1. Introduction
Process water recycling has become essential in mineral processing plants to minimize the use of fresh water. The process water could be contaminated with different types of ions depending on the ore type and flotation chemistry. It is therefore important to know the effects of water chemistry on flotation performance because the water quality can affect the efficiency of flotation of the desired minerals.
In the literature, there are several studies about the effect of water quality on flotation performance of different ore types [
1,
2,
3,
4,
5,
6,
7,
8,
9,
10]. The effects of the major contaminating ions, such as calcium, magnesium, sulfate, thiosulfate, and residual organics are investigated using different experimental methods. However, the temperature of the process water is also considered a significant parameter affecting dissolution and surface characteristics of minerals, water chemistry and hence the flotation performance [
11,
12,
13,
14,
15,
16,
17,
18,
19]. Seasonal variations and the grinding/regrinding processes can significantly change the water temperature in a process plant. The pulp temperature can reach up to 50 °C in the grinding mills and even in the flotation cells in the hot regions [
9,
15].
Temperature affects both the pulp and froth properties in the flotation system and changes the hydrodynamics and kinetics of flotation [
12,
13,
14]. The parameters that control particle-bubble interactions (except surface hydrophobicity) such as gas solubility and density, water surface tension and viscosity, bubble diameter, and rise velocity are all temperature dependent [
20]. The rate of collector adsorption, hence the flotation kinetics is improved at moderate pulp temperatures (around 30-40 °C), particularly in the flotation of oxide and silicate minerals where long-chain oily collectors are generally used [
21]. This effect has been observed particularly for fluorspar [
22], for the rate of pyrite flotation [
13] and for mixtures of sphalerite and chalcopyrite [
23]. However, elevated pulp temperatures (>40 °C) may adversely affect the flotation performance through desorption of the collector molecules from mineral surfaces, decomposition of the collector molecules, increasing dissolution of minerals, and precipitation of sulfoxy complex species in the pulp [
18,
19,
24]. The pulp temperature may also affect the flotation performance through the changes in hydrodynamics (pulp viscosity, gas solubility, bubble size and velocity, froth stability and bubble-particle interactions [
25,
26,
27,
28].
Monde et al. [
17] has investigated effects of tetrathionates on flotation of a Cu-Pb-Zn sulfide ore at water temperatures of 25 °C and 60 °C. Chalcopyrite recovery is marginally affected by the tetrathionate ions and temperature. Chalcopyrite is the least affected mineral by water chemistry and flotation. Gonzalo and Forsenario [
29] show that sulfate addition has a very small effect on the chalcopyrite flotation rate and recovery. On the other hand, galena and the secondary copper minerals are adversely affected by the presence of tetrathionate, sulfate ions and high temperature, due to probably higher rate of surface oxidation of these minerals.
Bicak et al. [
24] showed that the pulp temperature between 20 °C and 60 °C can significantly affect the flotation performance of a Cu-Pb-Zn ore. High temperature increases the grade of the bulk Cu-Pb and Zn concentrates due to reduced froth stability, i.e., lower water recovery and mass pull, and more efficient pyrite depression.
The pulp temperature is therefore a very important parameter when the effects of water chemistry are investigated for a particular ore and plant conditions. For example, the effects of water chemistry would be different in the rougher flotation stage or after regrinding stage than that of a scavenger flotation stage. Mathematical models can be used to estimate the effects of the pulp temperature and water chemistry in different sections of a flotation plant.
In this paper, interactive effects of pulp temperature, dissolved Ca2+, S2O32- and SO42- ions on the flotation performance were investigated using a Cu-Pb-Zn complex sulfide ore. A statistical experimental design method was used to determine the experimental conditions and the results were evaluated using ANOVA analysis. Mathematical models were developed with linear regression analysis to estimate the flotation performance as a function of the pulp temperature and the dissolved ions.
2. Materials and Methods
2.1. The Ore Sample
A complex copper-lead-zinc sulfide ore from a mine in the Iberian belt was used in the flotation tests. The chemical composition of the ore is given in
Table 1. The ore is a massive sulfide ore with approx. 75% pyrite, 0.8% chalcopyrite, 1.2% galena, 9% sphalerite and trace amounts of secondary copper minerals and arsenopyrite. Iron oxides/carbonates and quartz are the major non-sulfide gangue minerals.
The ore is concentrated in a flotation plant producing a bulk Cu-Pb concentrate and a zinc concentrate. A bulk Cu-Pb concentrate is produced in the process plant due to the complex mineralogy of the copper and lead minerals. The main product of the flotation plant is the zinc concentrate. Given that effects of water chemistry and temperature were evaluated according to the performance of the zinc flotation section in this study.
A representative ore sample was taken from the feed belt of the primary grinding mill of the flotation plant. The ore sample was crushed in two stages to -2 mm by using a laboratory scale jaw crusher and a roller crusher. The crushed sample was homogenized and split into 2 kg sub-samples using a Riffle splitter. The sub-samples were packed in vacuumed bags and stored in a freezer to minimize surface oxidation of the sulfide minerals.
2.2. Flotation Tests
Batch scale rougher kinetic flotation tests were performed to investigate the influence of water chemistry and temperature on flotation performance. A bulk Cu-Pb flotation stage was applied to recover the copper and lead before the zinc flotation stage (
Figure 1). The flotation conditions, i.e. reagent type and dosages and pulp pH, were similar to that used in plant scale operation. The test products were assayed for Cu, Fe, Pb and Zn using Thermo Fisher Scientific Niton XL series X-ray fluorescence (XRF).
The flotation tests were conducted using a modified Leeds flotation machine with 3 lt cell volume. A 2 kg ore sample was used in each flotation test. The ore sample was ground to d80=45 µm using a ball mill with high chrome grinding media. 500 g/t sodium metabisulphite (SMBS) was used in the grinding stage to depress sphalerite and pyrite in Cu-Pb bulk flotation stage. The pulp was pre-aerated for 5 minutes before collector addition to simulate the hydrocyclone classification circuit of the plant and to increase the redox potential of the pulp to positive values for enhanced collector adsorption. Aero 3418A, a dithiophosphinate type of collector, was used in the experiments as copper and lead collector. After the pre-aeration, the pulp pH was measured as 6.5-7, which is the optimum range for effective depression of sphalerite and pyrite in the presence of SMBS [
30]. In the zinc flotation stage, the pulp pH was increased to 9.5 with lime, and then 600 g/t Copper Sulphate (CuSO
4) and Sodium SIBX (Sodium Isobutyl Xanthate) were used as activator and collector respectively. MIBC (Methyl Isobutyl Carbinol, 20 g/t) was used as the frother in both flotation stages. The condition times were 2 minutes for the collectors, 1 min for the frother, 10 minutes for the CuSO
4. The total flotation times were 5 minutes in Cu-Pb flotation and 13 minutes in the zinc rougher flotation stage.
The pulp temperature was adjusted starting from the grinding stage using pre-heated water at the required temperature and maintained throughout the entire flotation test by heating the flotation cell. The flotation cell was wrapped with heating cable to heat the pulp and keep the pulp temperature constant.
The plant data and the previous studies on the same ore show that sulfate, thiosulphate and calcium ions and the temperature were the major variables in the process water [
3,
24]. Therefore, synthetic process water samples having different concentrations of SO
4−2, S
2O
3−2, Ca
+2 ions were prepared by using analytical grade CaCl
2. 2H
2O, Na
2SO
4 and Na
2S
2O
3.5H
2O. De-ionized water was used for preparation of the synthetic water samples. The amount of each chemical required for a given water quality was calculated and the chemicals were dissolved in a deionized water in the following order to prevent precipitation of the ions; Na
2S
2O
3, CaCl
2 and Na
2SO
4. The chemical analysis of the water samples was performed by using ICP-OES (Thermo-Elemental Iris Intrepid) for the cations and Dionex ICS-3000 Ion Chromatography for the anions.
The water chemistry and pulp temperature were changed as shown in
Table 2. The range of ionic concentrations and pulp temperature were determined according to the plant data and the previous studies [
3,
24]. Effects of these parameters were tested at two levels. Factorial design with center points repeats was used for the experimental design method [
18]. In the center point experiments (Exp No 17 to 20), the concentrations of the ions and temperature were taken as the average of the low and high levels. The relationship between the independent variables and observed responses were evaluated using multiple regression in Design Expert software version 6.0.8.
The flotation performance was evaluated based on the mass pull, water recovery, grade and recoveries of Cu, Pb, Zn and Pyrite. The recoveries in the zinc flotation stage were calculated in reference to the feed to the zinc rougher flotation (i.e. the Cu-Pb rougher flotation tail). The water recovery and mass pull relationship are generally used to evaluate the froth stability [
9,
31].
The flotation test results were evaluated using ANOVA analysis at 95% level of confidence. To ensure the reproducibility of the results, standard deviation was calculated using the center points repeat tests (Exp No 17-20) (
Table 3).
3. Result and Discussion
3.1. Flotation Tests
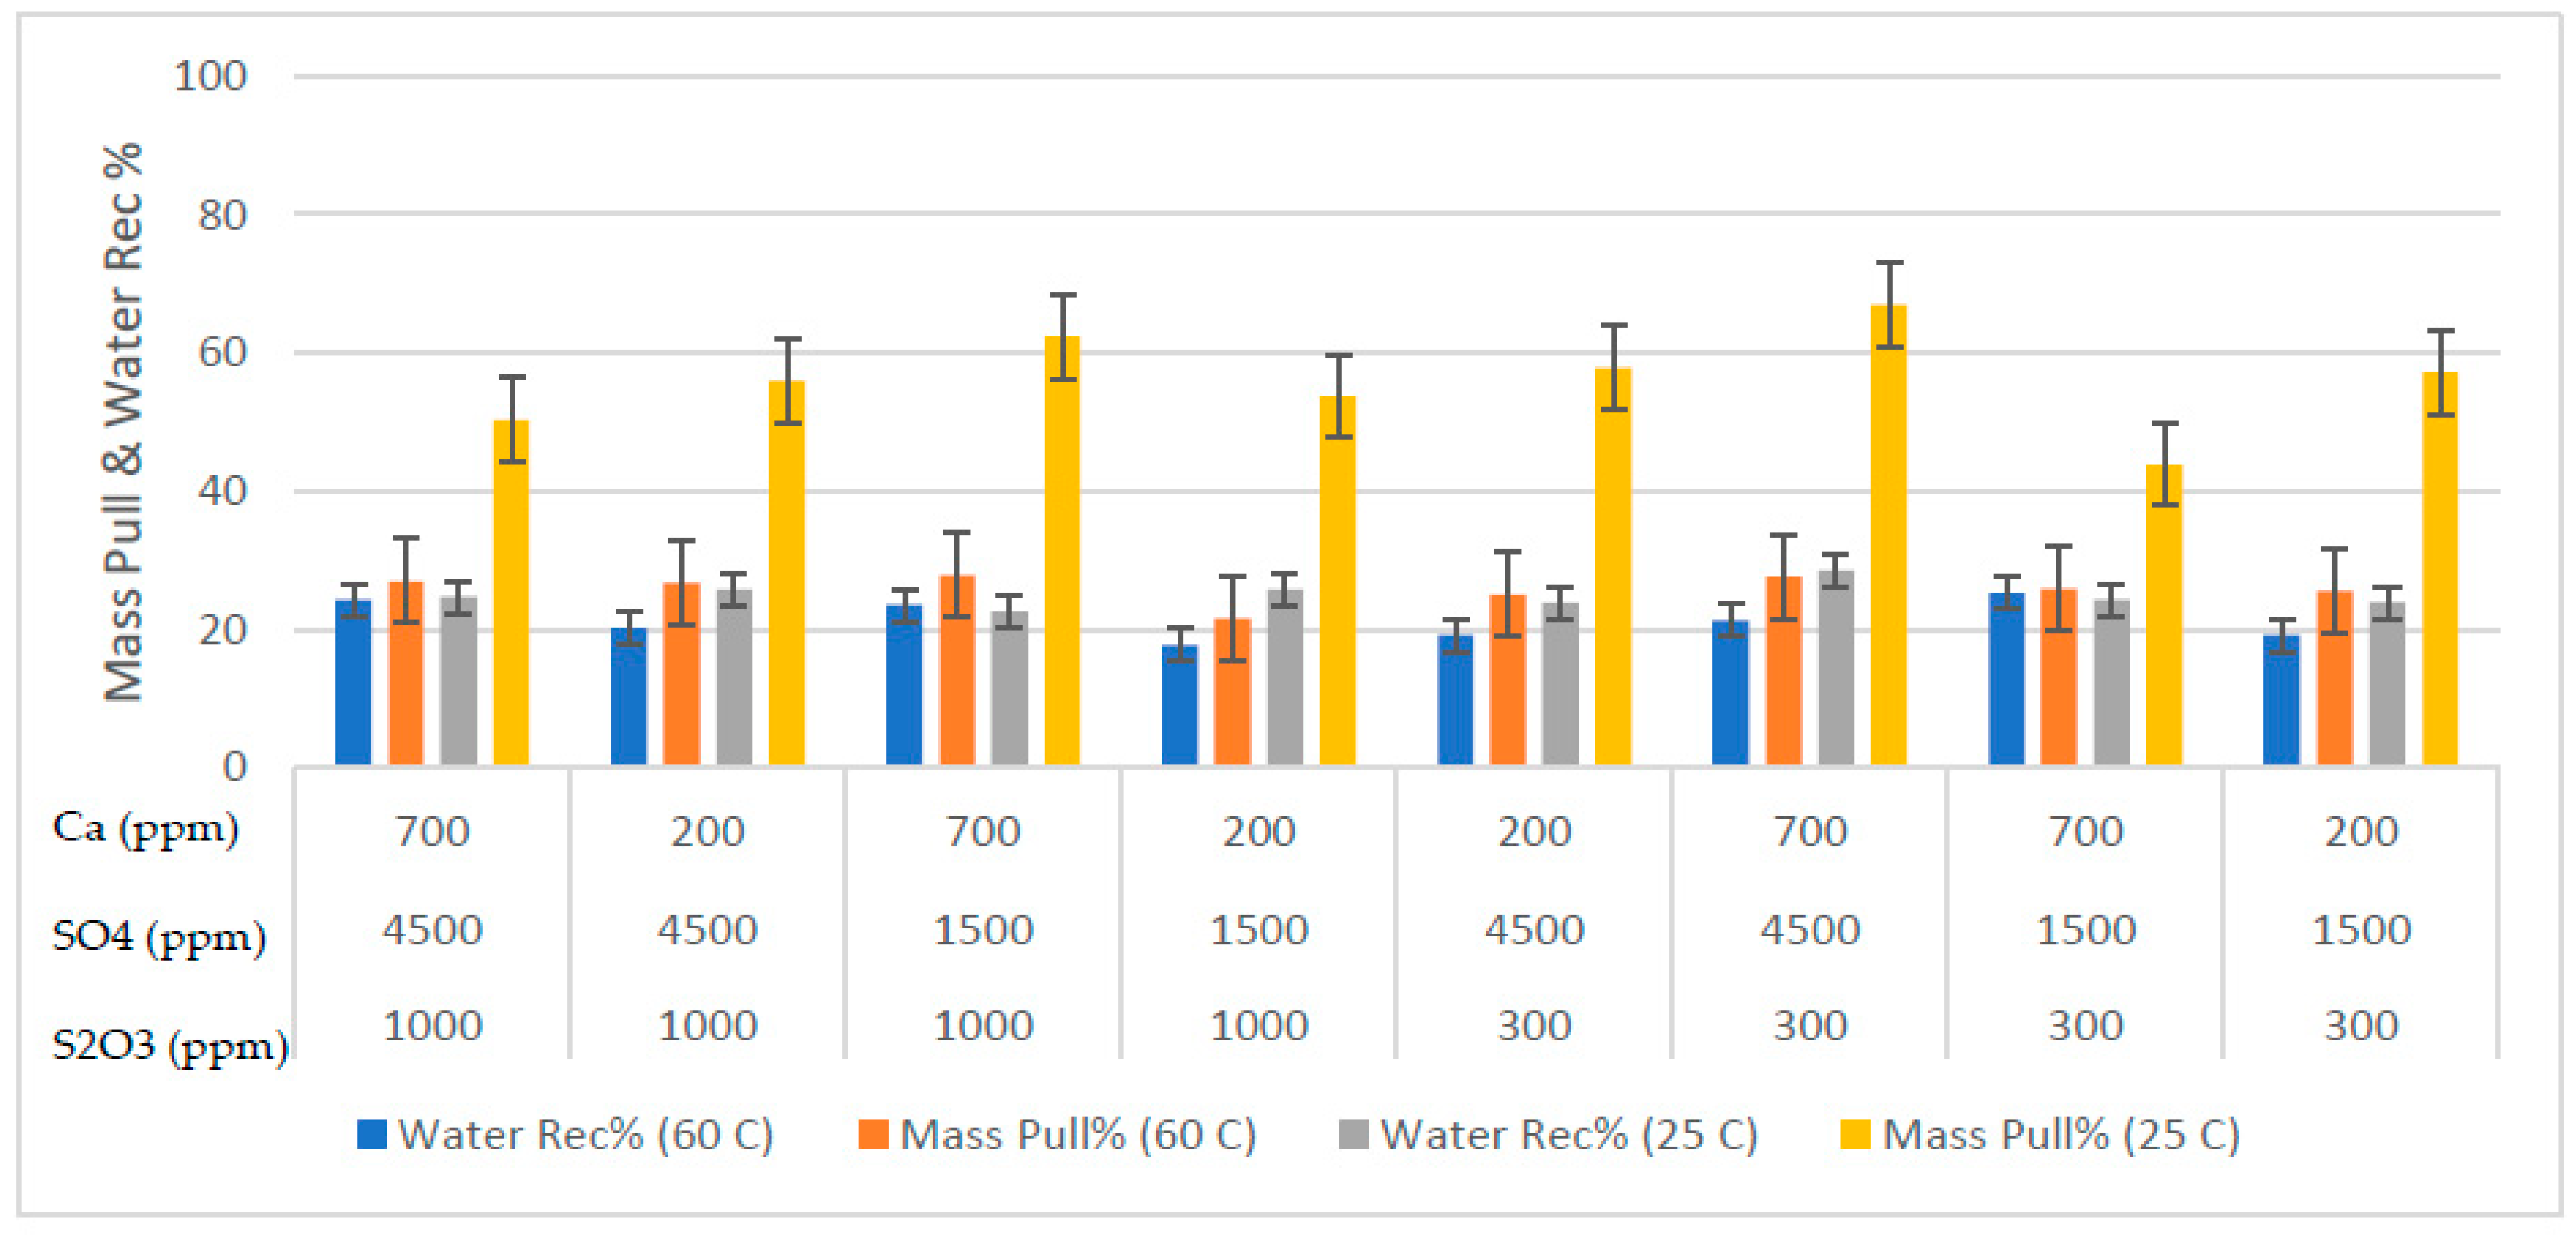
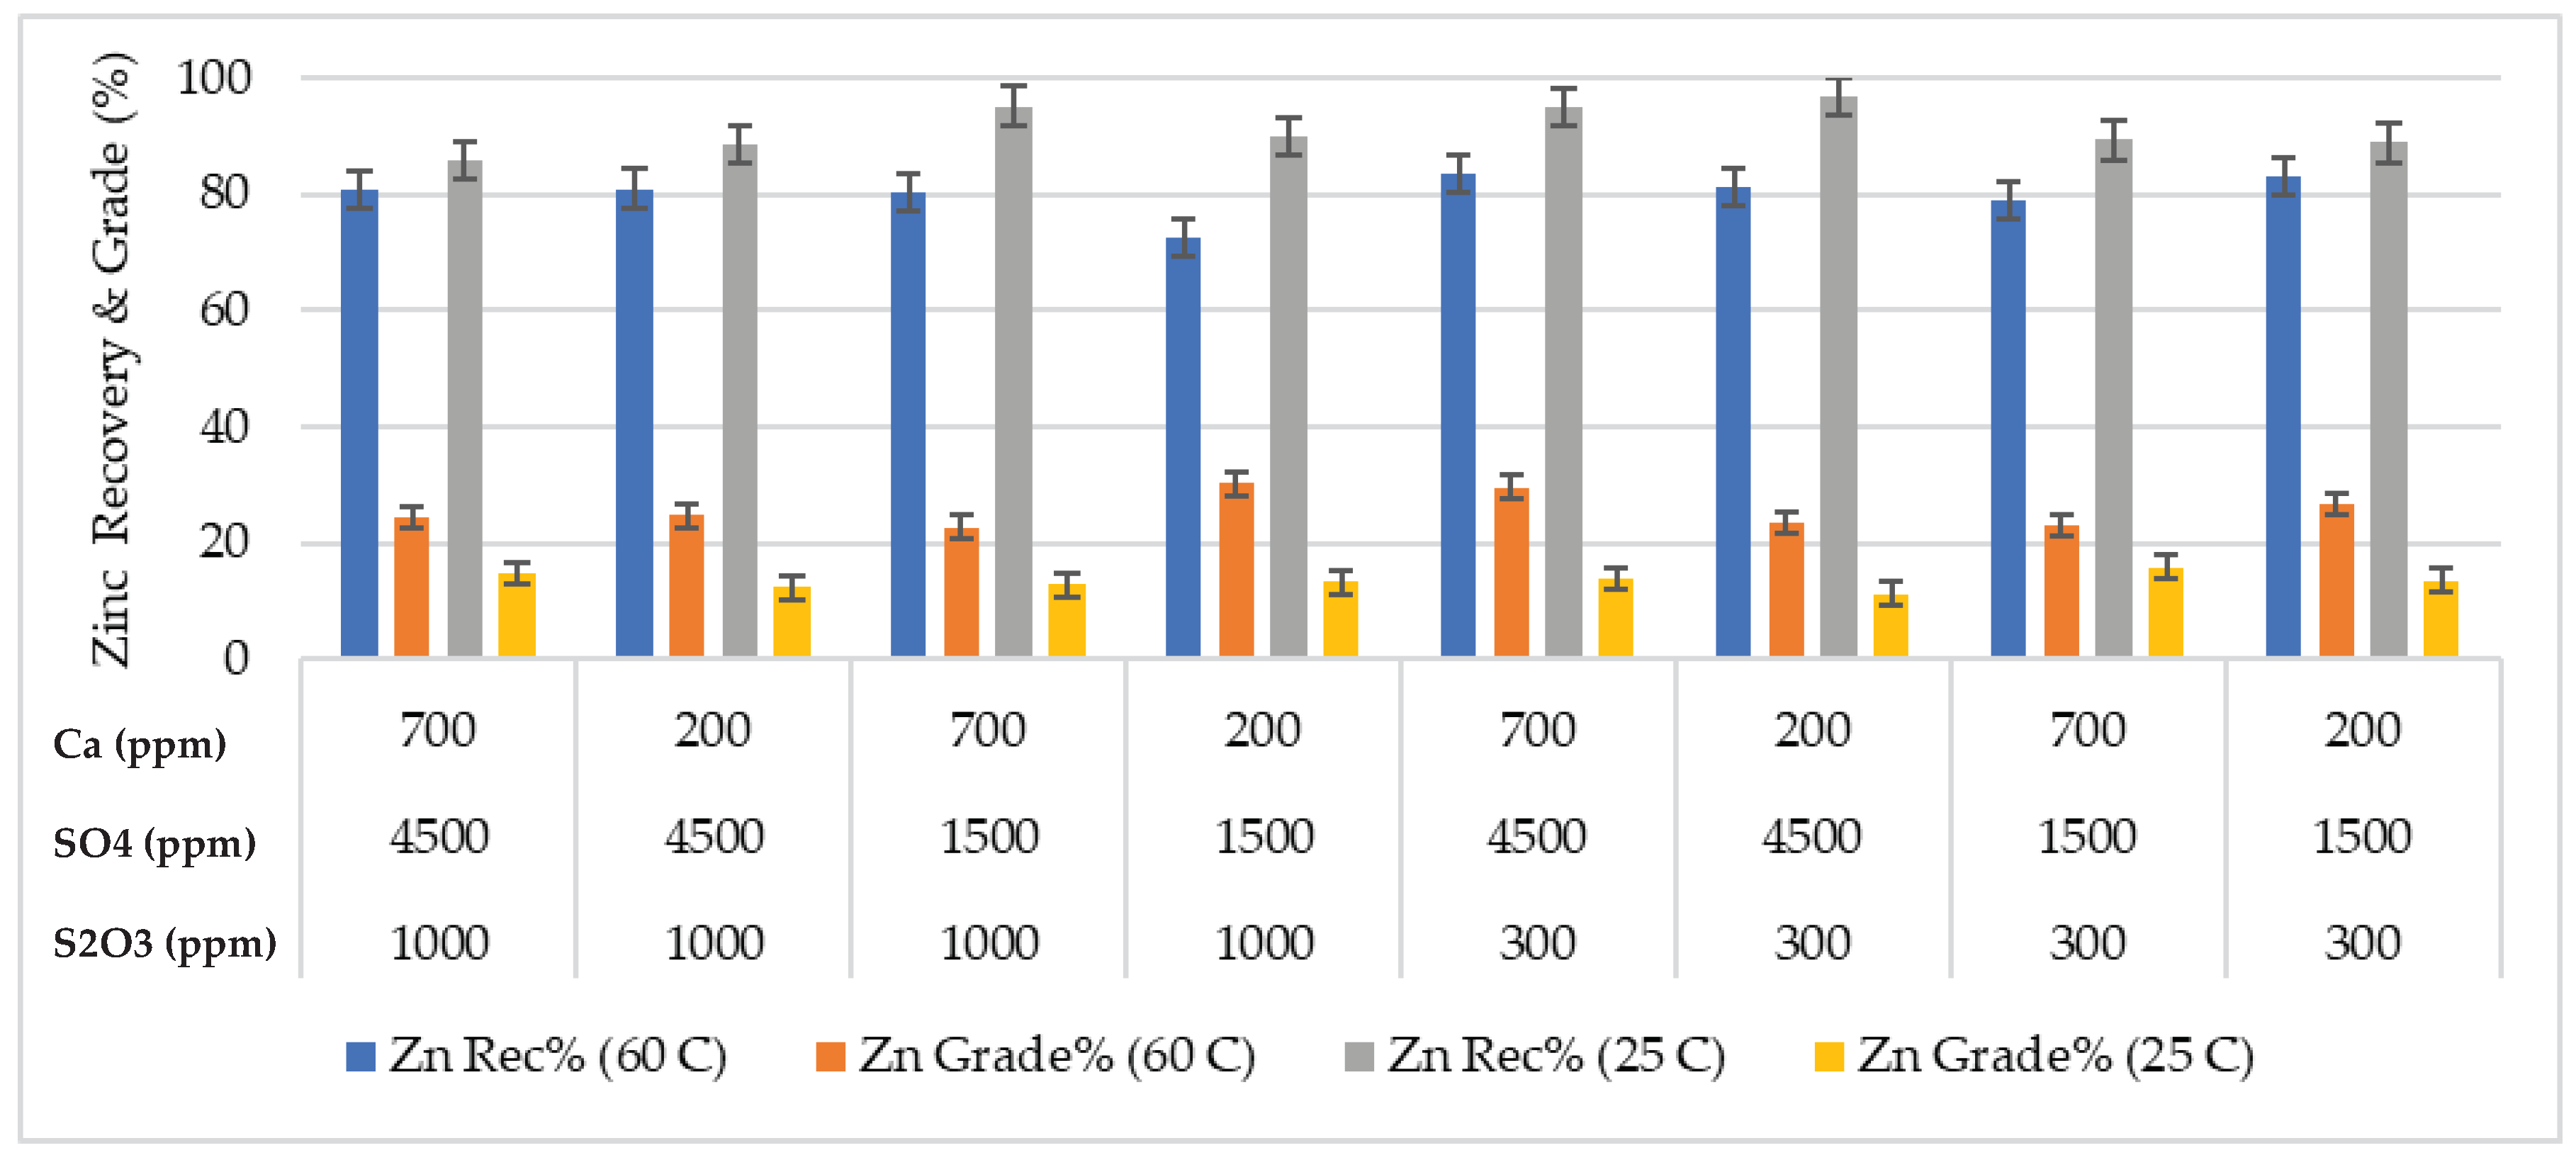
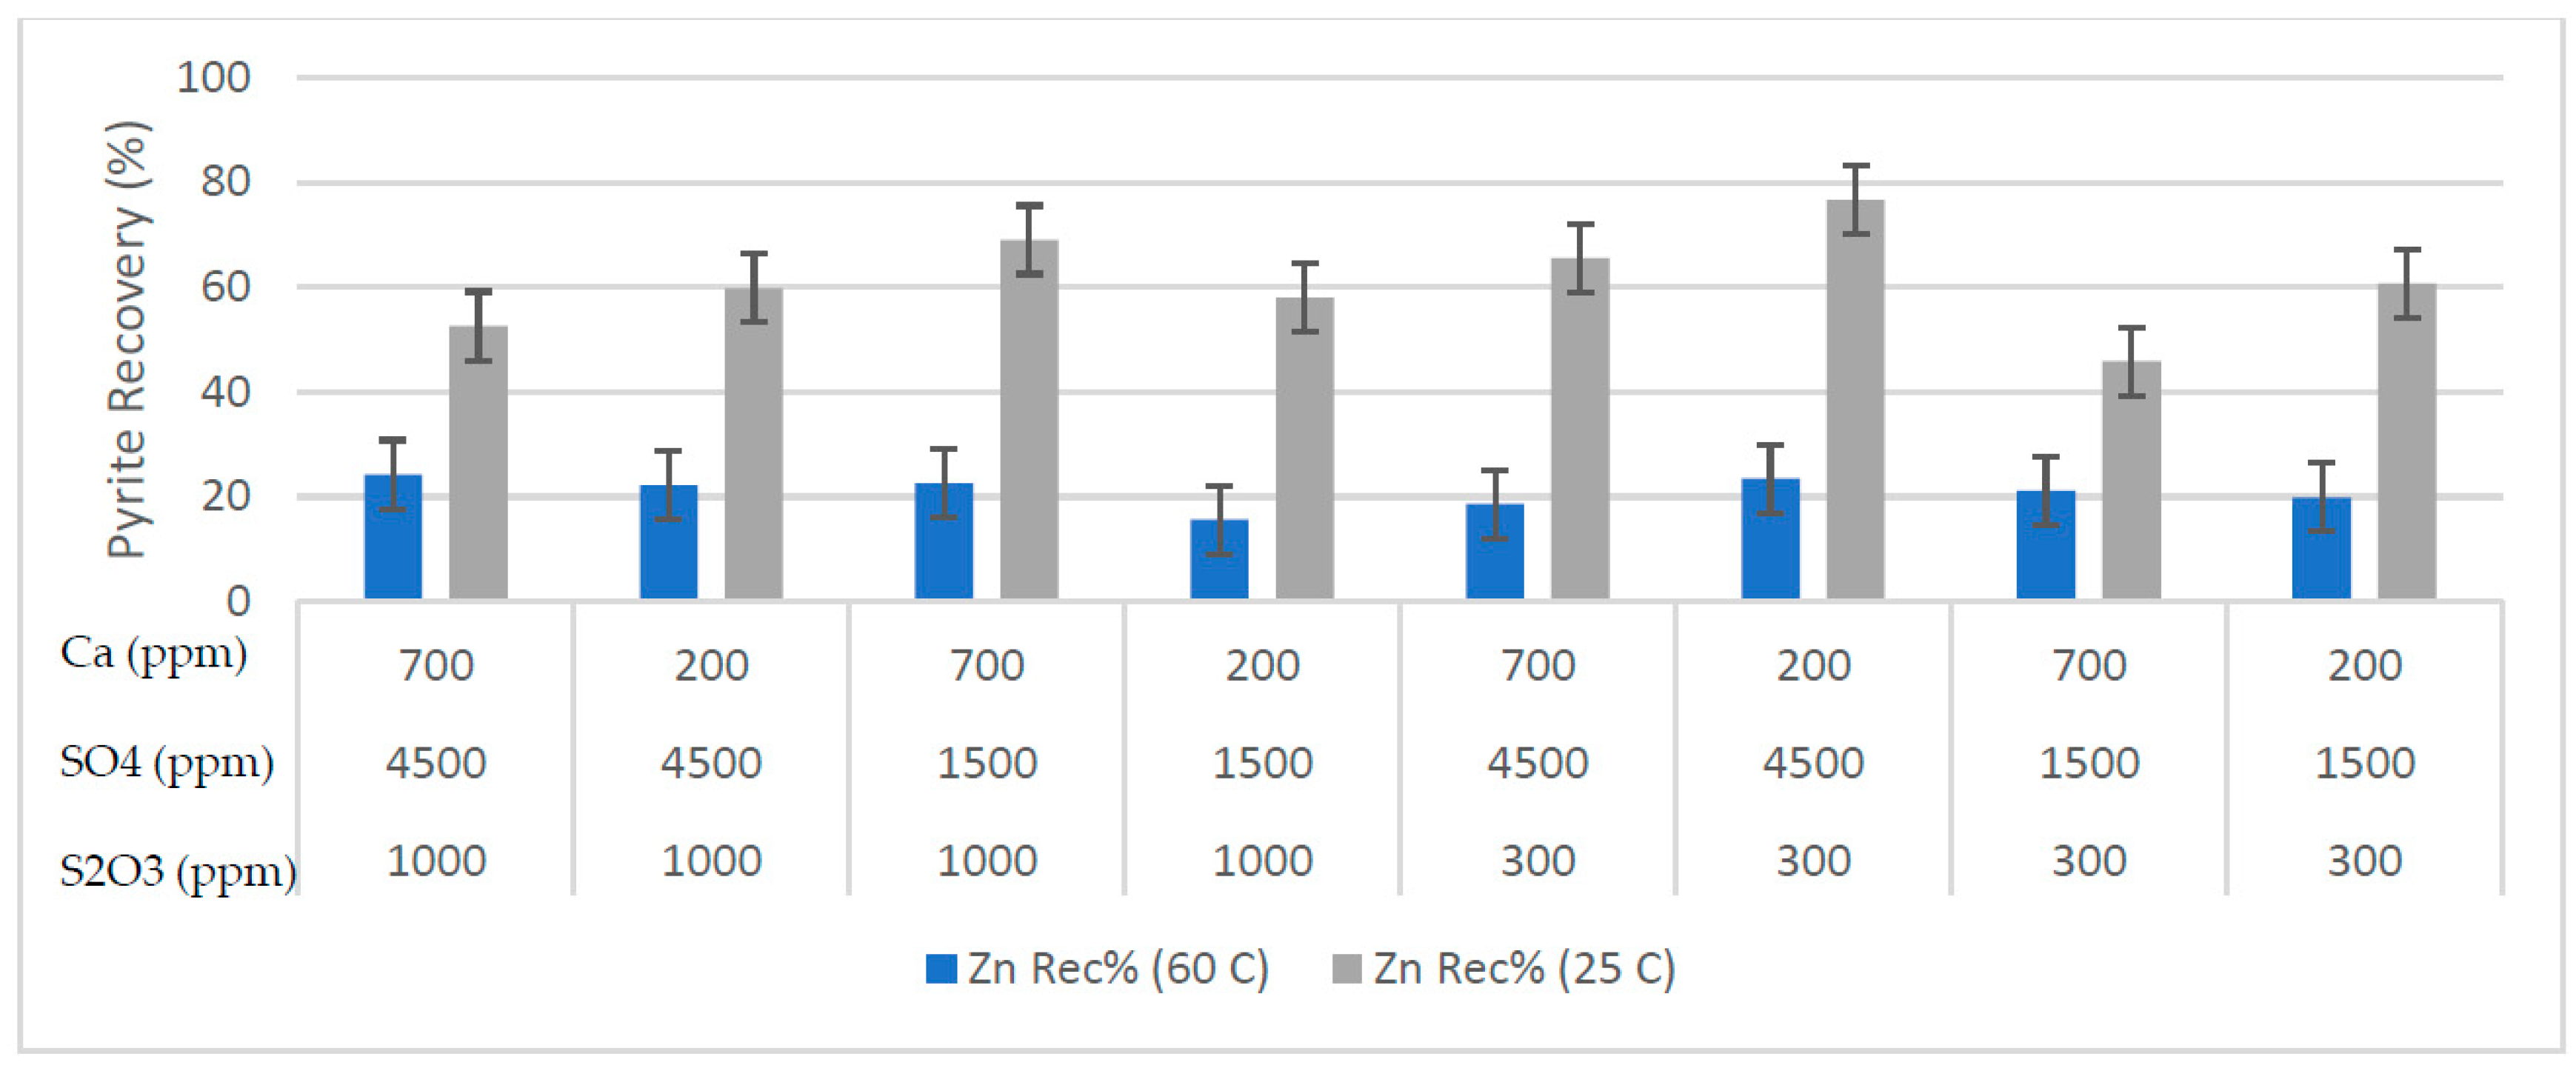
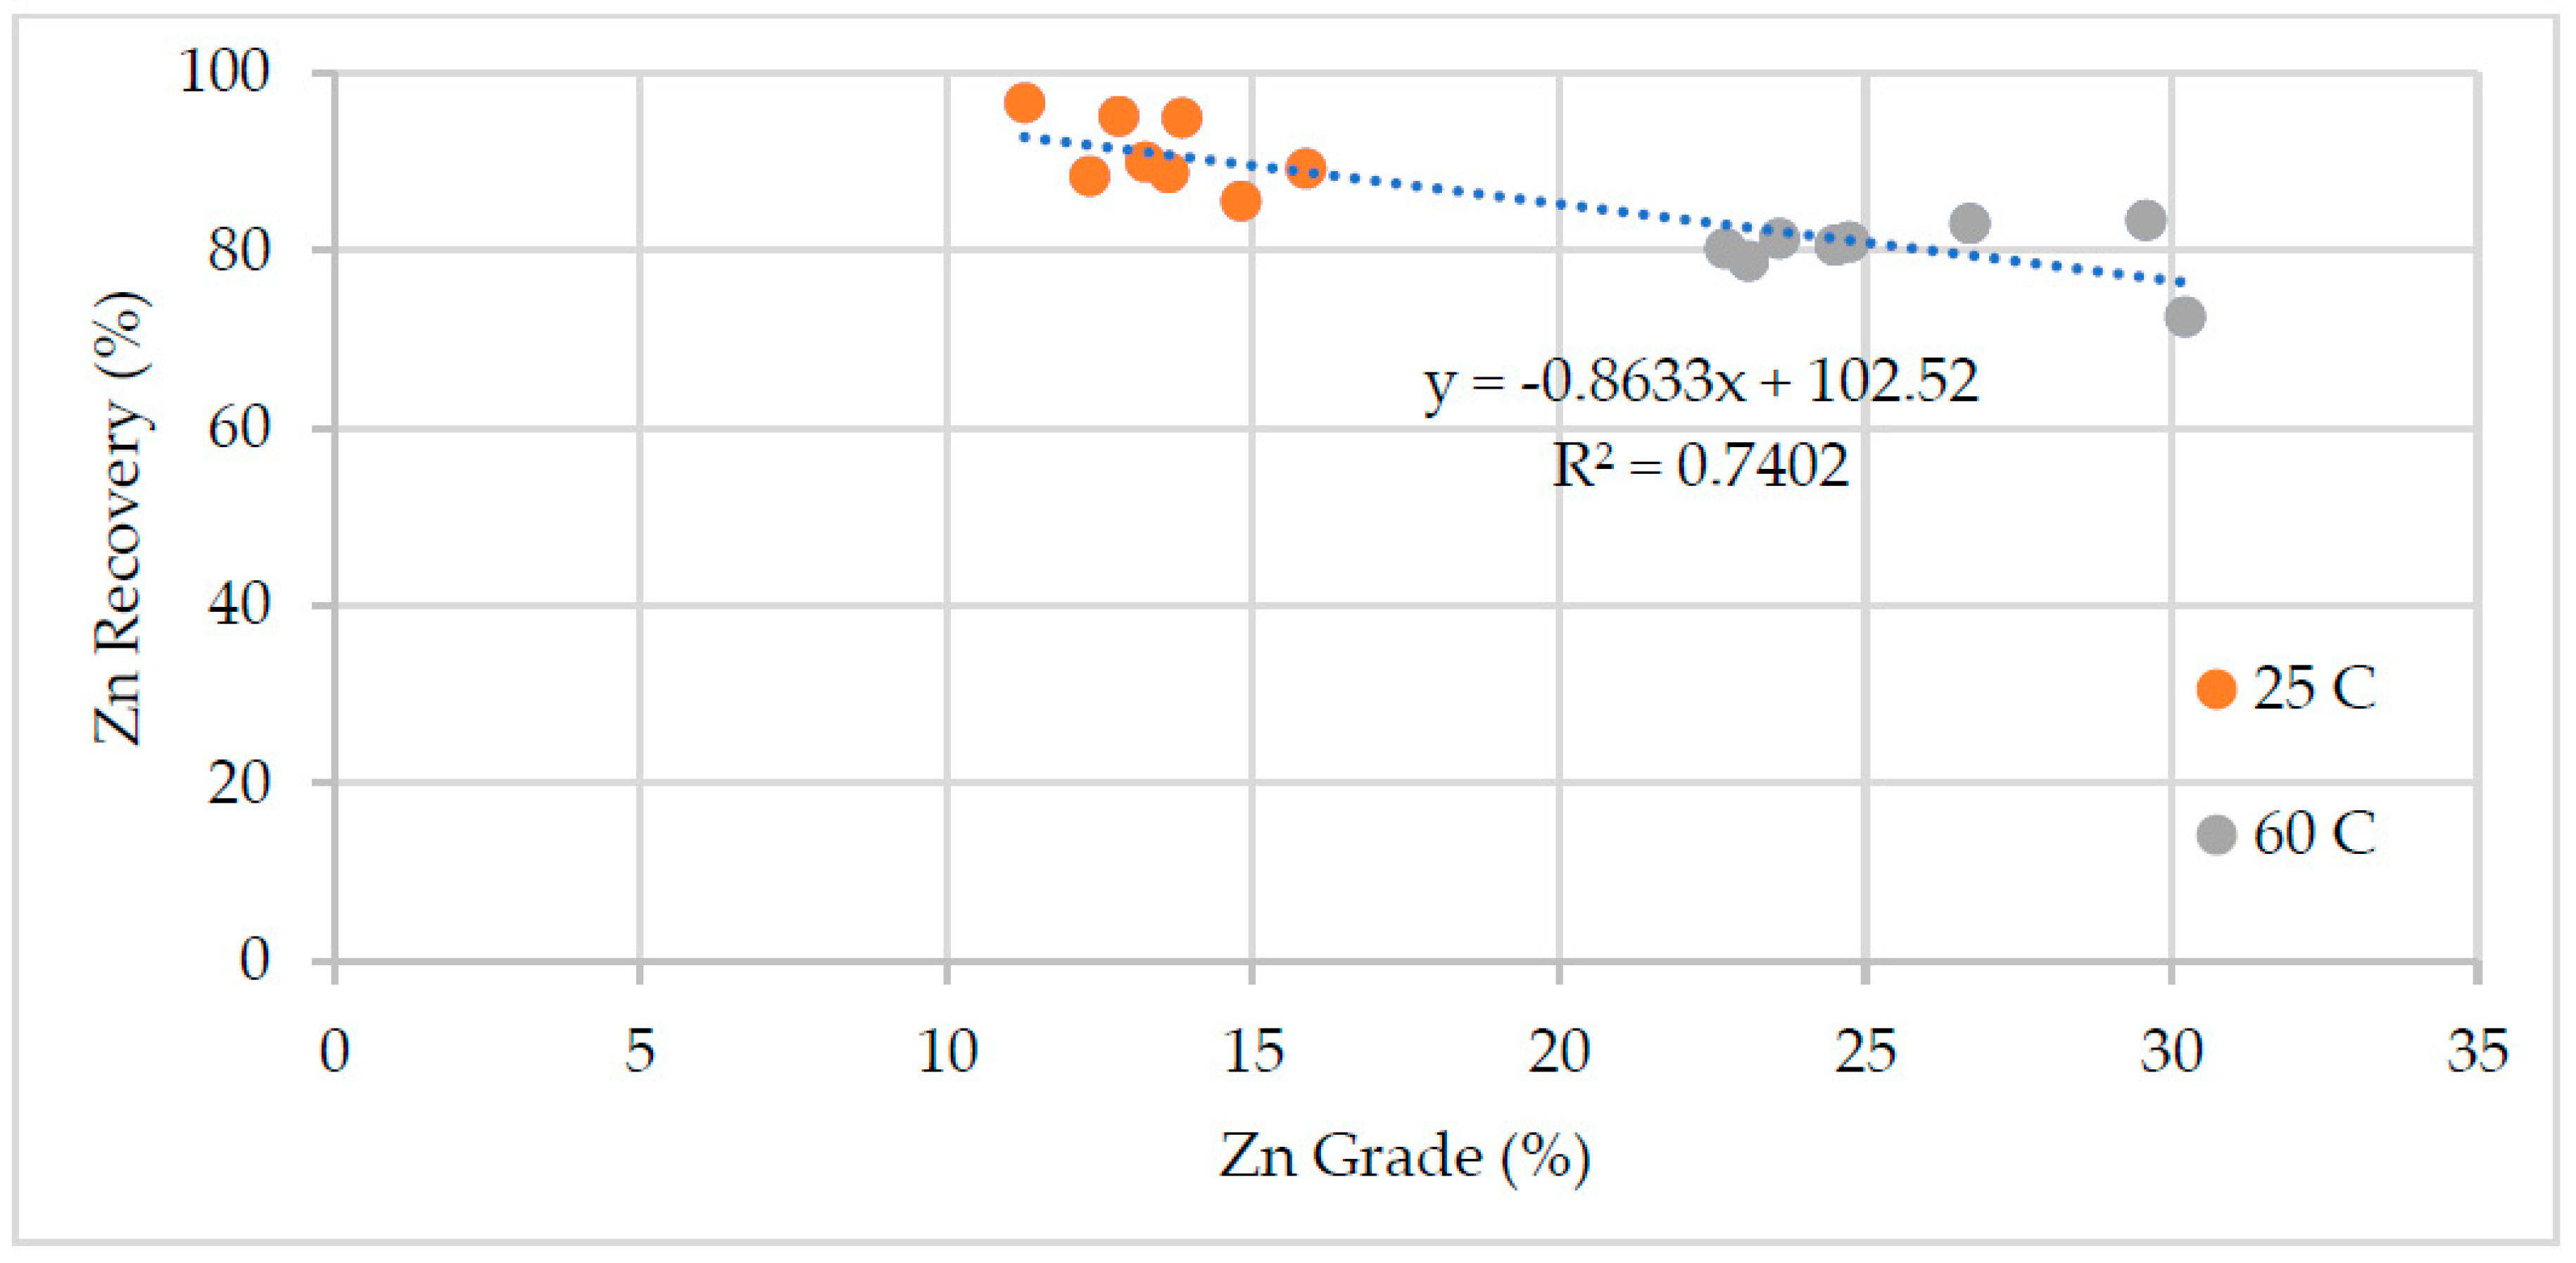
Effects of process water chemistry and temperature on the performance of the zinc flotation were discussed in the paper. The test results, mass pull, water recovery, zinc grade and recovery, and pyrite recovery are illustrated in
Figure 2,
Figure 3 and
Figure 4 respectively. In batch flotation tests, water recovery and mass pull indicate the changes in the froth phase and froth stability. The temperature significantly affected the mass pull and hence the grade of the zinc concentrate. The mass pull was about 50-60% at 25 °C and decreased to around 20% at 60 °C. The low mass pull at high temperature was due to the reduced pyrite recovery (
Figure 4). Pyrite recovery was around 60 % for most of the tests at 25 °C temperature and decreased down to 20% at high temperature regardless of water chemistry. The zinc recovery was less affected at the high temperature, but the zinc grade increased considerably (
Figure 3).
The pulp temperature affects both the froth stability and surface characteristics of the minerals. In general, an increase in temperature results in a decrease in the viscosity of water and water recovery, thus increasing the drainage of gangue particles in the froth phase [
32]. Higher concentrate grades should be expected at high temperature without negatively affecting the recovery. In this study, the water recovery and hence the froth stability were not significantly affected by the pulp temperature in most of the tests. The low pyrite recovery at high temperature was therefore attributed to the reduced pyrite floatability and enhanced froth drainage characteristics.
Monde et al [
18] show that temperature variation between 5 °C and 65 °C bears no effect on the decomposition of xanthate. Effects of high temperature on xanthate adsorption is considered to be mineral and ore specific. High temperature (50 – 60 °C) enhances xanthate adsorption on chalcopyrite, particularly at high dosages, but it negatively impacts on the adsorption on pentlandite [
18,
33,
34]. This is attributed to weaker floatability of pentlandite and faster surface oxidation than chalcopyrite. Similar effects of high temperature were observed between flotation recoveries of pyrite and copper activated sphalerite. Copper ions form a CuS
2 film at the surface of sphalerite particles, and they show similar flotation performance to that of chalcopyrite in the presence of xanthate [
35]. Given that the sphalerite recovery was less affected than pyrite at high temperature.
The influence of water chemistry, i.e. concentration of Ca, SO
4 and S
2O
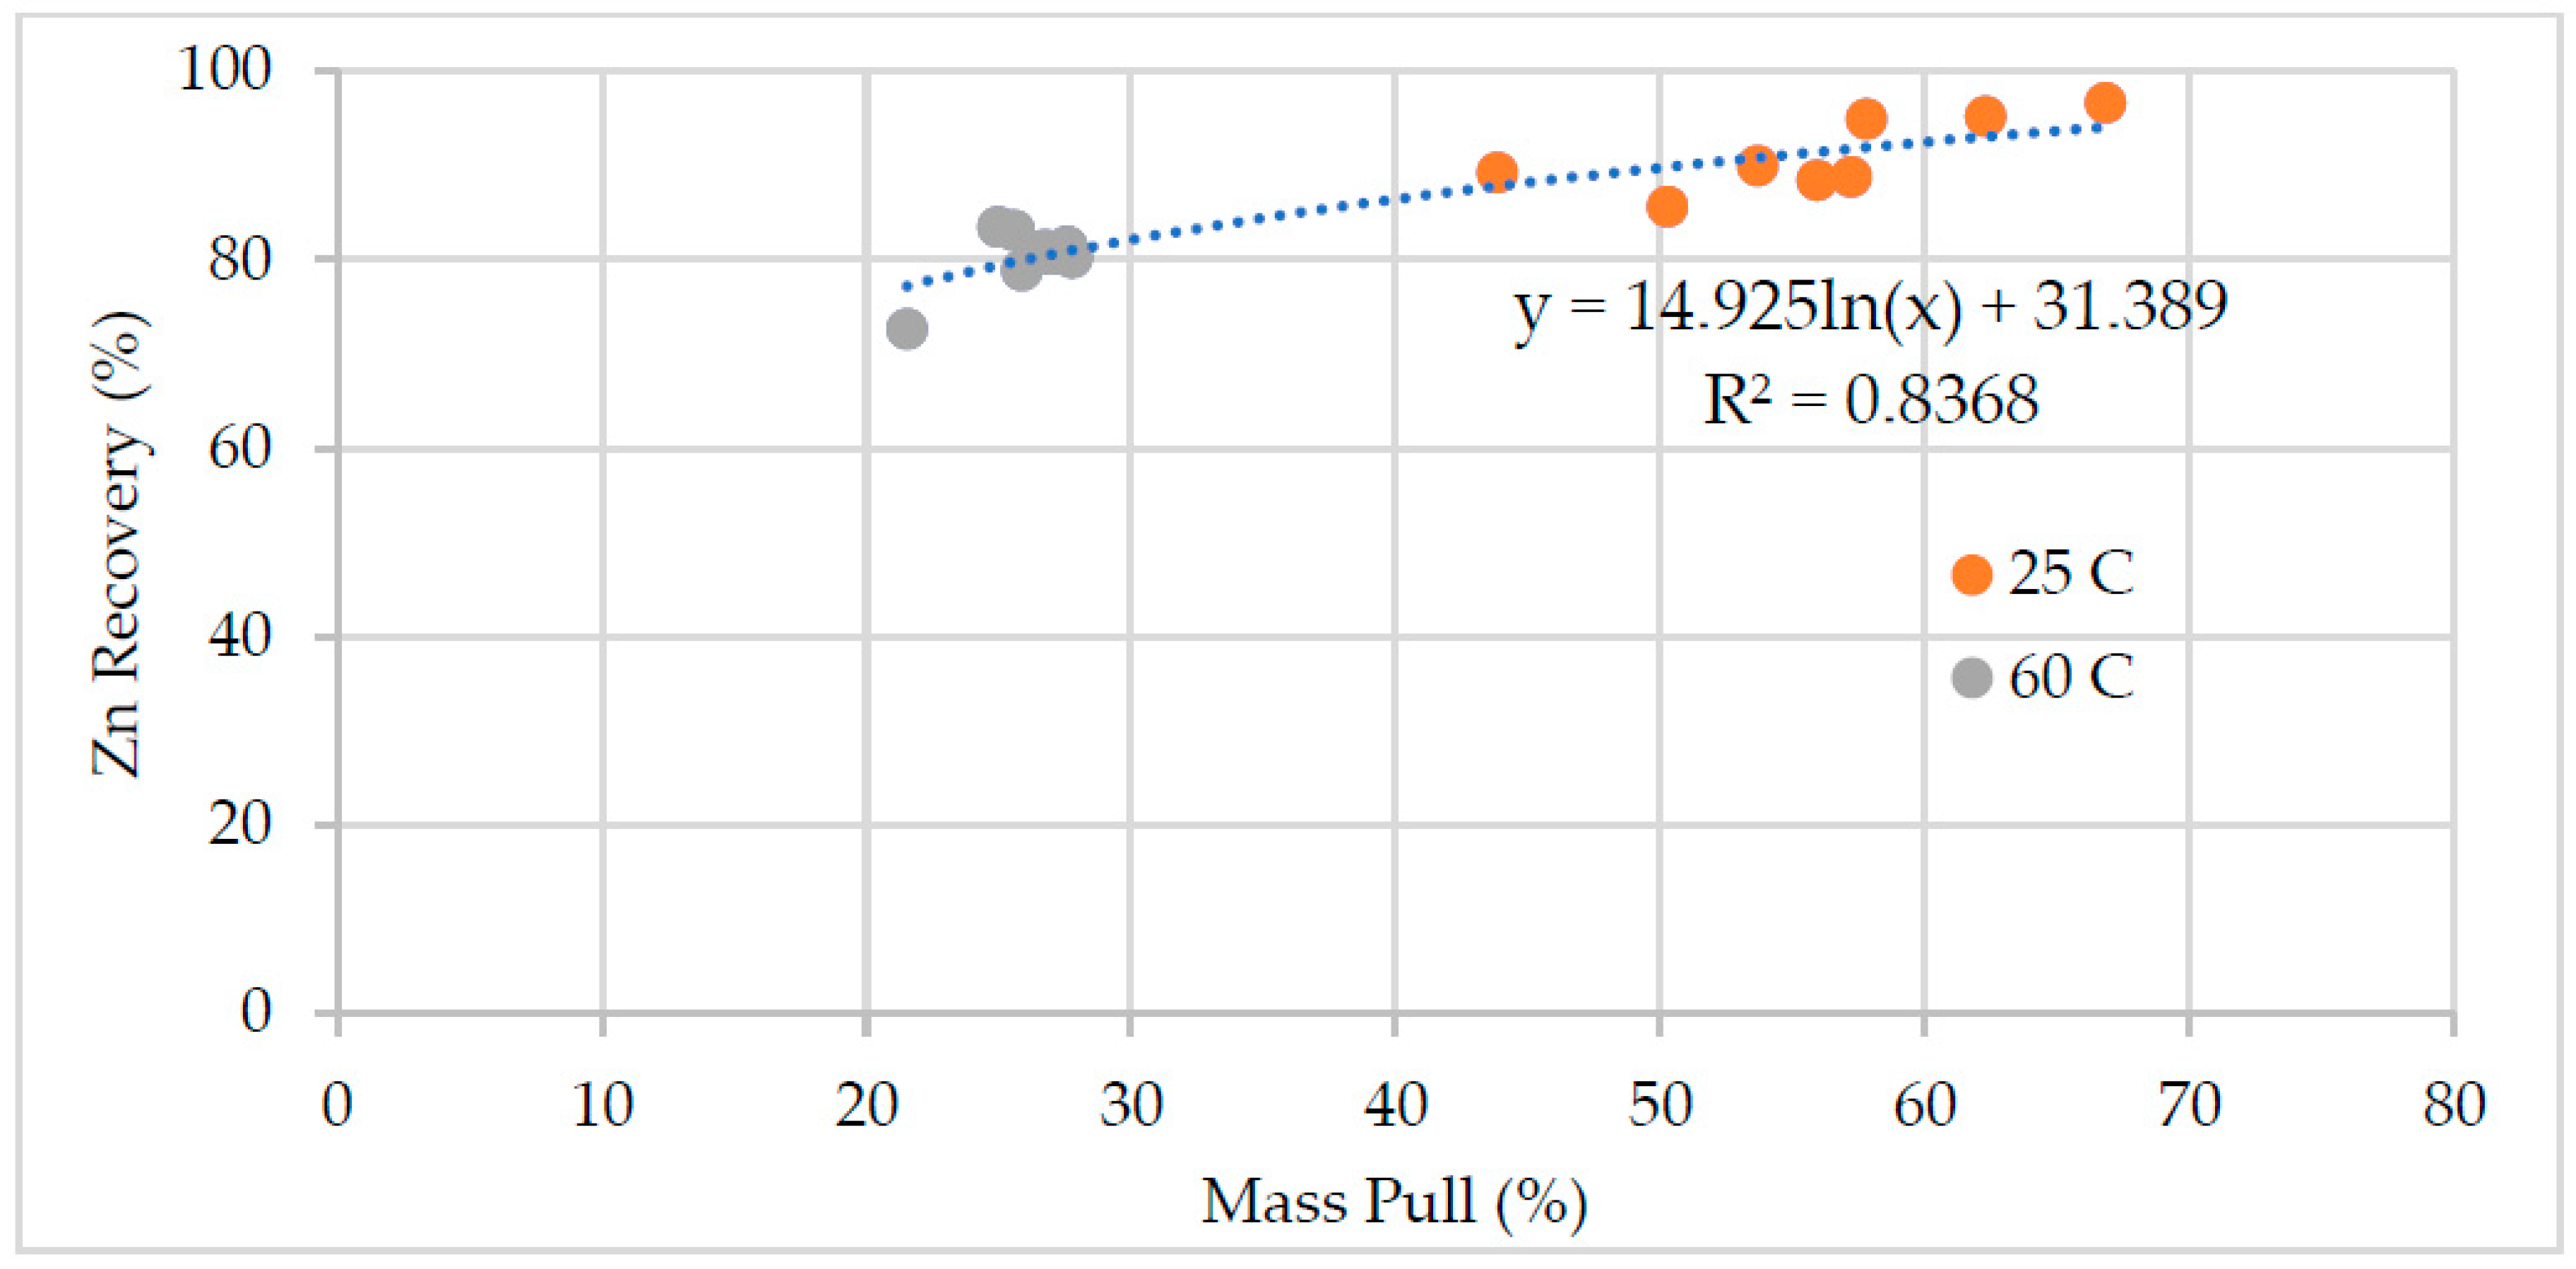
3 ions on flotation performance was clearly observed at 25 °C. The zinc grade of the concentrate was only affected by the water chemistry at 60 °C. The mass pull and zinc recovery were around 25% and 80% respectively in all the tests performed at 60 °C, except the test at high calcium concentration and low sulfate and thiosulfate concentrations (
Figure 5). The low zinc recovery in this test was due to reduced froth stability, i.e. low water recovery and mass pull.
Figure 5 shows the zinc recovery as a function of mass pull. The water chemistry had a stronger influence on the mass pull and hence zinc grade and recovery at low temperature. The mass pull varied between 44% and 67%. The large variation in the mass pull affected the zinc grade and recovery (
Figure 6). The lowest mass pull was obtained in the presence of high thiosulfate concentration, which depresses pyrite effectively. The zinc recovery was not affected significantly in this test, but in the test with the highest concentrations of calcium, sulfate and thiosulfate. High ion concentration may enhance formation of colloidal calcium-sulfoxy compounds on mineral surfaces [
18].
3.2. Statistical Evaluation of the Effects of Flotation Temperature and Anion Concentrations on Flotation Performance
Effects of dissolved ions (Ca2+, SO42-, S2O32-) and temperature on flotation performance were statistically evaluated using Design Expert 6.0.8 software. The significance of each parameter on mass pull, water recovery, recovery and grade of copper, zinc, lead and pyrite was evaluated using ANOVA analysis at 95% level of confidence.
Table 4 shows a typical regression model for the zinc recovery using all the variables and their interactions. Model F-value of 2.09 implies the model is not significant relative to the noise. There is a 29.82% chance that a "Model F-Value" this large could occur due to noise. "Prob > F" values of less than 0.05 indicate model terms are significant. In this case D (Temperature) was the only significant model term for zinc recovery. There were some model parameters and interaction effects with "Prob > F" values between 0.05 and 0.10. Therefore, 90% level of confidence was used to include more parameters for the model development to increase the prediction power of the models. In spite of that there were many insignificant model terms (not counting those required to support hierarchy), and hence model reduction was performed to improve the models.
The same ANOVA analysis was done for all of the flotation responses.
Table 5 shows the p-values for goodness of fit of the regression models. The bold numbers show the significant model parameters. The temperature was a significant parameter for all the flotation responses. Interaction of the different parameters significantly affected the water recovery, copper, lead and zinc grades of the concentrate and the copper recovery.
The model reduction studies were performed according to the values given in
Table 5. The parameters having >0.10 values were not included in the model development. However, it must be noted that the main effects which were not significant but exist in the interaction effects were also included as part of hierarchical regression analysis in the model development.
The model reduction studies performed on the copper recovery (RCu) is given below as an example. D and ABD were significant effects for copper recovery (
Table 5). Although A and B and their interaction effects were not significant, they had to be included in the model development as described above. According to the ANOVA results of the reduced model given in
Table 6, the reduced model is significant.
Standard deviation, mean, predicted and adjusted R squared values which show the consistency of the model are summarized in
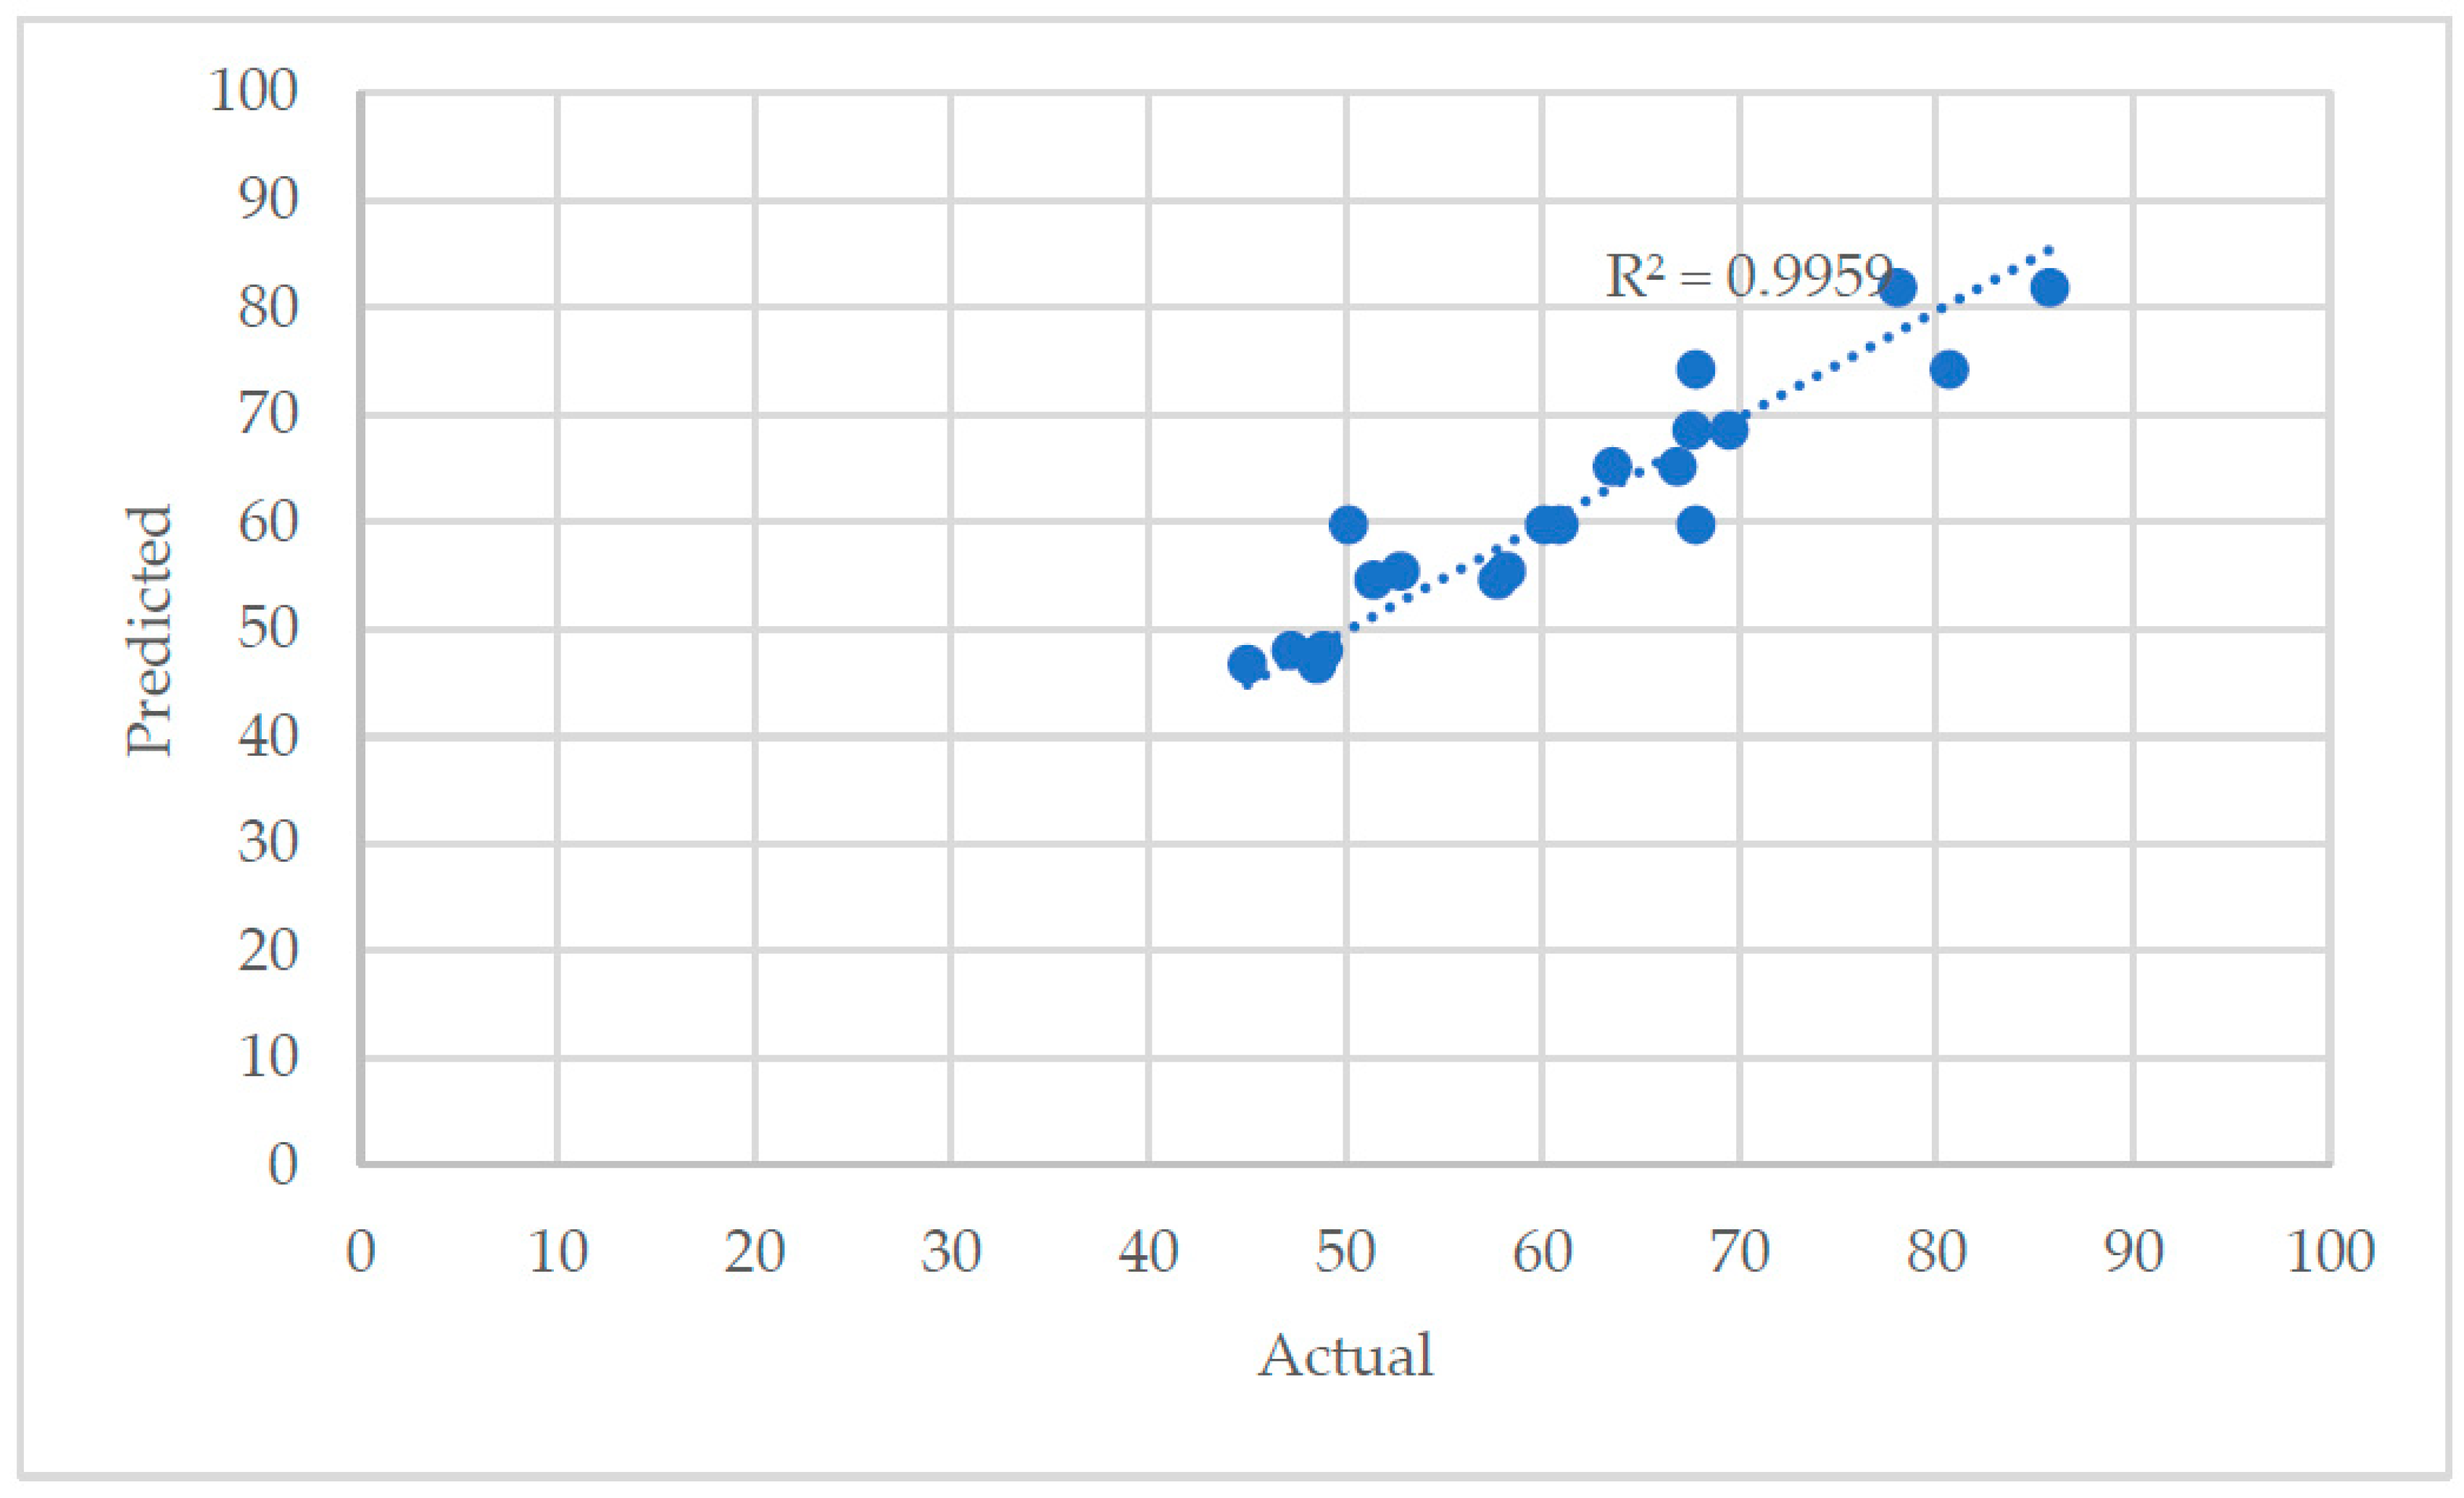
Table 7. "Adeq Precision" measures the signal to noise ratio, and a ratio greater than 4 is desirable. The reduced model has an adequate precision value of 9.7. Therefore, the model given in terms of actual factors in Equation 6 can be used to calculate the copper recovery in the zinc flotation section.
Figure 7 shows the comparison of the actual vs predicted copper recovery values calculated using Equation 1. The predictive power of the model is statistically satisfactory and can be used to navigate the design.
Similar model reduction studies were performed to develop statistically significant models for all the flotation parameters.
Table 8 shows the p-values of the model parameters, the correlation coefficient (R
2) and the precision values of the reduced models. All the reduced models are significant with the selected effects and can be used for optimization studies.
The coefficients of the equations based on actual factors are given in
Table 9. Since the values of the main effects are large (e.g. SO
42- rages between 1500 ppm and 4500 ppm), the equations have relatively small coefficient numbers. The coefficient numbers show that the mass pull and water recovery decrease with increasing the temperature, indicating lower froth stability and more selective flotation. Hence, copper, lead and zinc grade of the concentrate increases at high pulp temperatures. Calcium and sulfate ions increase the copper recovery and grade of copper and lead in the zinc rougher concentrate. The zinc recovery is negatively affected by high pulp temperature, presumably due to lower mass pull, but the zinc grade increases. Most of the ore sample is pyrite, and it is depressed effectively at high pulp temperatures. This was attributed to improved froth drainage and faster pyrite oxidation at high temperature.
The models are now available to determine the operating conditions for specific targets, such as the maximum zinc recovery, or zinc grade or both.
Table 10 shows the values of the main effects to achieve the target grade and recovery values. Mass pull, water recovery and grade and recoveries of the copper, lead and pyrite are also calculated but not included in the table due to space restrictions. The maximum zinc grade could be obtained at the highest temperature and calcium, moderate sulfate and minimum thiosulfate ion concentrations tested in this work. For maximum zinc recovery, the temperature should be reduced to 25 °C. The models suggest that the optimum zinc grade and recovery are 24.77% Zn and 82.35% respectively and they could be obtained at about 53 °C, moderate calcium, high sulfate and low thiosulfate concentrations. The models can also be used to predict the zinc grade and recovery for a given temperature and water chemistry.
4. Conclusions
Effects of process water chemistry (Ca2+, SO42-, S2O32-) and temperature on the zinc flotation performance of a Cu-Pb-Zn complex sulfide were investigated by using a statistical experimental design and modelling approach. The results were evaluated to derive individual regression models for each flotation response. The results showed that the pulp temperature was the most effective parameter affecting the flotation performance. At higher temperatures, the zinc grade increased due to better pyrite depression and froth drainage characteristics resulted in lower mass pull. The maximum zinc recovery, however, was obtained at the highest mass pull at low temperature. High Zn recoveries were obtained at low temperature due to higher mass pull. Influence of the dissolved ions (Ca2+, S2O32- and SO42-) on the flotation performance was masked at 60 °C pulp temperature.
Individual regression models were developed using the significant main effects and their interactions for each flotation response. Then, the models were used to determine the concentration of the dissolved ions and pulp temperature required to achieve the maximum zinc recovery, maximum zinc grade or the optimum zinc grade and recovery. This approach, evaluating effects of the experimental factors and their interactions on the flotation performance could effectively be used to predict effects of the changes in water chemistry and pulp temperature in a flotation plant.
Acknowledgments
The authors would like to thank Europian Union H2020 Funding, Iterams Project No 730480 for financial support.
References
- Basilio, C.I.; Kartio, I.J.; Roon, R.H. Lead activation of sphalerite during galena flotation. Miner. Eng. 1996, 9, 869–879. [Google Scholar] [CrossRef]
- Bicak, O.; Ekmekci, Z.; Can, M.; Ozturk, Y. The effect of water chemistry on froth stability and surface chemistry of the flotation of a Cu-Zn sulfide ore. Int. J. Miner. Process. 2012, 102–103, 32–37. [Google Scholar] [CrossRef]
- Bicak, O.; Ozturk, Y.; Ozdemir, E.; Ekmekci, Z. Modelling effects of dissolved ions in process water on flotation performance. Int. J. Miner. Process. 2018, 128, 84–91. [Google Scholar] [CrossRef]
- Broman, P.G. Water reuse at sulfide ore concentrators in Sweden: practice, experience and current development. In: Jones, M.J. (Ed.), Complex Sulphide Ores. The Institution of Mining and Metallurgy, London, 1980, pp. 28–39.
- Forssberg, K.S.E.; Jönsson, H.R.; Pualsson, B.I. Full scale test of process water reuse in a complex sulphide ore circuit. In: Forssberg, K.S.E. (Ed.), Flotation of Sulphide Minerals. Elsevier, Amsterdam, Netherlands, 1985, pp. 197–217.
- Levay, G.; Smart, R.; St, C.; Skinner, W.M. The impact of water quality on flotation performance. J. S. Afr. Inst. Min. Metall. 2001, 101, 69–75. [Google Scholar]
- Liu, L.; Rao, S.R.; Finch, J.A. Laboratory study effect of recycle water on flotation of a Cu/Zn Sulphide ore. Miner. Eng. 1993, 6, 1183–1190. [Google Scholar] [CrossRef]
- Liu, W.; Moran, C.J.; Vink, S. A review of the effect of water quality on flotation. Miner. Eng. 2013, 53, 91–100. [Google Scholar] [CrossRef]
- Ozturk, Y.; Bicak, O.; Ozdemir, E.; Ekmekci, Z. Mitigation negative effects of thiosulphate on flotation performance of a Cu-Pb-Zn sulfide ore. Int. J. Miner. Process. 2018, 122, 142–147. [Google Scholar]
- Rao, S.R.; Finch, J.A. A review of water reuse in flotation. Miner. Eng. 1989, 2, 65–85. [Google Scholar] [CrossRef]
- Lazarov, D.; Alexandrova, L.; Nishkov, I. Technical note: effect of temperature on the kinetics of froth flotation. Miner. Eng. 1994, 7, 503–509. [Google Scholar] [CrossRef]
- Lin, I.J. The effect of seasonal variations in temperature on the performance of mineral processing plants. Miner. Eng. 1989, 2, 47–54. [Google Scholar] [CrossRef]
- O'Connor, C.T.; Dunne, R.C.; Botelho De Sousa, A.M.R. The effect of temperature on the flotation of pyrite. S. Afr. Inst. Min. Metall. 1984, 84, 389–394. [Google Scholar]
- O'Connor, C.T.; Mills, P.J.T. The effect of temperature on the pulp and froth phases in the flotation of pyrite. Miner. Eng. 1990, 3, 615–624. [Google Scholar] [CrossRef]
- Grano, S.R.; Johnson, N.W. Ralston. Control of solution interaction of metabisulfite and ethyl xanthate in the flotation of Hilton ore of Mount Isa Mines Limited, Australia. Minerals Engineering 1997, 10, 17–39. [Google Scholar] [CrossRef]
- Albrecht, T.W.J.; Addia-Mensah, J.; Forsenario, D. Critical copper concentration in sphalerite flotation: Effect of temperature and collector. International Journal of Mineral Processing 2016, 146, 15–22. [Google Scholar] [CrossRef]
- Mhonde, N.; Johanson, L.S.; Corin, K.; Schreithofer, N. The Effect of Tetrathionate Ions on the Surface Chemistry and Flotation Response of Selected Sulphide Minerals. Mineral Processing and Extractive Metallurgy Review 2022, 43, 1000–1013. [Google Scholar] [CrossRef]
- Mhonde, N.; Schreithofer, N.; Corin, K.; Makela, M. Assessing the Combined Effect of Water Temperature and Complex Water Matrices on Xanthate Adsorption Using Multiple Linear Regression. Minerals 2020, 10, 733. [Google Scholar] [CrossRef]
- Le, T.M.K.; Schreithofer, N.; Dahl, O. Dissolution Test Protocol for Estimating Water Quality Changes in Minerals Processing Plants Operating with Closed Water Circulation. Minerals 2020, 10, 653. [Google Scholar] [CrossRef]
- Pyke, B.; Fornasiero, D.; Ralston, J. Bubble particle heterocoagulation under turbulent conditions. J. Colloid Interface Sci. 2003, 265, 141–151. [Google Scholar] [CrossRef]
- Eigeles, M.A.; Volova, M.L. Kinetic investigation of effect of contact time, temperature and surface condition on the adhesion of bubbles to mineral surfaces. Proceedings of Fifth International Mineral Processing Congress, IMM, London; 1960; pp. 271–284. [Google Scholar]
- Klassen, V.L.; Mokroussov, V.A. An introduction to the theory of flotation. London, Butterworth, 1963, 258.
- Marais, P. Some practical considerations in the design and operation of a plant for the differential flotation of mixed sulphides, especially copper and zinc. J. S. Afr. Inst. Min. Metal. 1980, 80, 385–394. [Google Scholar]
- Bicak, O.; Ozturk, Y.; Ozdemir, E.; Ekmekci, Z. Effects of Pulp Temperature on Flotation of a Complex Sulphide Ore. 16 th International Mineral Processing Symposium, 23-25 Ekim 2018, Antalya.
- Farrokhpay, S.; Zanin, M. An investigation into the effect of water quality on froth stability. Adv. Powder Technol. 2012, 23, 493–497. [Google Scholar] [CrossRef]
- Davidson, J.F.; Sholer, B.O.G. Bubble formation at an orifice in a viscous liquid. Trans. Inst. Chem. Eng. 1960, 38, 144–154. [Google Scholar] [CrossRef]
- Marsden, D.D. The effect of pH value, temperature and density on the kinematic viscosity of some South African gold-mine slurries. J. S. Afr. Inst. Min. Metal. 1962, 62, 391–398. [Google Scholar]
- Sutherland, K.L.; Wark, L.W. Principles of flotation. Melbourne, Australian Institute of Mining and Metallurgy, 1955, 178-188.
- Sinche-Gonzalez, M.; Forsenario, D. Understanding the effect of sulphate in mining-process water on sulphide flotation. Minerals Engineering 2021, 165. [Google Scholar] [CrossRef]
- Bulatovic, S.M. Handbook of Flotation Reagents, 2007, Chapter 13, 295-322.
- Sheni, N.; Corin, K.; Wiese, J. Considering the effect of pulp chemistry during flotation on froth stability. Minerals Engineering 2018, 116, 15–23. [Google Scholar] [CrossRef]
- O’Connor, C.T.; Mills, P.J.T. The effect of temperature on the pulp and froth phases in the flotation of pyrite. Minerals Engineering 1990, 3, 615–624. [Google Scholar] [CrossRef]
- Mustafa, S.; Hamid, A.; Naeem, A. Temperature Effect on Xanthate Sorption by Chalcopyrite. J. Colloid Interface Sci. 2004, 275, 368–375. [Google Scholar] [CrossRef]
- An, D.; Zhang, J. A Study of Temperature Effect on the Xanthate’s Performance during Chalcopyrite Flotation. Minerals 2020, 10, 426. [Google Scholar] [CrossRef]
- Wan, H.; An, Y.; Luukkanen, S.; Qu, J.; Zhang, C.; Xue, J.; Wang, S.; Bu, X. New insights into the sphalerite activated by copper sulfate in lime systems. Colloids and Surfaces A: Physicochemical and Engineering Aspects 2023, 667. [Google Scholar] [CrossRef]
|
Disclaimer/Publisher’s Note: The statements, opinions and data contained in all publications are solely those of the individual author(s) and contributor(s) and not of MDPI and/or the editor(s). MDPI and/or the editor(s) disclaim responsibility for any injury to people or property resulting from any ideas, methods, instructions or products referred to in the content. |
© 2023 by the authors. Licensee MDPI, Basel, Switzerland. This article is an open access article distributed under the terms and conditions of the Creative Commons Attribution (CC BY) license (https://creativecommons.org/licenses/by/4.0/).

