1. Introduction
Gross domestic product (GDP), which is confined to national income, has been used as an indicator of the quality of life of people in combination with two conditions—namely, the empirical assumption that income exerts an absolute impact on the quality of life and the practical environment for improving living standards after World War II. Level of income is the primary material basis for improving the level of happiness. Economists consider individual happiness as a function of income. That is, the opinion of economists on happiness is that the happiness of individuals, households, and the country increases as income increases, improving the capability to fulfill demands.
However, new approaches for the correlation between income and happiness have emerged, such as a study showing that an increase in the absolute amount of income does not correlate with an increase in happiness [
1] and the Esterlin paradox that the increase in happiness proceeds slightly when the increase in income reaches a certain level.
What is the relationship between income and health? Differences in the level of health are as diverse and unequal as those in the level of income. Humans do not have the same features, the way of becoming ill, or even the way to die. In addition to genetic factors, differences in the level of health depend on the social and economic status of parents, which continues to influence people’s lives. The level of income differs according to educational background, resulting in differences in the qualitative and quantitative capabilities of medical services.
This study conducted a conceptual review of the differences in health and health levels. Consequently, describing the concept of health as an absolute unified theory or explanation that transcends time and space is difficult. That is, it should be considered a relative concept that is flexible within the interests of an individual or group by reflecting the generation.
The factors influencing health remain controversial with respect to whether the cause of health is a personal and behavioral result or a social and structural problem [
2]. Examining the perspectives of reformism and historical materialism is vital. Reformism emphasizes the importance of social and environmental factors. This approach argues for the need for social and environmental improvements, such as lifestyle and nutrition management, for groups that could develop diseases, as the causes of various diseases interact. Therefore, a reformist position exists within the medical paradigm in a large framework, and health and disease are attributed to individual eating habits and health behaviors such as exercise. Conversely, the historical materialistic perspective emphasizes factors such as social structural inequality, poverty, and poor living conditions, rather than individual behavior. Some view the results of capitalist economic development as a health gap [
3,
4]. The other point of the historical materialistic view argues that industrialization caused health risk factors, not capitalism itself, which improved the diet, nutrition, and environment of living [
5]. Reformism and historical materialistic perspectives have significant relevance to the “cause-related debate” on health responsibility. For example, although reformists include social factors by emphasizing diet, health behavior, and hygiene, they tend to ignore socioeconomic factors such as income and wealth distribution. However, this position perpetuates the notion that premature death is a personal—rather than a social—responsibility [
6].
However, to understand health, it is important to understand the relationship between health and the environment, including factors related to individuals, communities, and the macro and political levels. McKeown argued that changes in the socioeconomic environment are more relevant than the quality of medical care [
7]. Both the Black Report and Acheson Report, which deal with health inequality in the UK, emphasize that living conditions have a significant influence on health than the quality of medical technology or medical services. Both reports emphasize that socioeconomic, cultural, and environmental conditions, housing or working conditions, and community influences are as important as income distribution [
8,
9]. Furthermore, the relationship between health and income inequality is controversial, although empirical studies on the relationship between the two variables have been conducted in recent years.
Income influences on health in two conditions. One is the lack of the absolute income necessary to maintain proper health conditions, such as poverty, and the other is the case wherein an intensive income gap causes various social side effects that negatively affect health. The relationship between per capita income and health is mainly addressed in the absolute income hypothesis, while the relationship between income inequality is addressed in the relative income hypothesis. Both hypotheses explain the relationship between income inequality and health, but each has a different explanation.
The absolute income hypothesis (AIH) refers that the effect of income on health refers a diminishing return as income increases [
10]. As income increases, the slope of life expectancy and mortality gradually increases. Preston (1976) argued that when economic growth reaches a certain level, life expectancy increases slightly, even if national income increases. Wilkinson (1996) mentioned the level of gross national product per capita as a threshold. Based on this, the AIH refers that the health of individuals is affected by an individual income, not by the condition of income distribution [
11]. Moreover, it refers to the effect of income inequality on national health as a compositional effect caused by the presence of lower-income individuals in society. Conversely, the relative income hypothesis (RIH) refers that income inequality affects health, irrespective of the absolute income level of individuals. That is, it is possible to worsen health conditions through income inequality, even when individuals have the same income level. The factor that explains an individual’s health level is personal characteristics and the influence of the group or region to which he belongs, that is, the contextual effect. According to the RIH, a person’s health can be affected by incomes of other people.
The RIH, or the contextual effects on health, is as follows:
Macinko presented a new materialism perspective whereby income deficiencies, such as poverty, influence health because the number of the poor increases as income inequality intensifies[
12]. However, this perspective is consistent with the AIH described previously, and the following perspectives can be seen as appropriate contextual effects. Second, the reduction of social investment refers to income inequality, causing under-investment in human capital [
13]. They tend to have a lower proportion of the total budget in the medical and educational sectors in intensified income inequality regions than those that do not. This suggests that regions with intensified income inequality have lower HDI indicators on human development index. The more intense the income inequality, the lower the social expenditure, the more inequality prevails, and the different interests of the rich and middle class differ [
14]. That is, there is a possibility of a lower supply of public goods, such as public health services, as societies under intensified inequality have become more polarized [
15]. Third, from the social psychology perspective, income inequality weakens social cohesion and adversely affects social capital and mutual [
16]. That is, residents in regions with intensified income inequality tend to distrust each other, have lower rates of civic group membership, and have less social interaction, which increases crime rates and is strongly correlated with mortality. Income inequality weakens social ties and adversely affects the public health. Finally, from the perspective of "social status" in social psychology, the deterioration of income inequality affects individual social status inequality, which can lead to the deterioration of health. This is because the higher the income inequality, the more likely individuals with lower social status are to be under severe stress and the greater the health impact of low income.
Table 1.
Influence of Income Inequality on Public Health.
Table 1.
Influence of Income Inequality on Public Health.
| |
Theory |
Social Psychology |
New Materialism |
| Analytic Level |
|
| Individual |
Social Status:
Inequality causes chronic stress in low-income families, which is detrimental to health |
Individual Income:
Low-income levels have fewer material conditions to avoid diseases and risks, which is detrimental to health |
| Social |
Social Cohesion:
Inequality undermines social ties, which leads to low confidence and increased crime rates, which are detrimental to health |
Social Disinvestment:
Inequality causes a decline in investment in social and environmental conditions necessary to promote health for low-income people, which is detrimental to health |
In conclusion, although many empirical studies have examined the relationship between income inequality and health, income inequality tends to negatively affect health and major values in the public sphere, such as trust and fairness [
15,
16,
19].
As a representative empirical study on the relationship between income and health, Rodgers [
17] analyzed the significant correlation between income level and life expectancy and revealed that countries with equal income distribution differ in average life expectancy by up to 10 years compared to countries with unequal income distribution. Willkinson [
18] proved this correlation by analyzing the relationship between the Gini coefficient and life expectancy in 11 Organization for Economic Cooperation and Development (OECD) countries. According to the analysis, income distribution has a significant effect on health inequality than GDP. While the effect of the GDP on life expectancy is less than 10%, the income share of low-income families accounts for approximately 75% of life expectancy [
20]. Le Grand [
21] also revealed that the mortality rate is closely related to income redistribution. In a study of 17 countries, Le Grand found that the relationship between the income of the lower 20% of the poor and the proportion of the country’s total income is important. Kaplan [
13] studied the relationship between the proportion of income and total mortality accounted for by the bottom 50% of the total income in 50 states in the United States; they found that income distribution and age-standardized mortality were significantly correlated. This effect appears to be a universal phenomenon, regardless of sex or race.[
22]
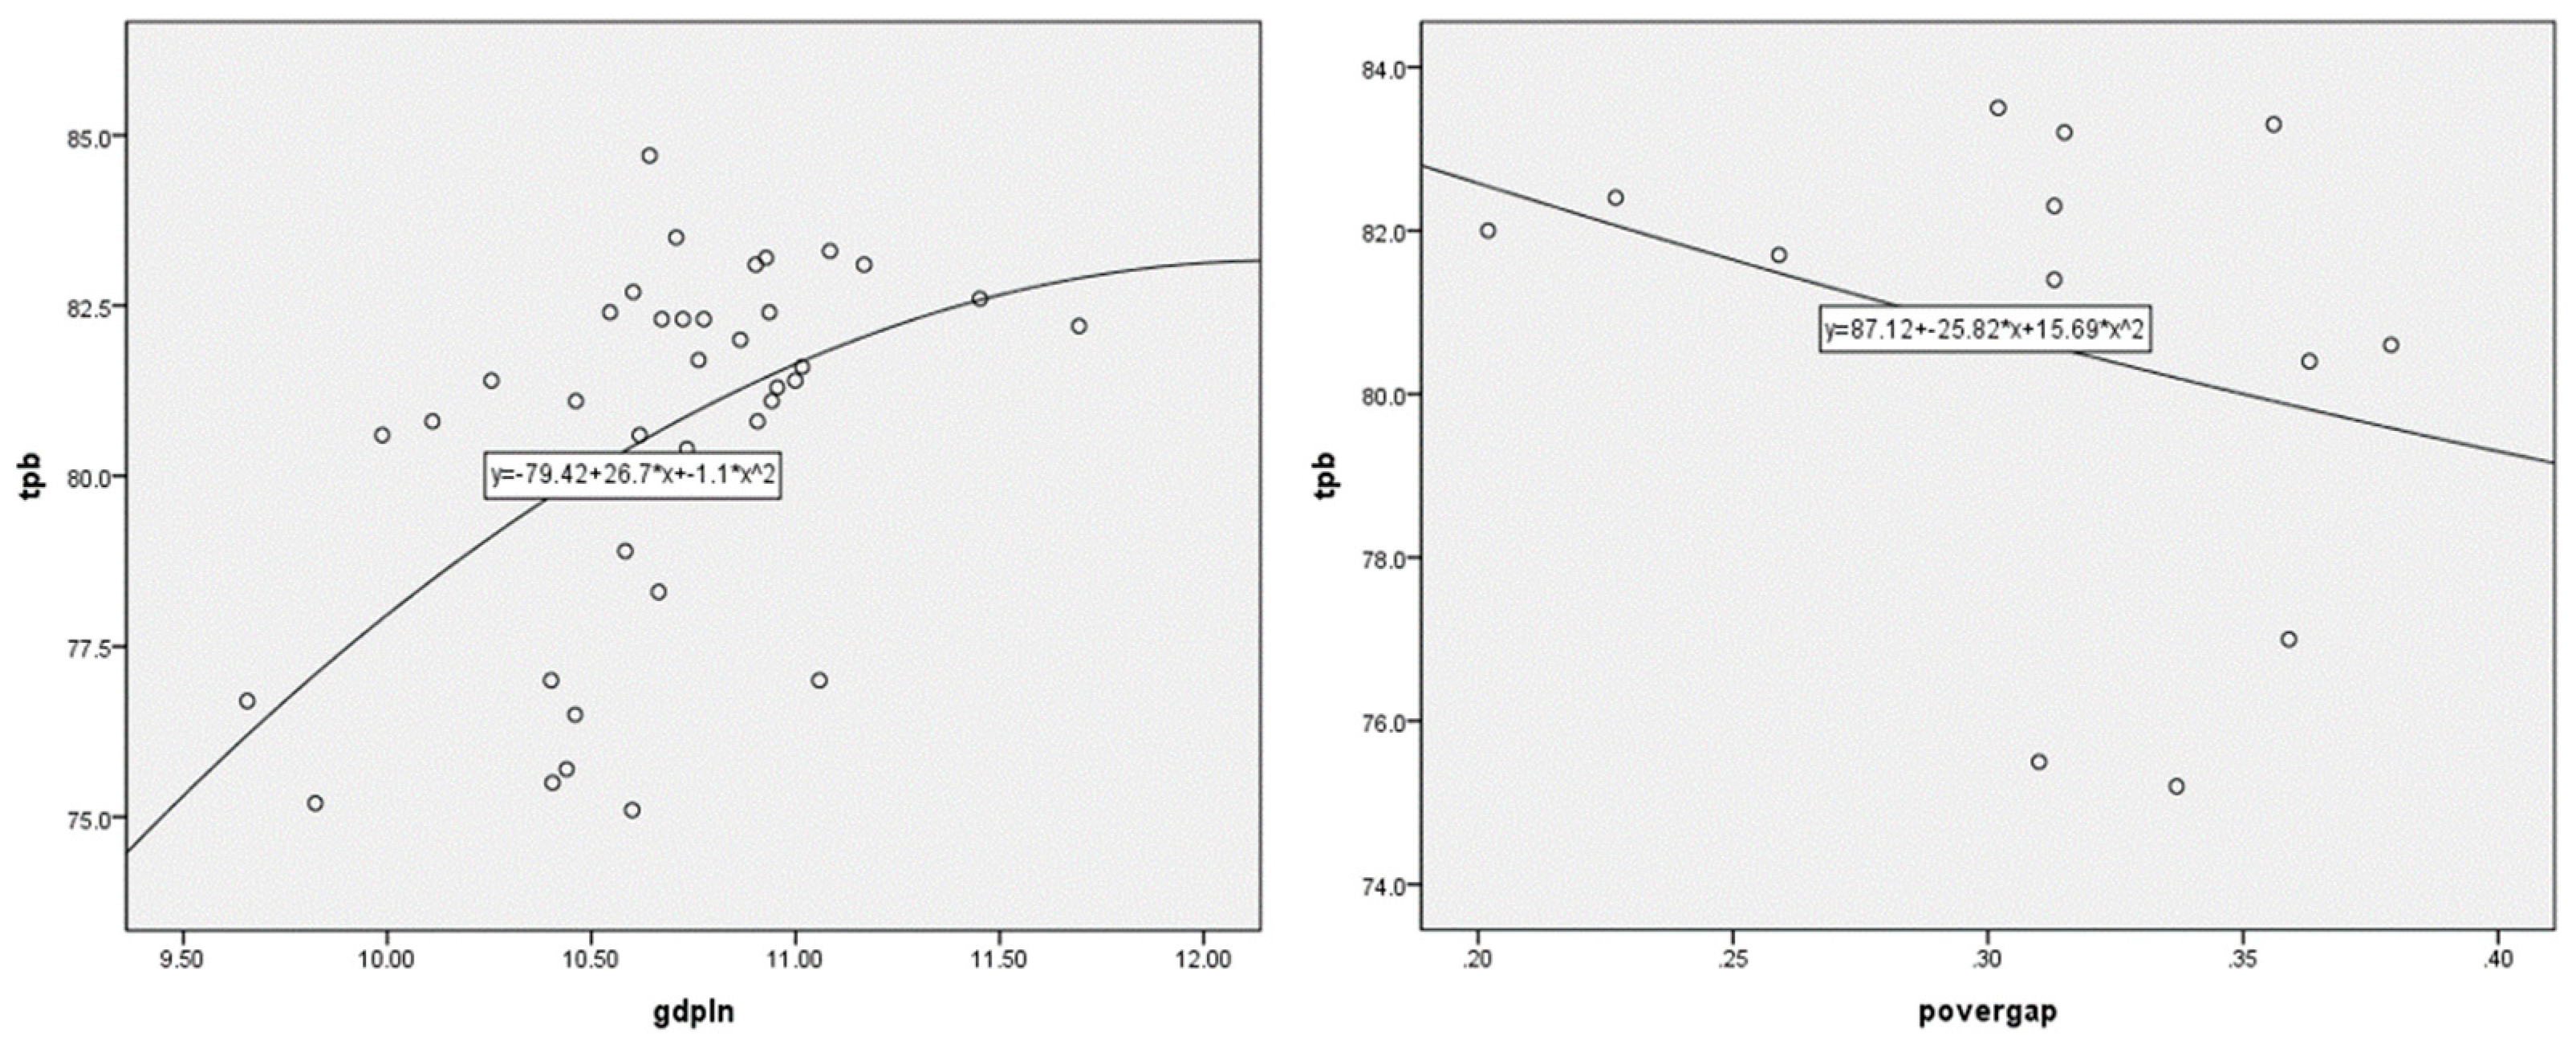
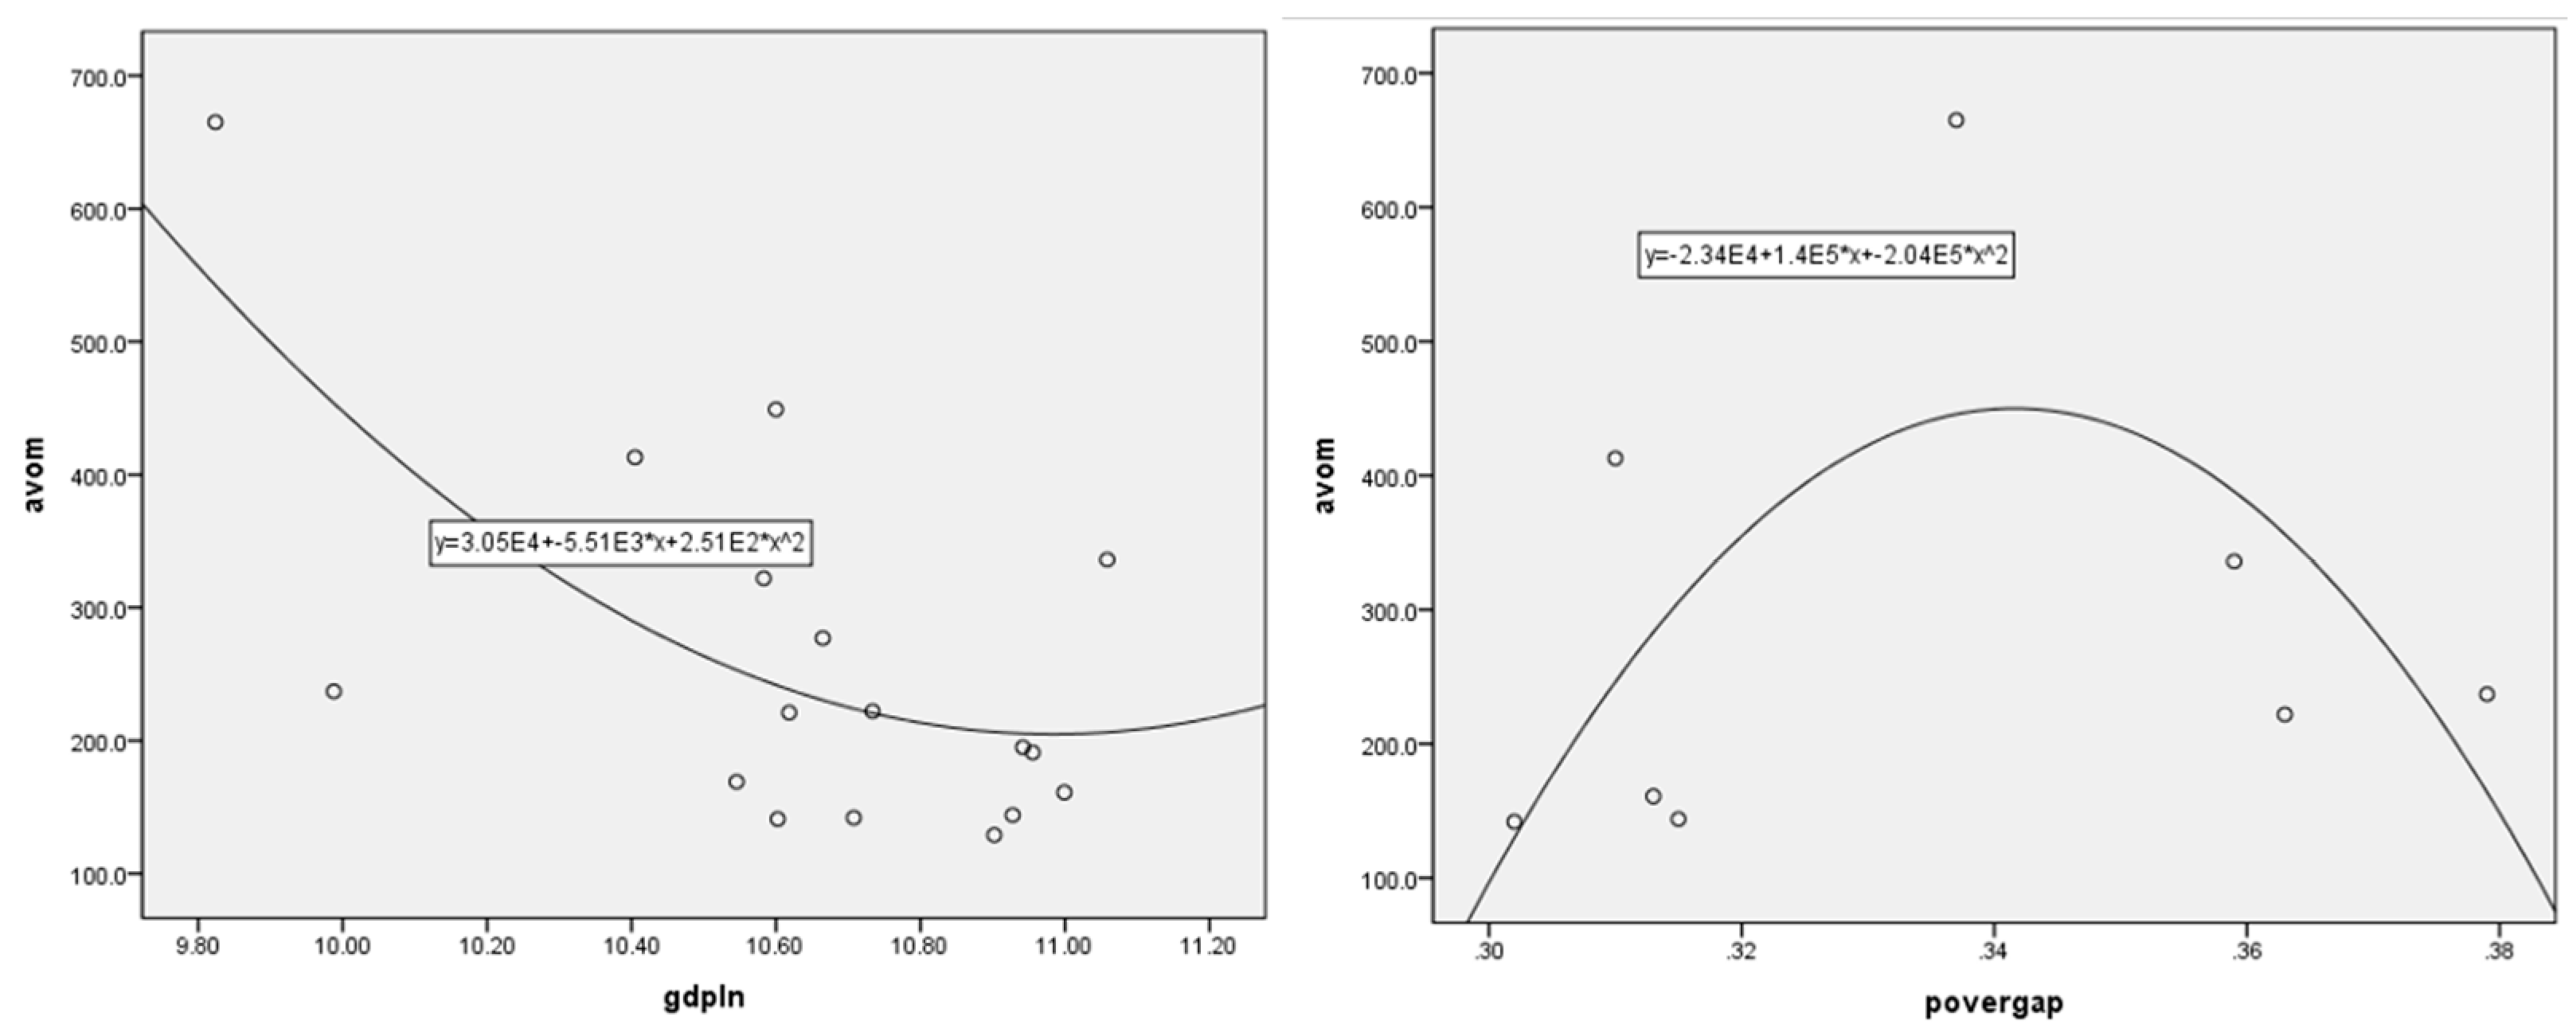
In this regard, this study conducts a panel analysis with OECD statistics data for 21 years to analyze how economic growth and distribution levels have significant relevance to health inequality.
2. Materials and Methods
2.1. Data Collection
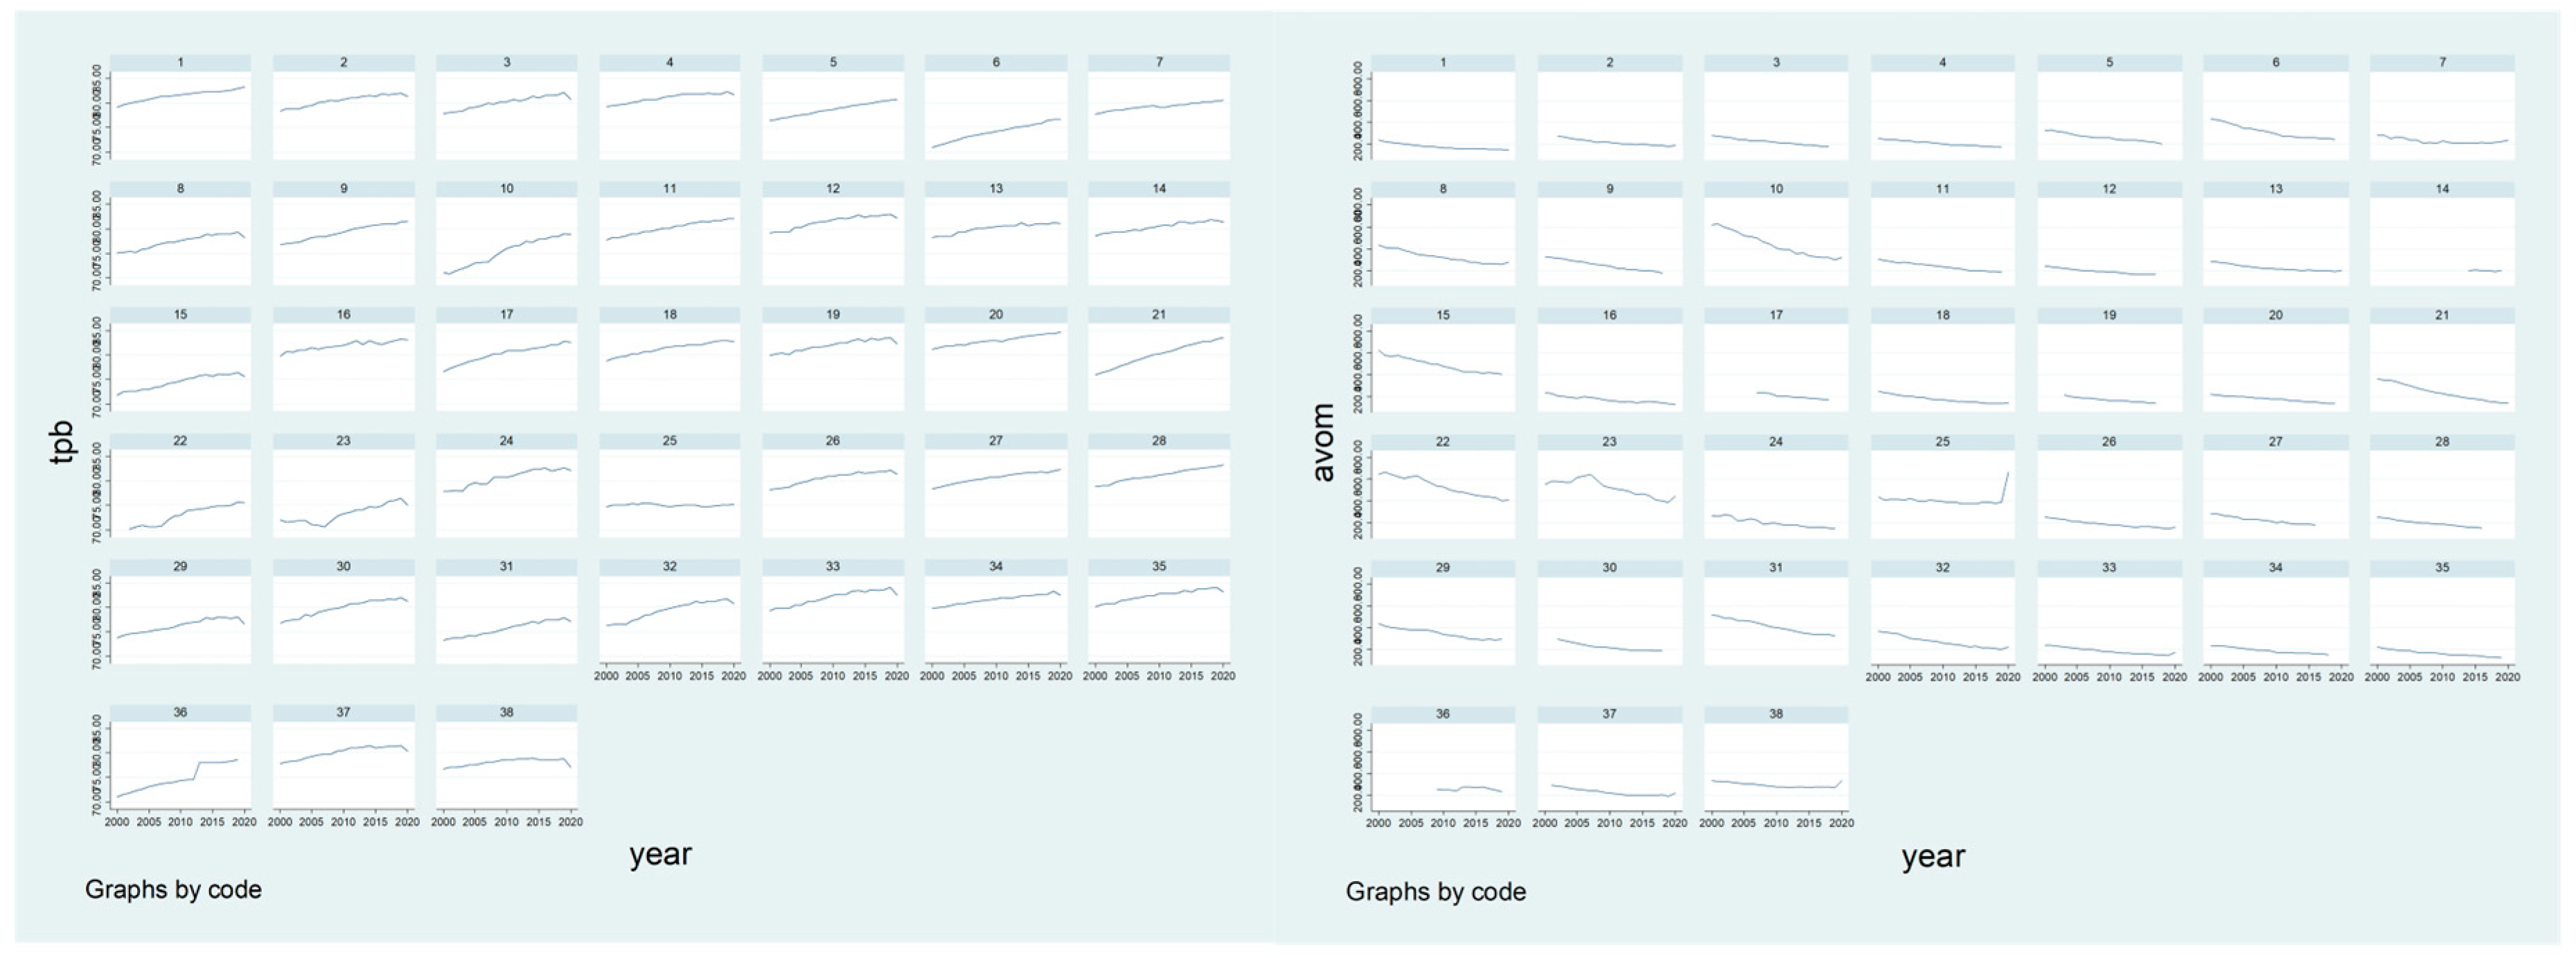
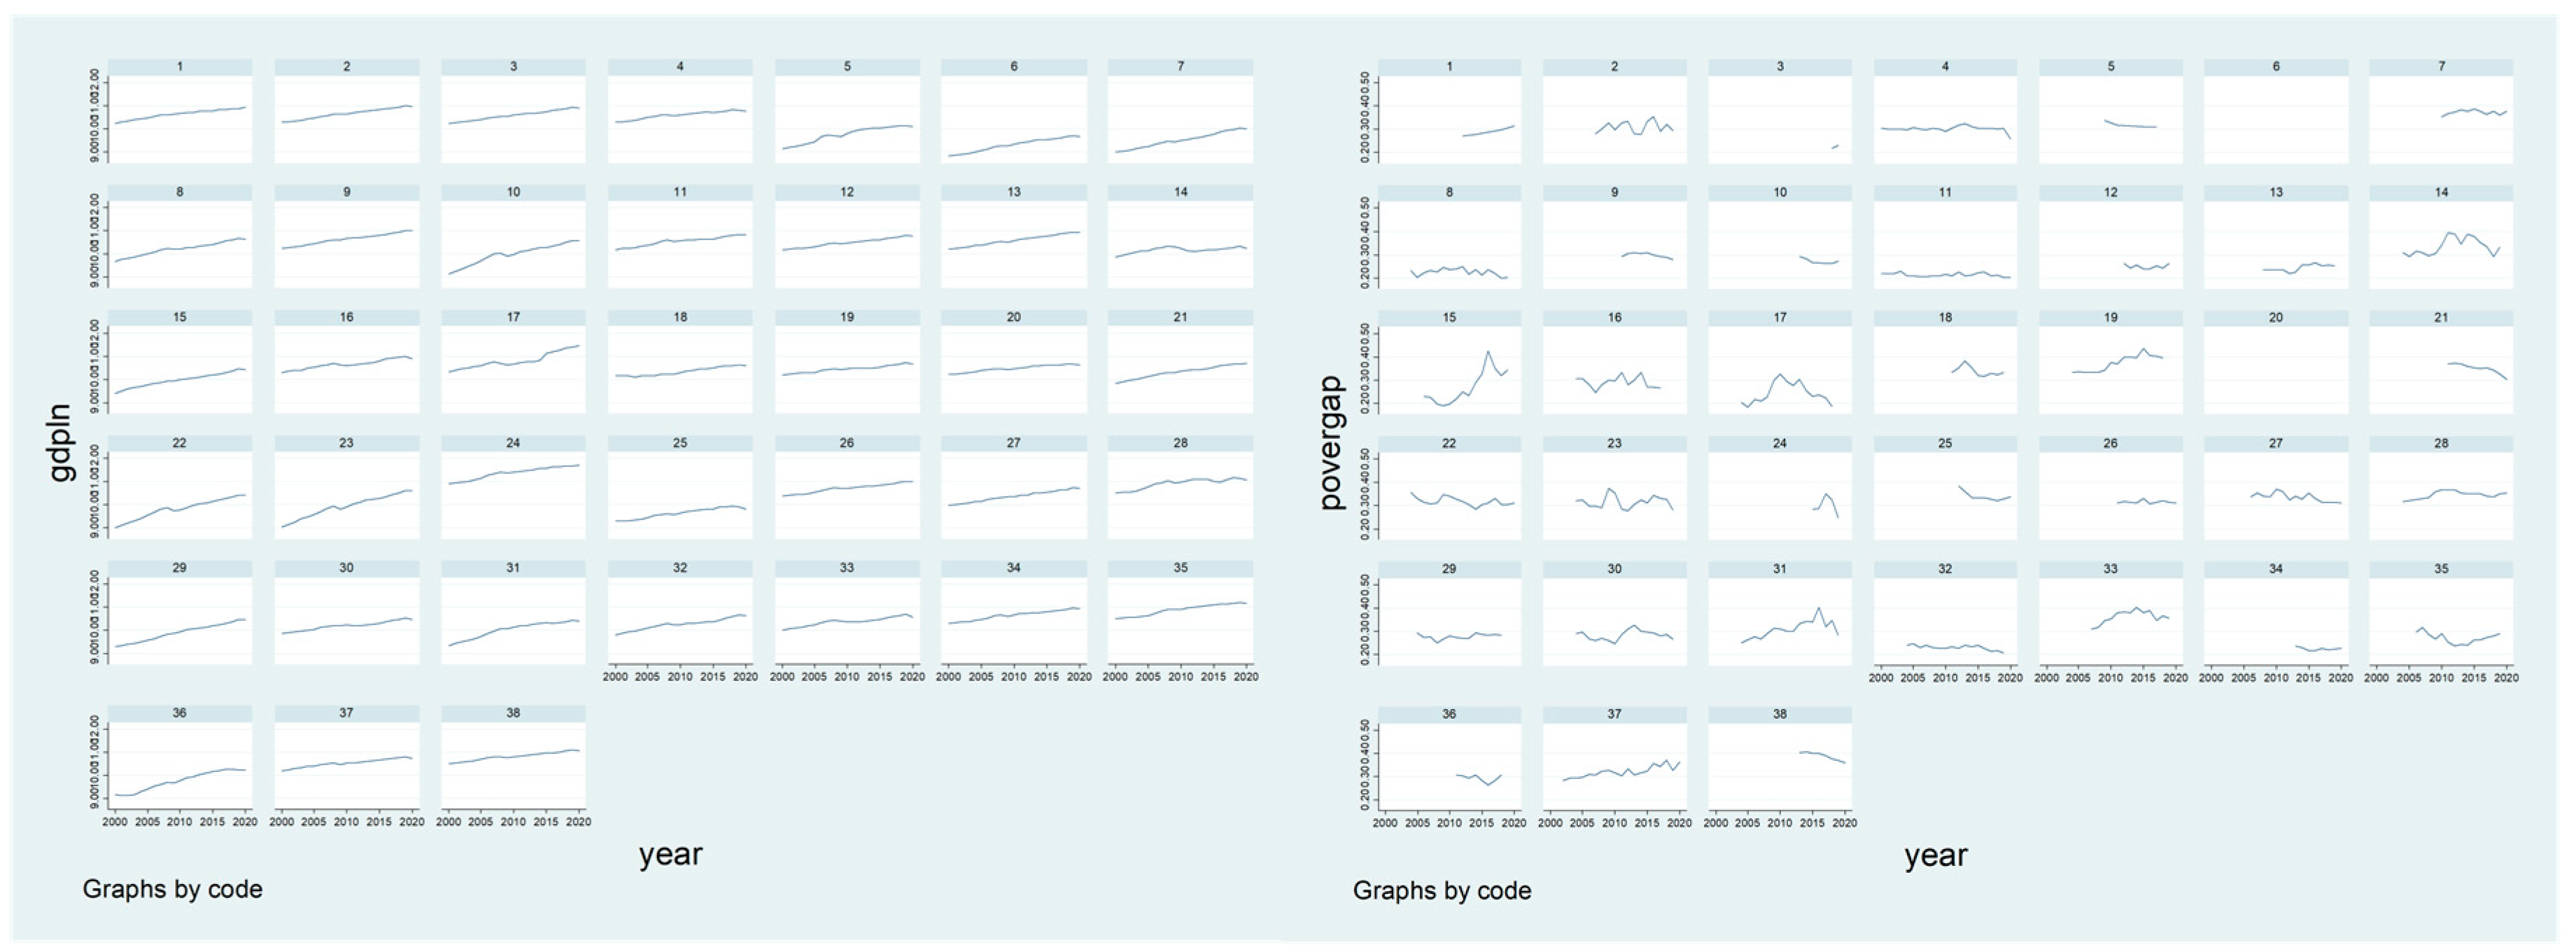
This study applied OECD statistical data to verify health inequalities in OECD countries. The OECD provides health and healthcare data and data from various fields such as employment, social policy, family, and pension per year, thus facilitating the analysis of socioeconomic factors and income inequality. For the analysis, pooled data were combined in a time series of 21 years from 2000 to 2020. Thirty-eight countries (Australia, Austria, Belgium, Canada, Chile, Colombia, Costa Rica, Czech Republic, Denmark, Estonia, Finland, France, Germany, Greece, Hungary, Iceland, Ireland, Israel, Italy, Japan, Korea, Latvia, Lithuania, Luxembourg, Mexico, the Netherlands, New Zealand, Norway, Poland, Portugal, Slovakia, Spain, Switzerland, Turkey, the United Kingdom, and the United States) are subject to analysis.
2.2. Setting Variables
This study empirically analyzes the factors that influence the growth and distribution of health inequality using OECD statistics. Life expectancy (tax) and avoidable mortality (% per 100,000 people) were applied as the dependent variables for health inequality. This is because the patterns of each dependent variable may refer to various conditions depending on economic growth and distribution, unemployment, and poverty. It is reasonable to apply various variables as proxy variables rather than applying a single variable to measure health inequality. Life expectancy is the average age expected to survive in the future of the population aged 40, 60, 65, and 80 years, based on OECD analysis, and an indicator of the overall health status of the people of each country is applied. The avoidable mortality rate is the sum of the preventable mortality rate before accidents and diseases occur and the treatable mortality rate that can be secondarily prevented through examination and treatment after accidents and diseases. It is calculated as the mortality rate per 100,000 people according to OECD population standards.
Proxy indicators of growth and distribution were used as independent variables. GDP, which measures the basic income of a country, is measured as per capita GDP for each country and is based on the US dollar (USD) used as the key currency. In the case of GDP per capita, the deviation between countries is relatively large, and the unit difference is larger than that of the other variables, indicating that the related problem has been solved through log conversion. In the case of distribution, a poverty gap utilizing the concept of relative poverty was applied. Relative poverty is an arbitrary concept in which the meaning of absolute poverty itself is relative [
22], and was introduced by Heo et al. [
23] as having the possibility of arbitrary or relative judgment being involved in setting standards that are essential for minimum needs. Even in countries with the same relative poverty rate, the poverty gap has been applied as a variable of distribution because it may differ depending on the relative size of poverty, that is, the average income of the lower-income class. The poverty gap is calculated and reflected after taxes and the transfer of income based on 50% of the poverty line.
Additionally, to verify the pure statistical effect of the independent variables, diverse variables that may affect the level of health inequality were controlled. First, the effects of drinking, smoking, and obesity were controlled as health-risk variables. Drinking means consumption per person of the population aged 15 or older, and smoking means smoking rate among the population aged 15 or older, and it was measured as %. Overweight or obesity was presented as the percentage of people with a body mass index (BMI) of 25 or more out of the total population of each country, based on the International Health Organization's BMI index.
Simultaneously, the representative variable, which indirectly measures healthcare resources, was controlled. First, the number of health care personnel and beds was calculated as "health care personnel per 1000 people" and "the number of beds per 1000 people." Health and medical expenses were measured as %, and national medical expenses were controlled for. This study controls for the share of government and compulsory schemes in national medical expenses related to GDP.
Finally, unemployment rate (%) is also a major variable influencing health inequality. Economic activity is directly related to an individual's income [
24], and it has been reported that unemployment increases the mortality rate regardless of other variables and affects risk variables related to death [
25]. Therefore, in this study, the ratio of the unemployed to the economic population aged 15 years or older was controlled for by OECD standards.
2.3. Analytical Method
The data for the analysis of this study are arranged by combining two spatially different cases (N) and chronologically different cases (T). The combination of these space and time (N×T) data has the advantage of analyzing cross-sectional area fluctuations and temporal fluctuations simultaneously as well as the effect of increasing the degree of freedom. It also enables research on variables that cannot be analyzed using simple cross-sectional data or time-series data because there is little or no volatility in time and space, and enables systematic comparison of causal factors that change spatially or in time. Panel analysis is estimated using generalized Ordinary Least Square (OLS); however, OLS could violate the basic assumptions of several estimates. First, combined data tend to exhibit autocorrelation, which is a correlation between different time points, owing to the characteristics of interdependent observation values over time. Second, there is a heteroscedastic characteristic in which the dispersion of errors varies depending on the unit of time [
25,
26]. Third, the errors tended to show contemporaneous correlations across spatial units at certain points in time. Fourth, the errors included both time and unit effects [
25]. Because OLS has biased, inefficient, or inconsistent estimation problems, this study considers the applicability of OLS.
The analysis procedure was as follows: First, the average and standard deviation of the variables were reviewed using descriptive statistics of the major variables. Second, the Lagrange multiplier test proposed by Breusch and Pagan [
27] was conducted to confirm the simultaneous correlation and determine the appropriate model between the pooled OLS and random effects models. Third, through an F-test, an appropriate model was identified between the pooled OLS model and the fixed-effect model. Fourth, to compare the suitability of the fixed effects and pooled OLS models, a Hausman test was conducted to determine a valid model, and the factors influencing health inequality were verified through the final model.
4. Discussion and Conclusion
This study analyzed how a country’s growth and distribution are significantly correlated with health inequality. A panel analysis was conducted using 21 years of time-series data for 38 OECD countries. The analysis results are summarized as follows:
First, the influence of independent variables that could not be confirmed in cross-sectional analysis was statistically significant as a result of panel analysis. In the case of cross-analysis of OECD data, the number of small samples (number of countries) may cause distortion of the analysis results. At the same time, it is difficult to compare or control the level of social security, the level of health care fiscal expenditure, and the level of impact of medical indicators in individual countries in the case of using statistics by country in individual. Therefore, panel analysis that combines space and time data could derive more practical implications as in this study.
Second, it was confirmed that economic growth (GDP per capita) influences on life expectancy and avoidable mortality as a result of panel analysis.
Economic growth and income distribution affect life expectancy and avoidable mortality rates. In particular, an increase in GDP per capita increases life expectancy and decreases avoidable mortality rate. Economic growth affects individual countries in various ways, including changes in living standards, diversification of individual values, development and accessibility of medical services, and development of medical technology, increasing life expectancy and decreasing preventable deaths.
Third, it has been confirmed that as the poverty gap increases, life expectancy increases and the avoidable mortality rate decreases.
Generally, income inequality is known to negatively affect health inequality; however, the results of this study are conflicting. In this regard, unlike the Gini coefficient, the poverty gap does not represent income distribution in society. That is, the poverty gap focuses on the average income of the lower class rather than on the Gini coefficient. Thus, an improvement in the Gini coefficient does not necessarily indicate an improvement in the poverty gap. Therefore, it provides the meaning that health inequality can improve even if the average income of the lower class does not improve. Perhaps, each country has a separate specialized medical system for the lowest class (i.e., Korea has a medical benefit system); thus, if the poverty gap increases, it is likely to be included in the related medical security system. In other words, it has possibility that a new medical security system for the poor will be established or coverage of the existing medical security system will be expanded in the case of growing poverty gap. Therefore, as in this study, income inequality cannot necessarily be judged to have a negative effect on health inequality. That is, it should be noted that an increase in the poverty gap causes medical intervention and expansion of social security for the lowest class, resulting in improvement of health inequality. These analysis results are difficult to confirm in cross-sectional analysis, and it is derived through panel analysis. Furthermore, there is a discussion that when income inequality in society as whole increases, relative deprivation affects various paths of health inequality through socio-psychological factors and awareness of inequality. However, even before the lowest class recognized relative deprivation, social-structural inequality existed. That is, social and psychological factors such as deprivation can occur depending on the proportion of all members of society; however, if limited to the lower class, social and psychological factors can have less influence. In addition, the increase in quality of life or satisfaction of the second-highest class may have had a greater impact on the overall welfare of society.
Considering the impact of economic growth and income inequality on health, it is necessary to pay attention to income inequality and lower-class healthcare policies in the future. Preceding literatures have empirically proven the causal effects of social protection systems and regime on health [
28,
29]. Thus, it is necessary to strengthen the potential role of social protection and to strengthen the comprehensive medical service system and poverty policy. Policy interventions are required to block or alleviate the negative effects of income inequality [
30]. According to Sen [
31], health is a key element in the ability to properly enjoy and claim basic rights and opportunities for political and economic participation in democracy. As physical and mental health status is related to basic energy in daily life, such as economic, cultural, and political activities [
32], the deterioration of health owing to income inequality has side effects that undermine the overall capacity of life. Simultaneously, if income inequality leads to health deterioration through various non-health paths, support for the vulnerable needs to be strengthened through non-health policies such as education, housing welfare, transportation, and improvement of the working environment [
33]. Policy support in the non-medical sector should be provided along with health support in various forms to enhance the capabilities of poor or vulnerable groups sensitive to the negative effects of income inequality. Furthermore, efforts are required to design health policies that reduce social gaps and promote equity, along with policies that can macroscopically reduce income inequality.


