1. Introduction
West Africa is one of the most impacted regions by the effects of climate change, due to its vulnerability, the poor economy, and low capacity of adaptation [
1,
2,
3]. Consequently, the survival of many sectors of activities (i.e., agriculture, transportation, infrastructure, etc.) depends on the advent of climate change. IPCC’s framework recommendations stipulate that governments, non-governmental organizations (NGOs) and stakeholders must take appropriate decisions to reduce greenhouse gas emissions in order to minimize their effects in response to the global warming. Indeed, the manifestation of climate change is especially caused by the advent of climate extremes of which heatwave, dry and wet spells are considered among the most dangerous in terms of dramatic impacts on the health of humans and natural ecosystems as well as on anthropogenic activities like infrastructures and economy [
4]. For example, exceptional or abnormal values of temperature recorded over a region or area during at least three consecutive days can be considered as a heatwave. Furthermore, when the same region or area is faced to a long dry spell, this can cause a risk of drought. Finally, while at the same time, over the same region, wet spells occur, this can enhance flooding and humidity. Therefore, human heath, anthropogenic activities and the environment are in danger.
Several studies have revealed the drawback of heatwave worldwide, in particular in Asia [
5], in Middle East [
6], in Europe [
7,
8,
9], in France [
10,
11], in Russia [
7,
12], in Africa [
13], and in west Africa [
14,
15,
16], causing important damages, loss of life and decrease of the economy. Unfortunately, heatwaves, dry and wet spells as well as other climate extremes are projected to increase in intensity, duration and frequency worldwide [
17,
18] and in some extent with different magnitude or intensity from an area to another [
19]. Heatwaves are generally lethal phenomena, but if they are combined with the effects of humidity, they are more dangerous [
19,
20]. In the same vein, [
21] underlined that hot and humid conditions such are prevailing in coastal regions can be more dangerous than equivalently hot but dry conditions [
4]. Consequently, heatwaves can be classified into two categories: wet heatwaves which are the most dangerous for human health and humid heatwaves [
4,
19,
20]. Thus, heatwaves are generally defined as consecutive days of extremely hot temperatures which exceed thresholds of temperature and span consecutive days [
5,
22]. However, this definition is not universal because of the dependance of heatwave on many factors such are: the research application or activities sectors (health, infrastructure, agriculture), the geographic and climatic conditions and the thresholds, etc., [
23,
24].
Hence, heatwaves do not have a unique definition and occur during a certain period of at least three or six consecutive days. On the other hand, the study of heatwave is not documented over the region of west Africa as well. Moreover, studies implying heatwaves did not analyzed the phenomenon with other climates extremes. This study aims to provide a comprehensive analysis of heatwaves and dry and wet spells over west Africa. Toward this end, the work consists to evaluate the strength of the CORDEX simulations and their ensemble mean in capturing the seasonal cycle of heatwaves and wet and dry spells under the present climate conditions with the observation from Climate Prediction Center (CPC) as reference; then to analyze the projected changes in their seasonal cycles over two future periods with respect to the present climate mean, using CORDEX simulations and their ensemble mean. The paper is organized as follows. First, we describe the materials and methods in section 2. This part includes detailed information about the study domain, the data and the methods with a brief description of the defined Experts Team Climate Change Detection and Indices (ETCCDI) indices related to heatwave, wet and dry spells. Results and discussion are presented in section 3, followed by the summary and conclusions in section 4.
2. Materials and Methods
2.1. Study domain
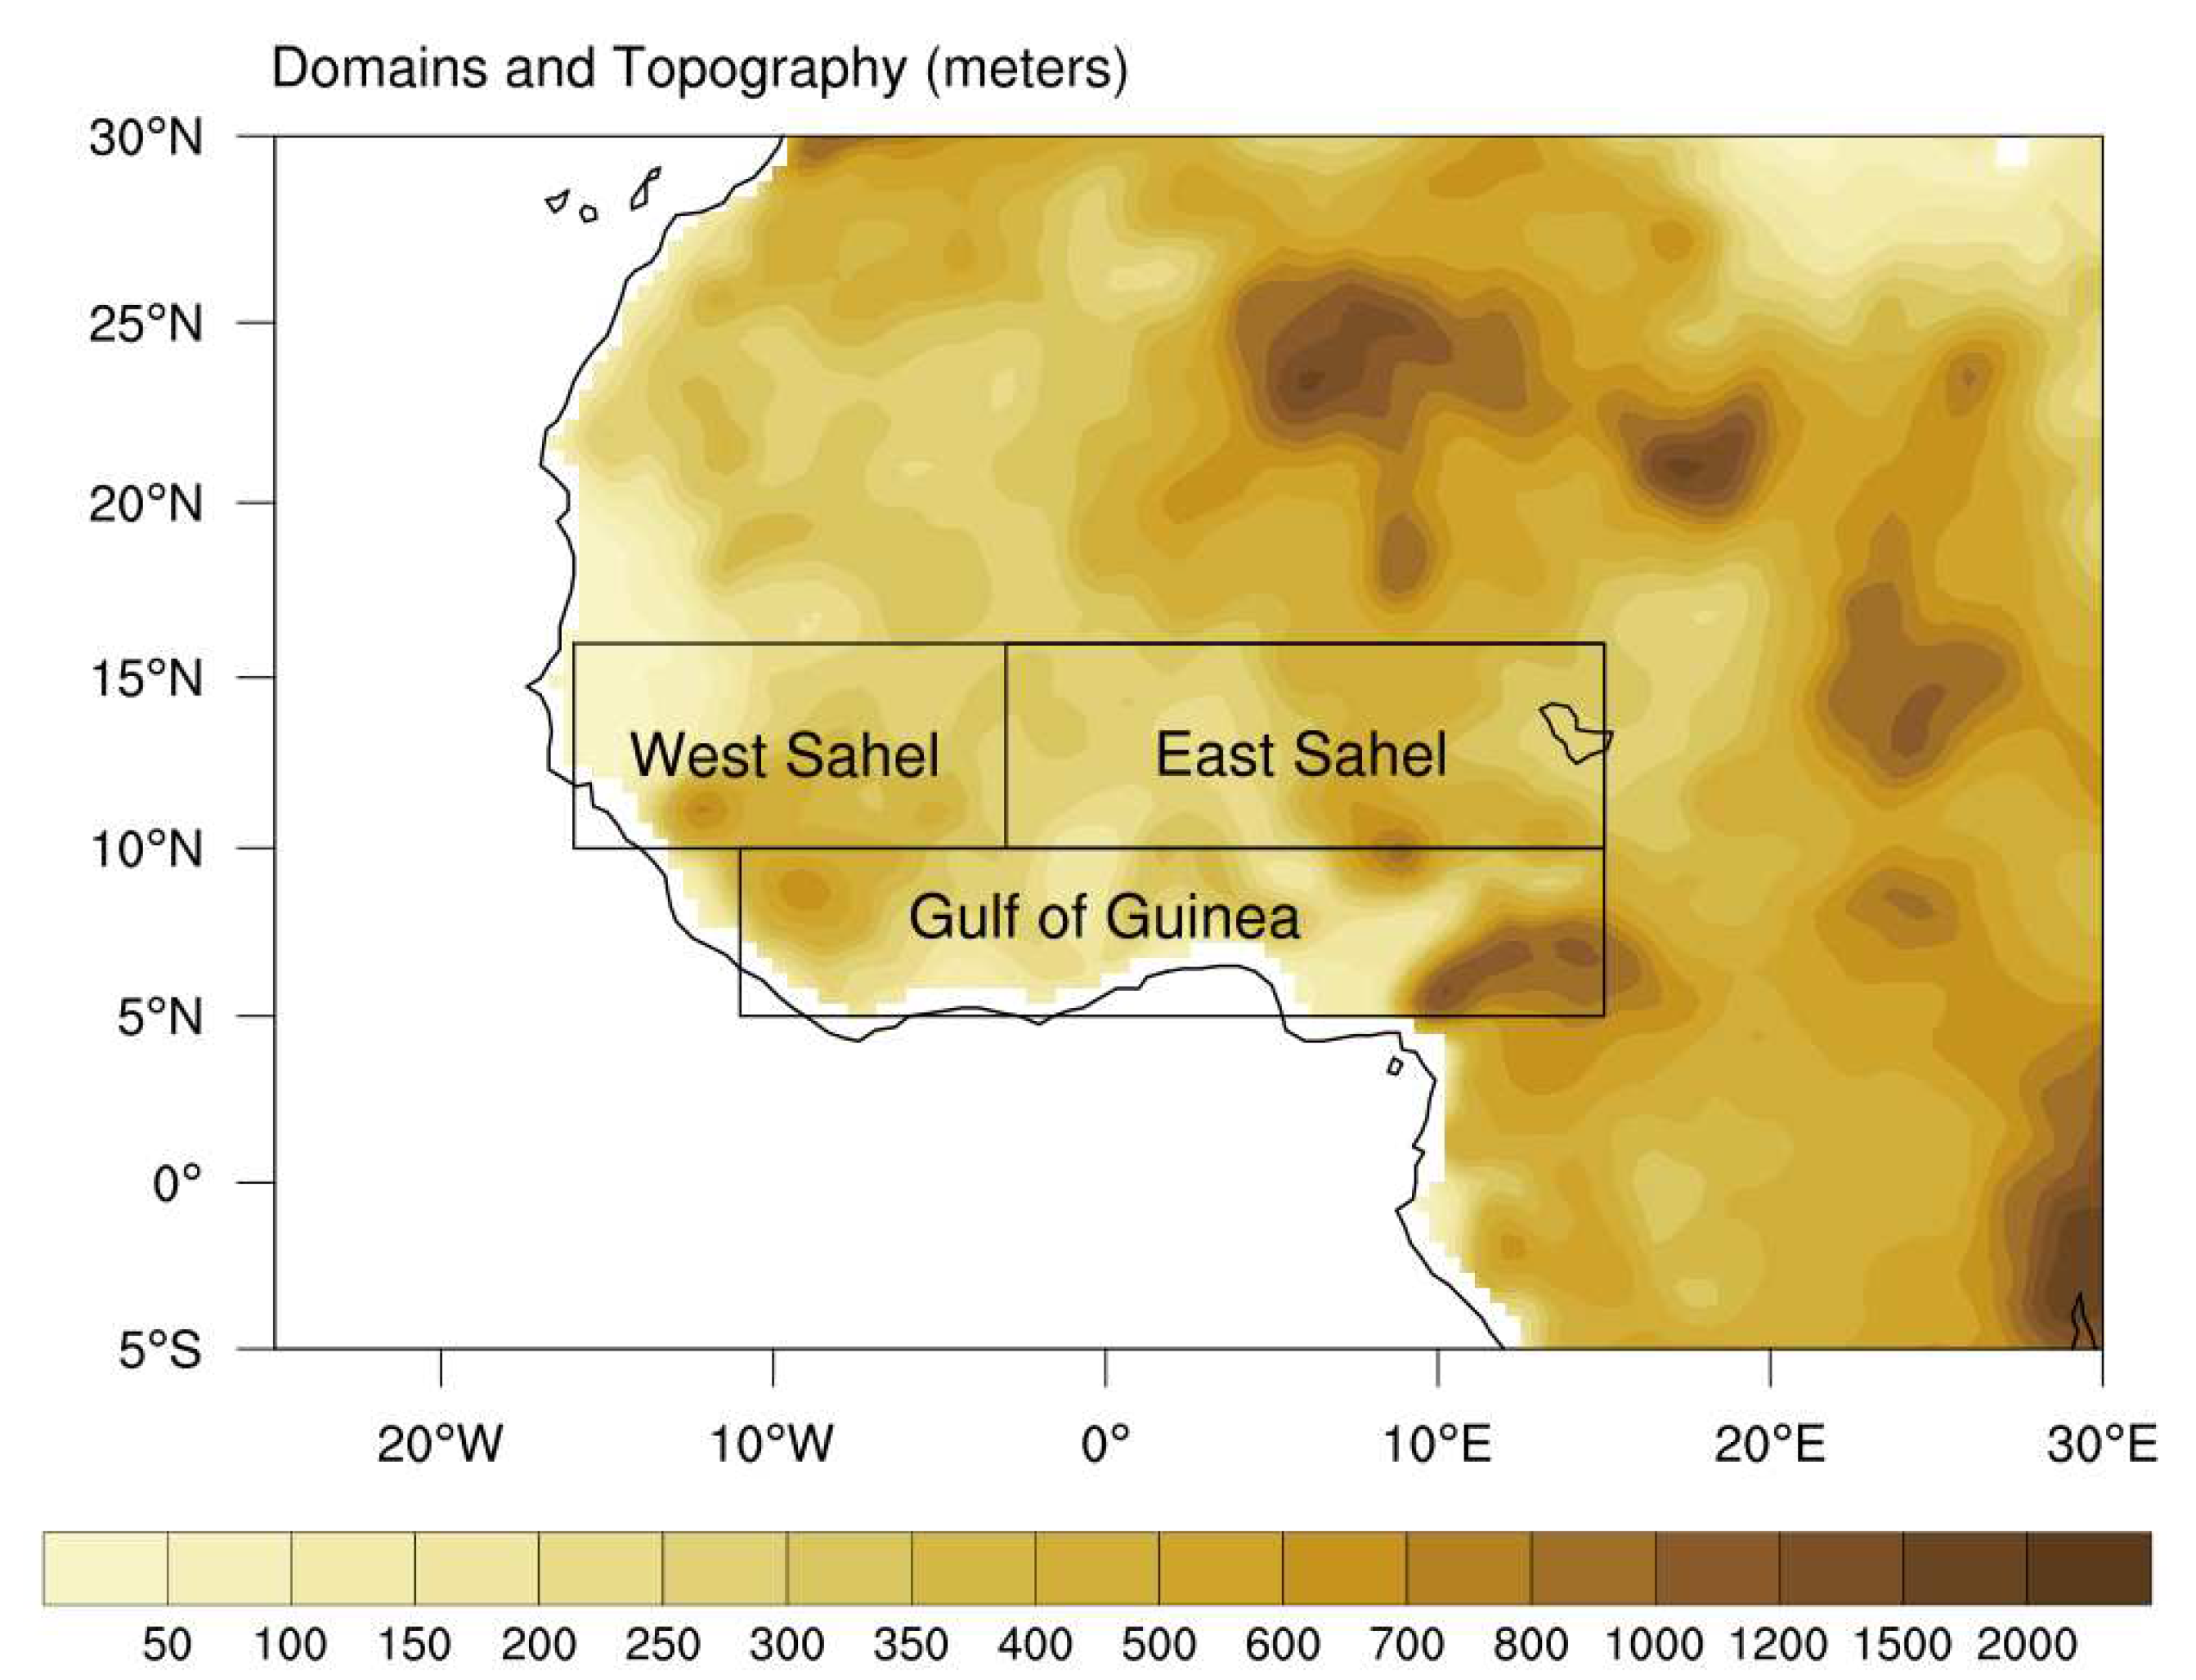
This study is conducted over West Africa domain (5°-15° N, 15°W-15° E) subdivided into three sub-regions, coherent with [
25]: the Western Sahel and the Eastern Sahel, located in the Sahel area and the Gulf of Guinea in the border of the Atlantic Ocean Figure
1. The identification of these sub-regions is based on their location, the climate variability, and other physical features like the ecosystem, the elevation and the soil occupation. Indeed, the West Africa region shows high climate variability at a regional and local scale [
26]. This climate is mostly influenced by the West African monsoon flux, which governs the rainy season and thus the rain-fed agriculture [
26]. This region has a semi-arid and hot climate with a dry season, corresponding to an alternation between a short-wet season and a very long dry-season [
4].
2.2. Data
In this study, we used simulated daily precipitation and maximum temperature outputs (
Table 1) from an ensemble of four (04) Coordinated Regional Climate Downscaling Experiment (CORDEX) RCMs [
27,
28,
29] available on the Earth System Grid Federation (ESGF) website (
https://esg-dn1.nsc.liu.se/projects/esgf-liu/) at 0.44° (~50 km) of resolution (
Table 2). The data spans the historical period (1950–2005) and the future period (2006–2100) under RCP4.5 and RCP8.5 scenarios [
31,
32,
33]. These simulations are performed over a domain covering the whole Africa. However, our domain of interest in this study is west Africa (see
Figure 1). CORDEX simulations are useful to provide climatic information using several meteorological parameters (i.e., temperature, rainfall, wind speed, etc.) and many extreme events (i.e., heat waves, dry spells, etc.) over a specific region (i.e., Africa) at many time scales [
33,
34,
35]. We also used the gridded gauge-based global daily precipitation and maximum temperature of Climate Prediction Center (CPC) observation at 0.5° (~50 km) resolution from 1979 to present [
36,
37]. This dataset enabled us to evaluate the performance of the CORDEX simulations
Table 1.
The list of details CORDEX simulations composed by the regional Climate and global climate models are consigned in the
Table 2. In the paper, we used a special denotation (
in bold) of the CORDEX simulations composed by the RCM and the GCM in the column 3 of the
Table 2.
2.3. Methods
2.3.1. HWDI, CWD and CDD indices calculation
In this study, we calculated three climate indicators defined by the Expert Team of Climate Change Detection and Indices ETCCDI, which are: the Consecutive Dry Days (CDD), the Consecutive Wet Days (CWD) and the Heat Wave Duration Index (HWDI). These indices describe dry and wet spells and heatwaves duration and number [
38,
39].
Table 3.
ETCCDI indices used in the study [
39,
40].
Table 3.
ETCCDI indices used in the study [
39,
40].
| Type of index |
Symbol |
Expression |
Unit |
Precipitation |
CDD1
|
CDD (Ri 1 < mm) |
day |
| CWD2
|
CWD (Ri 1 > mm) |
day |
| Temperature |
HWDI3
|
HWDI: TXi > TX90, in an interval of at least three (03) consecutive days |
day |
CDD (Consecutive Dry Days) is the greatest length of consecutive days when precipitation amount is less than 1 mm/day. This is an indicator of dry spells (day) and drought. A further variable is the number of consecutive dry days periods in given time period with more than 5 days;
CWD (Consecutive Wet Days) is the greatest length of consecutive days when precipitation amount is greater than 1 mm/day. A further variable is the number of consecutive wet periods in given time period with more than 5 days;
HWDI (
Heatwave Duration Index) is the maximum period of at least three (or six) consecutive days where daily maximum temperature is above the mean of daily maximum temperature during the period 1976-2005 + 5°C [
42]. A further output variable is the number of heatwaves longer than or equal to three (or six) days. The mean of the daily maximum temperature during the period 1976-2005 is calculated during a five-day window centered on each calendar day, taken as the climate reference period.
CDD, CWD and HWDI indices are calculated on the grid of each simulation, then interpolated on a common regular grid (0.5X0.5) degree of resolution using the bilinear interpolation to enable the use of the multi-model ensemble (MME) approach. This approach consists to calculate the mean of an ensemble of simulations to reduce uncertainties existing between them [
43,
44,
45,
46,
47,
48], using the equation (1) :
where
Simulationi represents each simulation and
N, the number of simulations.
2.3.2. Evaluation of the simulations’ skill in representing the indices
The simulations’ skill in capturing the variability of the annual cycle of CDD, CWD and HWDI is assessed for a better identification of their respective strengths and weaknesses [
46,
47]. This technic is performed using the Taylor diagram [
48,
49] showing three statistical quantities: the correlation coefficient (CC), the centered root-mean-square error (RMSE) and the amplitude of the variations represented by their standard deviation (SD). The aim is to identify the strengths and weakness of the different simulations through an easy and straightforward visual comparison [
46,
47]. In this study, the CORDEX simulations are compared to the unified gauge precipitation (CPC) to highlight their ability to reproduce the indices CDD, CWD and HWDI over the three sub-regions of west Africa during the historical period 1976-2005.
2.3.3. Climate change signal
Climate change signal is evaluated using projected data under RCP4.5 and RCP8.5 scenarios and historic data 1976-2005 to get insight the climate modification in the future. Changes are estimated in percentage (%) with respect to the historical mean period 1976-2005 used as reference. For this end, two future periods of thirty (30) years are considered, namely, the near-future 2031-2060 and the far-future 2071-2100 to get a more details description of the future climate, taking into account to its evolution [
50,
51,
52,
53]. The climate change signal is evaluated using the equations (2) or (3):
where
projection denotes the mean value of the variable (index) over a future period (2031-2060 or 2071-2100) and
reference is the mean value of the variable (index) over the historical period (1976-2005).
3. Results and discussion
3.1. Historical season cycle of CDD, CWD and HWDI indices over the different sub-regions of west Africa
In this paragraph, the annual cycles of the different indices (CDD, CWD and HWDI) over the three sub-regions (west Sahel, east Sahel and guinea gulf) of west Africa domain are analyzed using the observation (CPC) and the four CORDEX simulations. The annual cycles derived from the CORDEX simulations are then compared to the observation (CPC) to highlight the accuracy of the simulations to outperform the annual cycle.
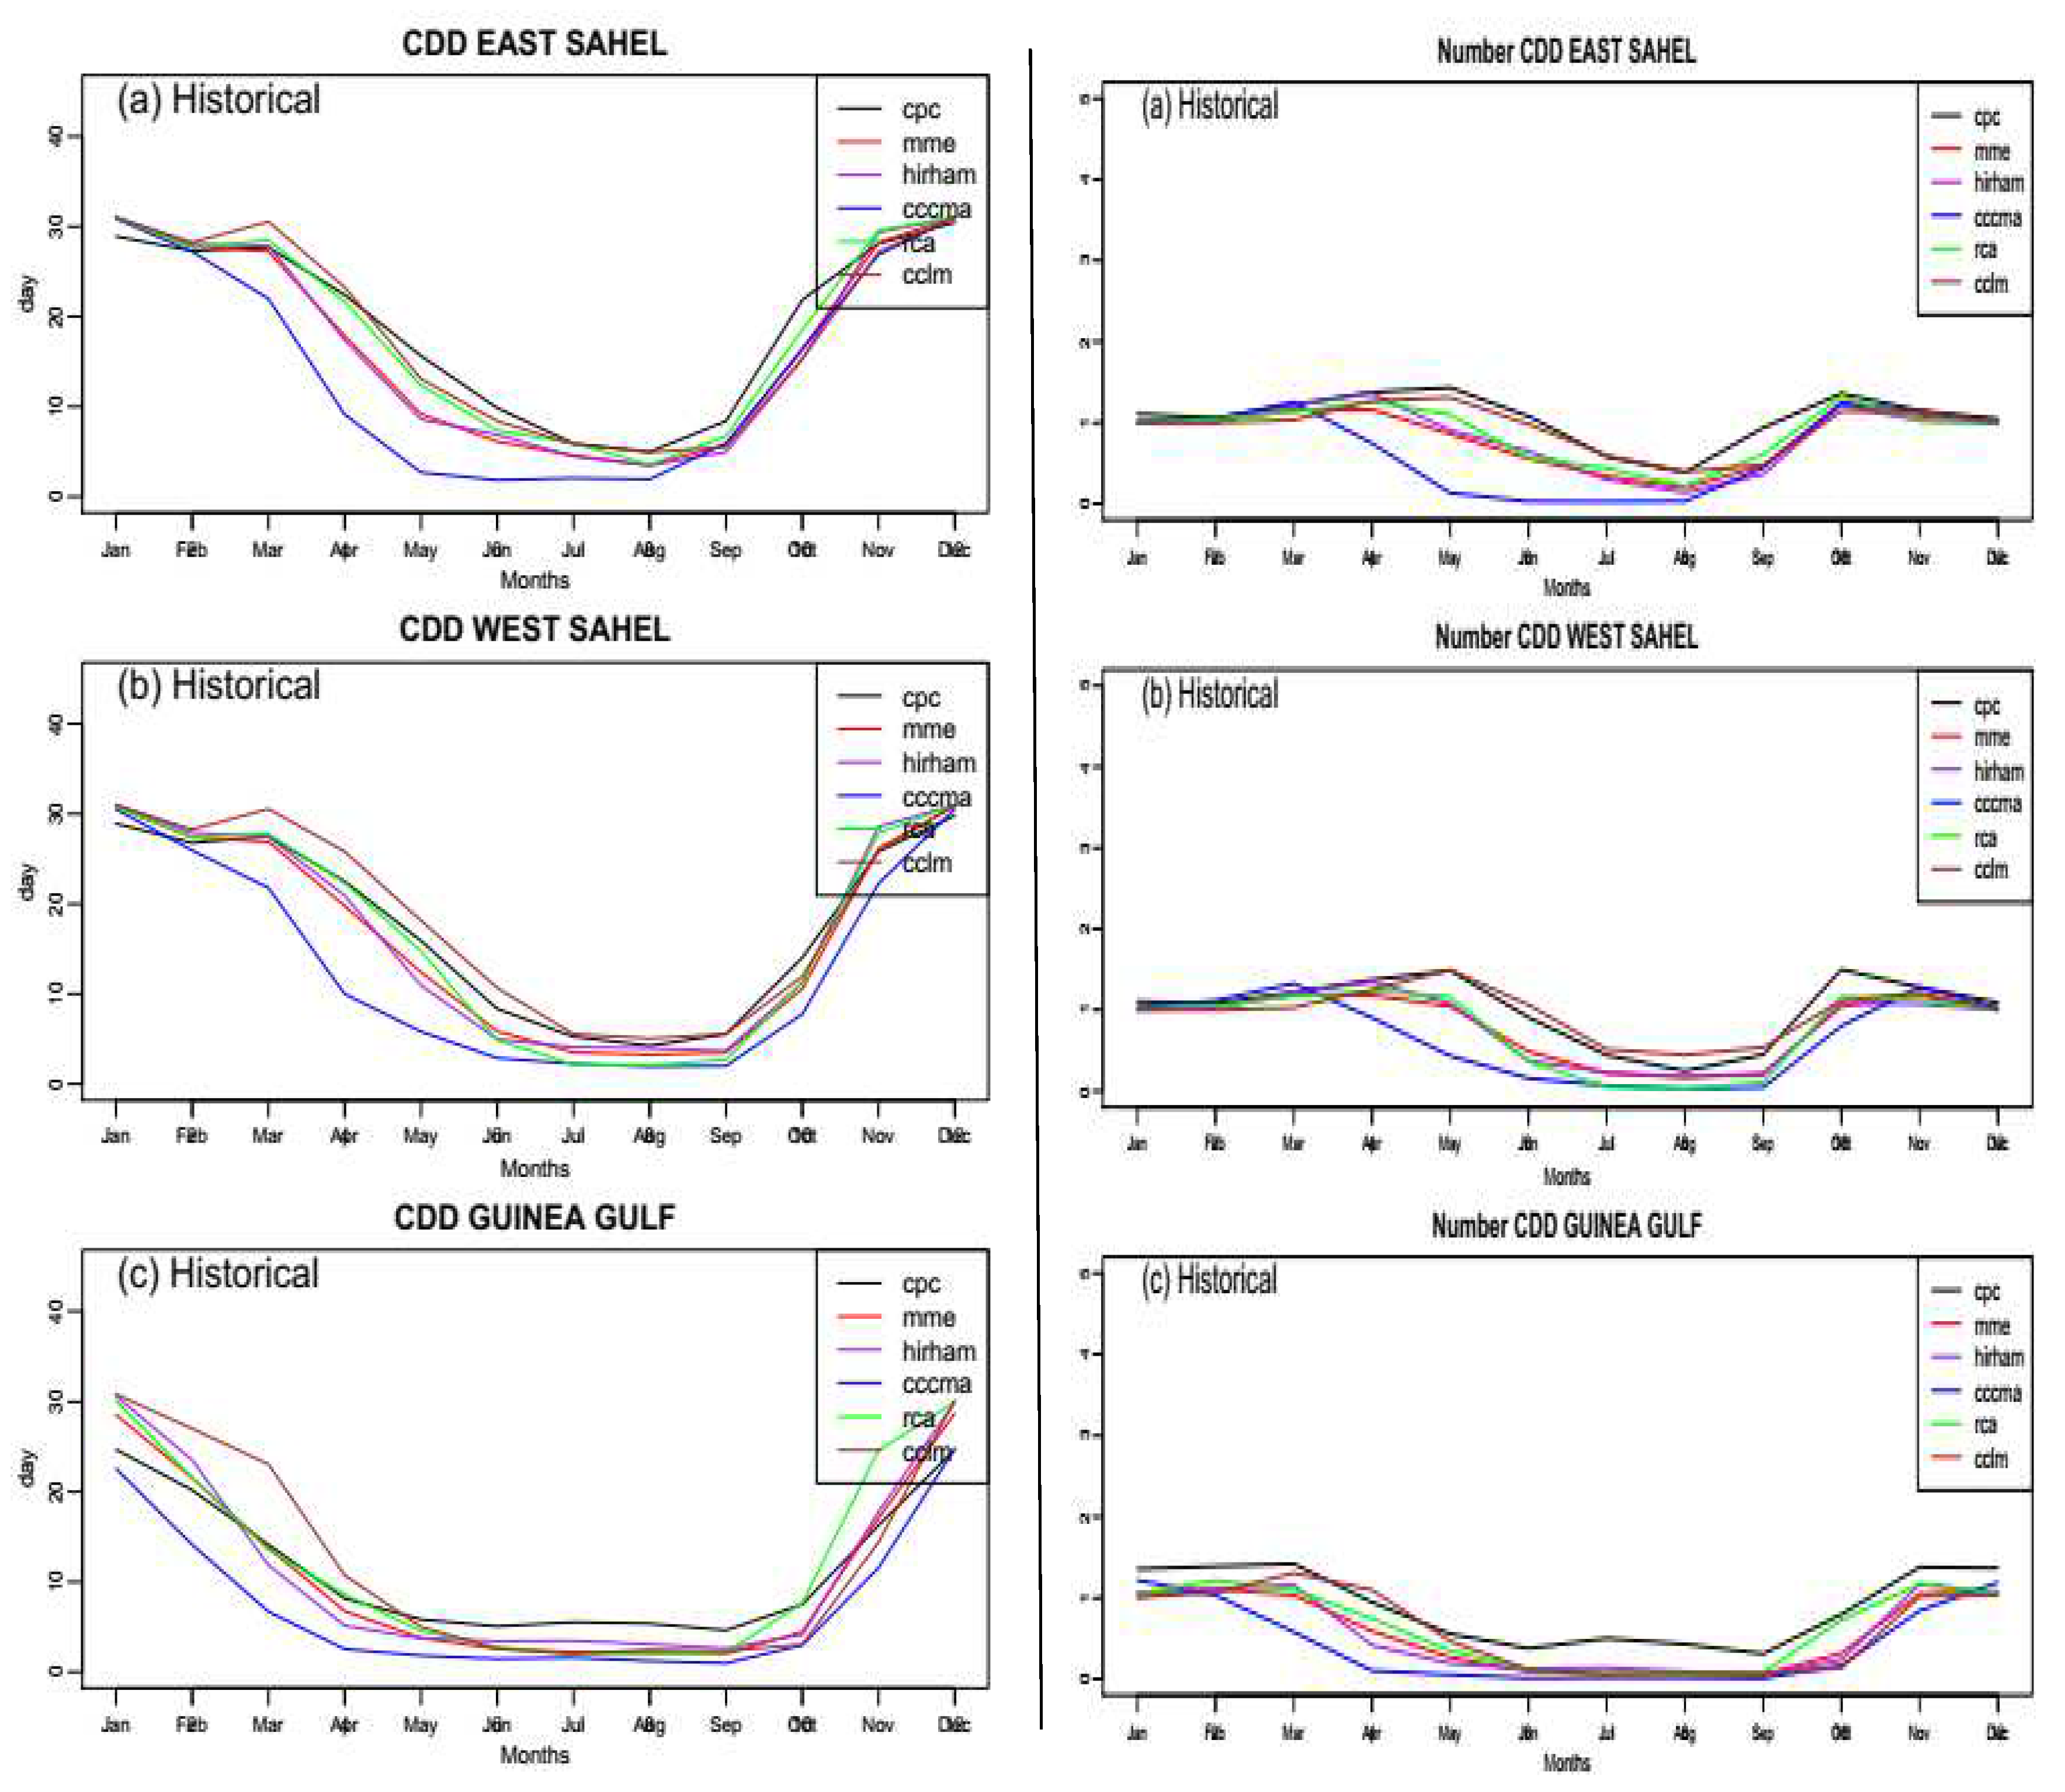
3.1.1. CDD and number of CDD index
Figure 2 presents the annual cycle variability of CDD and number of CDD over the tree sub-regions of west Africa. CDD and number of CDD present the same variability during a year over the different sub-regions as shown by CPC as well as the CORDEX simulations. The period from November to March is characterized by a longer dry spells (about 30 days) and the occurrence of the maximum number of dry spells (about 2 days), whereas, the period of May-September shows a shorter dry spell (about 10 days) with a relatively a smaller number of dry spells occurrence over the whole west Africa region. The period of May-September is considered as the Monsoon season in the Sahel regions (west and east) with a less occurrence of dry spells, whereas, the period April-October is denoted as the monsoon season in the gulf Guinea region as revealed by previous studies [
53,
54]. Over all, the annual cycle of CDD is well captured by the CORDEX simulations over all the three sub-regions of west Africa, which is consistent with the results found by other authors like [
55], over west Africa and [
56], over central Africa who pointed out the accuracy of CORDEX simulations in capturing the annual cycle of CDD.
3.1.2. CWD and number of CWD index
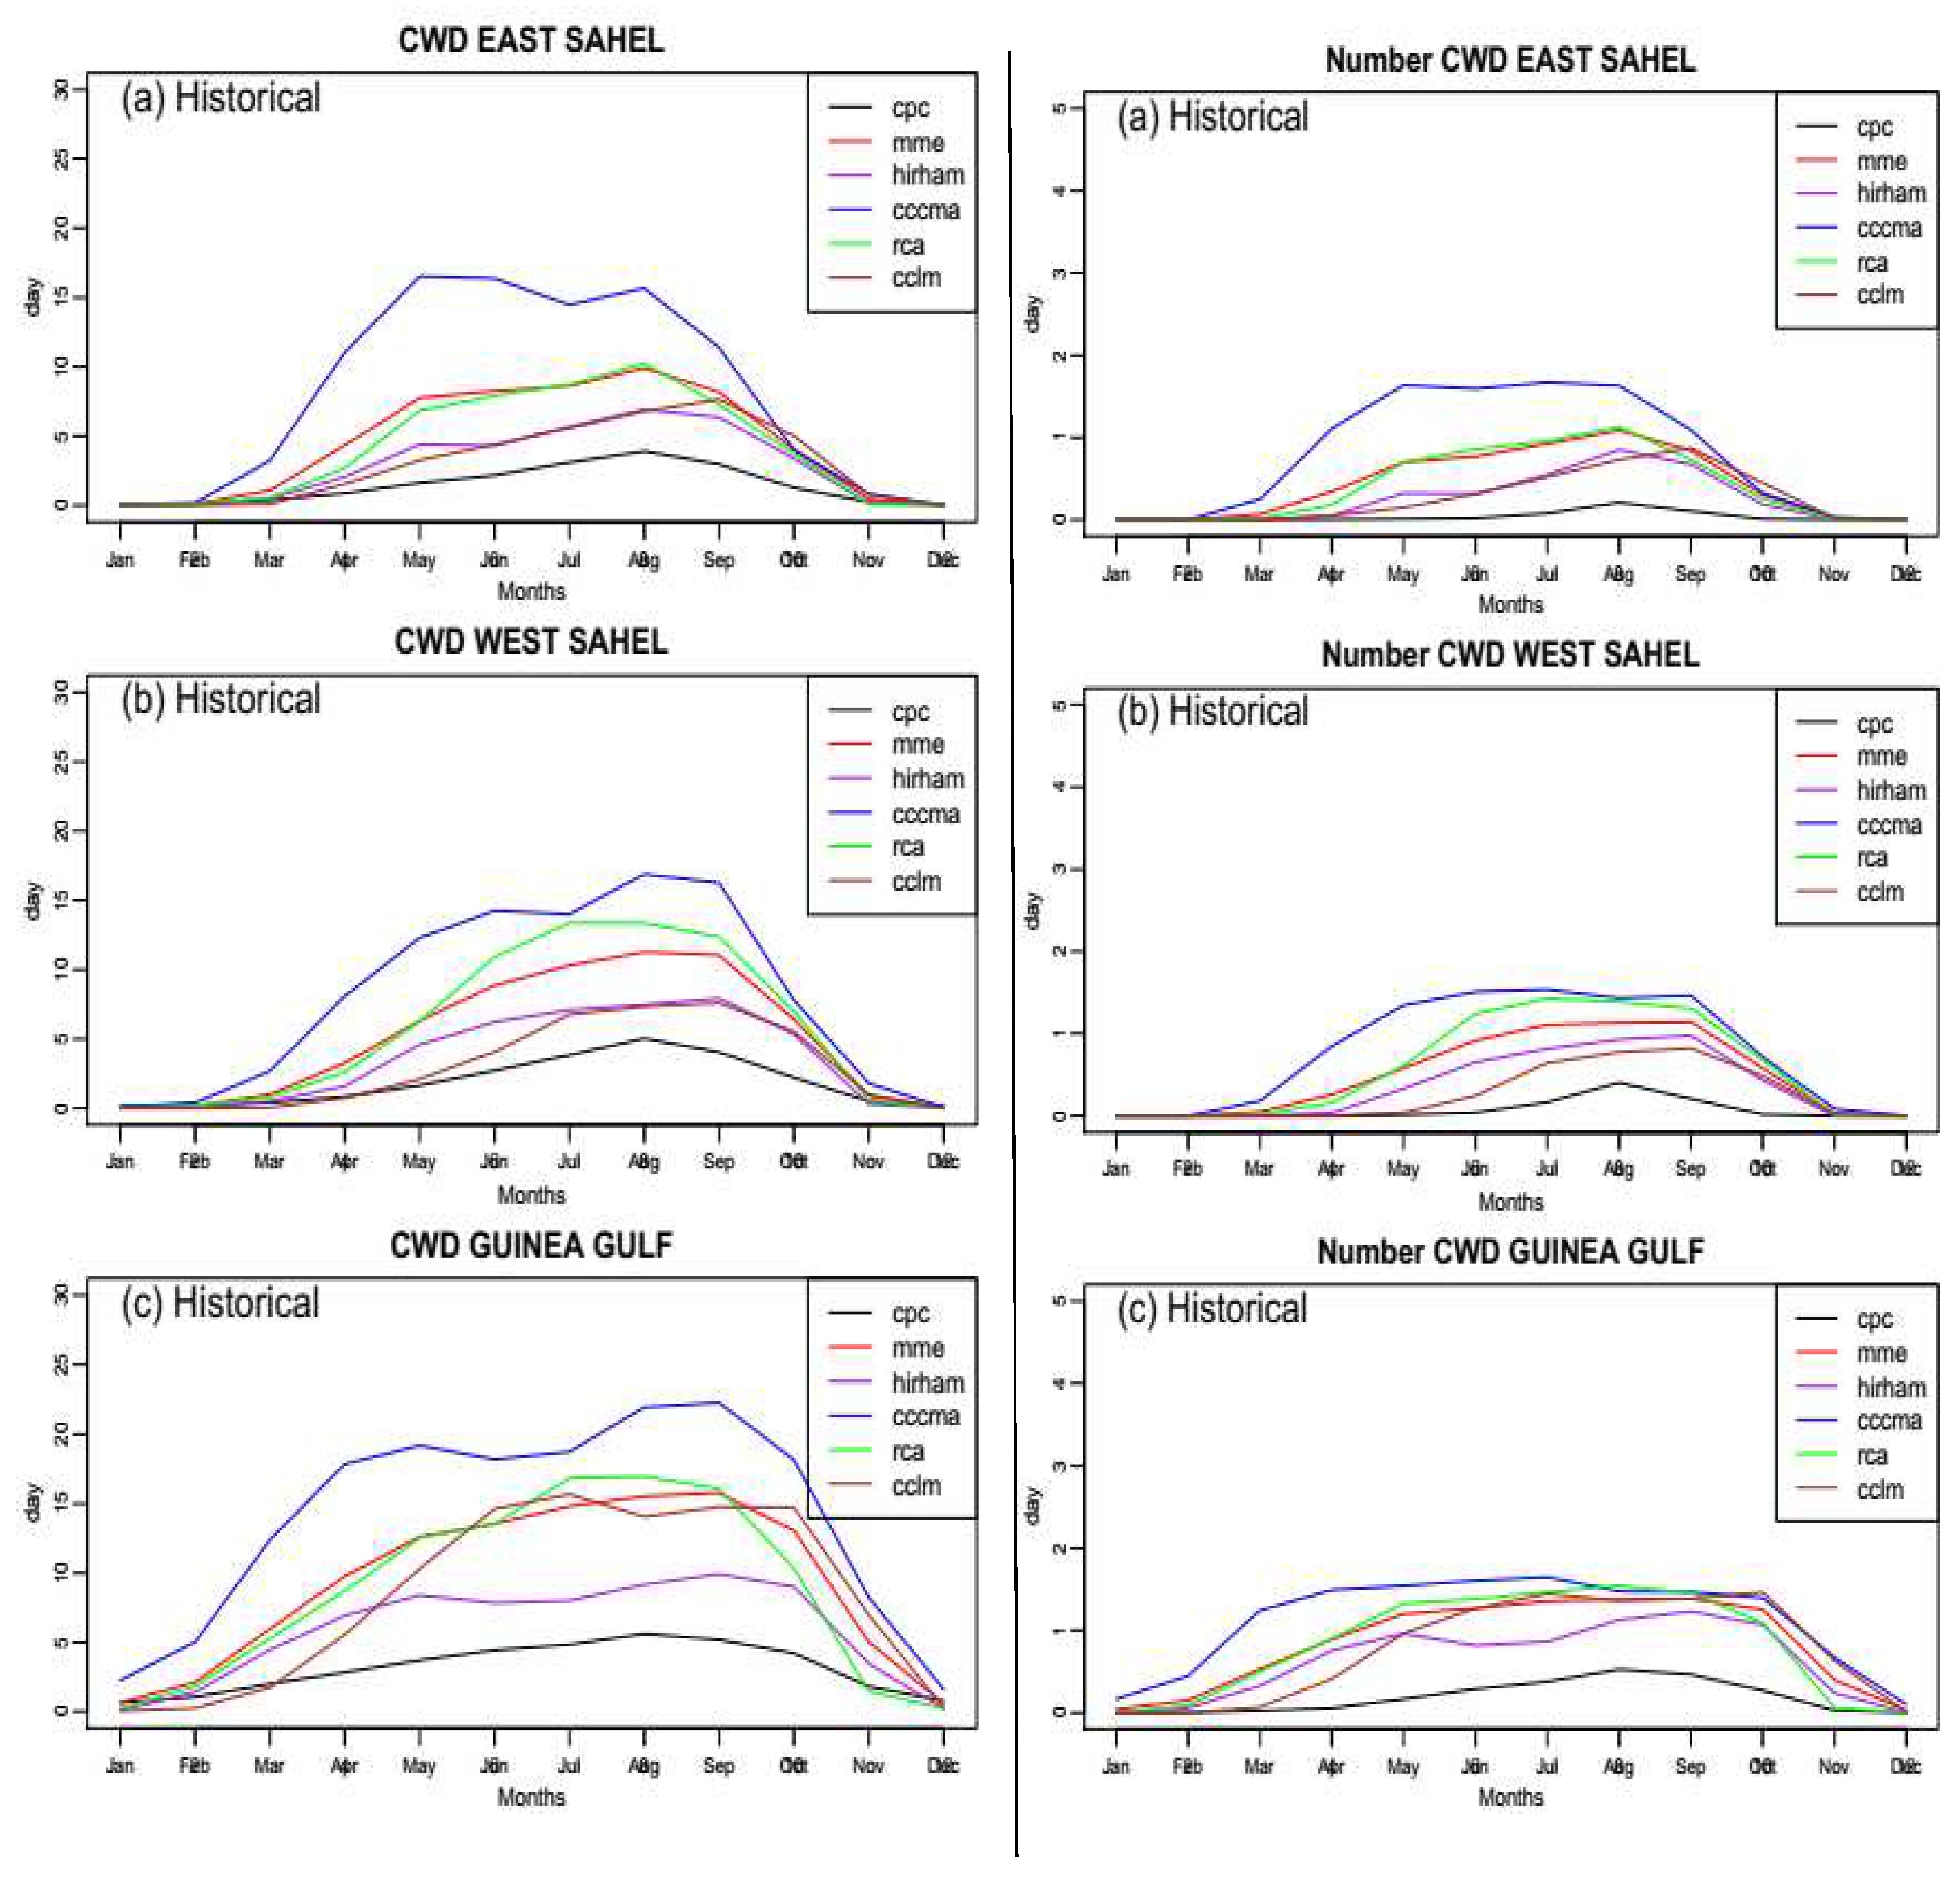
The annual cycle variability of CWD and number of CWD over the tree sub-regions of west Africa is presented in the
Figure 3. CWD and number of CWD present a bimodal variability during the year over the three sub-regions of west Africa with an overestimation by the CORDEX simulations during the period from March to November. Canadian simulation denoted as CCCMA overestimates CWD much more than the other simulations, whereas HIRHAM simulates CWD closer than the other models, compared to the observation CPC.
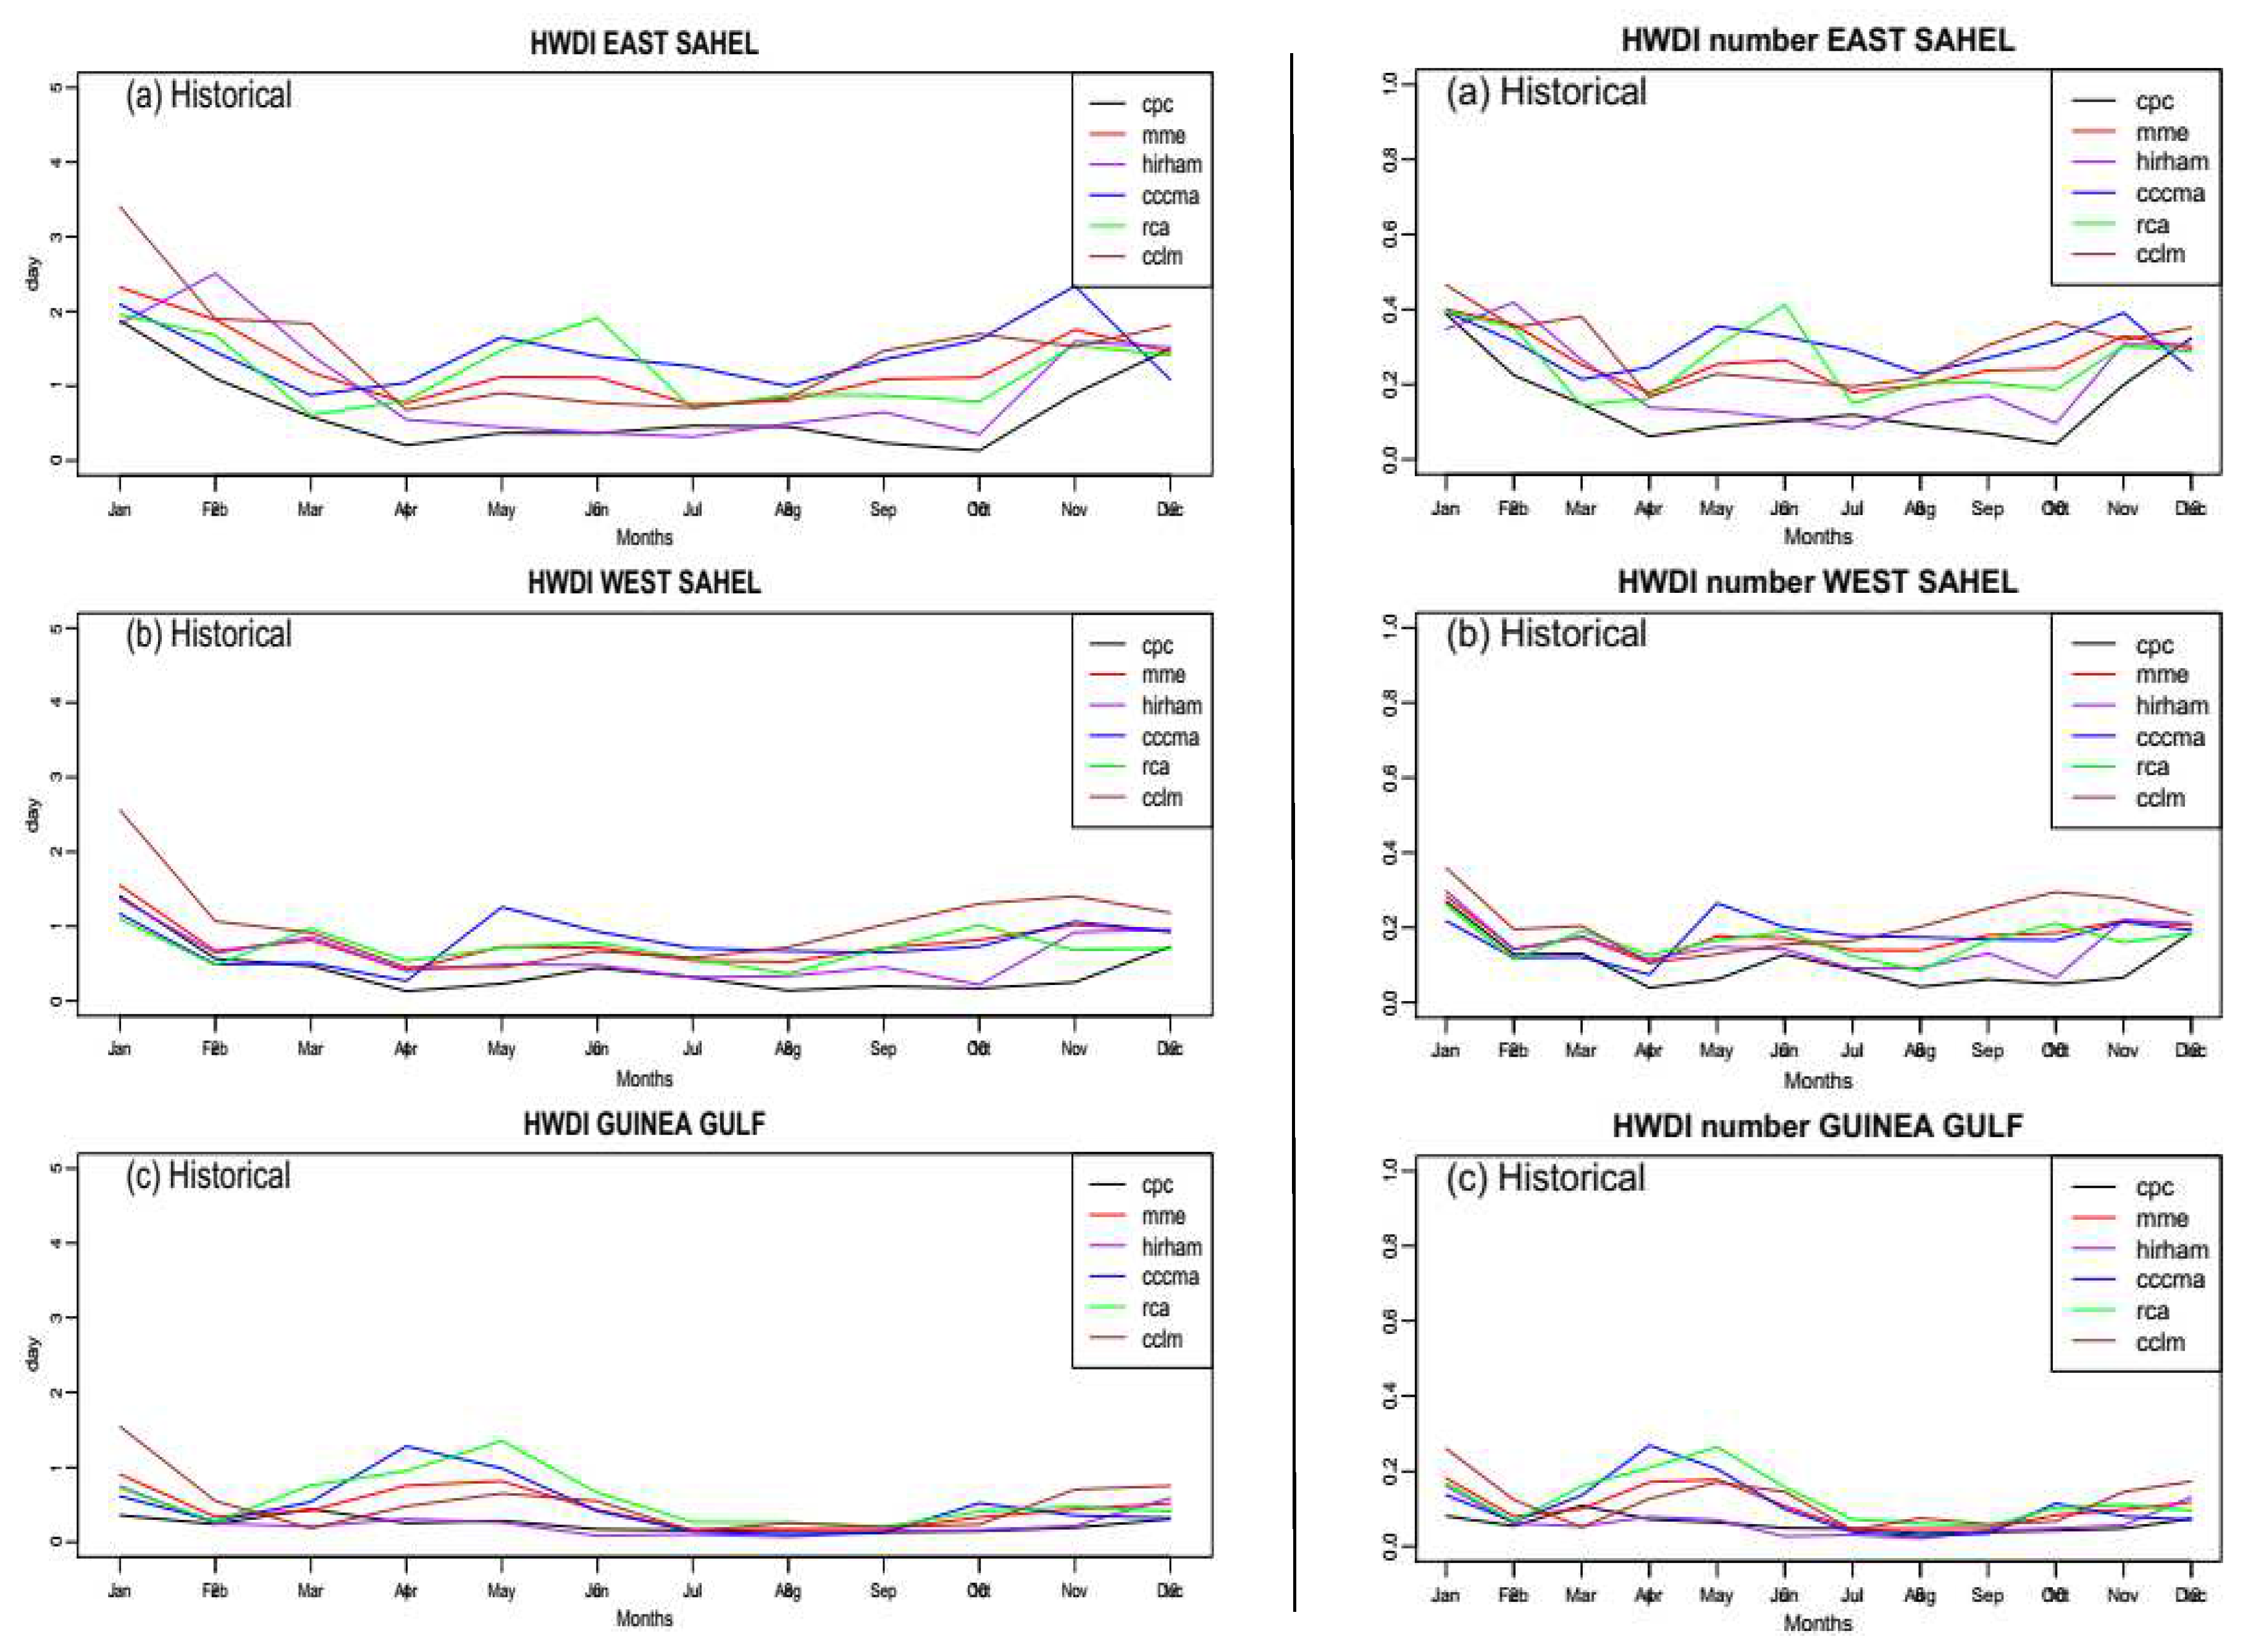
3.1.3. HWDI and number of HWDI index
Figure 4 shows the variability of the annual cycle of HWDI and number of HWDI in each west African sub-region. HWDI and number of HWDI present the same seasonal cycle over each sub-region of west Africa. Over east Sahel, the seasonal variability of HWDI and number of HWDI present three peaks in February, June and November. The western Sahel presents two peaks in the months of March and May. In contrast, the seasonal cycle of HWDI and number of HWDI observed in the Gulf of Guinea sub-region shows a marked peak in April. Overall, the seasonal variability of HWDI is well captured by the CORDEX simulations and their ensemble mean over the three sub-regions of west Africa, although some biases
Figure 4.
3.2. Validation of the CORDEX simulations in replicating CDD, CWD and HWDI over West Africa subregions
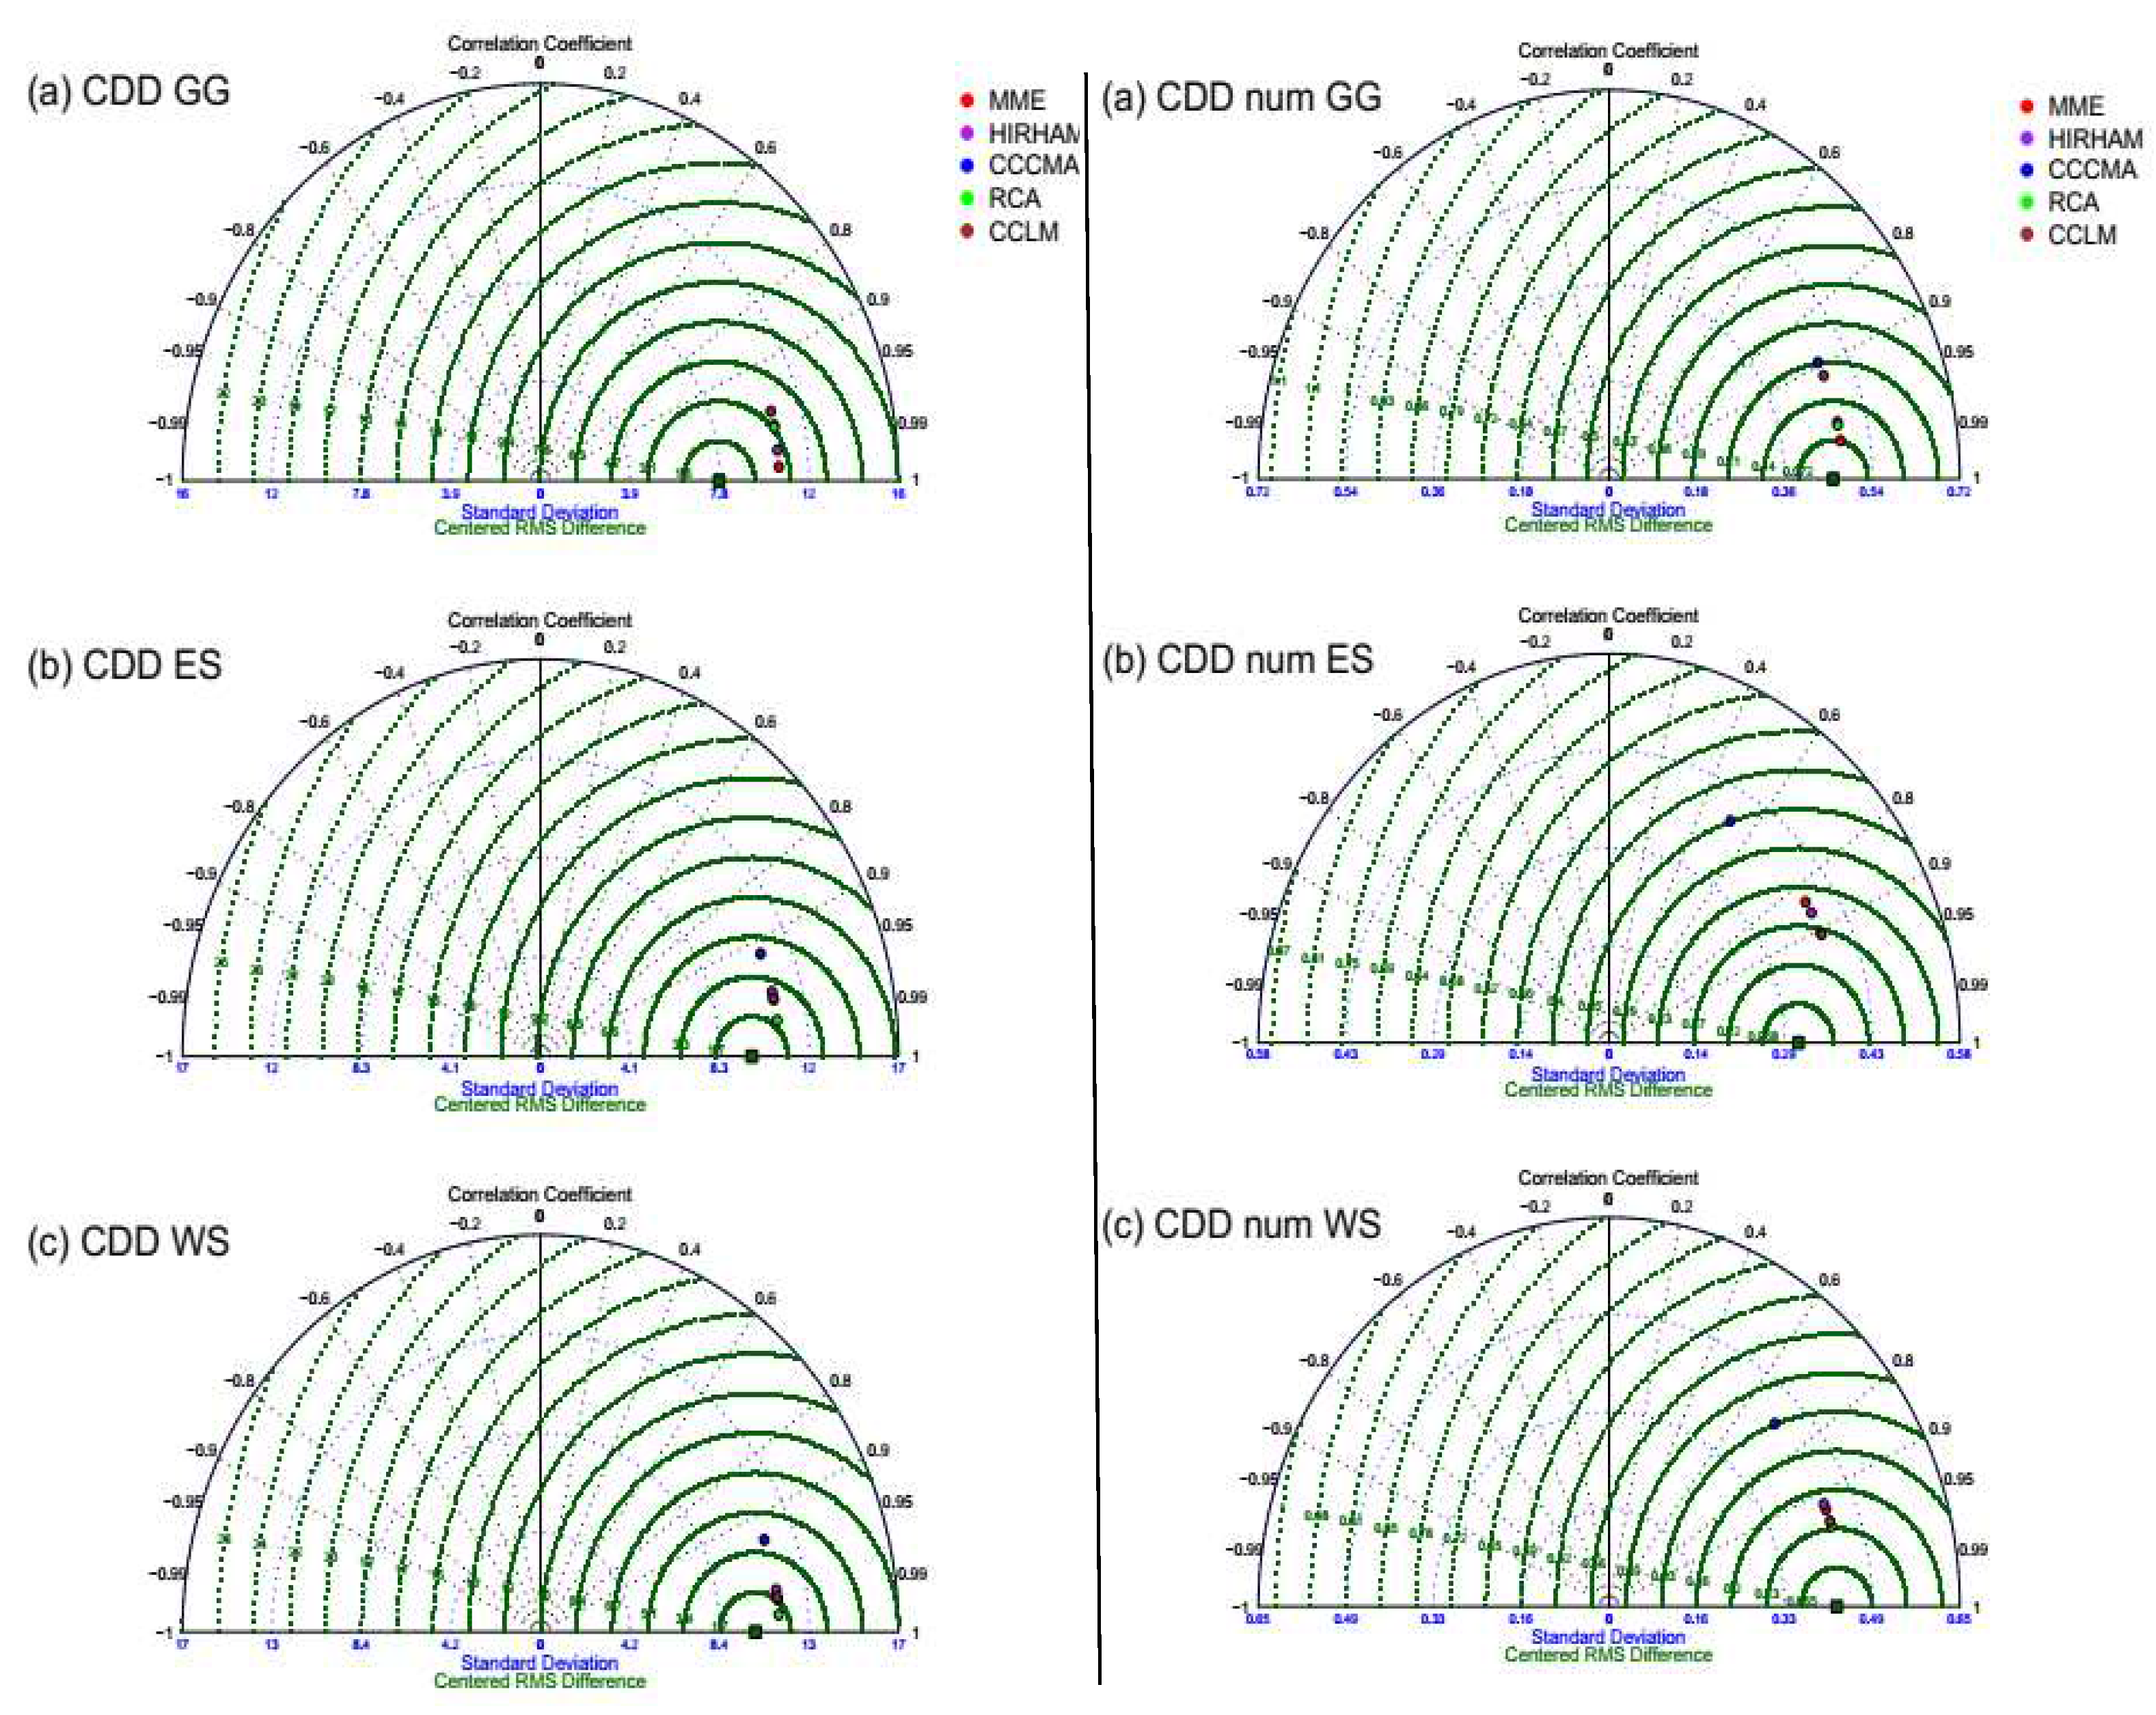
Figure 5,
Figure 6 and
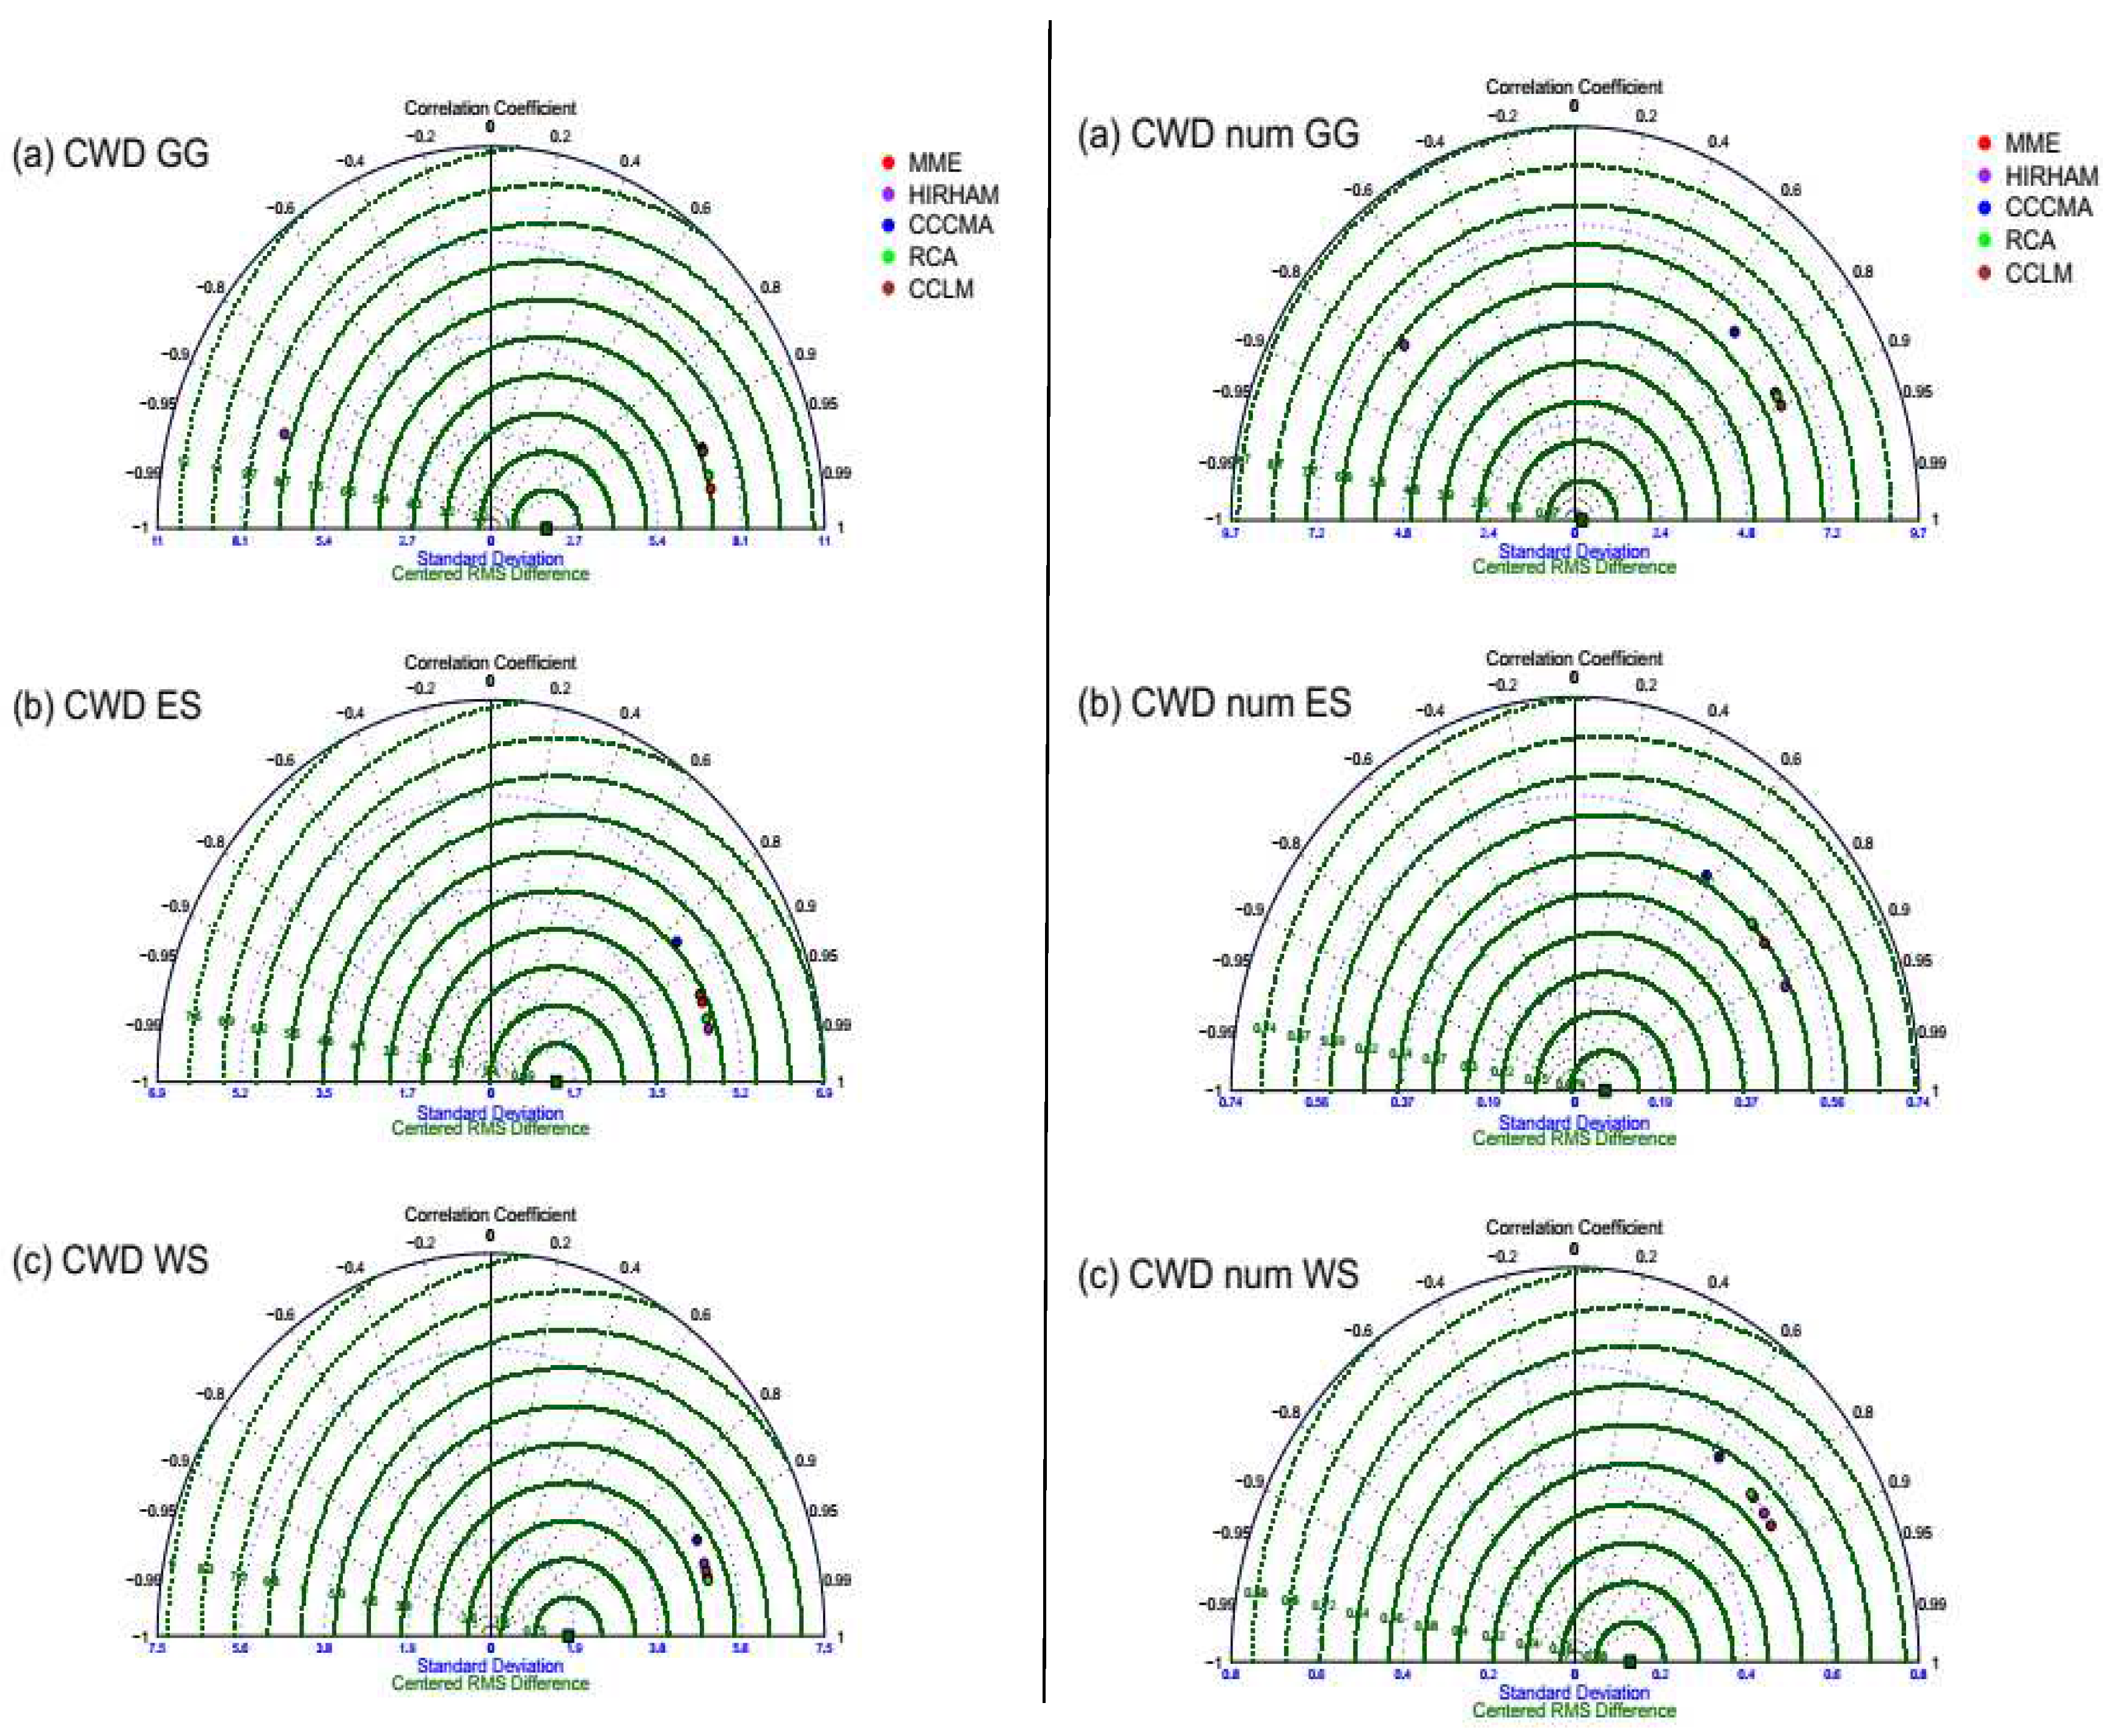
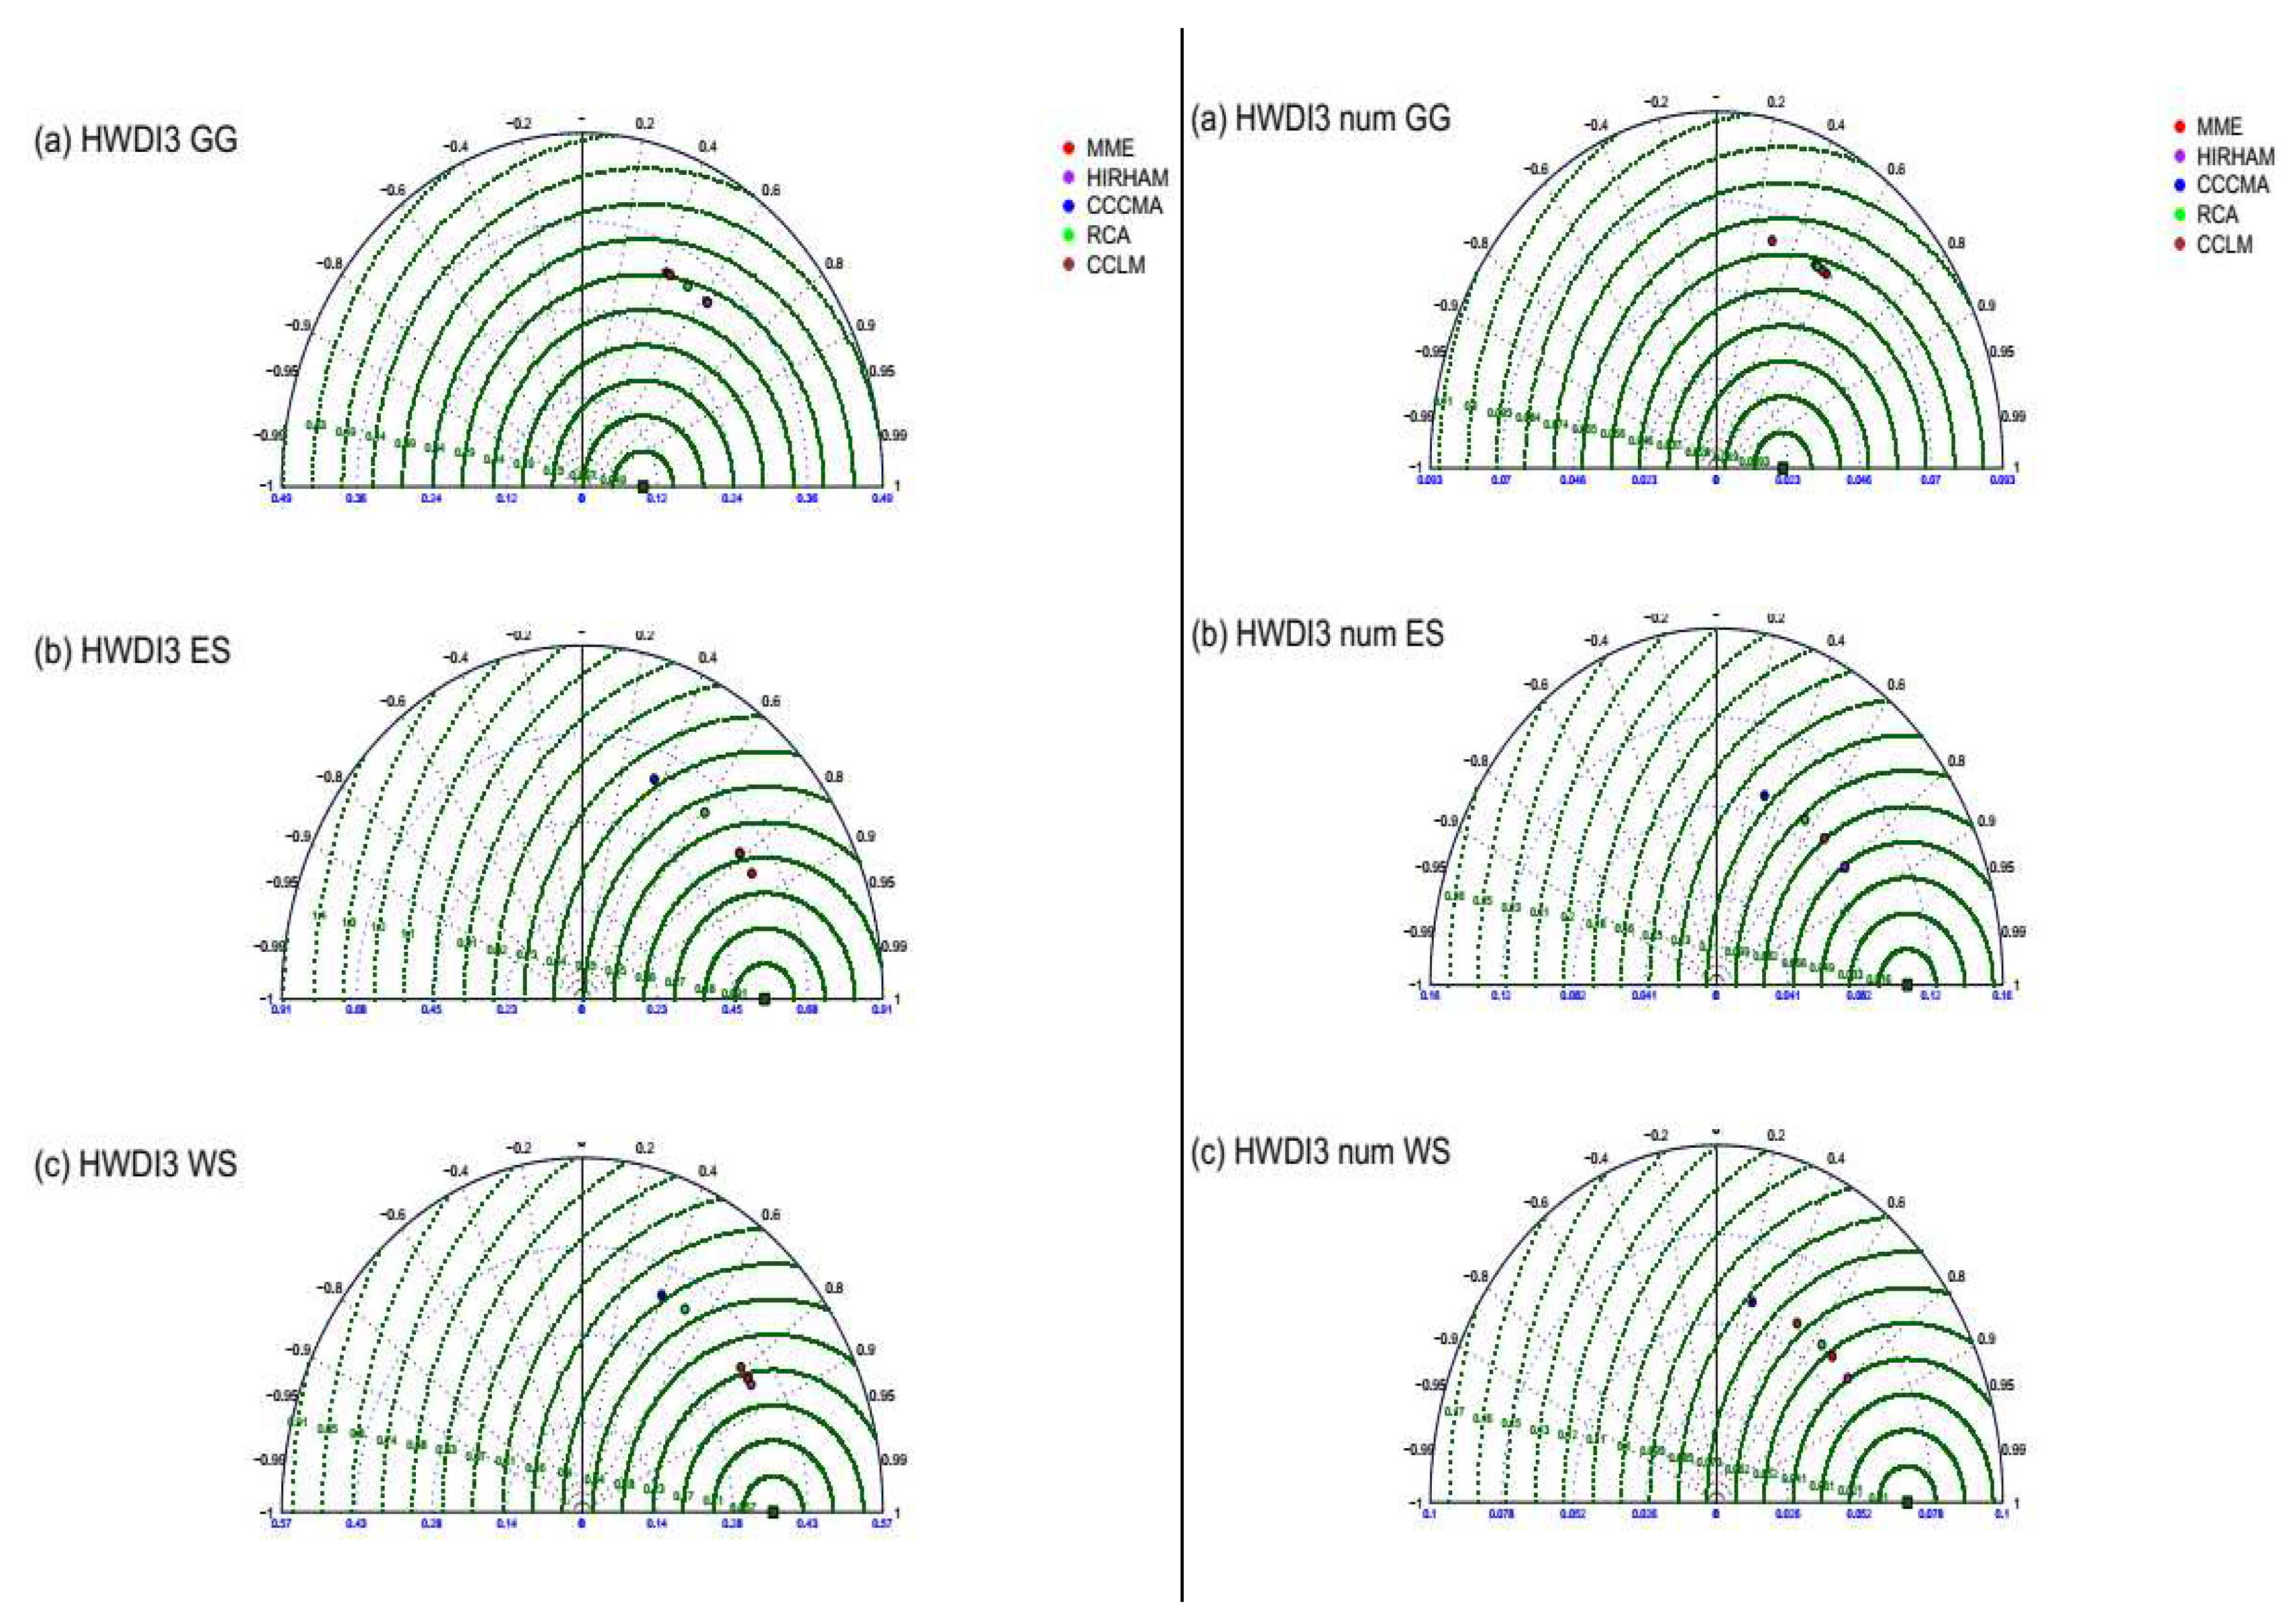
Figure 7 show the performance of the CORDEX simulations in simulating the seasonal cycle of HWDI, CDD and CWD over the three sub-regions of west Africa using the Taylor diagram during the period 1979-2005 in comparison with the observation CPC referred as reference. The different CORDEX simulations are characterized by different colored dots as referred on the legend (
Figure 5,
Figure 6 and
Figure 7). The green circles centered at the reference point represent loci of constant RMS distance and the circles centered at the origin represent loci of constant standard deviation. Correlation is represented as cosine of the angle from the X-axis. Models with as much variance as observation, largest correlation and least RMS error are considered best performers on the Taylor diagram [
58].
3.2.1. CDD
Figure 5 shows the Taylor diagram of CDD and number of CDD over the three regions of west Africa. During the period 1976-2005, all the CORDEX simulations overestimate the annual cycle of CDD and number of CDD over West Africa with almost the same standard deviation but different Root Means Squared difference (RMS). CORDEX simulations have the correct standard deviation capturing the number of CDD over west Sahel and Gulf of Guinea
Figure 5. Indeed, the pattern variations of the number of CDD are of the right amplitude over west Sahel and Gulf of Guinea with MME and RCA being the best performer of number of CDD over these sub-regions. These simulations, respectively have 0.97 and 0.99 correlation coefficients; CCLM simulation is the best performer over east Sahel with 0.9 correlation coefficient. Canadian simulation CCCMA is the poorer performing simulation with 0.9, 0.5 and 0.7 correlation coefficients over Gulf of Guinea, East Sahel and West Sahel, respectively in capturing number of CDD. Nevertheless, MME is the best performer of CDD over Gulf of Guinea sub-region with more than 0.99 correlation coefficient, whereas, RCA is the best performer of CDD over East and West Sahel with more than 0.99 correlation coefficient. These results are in line with Klutse et al., (2015).
3.2.2. CWD
The Taylor diagram of CWD and number of CWD is presented in
Figure 6. For each sub-region of west Africa, CORDEX simulations almost present the same Standard Deviation (SD) and Root Mean Square Difference (RMS) with an important value of correlation coefficients greater or egal to 0.6 in representing CWD and number of CWD, except HIRHAM over Gulf of Guinea sub-region with a negative correlation coefficient
Figure 6. Furthermore, HIRHAM simulation outperforms CWD and number of CWD over East Sahel, whereas, CCLM, MME, and RCA outperform CWD and number of CWD over Gulf of Guinea and West Sahel. Other all, the CORDEX simulations overestimate the CWD and the number of CWD over whole West Africa region. These results collaborate with Nikulin et al. (2012) who underlined that most of the CORDEX simulations overestimate precipitation over Africa although some biases depending on region, season, and evaluation metric.
3.2.3. HWDI
As CDD and CWD indices, CORDEX simulations reproduce HWDI and number of HWDI with the same standard deviation over West Africa. However, the amplitude of variation is well captured by the CORDEX simulations over East and West Sahel, whereas an overestimation of HWDI and number of HWDI is observed over Gulf of Guinea sub-region during 1976-2005 period. In addition, MME agrees best with observation CPC in reproducing HWDI over East Sahel and the number of HWDI over Gulf of Guinea, whereas, HIRHAM simulation outperforms better HWDI and number of HWDI over west Sahel, with a best performing of HWDI over Gulf of Guinea and a best reproduction of the number of HWDI over East Sahel
Figure 7.
3.3. Projected changes in the annual cycles of CDD, CWD and HWDI indices over west Africa
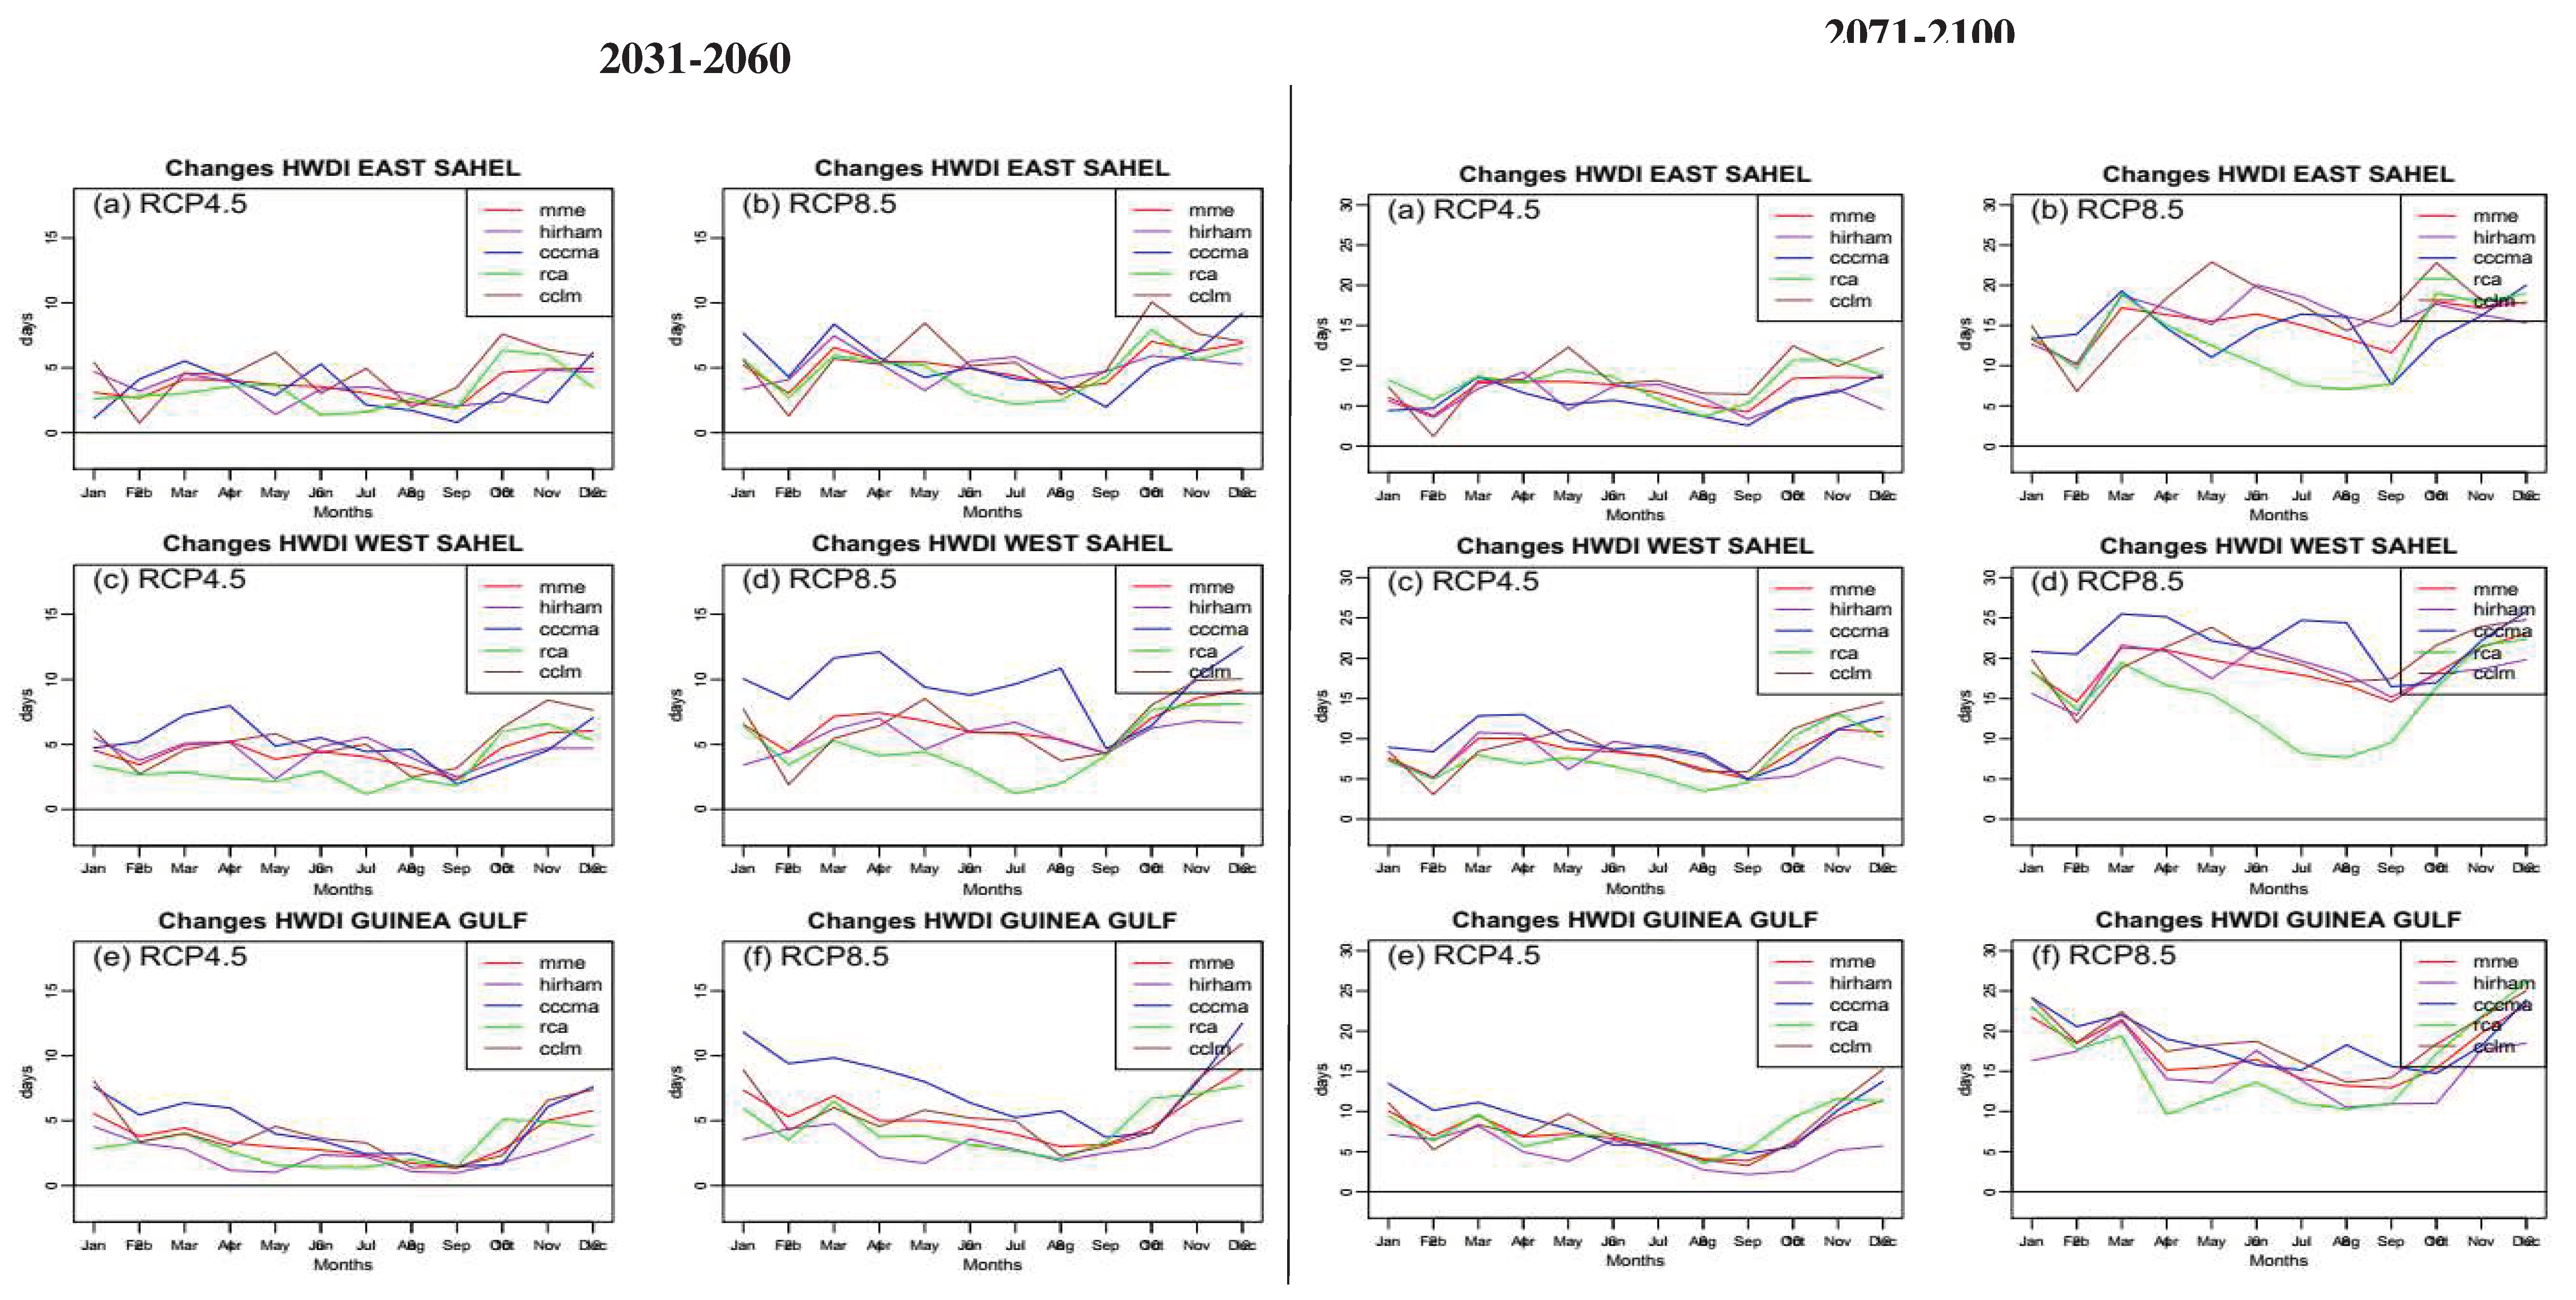
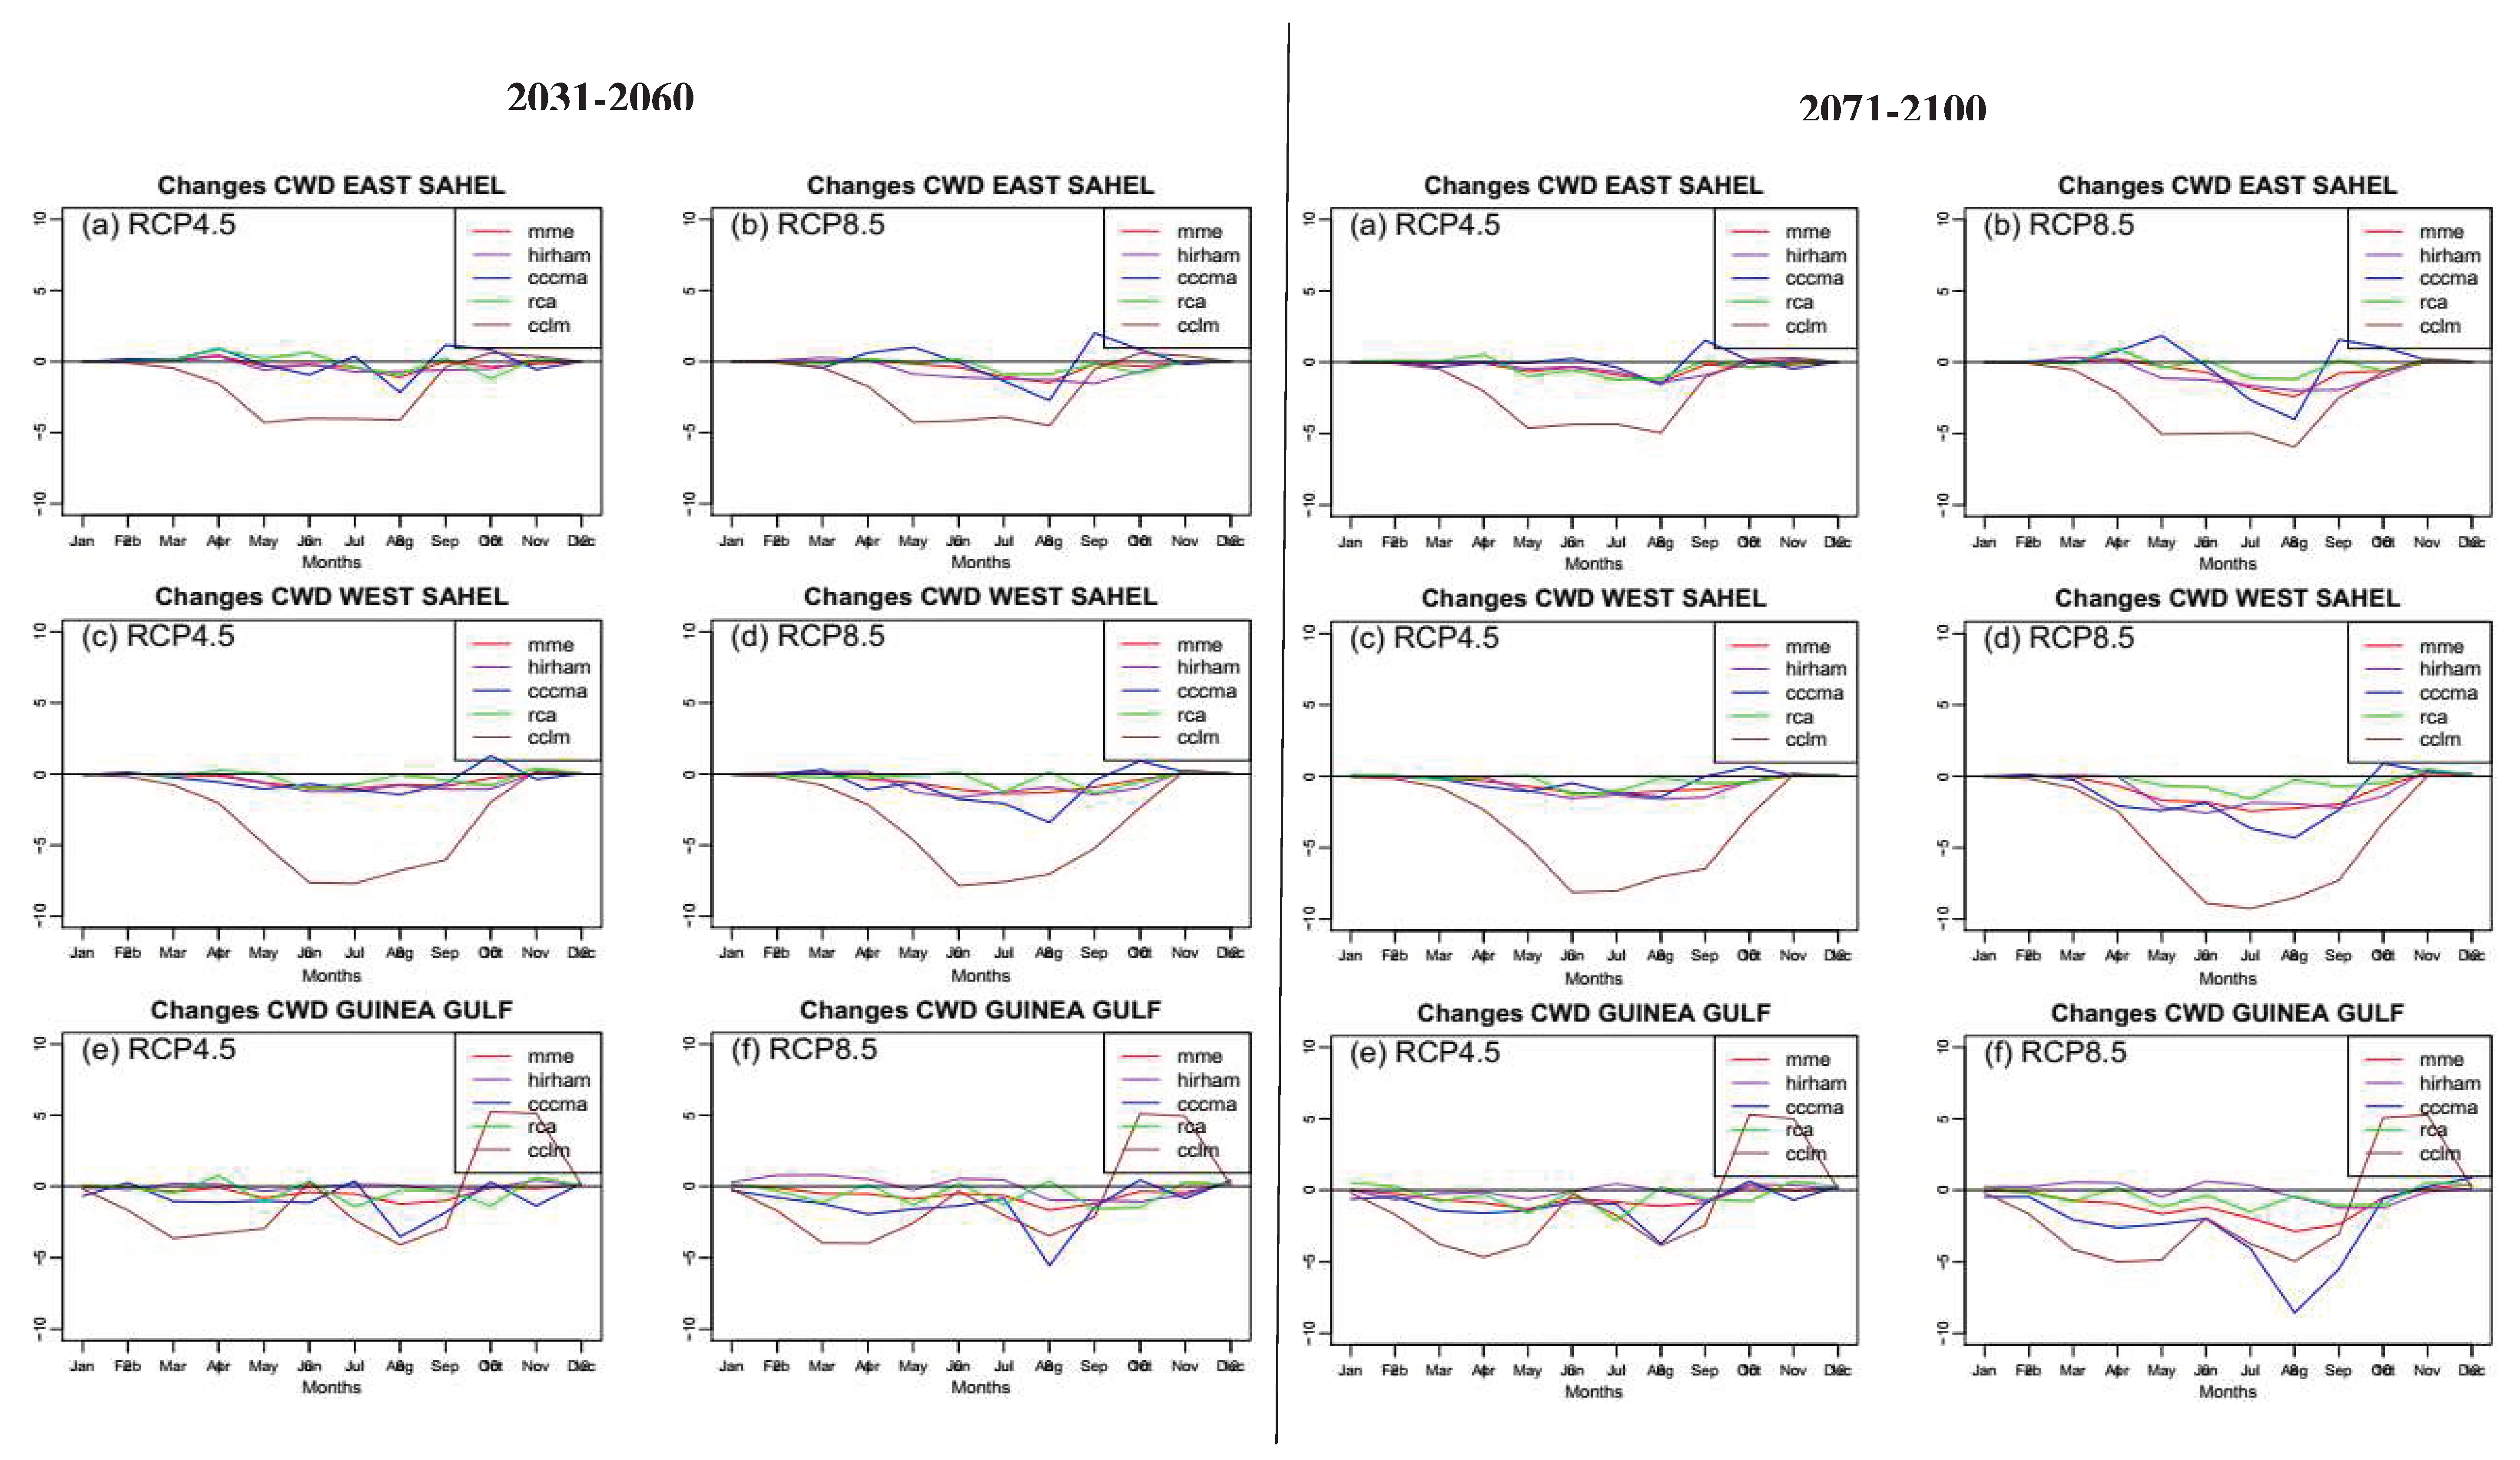
Future changes are evaluated with respect to the historical mean period (1979-2005) for each index over West Africa in order to get statistical characterization of the present climate and its evolution. Changes are evaluated over near (2031-2060) and far (2071-2100) future periods, under RCP4.5 and RCP8.5 scenarios respectively.
3.3.1. Seasonal changes in HWDI
Figure 8 displays changes in HWDI derived from the CORDEX simulations and their multi-model ensemble mean (red) during near (2031-2060) and far (2071-2100) future periods over the sub-regions of West Africa. A substantial increase in HWDI is observed over the three sub-regions of west Africa during both periods. The changes are more marked during far future and under RCP8.5 scenario, compared to near future and under RCP4.5 scenario. The fact that all CORDEX simulations agree to an increased in HWDI suppose that the changes are robust (GIEC, 2007; Sillmann et al., 2013b). This result suggest that the phenomenon of heatwave is unavoidable in West Africa for the future periods.
3.3.2. Seasonal changes in CWD
Seasonal changes in CWD exhibit a decrease in general from March to November over east and west Sahel regions with CCCLM simulation showing the most important decrease. In Sahel regions, almost no changes are observed during the dry season December to February. However, Gulf of Guinea region will experience a substantial decrease in CWD during the year, except CCCLM which projects an increase during September-December corresponding to the retreat of the monsoon in the region
Figure 9. The discrepancy shown by CCCLM simulation during September-December season over Gulf of Guinea and the projected large changes in CWD over the Sahel regions (east and west) is due to its convective scheme used. Indeed, CCCLM employs Tiedtke (1989) convective scheme causing overestimation of spells over the Sahel and flatter terrains of Guinea region [
34].
3.3.3 Seasonal changes in CDD
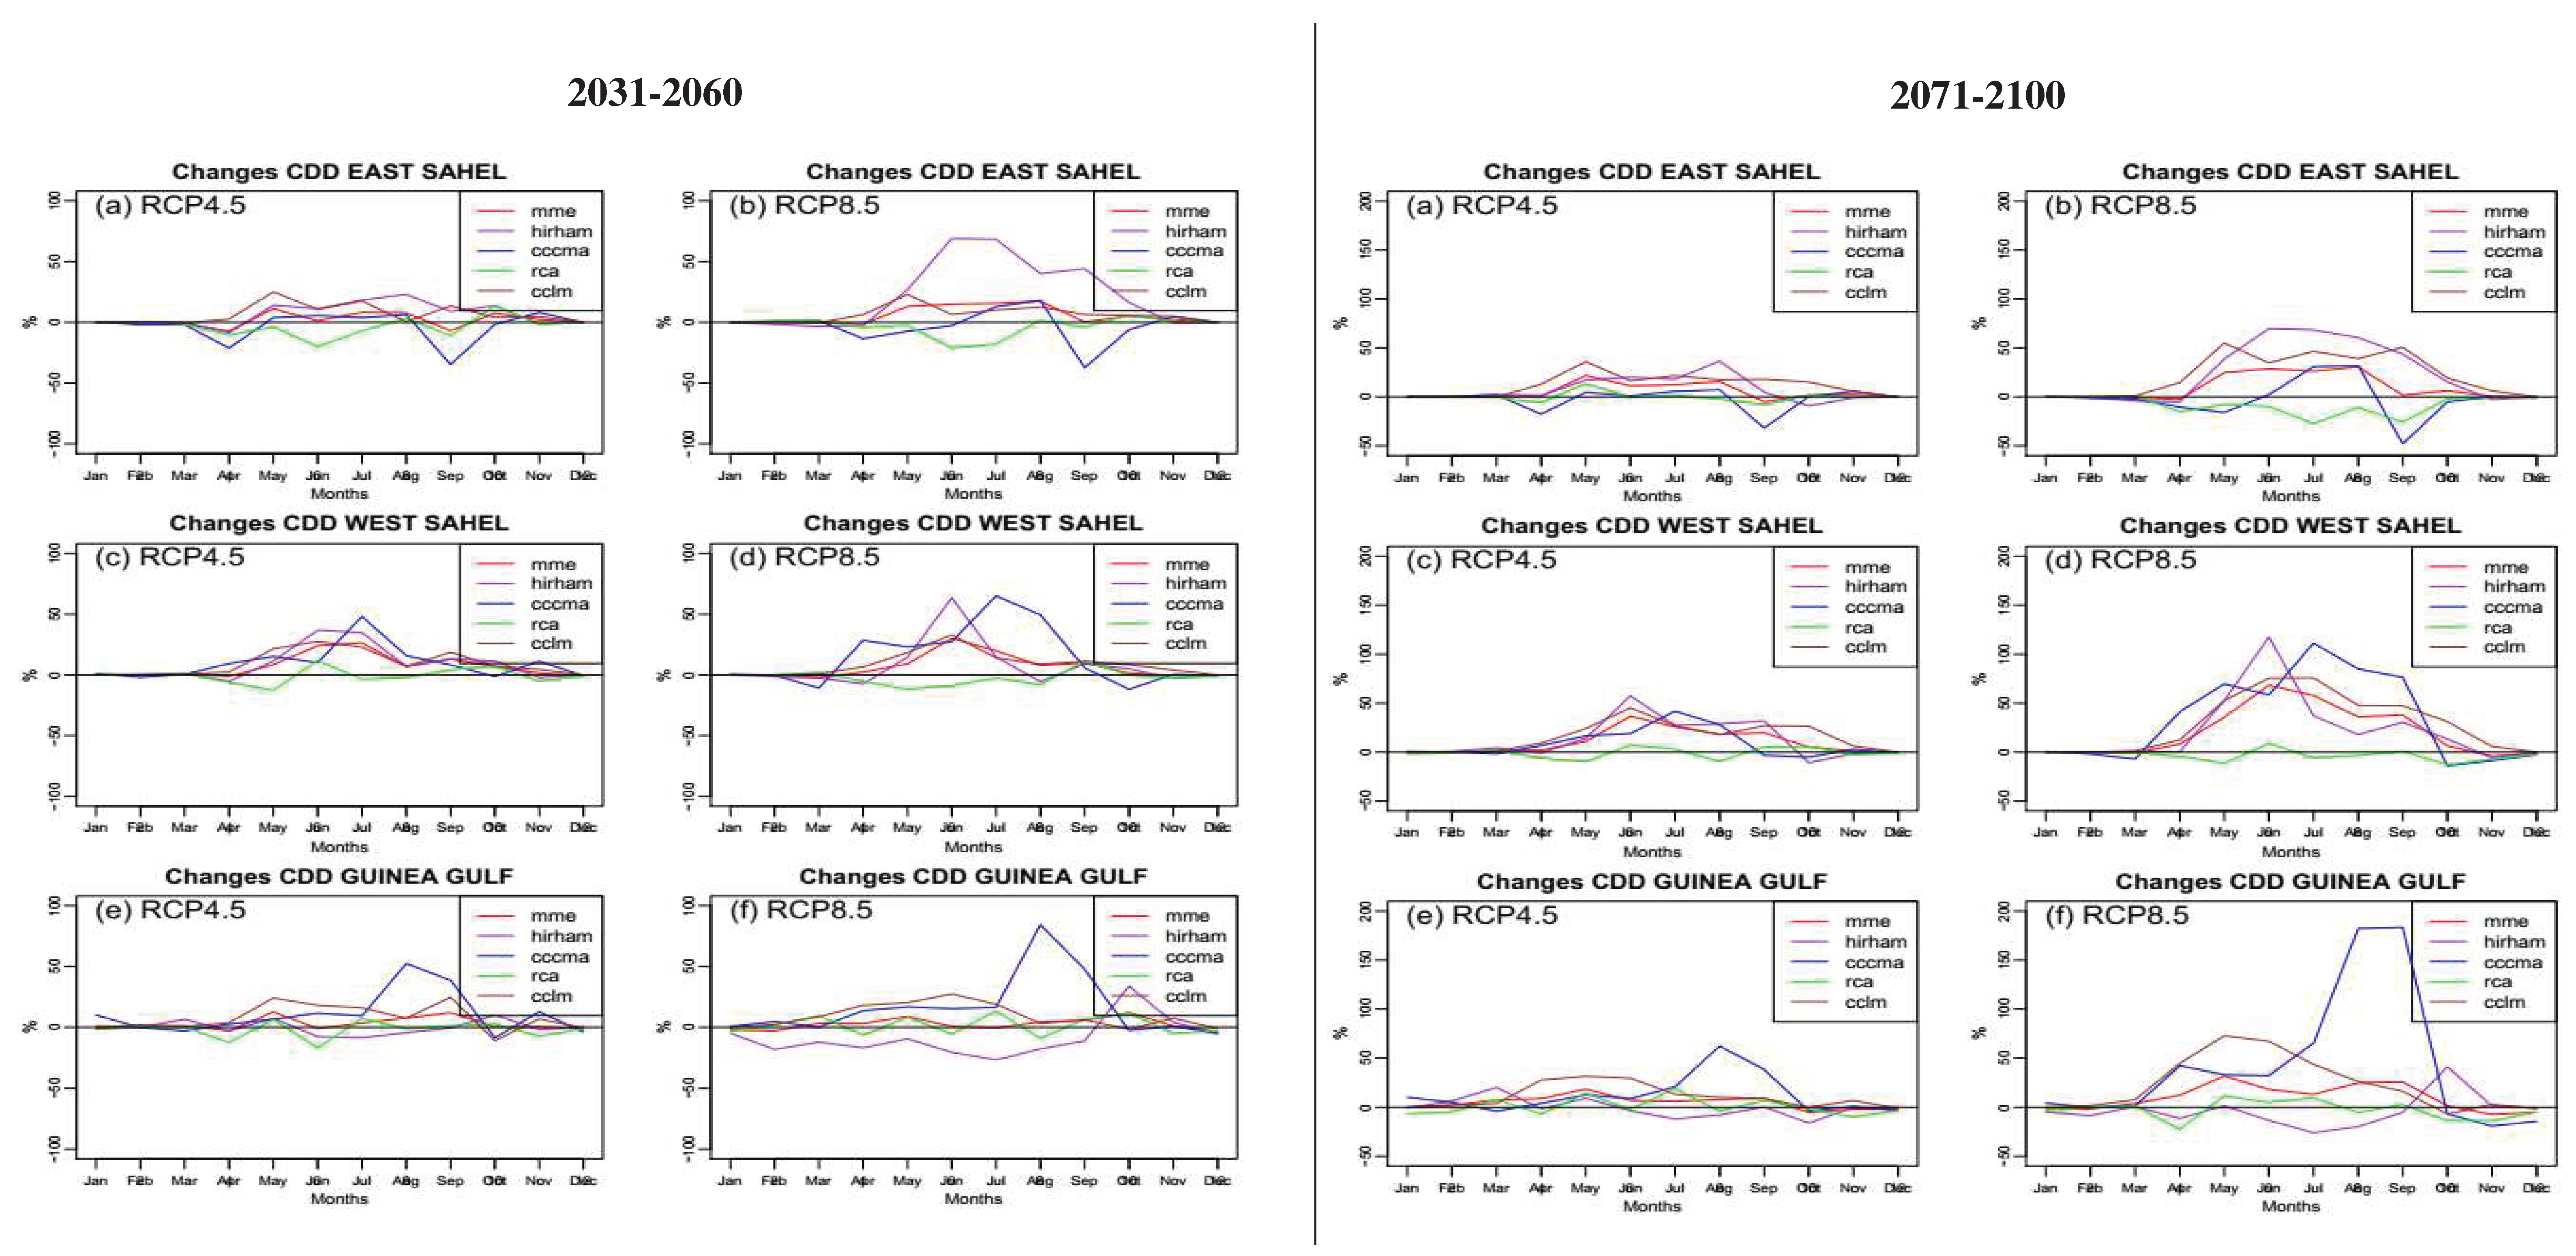
Figure 10 shows the projected changes in the annual cycle of CDD over the three sub-regions of west Africa during near and far future periods under RCP4.5 and RCP8.5 scenarios. There is an increase in CDD during March-November shown by the CORDEX simulations over east and west Sahel in general, except RCA which projects a decrease and CCCMA a decrease in September during near and far future and under both scenarios. Over Gulf of Guinea region, discrepancies between CORDEX simulations are observed in the projected changes in CDD. Indeed, during the year, RCA and CCCLM show decrease and increase in CDD, whereas the other simulations clearly indicate an increase, revealing uncertainties in projected changes in CDD. Overall, multi-model ensemble (MME) mean shows an increase over west Africa with a short decrease of CDD over Gulf of Guinea region during November-December for the far future period under RCP8.5 scenario. It is worth noted that the periods of changes in CWD coincide with the periods of changes in CDD over the Sahel regions (east and west). Our results are in line with the results of [
56] who suggested that the increases in dry spells coupled with decrease in wet spells and wet-day frequency could have strong consequences for seasonal rainfall onset, along with total yearly rainfall amount over Central Africa. This implies that the increase in dry spells coupled with decrease in wet spells could have negative drawbacks on the environment and the society. For instance, this situation could induce strong and severe drought and human discomfort in the future.
4. Summary and conclusions
In this study, the projected changes in seasonal cycles of heatwave, wet and dry spells indices were investigated over west Africa under RCP4.5 and RCP8.5 forcing scenarios. For this end, an ensemble of four CORDEX simulations and their ensemble mean with an observation data (CPC) are used. The changes are deducted and compared with respect to the mean of the reference period 1976-2005 for near (2031-2060) and far (2071-2100) future periods. The performance of the CORDEX simulations and their ensemble mean are evaluated firstly in comparison to the observation CPC in representing the seasonal cycle of the indices describing heatwave and wet and dry spells. The results of our analysis indicate that CORDEX simulations realistically reproduce the seasonal cycle of heatwave, wet and dry spells over the three defined sub-regions of west Africa (east Sahel, west Sahel and Guinea gulf) in the present climate although some relatively biases. The different bias observed in individual CORDEX simulations are due to the use of different convective schemes for the parametrization of the simulations. In addition, CORDEX simulations and their ensemble mean reproduce the different indices with the pattern variations being at the right amplitude. In some cases, individual simulations outperform the variability of the indices better than their ensemble mean. In other hand, projections indicate an increase in heatwave duration and number over whole west Africa region under both forcing scenarios and future periods. There is an increase in dry spells, whereas a decrease in wet spells is observed over the west Africa region. However, the changes in dry and wet spells span the period from March to November over Sahel regions (east Sahel and west Sahel), whereas over Gulf of Guinea, the changes span the whole year, except a slight decrease in dry spells during the retreat phase of monsoon (November-December) in the far future under RCP8.5 scenario. Almost the CORDEX simulations agree on the projected signal of the seasonal cycles of the different indices, except CCCLM which showed a discrepancy in the projected signal of CWD during September-December season over Gulf of Guinea. This suppose that the projected changes are robust. Finally, the period of increasing dry spells coincides of that of the decreasing in wet spells over west Africa, indicating that west African countries will be at risk of severe drought, floodings and heatwaves. Thus, governments and stakeholders must make effort to reduce suitably greenhouse gas emissions in west Africa.
Author Contributions
“Conceptualization, Assi Louis Martial YAPO; Formal analysis, Kouakou KOUADIO and Touré Dro TIEMOKO; Methodology, Pêlèmayo Raoul TOURE; Software, Adjoua Moise Landry FAMIEN; Supervision, Benjamin Komenan KOUASSI and Adama DIAWARA; Validation, Arona DIEDHIOU; Writing – original draft, Fidèle YOROBA and Mouhamadou Bamba SYLLA.. All authors have read and agreed to the published version of the manuscript.”
Acknowledgments
The authors thank the anonymous reviewers and the editor for their constructive comments and suggestions which helped improving the quality of the paper. The authors also think the CORDEX program for the availability of their data and the Geophysical Station of Lamto for its technical support and facilities.
Conflicts of Interest
The authors declare no conflict of interest.
References
- Boko M, Niang I, Nyong A, Vogel C, Githeko A, Medany M, et al. Africa ,Climate change 2007: Impacts, adaptation and vulnerability. Contribution of Working Group II to the Fourth Assessment Report of the Intergovernmental Panel on Climate Change. Clim Chang 2007 Impacts, Adapt vulnerability Contrib Work Gr II to Fourth Assess Rep Intergov Panel Clim Chang [Internet]. 2007;pp 433-467. Available from: https://cgspace.cgiar.org/handle/10568/17019.
- Niang I, Ruppel OC, Abdrabo MA, Essel A, Lennard C, Padgham J, et al. Africa. In: Climate Change 2014: Impacts, Adaptation, and Vulnerability. Part B: Regional Aspects. Contribution of Working Group II to the Fifth Assessment Report of the Intergovernmental Panel on Climate Change [Barros, V.R., C.B. Field, D.J. Dokken, M.D. Cambridge Univ Press Cambridge, United Kingdom New York, NY, USA, [Internet]. 2014;pp 1199-1265. Available from: https://ipcc-wg2.gov/AR5/images/uploads/WGIIAR5-Chap22_FINAL.pdf.
- IPCC. Climate Change 2013: The Physical Science Basis. Contribution of Working Group I to the Fifth Assessment Report of the Intergovernmental Panel on Climate Change. Intergov Panel Clim Chang Work Gr I Contrib to IPCC Fifth Assess Rep (AR5)(Cambridge Univ Press New York). 2013;1535.
- Langue, Cedric, Gacial N, Lavaysse C, Vrac M, Flamant C. Heat wave monitoring over West African cities : uncertainties, characterization and recent trends. Nat Hazards Earth Syst Sci [Internet]. 2023;23:1313–33. Available from: https://doi.org/10.5194/nhess-23-1313-2023. [CrossRef]
- Wang P, Tang J, Sun X, Liu J, Juan F. Spatiotemporal characteristics of heat waves over China in regional climate simulations within the CORDEX-EA project. Clim Dyn. 2019;52:799–818. [CrossRef]
- Tanarhte M, Hadjinicolaou P, Lelieveld J. Heat wave characteristics in the eastern Mediterranean and Middle East using extreme value theory. Clim Res. 2015;63(2):99–113. [CrossRef]
- Barriopedro D, Fischer EM, Luterbacher J, Trigo RM, Garcia-Herrera R. The Hot Summer of 2010: Redrawing the Temperature Record Map of Europe. Science (80- ) [Internet]. 2011;332:pp 220-224. Available from: www.sciencemag.org. [CrossRef]
- Guerreiro SB, Dawson RJ, Kilsby C, Lewis E, Ford A. Future heat-waves, droughts and floods in 571 European cities. Environ Res Lett. 2018;13:10. [CrossRef]
- Russo S, Sillmann J, Fischer EM. Top ten European heatwaves since 1950 and their occurrence in the coming decades. Environ Res Lett [Internet]. 2015;10:15. Available from:. https://doi.org/10.1088/1748-9326/10/12/124003. [CrossRef]
- Bessemoulin P, Bourdette N, Courtier P, Manach J. La canicule d’Août 2003 en France et en Europe. La Métérologie. 2004;46:25–33.
- Poumadère M, Mays C, Le Mer S, Blong R. The 2003 Heat Wave in France: Dangerous Climate Change Here and Now. Risk Anal. 2005;25:pp 1483-1494. [CrossRef]
- Matsueda, M. Predictability of Euro-Russian blocking in summer of 2010. Geophys Res Lett. 2011;38. [CrossRef]
- Russo S, Marchese AF, Sillmann J, Immé G. When will unusual heat waves become normal in a warming Africa? Environ Res Lett. 2016;11:11 pages.
- Rome S, Caniaux G, Ringard J, Dieppois B, Diedhiou A. Identification de tendances récentes et ruptures d’ homogénéité des températures: exemple en Afrique de l’Ouest et sur le Golfe de Guinée. XXVIIIe Colloq l’Association Int Climatol. 2015;pp 591-596.
- Ringard J, Dieppois B, Rome S, Diedhiou A, Pellarin T, Konaré A, et al. The intensification of thermal extremes in west Africa. Glob Planet Change. 2016;139:66–77. [CrossRef]
- Sylla, M., B., Faye, A., Giorgi, F., Diedhiou, A., and Kunstmann H. Projected Heat Stress Under 1.5 °C and 2 °C Global Warming Scenarios Creates Unprecedented Discomfort for Humans in West Africa. Earth’s Futur. 2018;6:16 pages.
- IPCC. Summary for Policymakers. In: Managing the Risks of Extreme Events and Disasters to Advance Climate Change Adaptation. [Field, CB, V Barros, TF Stock D Qin, DJ Dokken, KL Ebi, MD Mastrandrea, KJ Mach, G-K Plattner, SK Allen, M Tignor, PM Midgley (eds)] A Spec Rep Work Groups I II Intergov Panel Clim Chang [Internet]. 2012;Cambridge:1–19. Available from: http://ebooks.cambridge.org/ref/id/CBO9781139177245.
- Perkins-Kirkpatrick SE, Gibson PB. Changes in regional heatwave characteristics as a function of increasing global temperature. Sci Rep [Internet]. 2017;7:12. Available from:. https://doi.org/10.1038/s41598-017-12520-2. [CrossRef]
- Yapo ALM. Impacts du Changement Climatique sur la Fréquence et l’ Intensité des Evènements Extrêmes en Côte d’Ivoire. Thèse Dr Univ Félix Houphouet-Boigny. 2021;208.
- Steadman RG. The Assessment of Sultriness. Part I: A Temperature-Humidity Index Based on Human Physiology and Clothing Science. J Appl Meteo- rol Clim. 1979;18:861–73.
- Steadman RG. The assessment of sultriness. Part II: effects of wind, extra radiation and barometric pressure on apparent tem- perature. J Appl Meteorol. 1979;18:874–85.
- Wehner M, Castillo F, Stone D. The impact of moisture and temperature on human health in heat waves. Oxford Res Encycl Nat Hazard Sci. 2017;Oxford Uni. [CrossRef]
- Engdaw MM, Ballinger AP, Hegerl GC, Steiner AK. Changes in temperature and heat waves over Africa using observational and reanalysis data sets. Int J Climatol. 2021;(June 2020):1–16. [CrossRef]
- Oueslati B, Pohl B, Moron V, Rome S, Janicot S. Characterization of Heat Waves in the Sahel and Associated Physical Mechanisms. J Clim. 2017;30:3095–3115. [CrossRef]
- Shafiei Shiva J, Chandler DG, Kunkel KE. Localized Changes in Heat Wave Properties Across the United States. Earth’s Futur. 2019;7:300–319. [CrossRef]
- Camara M, Diedhiou A, BA S, MD D, S D, I M, et al. Analyse de la pluie simulée par les modèles climatiques régionaux de CORDEX en Afrique de l’Ouest. Sécheresse. 2013;24:pp 14-28.
- Sylla MB, Diallo I, Pal JS. West African Monsoon in State-of-the-Science Regional Climate Models. Clim Var - Reg Themat Patterns [Internet]. 2013;(May 2014). Available from: http://www.intechopen.com/books/climate-variability-regional-and-thematic-patterns/west-african-monsoon-in-state-of-the-science-regional-climate-models.
- Giorgi F, Jones C, Asrar GR. Addressing climate information needs at the regional level : the CORDEX framework. WMO Bull. 2009;58:pp 175-183.
- Giorgi F, Gutowski WJ. Regional Dynamical Downscaling and the CORDEX Initiative. Annu Rev Environ Resour. 2015;40:24 pages. [CrossRef]
- Giorgi F, Gutowski WJ. Coordinated Experiments for Projections of Regional Climate Change. Curr Clim Chang Reports [Internet]. 2016;2:pp 202-210. Available from:. https://doi.org/10.1007/s40641-016-0046-6. [CrossRef]
- Moss RH, Edmonds JA, Hibbard KA, Manning MR, Rose SK, Van Vuuren DP, et al. The next generation of scenarios for climate change research and assessment. Nature [Internet]. 2010;463:pp 747-756. Available from:. https://doi.org/10.1038/nature08823. [CrossRef]
- Van Vuuren DP. Representative Concentration Pathways: An overview. Clim Change. 2011. [CrossRef]
- Riede JO, Posada R, Fink AH, Kaspar F. What’s on the 5th IPCC Report for West Africa? Adapt to Clim Chang Var Rural West Africa, Chapter 2 [Internet]. 2016;pp 7-24. Available from: http://link.springer.com/10.1007/978-3-319-31499-0. [CrossRef]
- Dosio A, Panitz HJ. Climate change projections for CORDEX-Africa with COSMO-CLM regional climate model and differences with the driving global climate models. Clim Dyn. 2016;46:pp 1599-1625. [CrossRef]
- Klutse, Nana Ama B, Sylla MB, Diallo I, Sarr A, Dosio A, Diedhiou A, et al. Daily characteristics of West African summer monsoon precipitation in CORDEX simulations. Theor Appl Climatol. 2015;123:pp 369-386. [CrossRef]
- Pinto I, Lennard C, Tadross M, Hewitson B, Dosio A, Nikulin G, et al. Evaluation and projections of extreme precipitation over southern Africa from two CORDEX models. Clim Change. 2016;135:14 pages. [CrossRef]
- Chen M, Shi W, Xie P, Silva VBS, Kousky VE, Wayne HR, et al. Assessing objective techniques for gauge-based analyses of global daily precipitation. J Geophys Res. 2008;113:D04110. [CrossRef]
- Diaconescu EP, Gachon P, Scinocca J, Laprise R. Evaluation of daily precipitation statistics and monsoon onset/retreat over western Sahel in multiple data sets. Clim Dyn [Internet]. 2015;45:1325–54. Available from:. https://doi.org/10.1007/s00382-014-2383-2. [CrossRef]
- Klein Tank AMG, Peterson TC, Quadir DA, Dorji S, Zou X, Tang H, et al. Changes in daily temperature and precipitation extremes in central and south Asia. J Geophys Res [Internet]. 2006;111:D16105. Available from: http://doi.wiley.com/10.1029/2005JD006316. [CrossRef]
- Klein Tank AMG, Zwiers FW, Zhang X. Guidelines on Analysis of extremes in a changing climate in support of informed decisions for adaptation. World Meteorol Organ. 2009;56 pages.
- Zhang X, Alexander L, Hegerl GC, Jones P, Tank AK, Peterson TC, et al. Indices for monitoring changes in extremes based on daily temperature and precipitation data. Wiley Interdiscip Rev Clim Chang. 2011;851–70. [CrossRef]
- Perkins SE. A review on the scientific understanding of heatwaves - Their measurement, driving mechanisms, and changes at the global scale. Atmos Res [Internet]. 2015;164–165:pp 242-267. Available from:. https://doi.org/10.1016/j.atmosres.2015.05.014. [CrossRef]
- Sylla MB, Gaye A, Jenkins G, Pal JS, Giorgi F. Consistency of projected drought over the Sahel with changes in the monsoon circulation and extremes in a regional climate model... J Geophys Res. 2010;115:10 pages. [CrossRef]
- Diallo I, Sylla MB, Giorgi F, Gaye AT, Camara M. Multimodel GCM-RCM ensemble-based projections of temperature and precipitation over West Africa for the Early 21st Century. Int J Geophys. 2012;2012:19 pages. [CrossRef]
- Haensler A, Jacob D, Kabat P, Ludwig F. Assessment of projected climate change signals over central Africa based on a multitude of global and regional climate projections. Clim Chang Scenar Congo Basin [Internet]. 2013;11–42. Available from: www.climate-service-center.de/imperia/md/content/csc/ csc-report11_optimized.pdf.
- Nikiema PM, Sylla MB, Ogunjobi K, Kebe I, Gibba P, Giorgi F. Multi-model CMIP5 and CORDEX simulations of historical summer temperature and precipitation variabilities over West Africa. Int J Climatol. 2016;37:2438–50. [CrossRef]
- Kalognomou EA, Lennard C, Shongwe M, Pinto I, Favre A, Kent M, et al. A Diagnostic evaluation of precipitation in CORDEX models over Southern Africa. J Clim. 2013;26:9477–506. [CrossRef]
- Taylor, KE. Summarizing multiple aspects of model performance in a single diagram. J Geophys Res. 2001;106:pp 7183-7192. [CrossRef]
- Taylor KE. Taylor Diagram Primer. Work Pap [Internet]. 2005;(January):1–4. Available from: https://bigladdersoftware.com/projects/elements/.
- Diallo I, Giorgi F, Deme A, Tall M, Mariotti L, Gaye AT. Projected changes of summer monsoon extremes and hydroclimatic regimes over West Africa for the twenty-first century. Clim Dyn. 2016;47:pp 3931-3954. [CrossRef]
- Sylla MB, Nikiema PM, Gibba P, Kebe I, Ama N, Klutse B. Climate Change over West Africa: Recent Trends and Future Projections [Internet]. 2016. pp 25-40. Available from: http://link.springer.com/10.1007/978-3-319-31499-0.
- Abiodun BJ, Adegoke J, Abatan AA, Ibe CA, Egbebiyi TS, Engelbrecht F, et al. Potential impacts of climate change on extreme precipitation over four African coastal cities. Clim Change. 2017;143:pp 399-413. [CrossRef]
- Sarr AB, Camara M. Evolution Des Indices Pluviométriques Extrêmes Par L’analyse De Modèles Climatiques Régionaux Du Programme CORDEX: Les Projections Climatiques Sur Le Sénégal. Eur Sci J [Internet]. 2017;13:pp 206-222. Available from: http://eujournal.org/index.php/esj/article/view/9521/9029.
- Nikulin G, Jones C, Giorgi F, Asrar G, Büchner M, Cerezo-Mota R, et al. Precipitation climatology in an ensemble of CORDEX-Africa regional climate simulations. J Clim. 2012;25:6057–78. [CrossRef]
- Gbobaniyi E, Sarr A, Sylla, Mouhamadou B, Diallo I, Lennard C, Dosio A, et al. Climatology, annual cycle and interannual variability of precipitation and temperature in CORDEX simulations over West Africa. Int J Climatol. 2013;34:pp 2241-2257.
- Sylla MB, Giorgi F, Pal JS, Gibba P, Kebe I, Nikiema M. Projected changes in the annual cycle of high-intensity precipitation events over West Africa for the late twenty-first century. J Clim. 2015;28:6475–88. [CrossRef]
- Fotso-Nguemo TC, Diallo I, Diakhaté M, Vondou DA, Mbaye ML, Haensler A, et al. Projected changes in the seasonal cycle of extreme rainfall events from CORDEX simulations over Central Africa. Clim Change. 2019;19.
- Chaturvedi RK, Joshi J, Jayaraman M, Bala G, Ravindranath NH. Multi-model climate change projections for India under representative concentration pathways. Curr Sci. 2012;103(7):791–802.
- Sillmann J, Kharin V V., Zwiers FW, Zhang X, Bronaugh D. Climate extremes indices in the CMIP5 multimodel ensemble: Part 2. Future climate projections. J Geophys Res Atmos. 2013;118:2473–93. [CrossRef]
- GIEC. Résumé à l’intention des décideurs. Bilan 2007 des Chang Clim Impacts, Adapt vulnérabilité Con- Tribut du Groupe Trav II au quatrième Rapp d’évaluation Rapp du Groupe d’experts Intergouv sur l’évolution du Clim ML Parry, OF Canz. 2007.
- Tiedtke, M. A comprehensive mass flux scheme for cumulus parameterization in largescale models. Mon Weather Rev. 1989;117:1779–1800.
|
Disclaimer/Publisher’s Note: The statements, opinions and data contained in all publications are solely those of the individual author(s) and contributor(s) and not of MDPI and/or the editor(s). MDPI and/or the editor(s) disclaim responsibility for any injury to people or property resulting from any ideas, methods, instructions or products referred to in the content. |
© 2023 by the authors. Licensee MDPI, Basel, Switzerland. This article is an open access article distributed under the terms and conditions of the Creative Commons Attribution (CC BY) license (http://creativecommons.org/licenses/by/4.0/).
