1. Introduction
The characteristic of energy structure of China is rich coal, poor oil and little gas [
1], the proportion of coal in the energy structure of our country is 60.4%, can consume in the absolute dominant position [
2]. Although the coal reserves of China are relatively large, the quality of coal is not high. In general, the low rank coal reserves account for more than half of the total coal reserves. Low rank coal with high water content and volatile content, low ash content and high activity showed poor thermal stability and low calorific value. Recently, the main use of low-rank coal is direct combustion, about 90% for industrial power generation and boiler fuel. A large amount of energy is consumed in the combustion process, and the energy utilization efficiency is only about 35%. In addition, low rank coal combustion will cause serious environmental pollution and emit a lot of greenhouse gases. Therefore, it is of great significance to rationally utilize coal resources, improve energy utilization efficiency and reduce carbon emissions [
3,
4].
Biomass is a kind of clean and renewable energy, which can achieve zero carbon emission in the utilization process, and reduce the emission of SO
X and NO
X, thus reducing the pollution to the environment [
5,
6,
7]. In recent years, the co-pyrolysis technology of biomass and coal has been widely studied by scholars, which is regarded as an effective way to improve the energy quality and utilization efficiency of coal and solve the problem of environmental pollution [
8,
9,
10]. Coal-biomass co-pyrolysis can not only reduce the use of fossil energy and reduce greenhouse gas emissions, but also improve the yield of pyrolysis oil with high calorific value in the pyrolysis products. In addition, co-pyrolysis of coal and biomass can also solve the problem of low energy density of biomass, which is not suitable for independent pyrolysis [
11,
12].
The co-pyrolysis process of biomass and coal is very complicated [
16,
17], which is difficult to be expressed by a series of accurate reaction equations. Moreover, traditional experimental methods cannot accurately calculate the reaction heat of pyrolysis process, which increases the difficulty of exploring the energy utilization efficiency of pyrolysis system [
18]. Aspen Plus, a large-scale process simulation software, provides a complete set of unit operation models for simulating various unit operation processes. Its physical property system is complete, including 1773 kinds of organic matter, 2450 kinds of inorganic matter, 3314 kinds of solid substances, and 900 kinds of water soluble electrolytes [
19,
20]. In this paper, Aspen Plus software was used to simulate the process of coal-biomass co-pyrolysis, and the simulation process of coal-biomass co-pyrolysis was built in combination with the experimental process. The influence of Raw material feed amount and different filling methods on the industrial production cost of coal-biomass co-pyrolysis was analyzed. Through sensitivity analysis, the influence of the price changes of four kinds of products -- pyrolytic carbon, pyrolytic oil, pyrolysis gas and wood vinegar on the total return on investment was obtained, so as to provide a reference for improving the energy utilization efficiency of lignite in industrialization [
21].
In this paper, the co-pyrolysis process of coal-biomass was studied by experimental methods, and the effects of pyrolysis temperature, filling method and raw material ratio on the distribution and composition of co-pyrolysis products were investigated. The synergistic effect of coal and biomass was explored, and the optimum technological conditions for co-pyrolysis were obtained. The co-pyrolysis process of coal and biomass was simulated by Aspen Plus software. The reliability of the model was verified by comparing the distribution of co-pyrolysis products under different raw material ratios with the experimental and simulated values. At last, through the economic analysis of the investment in plant construction, raw material collection and product production and sales, this paper provides the basic data and basis for the commercialization of coal-biomass co-pyrolysis technology and the investment in plant construction.
2. Materials and Methods
2.1. Pyrolysis experiment design
2.1.1. Raw material
Biomass raw material is elm from Xinjiang, China. The biomass raw materials were crushed and screened into 0.15-0.30 mm particles. They were also dried in an oven at 105 °C for 12 h. The raw materials of Baishihu Coal from Hami of Xinjiang were crushed and sifted into fractions with particle size of 0.07-0.10mm. It was also dried in an oven at 105 °C for 12h, followed by co-pyrolysis of coal and biomass. The proximate and ultimate analyses of coal and biomass are shown in
Table 1.
2.1.2. Experimental apparatus and process
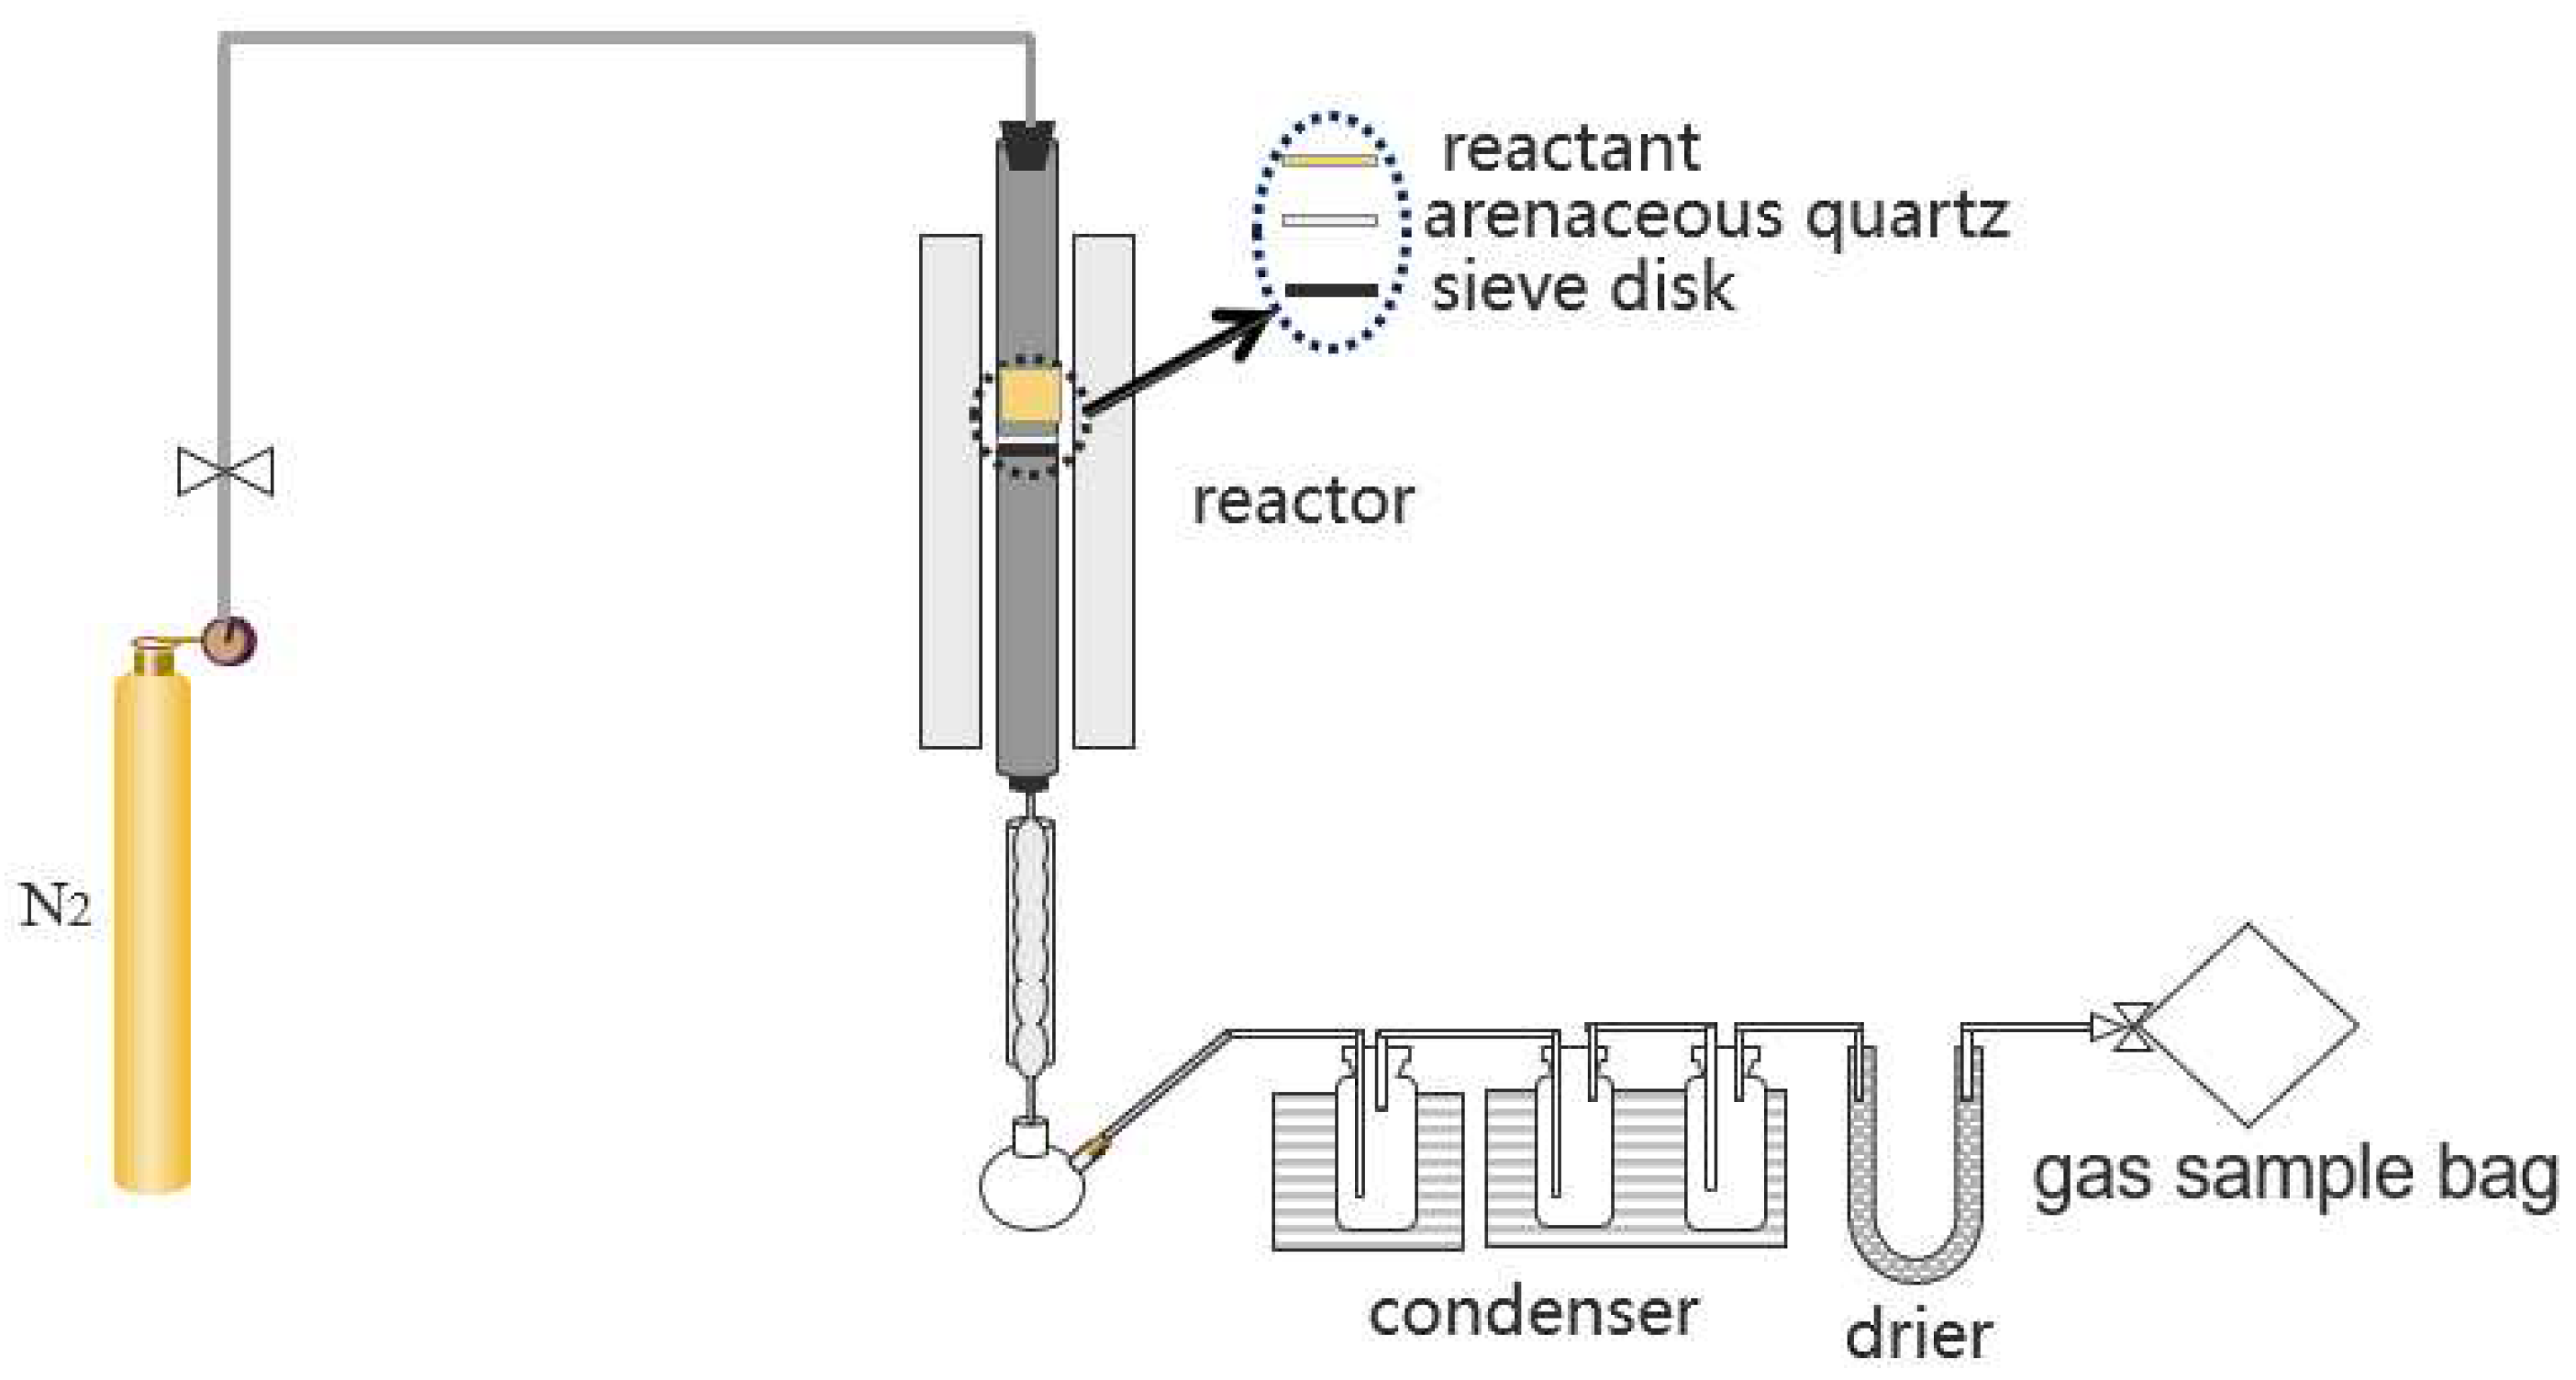
The co-pyrolysis reaction of biomass and coal samples was carried out in a quartz tube fixed bed reactor at 450°C、500°C、550°C、600°C、650°C、700°C. The loading methods are divided into C#B, B#C and Mix. C#B represents coal in the upper layer, B#C represents biomass in the upper layer, and Mix represents coal-biomass blend. The coal-biomass mixing ratio is 4:0、3:1、1:1、1:3 and 0:4. The pyrolytic gas generated by pyrolysis is collected by gas bag and sent to gas chromatography for component analysis. The end of quartz tube is sealed with cotton for collecting pyrolytic oil. Pyrolytic oil was analyzed by GC-MS. Pyrolytic carbon is collected after cooling at the end of pyrolysis reaction. The reactor system is shown in
Figure 1. The coal and biomass raw materials were weighed respectively according to the mixing ratio. The final total mass of 5.0 g was placed in the center of the pyrolysis reactor. The carrier gas with a flow rate of 100 mL min−1 N2 (purity > 99.999%) flowed through the reactor system continuously. During the experiment, the temperature was heated from room temperature to reaction temperature at 10°C min−1 and maintained for 30 min. Finally, the temperature was lowered to 350°C to finish the experiment. At the end of each experiment, the reactor was wiped with a sponge soaked in anhydrous ethanol, and then burned and cleaned in air before the next experiment was conducted.
2.1.3. Pyrolysis experiment design
The purpose of coal-biomass pyrolysis is to explore the synergistic effect of their co-pyrolysis. In this section, the effects of raw material ratio, pyrolysis temperature and filling method on the distribution and composition of co-pyrolysis products were studied, and the optimal process conditions were determined.
2.1.4. Product analysis
The contents of eight main gases including CO、CH4、CO2、H2、C2H4、C2H6、C3H6 and C3H8 in the gas phase products were determined by gas chromatograph. The quality of pyrolysis oil was measured by weighing method. The pyrolytic oil was dissolved into toluene to measure its water content, and the pyrolytic oil was dissolved into dichloromethane to remove the water and put into the test tube, and then gas chromatography-mass spectrometer (PerkinelmerClams500, GC-MS) was used for component analysis.
In order to evaluate the conversion performance of pyrolytic oil, the yield of pyrolytic oil was calculated according to formulas (1) and (2).
Which mtar and mfeed represent the weight (g) of pyrolysis oil and raw materials.
The yield of pyrolysis gas and the volume concentration of eight main gases (CO、CH
4、CO
2、H
2、C
2H
4、C
2H
6、C
3H
6、C
3H
8) are calculated by formula (2) and formula (3) below.
(i= CO、CH
4、CO
2、H
2、C
2H
4、C
2H
6、C
3H
6、C
3H
8)
(i= CO、CH
4、CO
2、H
2、C
2H
4、C
2H
6、C
3H
6、C
3H
8)
2.2. Aspen plus process simulation design
2.2.1. Simulation flow description
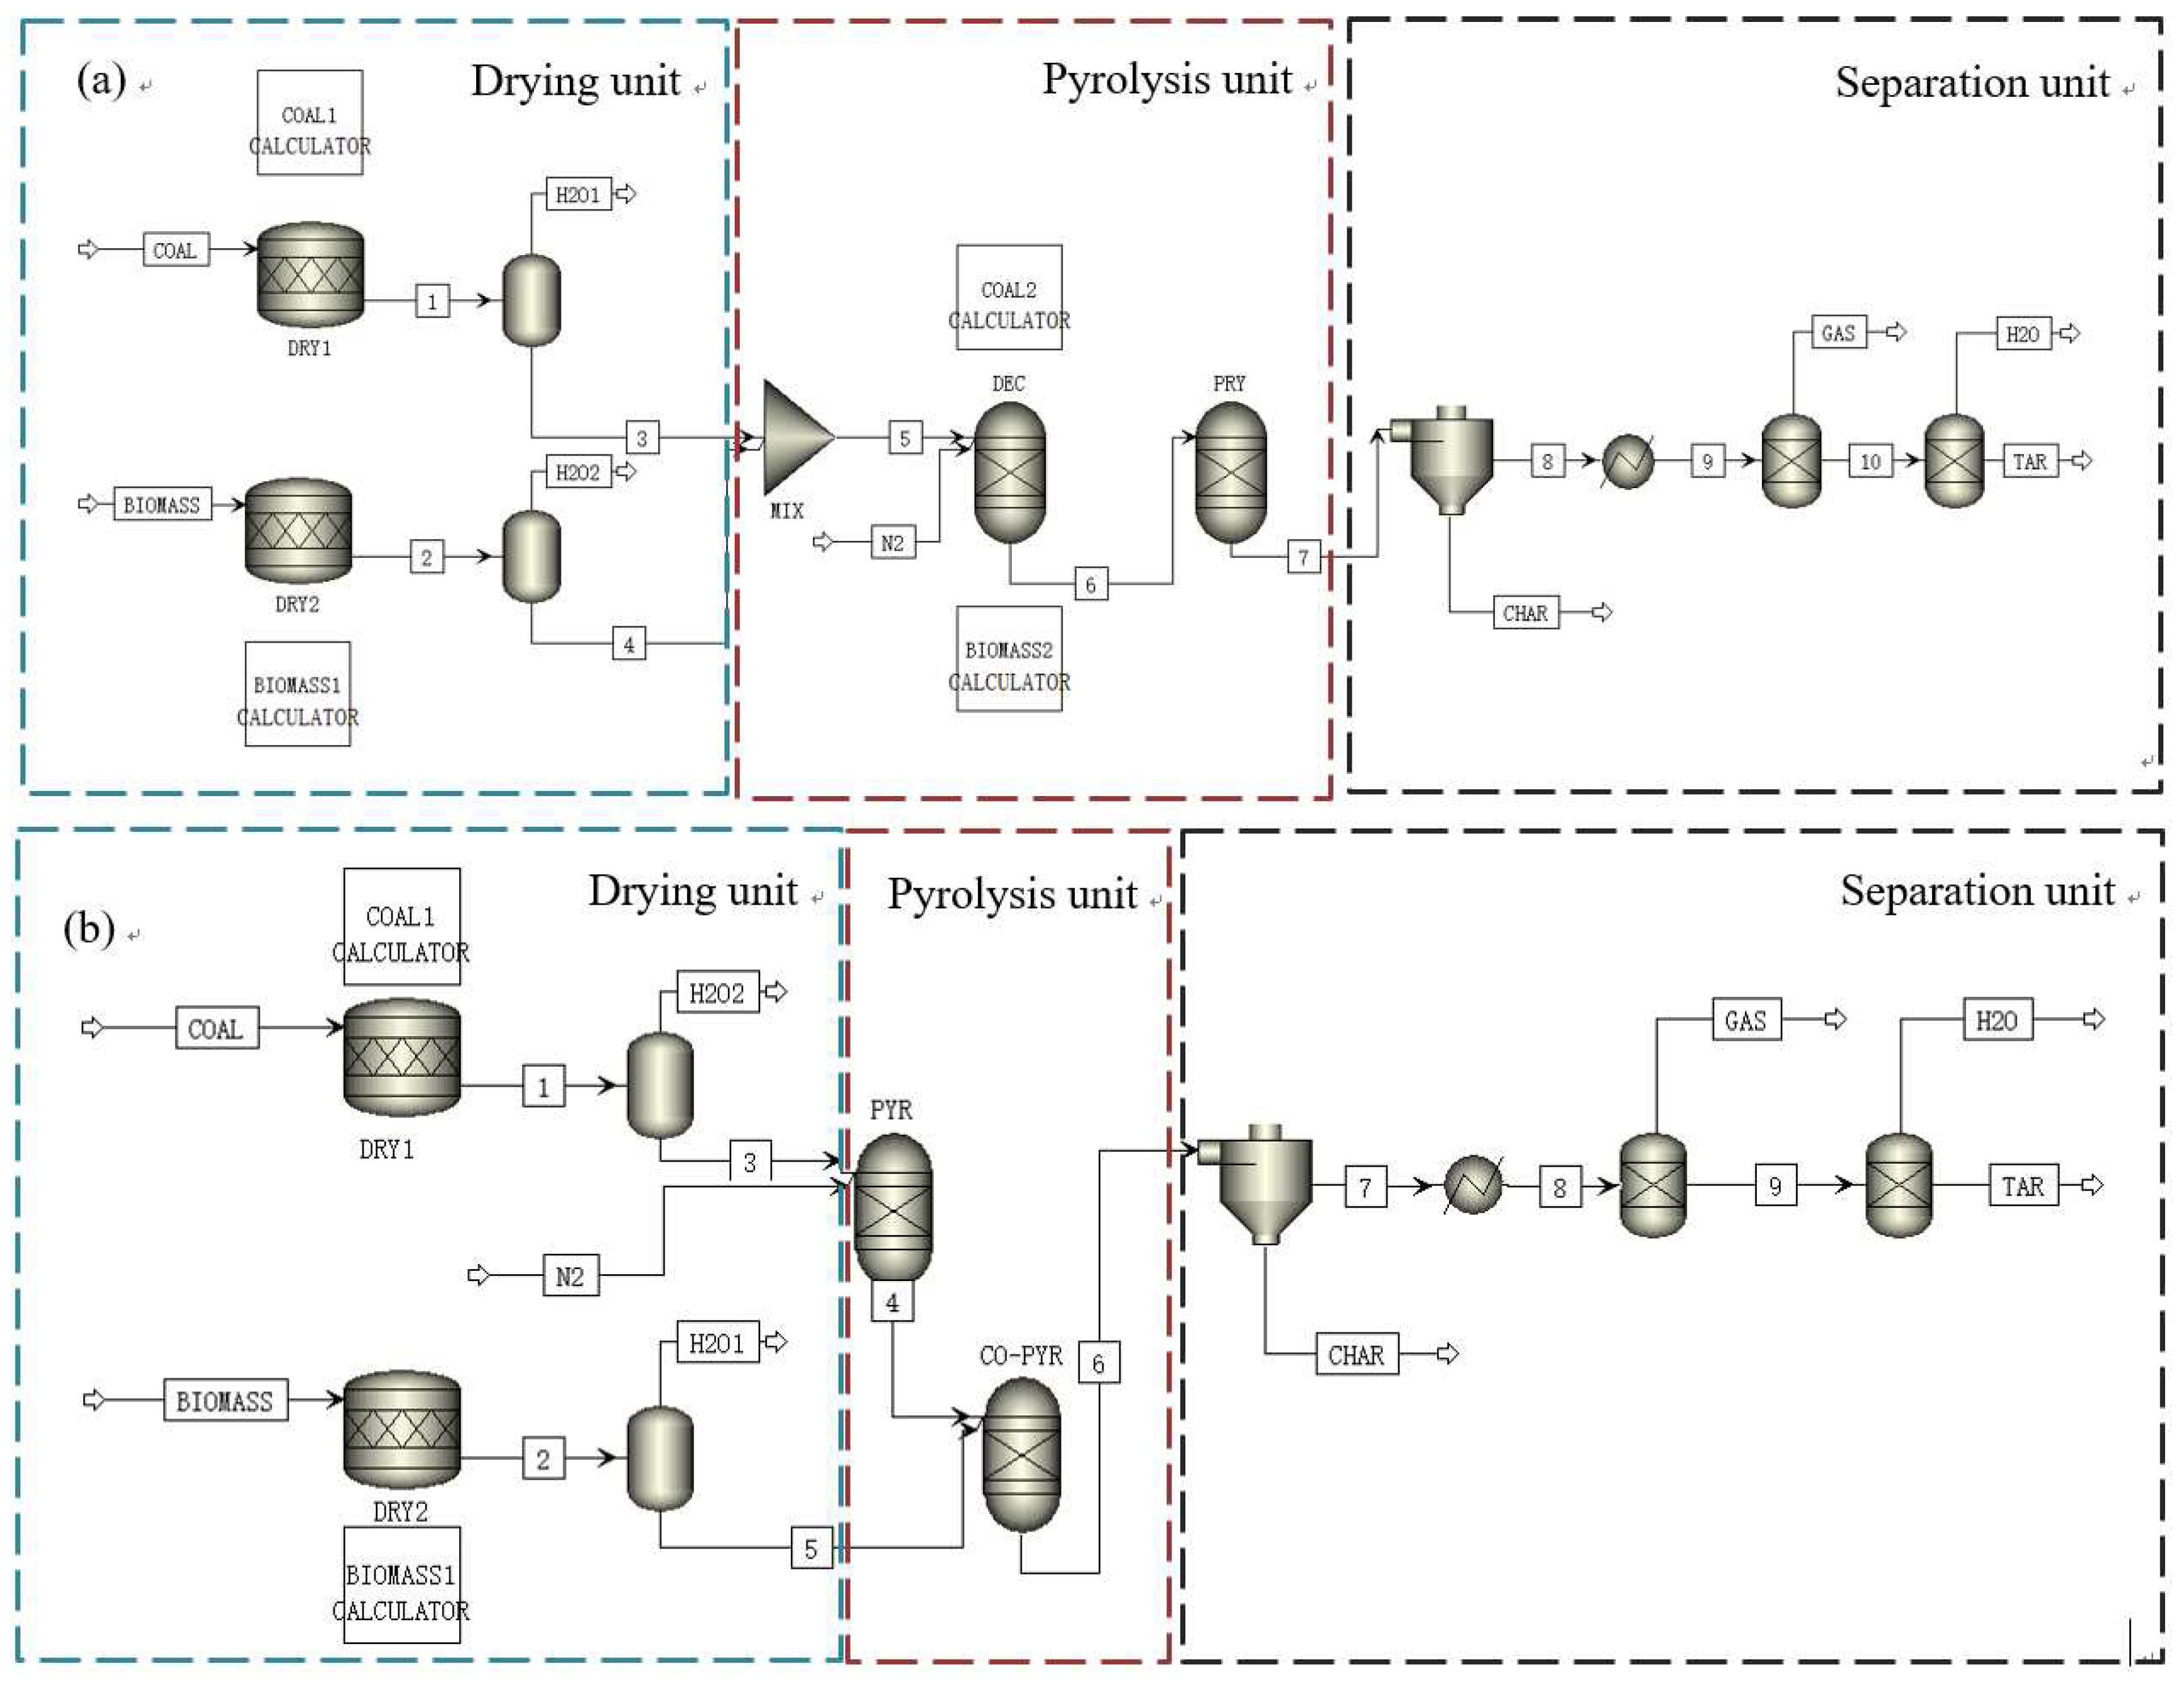
The data source of the Aspen simulation process is obtained from the above experiments, and the conditions in the simulation process are also set according to the above experimental conditions. According to the filling method, two different simulation processes of stratified pyrolysis and mixed pyrolysis were established. The simulation process consists of three parts: drying unit, pyrolysis unit and separation unit. The difference between the two simulation processes was the difference in the pyrolysis unit. Drying unit, for raw material drying and moisture removal was only physical change. A stoichiometric reactor (RStoic) was selected for the drying of raw materials. The separation of dried coal and biomass raw materials and water was completed by a separator. In the mixed pyrolysis model, the dried coal and biomass were mixed by a mixer before entering the pyrolysis unit. Due to the complex process of co-pyrolysis of coal-biomass, the reaction products (mainly including C、H
2、O
2、N
2 and S) were first normalized in the RYield reactor according to the elemental analysis results, and then pyrolysis was performed in the next RYield reactor. The pyrolysis products were divided into pyrolytic carbon, pyrolytic oil, pyrolysis gas and water. According to the results of gas chromatographic analysis, pyrolysis gas consisted of CO、CH
4、CO
2、H
2、C
2H
4、C
2H
6、C
3H
6 and C
3H
8. According to GC-MS analysis results, pyrolytic oil was mainly composed of phenols、alkenes、alkanes、alcohols、ketones、benzenes and esters. Therefore, it can be simplified into a mixture of seven model compounds, including phenol (C
6H
6O)、pentene (C
5H
10)、pentane (C
5H
12)、ethanol (C
2H
5OH)、acetone (CH
3COCH
3)、benzene (C
6H
6) and methyl acetate (C
3H
6O
2). In addition, the pyrolytic carbon was mainly carbon. In the stratified pyrolysis model, coal or biomass was first pyrolyzed separately in a RYield reactor, and all the pyrolysis products are transferred to the next RYield reactor for mixed pyrolysis. In the separation unit, the pyrolytic products were first removed by the cyclone separator, and then through the heat exchanger, the gas-liquid separation was carried out, and the pyrolysis gas was removed. The final liquid phase product was removed by the separator.
Figure 2 shows the mixed pyrolysis model and coal-biomass pyrolysis layered model. Coal and biomass raw materials are unconventional components. HCOALGEN model is used to calculate enthalpy value, and DCOALIGT model is used to calculate density. In the pyrolysis process, the raw material is decomposed into conventional components by the yield reactor, and the final pyrolysis product is also represented by conventional components. The simulation flow chart is shown in
Figure 2.
2.2.2. Model building assumptions
The following assumptions were made during the establishment of the co-pyrolysis model [
19,
28]:
(1) The simulation system is a steady-state process.
(2) Ash in coal and biomass is an inert component and does not participate in the pyrolysis simulation process.
(3) Coal exists in the form carbon, as does the pyrolytic carbon after the reaction.
(4) It does not consider the loss of quality and energy transmitted between modules.
(5) The pyrolysis process of the simulation process reaches equilibrium.
(6) Gas phase products with CO、CH4、CO2、H2、C2H4、C2H6、C3H6 、C3H8. these eight products replaced.
(7) According to the results of GC-MS, the pyrolysis oil was replaced by seven model compounds, including phenol (C6H6O), pentene (C5H10), pentane (C5H12), ethanol (C2H5OH), acetone (CH3COCH3), benzene (C6H6) and methyl acetate (C3H6O2).
2.2.3. Simulation process module and function
The model modules and functions of coal-biomass co-pyrolysis process are shown in
Table 2, which are represented in terms of modules and functions used by drying units, pyrolysis units and separation units.
2.2.4. Aspen plus simulates the pyrolysis product components
The co-pyrolysis products of coal-biomass can be divided into four parts: pyrolytic carbon, pyrolytic oil, pyrolysis gas and water. The components and proportions of co-pyrolysis products are shown in
Table 3.
(a) Composition and proportion of co-pyrolysis products obtained from mixed pyrolysis model. (b) Composition and proportion of co-pyrolysis products from stratified pyrolysis model of coal in top layer. (c) The composition and proportion of co-pyrolysis products from stratified pyrolysis model of coal in lower layer.
2.3. Technical and economic analysis
2.3.1. Economic analysis basis
Based on the experiment of co-pyrolysis of coal and biomass and the simulation of Aspen Plus process, the economic analysis of mixed pyrolysis and stratified pyrolysis process was carried out [
29,
30,
31]. Assuming a transport radius of 40 km for biomass, a pyrolytic plant will be built at the biomass collection and extraction site, so the transport cost of biomass can be ignored. Coal has a higher energy density than biomass and can be transported long distances to pyrolysis plants, ignoring transport costs for biomass. Two raw materials of coal and biomass are defined as unconventional components, and they are feeded according to the optimal ratio of raw materials. All costs are adjusted for the 2023 US dollar exchange rate. Equipment cost estimates based on available market prices from industrial pyrolysis manufacturers in China include dryers, pyrolysis furnaces, condensing systems, pipes and separators. Raw material costs are based on local prices of coal and biomass. Assuming 320 days of operation per year and 24 hours per day, the estimated annual operation time is 7680 hours. Assuming 20 years of equipment life.
2.3.2. Cost of capital
The capital cost of building the plant includes the cost of construction, equipment purchase and equipment installation. Construction cost includes land cost and worker construction cost. The equipment purchase cost is mainly the equipment purchase cost of pyrolysis system. Most of the equipment cost comes from Aspen Icarus software, and part of the equipment cost comes from literature [
32,
33,
34]. The specific equipment cost is shown in
Table 4. It is assumed that the construction time of the plant is 3 years and the equipment life is 20 years. The key assumptions for the economic analysis are shown in
Table 5, where the maximum processing scale is 10t h
−1.
2.3.3. Operating cost
Operating costs can be divided into variable and fixed operating costs. Variable operating costs mainly include power costs, cooling tower coolant and raw material costs [
20,
37]. Electricity costs and cooling tower coolant were calculated according to the capital estimation tool in Aspen plus simulation software. Fixed operating costs include labor, maintenance、overhead、taxes and insurance. Fixed operating costs are shown in
Table 6.
Raw material costs include biomass and coal costs. The biomass is first cut down and transported to the factory, and then crushed to the size required for pyrolysis. The cost of biomass raw materials includes the cost of cutting, transportation, afforestation and crushing. Coal is purchased directly from the coal yard, transported to the factory, and then crushed to the size required for pyrolysis. The cost of coal includes the cost of buying, transporting and crushing. The specific cost of raw materials is shown in
Table 7.
2.3.4. Product sales
Pyrolytic oil, pyrolysis carbon and pyrolysis gas in the pyrolysis products can be sold as products. Pyrolytic oil is sold with reference to the international oil price, which is about 569 $ t−1. Pyrolytic carbon is marketed as a soil amendment for about 323$ t−1. The sale price of pyrolysis gas is about 590 $ t−1 based on the natural gas price.
3. Results and discussion
3.1. Analysis of pyrolysis experiment results
In this section, the effects of pyrolysis temperature, Raw material filling method and raw material ratio on the product distribution and composition of co-pyrolysis of coal and biomass were studied. On this basis, the optimal co-pyrolysis conditions were obtained.
3.1.1. Pyrolysis temperature
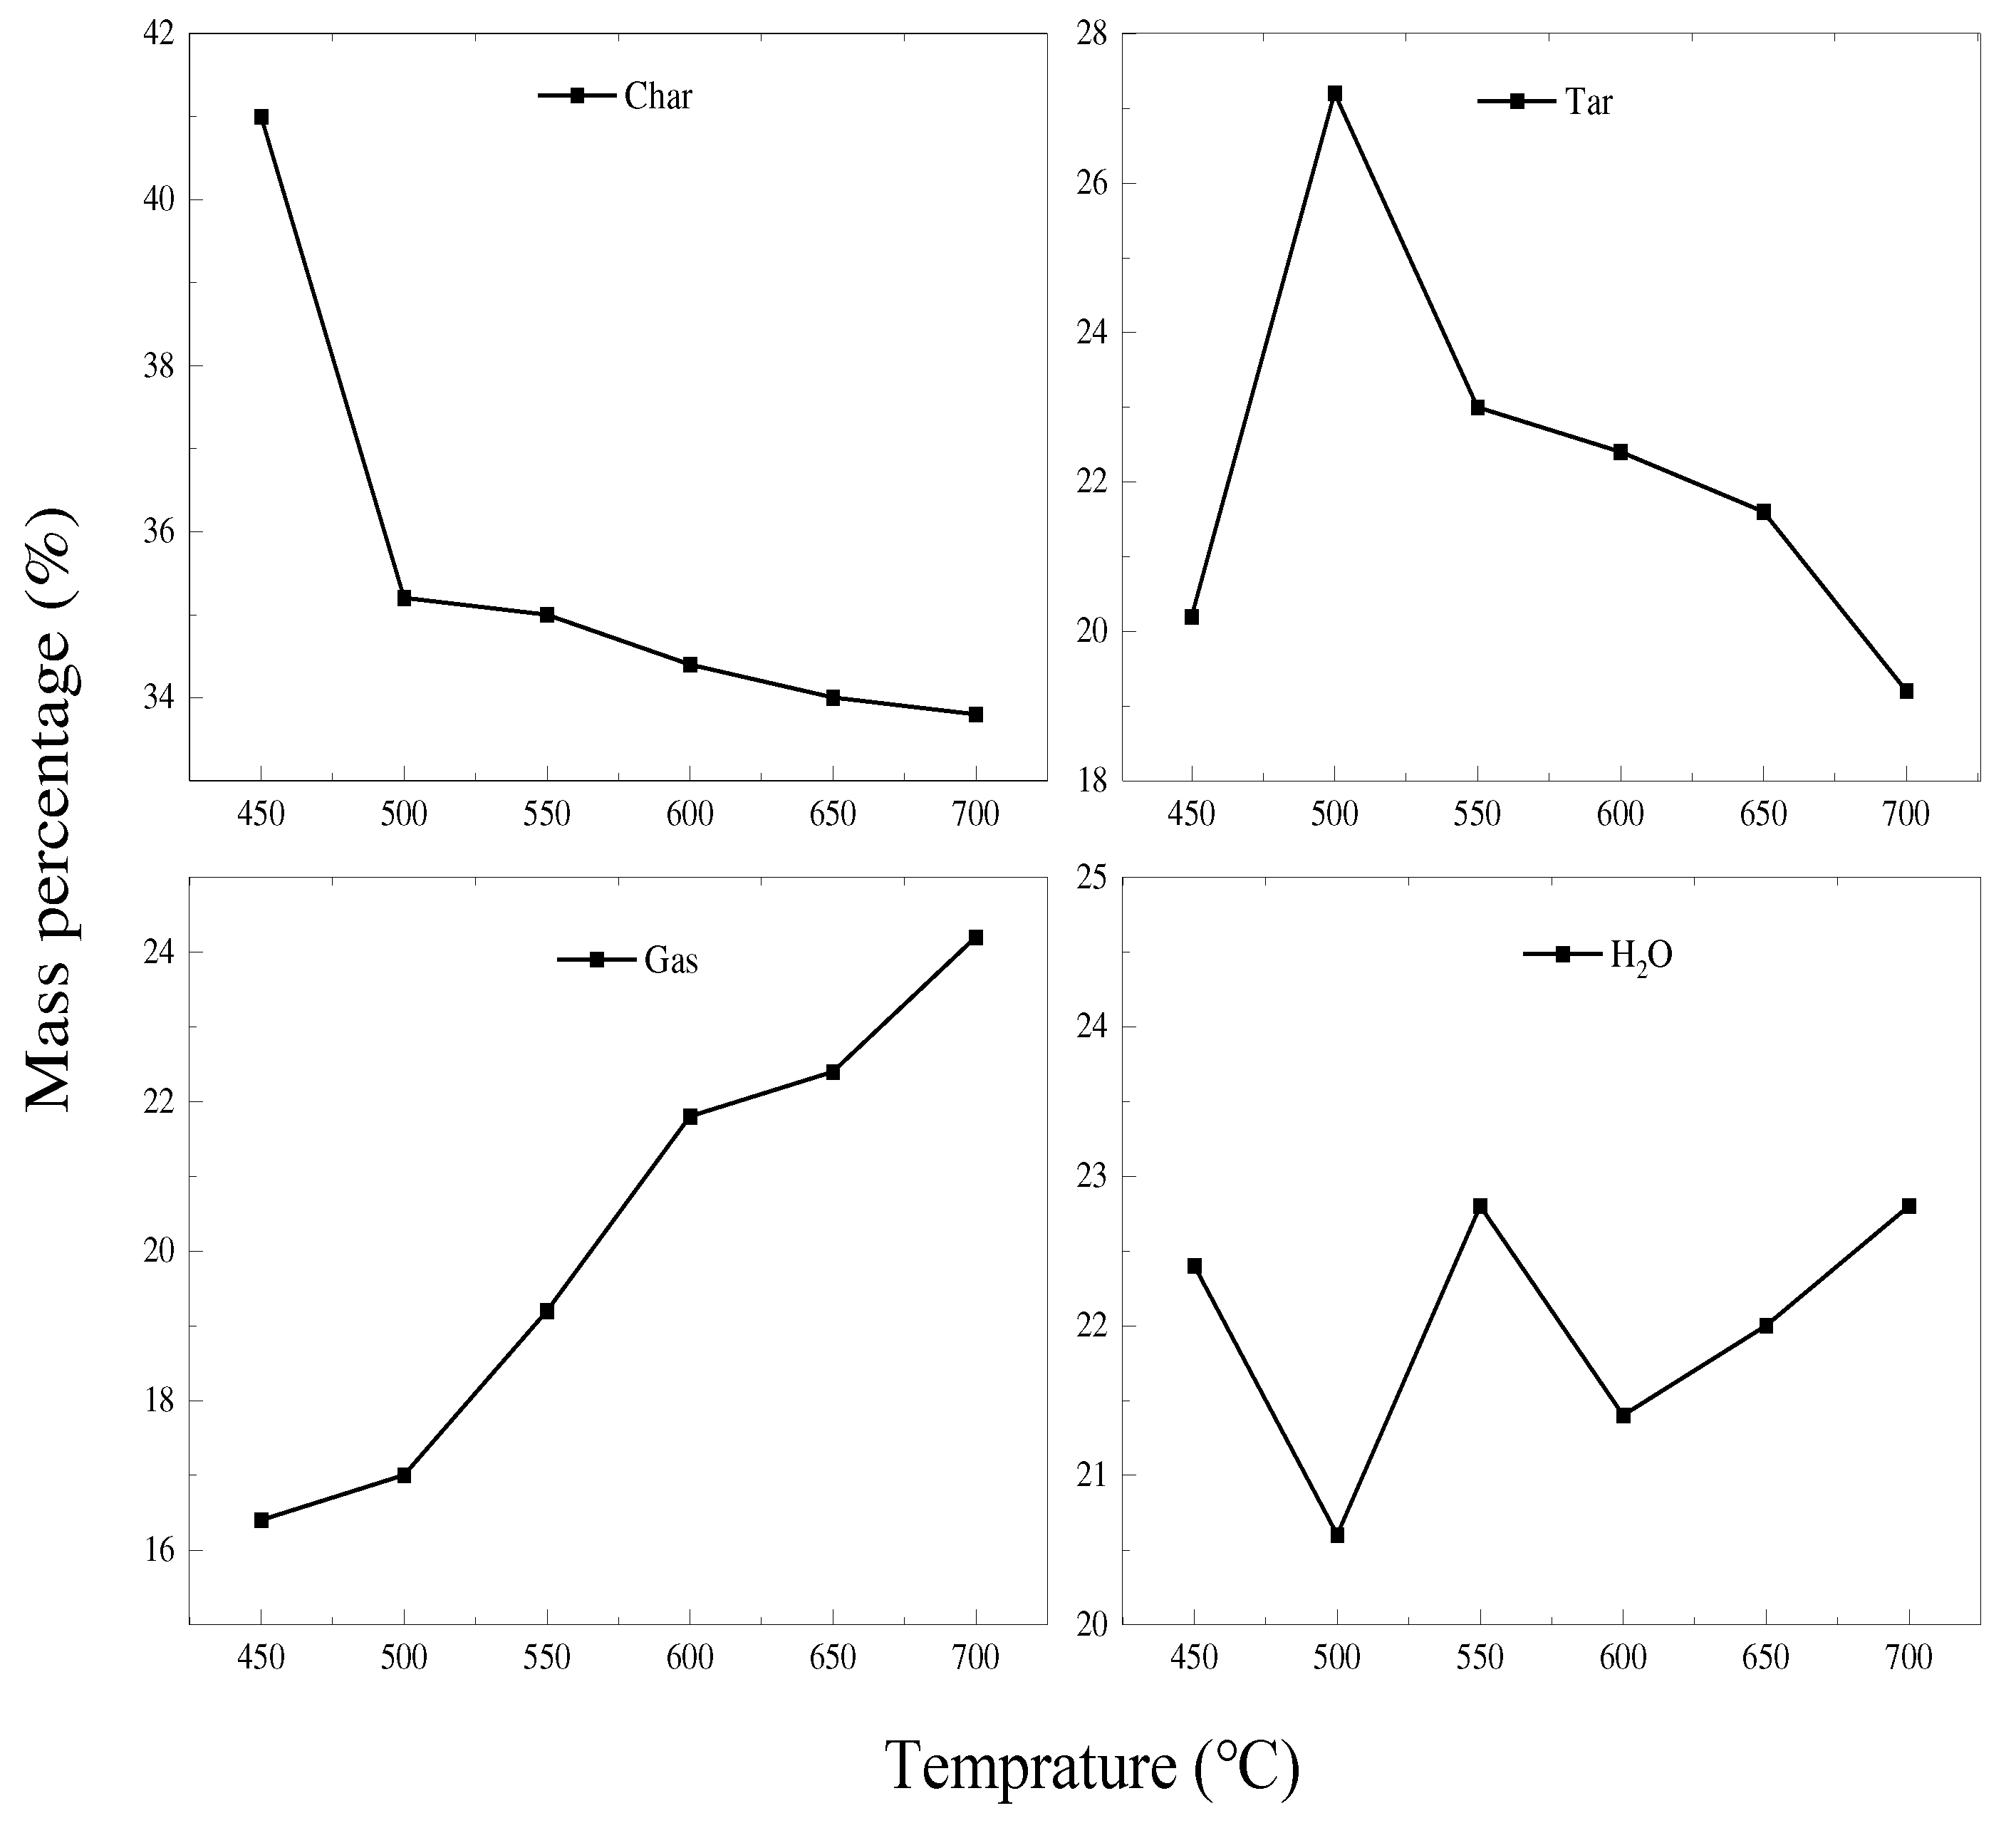
The influence of pyrolysis temperature on the co-pyrolysis of coal and biomass in the range of 450-700°C was studied under the conditions of 1:3 coal-biomass mixture ratio and B#C filling method. The results are shown in
Figure 3. The results show that with the increase of temperature, the yield of pyrolytic carbon decreases gradually, and the tar increases first and then decreases. Tar production reaches its maximum at 500°C. With the increase of pyrolysis temperature, the production of pyrolysis gas increases gradually and reaches its maximum value at 700°C. Since pyrolysis oil is the most important product in co-pyrolysis, 500°C is chosen as the best pyrolysis temperature.
3.1.2. Pyrolysis temperature
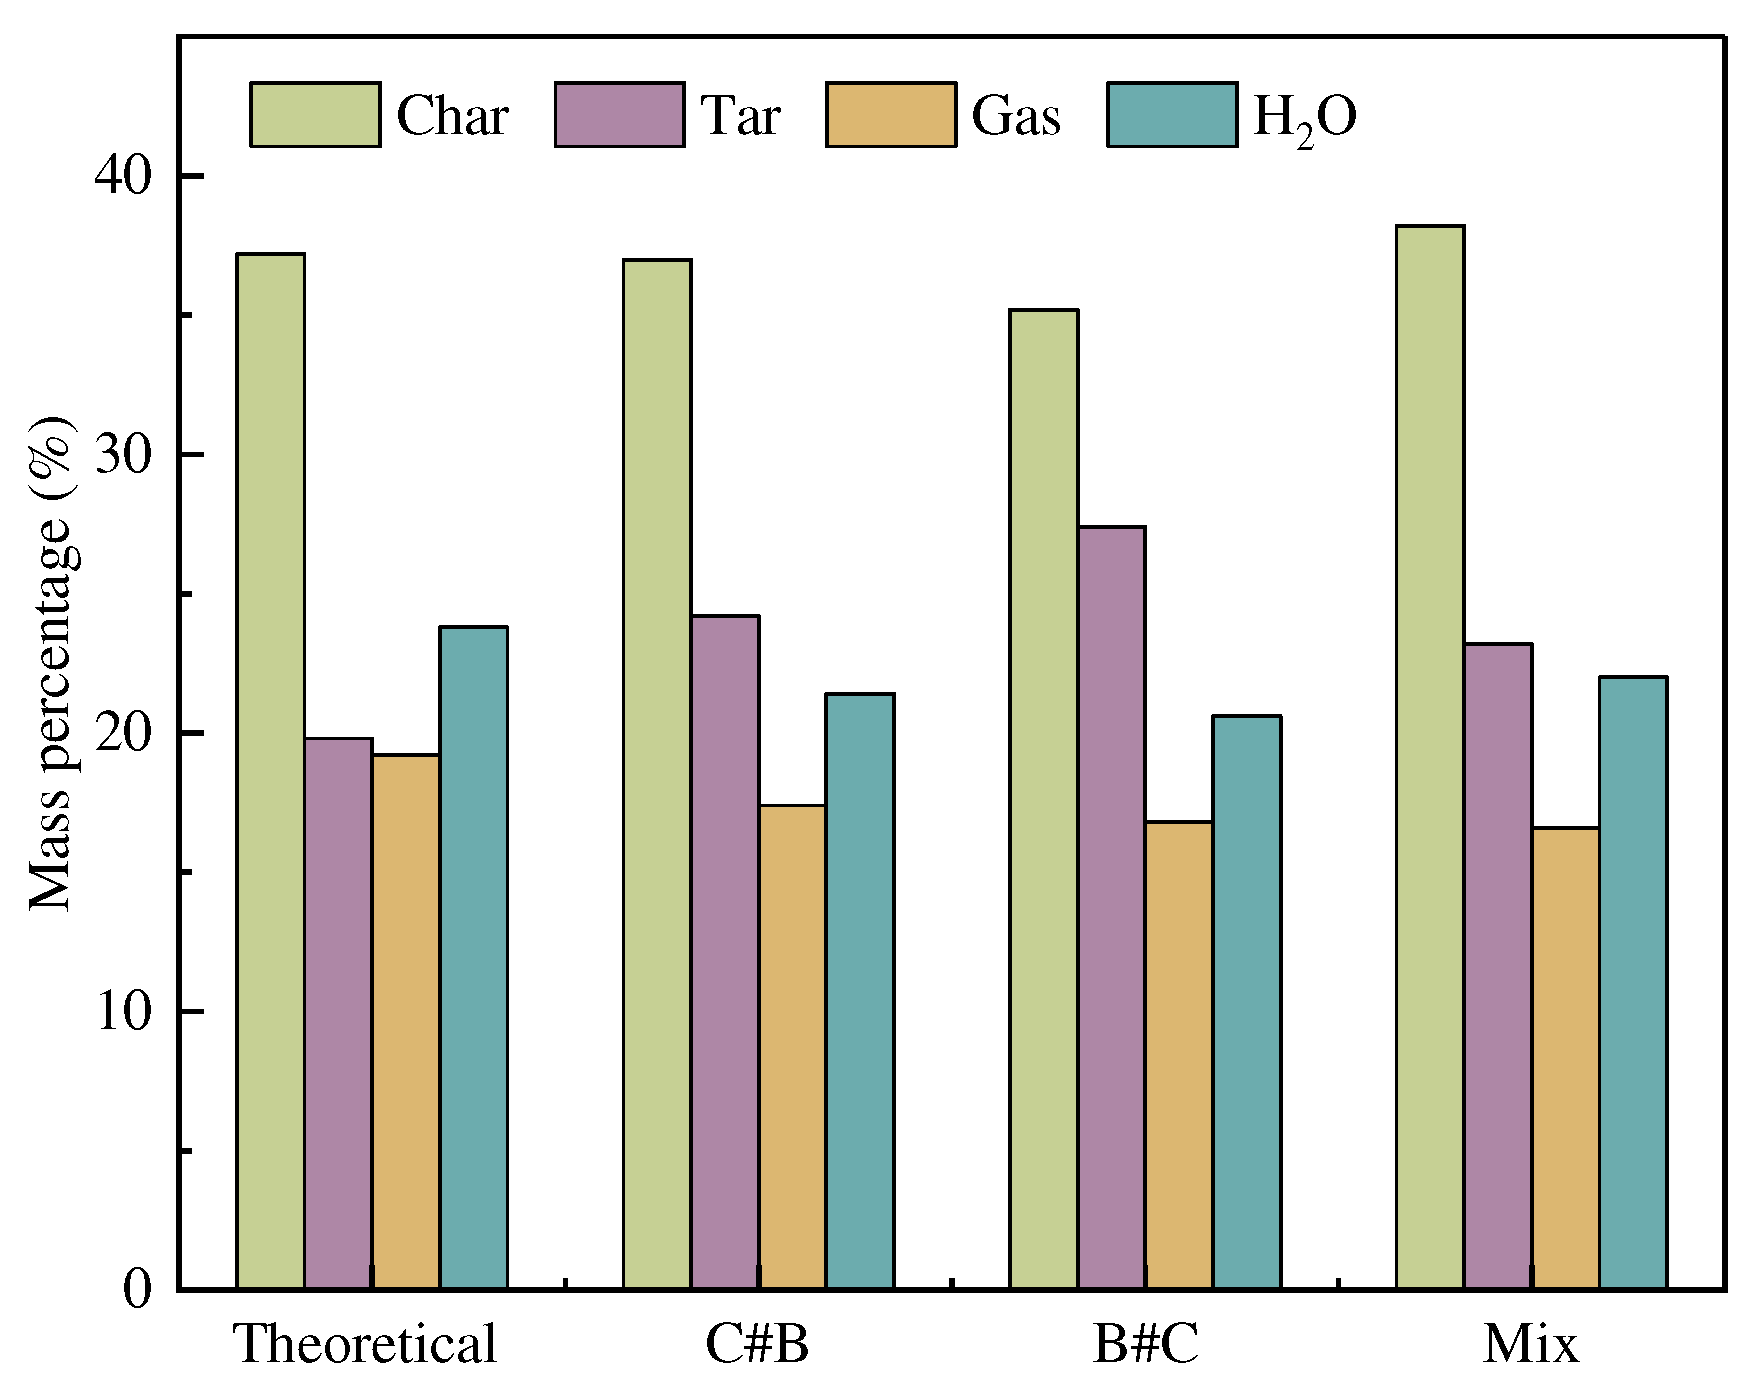
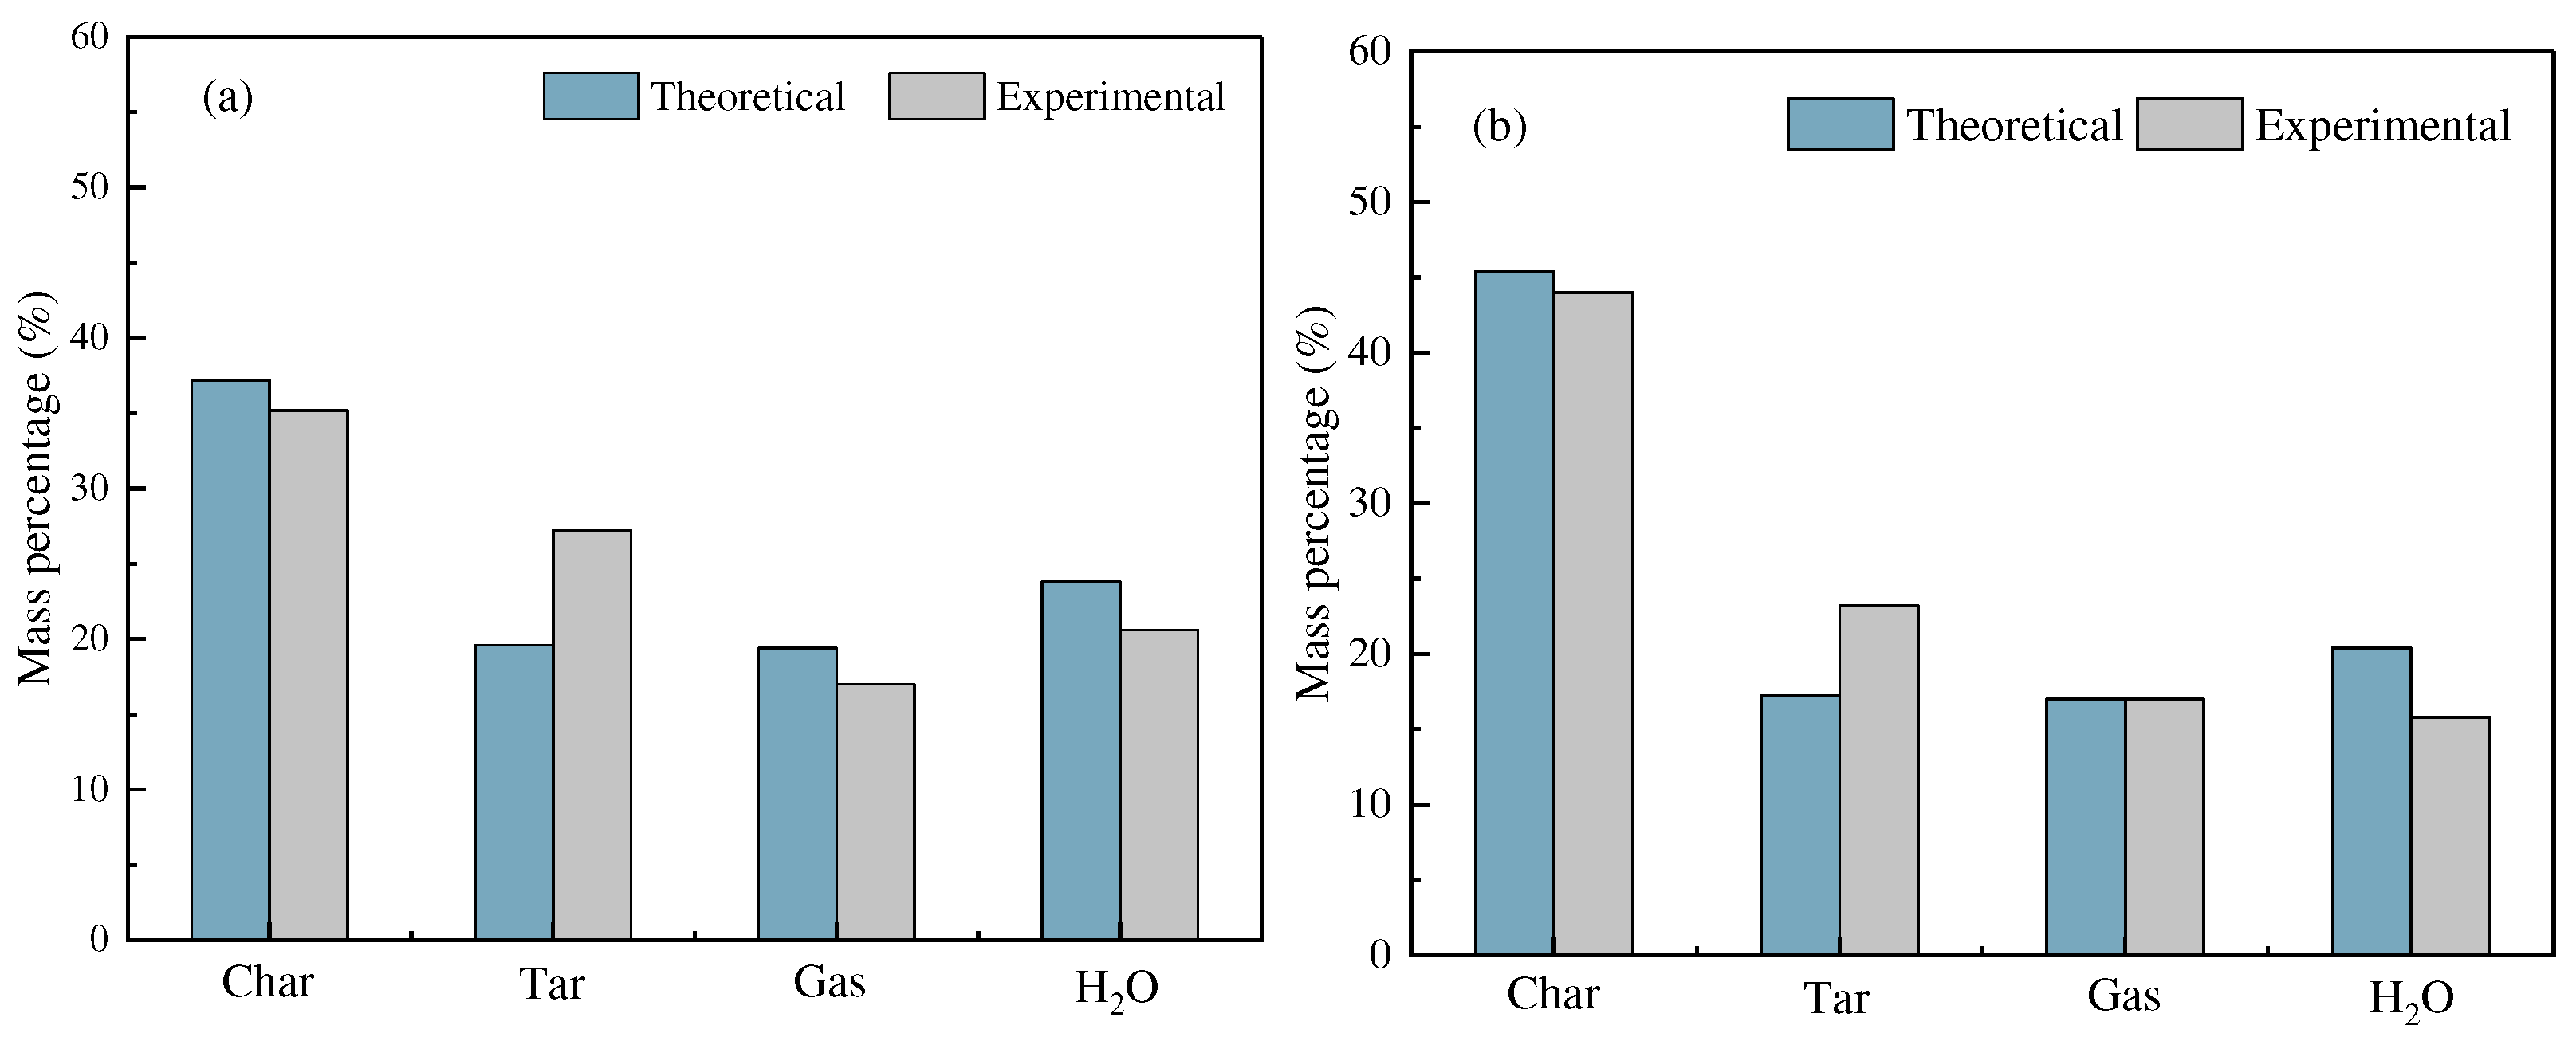
Three different loading methods (C#B、B#C and Mix) on the distribution of coal-biomass co-pyrolysis products, and the results are shown in
Figure 4. The theoretical value is calculated from the results of separate pyrolysis of coal-biomass. The result shows that the loading method of pyrolysis oil pyrolysis experimental value is higher than the theoretical value, pyrolysis experiments yield less than theoretical value. The B#C loading method has the highest output of pyrolytic oil and the lowest output of pyrolytic carbon. The filling method has no effect on the yield of pyrolysis gas during co-pyrolysis. Biomass pyrolysis can form free radicals to react with coal and inhibit the formation of coal coke. In addition, the alkali and alkaline earth metals contained in biomass can promote the pyrolysis reaction of coal. The pyrolysis reaction process in the experimental facility in this paper is from top to bottom, so the biomass has a better promotion effect on coal pyrolysis at the top.
3.1.3. Optimal raw material ratio
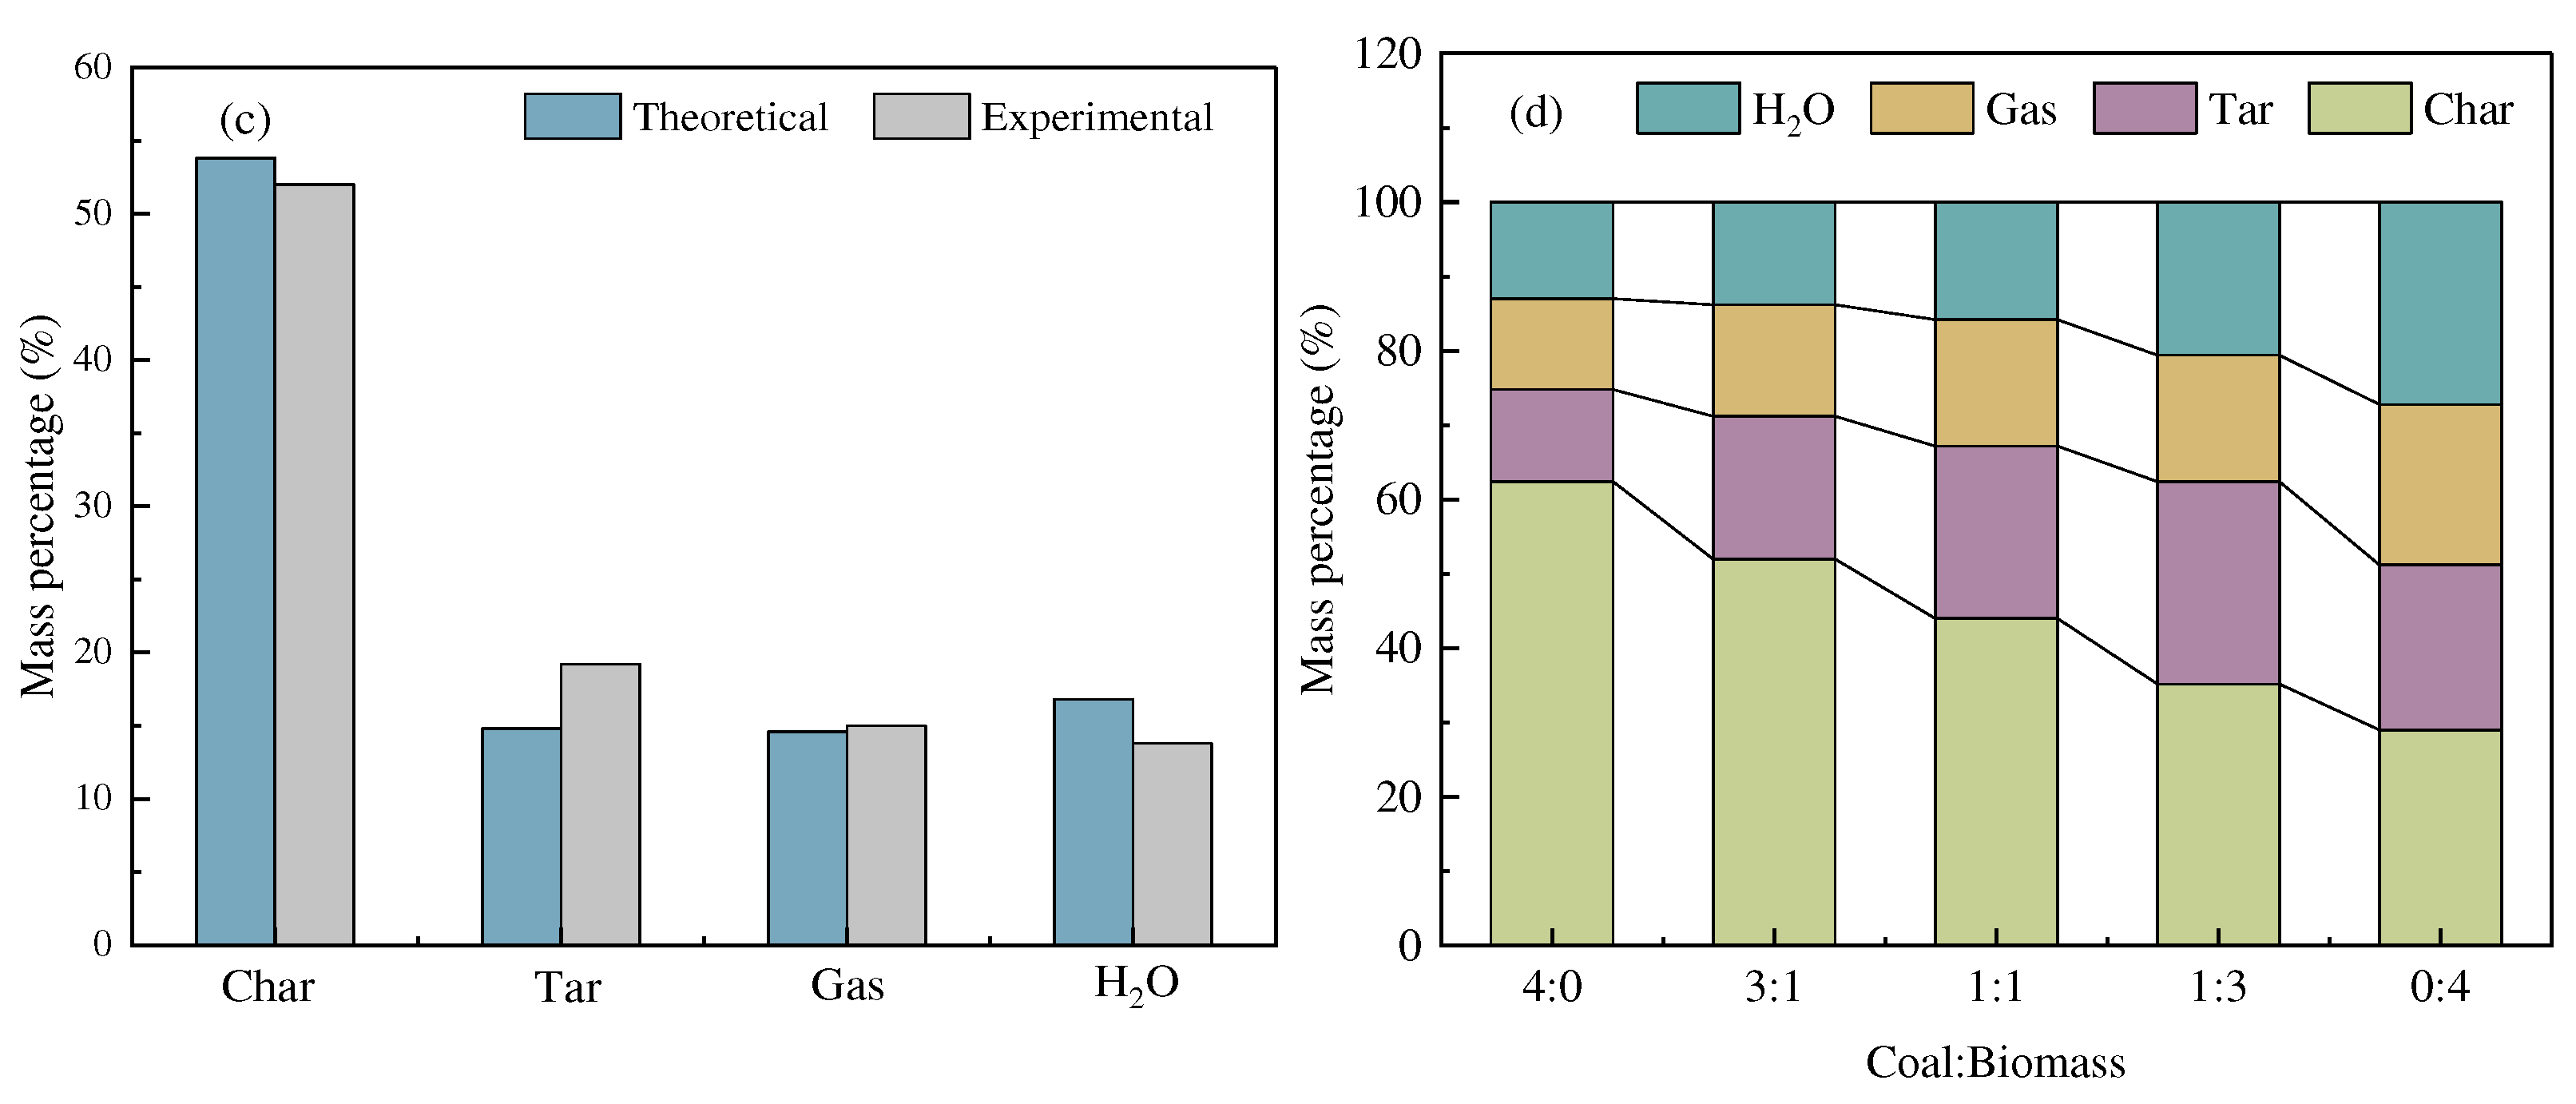
The effects of different raw material ratios on the distribution of gas-liquid-solid three-phase products of coal-biomass co-pyrolysis were studied under the pyrolysis temperature of 500°C and the loading method of B#C. The theoretical values were weighted averaging by the pyrolysis results of coal and biomass separately.
Figure 5a shows the comparison of theoretical and experimental values of different product when the mass ratio of coal to biomass is 1:3. The experimental value of pyrolytic carbon yield in pyrolysis products is less than the theoretical value, the experimental value of pyrolytic oil is significantly greater than the theoretical value, and the experimental value of gas phase product is slightly less than the theoretical value. The results show that the co-pyrolysis of coal and biomass at the ratio of 1:3 achieves the highest yield of pyrolysis oil.
Figure 5b shows the comparison of theoretical and experimental values of different product when the mass ratio of coal to biomass is 1:1. The experimental value of pyrolytic carbon is less than the theoretical value, the experimental value of pyrolytic oil is greater than the theoretical value, and the experimental value of pyrolysis gas is basically equal to the theoretical value.
Figure 5c shows the comparison of theoretical and experimental values of different product when the mass ratio of coal and biomass is 3:1. The experimental value of pyrolytic carbon in pyrolysis products is slightly less than the theoretical value, the experimental value of pyrolytic oil is slightly greater than the theoretical value, and the experimental value of pyrolysis gas is basically equal to the theoretical value. It can be seen that the co-pyrolysis under the three ratios can promote the generation of pyrolysis oil. Three kinds of different ratio was greater theoretical value and experimental value of the water.
Figure 5d shows the distribution of co-pyrolysis products of coal and biomass at different ratios. Biomass contains a large number of volatile components, so the output of pyrolysis gas during biomass pyrolysis alone is greater than that during co-pyrolysis and coal pyrolysis separately. In the process of co-pyrolysis, the higher the proportion of biomass, the higher the yield of pyrolytic oil, while the higher the proportion of coal, the higher the yield of pyrolytic carbon, pyrolysis gas and pyrolysis oil [
39]. Among the three ratios, when the ratio of coal and biomass is 1:3 showed the best synergistic effect, the yield of pyrolysis oil is the highest and the pyrolysis carbon is the lowest.
3.1.4. Analysis of pyrolysis products
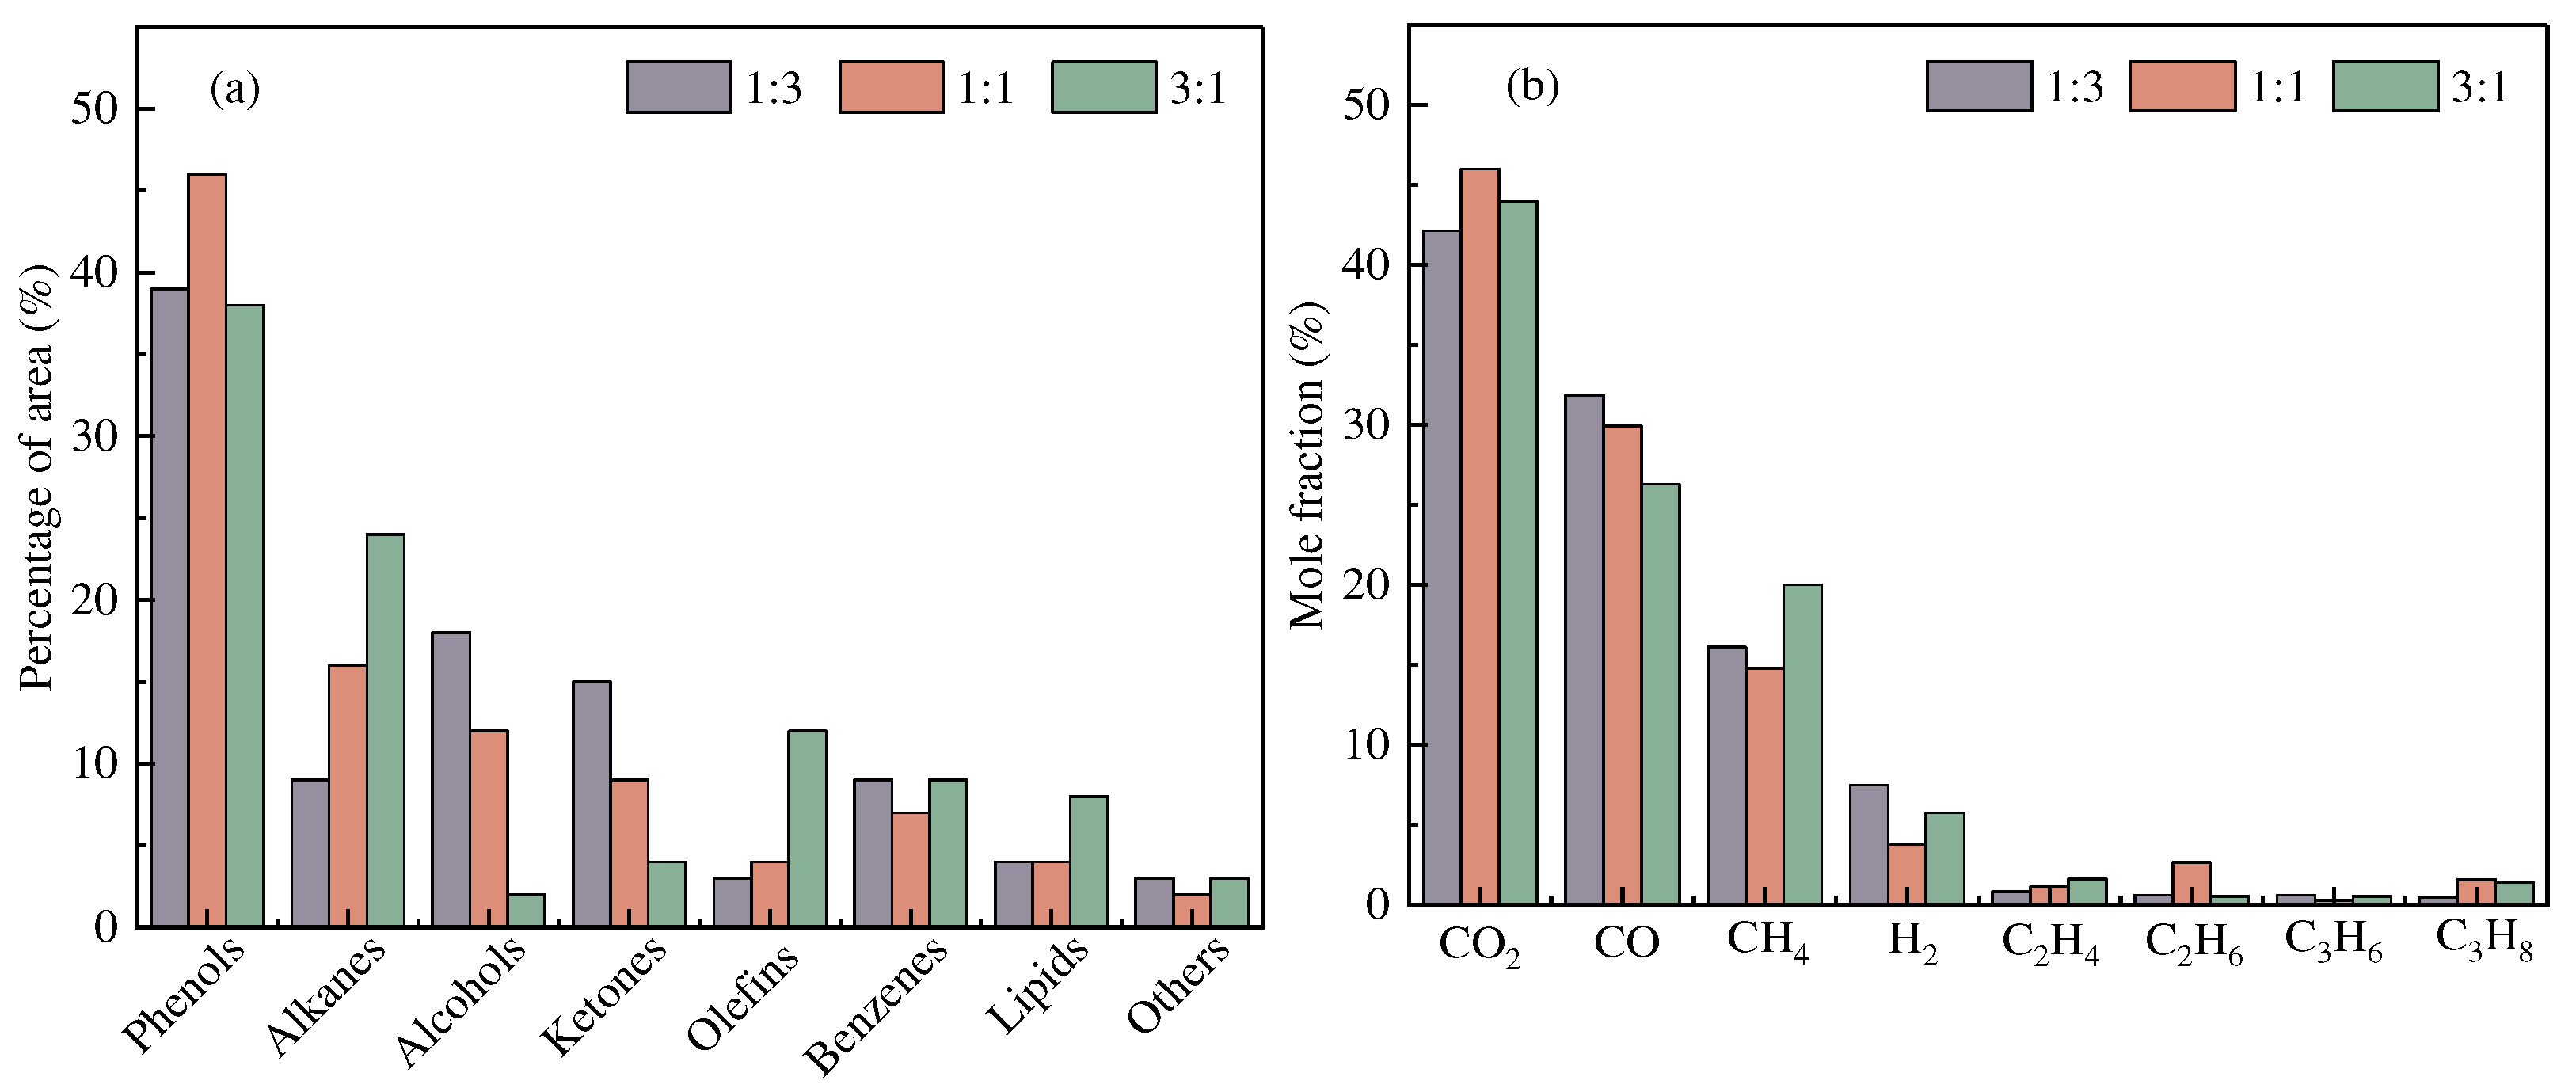
Under the condition that the co-pyrolysis temperature is 500°C and the loading method is B#C, the composition distribution of co-pyrolysis oil and pyrolysis gas at different ratios is studied. In
Figure 6a, When the coal-biomass ratio is 1:3, the contents of alcohols and ketones in the pyrolysis oil are the highest; when the coal-biomass ratio is 3:1, the contents of alkanes, lipids and olefins in the pyrolysis oil are the highest. When the coal-biomass ratio is 1:1, the content of phenols in pyrolysis oil is the highest, and the content of other substances is between the other two ratios (that is, the ratio of coal and biomass is 3:1 and 1:3). Therefore, increasing the content of biomass in the mixed raw materials is conducive to increasing the contents of phenols, alcohols and ketones in the pyrolysis oil. By contrast, the increase of coal is beneficial to increase the content of alkanes, lipids and olefins in pyrolysis oil. Other groups of substances include acids, nitrogen, sulfur and chlorine. Under the three ratios, the content of other substances is less than 3%, which proves that the quality of the pyrolysis oil from coal-biomass pyrolysis is much better.
Figure 6b shows the result of the composition of gas phase products of co-pyrolysis under three different raw material ratios. The content of CO
2, CO and CH
4 in pyrolysis gas is more than 80%, much higher than the other gas components. When the ratio of coal to biomass is 1:3, the content of CO and H
2 in gas phase products is the highest. When the ratio of coal to biomass is 1:1, the content of CO
2, C
2H
6 and C
3H
8 in pyrolysis gas is the highest. When the ratio of coal to biomass is 3:1, the content of CH4 in pyrolysis is the highest. Due to the greenhouse effect of CO
2, the less CO
2 content in the pyrolysis gas products, the better. When the ratio of coal to biomass is 1:3, the content of CO
2 is the least, and the content of CO and H
2 is higher than that of the other two ratios, so the ratio is the best.
3.2. Simulation result analysis
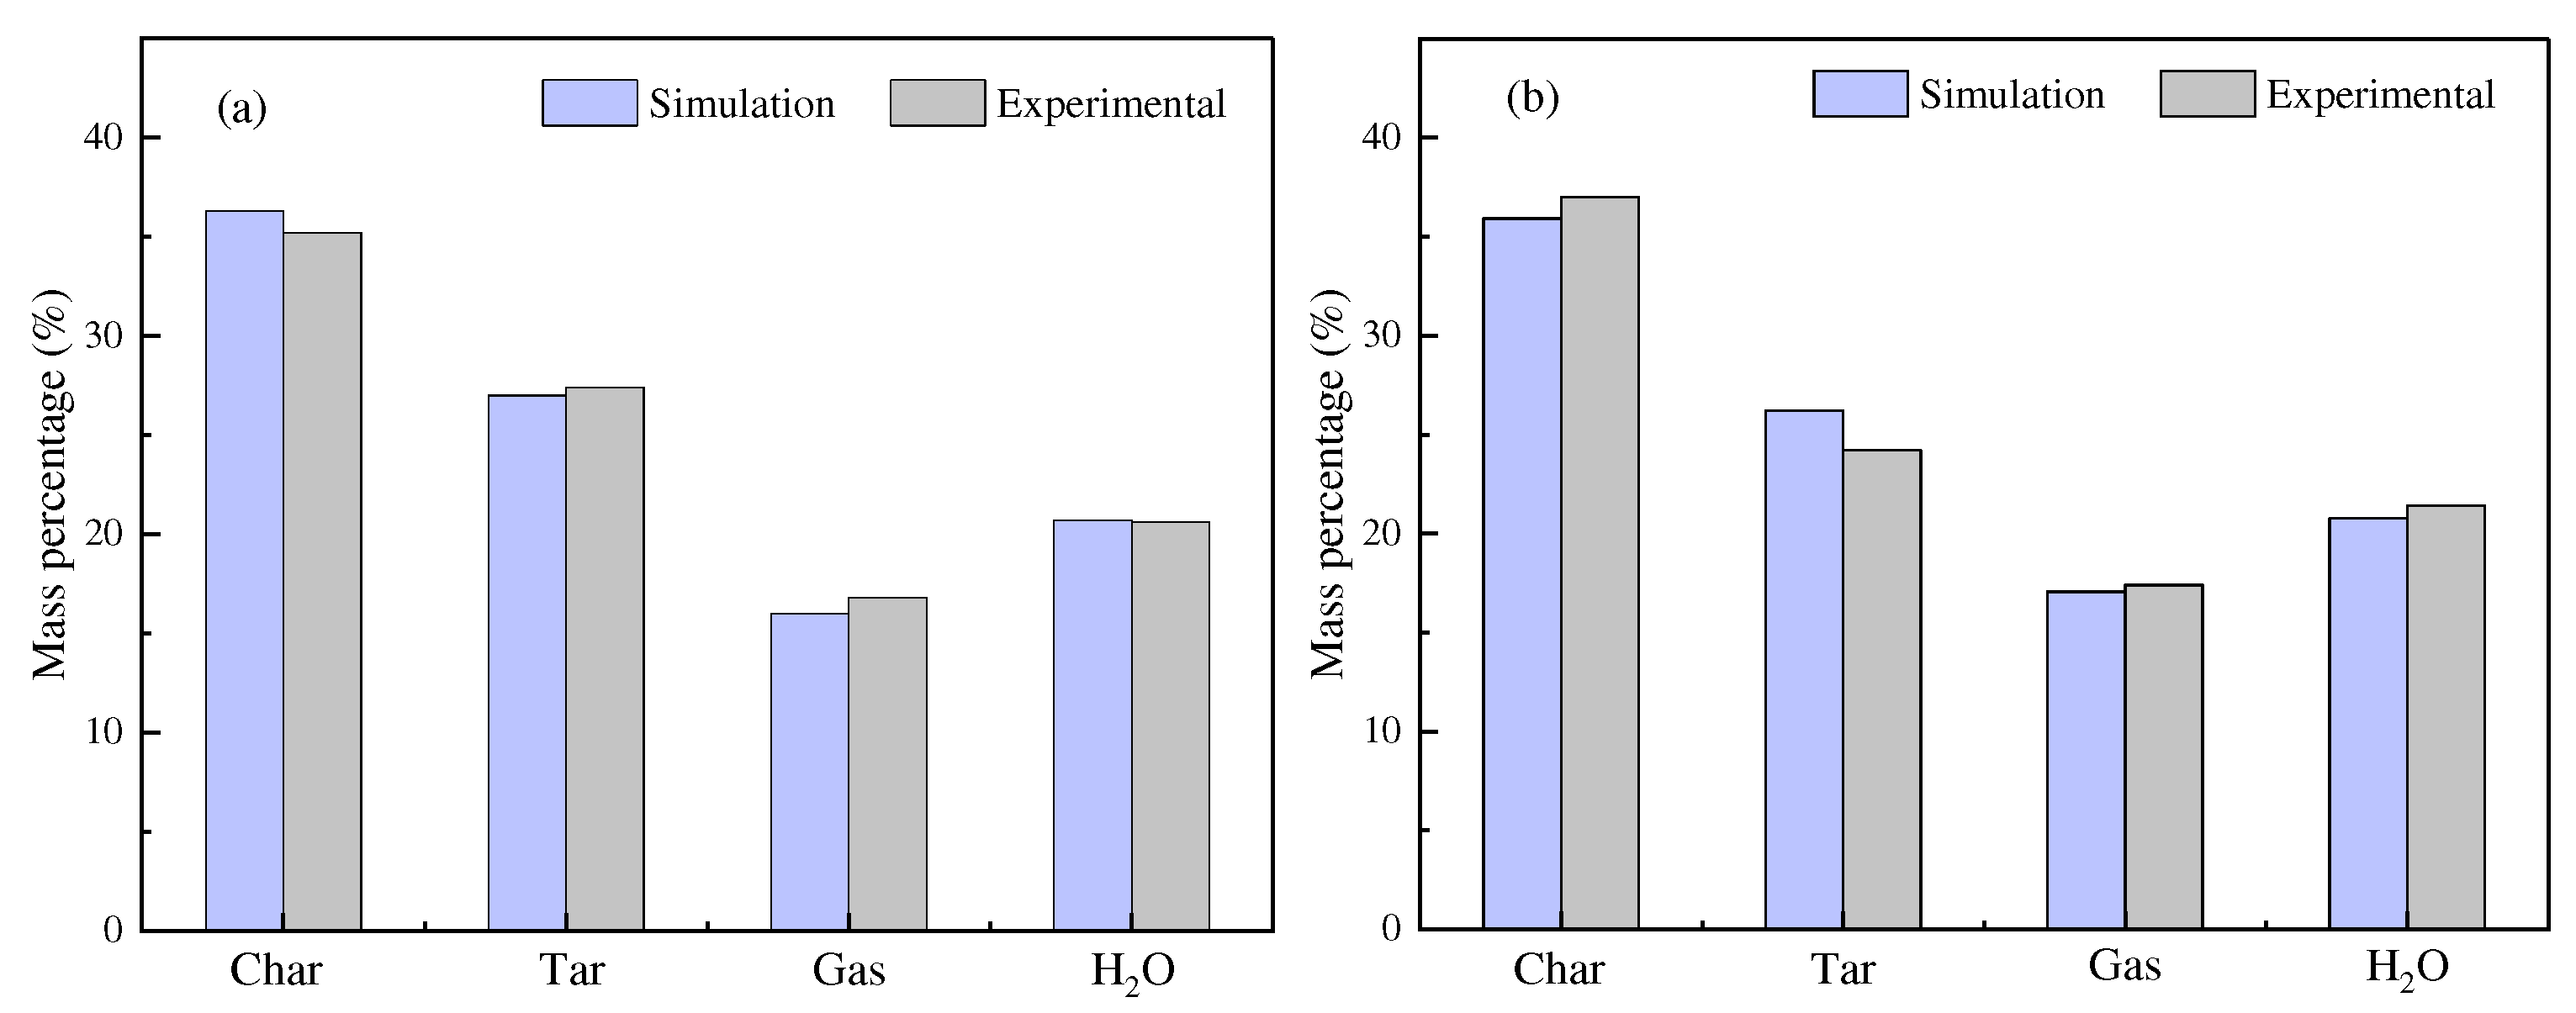
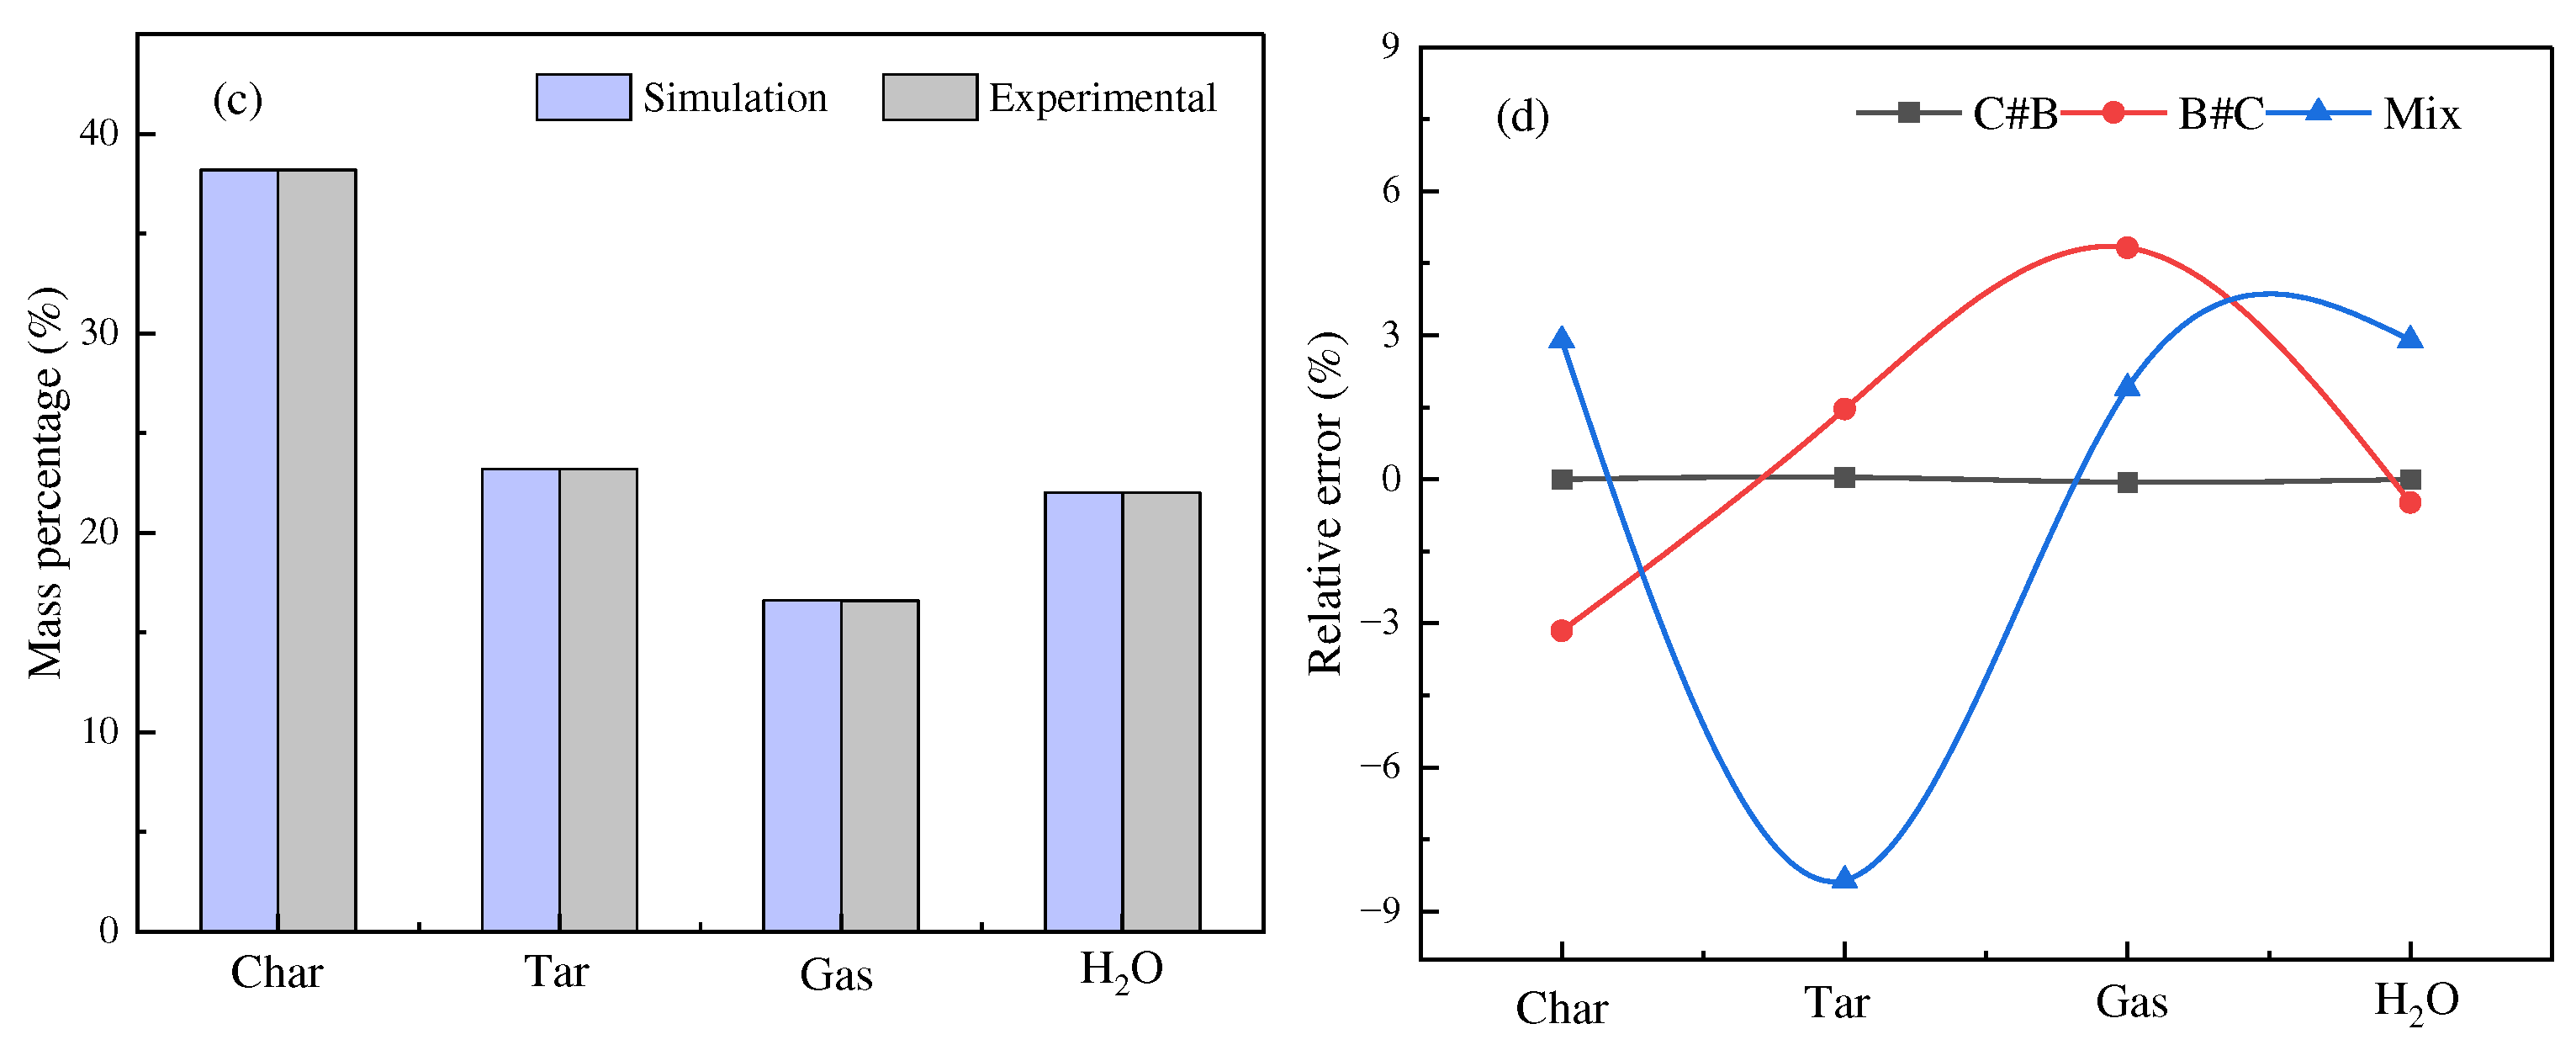
In this section, two models of mixed co-pyrolysis and stratified pyrolysis were established to explore the influence of three different loading methods on the distribution of simulated products of coal-biomass co-pyrolysis. The results are shown in
Figure 7.
Figure 7 compares the simulation results and experimental results at the pyrolysis temperature of coal and biomass at 500 °C, the ratio of coal and biomass at 3:1, and with the three loading modes. As can be seen from
Figure 7, the experimental results of pyrolytic carbon, pyrolytic oil, pyrolysis gas and water under three different ratios are close to the simulation results, in which the simulation relative error of coal on top is the smallest, and the simulation relative error of uniform mixing is the largest. The overall relative error is controlled within 9%, verifying that the model has good reliability.
3.3 Economic analysis
3.3.1. Result of investment cost
Table 8 shows the plant investment costs of stratified pyrolysis and mixed pyrolysis. The total plant capital cost of mixed pyrolysis is slightly higher than that of stratified pyrolysis. Because mixed pyrolysis goes through post-mixed pyrolysis after the raw material is dried, a mixer needs to be installed. Equipment cost and installation cost are the main investment items of plant investment. From the perspective of cost, stratified pyrolysis is more suitable for pyrolysis plant investment than mixed pyrolysis.
3.3.2. Breakeven analysis of pyrolysis system
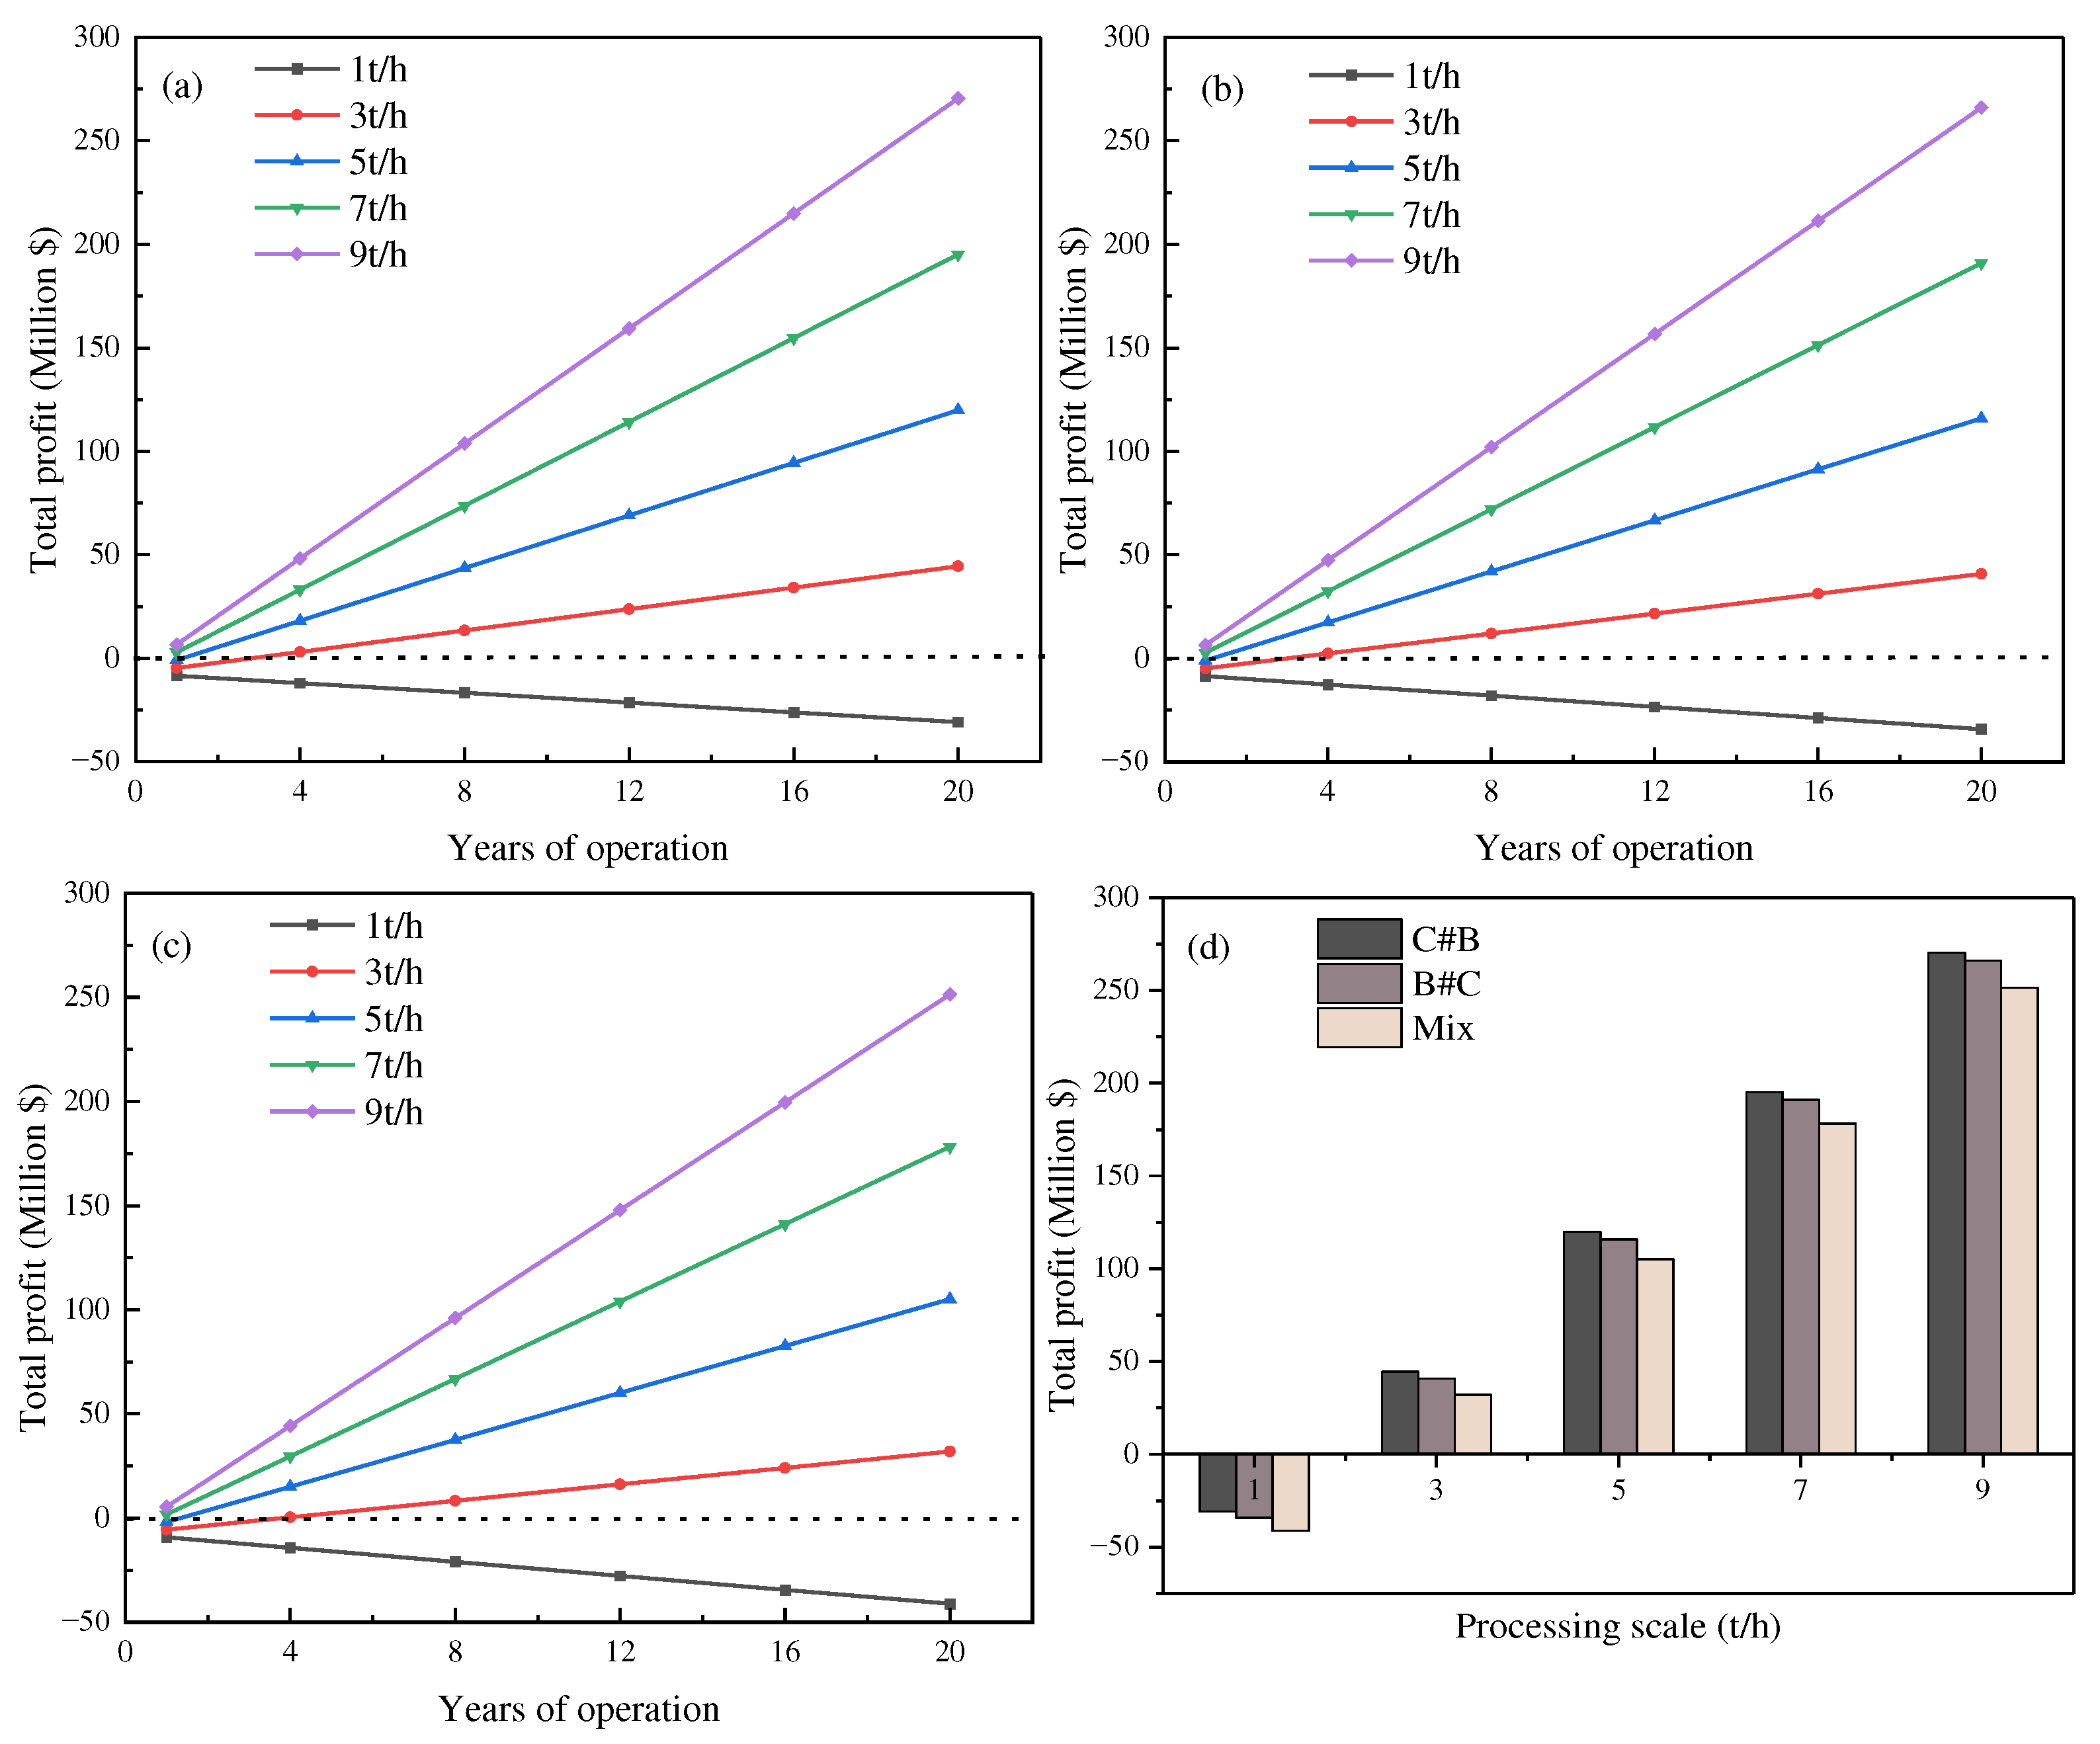
In this section, the economic analysis of the pyrolysis plant model built by three loading methods was carried out respectively.
Figure 8 shows the effect of processing scale on total profit. As can be seen from the
Figure 8, when the processing scale is 1 ton/h, the pyrolysis plants with the three loading methods have been in a state of loss during the 20-year running time. When the processing scale is 3 ton/h or above, the pyrolysis plant is in a profitable state. When the processing scale is 9 ton/h, the pyrolysis plant with three loading methods is the most profitable.
Figure 8d shows the effect of treatment scale on the total profit of different filler methods. The total profit is the sum of the profits of the pyrolysis plant for twenty years of operation. The total profit of the packing method C#B is higher than the total profit of the other two packing methods at different processing scales. The pyrolysis plant under the mix packing method has the lowest total profit. From the perspective of profitability, the pyrolysis plant with packing method C#B is the most profitable. The larger the processing scale, the more profitable the plant. The optimal quantity of raw material feed is 9 t/h. The investment cost of coal-biomass co-pyrolysis is closely related to the production scale, the larger the production scale, the less investment per unit production capacity, and the higher the energy and material utilization rate.
3.3.3 Sensitivity analysis
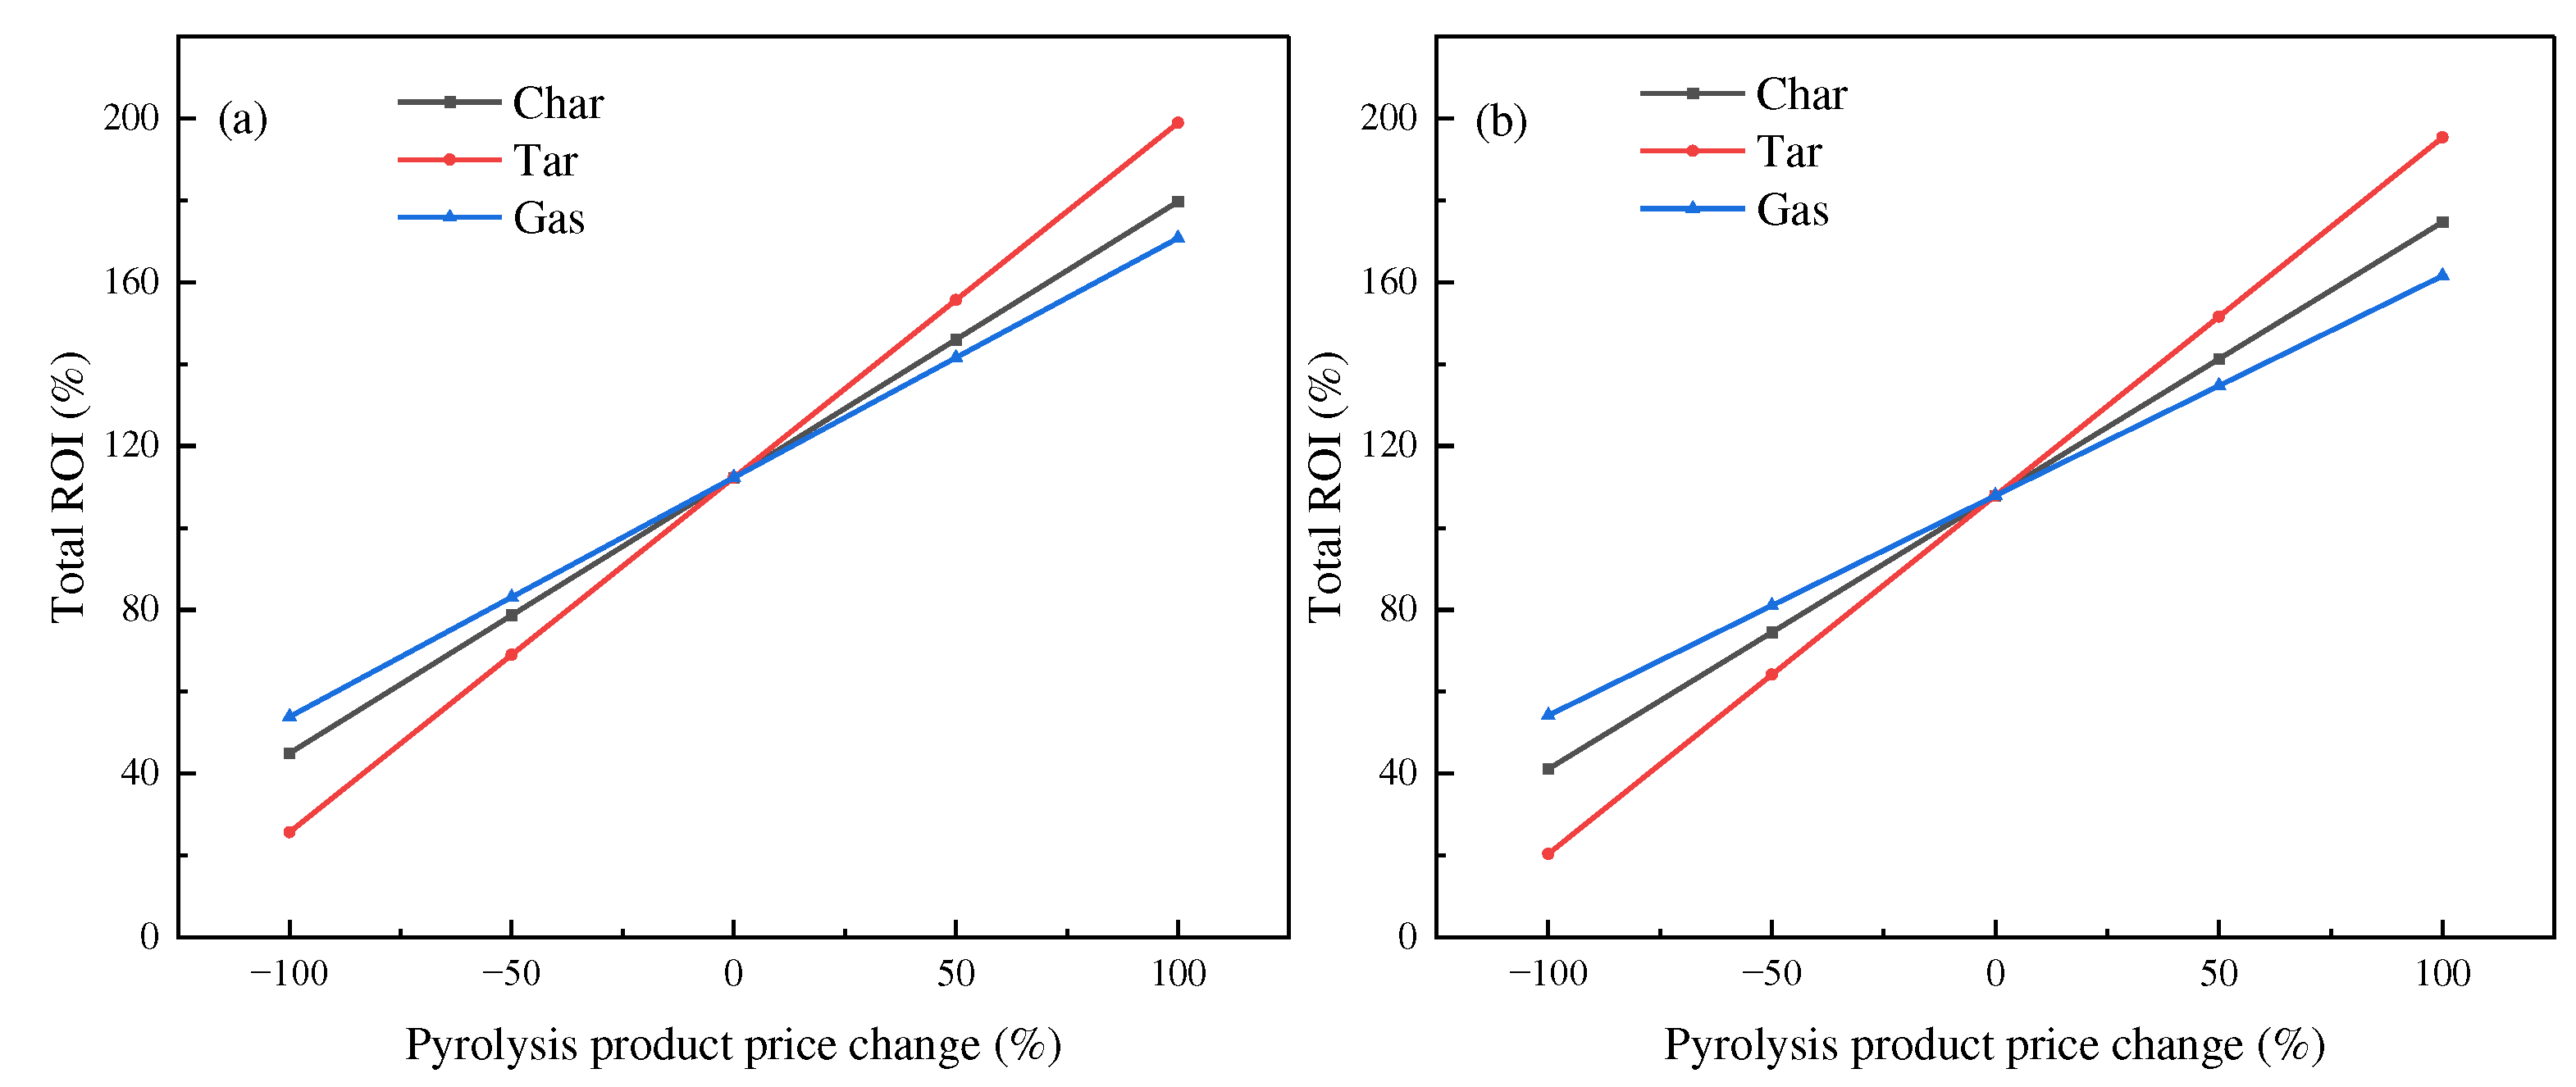
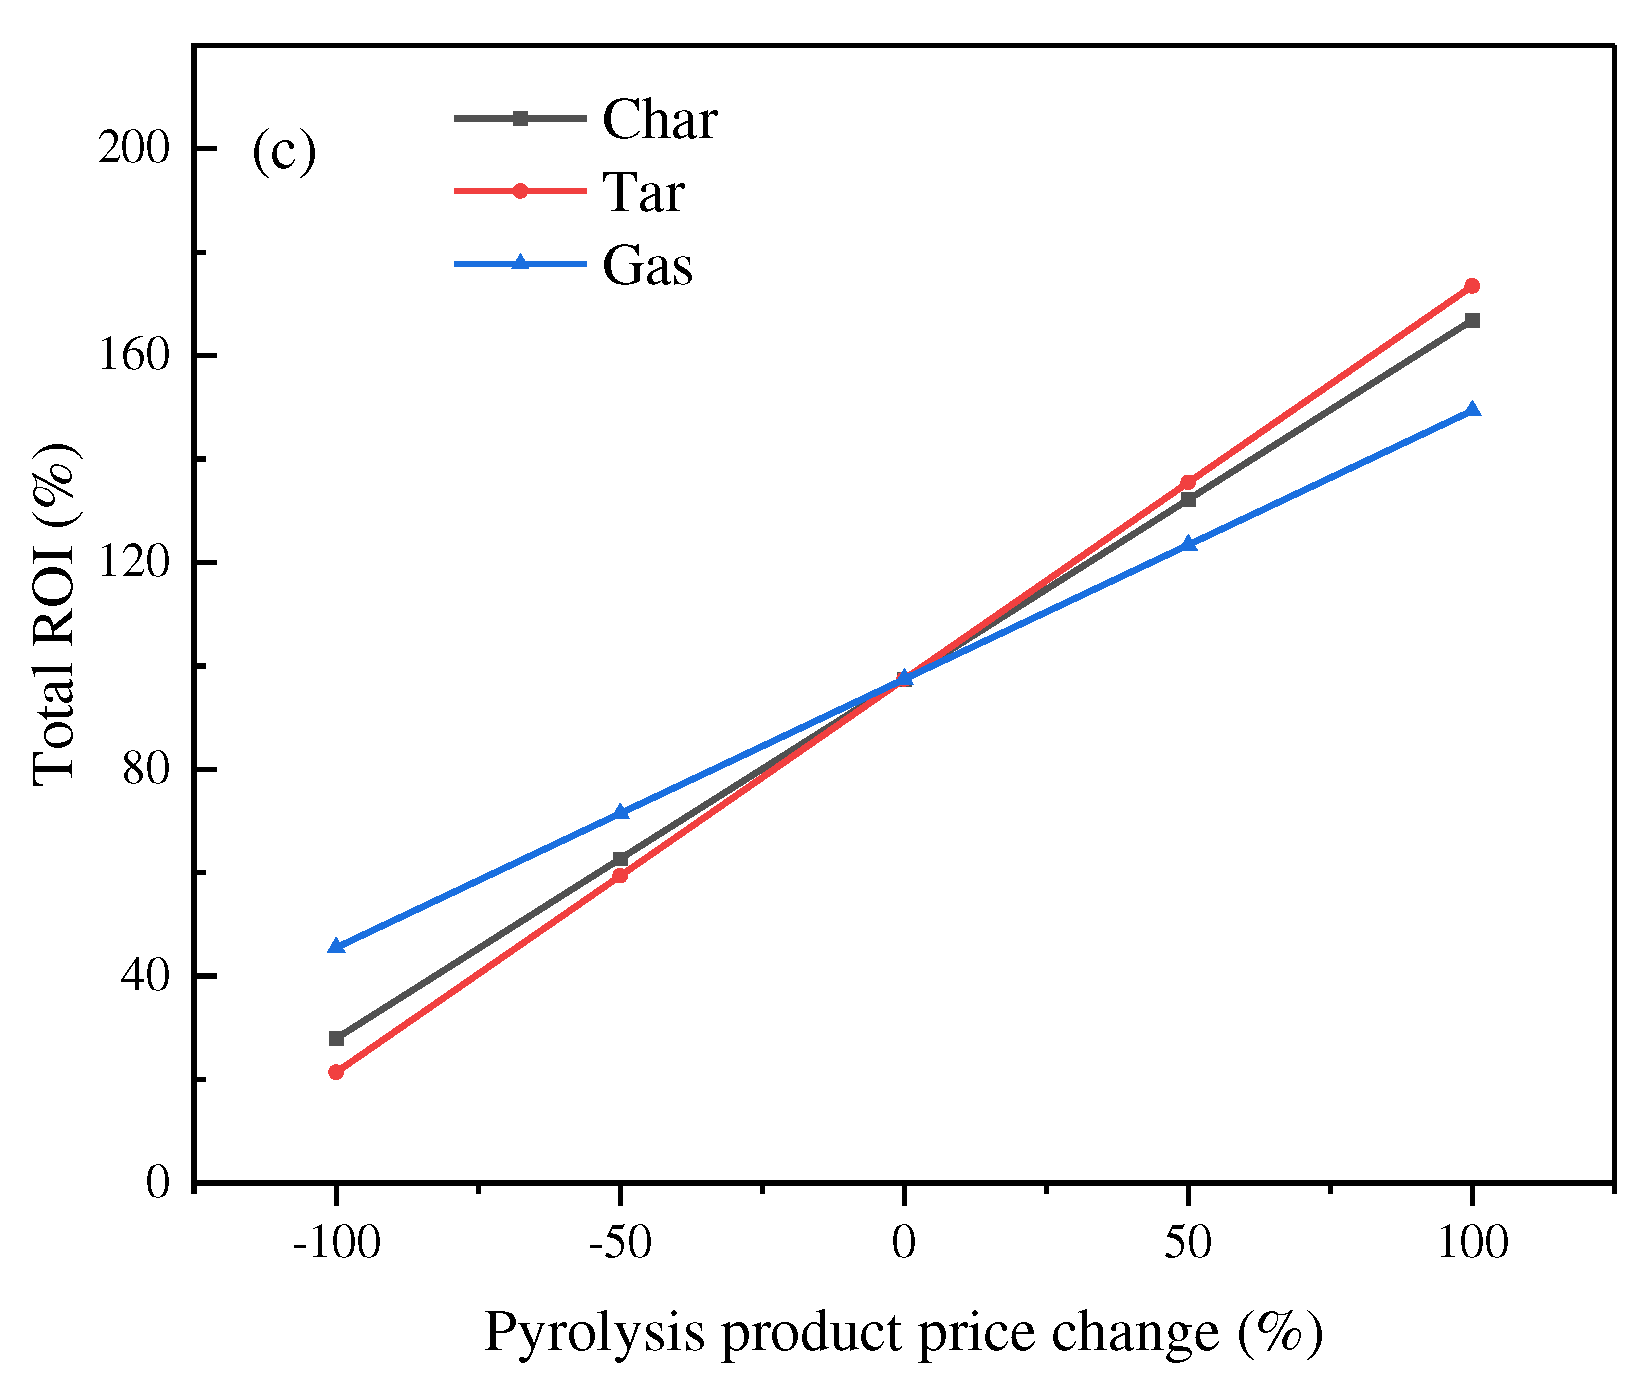
In the calculation of coal-biomass co-pyrolysis economy, the price of co-pyrolysis products is an important indicator affecting economic returns. In this paper, the sensitivity analysis of the three products of co-pyrolysis was carried out separately. The processing scale is 9 t/h. The total operating period is 20 years. It can be seen from
Figure 9 that the price change of pyrolysis oil under the three filling methods has the greatest impact on the Total ROI. The impact of pyrolysis gas price changes on the Total ROI is minimal. Pyrolysis oil under the three filling methods is the most important pyrolysis product.
4. Conclusions
(1) Firstly, the effects of pyrolysis temperature, filling method and raw material ratio on the distribution and composition of co-pyrolysis products during the process of coal-biomass co-pyrolysis were studied. The components of pyrolysis oil and pyrolysis gas under relevant conditions were analyzed to explore the synergistic effect of coal and biomass in the process of co-pyrolysis, and the optimal technological conditions of coal-biomass co-pyrolysis were obtained. The results show that the maximum pyrolysis oil production is obtained under the optimal conditions of pyrolysis temperature 500°C, loading method B#C and the raw material ratio of coal to biomass at 3:1, , so the positive synergistic effect is the largest. The contents of phenols, alcohols and ketones in pyrolysis oil were increased by increasing the proportion of biomass. The increase of coal increases the benzene, alkanes, lipids and olefin in pyrolysis oil. This indicates that the quality of pyrolysis oil from coal-biomass pyrolysis is better. When the ratio of coal to biomass is 1:3, the content of CO2 is the least, and the content of CO and H2 is higher than that of the other two ratios. Therefore, the quality of pyrolysis gas is better when the ratio of coal-biomass raw materials is 1:3.
(2) Aspen Plus V11 software was used to build the coal-biomass co-pyrolysis model for the two loading methods of stratified pyrolysis and mixed pyrolysis. The modeling scheme of each main unit in the system was determined, and the process simulation was carried out. According to the simulation results, the experimental values of pyrolytic carbon, pyrolytic oil, pyrolysis gas and water under three different raw material ratios are close to the simulated values, and the overall relative error is within 9%, indicating that the model has good reliability.
(3) The economic analysis of investment and factory construction, raw material collection and product production and product sales was carried out, and the impact of raw material processing scale on total profit was explored. The results showed that when the processing scale was 1ton/h, the pyrolysis plant is not economically efficient and is in a loss-making state. And when the processing scale is 9ton/h, the pyrolysis plant can be profitable in the first year. The sensitivity analysis explored the effects of the three pyrolysis products on the total return on investment, and the results showed that the price change of pyrolysis oil under the three loading methods had the greatest impact on the total return on investment, and the impact of pyrolysis gas price change on the total return on investment was the smallest. The larger the processing scale, the more profitable the plant. This study provides basic data and basis for the commercialization and investment and construction of coal-biomass co-pyrolysis technology.
Author Contributions
B. W; writing—review and editing, N. L; methodology, S.S.W; visualization, X.X.L; validation, R. L; supervision, Y.L.W; project administration.
Funding
The authors are grateful for the financial support from Huaneng Group science and technology research project(KTHT-U23YYJC01) and National Natural Science Foundation of China (No. 21838006).
Institutional Review Board Statement
Not applicable.
Informed Consent Statement
Not applicable.
Data Availability Statement
Data is available upon request from the corresponding author.
Conflicts of Interest
The authors declare no conflict of interest.
References
- Kwon G, Park Y-K, Ok YS, Kwon EE, Song H. Catalytic pyrolysis of low-rank coal using Fe-carbon composite as a catalyst. Energy Conversion and Management 2019;199.
- Wang G, Dai Y, Yang H, Xiong Q, Wang K, Zhou J, et al. A Review of Recent Advances in Biomass Pyrolysis. Energy & Fuels 2020;34(12):15557-78.
- Chen W-H, Naveen C, Ghodke PK, Sharma AK, Bobde P. Co-pyrolysis of lignocellulosic biomass with other carbonaceous materials: A review on advance technologies, synergistic effect, and future prospectus. Fuel 2023;345.
- Onay, Ö. Co-pyrolysis of a coal/biomass blend into biofuel: optimization of operational parameters using central composite design. Biofuels, Bioproducts and Biorefining 2022;16(4):1015-24.
- Hu X, Gholizadeh M. Biomass pyrolysis: A review of the process development and challenges from initial researches up to the commercialisation stage. Journal of Energy Chemistry 2019;39:109-43.
- Abomohra AE-F, Sheikh HMA, El-Naggar AH, Wang Q. Microwave vacuum co-pyrolysis of waste plastic and seaweeds for enhanced crude bio-oil recovery: Experimental and feasibility study towards industrialization. Renewable and Sustainable Energy Reviews 2021;149.
- Zhang M, Fan G, Liu N, Yang M, Li X, Wu Y. Tar removal in pine pyrolysis catalyzed by bio-char supported nickel catalyst. Journal of Analytical and Applied Pyrolysis 2023;169.
- Lian W, Shi W, Tian S, Gong X, Yu Q, Lu H, et al. Preparation and application of biochar from co-pyrolysis of different feedstocks for immobilization of heavy metals in contaminated soil. Waste Manag 2023;163:12-21.
- Tian B, Zhao W, Guo Q, Tian Y. A comprehensive understanding of synergetic effect and volatile interaction mechanisms during co-pyrolysis of rice husk and different rank coals. Energy 2022;254.
- Li S, Li J, Xu J. Investigating the release behavior of biomass and coal during the co-pyrolysis process. International Journal of Hydrogen Energy 2021;46(70):34652-62.
- Hong W, Zhang Y, Jiang H, Li S, Chen J, Zhang L. Co-pyrolysis of corn stalk and coal fly ash: A case study on catalytic pyrolysis behavior, bio-oil yield and its characteristics. Case Studies in Thermal Engineering 2022;38.
- Wu Z, Zhang J, Fan Y, Zhang B, Guo W, Zhang R, et al. Synergistic effects from co-pyrolysis of lignocellulosic biomass with low-rank coal: A perspective based on the interaction of organic components. Fuel 2021;306.
- Mo W, Xiong Z, Leong H, Gong X, Jiang L, Xu J, et al. Processes simulation and environmental evaluation of biofuel production via Co-pyrolysis of tropical agricultural waste. Energy 2022;242.
- Khan SR, Ciolkosz D, Vasco-Correa J, Zeeshan M. A techno-economic study to evaluate the impacts of feedstock ratio on commercial scale co-pyrolysis plants of biomass and waste tire. Journal of Analytical and Applied Pyrolysis 2022;167.
- He W, Yin G, Zhao Y, Zhang L, Xu S, Huang T, et al. Interactions between free radicals during co-pyrolysis of lignite and biomass. Fuel 2021;302.
- Chen X, Xing C, Zhang L, Jiao Z, Yang C, Qiu P. Effect of mixing ratio and active alkali and alkaline earth metals on gaseous products from co-pyrolysis of coal and corn stalks. Journal of Analytical and Applied Pyrolysis 2021;159.
- Chen X, Liu L, Zhang L, Zhao Y, Xing C, Jiao Z, et al. Effect of active alkali and alkaline earth metals on physicochemical properties and gasification reactivity of co-pyrolysis char from coal blended with corn stalks. Renewable Energy 2021;171:1213-23.
- Meng H, Wang M, Wu Z, Wang S, Zhao J, Wang Z, et al. Co-pyrolysis of platanus wood and bituminous coal: Product distributions, char pore analysis and synergistic effects. Journal of Analytical and Applied Pyrolysis 2022;167.
- Jaroenkhasemmeesuk C, Tippayawong N, Shimpalee S, Ingham DB, Pourkashanian M. Improved simulation of lignocellulosic biomass pyrolysis plant using chemical kinetics in Aspen Plus® and comparison with experiments. Alexandria Engineering Journal 2023;63:199-209.
- Rosha P, Kumar S, Ibrahim H. Sensitivity analysis of biomass pyrolysis for renewable fuel production using Aspen Plus. Energy 2022;247.
- Dwivedi KK, Pramanick AK, Karmakar MK, Chatterjee PK. Synergistic effect on co-pyrolysis mechanism and kinetics of waste coal blended with high-rank coal and biomass. Journal of Thermal Analysis and Calorimetry 2021;147(15):8323-43.
- Tian B, Wang J, Qiao Y, Huang H, Xu L, Tian Y. Understanding the pyrolysis synergy of biomass and coal blends based on volatile release, kinetics and char structure. Biomass and Bioenergy 2023;168.
- Li L, Liu G, Li Y, Zhu Z, Xu H, Chen J, et al. Release of Sulfur and Nitrogen during Co-pyrolysis of Coal and Biomass under Inert Atmosphere. ACS Omega 2020;5(46):30001-10.
- Li J, Zhu J, Hu H, Jin L, Wang D, Wang G. Co-pyrolysis of Baiyinhua lignite and pine in an infrared-heated fixed bed to improve tar yield. Fuel 2020;272.
- Huang C, Mohamed BA, Li LY. Comparative life-cycle energy and environmental analysis of sewage sludge and biomass co-pyrolysis for biofuel and biochar production. Chemical Engineering Journal 2023;457.
- Shemfe MB, Gu S, Ranganathan P. Techno-economic performance analysis of biofuel production and miniature electric power generation from biomass fast pyrolysis and bio-oil upgrading. Fuel 2015;143:361-72.
- Liu Y, Yang X, Zhang J, Zhu Z. Process Simulation of Preparing Biochar by Biomass Pyrolysis Via Aspen Plus and Its Economic Evaluation. Waste and Biomass Valorization 2022;13(5):2609-22.
- Peters JF, Banks SW, Bridgwater AV, Dufour J. A kinetic reaction model for biomass pyrolysis processes in Aspen Plus. Applied Energy 2017;188:595-603.
- Naqi A, Kuhn JN, Joseph B. Techno-economic analysis of producing liquid fuels from biomass via anaerobic digestion and thermochemical conversion. Biomass and Bioenergy 2019;130.
- Mohammed IY, Abakr YA, Mokaya R. Integrated biomass thermochemical conversion for clean energy production: Process design and economic analysis. Journal of Environmental Chemical Engineering 2019;7(3).
- Han D, Yang X, Li R, Wu Y. Environmental impact comparison of typical and resource-efficient biomass fast pyrolysis systems based on LCA and Aspen Plus simulation. J Clean Prod 2019;231:254-67.
- Shahbaz M, AlNouss A, Parthasarathy P, Abdelaal AH, Mackey H, McKay G, et al. Investigation of biomass components on the slow pyrolysis products yield using Aspen Plus for techno-economic analysis. Biomass Conversion and Biorefinery 2020;12(3):669-81.
- Unrean P, Lai Fui BC, Rianawati E, Acda M. Comparative techno-economic assessment and environmental impacts of rice husk-to-fuel conversion technologies. Energy 2018;151:581-93.
- Fivga A, Dimitriou I. Pyrolysis of plastic waste for production of heavy fuel substitute: A techno-economic assessment. Energy 2018;149:865-74.
- Aspen-Icarus: Aspen process economic analyzer. https://www.aspentech.com/Compa ny/About -Aspen Tech/ (2014). Accessed 14 Dec 2015.
- Ringer M, Putsche, V, and Scahill, J. Large-Scale Pyrolysis Oil Production: A Technology Economic Analysis. United States: N p, 2006 Web.
- Patel M, Oyedun AO, Kumar A, Gupta R. A Techno-Economic Assessment of Renewable Diesel and Gasoline Production from Aspen Hardwood. Waste and Biomass Valorization 2018;10(10):2745-60.
- Yang Z, Qian K, Zhang X, Lei H, Xin C, Zhang Y, et al. Process design and economics for the conversion of lignocellulosic biomass into jet fuel range cycloalkanes. Energy 2018;154:289-97.
- Qiu S, Zhang S, Fang Y, Qiu G, Yin C, Reddy RG, et al. Effects of poplar addition on tar formation during the co-pyrolysis of fat coal and poplar at high temperature. RSC Adv 2019;9(48):28053-60.
|
Disclaimer/Publisher’s Note: The statements, opinions and data contained in all publications are solely those of the individual author(s) and contributor(s) and not of MDPI and/or the editor(s). MDPI and/or the editor(s) disclaim responsibility for any injury to people or property resulting from any ideas, methods, instructions or products referred to in the content. |
© 2023 by the authors. Licensee MDPI, Basel, Switzerland. This article is an open access article distributed under the terms and conditions of the Creative Commons Attribution (CC BY) license (http://creativecommons.org/licenses/by/4.0/).
