1. Introduction
Polytetrafluoroethylene (PTFE) is a fluoropolymer, with a molecular structure of (-CF
2-CF
2-)
n. It is a registered trademark product of DuPont and commercially named as ‘Teflon’. PTFE possess hydrophobic surface with a surface free energy of 18.6 mJ/m
2. This hydrophobic property is the outcome of low polarizability of C-F bonds in it. Due to this distinguishable hydrophobicity, PTFE can withstand harsh thermal, mechanical and chemical conditions possessing excellent thermal stability with increased working temperature range, wear resistance, low friction and chemical inertness. These innumerable properties of PTFE make its wide usage in many fields including electronic (automobiles, semiconductors); medicinal (pharmaceuticals, medical instruments); house hold items (non-stick cookware); and environmental protection (paints, filtration membrane) [
1,
2,
3]. Even though, hydrophobic property of PTFE is an admirable property, due to this property, PTFE surfaces do not adhere to other material’s surface and moreover, it has high static voltage (5 kV ~ 25 kV) which reduces its lifetime, particularly in electronics field.
To broaden their application in various fields and to increase their lifetime, while maintaining their unique properties, surface modification of PTFE has been the focus of research in recent years. Surface modification of teflon can be done by both physical [
4,
5,
6] and chemical methods [
7,
8]. However, physical methods (such as plasma treatment [
9,
10,
11], sputtering [
12,
13], electron beam treatment [
14], radiation grafting [
15], laser treatment [
16], atmospheric pressure plasma jet [
17], particle beam irradiation and irradiation of synchrotron radiation) [
18] are generally adopted due to their high efficiency and they do not cause any damage to the PTFE membrane. A balance between surface wettability and adhesiveness between the liquid (say water) and solid surface (teflon) is of great importance to produce hydrophilic and hydrophobic surfaces for various applications. In case of chemical treatment methods, substitution of fluorine atom by hydrophilic groups (such as hydroxyl and carbonyl groups) is very difficult, as C-F bond has high bond energy of 486 kJ/mole. And so, physical methods, in particular, plasma treatment, is effective in producing hydrophilic PTFE surfaces.
Surface modification by plasma treatment is an inexpensive, clean and scalable approach as it can induce a specific surface change without altering the bulk property of the material. Plasma treatment modifies the surface through physical bombardment by energetic ions, chemical reactions at the surface and cross-linking [
1,
4,
19]. Even a short period of plasma treatment (say few seconds to a max. of 1 minute) is sufficient to bring about changes in surface wettability. By optimizing the operating parameters (such as pressure, power, time and gas flow rate) and by varying the plasma gas (such as Ar, N
2, O
2, Ar+H
2, CO
2 and NH
3) different type of functionalization can be imparted on the surface of the material [
20,
21]. Liu et al. [
22] studied the effects of dielectric barrier discharge (DBD) plasma surface treatment on three different polymer surfaces, viz., polytetrafluoroethylene (PTFE), polyimide (PI) and poly(lactic acid) (PLA). The influence of different operating parameter, including plasma power, plasma duration and electrode gap were analyzed and found that plasma duration plays a significant role for PTFE and PI, whereas, electrode gap plays a significant role for PLA. All the polymers show improvement in wettability for all parameters indicating appreciable changes in their surface chemistry. Guruvenket et al. [
23] studied the plasma surface modification of polystyrene (PS) and polyethylene (PE). They used argon and oxygen plasma were used to modify the surface of the polymers with two different parameters including different microwave power and treatment time. The study showed that increase in microwave power increased the wettability of both the polymers, PS and PE, attributed to the surface functionalization and CASING. Bhowmik et al. [
24] investigated the changes occurred in wetting and physicochemical characteristics of polypropylene (PP) when it is exposed to a DC glow discharge. The effect of DC glow discharge across three different electrodes including copper, nickel and stainless steel on PP was studied in detail. The study revealed that stainless steel electrode increased the surface energy and polar component of PP to a larger extent when compared with nickel and copper electrodes. In this work, the hydrophobicity of PTFE is reduced by means of plasma treatment using three different gases, viz., N
2, O
2 and (Ar+H
2). Different parameters used in the plasma treatment, such as, different active gases, flow rate of carrier and active gases, RF power, distance between the sample and plasma source, duration etc., and the surface modifications caused by the plasma treated are well characterized and analyzed.
2. Materials
The PTFE sheet roll was purchased from Flontec Co., Ltd, South Korea and different gases including Ar, N2, O2 and Ar+H2 (4%) was supplied from Korea standard gas (KSG), South Korea.
2.1. Instrumentation Methods
Attenuated Total Reflectance Fourier Transform Infrared Spectrometer ATR FT-IR from Perkin Elmer, the MB3000 ATR FT-IR spectrometer, was employed to acquire the FT-IR spectrum. A resolution of 4 cm-1 was obtained in the range 400-4000 cm-1 of the infrared spectrum. The neat PTFE and plasma treated PTFE was placed on the sample disc and the spectrum was recorded. For each sample, the spectrum was recorder at three different spots on the PTFE to observe the uniformity in the sample. In order to obtain high-resolution XPS spectra, K-Alpha (Thermo Scientific) was utilized. CasaXPS software was used for deconvolution of high-resolution XPS spectra. A high-resolution scanning electron microscope (FESEM, Hitachi S-4800) at an accelerating voltage of 30 kV was employed to examine the morphology of the neat PTFE and plasma modified PTFE. In order to characterize the prepared materials, physicochemical techniques including field emission scanning electron microscopy (FESEM) were employed. A Dataphysics Instruments OCA 20 model was used to determine the water contact angle between the neat PTFE and modified PTFE. There is an optical contact angle measuring instrument that utilizes video-based technology. The measuring range of the instrument is 0 to 180°, and the measurement precision of the video system is +/-0.1°. For each sample, contact angle measurement was taken in five different areas and the average value is denoted.
2.2. Plasma Treatment Procedure
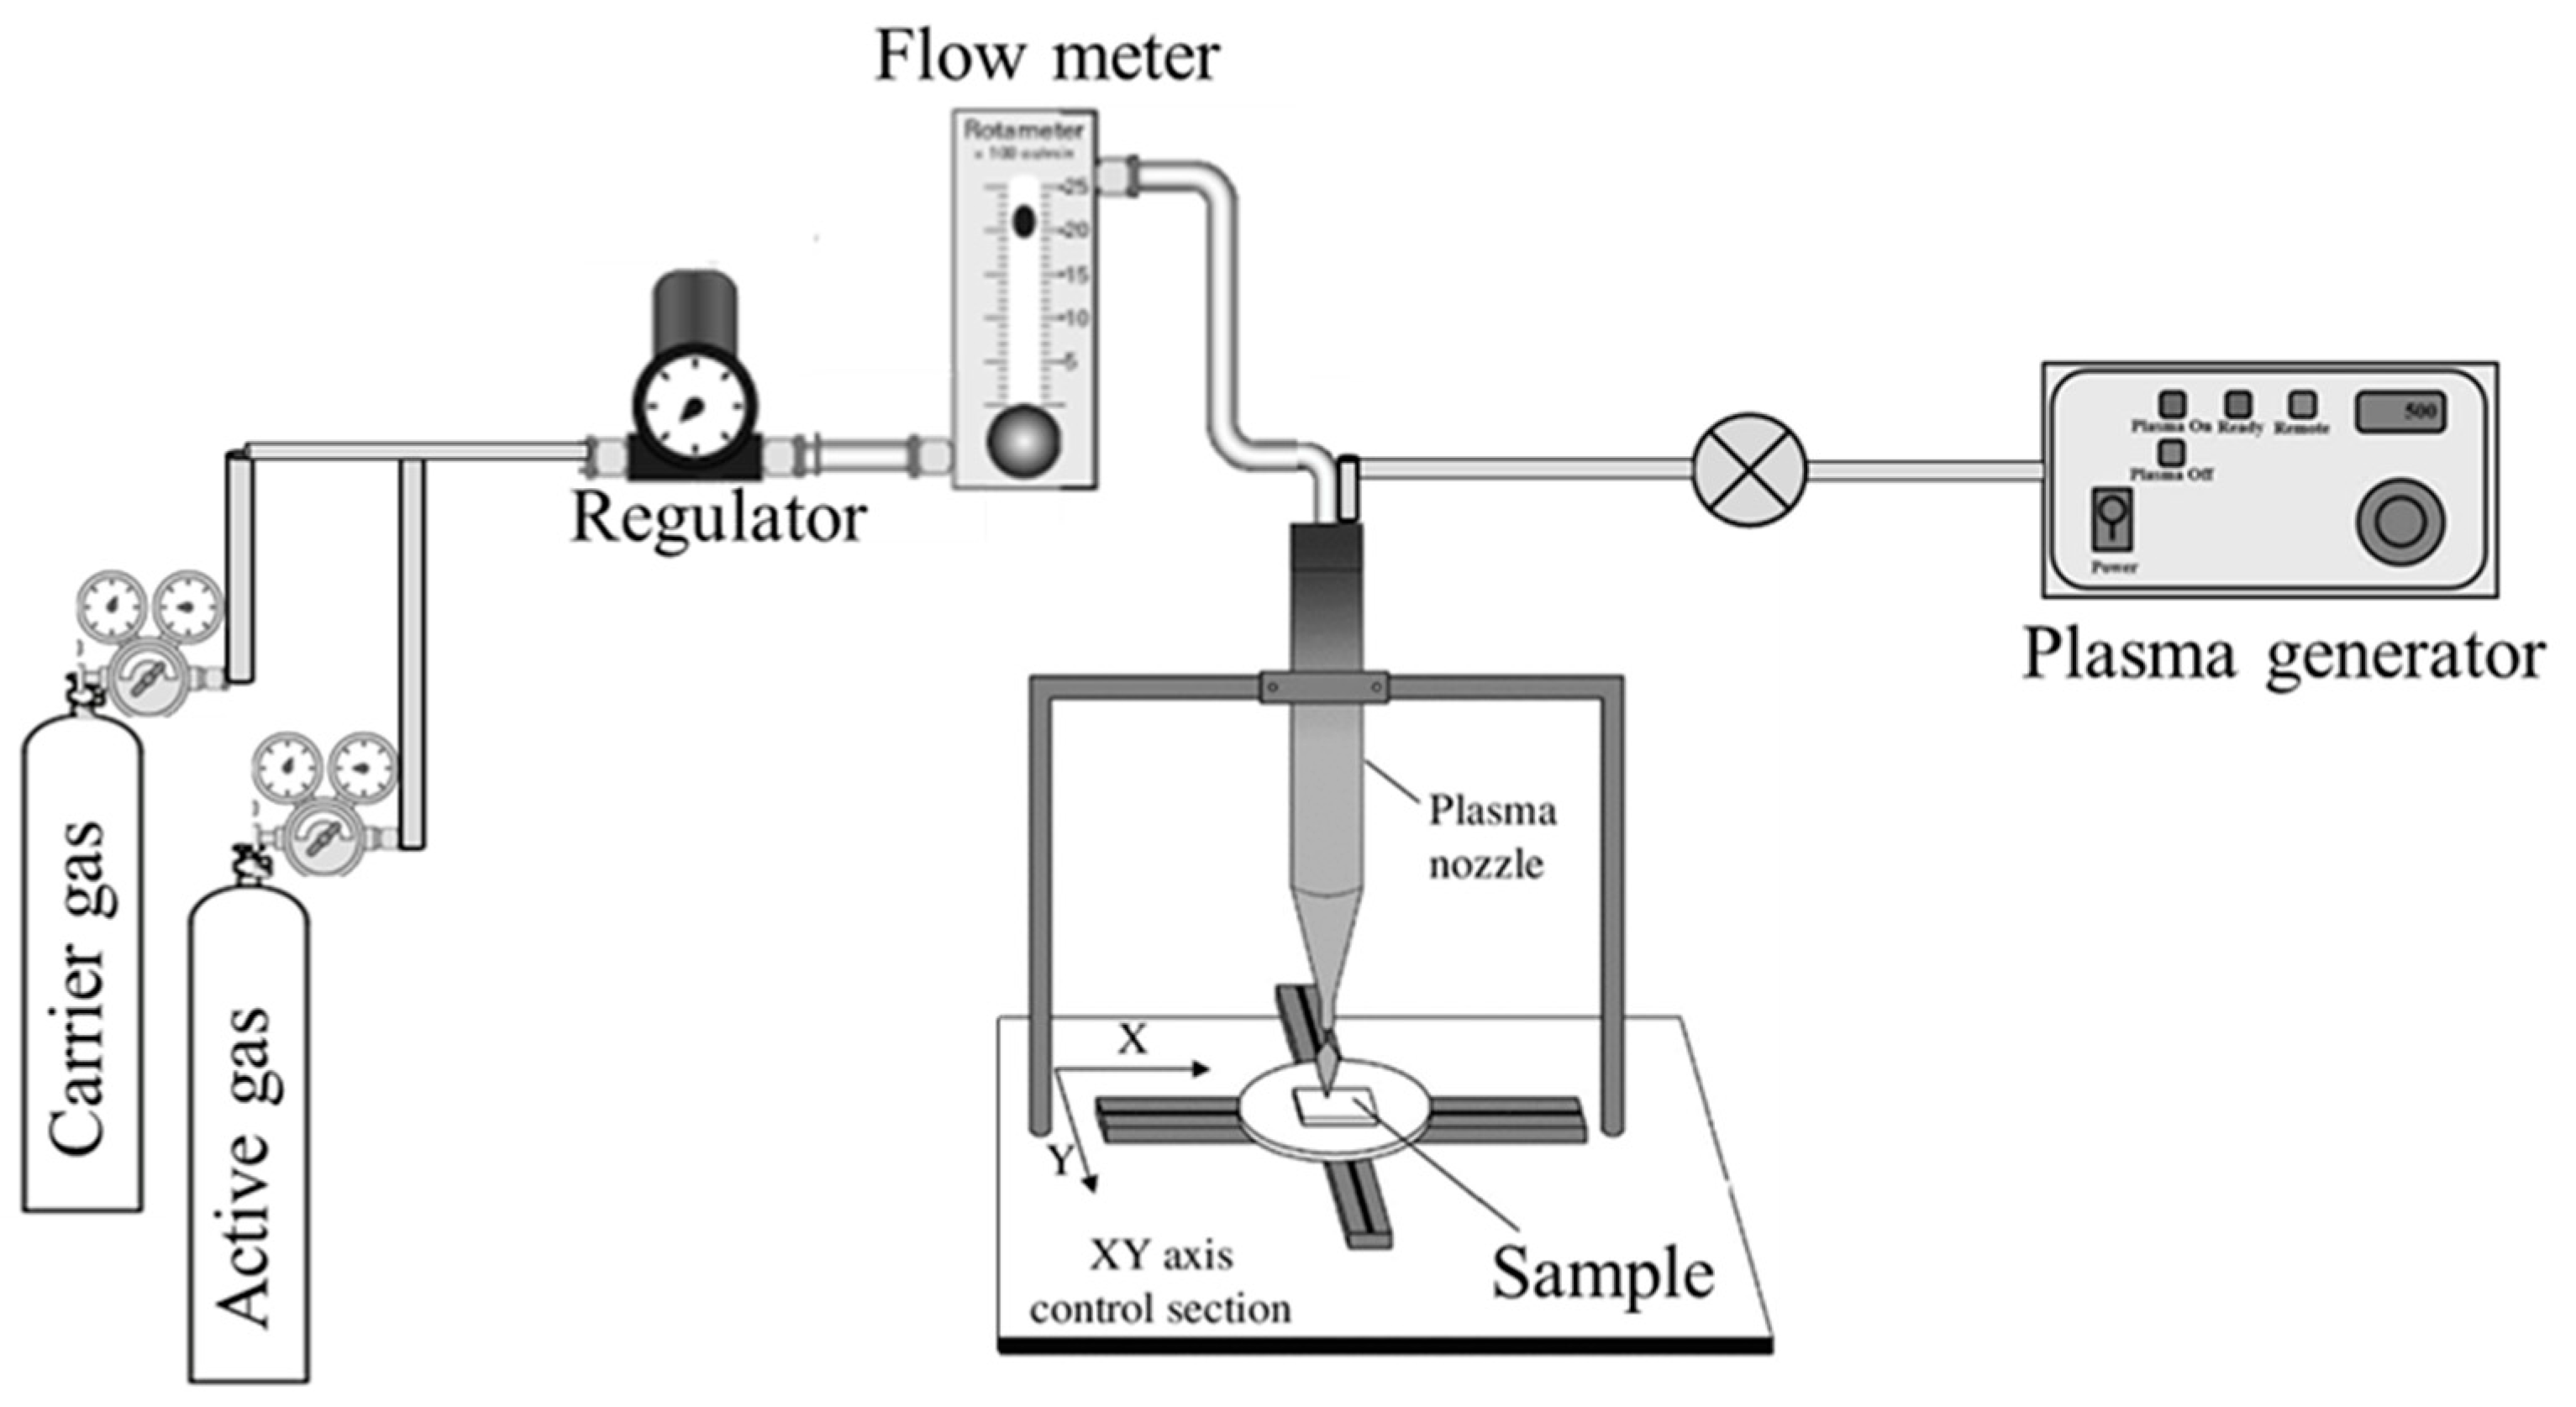
The schematic representation of atmospheric plasma instrument is given in
Figure 1. It consists of sample holder, plasma generator, plasma nozzle and flow meter. The sample holder is flat and large enough to place the sample in horizontal direction. It can be moved to and fro horizontally up to a specific distance. The plasma generator acts as a source of plasma, whose intensity is adjusted using RF power and passes through the plasma nozzle to the surface of the sample. The flow rate of the carrier gas and active gas is controlled by the flow meter. Generally, argon gas is used as a carrier gas and N
2, O
2, H
2 or mixture of gases is used as an active gas. There is a space provided just above the plasma nozzle, where the carrier gas, active gas and plasma source are mixed together before depositing on the teflon surface.
To start with, teflon sheet was cut into 15 x 15 cm and placed on the sample holder. Vacuum was applied to ensure proper attachment of the teflon sheet to the sample holder. Care should be taken to avoid wrinkles of the teflon sheet. The sheet should be placed as flat as possible without any wrinkles on it. There are many parameters (such as flow rate of carrier and active gas; RF power; distance between the sample and plasma source; and duration of plasma source) that has to be adjusted for plasma treatment. After several trials, these parameters were fixed.
2.3. Flow Rate of Carrier Gas
In case of plasma treatment, Ar is used as the carrier gas. In general, the flow rate of carrier gas should be much larger than the flow rate of active gas. Three different flow rates of carrier gas were used, i.e., 4.0 L/min, 4.5 L/min and 5.0 L/min. It was found that 4.5 L/min was optimum flow rate for all conditions. Increasing or decreasing the flow rate from 4.5 L/min increases the contact angle of water. For checking all these parameters, soon after the plasma treatment, one or two drops of DI water was placed on the plasma treated sample using a syringe, to find the effect of plasma treatment effectively.
2.4. Flow Rate of Active Gas
Different active gases [i.e., N2, O2 & (Ar+H2)] were chosen to modify the surface of PTFE and hence increase the wettability. These three different gases were chosen due to the hydrophilic nature of these gases. Once these gases are adsorbed on the surface of PTFE, it can abstract hydrogen and can produce several hydrophilic groups on the surface of PTFE. In general terms, the flow rate of active gas should be much less than the carrier gas. Five different flow rates of these active gases were chosen (i.e., 10, 15, 20, 25 and 30 mL/min). Other than 20 mL/min flow rate, all other flow rate showed increased wettability, when checked using syringe. And so, 20 mL/min was chosen as the optimum flow rate for active gas.
2.5. RF Power
The plasma power/RF power also plays an importance role in producing changes on the surface of PTFE. RF power is varied between 100 – 200 W (i.e., 100, 125, 150, 175 and 200 W). It was found that 150 W is appropriate, and increasing the RF power to 175 and 200 W, leads to discontinuous plasma source.
2.6. Distance
A square shaped sample holder (15 x 15 cm) is used to place the PTFE sheet and a rectangular plasma nozzle (15 x 2 cm) is used to deposit the plasma onto the PTFE sheet. The plasma nozzle can be moved in a horizontal direction, so that the plasma could be deposited all over the sample (i.e., PTFE sheet). The distance between the sample holder and the plasma nozzle can be varied between 1 – 3 mm (i.e., 1, 2 and 3 mm). It was found that 3 mm distance was found to be appropriate. Both 1 mm and 2 mm distances cause rolling of the PTFE sheet along with the plasma nozzle and so the plasma treatment was not effective in both the conditions.
2.7. Duration of Plasma Treatment
Duration of plasma treatment can be varied by changing the speed and repetition time. Speed can be altered by changing the numbers between 1 – 7, where, number 1 is very slow and number 7 is very fast. The speed and repetition time is set so that the plasma duration is varied between 1 – 4 minutes (i.e., 1, 2, 3 and 4 mins). These four-time duration is followed for all active gases [i.e., N2, O2 & (Ar+H2)] and the differences in surface modification was analyzed. Plasma duration was not increased more than 4 mins, due to the fact that increased plasma duration can bring about degradation of PTFE sheet. For N2 plasma treatment, the following parameters were used:
Flow rate of Ar: 4.5 L/min
Flow rate of N2: 20 mL/min
RF power: 150 W
Distance between the plasma nozzle and teflon sheet: 3 mm
Duration of plasma treatment: 1, 2, 3 & 4 minutes.
A pinkish glow of plasma could be seen with naked eyes when using N
2 as active gas. Similar parameters were followed for O
2 and Ar+H
2 (4%) gases. A white glow is seen for O
2 plasma and a pale pink glow is seen for Ar+H
2 (4%) plasma.
Table 1 shows the details of different parameters used for different active gases (i.e., N
2, O
2 & Ar+H
2). Soon after plasma treatment, the PTFE sheet was carefully removed from the sample holder and packed in a zip-lock cover, to avoid its exposure to atmospheric gas. The plasma treated side of the PTFE sheet was marked and several analyses were performed.
3. Results and Discussion
After several treatments, the plasma conditions such as the volume flow rate of the carrier and active gasses, plasma/RF power, distance between the plasma nozzle and sample are fixed, while, the plasma duration and active gasses are varied. Very less plasma duration (i.e., 1, 2, 3 and 4 mins) was adopted, considering that plasma treatment can bring about surface modifications within few minutes and prolonged plasma exposure can cause degradation to the PTFE sheet [
4]. For all the conditions of plasma treatment, the hydrophobic nature of neat teflon is decreased, due to the incorporation of nitrogen and oxygen atom.
3.1. FT-IR Analysis
The surface modification of teflon by plasma treatment, using N
2, O
2 and (Ar+H
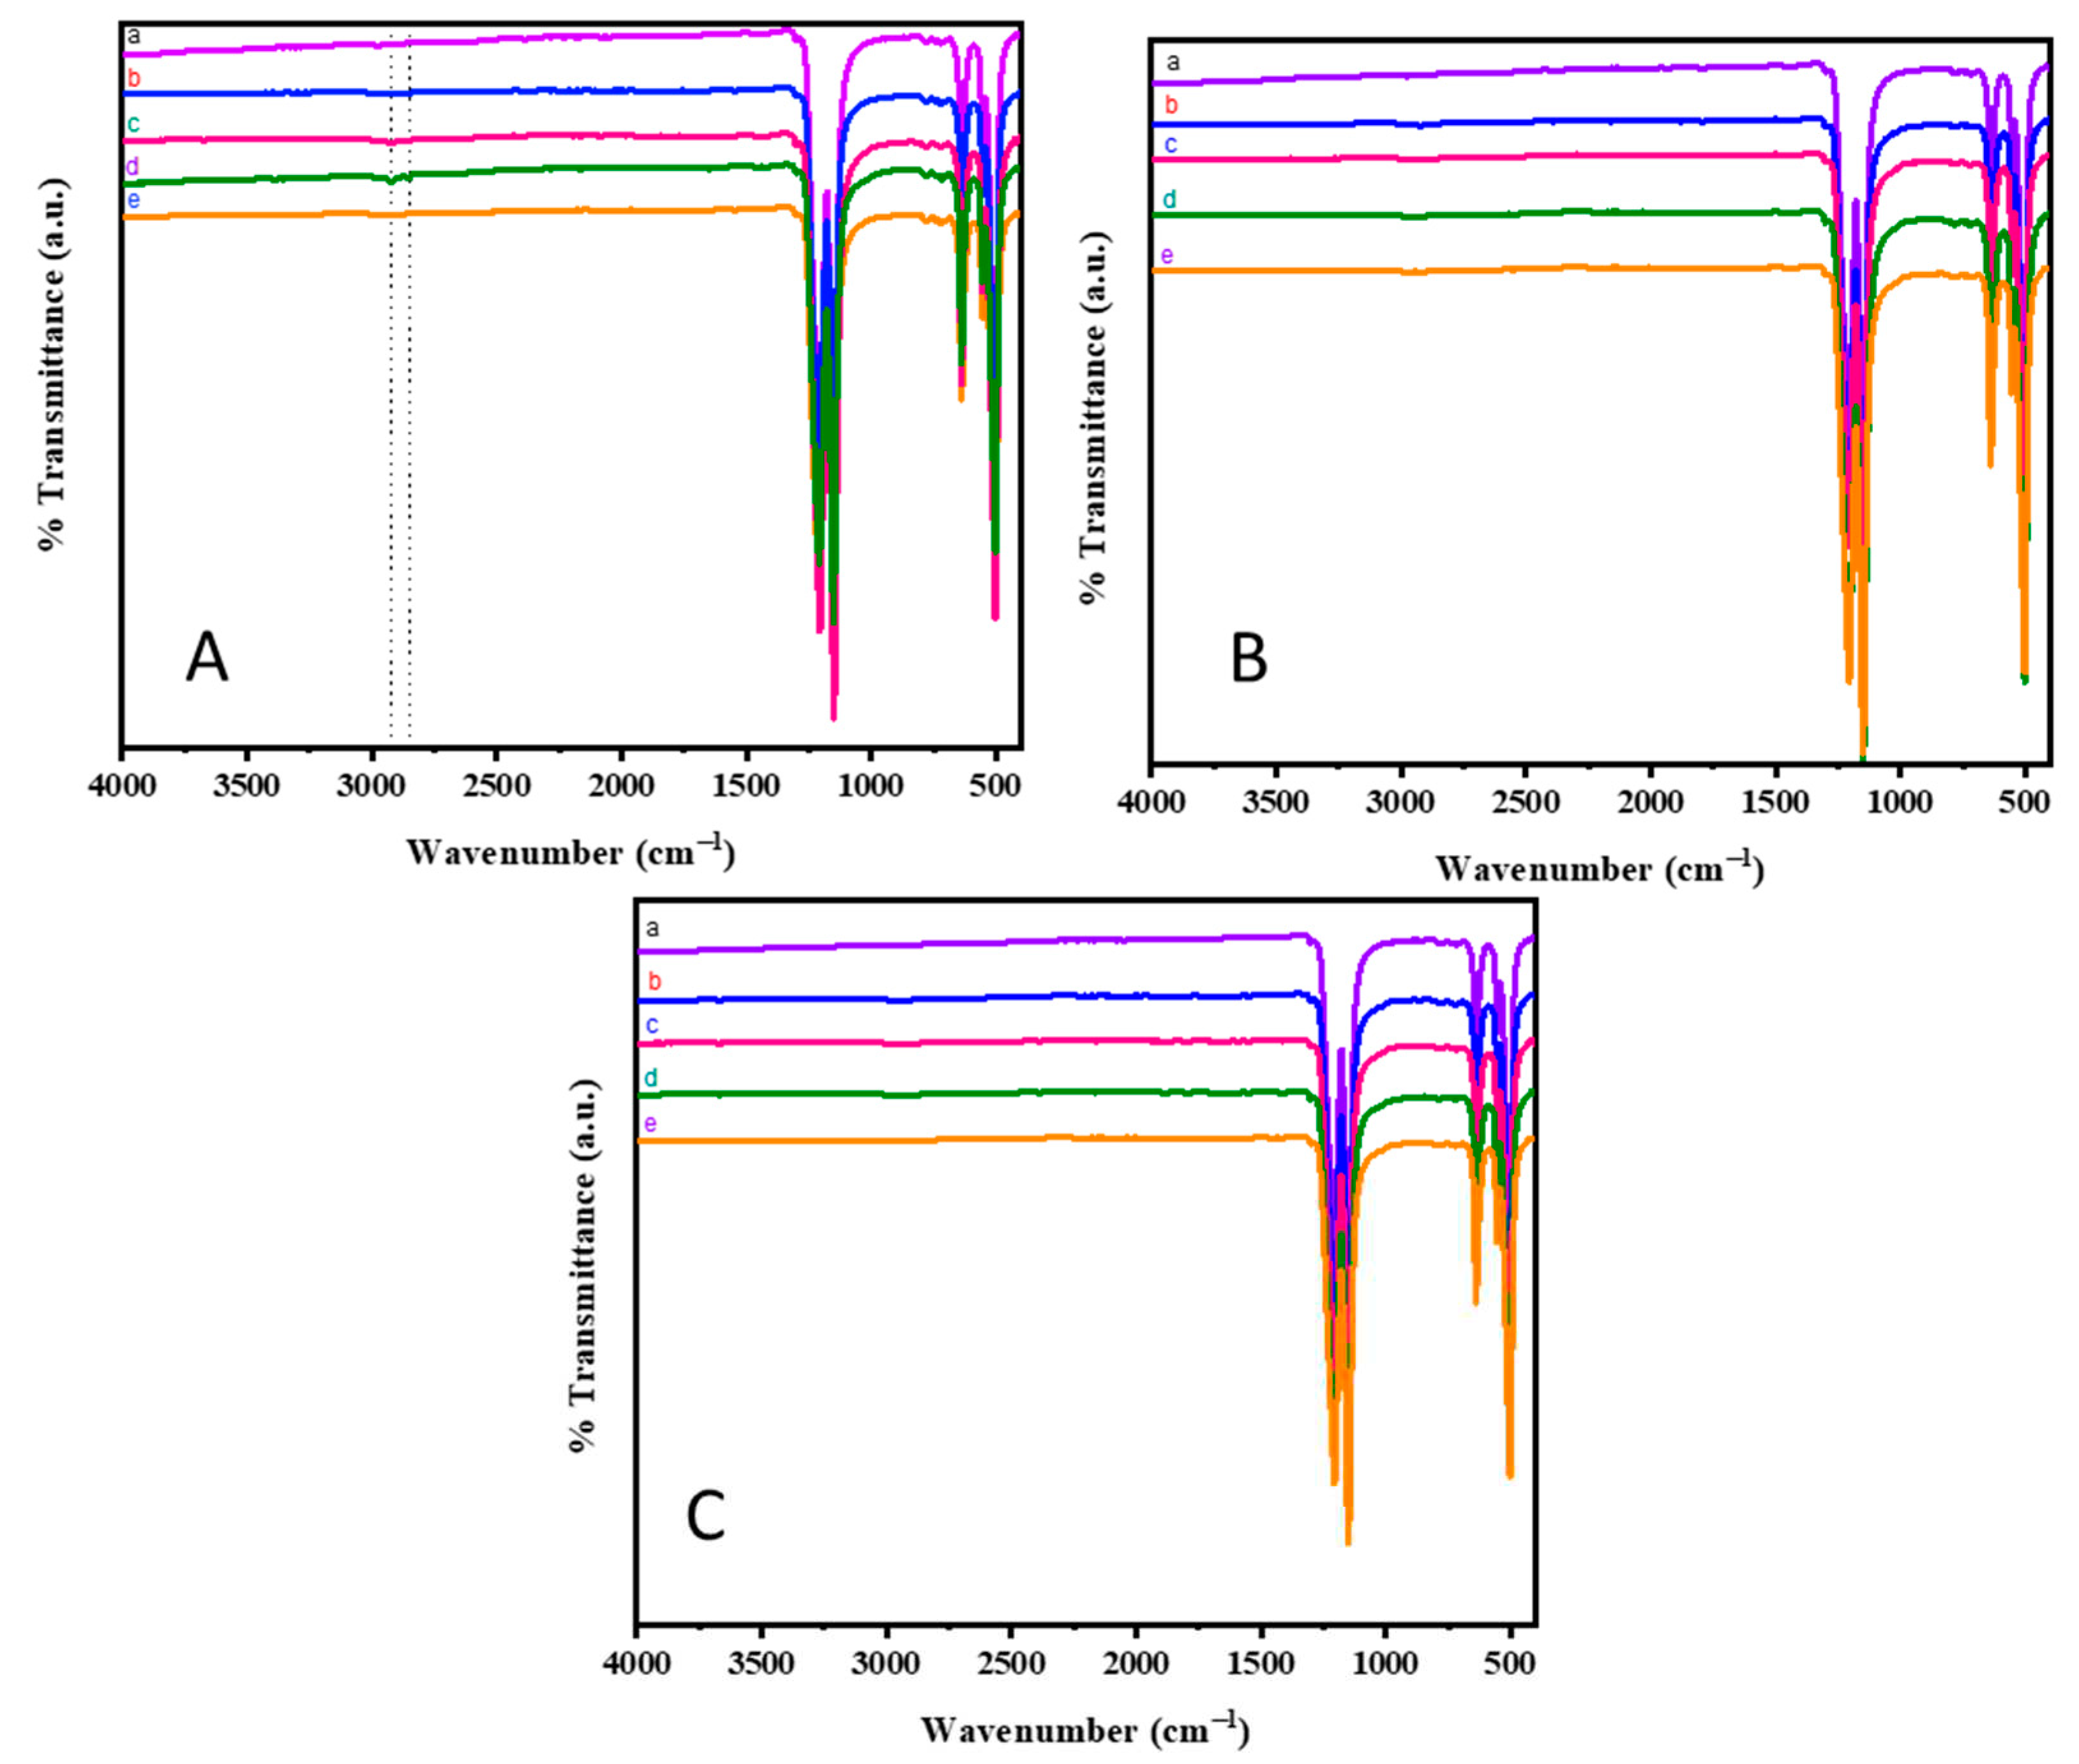
2) as active gases is analyzed by FT-IR spectroscopy and represented in Figs. 2A-C. As evidenced, the neat PTFE sheet [
Figure 2(Aa)] shows absorption band at 1205 and 1149 cm
-1, due to the asymmetric and symmetric stretching vibrations of C-F bond, respectively. In addition to it, the bands at 638, 525 and 501 cm
-1 corresponds to CF
2 rocking, CF
2 deformation and CF
2 wagging modes, respectively [
25,
26]. N
2 plasma treatment for 2 mins [
Figure 2(Ac)] and 3 mins [
Figure 2(Ad)] showed a slight modification in the absorption spectrum. In addition to the CF
2 bands, the band due to –CH also appears at 2918 and 2845 cm
-1, respectively, which corresponds to the asymmetric and symmetric stretching vibrations of C-H bond. Whereas, the N
2 plasma duration of 1 min [
Figure 2(Ab)] and 4 mins [
Figure 2(Ae)] do not show any modifications w.r.t. the neat teflon. Moreover, the FT-IR spectra of O
2 and (Ar+H
2) plasma treatment (
Figure 2B,C) do not show any visible changes in addition to the CF
2 peaks. It could be visualized that the plasma treatment brings about very minute modifications on the PTFE surface that is not observed in the FT-IR spectrum. Even though N
2 and O
2 plasma treatments tend to form C-N, C-O and C-H bond on the surface of teflon, only changes w.r.t. C-H bond could be observed in FT-IR spectrum. Interestingly, N
2 plasma treatment for 3 mins show the appearance of C-H stretching vibrations [
4,
27].
3.2. Water Contact Angle Analysis
The contact angle measurements were taken on the same day of plasma treatment to minimize any changes in the surface of the PTFE. A small part of neat PTFE membrane and plasma treated PTFE membrane (about 3 x 1 cm) was placed on the glass slide. Proper precaution was taken to place the PTFE membrane without folding it. A high-resolution camera with 6X zoom lens was used to capture the contact angle formed by the water droplet on the surface of teflon membrane. A micro-syringe containing DI water was used and contact angle measurements were taken by placing 2µL of DI water onto the membrane surface.
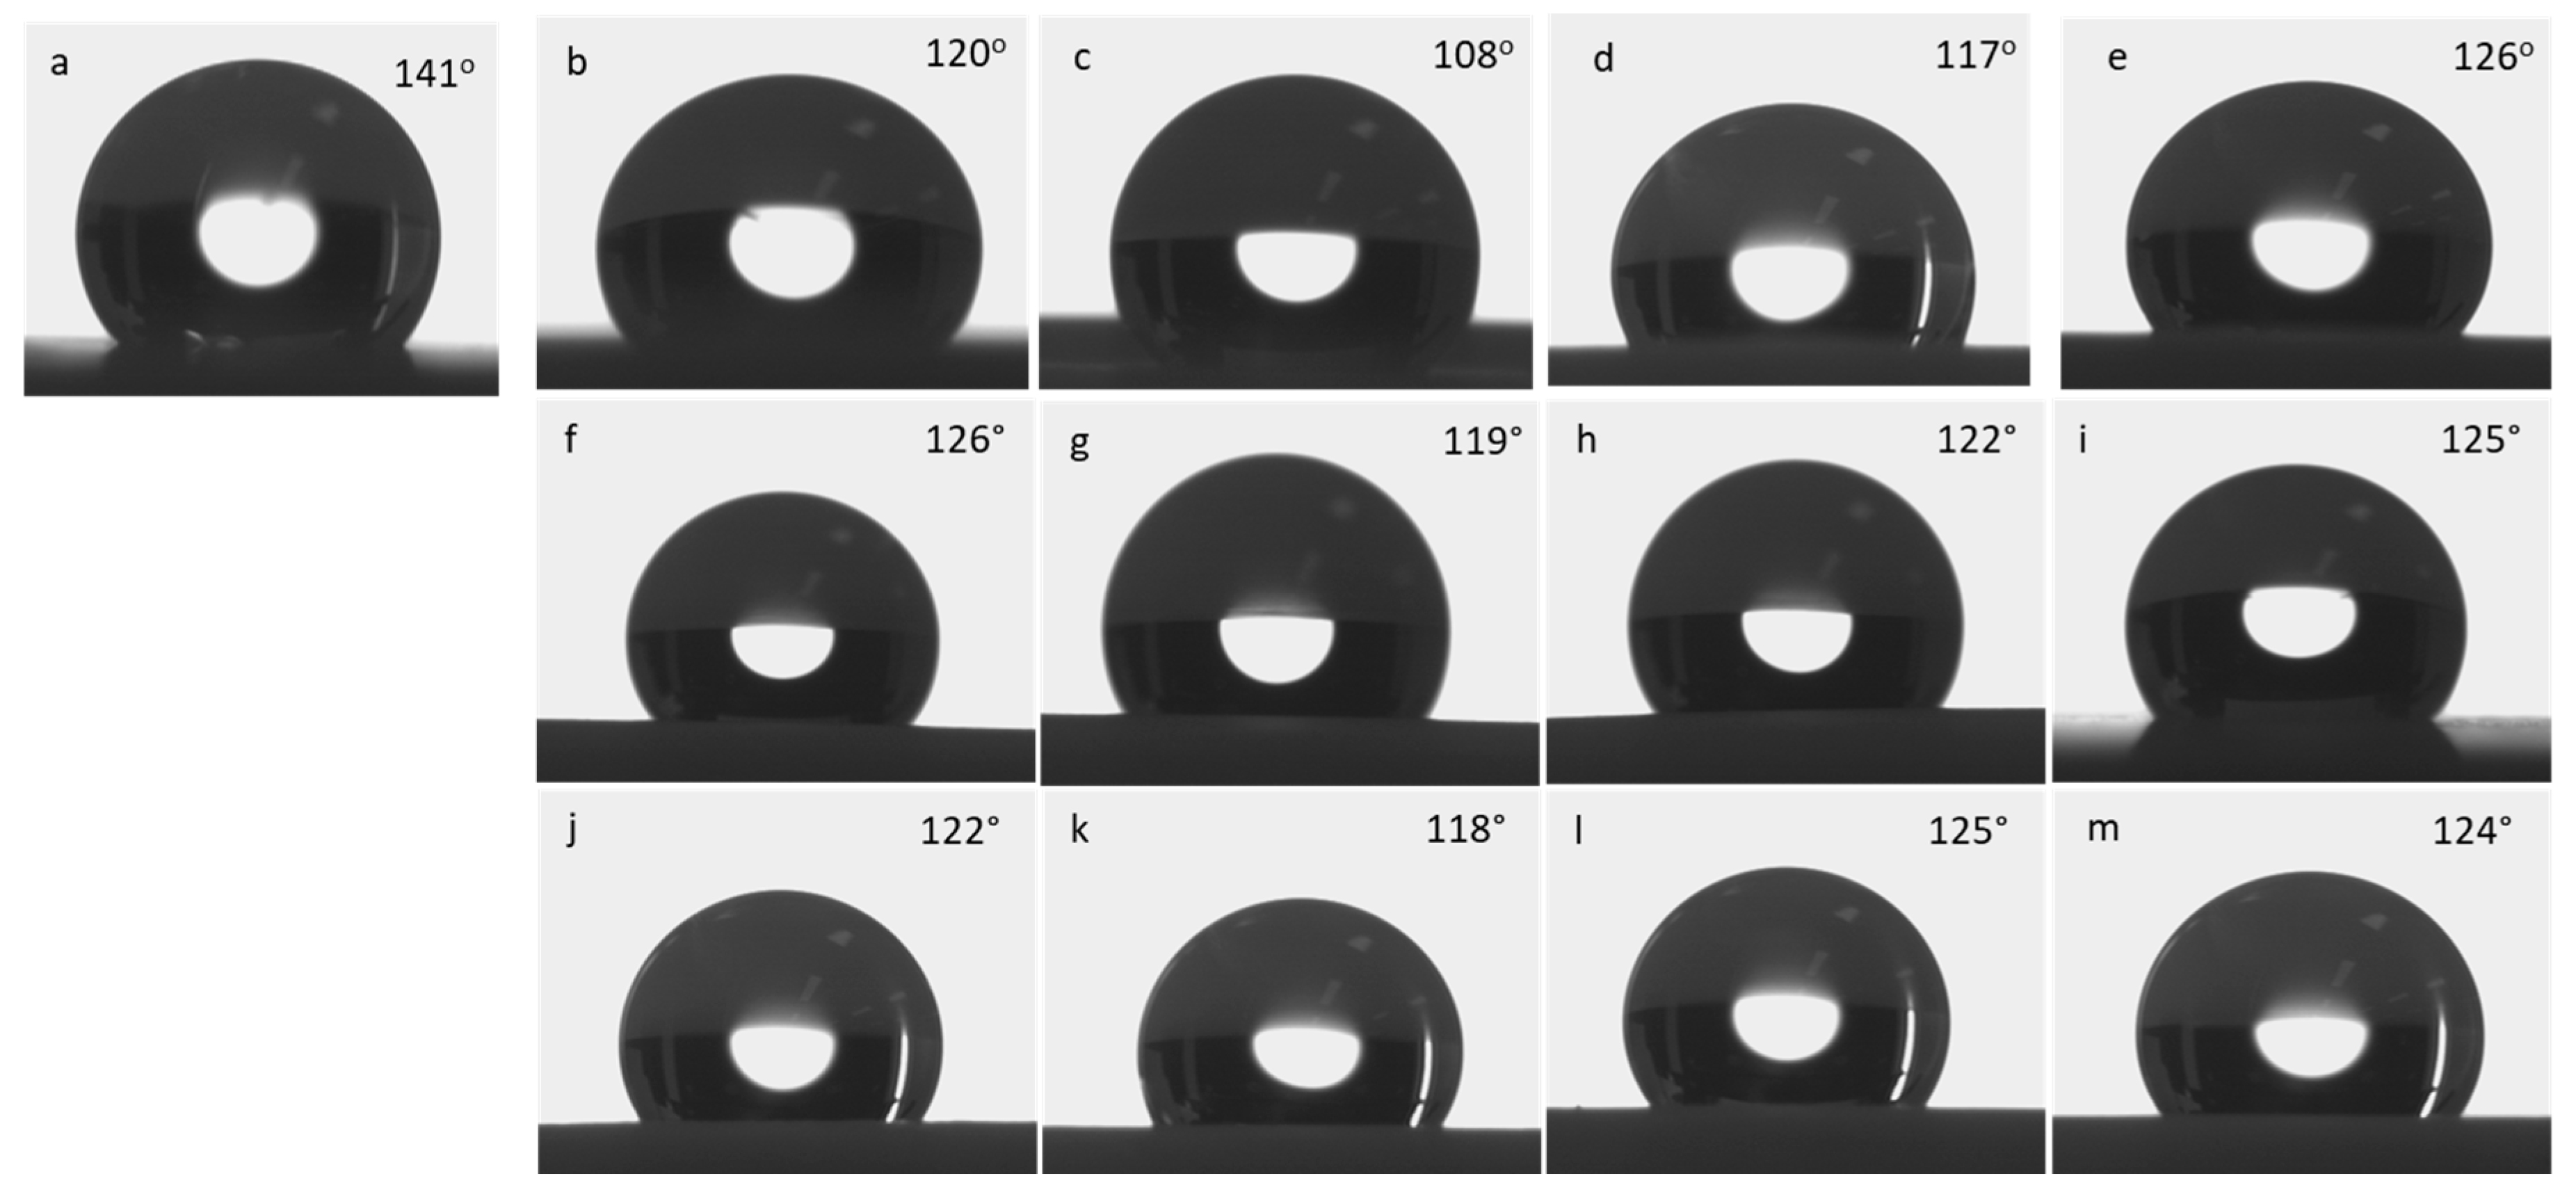
Figure 3 shows the static water contact angle measurements of neat PTFE and N
2, O
2 and (Ar+H
2) plasma treated PTFE as a function of plasma exposure time. In general terms, if the contact angle formed by the water droplet in contact with material’s surface is < 90°, then the surface is said to be hydrophilic; if it is > 90°, then the surface is said to be hydrophobic; and if it is > 150°, then the surface is said to be superhydrophobic. When a water droplet falls on a hydrophobic surface, the repulsive forces between the solid-air-liq tends to create a spherical bead upon a material’s surface. Whereas, with respect to a hydrophilic surface, the attractive forces will allow the water to spread, which results in wetting of the material’s surface [
28]. The neat PTFE membrane shows a contact angle of 141°, representing very high hydrophobic surface (
Figure 3a). Whereas, the modified PTFE membrane with N
2 plasma treatment, shows reduced contact angle, regardless of plasma exposure times (
Figure 3b–e). Interestingly, N
2 plasma exposure for 2 mins reduces the hydrophobic nature of PTFE membrane from 141° to 108° (
Figure 3c). Moreover, increased plasma treatment of 3 and 4 mins did not show any positive effect on PTFE surface. Therefore, N
2 plasma exposure for 2 mins is sufficient to bring changes on the PTFE surface. And increased plasma exposure could damage the material’s surface and do not show any improvement. In spite of this, the other two plasma treatments [i.e., O
2 and (Ar + H
2)] reduces the contact angle only to a lesser extent up to 119 and 118°, respectively (Figs. 3g & k). Similar to N
2 plasma treatment, even for O
2 and (Ar+H
2) plasma treatment, increasing plasma exposure times, such as 3 and 4 mins do not reduce the contact angle further and 2 mins seems to be effective [
19,
26,
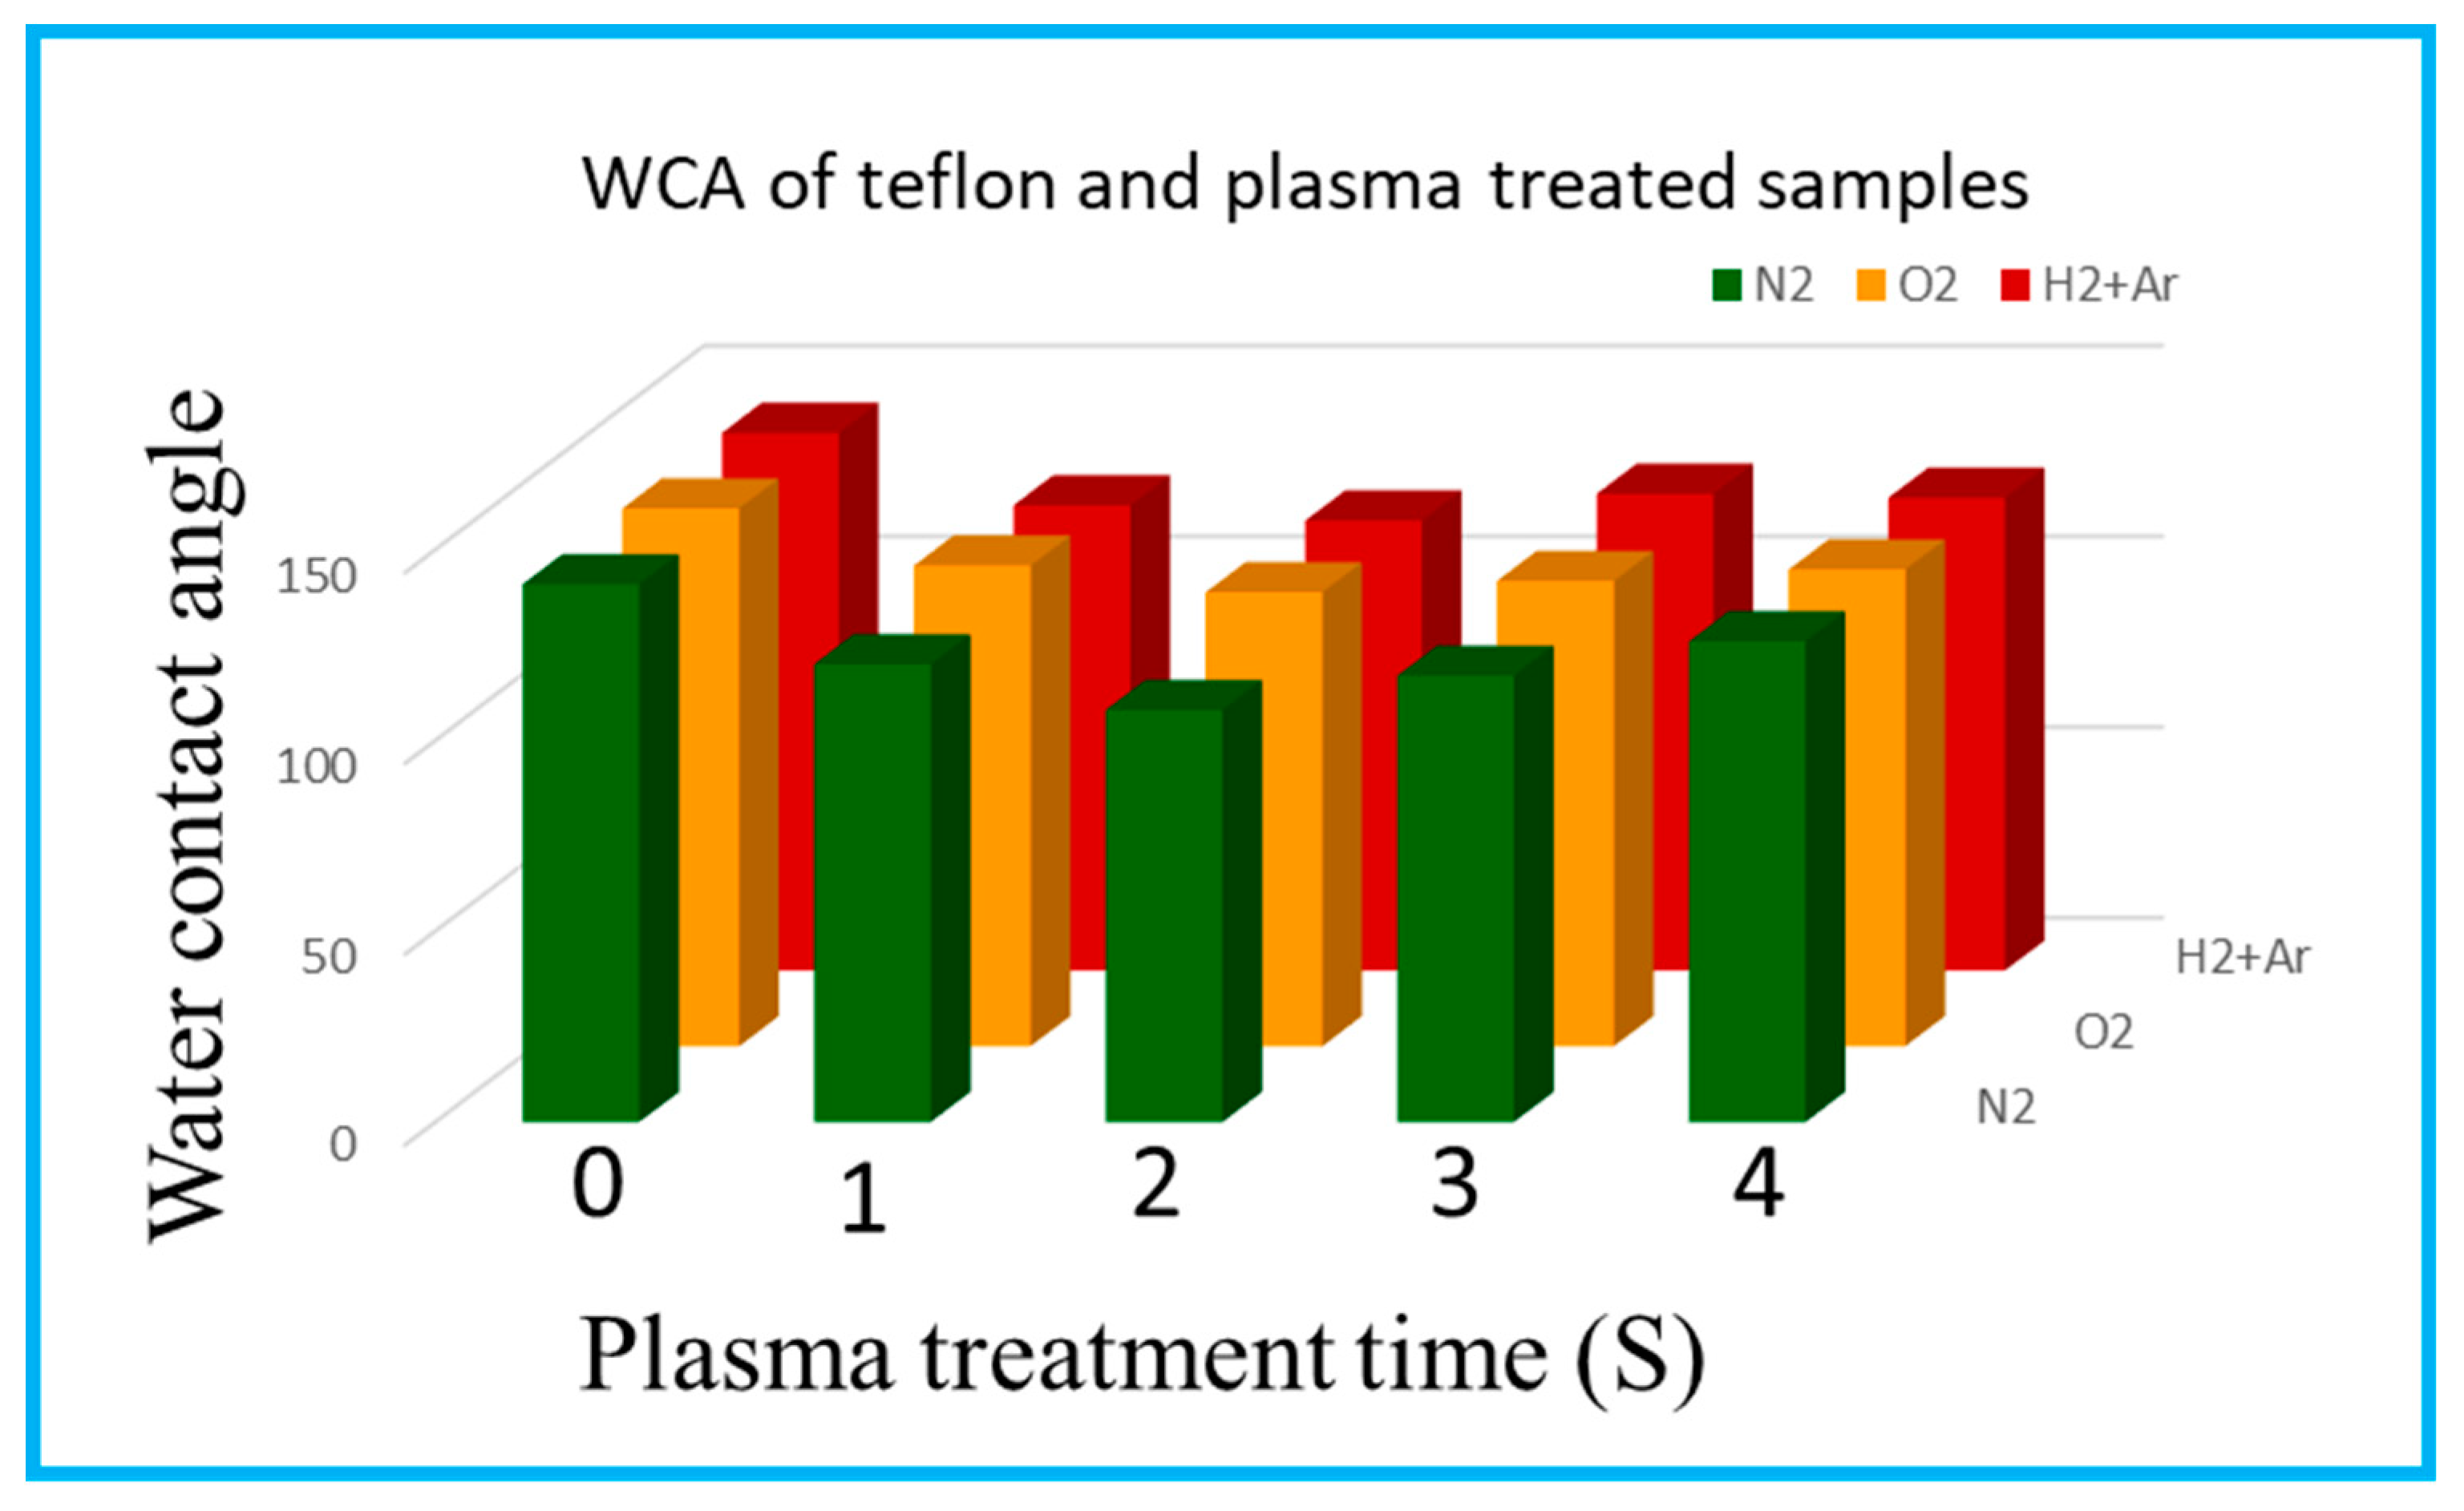
27]. Hence, among the three plasma treatment conditions, N
2 plasma seems to be effective even with very less plasma exposure time of 2 mins [
29] (
Figure 4).
3.3. SEM Analysis
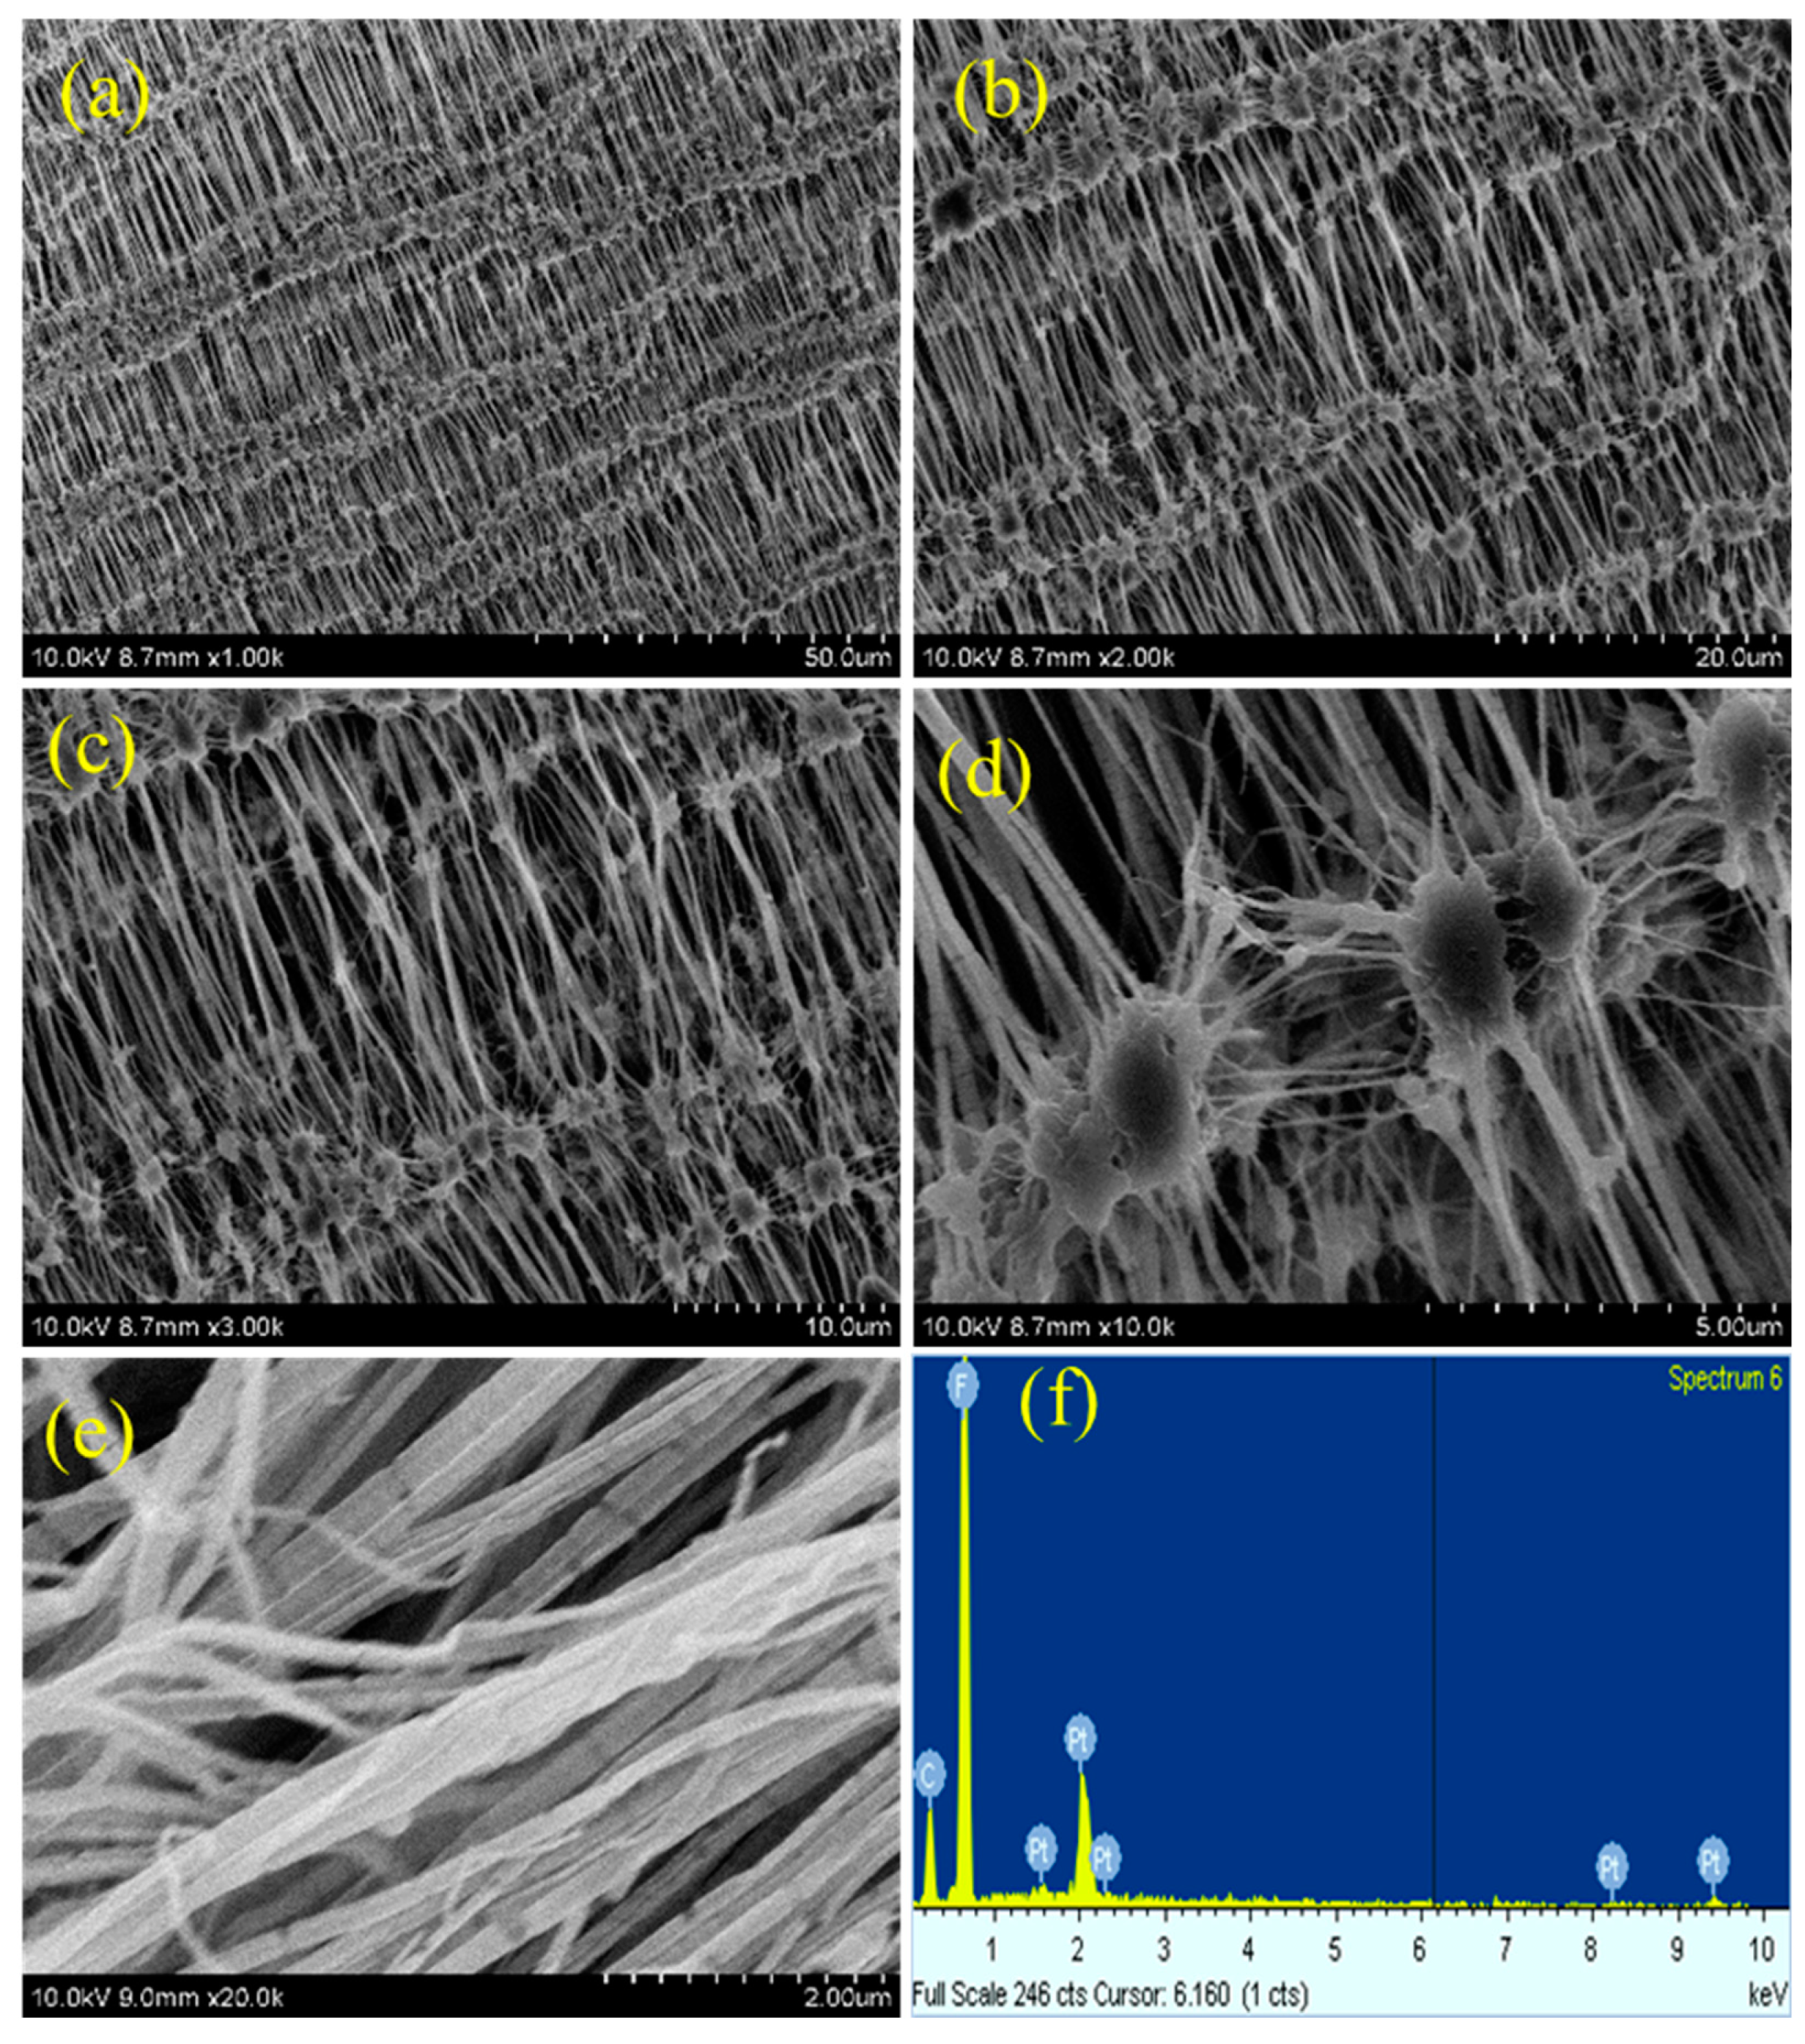
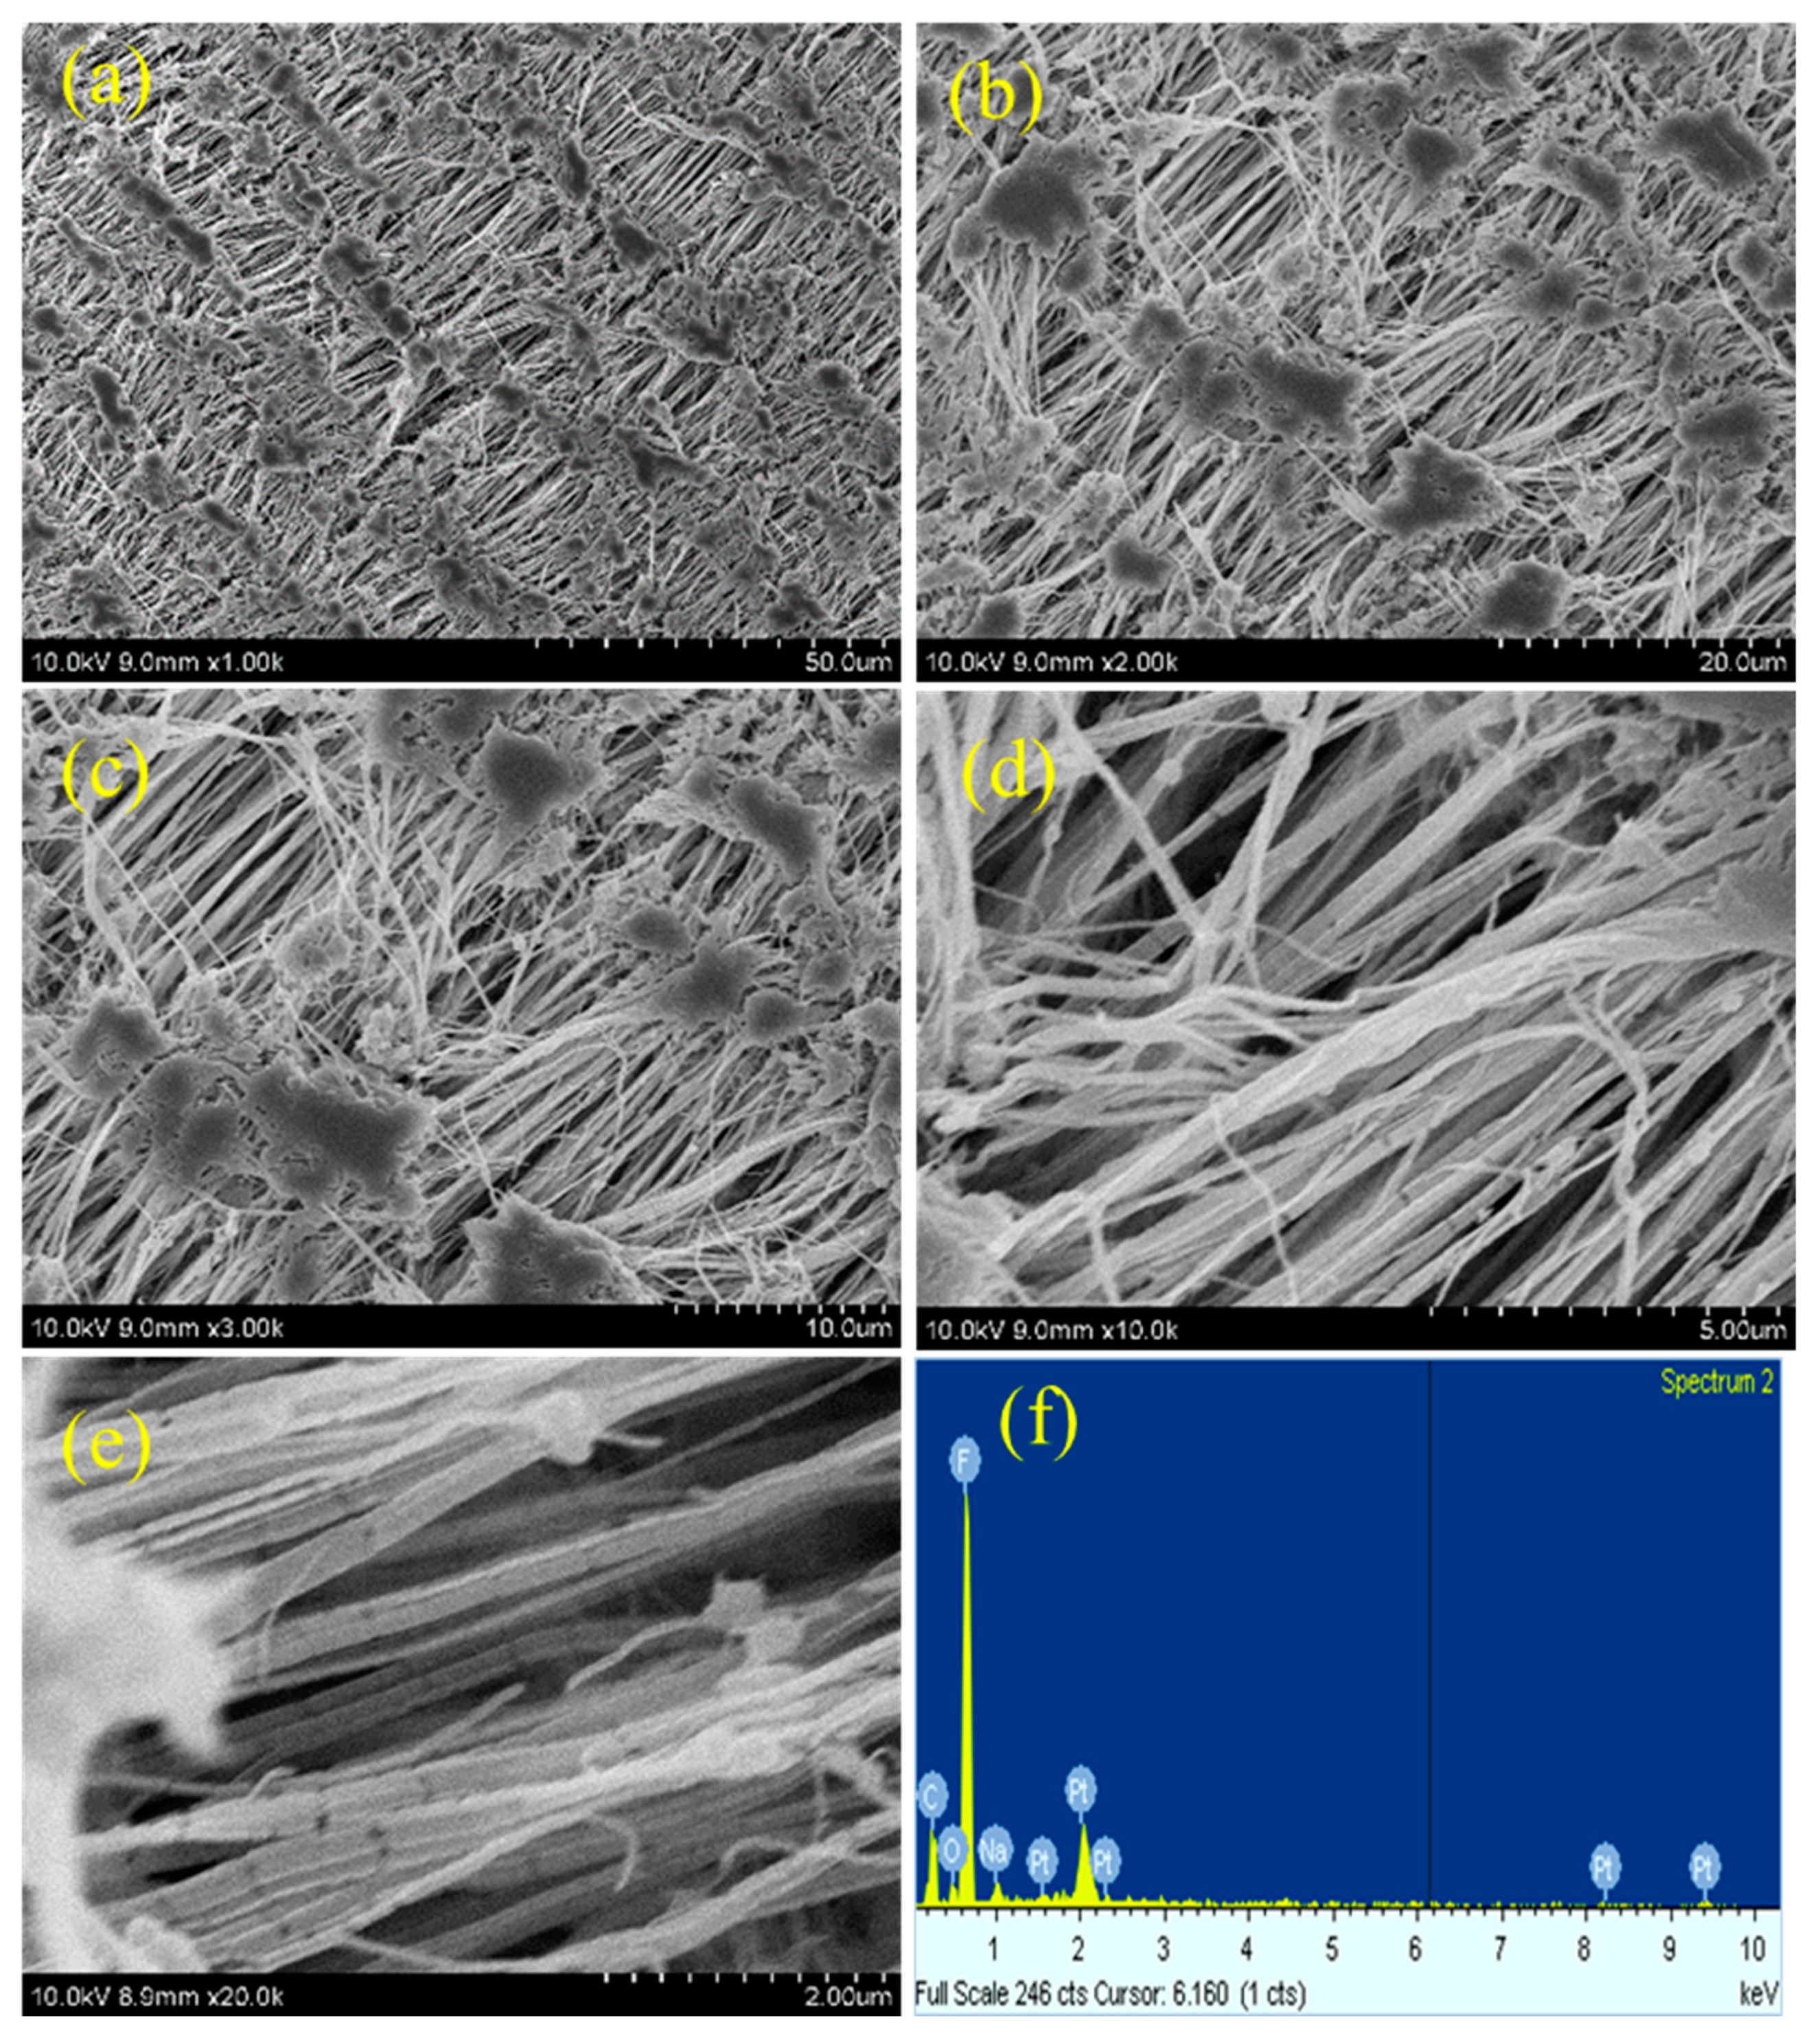
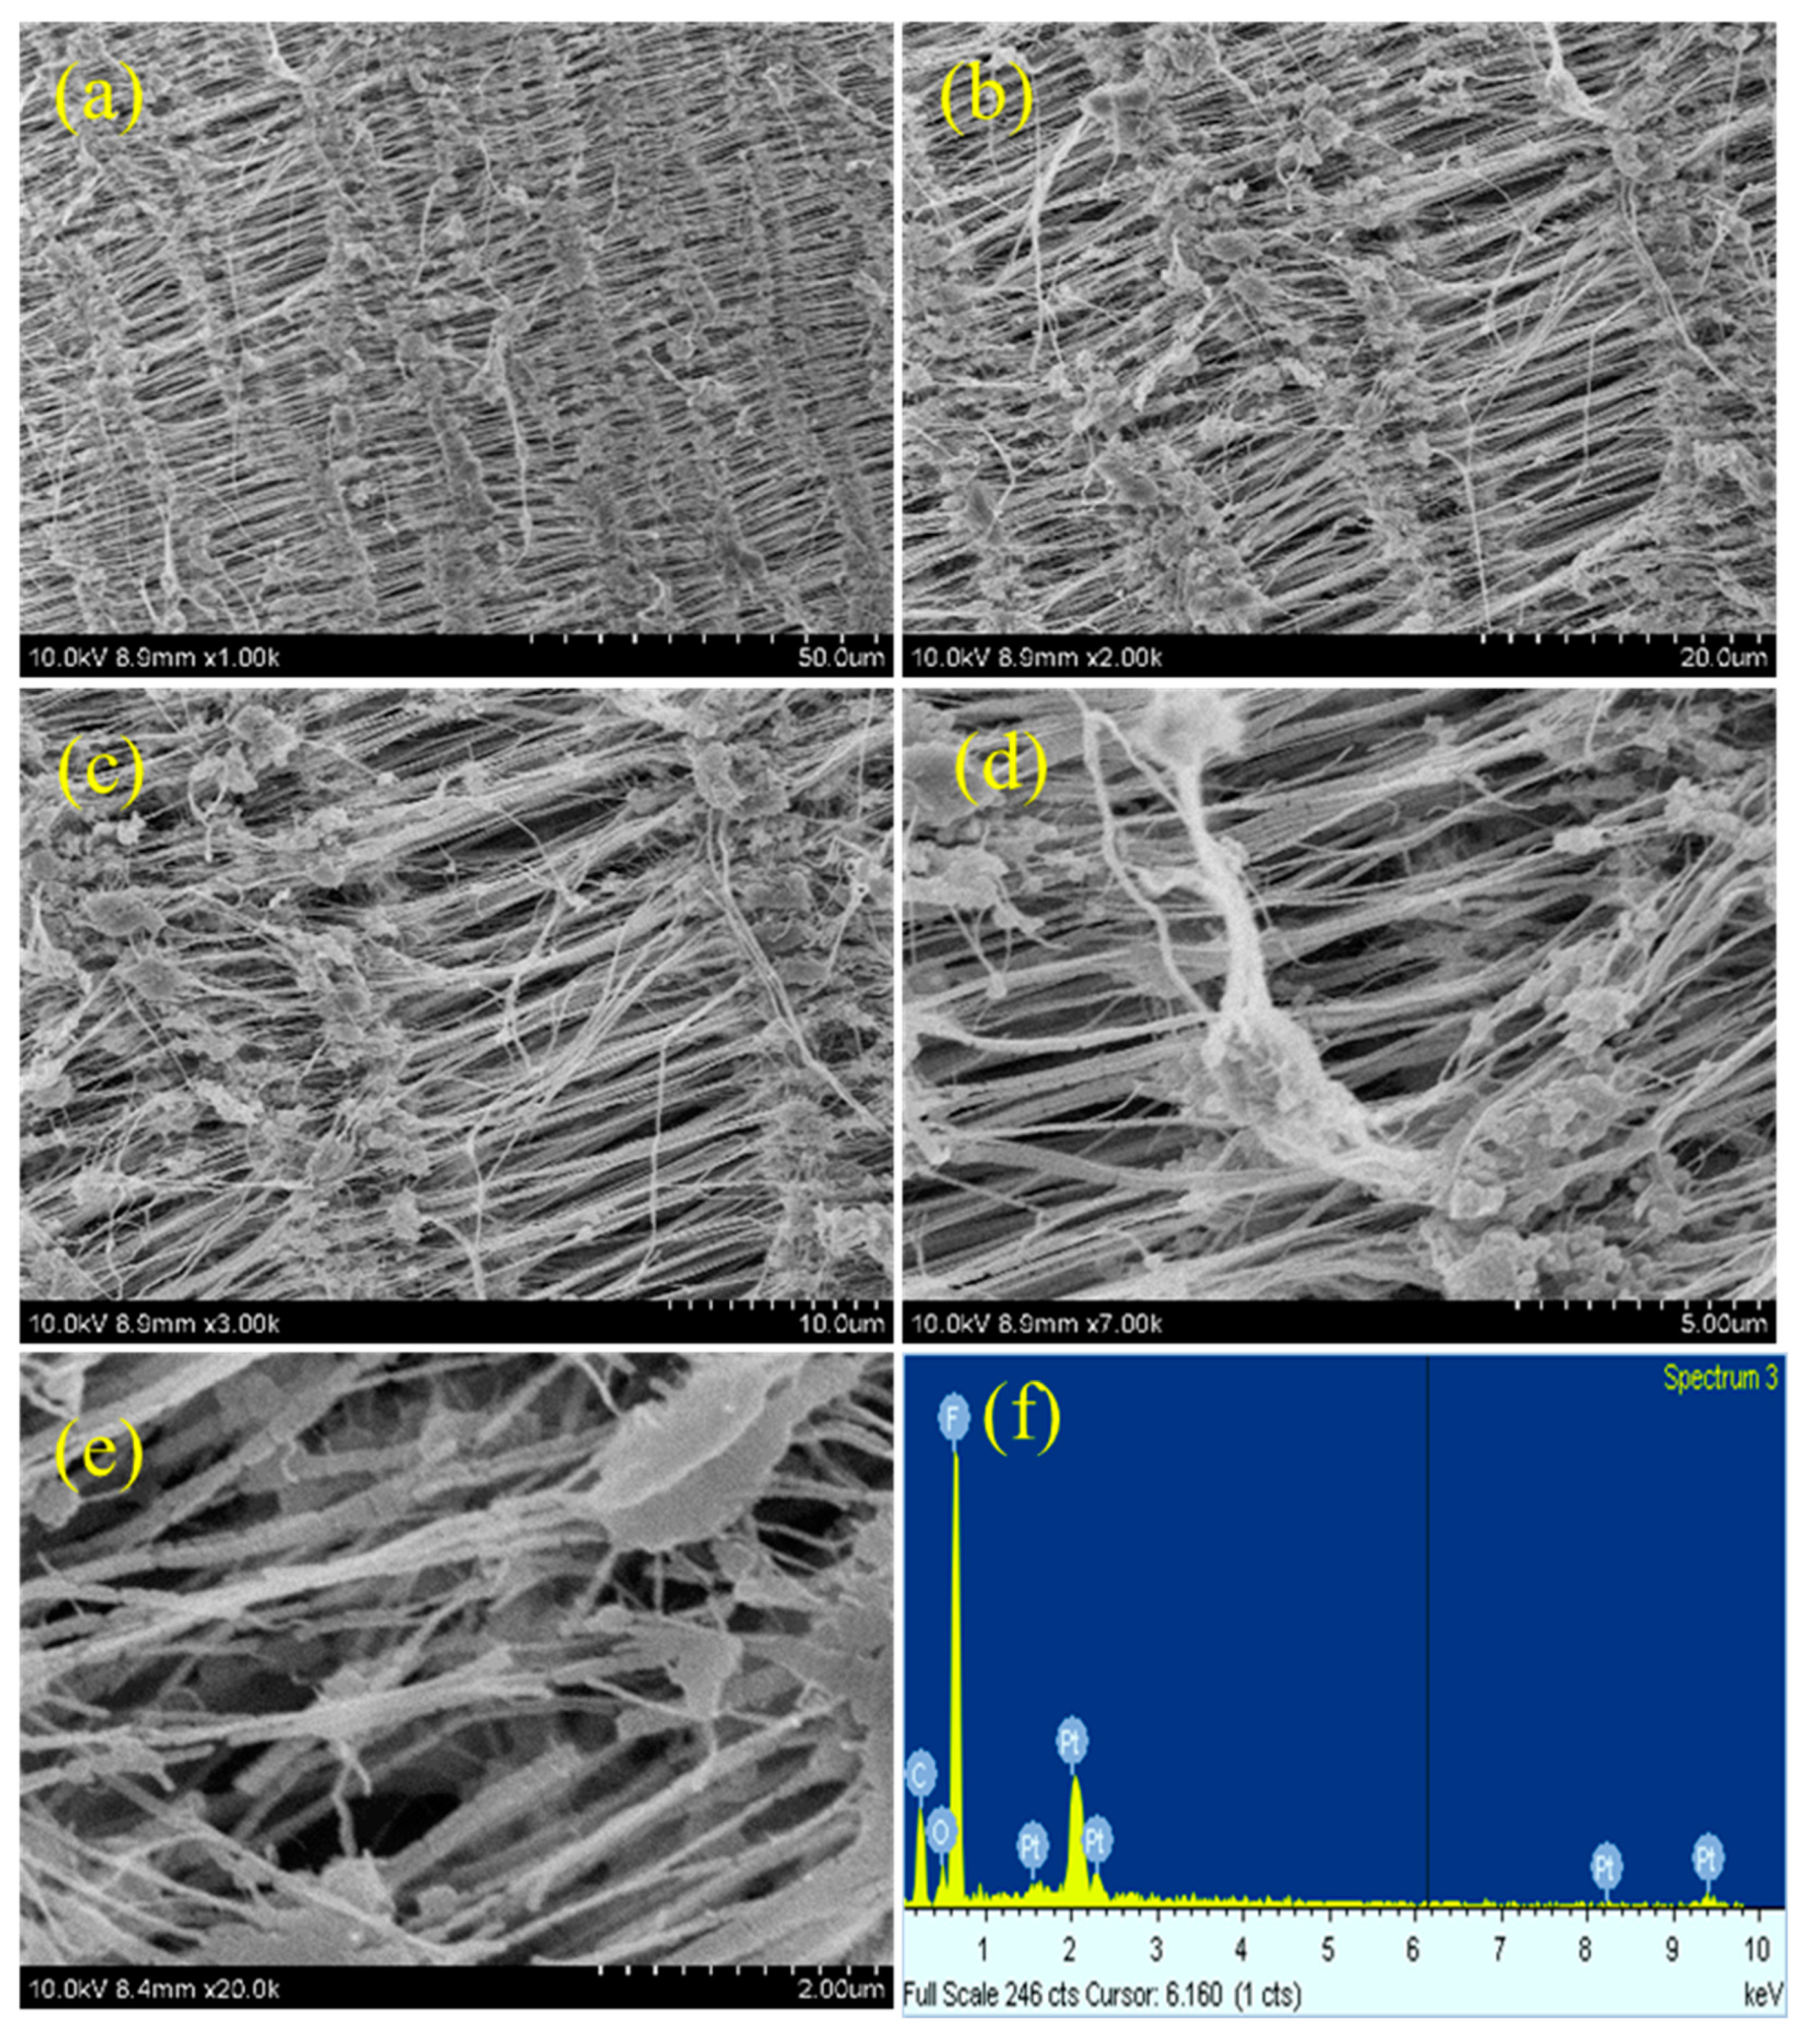
As plasma treatment is a surface modification process, the surface morphology of teflon will be altered after plasma treatment process. The morphology changes occurred on the PTFE membrane after different plasma treatments was investigated by FE-SEM measurements.
Figure 5,
Figure 6,
Figure 7 and
Figure 8 depicts the SEM images of neat teflon and modified teflon membrane after plasma treatment process with N
2, O
2 and (Ar+H
2) at different magnifications. As with the three plasma treatments [i.e., N
2, O
2 and (Ar+H
2)], the water contact angle reduced much for 2 minutes exposure of plasma, and so the SEM images of teflon with different plasma treatments for 2 mins were discussed to figure out the maximum changes in surface morphology. If we take a closer look at the SEM images, particularly at higher magnifications, the surface morphological changes can be clearly seen.
The neat PTFE membrane (
Figure 5a–f) shows several reticular fiber-like nodule structure, in which the fibers are aligned in a uniform order and connected to another fiber through this nodule (
Figure 5c). Even at higher magnification, the SEM images show uniform alignment of the fibers, representing bundles of rods stacked together. It can also be observed that from each nodule several fibers arise that are connected together (
Figure 5d).
This reticular fiber-nodule structure is a result of melt-stretching membrane fabrication technology adopted to fabricate teflon membrane, and the hydrophobic nature of teflon membrane is expected to be from this structure contribution in addition to –CF
2 groups. For the plasma treated PTFE membrane, low magnification SEM images, say 1k, do not show much significant changes (
Figures 6a,
7a and
8a), whereas, the high magnification SEM images, show drastic changes on the surface morphology.
At first, the alignment of the fiber structure is completely collapsed, and at several places the fibers were torn and broken fibers are clearly visible (
Figures 6b–e,
7b–e and
8 b–e) [
26,
27]. And so, we can confirm that all the plasma treatment brings drastic changes w.r.t. the surface morphology of teflon membrane. Even though O
2 and (Ar+H
2) plasma treatment could modify the surface morphology of teflon similar to N
2 plasma treatment, they do not reduce the contact angle much. This could be attributed to the fact that soon after the plasma treatment, the atmospheric air can further affect the surface of the teflon membrane. The atmospheric oxygen could be deposited on teflon membrane and with N
2 plasma, it is less pronounced. This could be the reason that N
2 plasma treatment is more effective than O
2 and (Ar+H
2) plasma treatment. The EDX spectrum (
Figures 5f,
6f,
7f and
8f) gives the composition of each element present in the teflon membrane. It could be observed that ‘C’ and ‘F’ are the predominant elements present in all samples. The neat teflon membrane shows the presence of very little amount of ‘O’ species, whereas, all the plasma treated samples show an increase in the percentage of oxygen.
At first, the alignment of the fiber structure is completely collapsed, and at several places the fibers were torn and broken fibers are clearly visible (
Figures 6b–e,
7b–e and
8 b–e) [
26,
27]. And so, we can confirm that all the plasma treatment brings drastic changes w.r.t. the surface morphology of teflon membrane. Even though O
2 and (Ar+H
2) plasma treatment could modify the surface morphology of teflon similar to N
2 plasma treatment, they do not reduce the contact angle much. This could be attributed to the fact that soon after the plasma treatment, the atmospheric air can further affect the surface of the teflon membrane. The atmospheric oxygen could be deposited on teflon membrane and with N
2 plasma, it is less pronounced. This could be the reason that N
2 plasma treatment is more effective than O
2 and (Ar+H
2) plasma treatment. The EDX spectrum (
Figure 5f,
6f,
7f and
8f) gives the composition of each element present in the teflon membrane. It could be observed that ‘C’ and ‘F’ are the predominant elements present in all samples. The neat teflon membrane shows the presence of very little amount of ‘O’ species, whereas, all the plasma treated samples show an increase in the percentage of oxygen.
3.4. XPS Analysis
The atomic composition present on the surface of neat PTFE sheet and plasma treated PTFE sheets with N
2, O
2 and (Ar+H
2) gases were determined by XPS analysis.
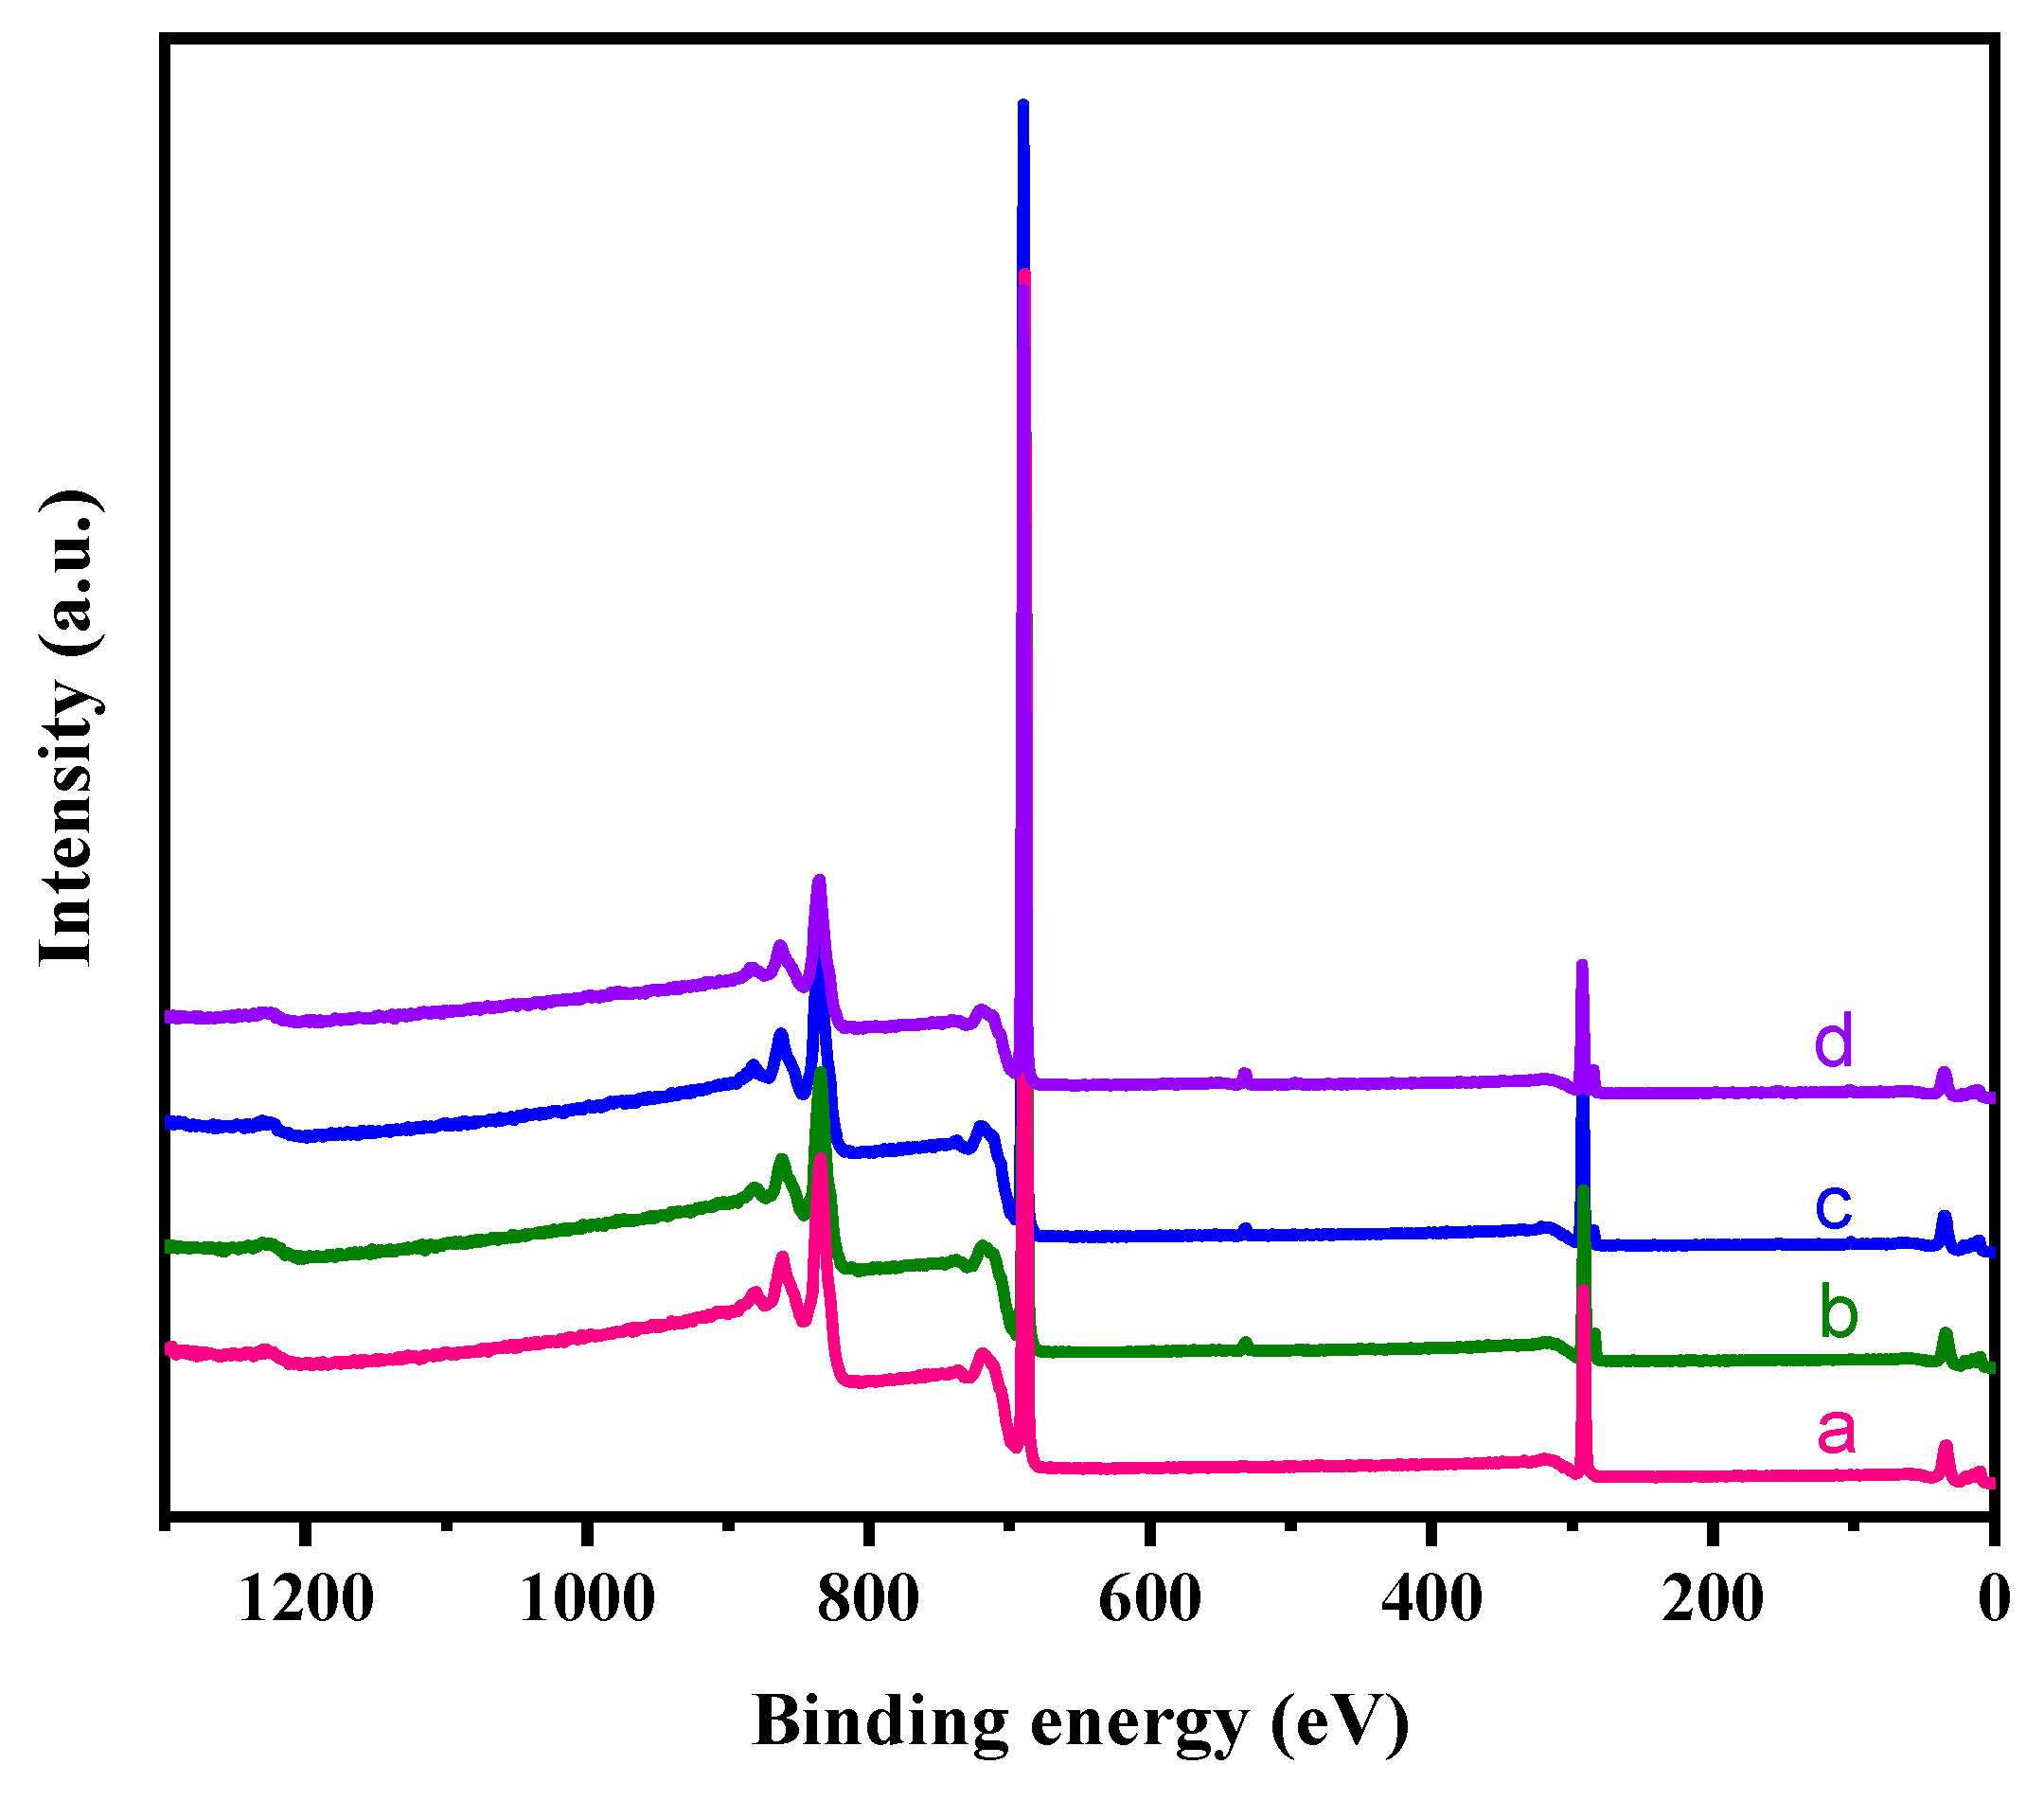
Figure 9 represents the XPS survey spectra of neat PTFE sheet and plasma treated PTFE sheets. From the survey spectrum, it is clearly observed that ‘C’ and ‘F’ are the predominant species found in all samples. The neat PTFE shows peaks for C1s at 294 eV, and for F1s at 683 eV (
Figure 9a). Whereas, for the plasma treated samples, an additional small peak at 532 eV is obtained, corresponding to O1s binding energy (
Figure 9b–d). This clearly indicates that the surface of PTFE has been modified by plasma treatment. The data in
Table 2 gives an idea about the atomic percentage of different elements present on the PTFE surface. It is observed from the data that there is an increase in the percentage of carbon and decrease in the percentage of fluorine for all plasma treatment. Additionally, very less % of ‘N’ and ‘O’ atoms were also observed for the plasma treated samples in comparison with neat PTFE. The data clearly shows that all the plasma treatments [i.e., N
2, O
2 and (Ar+H
2)] brings about defluorination of the PTFE, as a result of C-F chain breaking in the polymer induced by the electrons generated in the plasma. And hence, we can observe a decrease in the fluorine content when compared with neat PTFE. Moreover, all the plasma treatments results with an introduction of ‘N’ and ‘O’ atoms. This is attributed to two factors, viz., the active gas used in the plasma treatment and the surface oxidation of PTFE sheet by atmospheric air soon after plasma treatment. In all the cases, very less plasma duration of 2 mins was sufficient to bring out these changes [
1,
4,
19].
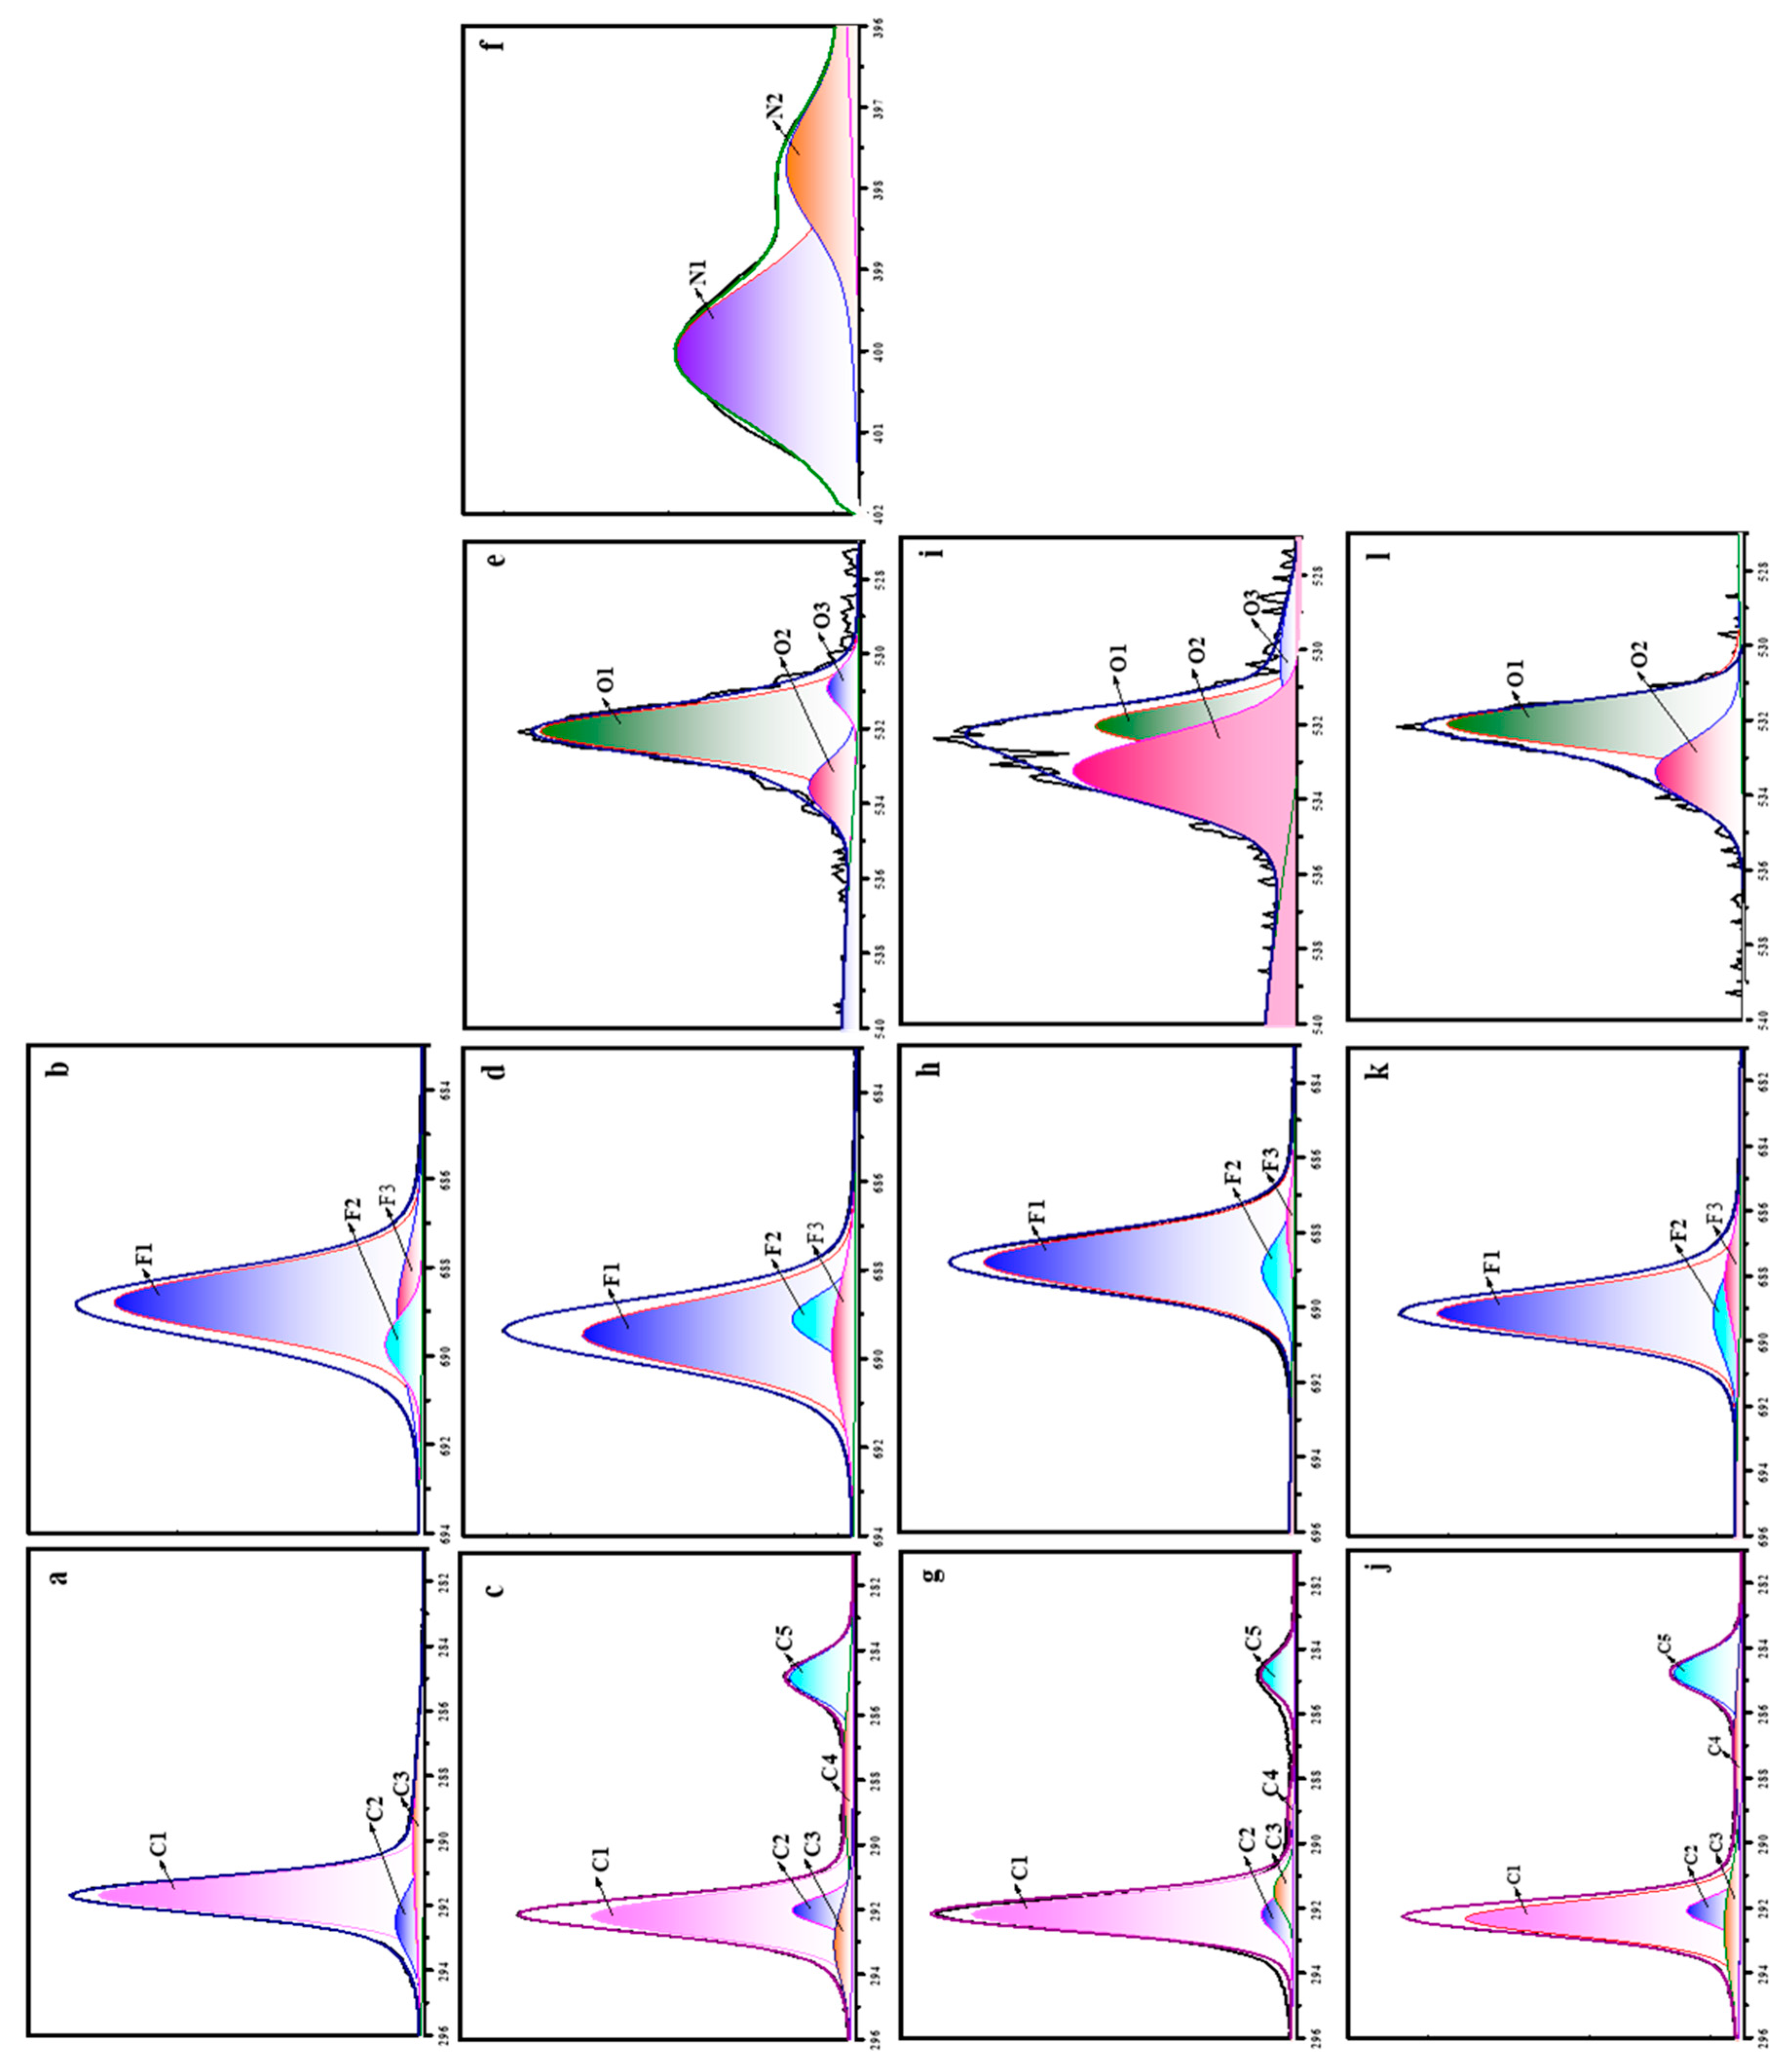
The high resolution XPS spectra showing the binding energy of C1s, F1s, N1s and O1s are depicted in
Figure 10. The C1s spectrum of neat PTFE is deconvoluted into three different peaks, representing three different chemically non-equivalent carbon atoms (
Figure 10a). The major peak at 291.8 eV is related to CF
2 species and the two smaller peaks at 292.3 and 288.6 eV are related to CF and CF
3/C-C species, respectively. Similarly, the high resolution F1s spectra of neat PTFE (
Figure 10b) showed three different peaks. The one with higher intensity at 688.7 eV corresponds to F-C-F species and the other two with very small intensities at 689.7 and 689.0 eV correspond to F-C and F
3-C species, respectively. For all the plasma treated samples, the C1s spectra showed a very small additional peaks at 285 and 288 eV, representing the present of C-O and C-H species (
Figure 10c,g,j). Additionally, there is a decrease in the CF
2 peaks for all the plasma treated samples, which is more prominent for N
2 plasma treatment (
Figure 10c). In the same way, the F1s spectra also showed a decreased F-C-F peaks (
Figure 10d,h,k). In addition to C1s and F1s, N
2 plasma treatment shows additional peaks due to O1s and N1s (
Figure 10e,f), whereas, O
2 and (Ar+H
2) plasma treatment shows additional peaks due to O1s (
Figure 10i,l). The O1s spectra is deconvoluted into three different peaks corresponding to C-O, C=O and C-O-F species and N1s spectra is deconvoluted into two different peaks, representing C-N and N-H species [
26,
27]. And therefore, the combined results of FT-IR, SEM, WCA and XPS indicates that plasma treatment bring about surface modification of neat PTFE membrane.
4. Conclusions
The work reported in this paper demonstrates a simple and effective method to modify the surface of PTFE without altering its bulk property by tuning the hydrophobic nature of PTFE. Plasma treatment was found to be successful in altering the surface morphology of PTFE by optimizing several parameters. The optimum parameters for plasma discharge are set as follows: flow rate of carrier gas (Ar) = 4.5 L/min; flow rate of active gas [N2/O2/(Ar+H2)] = 20 mL/min; RF power = 150 W; distance = 3 mm; and plasma exposure time = 1 – 4 min. The plasma treatment using N2 as an active gas was effective to reduce the hydrophobicity of PTFE from 140° to 108°, even with a very short duration time (2 minutes). In supportive to this result, SEM images clearly indicate the modified PTFE surface after plasma treatment. The surface of PTFE has been collapsed to a greater extent with uneven fiber orientation and broken fibers. Additionally, FT-IR confirms the presence of –CH stretching vibrations and XPS confirms the presence of oxygen and nitrogen atoms at 532 and 400 eV, respectively in addition to carbon and fluorine atoms at 294 and 683 eV, respectively (‘C’ and ‘F’ atoms are presumably found in neat PTFE). Moreover, the intensity of CF2 decreased with an increase in C-C/C-H intensity, which proved that plasma treatment results in defluorination with the formation of new polar groups appearing on the surface of PTFE. Overall, the results proved that the ability to tune the surface properties while maintaining their bulk property could be achieved effectively by plasma treatment. Even though plasma treatment could modify the surface of PTFE, the plasma treatment alone could not produce hydrophilic surface and the produced hydrophilicity could not be retained for a longer period of time. This work is a preliminary study investigating the surface modification of PTFE by plasma treatment. Further to enhance the surface modification and to maintain the modified surface, treatment with hydrophilic compounds before or after plasma treatment will be much effective.
Author Contributions
Conceptualization – S.P.A. and P.T, Methodology – S.P.A. and T.P., Software Supervision – S.-C.K., Resources – S.-C.K., Project administration– S.-C.K., Funding acquisition – S.K. All authors have read and agreed to the published version of the manuscript.
Funding
The research work described in this paper is supported by the Basic Science Research Program through the National Research Foundation of Korea (NRF) funded by the Ministry of Education (2020R1I1A3052258). In addition, the work was also, supported by the Technology development Program (S3060516) funded by the Ministry of SMEs and Startups (MSS, Republic of Korea) in 2021.
Institutional Review Board Statement
Not applicable.
Data Availability Statement
The data presented in this study are available in article.
Conflicts of Interest
The authors declare no conflict of interest
References
- Yamada, Y.; Yamada, T.; Tasaka, S.; Inagaki, N. Surface Modification of Poly(Tetrafluoroethylene) by Remote Hydrogen Plasma. Macromolecules 1996, 29, 4331–4339. [Google Scholar] [CrossRef]
- Liu, S.J.; Cui, S.P.; Qin, Z.P.; Fei, C.J.; Wang, Y.L.; Guo, H.X. A Novel Way to Modify PTFE Membrane into Hydrophilicity. Mater. Sci. Forum 2017, 898 MSF, 1892–1895. [Google Scholar] [CrossRef]
- Sharma, M.; Bharatiya, B.; Mehta, K.; Shukla, A.; Shah, D.O. Novel Strategy Involving Surfactant-Polymer Combinations for Enhanced Stability of Aqueous Teflon Dispersions. Langmuir 2014, 30, 7077–7084. [Google Scholar] [CrossRef] [PubMed]
- Vasile, C.; Baican, M.C.; Tibirna, C.M.; Tuchilus, C.; Debarnot, D.; Pslaru, E.; Poncin-Epaillard, F. Microwave Plasma Activation of a Polyvinylidene Fluoride Surface for Protein Immobilization. J. Phys. D. Appl. Phys. 2011, 44. [Google Scholar] [CrossRef]
- Toma, M.; Loget, G.; Corn, R.M. Flexible Teflon Nanocone Array Surfaces with Tunable Superhydrophobicity for Self-Cleaning and Aqueous Droplet Patterning. ACS Appl. Mater. Interfaces 2014, 6, 11110–11117. [Google Scholar] [CrossRef] [PubMed]
- Zdziennicka, A.; Jańczuk, B.; Wójcik, W. Wettability of Polytetrafluoroethylene by Aqueous Solutions of Two Anionic Surfactant Mixtures. J. Colloid Interface Sci. 2003, 268, 200–207. [Google Scholar] [CrossRef]
- Wang, S.; Li, J.; Suo, J. Surface modification of porous poly(tetrafluoraethylene) film by a simple chemical oxidation treatment. Appl. Surf. Sci. 2010, 256, 2293–2298. [Google Scholar] [CrossRef]
- Wang, S.; Li, J.; Suo, J. Surface modification of porous poly(tetrafluoraethylene) film by a simple chemical oxidation treatment. Appl. Surf. Sci. 2010, 256, 2293–2298. [Google Scholar] [CrossRef]
- Wang, C.; Chen, J.R.; Li, R. Studies on surface modification of poly(tetrafluoroethylene) film by remote and direct Ar plasma. Appl. Surf. Sci. 2008, 254, 2882–2888. [Google Scholar] [CrossRef]
- Tu, C.Y.; Wang, Y.C.; Li, C.L. Expanded poly(tetrafluoroethylene) membrane surface modification using acetylene/nitrogen plasma treatment. Eur. Polym. J. 2005, 41, 2343–2353. [Google Scholar] [CrossRef]
- Wang, C.; Chen, J.R. Studies on surface graft polymerization of acrylic acid onto PTFE film by remote argon plasma initiation. Appl. Surf. Sci. 2007, 10, 4599–4606. [Google Scholar] [CrossRef]
- Feng, W.; Li, J.; Zhu, H. Physical modification of polytetrafluoroethylene flat membrane by a simple heat setting process and membrane wetting remission in SGMD for desalination. Desalination 2014, 354, 143–152. [Google Scholar]
- Rychkov, D.; Yablokov, M.; Rychkov, A. Chemical and physical surface modification of PTFE films—an approach to produce stable electrets. Appl. Phys. A 2012, 107, 589–596. [Google Scholar] [CrossRef]
- Lee, S.W.; Hong, JW.; Wye, MY. Surface modification and adhesion improvement of PTFE film by ion beam irradiation. Nucl. Instrum. Methods Phys. Res. 2004, 219, 963–967. [Google Scholar] [CrossRef]
- Sun, H.X.; Zhang, L.; Chai, H. Surface modification of poly (tetrafluoroethylene) films via plasma treatment and graft copolymerization of acrylic acid. Desalination 2006, 192, 271–279. [Google Scholar] [CrossRef]
- Hopp, B.; Smausz, T.; Kresz, N. Adhesion strength measurements of excimer-laser-treated PTFE surfaces using liquid photoreagents. Proc Spie 2003, 5131, 190–194. [Google Scholar]
- Noh, J, H; Hong, K, B.; Noh, I.; Surface modification of polytetrafluoroethylene usingatmospheric pressure plasma jet for medical application. Surf. Coat. Technol. 2007, 201, 5097–5101. [CrossRef]
- Kato, Y.; Kanda, K.; Haruyama, Y. Surface modification of ptfe by synchrotron radiation under the O2 gas atmosphere[C]// Microprocesses and Nanotechnology Conference, 2004. Digest of Papers. 2004 International. IEEE 2004, 413–415. [Google Scholar]
- Sprick, R.S.; Cheetham, K.J.; Bai, Y.; Alves Fernandes, J.; Barnes, M.; Bradley, J.W.; Cooper, A.I. Polymer Photocatalysts with Plasma-Enhanced Activity. J. Mater. Chem. A 2020, 8, 7125–7129. [Google Scholar] [CrossRef]
- Pegalajar-Jurado, A.; Joslin, J.M.; Hawker, M.J.; Reynolds, M.M.; Fisher, E.R. Creation of Hydrophilic Nitric Oxide Releasing Polymers via Plasma Surface Modification. ACS Appl. Mater. Interfaces 2014, 6, 12307–12320. [Google Scholar] [CrossRef]
- López, C.D.; Cedeño-Mata, M.; Dominguez-Pumar, M.; Bermejo, S. Surface Modification of Polytetrafluoroethylene Thin Films by Non-Coherent UV Light and Water Treatment for Electrowetting Applications. Prog. Org. Coatings 2020, 149, 105593. [Google Scholar] [CrossRef]
- Liu, C.; Cui, N.; Brown, N.M. D.; Meenan, B.J. Effects of DBD Plasma Operating Parameters on the Polymer Surface Modification. Surf. Coatings Technol. 2004, 185, 311–320. [Google Scholar] [CrossRef]
- Guruvenket, S.; Rao, G.M.; Komath, M.; Raichur, A.M. Plasma Surface Modification of Polystyrene and Polyethylene. Appl. Surf. Sci. 2004, 236, 278–284. [Google Scholar] [CrossRef]
- Bhowmik, S.; Jana, P.; Chaki, T.K.; Ray, S. Surface Modification of PP under Different Electrodes of DC Glow Discharge and Its Physicochemical Characteristics. Surf. Coatings Technol. 2004, 185, 81–91. [Google Scholar] [CrossRef]
- Surface Wet Chemical Treatment to Improve the Adhesion of Teflon. 1, 1–5.
- Wang, K.; Hou, D.; Wang, J.; Wang, Z.; Tian, B.; Liang, P. Hydrophilic Surface Coating on Hydrophobic PTFE Membrane for Robust Anti-Oil-Fouling Membrane Distillation. Appl. Surf. Sci. 2018, 450, 57–65. [Google Scholar] [CrossRef]
- Park, S.Y.; Chung, J.W.; Kwak, S.Y. Regenerable Anti-Fouling Active PTFE Membrane with Thermo-Reversible “Peel-and-Stick” Hydrophilic Layer. J. Memb. Sci. 2015, 491, 1–9. [Google Scholar] [CrossRef]
- Dowd, R.P.; Day, C.S.; Van Nguyen, T. Engineering the Ionic Polymer Phase Surface Properties of a PEM Fuel Cell Catalyst Layer. J. Electrochem. Soc. 2017, 164, F138–F146. [Google Scholar] [CrossRef]
- Biro, D.A.; Pleizier, G.; Deslandes, Y. Application of the microbond technique. IV. Improved fiber–matrix adhesion by RF plasma treatment of organic fibers. J. Appl. Polym. Sci. 1993, 47, 883–894. [Google Scholar]
|
Disclaimer/Publisher’s Note: The statements, opinions and data contained in all publications are solely those of the individual author(s) and contributor(s) and not of MDPI and/or the editor(s). MDPI and/or the editor(s) disclaim responsibility for any injury to people or property resulting from any ideas, methods, instructions or products referred to in the content. |
© 2023 by the authors. Licensee MDPI, Basel, Switzerland. This article is an open access article distributed under the terms and conditions of the Creative Commons Attribution (CC BY) license (https://creativecommons.org/licenses/by/4.0/).
