Preprint
Article

Small-scale marine fishers’ possession of fishing vessel and its impact to their net income level: A Case Study in Takalar District, South Sulawesi Province of Indonesia

Altmetrics

Downloads

112

Views

31

Comments

0

A peer-reviewed article of this preprint also exists.

Submitted:

27 July 2023

Posted:

28 July 2023

You are already at the latest version

Alerts
Abstract
During two decades back, the growth of the fisheries sector in Indonesia was showing increasing trend, however, behind the rapid development of the sector, small-scale fisheries role is often neglected as one of the main actors to support the whole sector. They remain poor and doing fishing activities traditionally. Therefore, this study aims to describe the real situation of small-scale fishers, analyzing fishers’ ownership of the boat, analyzing their income level to reveal their poverty condition, to analyze the factors affecting their income. The regression analysis results indicate that fishing days, boat category, sea fish catch, fish selling price, variable cost, and secondary job have significant affect to fishers’ net income.
Keywords: 
Subject: Business, Economics and Management  -   Economics

1. Introduction

The development of the fisheries sector in Indonesia plays an important role in terms of employment creation, food security, poverty alleviation and economic development [1,2,3]. The development of total fisheries production is showing an increasing trend especially during two decades back which made Indonesia as the second major producer of fisheries and aquaculture products in the world [4]. Despite the rapid development, it still has many challenges to overcome, for instance to improve the livelihood of small-scale fishers. Small-scale fishers role is important because small-scale fishers are the supplier of seafood for people in coastal and inland society and also absorb labors in order to alleviate poverty problem in remote areas [5,6,7]. Small-scale marine capture fishers in Indonesia are the largest contributor for domestic fishery production, about 85% of the workforce engaged in the fishing sector are still poor and traditional fishers they are lack behind in term of education, fishing skills, fishing activities management, limited access to other livelihood choices, lack of capital and high dependency on natural resources resulting in their poor economic condition [8,9,10,11). Thus, addressing poverty of small-scale fishers remains as important issue for Indonesian fisheries sector.
An increasing trend of fishers’ boat posession can be observed. Number of fishers who use row boat declined and both fishers who use outboard motor boat and motor boat were increasing starting around 2003 (Figure 1) [12]. Along with improvement of fishing vessel type, fishers’ income also increases. According to MMAFI [13] , in 2014 the average income of fishers was Rp. 2,150,000 (US $ 156 (US $ 1= Rp. 13,771)) per month and in 2017 it had increased to Rp. 2,700,000 (US $ 196) per month. There might be a significant relationship between the improvement of possession of fishing vessel and increase of fishers’ catch productivity which lead to higher income. According to foregone discussion, fisheries sector is important for Indonesia and recently keep improving in terms of the production, fishing vessels owned by fishers and also fishers’ income. Unfortunately, not many researchers have evaluated the real situation of small-scale fishers related to their fishing activity, their possession of fishing boats, poverty condition, and factors affecting their income level, therefore, this study aims to describe the real situation of small-scale fishers, analyzing fishers’ ownership of the boat, analyzing their income level to reveal their poverty condition, to analyze the factors affecting their income.

2. Materials and Methods

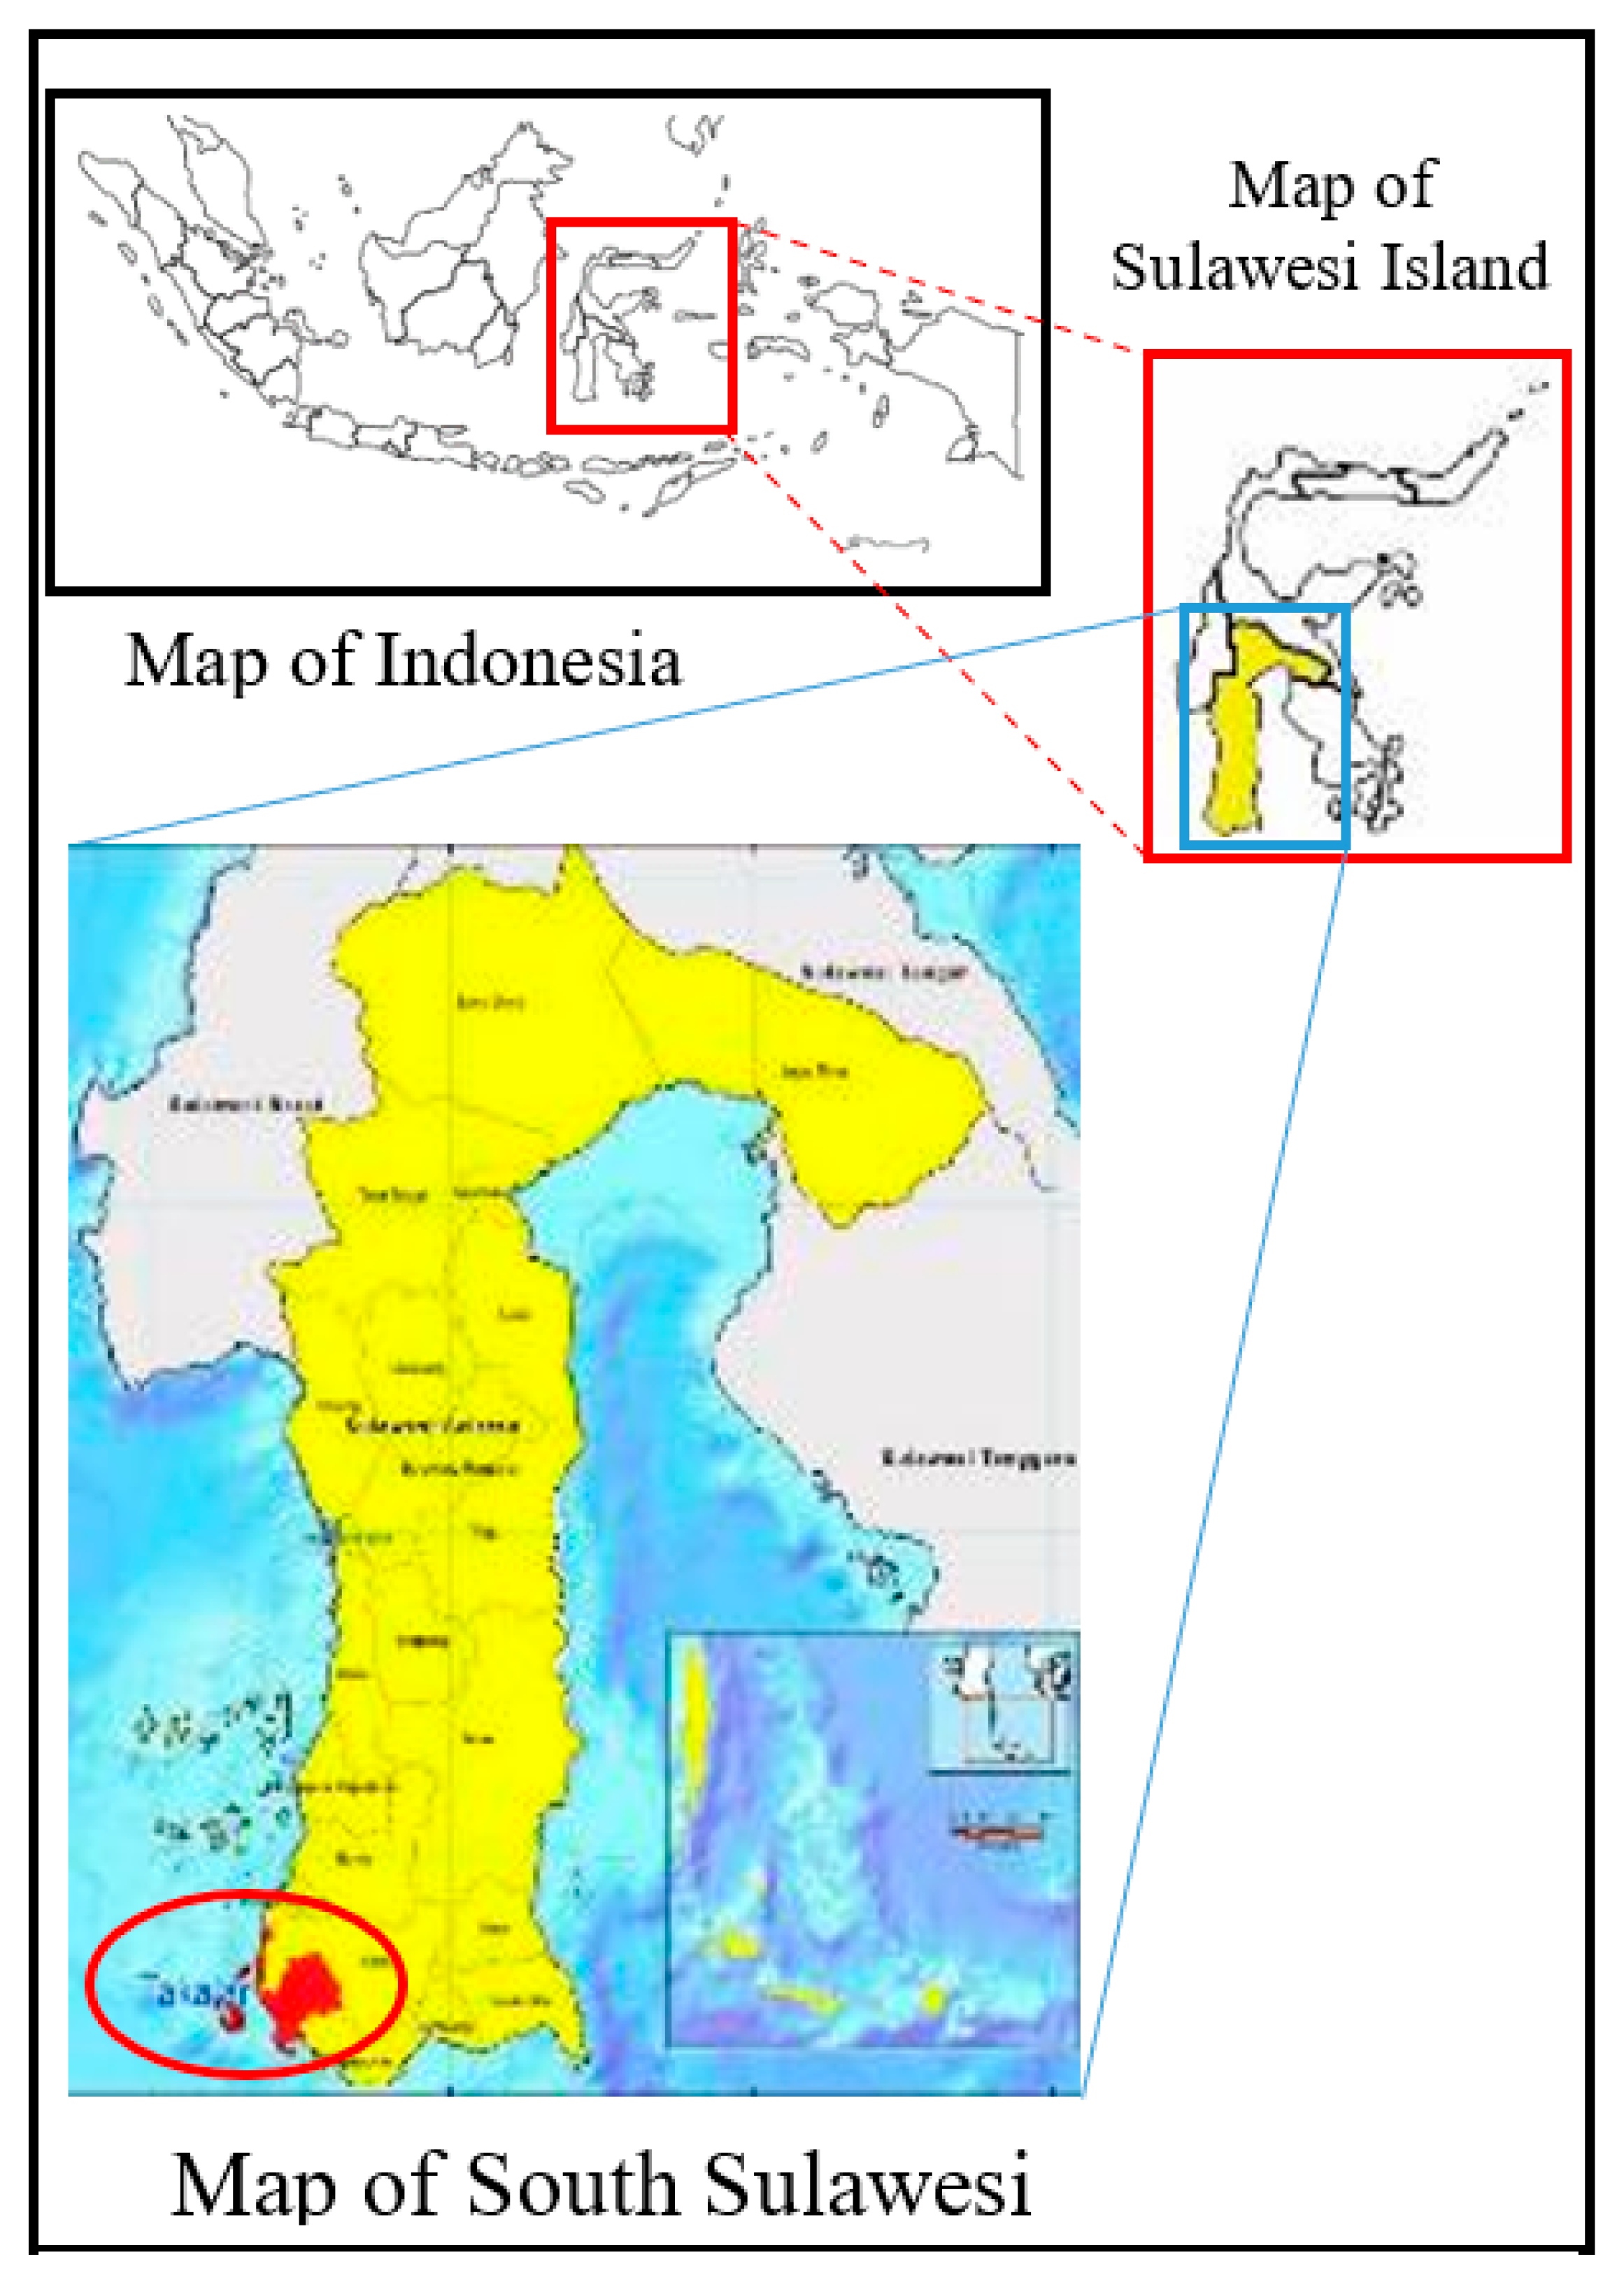
Research site is in Takalar District, one of district in South Sulawesi Province. Takalar District was selected because of almost half of its territory is coastal areas and number of fishers is high. As shown in Figure 2, the circled area in the map of the province is Takalar district. In Takalar District there are 2,085 marine capture fishers in 2015 [14]. In Takalar District there are 527 row boat, 2,402 outboard motor boat, and 907 motor boat in 2016 and the production from capture fisheries amounted to 9,372 ton [15]. The local poverty line in Takalar District is Rp. 299,721 per capita per month or equal to US $ 0.73 (US $ 1= Rp. 13,771) per capita per day, there were 26,990 (9.24%) poor people in Takalar District in 2017 [16].
In this research, a cross-sectional survey design was applied. Data from total of 152 fishers were collected in Takalar District. For selecting the sample respondents, convenience sampling method (also known as haphazard sampling or accidental sampling) was chosen. Data collection for this research consisted of (1) primary data, (2) secondary data collection. Primary data was collected by doing fishers household interviews which was conducted during February to March in 2018. Secondary data were collected from publication of previous research or secondary data sources. Finally, primary data that have been collected were analyzed using descriptive statistics in MS EXCEL and SPSS 22 version.

3. Results and Discussions

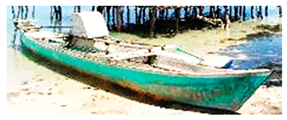
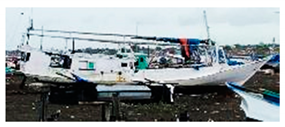
This research is targeting small-scale fishers who has their own boat. There are three types of boat that fishers use, namely; 1. Rowboat; 2. Outboard motor boat; 3. Motor boat (see Table 1). Then, they are divided into six categories of fishers based on combination of boat type they own, namely: 1. Fishers who own motor boat and also onboard motor boat (MB and OMB), 2. Fishers who own motor boat and row boat (MB and RB), 3. Fishers who own motor boat only (MB), 4. Fishers who own outboard motor boat and rowboat (OMB and RB), 5. Fishers who own outboard motor boat only (OMB) and the last 6. Fishers who own row boat only (RB) (Table 2). All of them considered as small-scale fishers based on Indonesian Constitutions: No. 45/2009 Article 1 point 11, No. 7/2016 Article 1 point 4, and No. 23/2014 [17].

3.1. Characteristics of fishers’ household

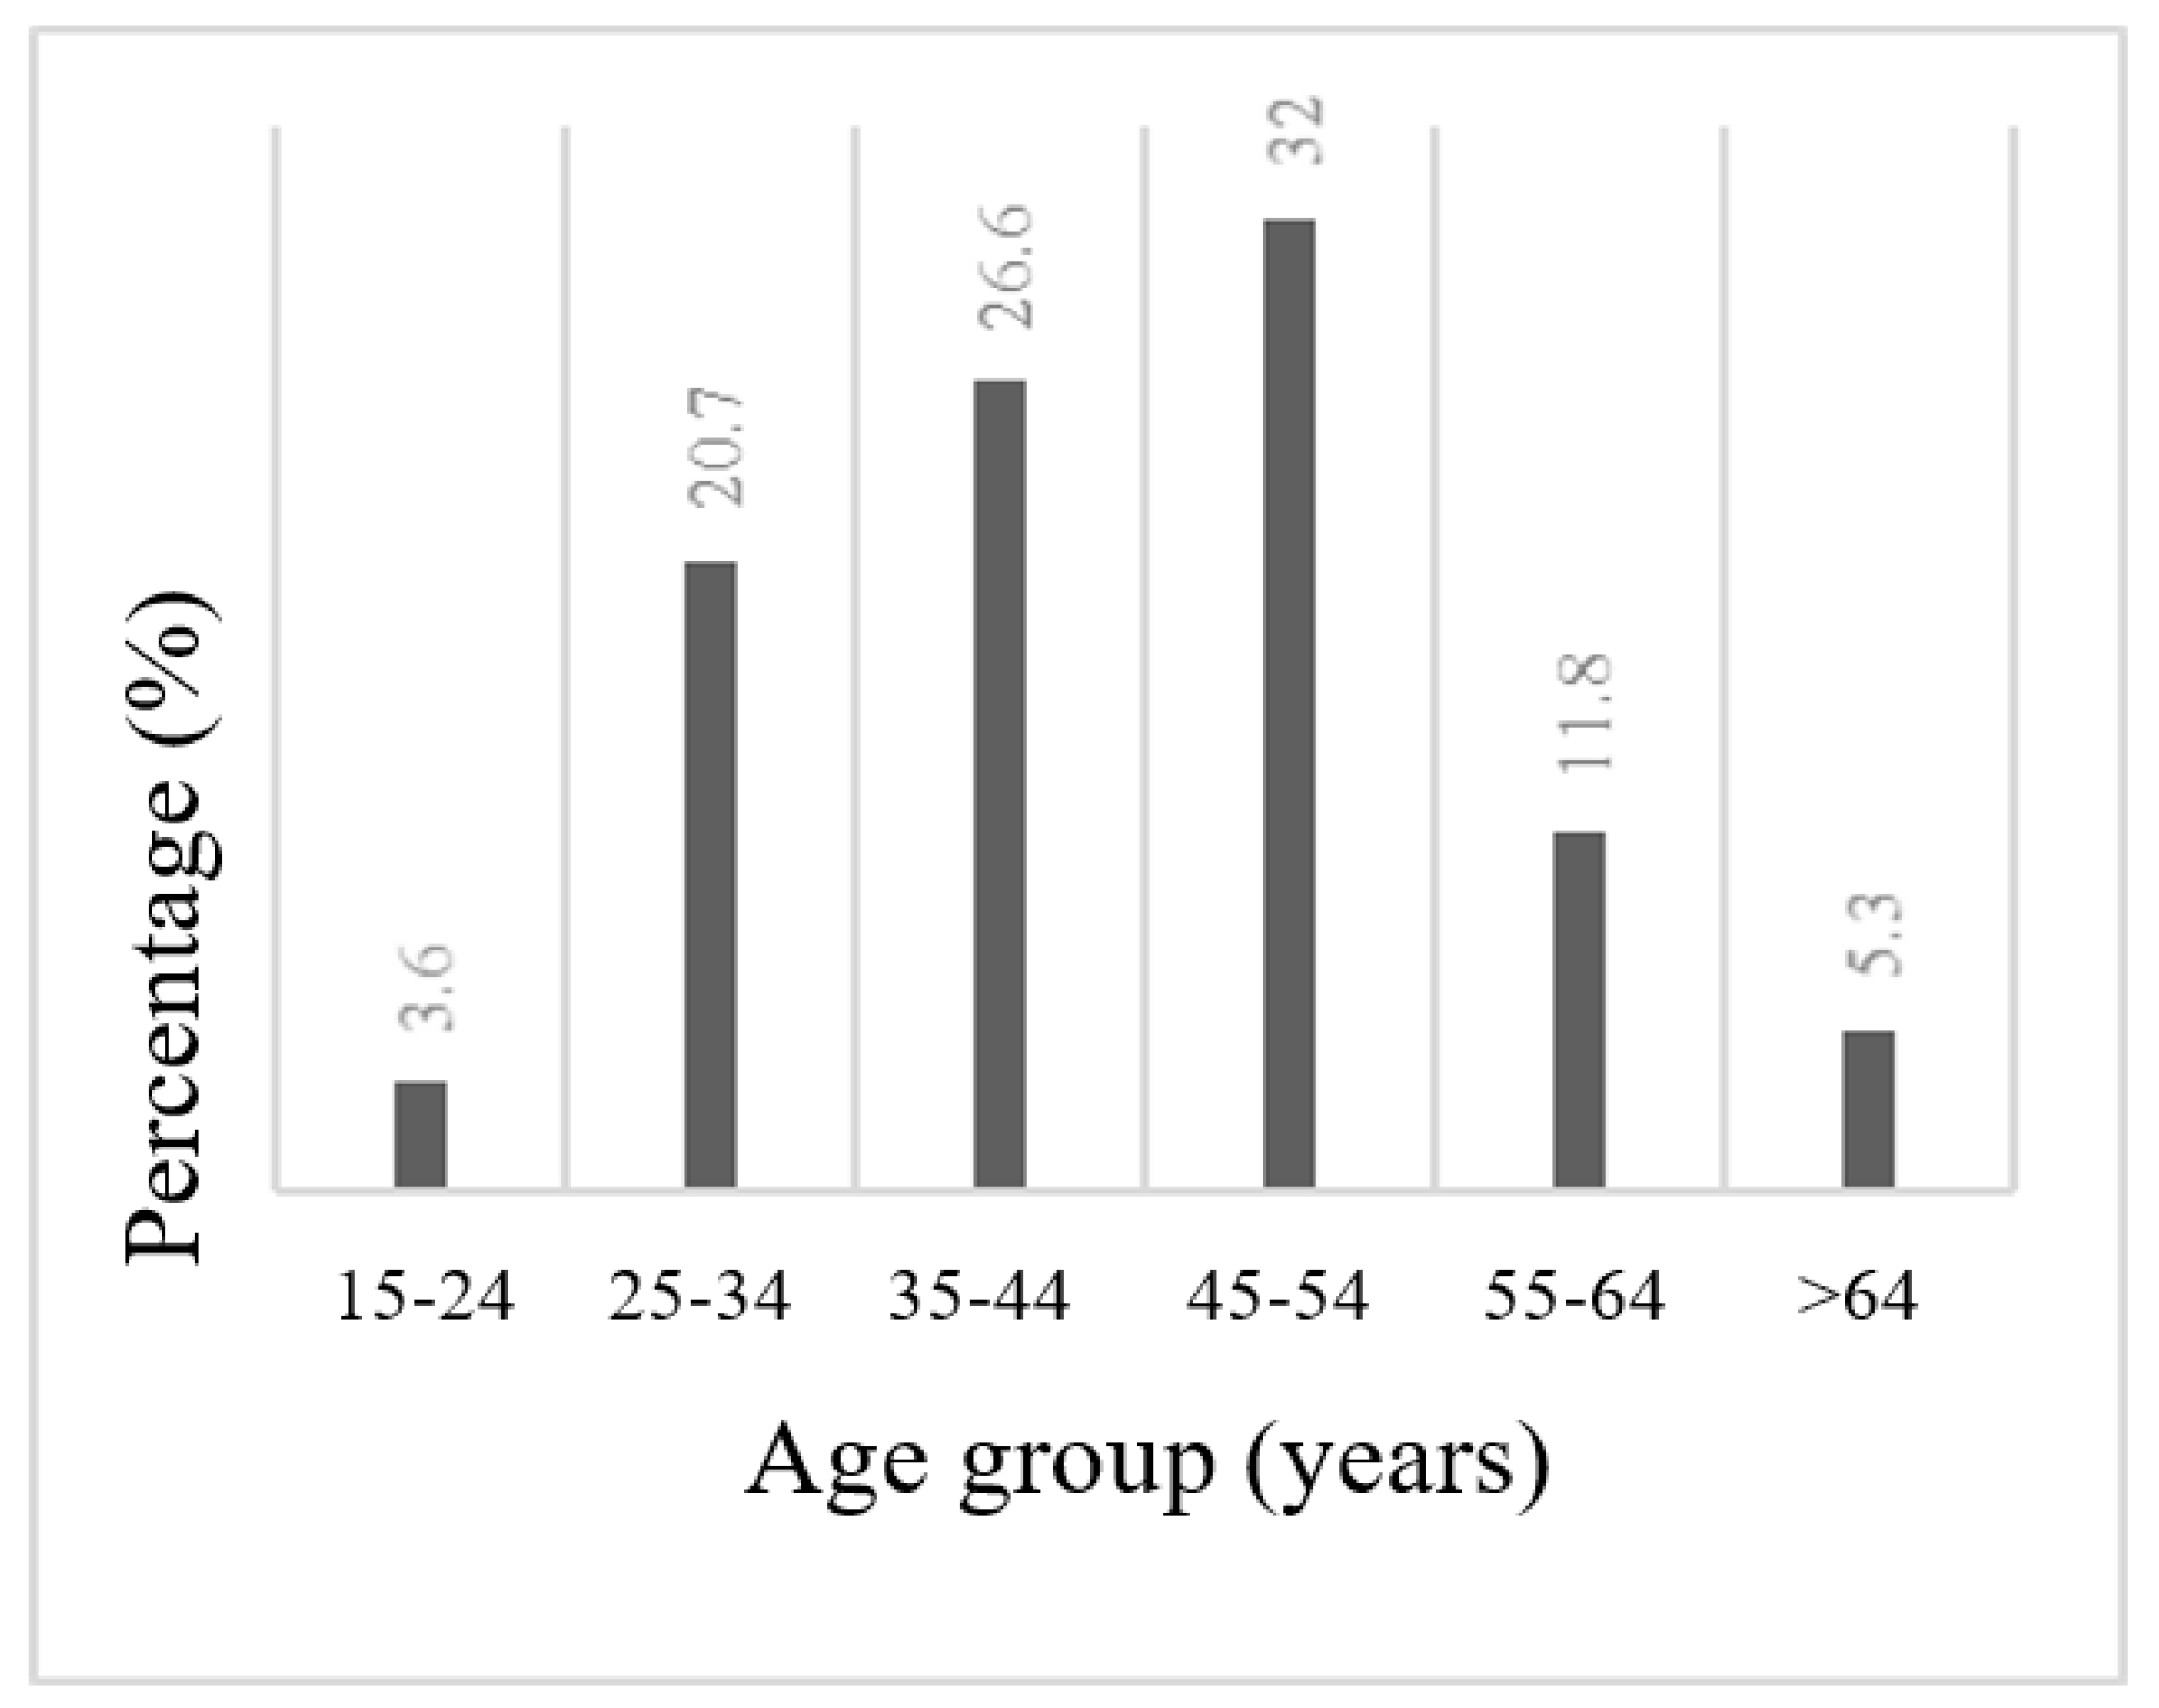
All of the interviewed fishers are males. Around 93% of them are married. Fishers’ average age is 44 years in a range of 22 to 82 years old. Average age is not significantly different among different type of boat users. As shown in Figure 3, around 51% of fishers are 15-44 years old, 32% are 45-54 years old and 17% are 55 years or older. To support the sustainability of fishing livelihood, the percentage of young fishers should be larger. Average fishers’ fishing experience is 22 years. Their fishing experience as a fisher starts when they catching fish by themselves not with their parents. Perhaps when they help their parents who also were fishers, they were not considering themselves as a fisher yet.
Fishers’ average years of education is 5.5 years, the majority of them have only attended elementary school. It is very low compared to the average education level in South Sulawesi Province in 2017 which is 10,5 years [18]. Household economic pressure forces their children to engage in fishing activities as soon as possible to generate more income and neglect their education. According to fishers’ response, they are following their father to catch fish when they were around 10 years old and since then they rarely go to school or even not go to school entirely. There is a high negative correlation between age and education level (Pearson test, r= -0.410, p=0.000 p<0.01). Young fishers tend to have a higher education than the older fishers.
Average number of household members is four people range between two to seven people. The average number of children of fishers’ family are 2.04 people ranging between one to five people. In the fisheries community, children are considered as an asset to support their fishing activity, especially the son. There is no significance different between means of household member, age, school period and experience of fishing for each category (One way ANOVA test) (Table 2).

3.2. Fishers’ boat and fishing tools

As explained early, fishers are categorized into six based on their boat type possession. All of the fishers in this research either own one type or two types of the boat, it is highly related to their financial capabilities. Majority of fishers are in Category 3 (25%) and Category 5 (57.3%), with only motor boat or outboard motor boat respectively. There are 41 fishers (27%) who rent or borrow the boat they are using now. As can be seen from Table 3, fishers who have motor boat relatively can go to farther place to catch fish compare to fishers who only have outboard motor boat and row boat.
Fishers are going for fishing alone or with their families, relatives or other fishers depend on their fishing boat size that allow them to bring more people. Targeted fish and fishing tools or net type that require more man power to be used also become the consideration to bring more people. There are fishers who do not possess any type, possess only one type, two, three, four and five types of fishing tool, 5 fishers (3.3%), 95 fishers (62.5%), 21 fishers (13.8%), 24 fishers (15.8%), 6 fishers (3.9%), and 1 fisher (0.7%) respectively. There are many combinations of fishing tools owned by fishers. Variation of the fishing tools of fishers let them to catch in different fishing ground and also aimed for different type of fish depend on the seasonality of fish. Thus, the more types of catching tools mean they have higher chances to catch more fish at various condition.

3.3. Fishers’ primary and secondary income

Among the fishers, 99% stated that their primary job is fishing. Average of their revenue from the primary job is Rp. 5,316,493 (US $ 386.06) per month. Then, 62 out of 152 of fishers have a secondary job. From 62 fishers, 46.7%, 29%, 18.7% of them have the second job as the farmer or seaweed farmer, labor and self-employment respectively. Only 40% of 152 fishers have a secondary job. Particularly, the respondents in this area do seaweed farming and rice farming. Farming is the most popular secondary job option for fishers in Takalar District. Their average revenue from secondary job is Rp. 1,370,819 (US $ 99.54) per month. For secondary jobs like fisheries related activities or seaweed farming, fishers generally engage in them along with catching fish. While in the windy season, fishers generally work as a labor, farmer or other jobs, because they cannot go for fishing as frequently like in the normal season. Therefore, fishers do their secondary job normally not every month. Thus, fishers highly depend from their fishing activity as their main income source.
In order to see poverty condition of fishers in this research, extreme poverty line (US $ 1.90) and poverty line (US $ 3.20) which was defined by the World Bank in 2015 is used. Based on the average of monthly net income from fishing activity divided by number of family members, fishers who use rowboat have average income of Rp. 16,706 (US $ 1.21) per day per person, that is considered as in extreme poverty. Fishers who use outboard motor boat have more income of Rp. 33,368 (US $ 2.42) per day per person which is between extreme poverty line and poverty line. Fishers who are using motor boat are better in terms of income with monthly income of Rp. 63,778 (US $ 4.63) per day per person, that is above the poverty line. Thus, it can be concluded that row boat and outboard motor boat fishers in Takalar District are in poverty while motor boat fishers are economically sufficient.
The highest catch per month is fishers from Category 1, however the highest selling price is fishers from Category 5 (Table 3). Fishers from Category 6 is the lowest in selling price among the fishers, perhaps because they sell their fish catch in home and shore. However, their fish catch is higher than fishers from Category 5, who are using outboard motor boat compare to them who only use rowboat. But, because of their selling price is much lower, their income also lower than the other fishers. There are no significant differences in sea fish catch and selling price for each category, but for fishing income, fishing variable cost and fishing fix cost are significantly different between the category (One way ANOVA test, p=0.000 p<0.001).
Table 4 contains the results of analysis of factors affecting fishers’ net income. Ordinary Least Square (OLS) regression analysis is used with dependent variable of fishers’ net income and thirteen independent variables (Table 4). The model can explain a significance variation of fishers’ net income with the adjusted R2 is 0.598. There are six factors that significantly affecting fishers’ net income, namely: fishing days, boat category, sea fish catch, fish selling price, variable cost, and second job. Fishing days has positive effect on fishers’ net income. Currently, average fishers’ fishing days is 21 days per month, however, fishers’ fishing days highly related to weather condition, their health condition, and also their fishing tools or boat conditions. Fishers are still using traditional knowledge and direct observations to predict the weather, such us by looking at the stars, clouds, birds and other natural phenomena. Fisheries department, BMKG (Meteorological, Climatological, and Geophysical Agency of Indonesia) and local TV channel or radio channel can work together to provide weather forecast, rainfall, wind and other information to people who are working closely to natural environment especially fishers.
Boat category has significant impact on fishers’ net income, the better their boat, the higher their income. However, this issue is not an easy thing to solve, because this is related to fishers’ financial capital to afford better boat. Some solution can be done to improve fishers boat possession. For instance, establishing cooperation for fishers, which give a loan or credit service to the fishers in order to buy a boat with low payment rate per month, no interest rate and no fine if the payment is late. All this time, fishers cannot get loan or credit service from bank, because they need to submit a bail, for example land certificate or house certificate, which many of fishers do not have. Even if they have, the loan will only be small amount or the bank themselves do not want to give because of high risk of the loan or credit fund cannot be paid back by fishers. Thus, most of the fishers only have option to borrow money from money lender or village collector (Papalele in local term).
Other possible solution is by reviving or establishing fisheries association, because based on interview results with fishers, there were no any activities, training, or working as a group for fishing activities. By establishing fisheries association, it can provide support to other fishers. In the association, saving money system to buy a boat for collective use or for individual use can be arranged by themselves. This can be applied if all the fish catch of each member are sold to the fisheries association, after that the association will sell it to the market with higher price and better bargaining position. In this case the profit will be back to fishers themselves rather than going to other parties. Through fisheries association also, aid or assistance from fisheries department can be well managed, instead of giving boat or net to individual fisher, it can be used by all member in rotation, hence the scope of the support can be enlarged and many fishers can be benefitted.
Sea fish catch is one of the significant factors that positively affect fishers’ net income. There are many reasons why fishers’ fish catch is low, such as because of bad environmental condition so that fish stock in the area is low, unproper fishing tools, too many people catching in the same fishing ground, limited man power or effort spend because of individual fishing, and so on. Further research needs to be done to reveal the exact reason for the specific case in the research site. However, one thing can be applied to increase the chance to increase fish catch, by collectively catching fish with other members of fisheries association. In that way, it might have higher chance to obtain more fish catch in each fishing trip.
Selling price also has positive significant effect to fishers’ net income. In most cases fishers sell their fish with low price to Papalele because they have contract with the Papalele. First of all, there should be a regulation from government about fish floor price in the market to make sure small-scale fishers are not exploited when selling the fish. Secondly, fishers should be encouraged to sell their fish in fish market set up by fisheries department, where fishers will be able to sell their fish directly to the consumer. Fisheries association also can facilitate the fishers to sell their fish in the market with higher price. Variable cost has negative significant effect to fishers’ net income. There are six items from variable cost, namely: fuel, ice, labor, food, bait, and general maintenance. Among all of them only general maintenance does not have significant correlation to variable cost (Pearson correlation test). Further research is needed to see whether they use those items efficiently for their fishing activities and to see whether there is a way to reduce their variable cost in order to increase their net income.
Second job has positive significant effect to fishers’ net income. Thus, having secondary income for fishers is a solution for them to earn more income, especially in windy and rainy season. South Sulawesi is the biggest contributor (3,339,048 ton or equivalent to 30.2% of total seaweed production) of seaweed product (Eucheuma cottoni and Gracilaria verrucosa) in Indonesia in 2016 [19]. In 2016, seaweed production in Takalar District was 1,034,305 ton where the trend is increasing over the years [20] (MAFDSS, 2017). Thus, seaweed aquaculture has big potential to be developed as secondary or even main income source for fishers in Takalar District.
As the conclusions, the results revealed that small-scale fishers are in poverty condition especially for fishers who only possess row boat and outboard motor boat. There are three solutions that can be applied to improve and diversify small-scale fishers’ livelihood, firstly by participation of government agencies (MMAFI, MAFD of South Sulawesi and Takalar District), NPO, and NGO to provide fishers with weather or other related information and by establishing small-scale cooperation as funding or loan resource for the fishers. Second, by reviving or re-establishing fisheries association with good management system that not only is organized by fishers but also external stakeholder, which will provide support for small-scale fishers to work as a team. Thus, reviving or re-establishing fisheries association is viewed as the key solution to improve fishers’ livelihood, living condition, and beyond that is expected to develop rural fishing community. Third, as expected from a job that highly depend on natural resources, the result is very low especially for small-scale fishers, thus fishers need to expand their livelihood options as other income source, for example lobster, shell, fish, or seaweed aquaculture, or non-fisheries related job. It can be better if it can be done as a community business manage by fisheries association.

Author Contributions

Conceptualization, A.I.M.; Data Collection, A.I.M.; Data Process, A.I.M.; Writing – Original Draft Preparation, A.I.M; Writing – Review & Editing, M.F, T.K. and M.S.; Supervision, M.F, T.K. and M.S.

Funding

The flight and accommodation for the research was funded by university and the university will also fund the publication costs.

Informed Consent Statement

This research has received permit to conduct the research by National Unity and Politics Takalar District, and approved by District Office, Sub-District Office and Village Office in Takalar District where the research was conducted. Before conducting the interview, the author explains about the purpose of the research and how the research will be caried out and consent from each of participant also obtained.

Acknowledgments

The author would like to convey sincere gratitude for all of people who had contributed in this research, including fishers and fisheries department officers who had helped during the data collection, supervisors and colleagues who had contribute during script preparation. This paper is submitted as a part of doctoral study’s requirement at the United Graduate School of Agriculture, Kagoshima University.

Conflicts of Interest

The authors declare no conflict of interest.

References

  1. MMAFI, 2016. Konsumsi Ikan Naik dalam 5 Tahun Terakhir Kementerian Kelautan dan Perikanan. Available at: http://kkp.go.id/wp-content/uploads/2016/05/Konsumsi-Ikan-Naik-dalam-5-Tahun-Terakhir.pdf Accessed on 13 March 2017.
  2. Tajerin, Yusuf, R., Sastrawidjaja, and Asnawi, 2007. Keterkaitan Sektor Perikanan Dalam Perekonomian Indonesia: Pendekatan Model Input-Output. J. Bijak dan Riset Sosek KP, 2(1).
  3. Winter, G. (Ed)., 2009. Towards Sustainable Fisheries Law. A Comparative Analysis. Switzerland: International Union for Conservation of Nature and Natural Resources (IUCN).
  4. FAO, 2018. The State of World Fisheries and Aquaculture 2016. Contributing to food security and nutrition for all. Rome: Food and Agriculture Organization of the United Nations.
  5. Martins, I. M., Medeiros, R.P., Domenico, M.D. and Hanazaki, N., 2018. What Fishers’ Local Ecological Knowledge Can Reveal about the Changes in Exploited Fish Catches. Fisheries Research, 198, pp.109-116.
  6. FAO, 2008. Achieving Poverty Reduction Through Responsible Fisheries. Rome: Food and Agriculture Organization of the United Nations.
  7. Akbarsyah, N., Wiyono, E. S., and Solihin, I., 2017. Dependency and Perception of Handline Fishermen towards Fish Resources at Prigi Trenggalek East Java. Marine Fisheries, 8(2), pp. 199-210.
  8. Setiawan, I., 2008. Keragaan Pembangunan Perikanan Tangkap: Suatu Analisis Program Pemberdayaan Nelayan Kecil. Indonesia. Bogor Agricultural University (Unpublished). Available at: https://repository.ipb.ac.id/handle/123456789/41045 (Accessed: 17 August 2021).
  9. Salam, M., 2005. Poverty Structure in Indonesian Forest Area: A Comparative Study on Poverty Structural Causal Model of Forest and Non-Forest Communities. Japan: Ryukoku University (Unpublished).
  10. Hafsaridewi, R., Fahrudin, A., Sulistiono, Sutrisno, D., and Koesshendrajana, S., 2018. Fishers’ Resilience to the Availability of Fishery Resources in Karimunjawa Island. Journal of Natural Resources and Environmental Management, 9(2), pp. 527-540. [CrossRef]
  11. Bene, C., 2003. When Fishery Rhymes with Poverty: A first Step Beyond the Old Paradigm on Poverty in Small-scale Fisheries. World Development, 31(6), pp.949-975. [CrossRef]
  12. Statistics Agency of Indonesia, 2021. Jumlah Perahu/Kapal Menurut Provinsi dan Jenis Perahu /Kapal, 2000-2016. Available at: https://www.bps.go.id/statictable/2014/01/10/1710/jumlah-perahu-kapal-menurut-provinsi-dan-jenis-perahu-kapal-2000-2016.html (Accessed: 2 September 2021).
  13. MMAFI, 2017. Laporan Tahunan Kementerian Kelautan dan Perikanan Tahun 2017. Indonesia: Tahunan Kementerian Kelautan dan Perikanan Tahun Republik Indonesia.
  14. Statistics Agency of South Sulawesi Province, 2021. Jumlah Rumah Tangga Perikanan Tangkap 2014-2015. Available at: https://sulsel.bps.go.id/indicator/56/980/1/jumlah-rumah-tangga-perikanan-tangkap.html (Accessed on 2 September 2021).
  15. Statistics Agency of Takalar District, 2016. Kabupaten Takalar Dalam Angka 2016. Indonesia: Badan Pusat Statistik Kabupaten Takalar.
  16. Statistics Agency of Takalar District, 2018. Kabupaten Takalar Dalam Angka 2018. Indonesia: Badan Pusat Statistik Kabupaten Takalar.
  17. Indonesian Constitution, 2019. Undang-Undang Republik Indonesia Nomor 45 Tahun 2009 Available at: https://pelayanan.jakarta.go.id/download/regulasi/undang-undang-nomor-45-tahun-2009-tentang-perikanan.pdf (Accessed: 4 April 2019).
  18. Statistics Agency of South Sulawesi Province (2018a). Education. Available at: https://sulsel.bps.go.id/subject/28/pendidikan.html#subjekViewTab3 (Accessed: 15 November 2018).
  19. MMAFI, 2019. Peluang Usaha dan Investasi Rumput Laut. Indonesia: Ditjen Penguatan Daya Saing Produk kelautan dan Perikanan, Kementrian Kelautan dan Perikanan Republik Indonesia.
  20. MAFDSS, 2017. Komoditas Unggulan Rumput Laut. Available at: http://panel. sulselprov.go.id/pages/komoditas-unggulan-rumput-laut (Accessed on 18 January 2022).
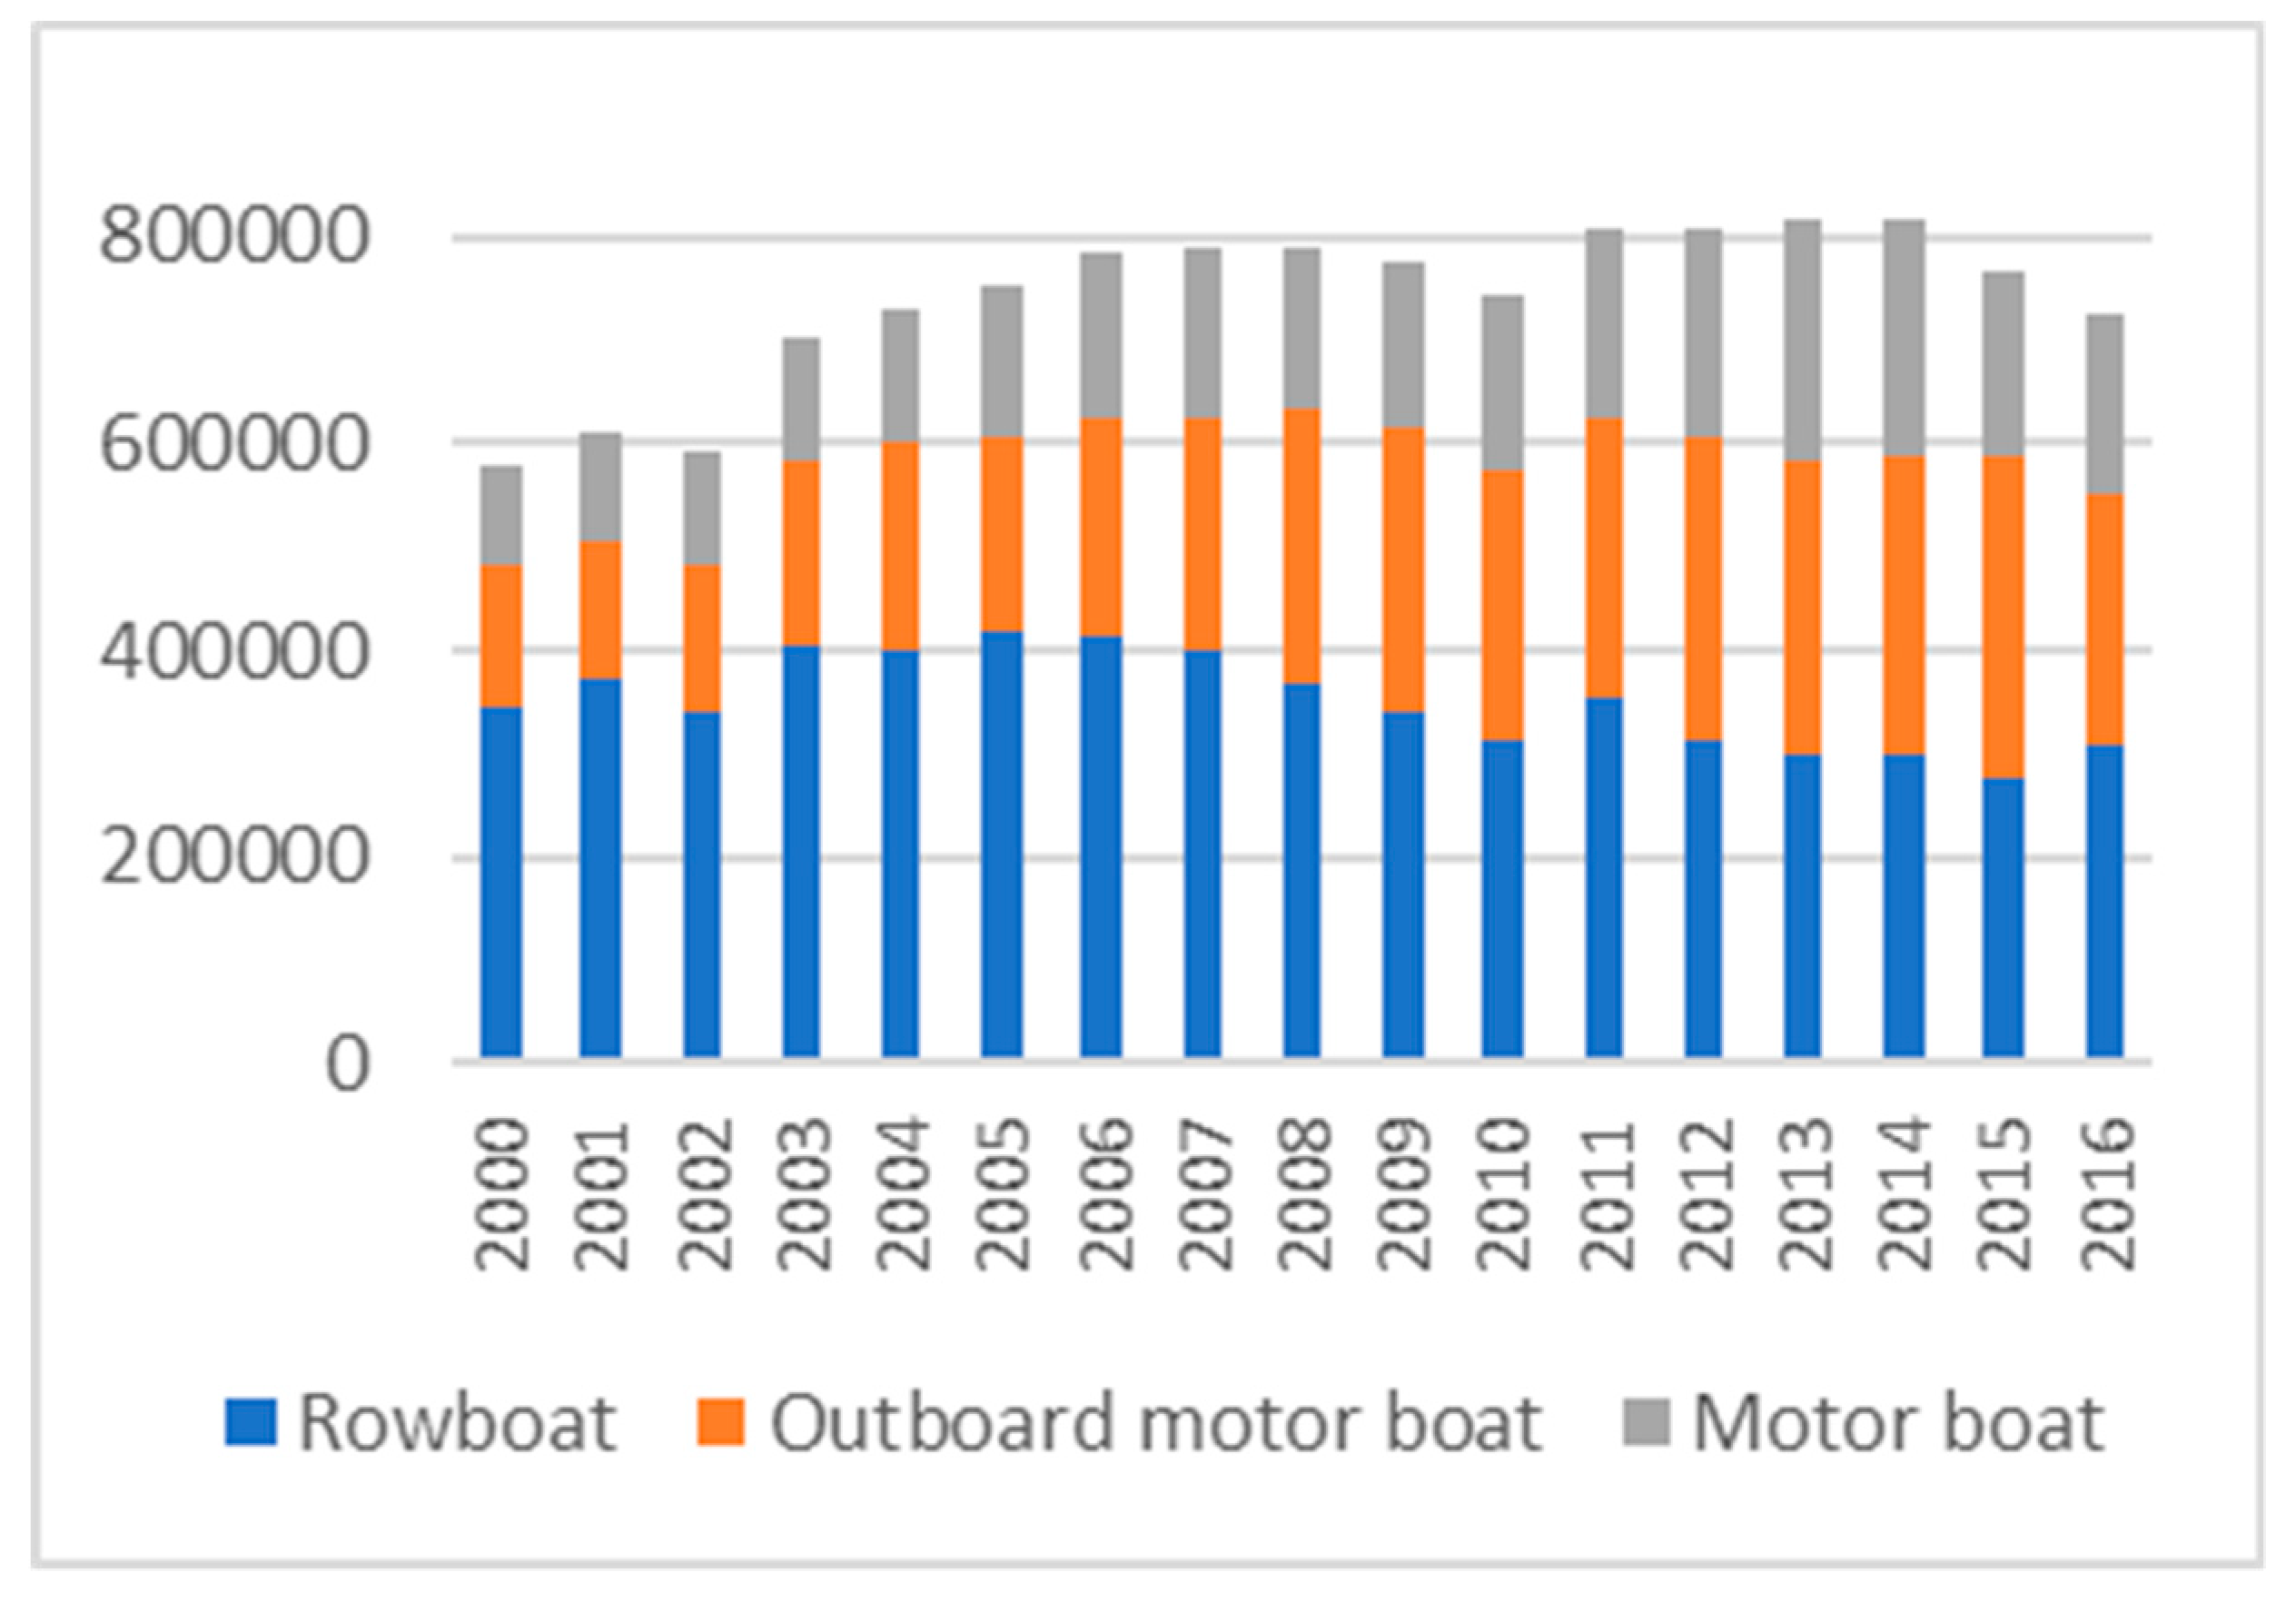
Figure 1. Boat possession of fishers in Indonesia (Source: Statistics Agency of Indonesia, 2021).
Preprints 80742 g001
Figure 2. Map of the Research Site, Takalar District.
Preprints 80742 g002
Figure 3. Fishers’ Age Distribution (Source: Sample Survey Conducted by the Author in February and March, 2018).
Preprints 80742 g003
Table 1. Fishing Boat’s Characteristics.
Type Characteristic
Fishing ground Driving force Size and price
Rowboat (RB)*
Shore (0-5 km)
Single day fishing
Manpower (paddle) Length is 2-4 meter, width is 50-75 cm
Rp. 700,000 – Rp. 2,000,000 or
US $ 51 – $ 145**
Preprints 80742 i001
Outboard Motor Boat (OMB)*
Off-shore (0-20 km)
Single day fishing
Single motor
(can be removed or installed outside of boat before going to catch fish)
Length is 3-7 meter,
width 75-100 cm
Rp. 8,000,000 – Rp. 15,000,000 or US $ 581 – $ 1,089**
Preprints 80742 i002
Motor Boat (MB)*
Off-Shore (More than 20 km),
Multi-day fishing

Single/ double motor (installed permanently inside the boat)
Length is 10–15 meter, width 100-200cm
Rp. 50,000,000 –
Rp. 100,000,000 or
US $ 3,630 - $ 7,261**
Preprints 80742 i003
Source: Sample Survey Conducted in Takalar District by the Author in February and March 2018. Note: * MB: Motor Boat, OMB: Outboard Motor Boat, RB: Row Boat, ** US $ 1 = Rp. 13,771 (at the time of data collection).
Table 2. Social Characteristic of Fishers.
Category Type of boat based on the category* No. of Fisher % Household member
(people)
Age
(years)
School period
(years)
Experience in fishing
(years)
1 MB + OMB 5 3.3 4.2 45.4 7.2 23.8
2 MB + RB 6 3.9 4.5 42.0 5.0 23.7
3 MB 38 25.0 4.1 41.2 6.4 16.5
4 OMB + RB 7 5.3 3.6 44.3 5.7 19.9
5 OMB 88 57.3 4.5 45.1 5.1 24.8
6 RB 8 5.3 4.5 45.1 3.75 18.0
Average in total 4.2 43.9 5.5 22.1
Source: Sample Survey Conducted by the Author in February and March, 2018. Note: * MB: Motor Boat, OMB: Outboard Motor Boat, RB: Row Boat.
Table 3. Fishing activities, catch, selling price, income and cost .
Category Fishing day/
month
Sea fish catch/
month (kg)
Selling place Fishing ground (km) Selling price/kg
(rupiah)
Average revenue Variable cost Fix Cost
(thousand Rp./month)
1 24.8 258.0 Local market and city market 45.2 40,000 8,017 2,951 2,798
2 22.7 195.3 Shore and road side 23.6 45,416
3 21.6 128.4 Road side and local market 19.6 43,842
4 21.7 178.6 Home, shore and road side 18.4 30,071 4,194 1,214 1,436
5 20.8 144.6 Road side and local market 11.4 47,579
6 25.5 174.5 Home and shore 7.3 14,875 2,100 1,027 0
Average 21.5 149.4 20.9 43,782 5,317 1,759 1,795
Source: Sample Survey Conducted by the Author in February and March, 2018.
Table 4. Regression analysis of factors affecting fishers’ net income .
Variable Description Measurement Coefficient t Statistic
Constant Intercept term -270844.2 -0.227
Age Fishers’ age Years 5197.9 0.320
School period Formal school period attended by fishers Years -10766.7 -0.247
Fishing experience Fishers’ fishing experience or how long they have been a fisher Years -2916.8 -0.186
Household members Number of household member living in the same house including the fishers themselves People -21283.7 -0.190
Fishing days Number of days spend for fishing in a month Days 49810.6 2.245*
Boat category Boat ownership category (Table 2) Categorical data (1-6) -408624.9 -2.859*
Sea fish catch Number of fish catch by fishers in a month Kg 15888.2 8.670**
Fish selling price Selling price of fish per kilogram Rupiah 37.3 5.552**
Fishing ground Distance from the shore to the fishing ground Km 4052.5 0.241
Total net Total number of net or catching tools possess by fishers Nets 180.5 0.127
Fix cost Fix cost spends by fishers for fishing activity in a month Rupiah -1.297 -0.845
Variable cost Variable cost spends by fishers for fishing activity in a month Rupiah -0.4 -2.424*
Second job Availability of second job of fishers Dummy (0=No, 1=Yes) 1710017.0 5.501**
Net income Total fishers’ primary job and secondary job incomes minus variable cost and fix cost
N 98
R2 0.652
Adj-R2 0.598
F- value 12.081
Source: Sample Survey Conducted by the Author in February and March, 2018. Note: *significant at 0.05 level, **significant at 0.001 level.
Disclaimer/Publisher’s Note: The statements, opinions and data contained in all publications are solely those of the individual author(s) and contributor(s) and not of MDPI and/or the editor(s). MDPI and/or the editor(s) disclaim responsibility for any injury to people or property resulting from any ideas, methods, instructions or products referred to in the content.
Copyright: This open access article is published under a Creative Commons CC BY 4.0 license, which permit the free download, distribution, and reuse, provided that the author and preprint are cited in any reuse.
Prerpints.org logo

Preprints.org is a free preprint server supported by MDPI in Basel, Switzerland.

Subscribe

© 2024 MDPI (Basel, Switzerland) unless otherwise stated