Submitted:
27 July 2023
Posted:
31 July 2023
You are already at the latest version
Abstract
Keywords:
1. Introduction
3. Materials and Method
3.1. Materials
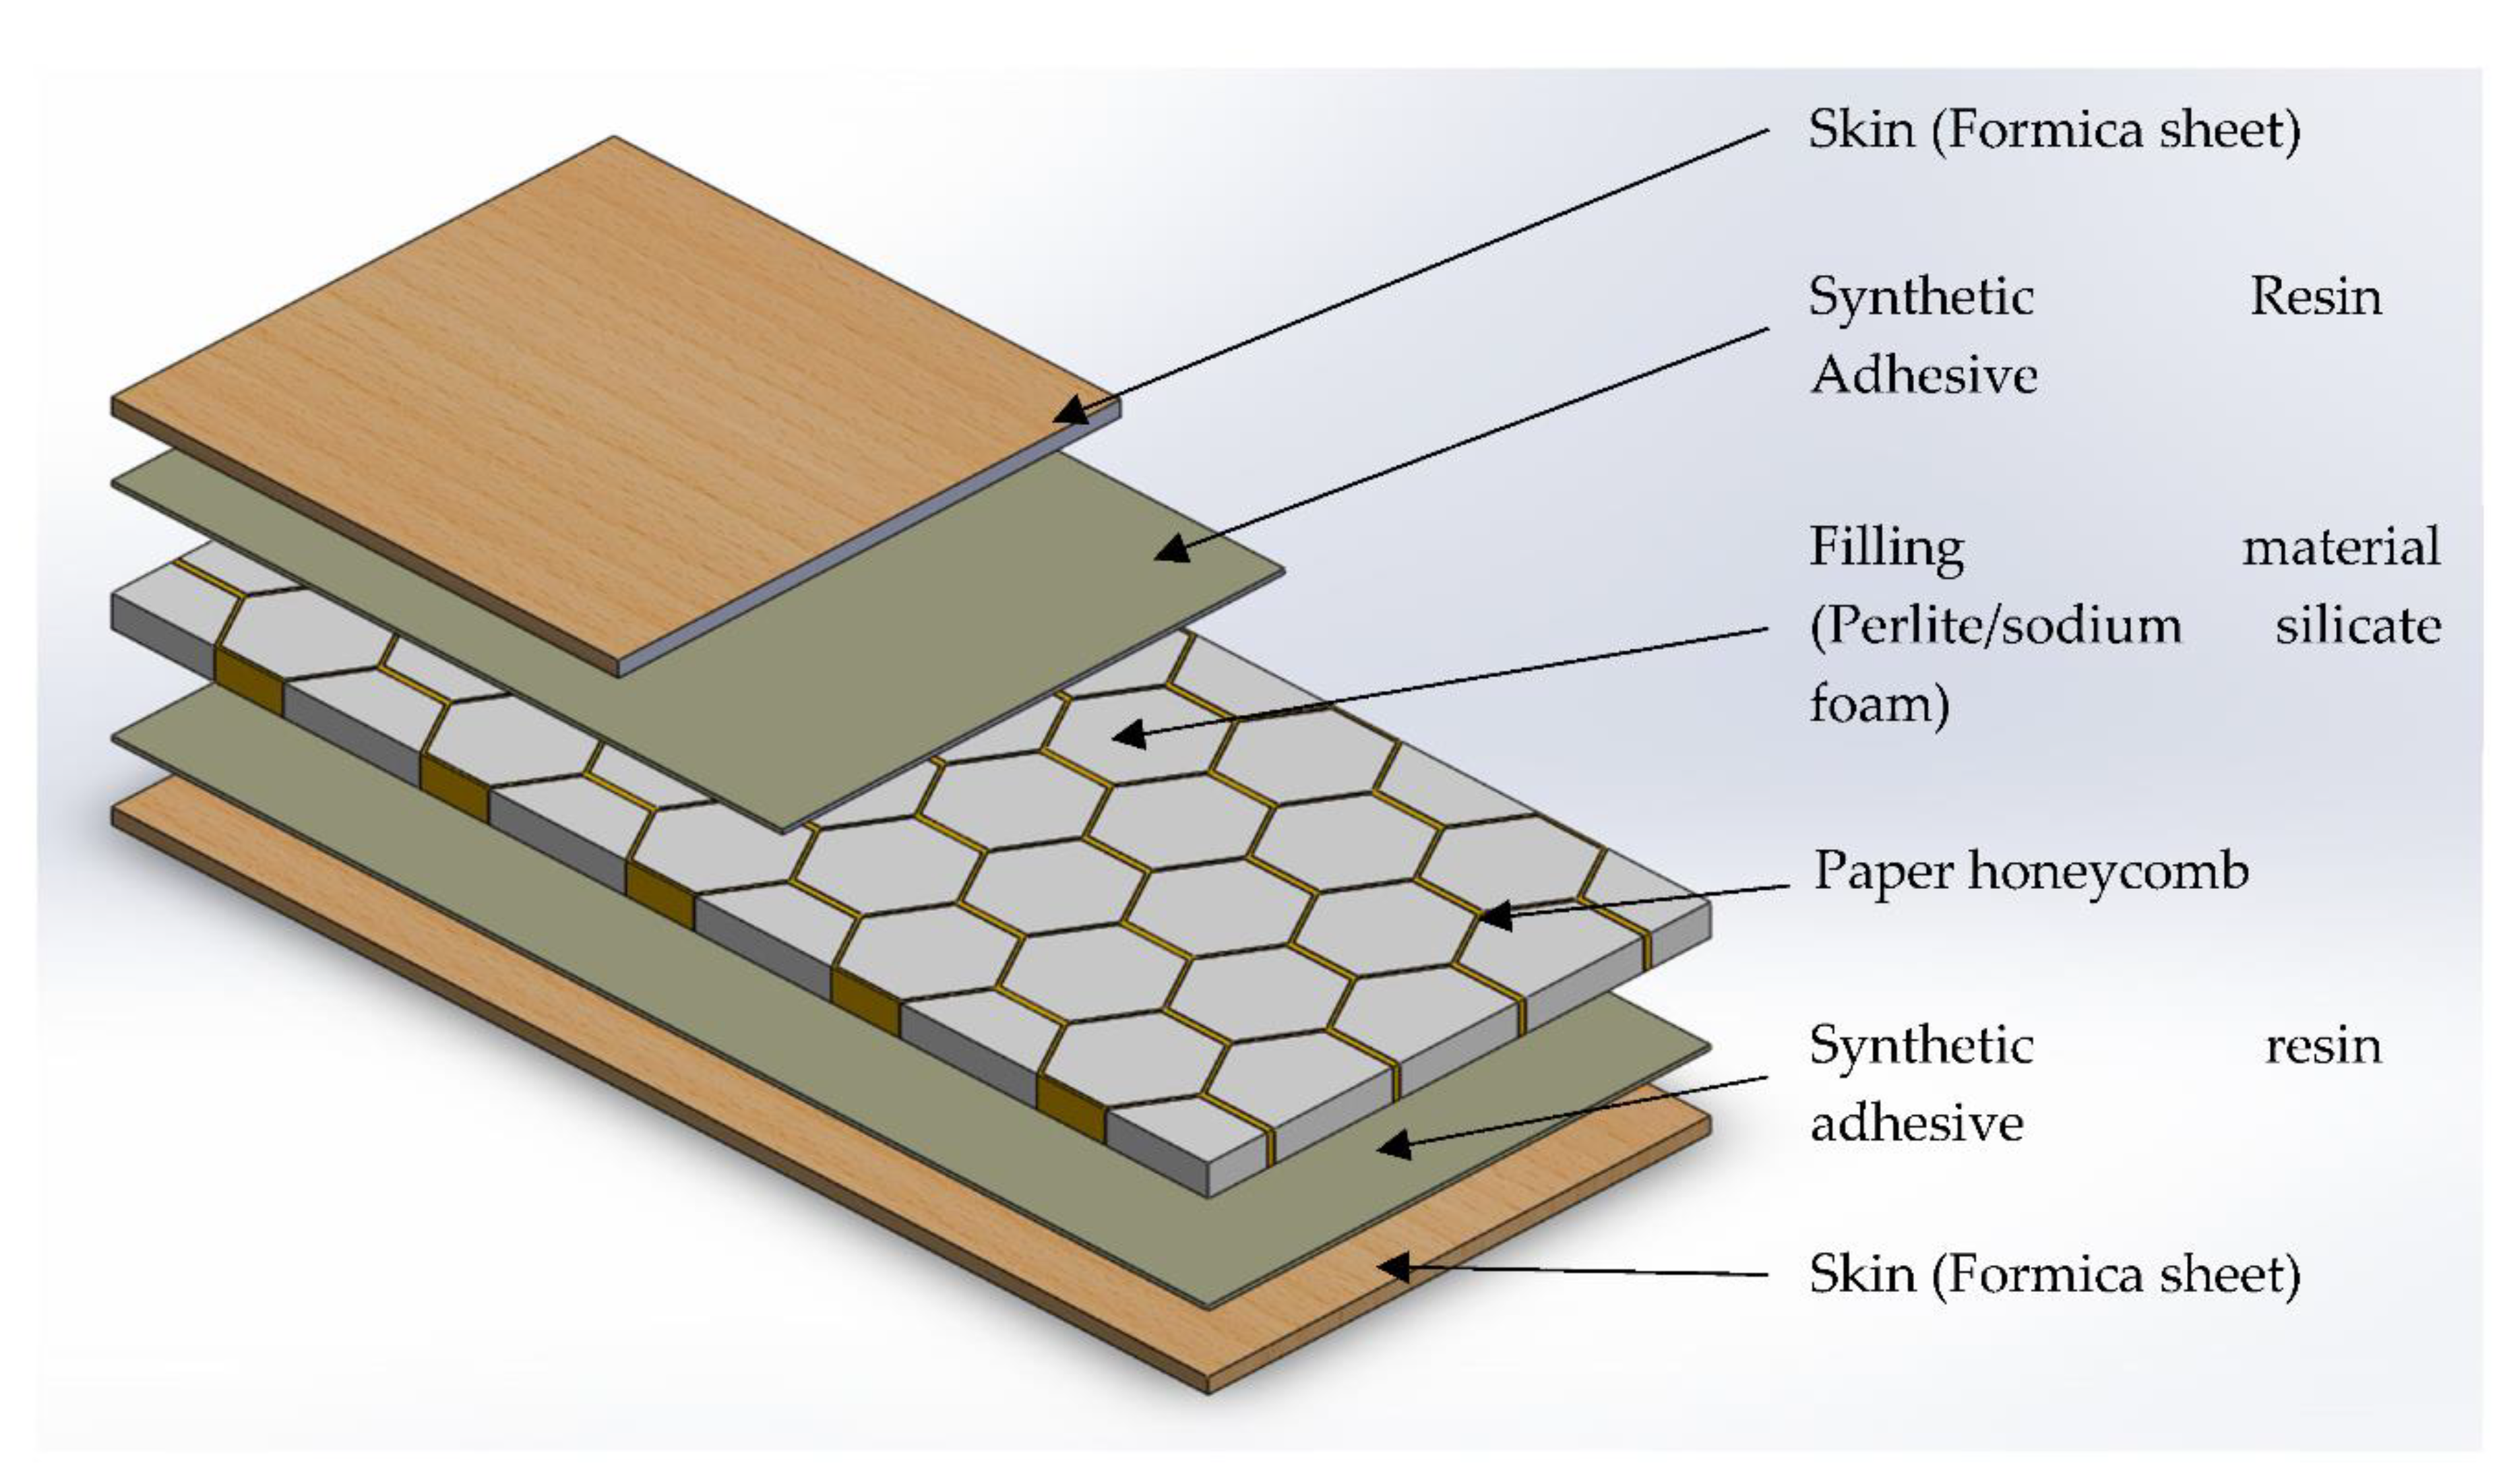
| Sample | Tensile strength (MPa) | Tensile modulus (GPa) | Failure strain (%) |
| Formica sheet | 57.89 (4.73) | 8.91 (0.23) | 0.69 (0.05) |
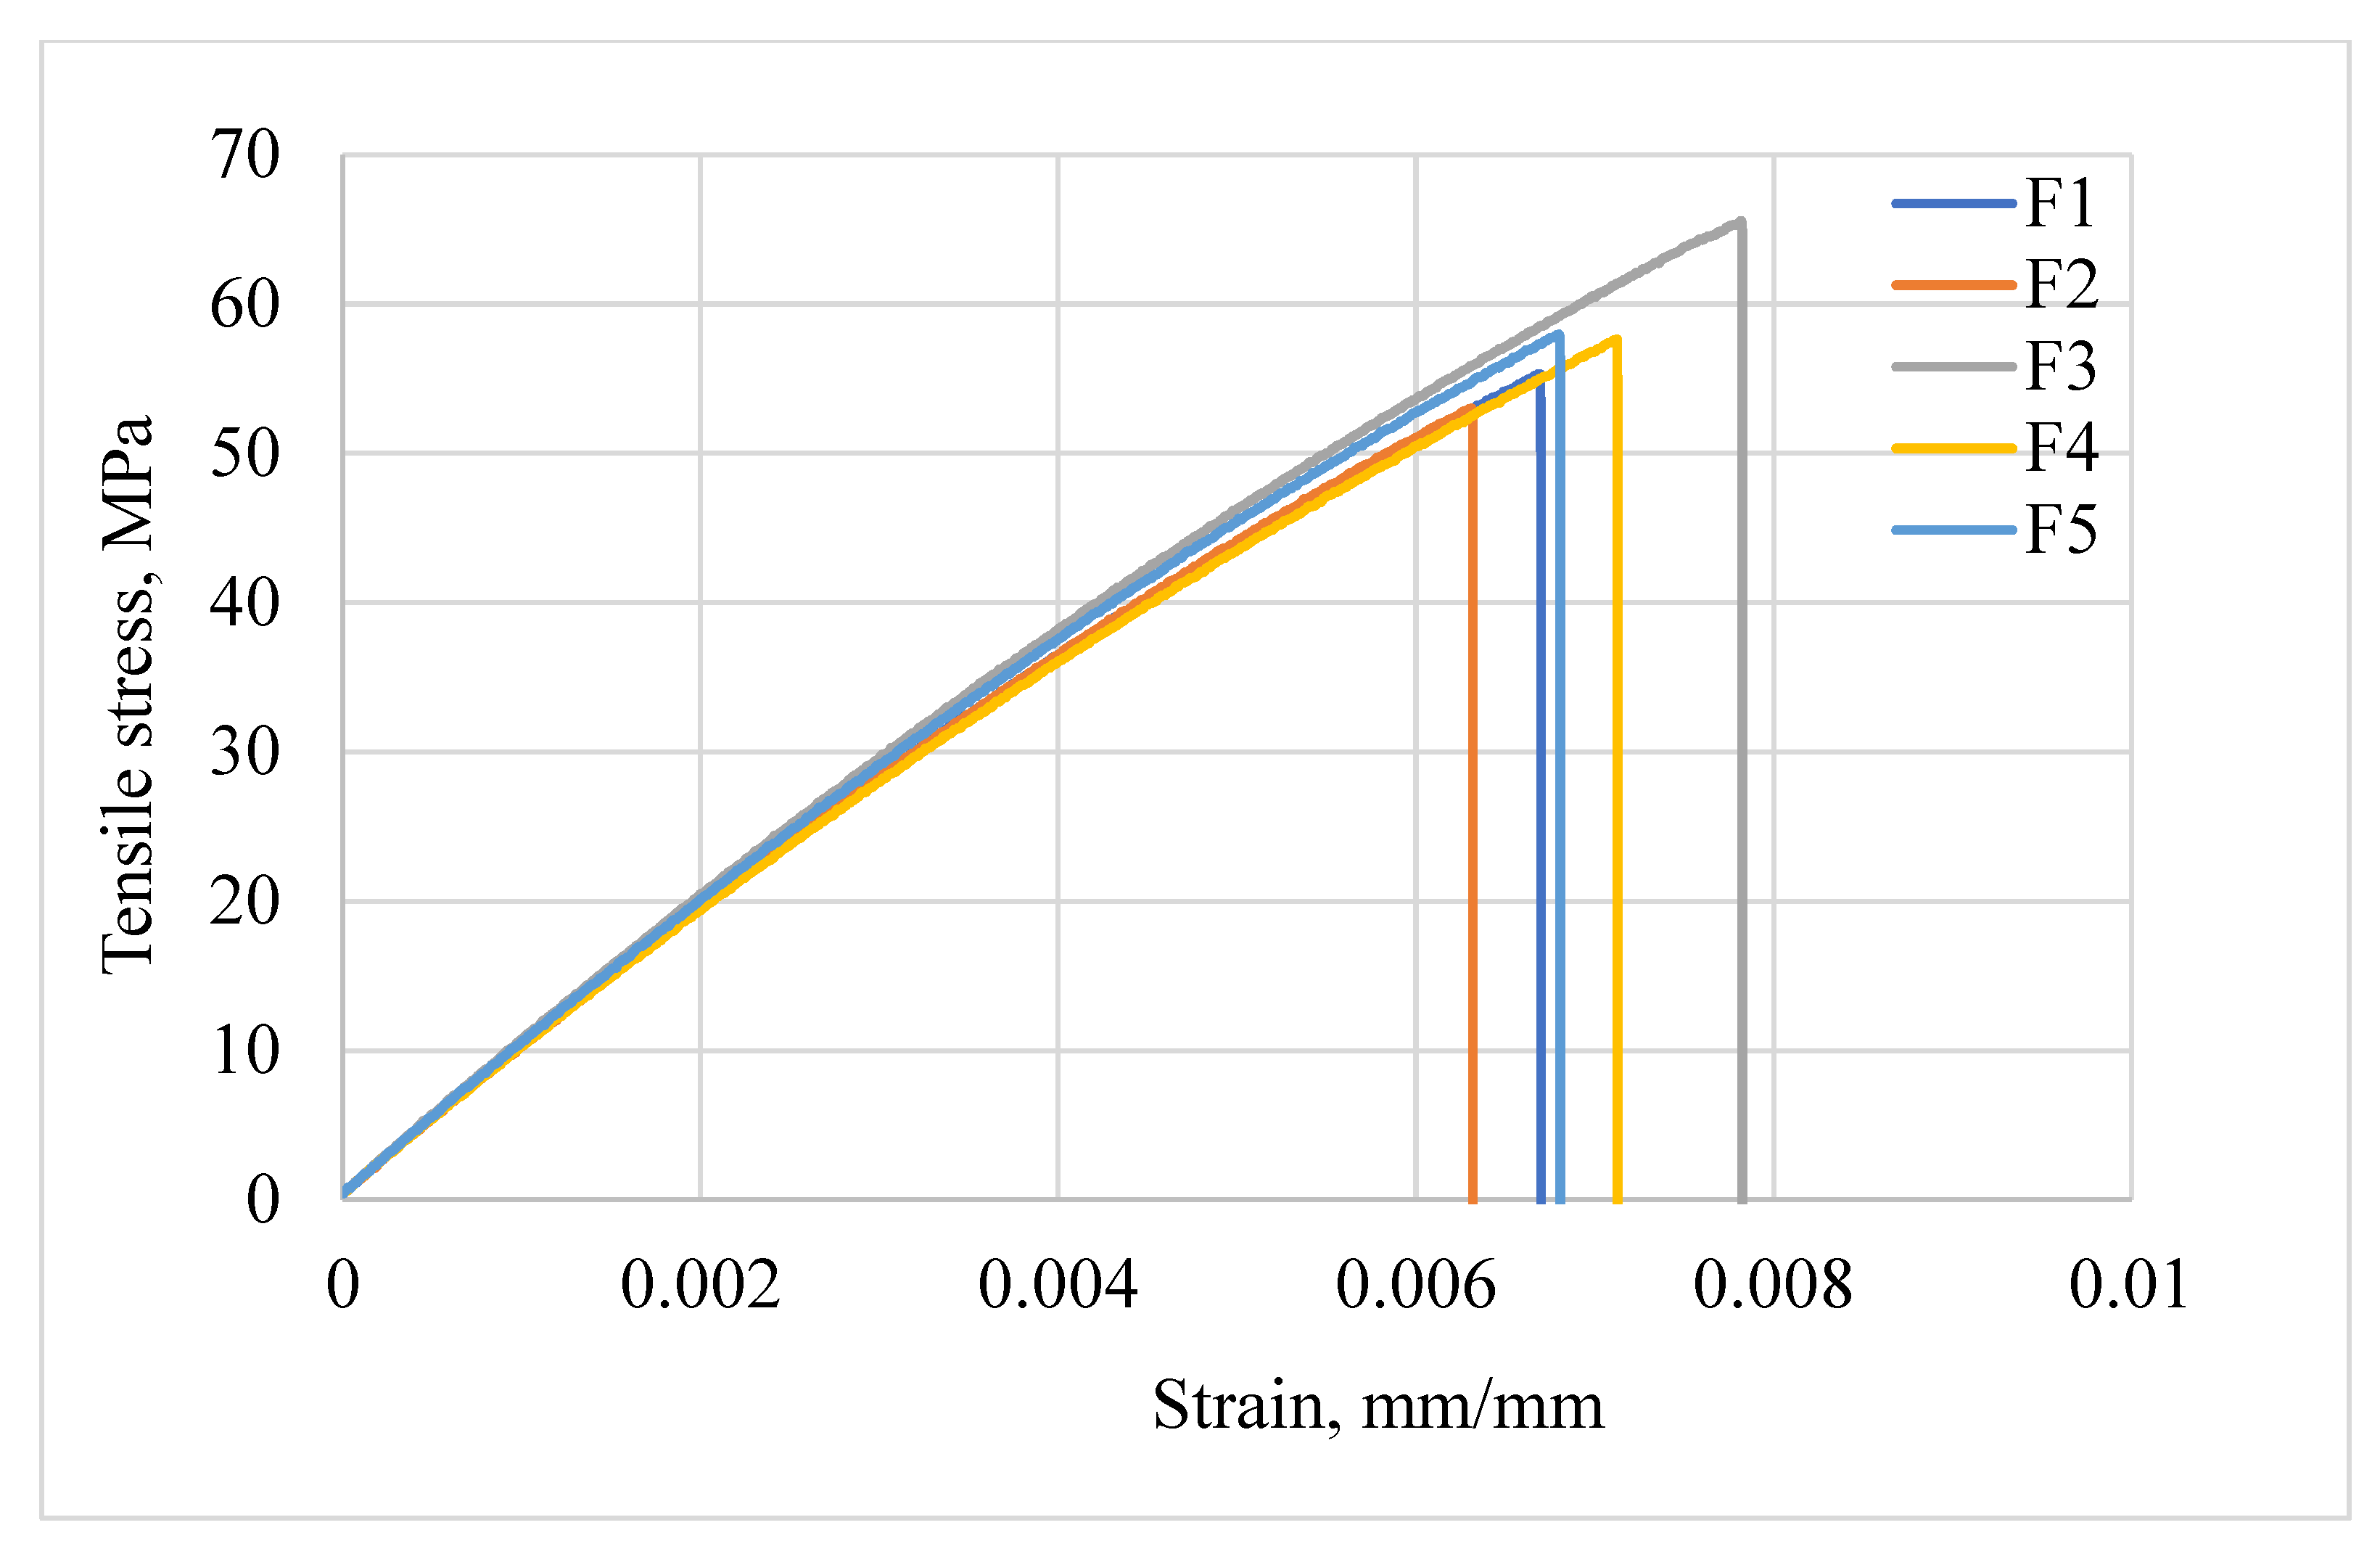
| Sample ID | Sodium silicate solution, wt. % | Water, wt. % |
| FHCS-100, FCS-100 | 100 | 0 |
| FHCS-90, FCS-90 | 90 | 10 |
| FHCS-80, FCS-80 | 80 | 20 |
3.2. Specimen Preparation
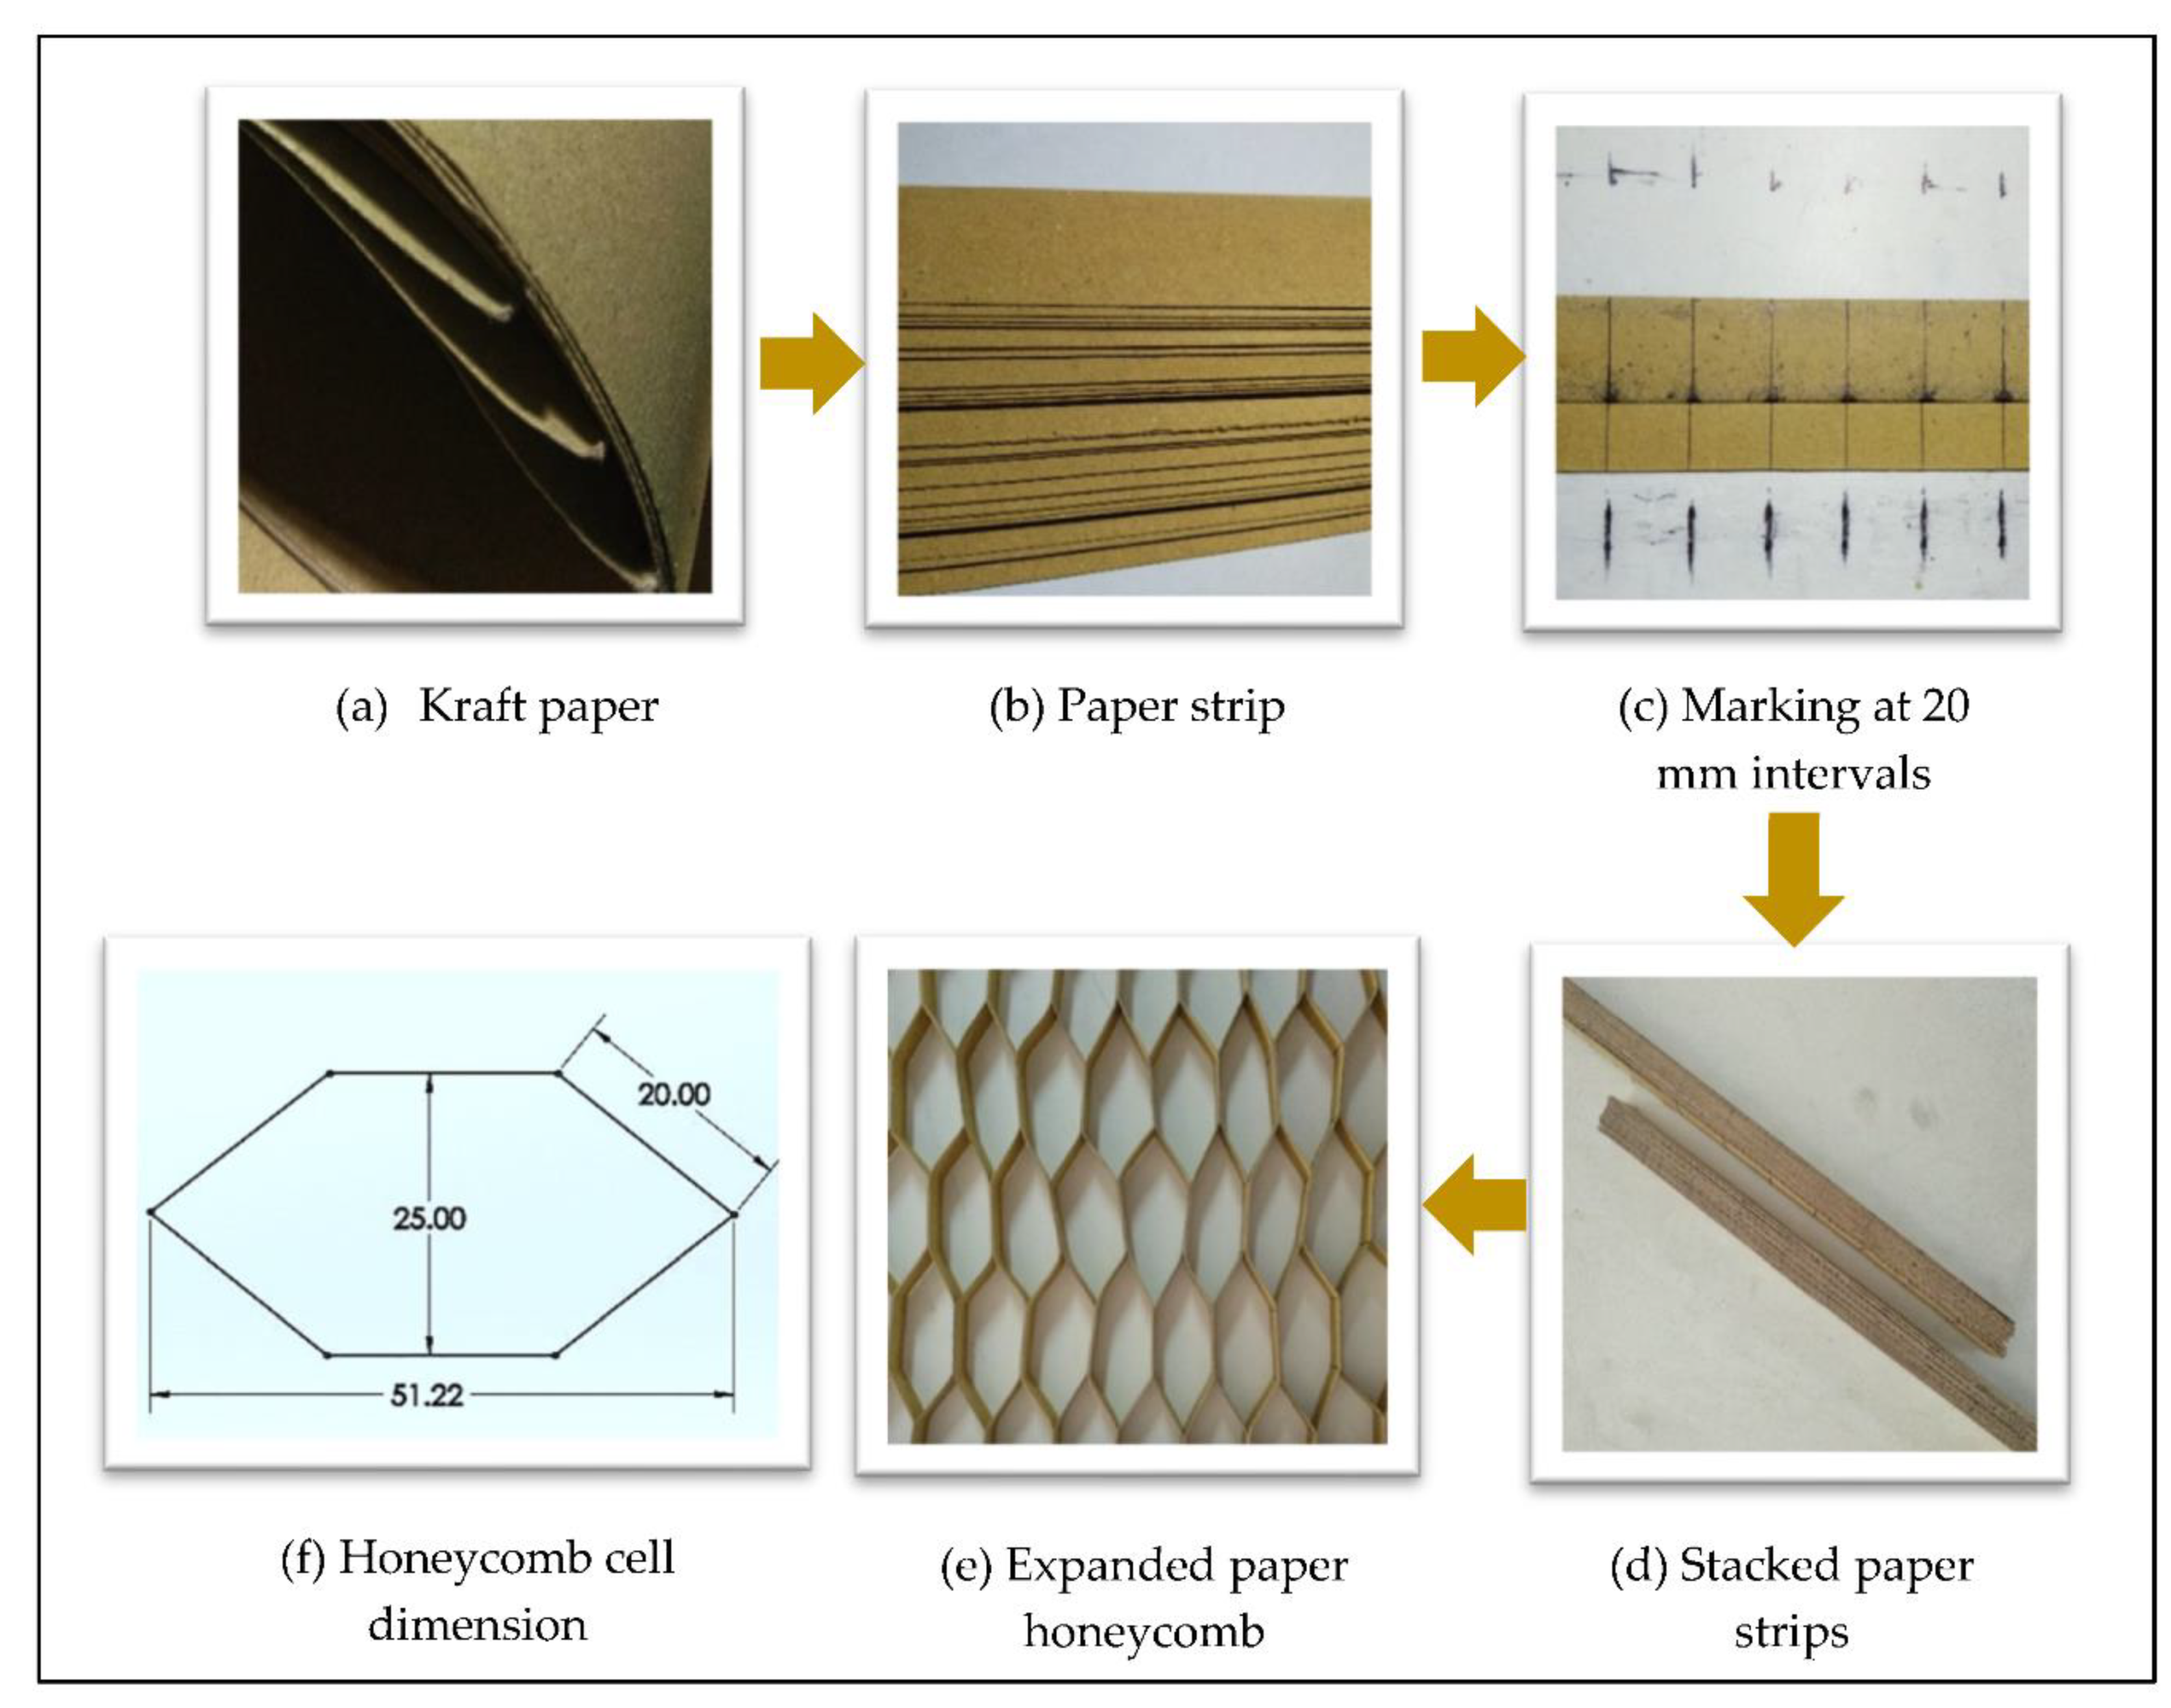
3.2.1. Fabrication of Honeycomb Structure
3.2.2. Preparation of Perlite Foam Mixture
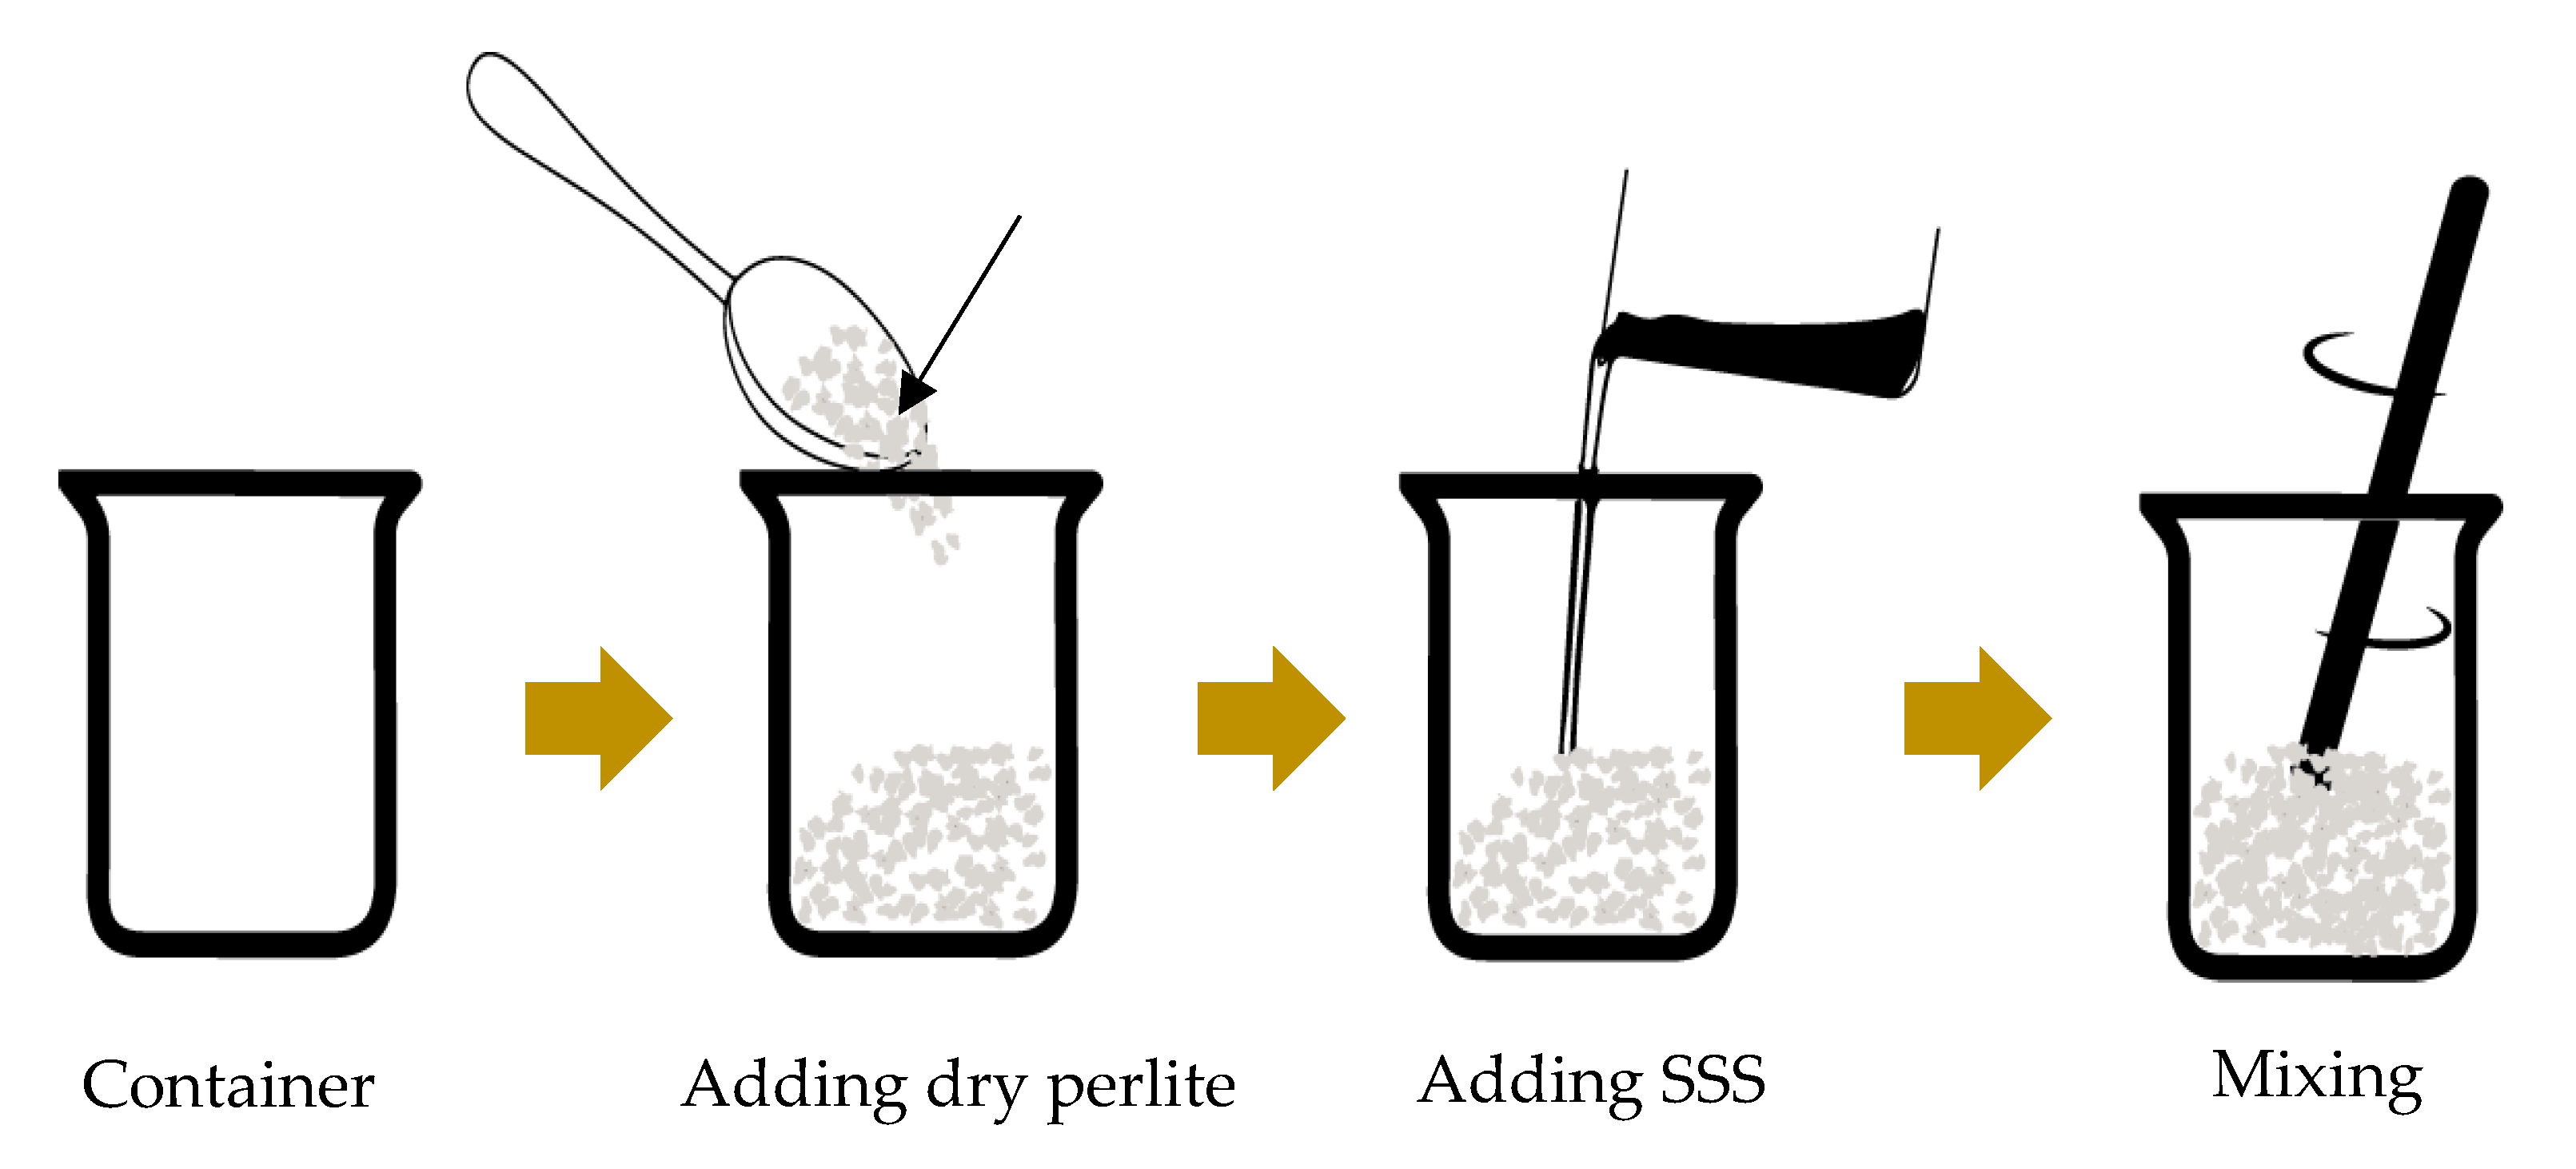
| Sample ID | Mass of perlite (g) | Mass of SSS as received (g) | Mass of water (g) | Mass of diluted SSS (g) |
| FHCS-100 | 85 | 365.00 | 0 | 365.00 |
| FCS-100 | 90 | 386.47 | 0 | 386.47 |
| FHCS-90 | 85 | 328.50 | 36.50 | 365.00 |
| FCS-90 | 90 | 347.82 | 38.65 | 386.47 |
| FHCS-80 | 85 | 292.00 | 73.00 | 365.00 |
| FCS-80 | 90 | 309.18 | 77.29 | 386.47 |
3.2.3. Core Manufacturing
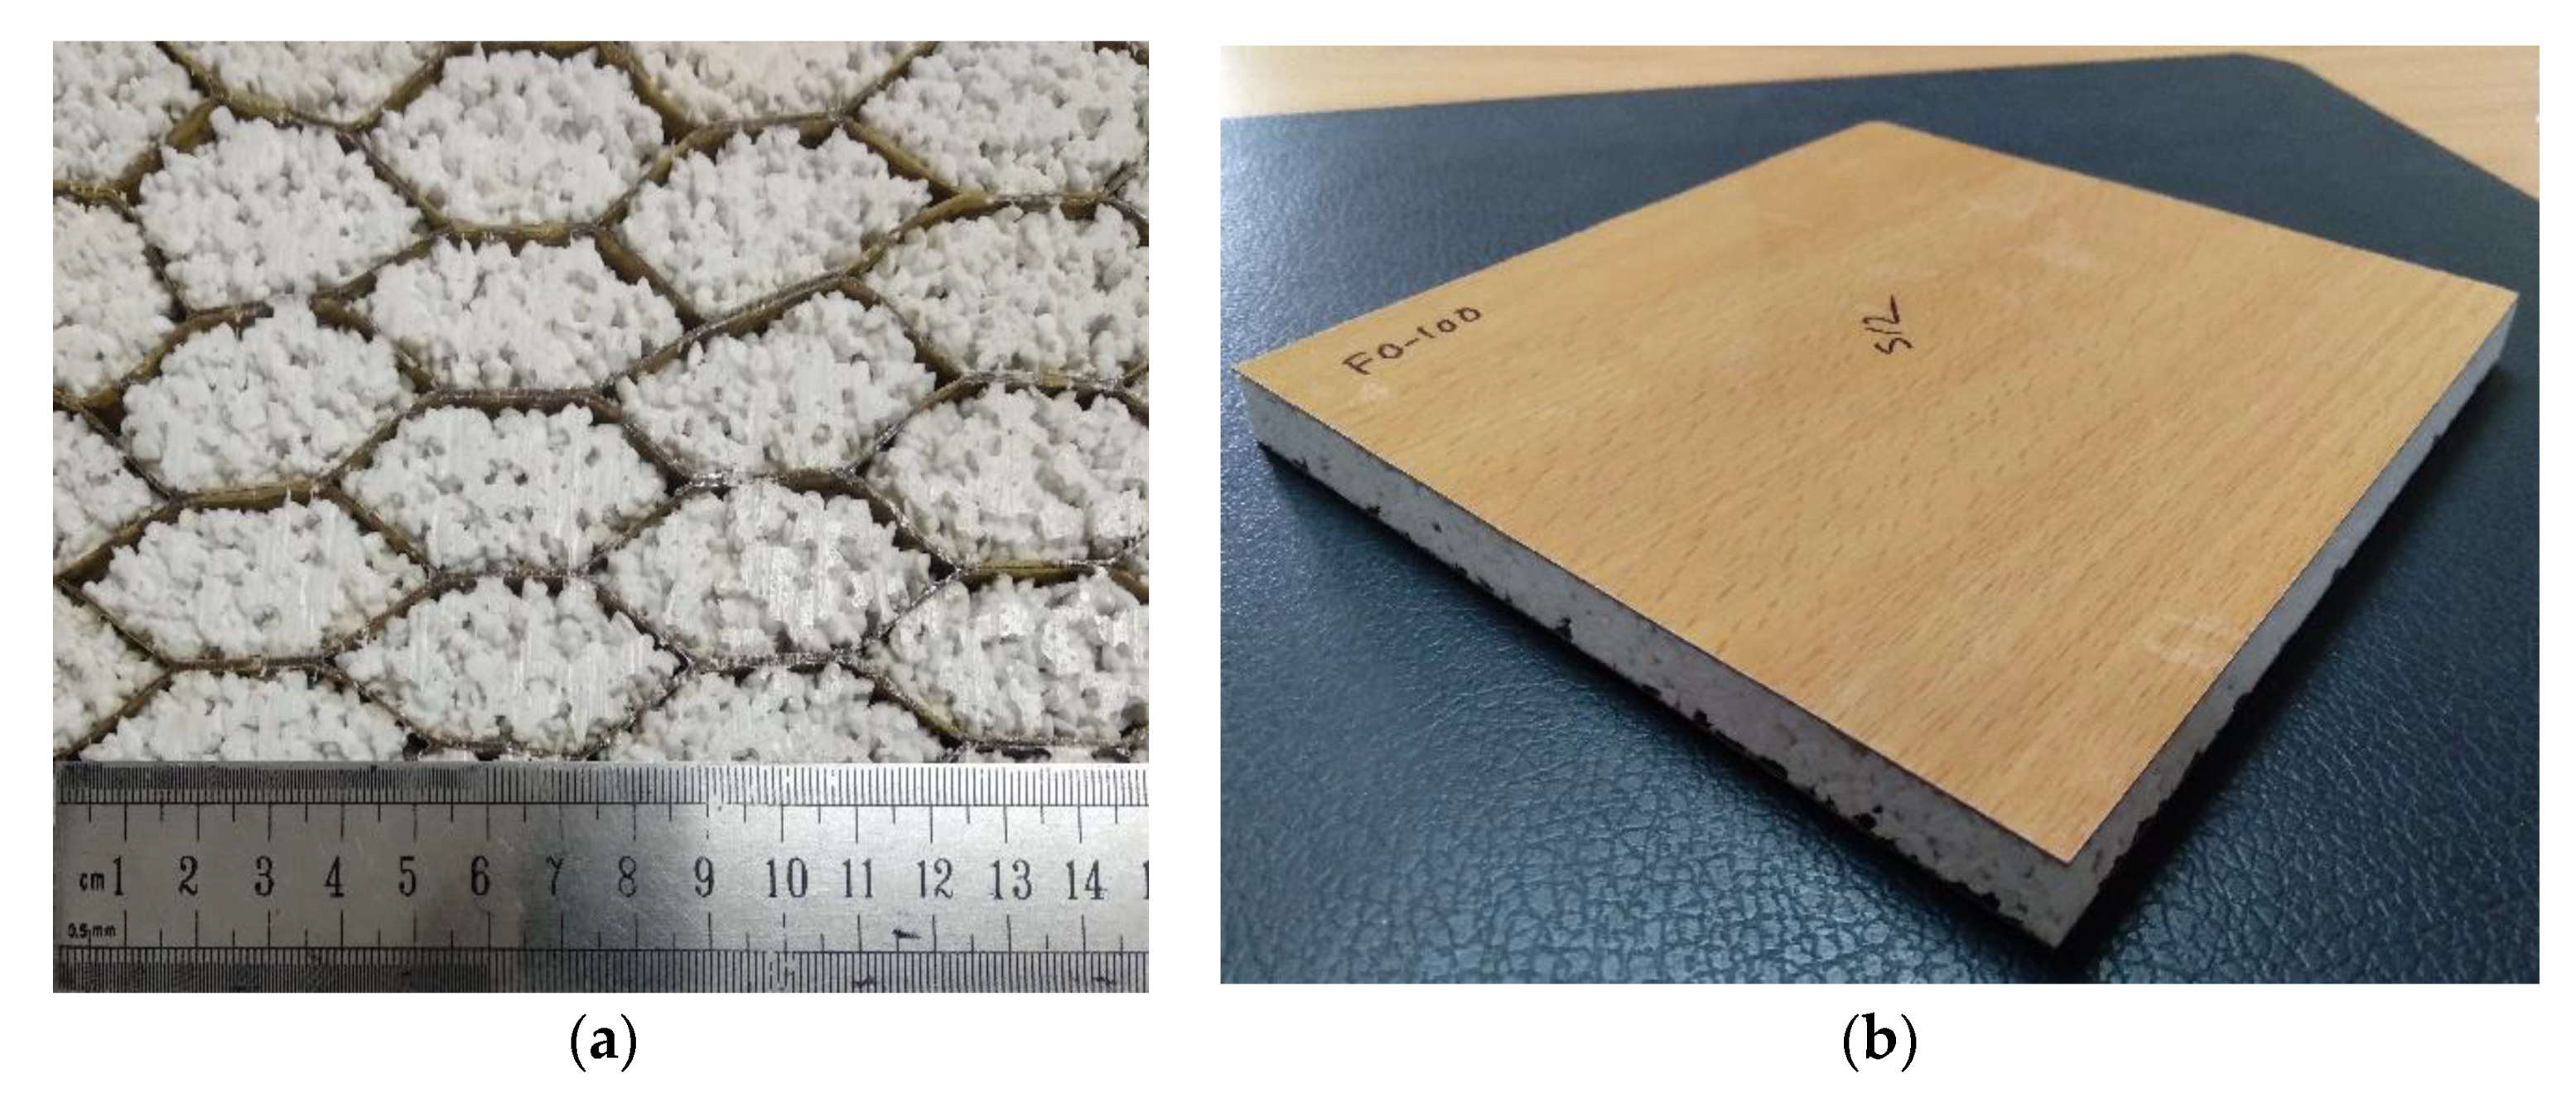
3.2.3. Fabrication of Sandwich
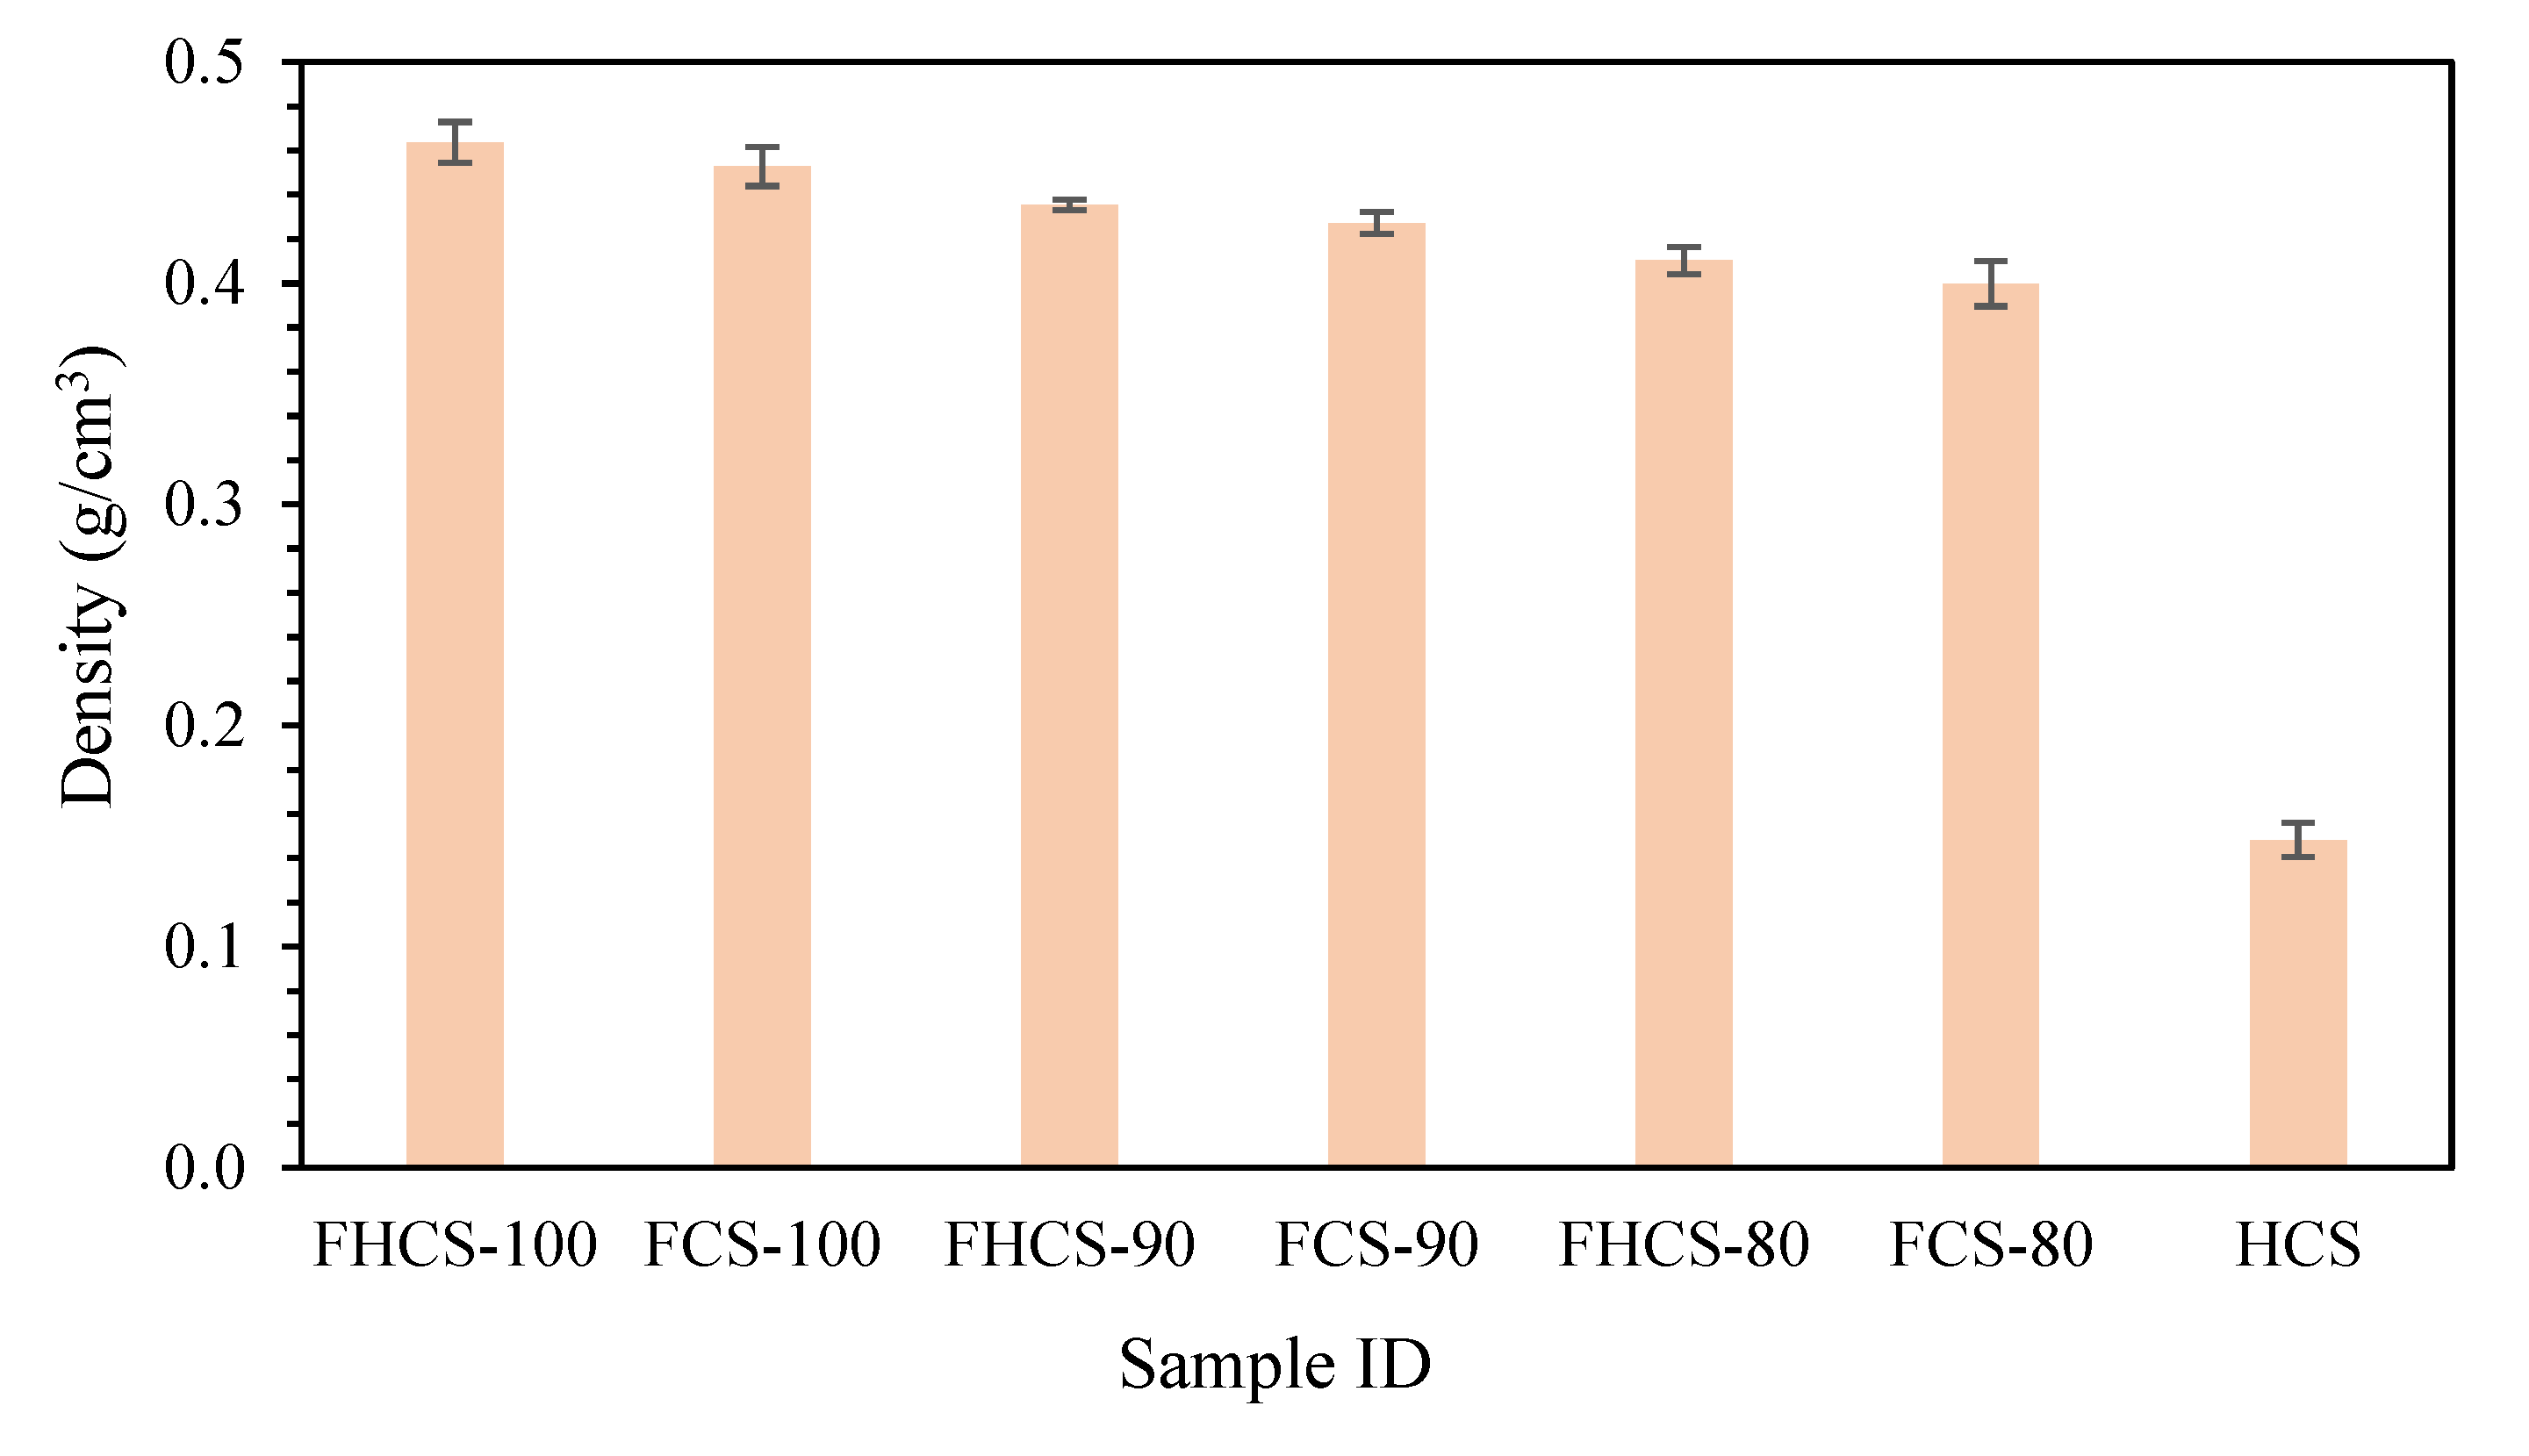
3.3. Density Measurement
3.4. Flexural Testing
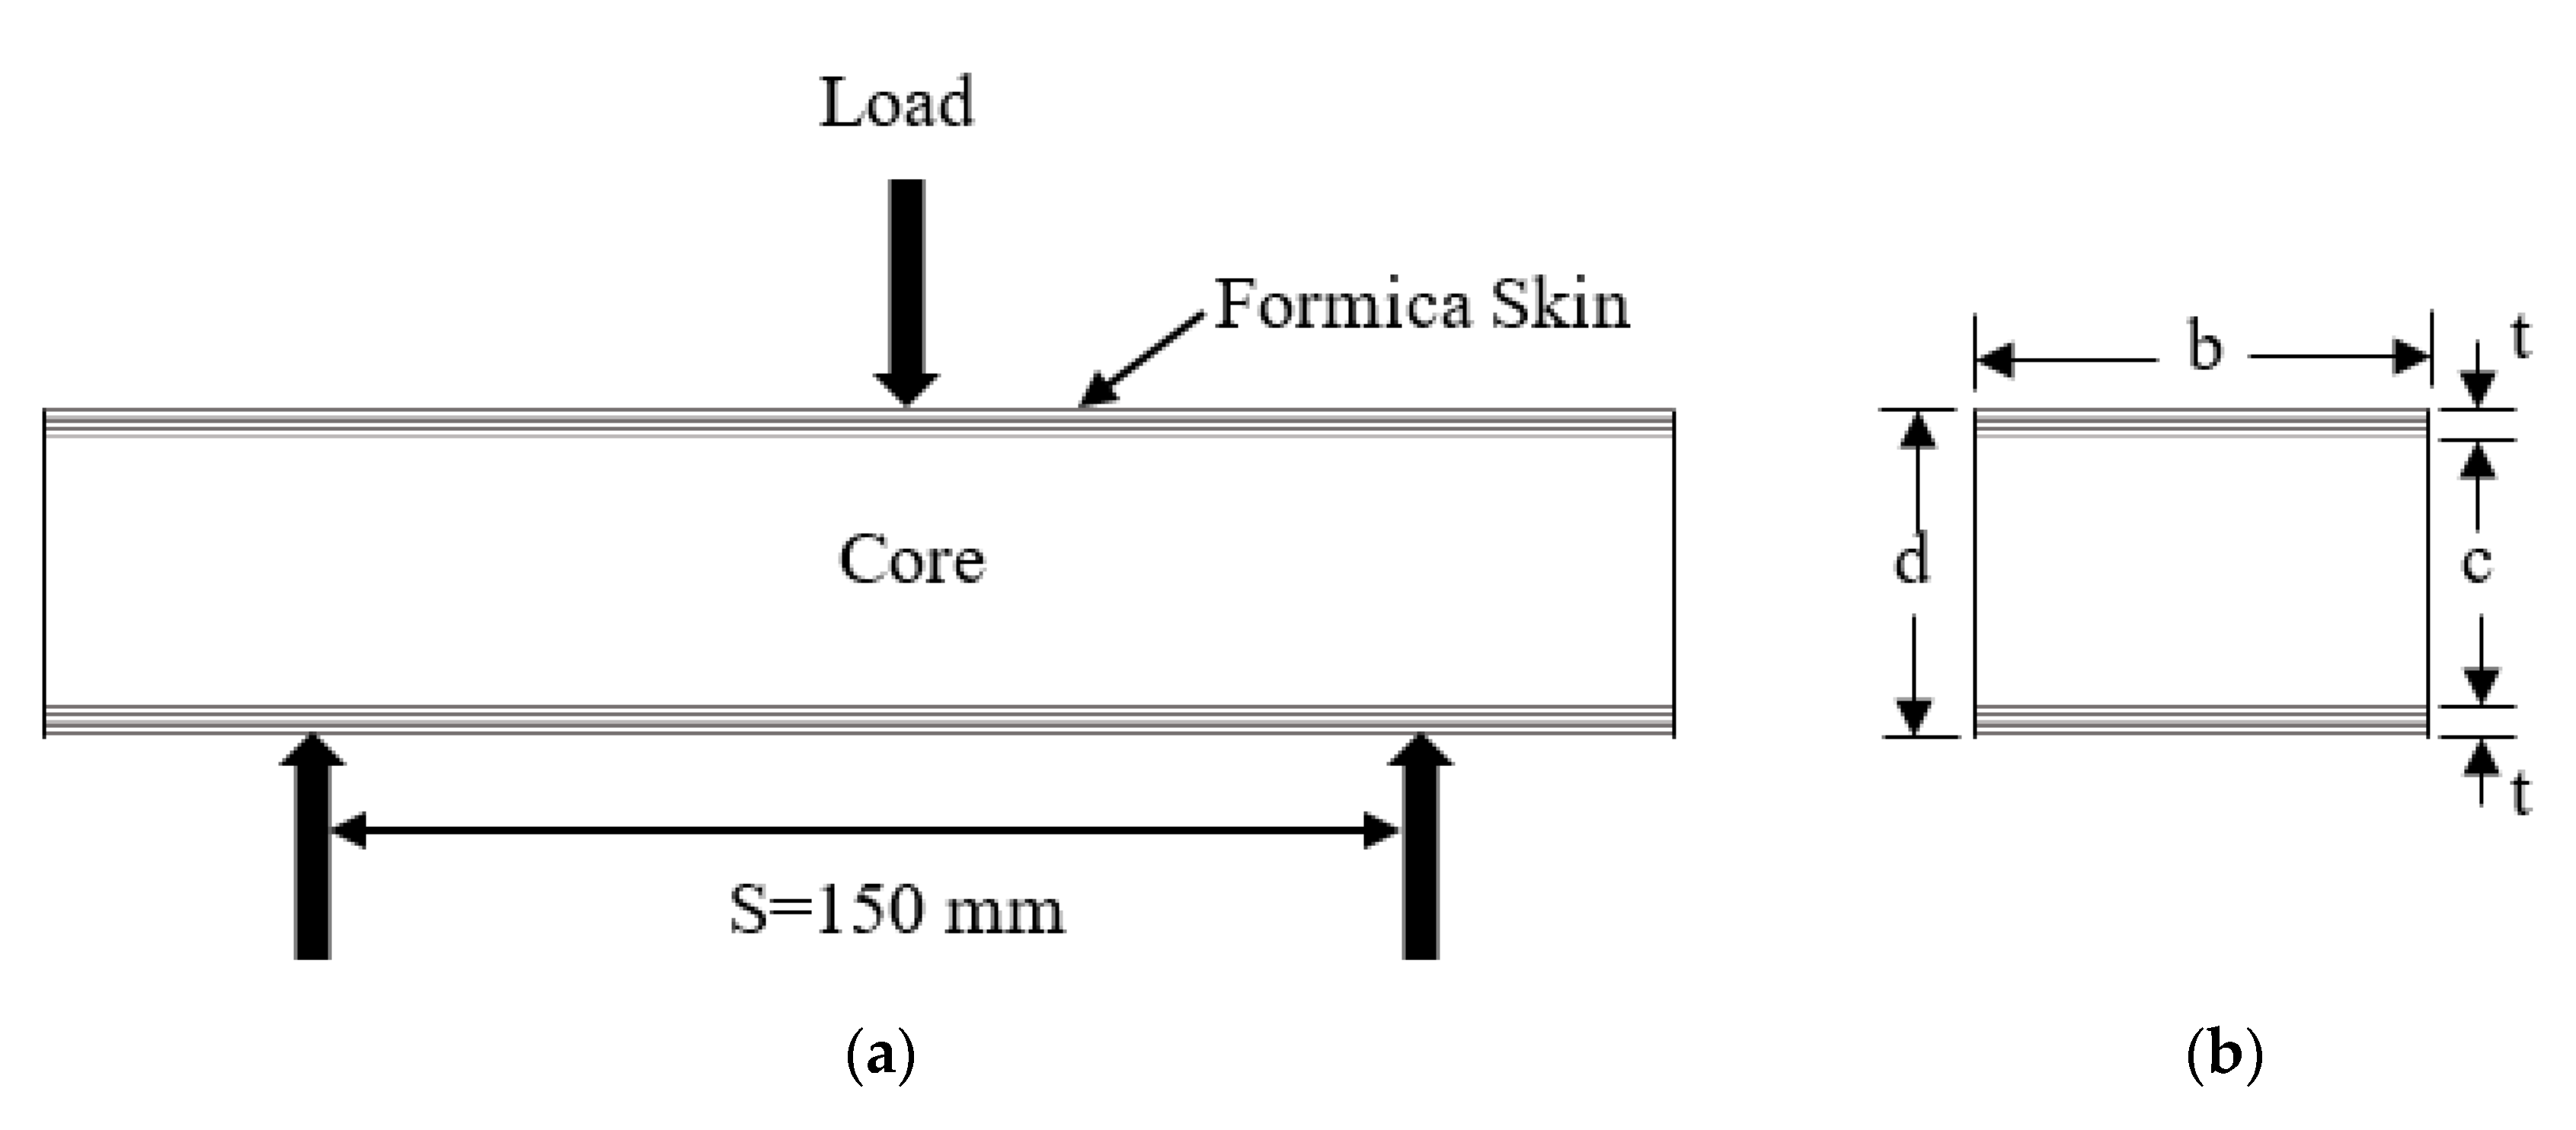
3.5. Thermal Conductivity Testing
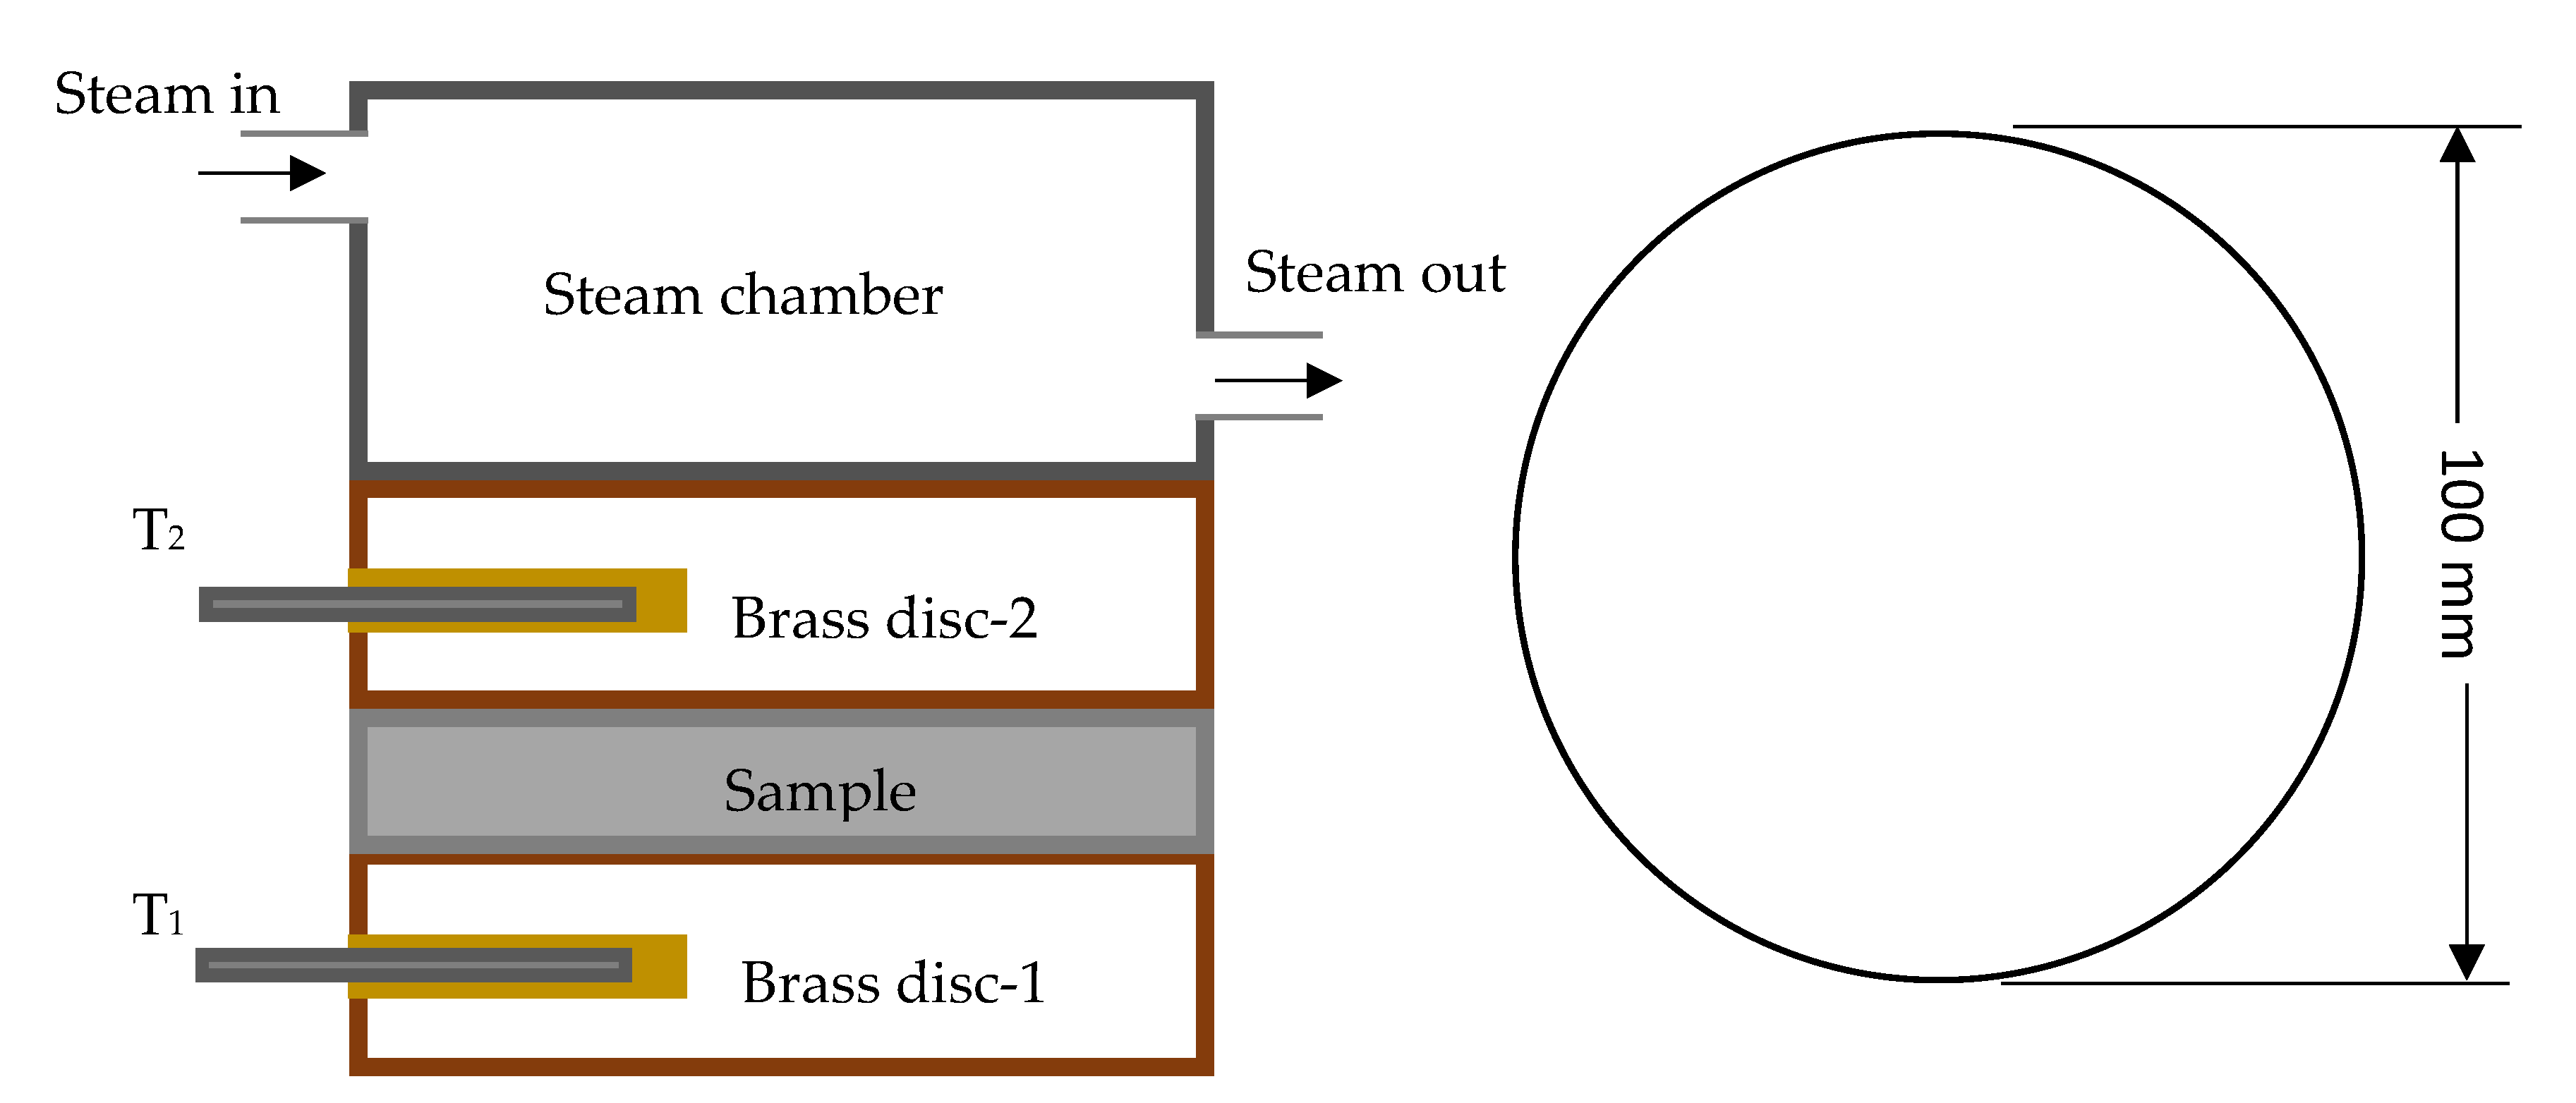
4. Results and Discussion
4.1. Flexural Properties
| Sample ID | Density, g/cm3 | Core shear stress, MPa | Facing stress, MPa | Flexural modulus, GPa |
Flexural strength, MPa |
Thermal conductivity, W/mK |
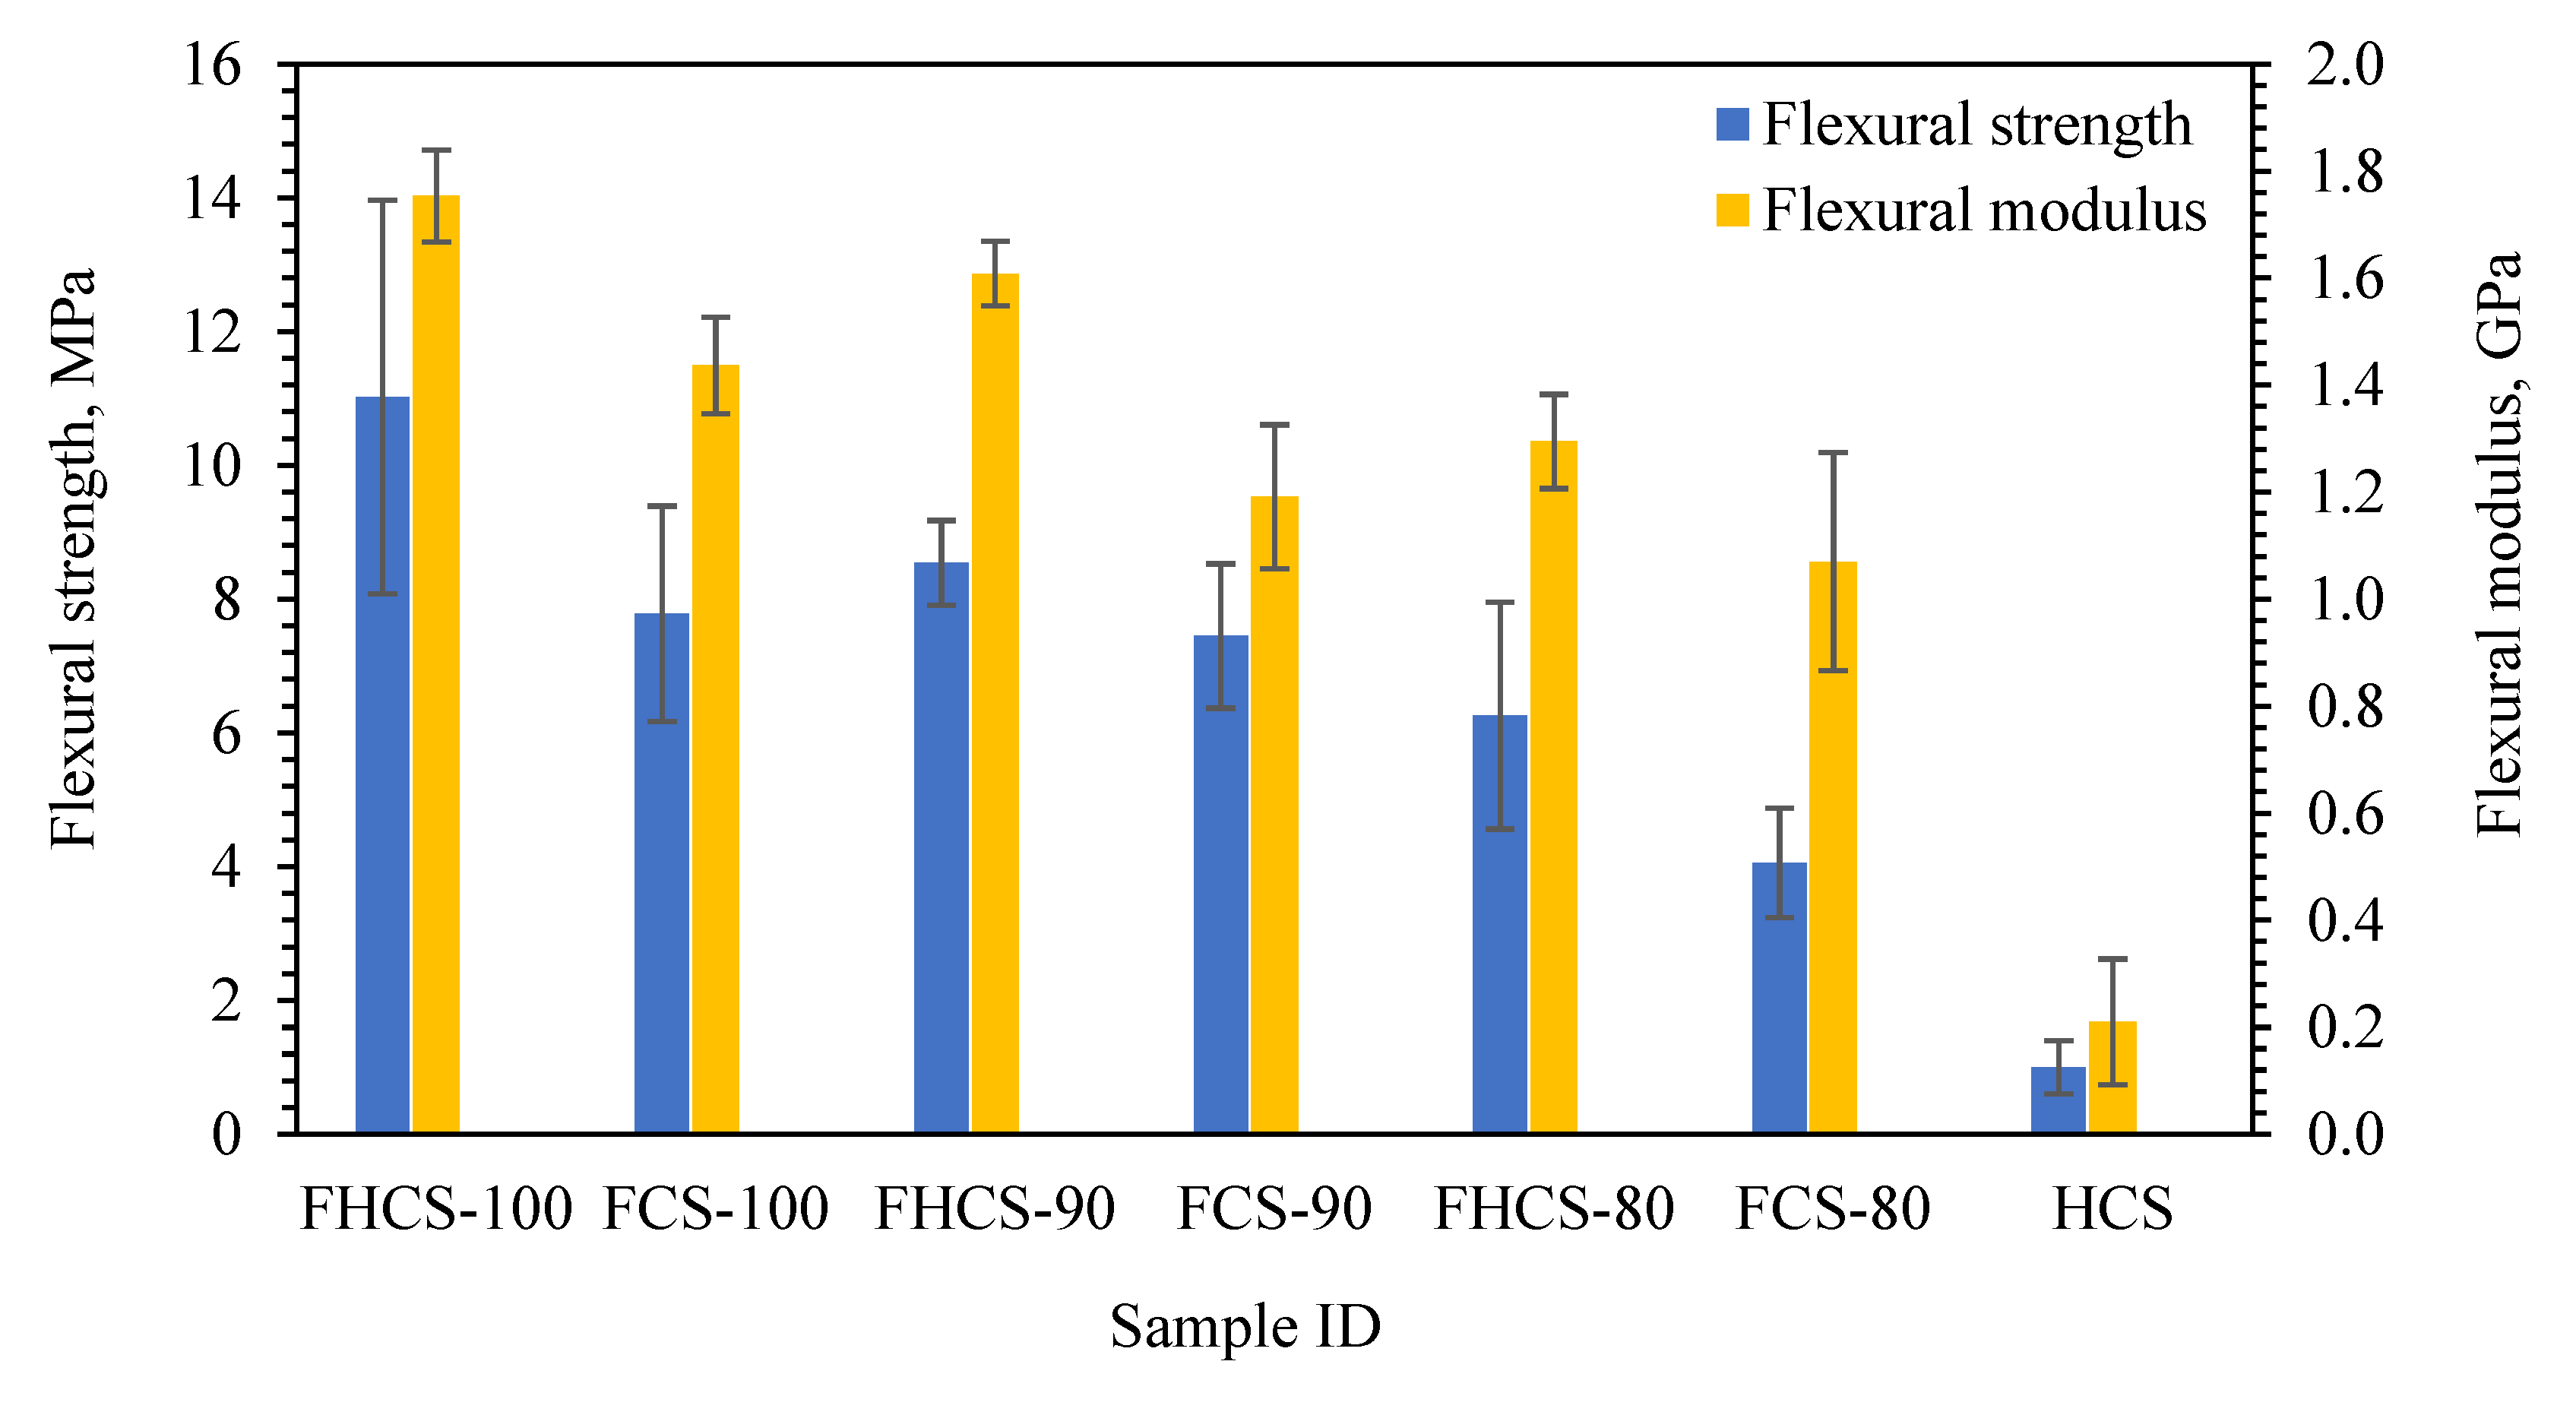
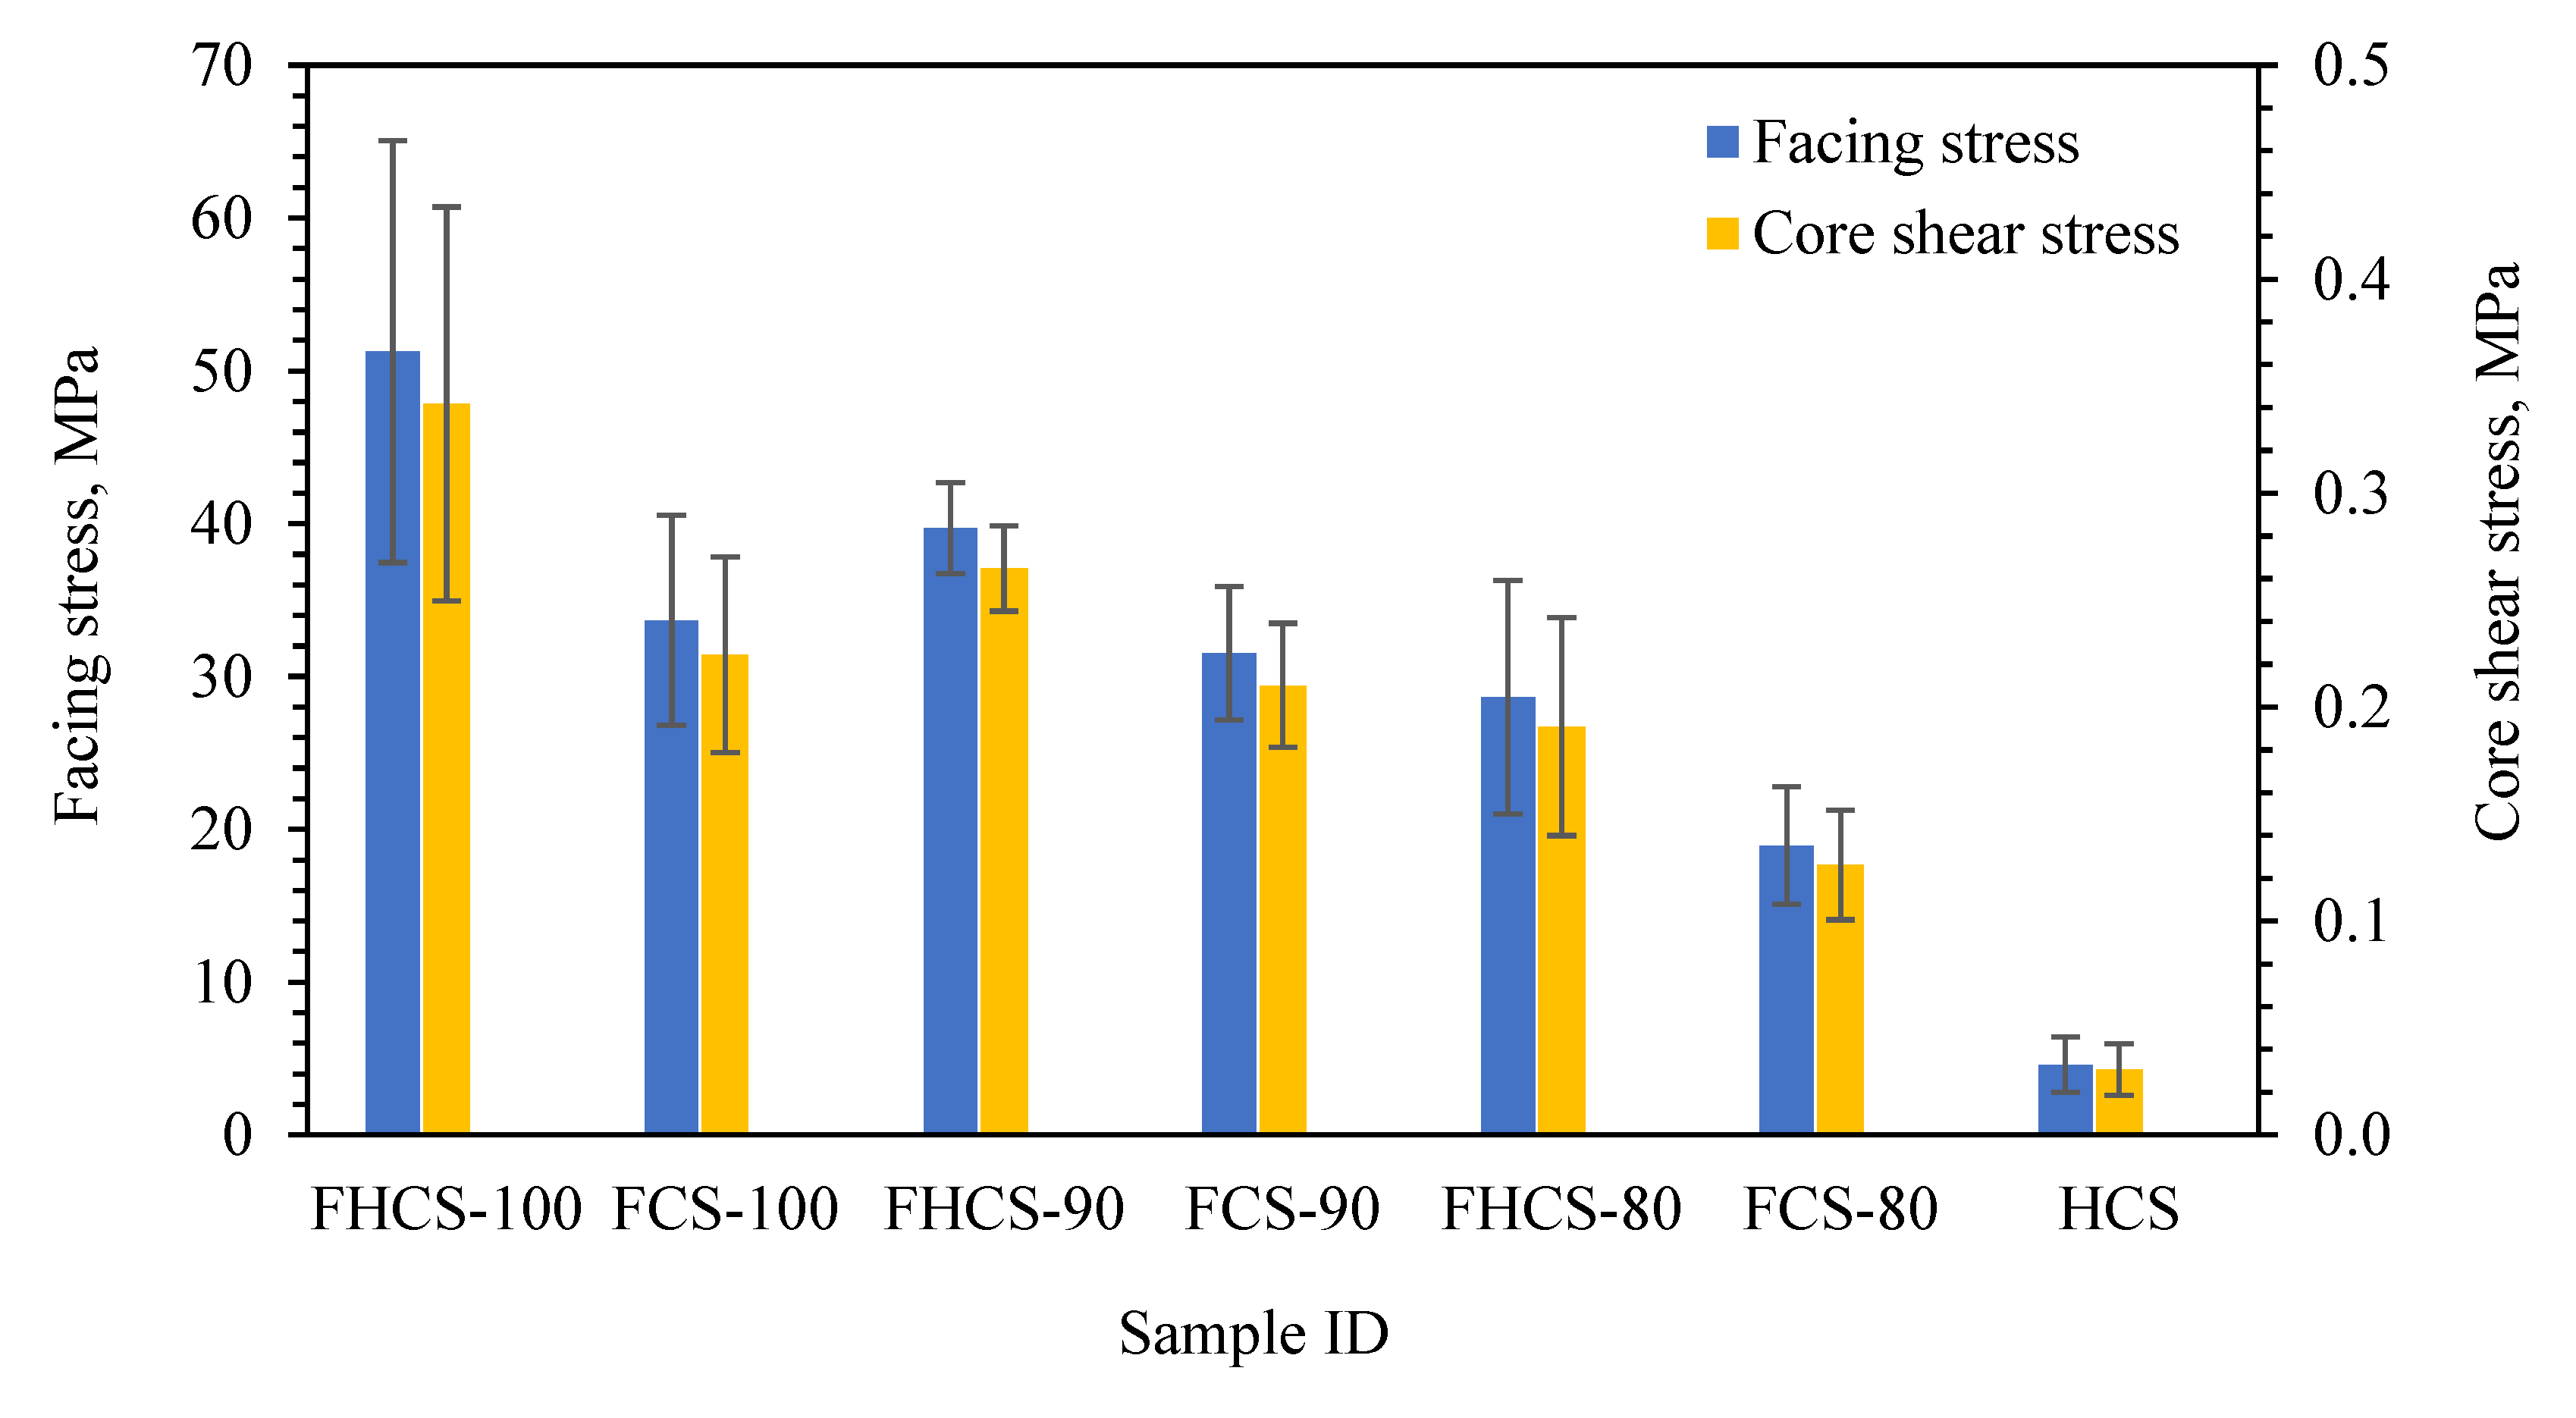
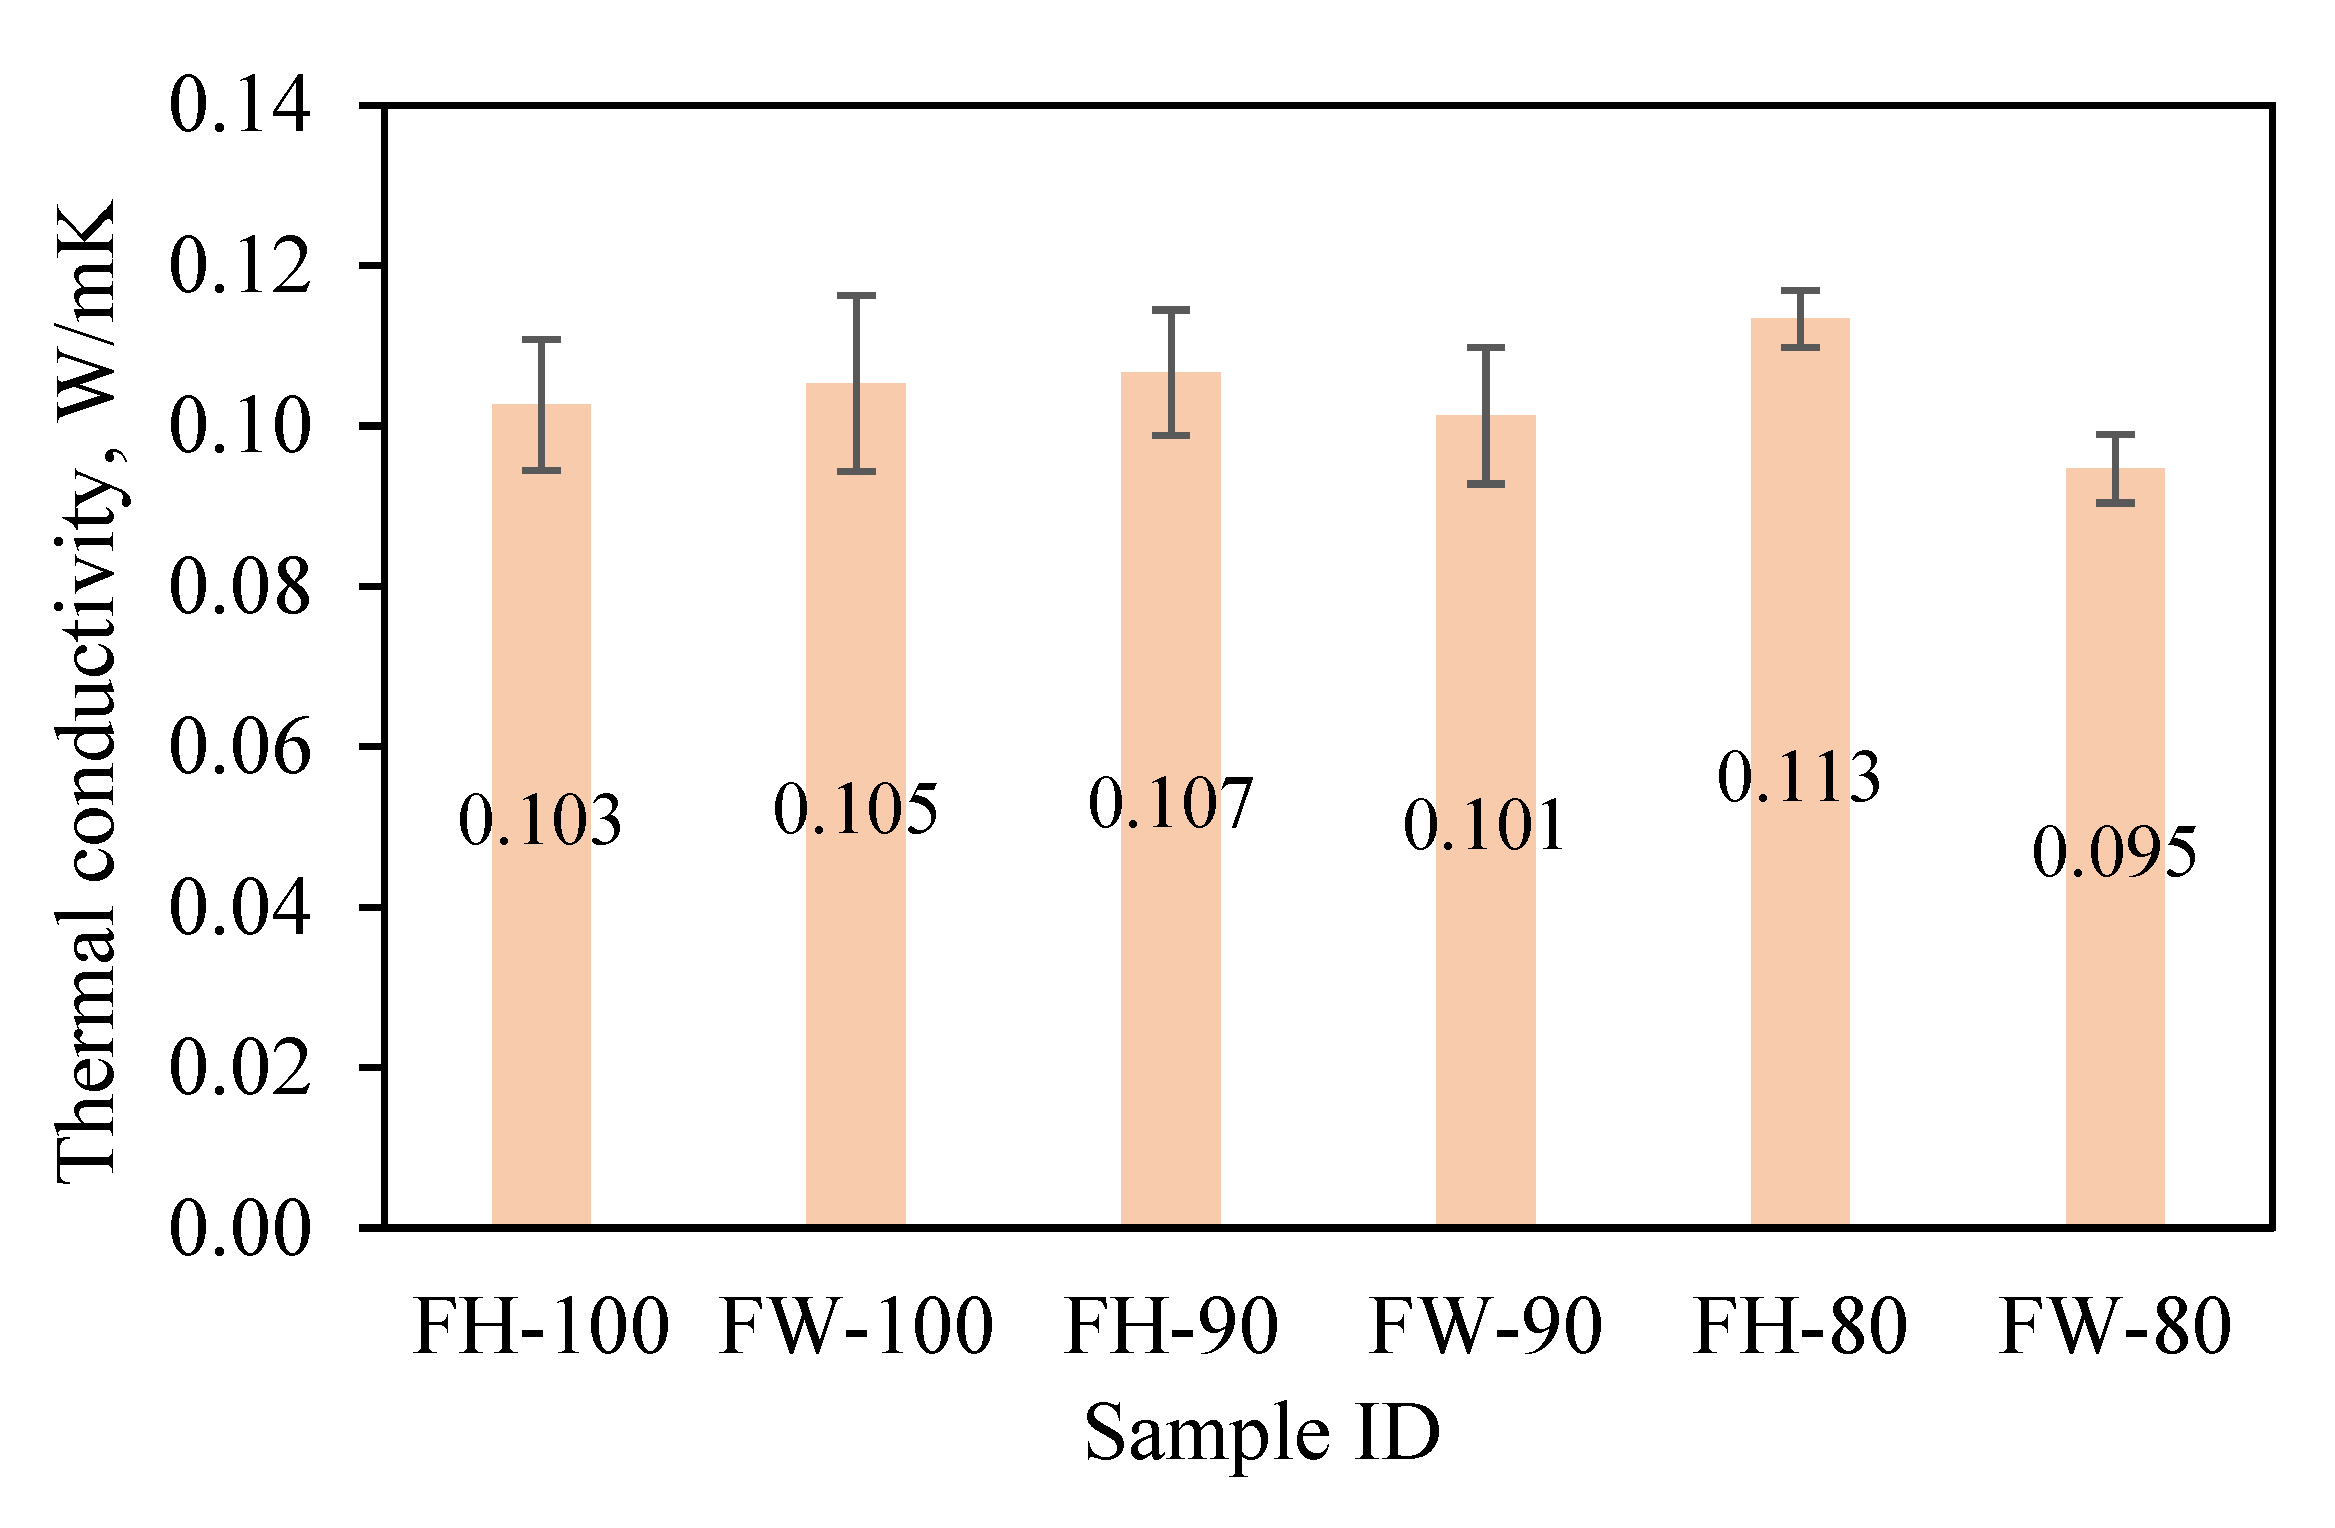
| FHCS-100 | 0.47 ± 0.010 | 0.35 ± 0.10 | 51.26 ± 13.81 | 1.76 ± 0.09 | 11.03 ± 2.95 | 0.10 ± 0.010 |
| FHCS -90 | 0.44 ± 0.003 | 0.27 ± 0.02 | 39.72 ± 3.00 | 1.61 ± 0.07 | 8.55 ± 0.64 | 0.11 ± 0.003 |
| FHCS -80 | 0.42 ± 0.007 | 0.20 ± 0.06 | 28.64 ± 7.65 | 1.30 ± 0.09 | 6.26 ± 1.70 | 0.10 ± 0.010 |
| FCS-100 | 0.46 ± 0.009 | 0.23 ± 0.05 | 33.69 ± 6.86 | 1.44 ± 0.09 | 7.79 ± 1.62 | 0.11 ± 0.010 |
| FCS -90 | 0.43 ± 0.006 | 0.22 ± 0.03 | 31.53 ± 4.36 | 1.19 ± 0.14 | 7.45 ± 1.08 | 0.11 ± 0.010 |
| FCS -80 | 0.40 ± 0.011 | 0.13 ± 0.03 | 18.95 ± 3.85 | 1.07 ± 0.21 | 4.06 ± 0.82 | 0.09 ± 0.004 |
| HCS | 0.15 ± 0.008 | 0.04 ± 0.02 | 4.59 ± 1.81 | 0.22 ± 0.12 | 1.01 ± 0.40 | - |
| Sample ID | Density (g/cm3) | Sp. flexural strength, [MPa/(g/cm3)] | Sp. flexural modulus, [GPa/(g/cm3)] |
| FHCS-100 | 0.47 | 23.77 | 3.78 |
| FHCS-90 | 0.44 | 19.62 | 3.69 |
| FHCS-80 | 0.42 | 15.25 | 3.16 |
| FCS-100 | 0.46 | 17.18 | 3.17 |
| FCS-90 | 0.43 | 17.44 | 2.79 |
| FCS-80 | 0.40 | 10.15 | 2.68 |
| HCS | 0.15 | 6.77 | 1.42 |
| Portland cement skin with kraft paper honeycomb core [25] | 0.99 | 0.88 | - |
| Flax-reinforced Portland cement skin with kraft paper honeycomb core [25] | 0.89 | 1.74 | - |
| Oriented strand boards or plywood [36] | 0.55 | 29.82 | 8.97 |
| Gypsum-fibre boards [36] | 1.15 | 3.48 | 3.30 |
| Chips board urea-formaldehyde bonded [37] | 0.72 | 15.97 | 2.68 |
| MDF [37] | 0.68 | 27.50 | - |
| Coconut coir cement board [38] | 1.13 | 17.64 | 4.70 |
| Commercial flake board [38] | 1.40 | 8.43 | 4.29 |
| Commercial cellulose board [38] | 1.56 | 12.24 | 4.22 |
| Gypsum panel [11] | 1.00 | 2.26 | 2.12 |
| Jute fiber reinforced gypsum panel [11] | 0.97 | 2.03 | 2.24 |
| Perlite/sodium silicate foam panel [21] | 0.41 | 2.37 | 0.87 |
| Syntactic foam panel [39] | 0.37 | 21.32 | 2.86 |
| Syntactic foam panel [39] | 0.44 | 17.20 | 2.57 |
| Nylon fiber reinforced perlite/sodium silicate panel [18] | 0.41 | 2.68 | 0.61 |
| Perlite/sodium silicate foam with jute fiber reinforced epoxy composite skin [30] | 0.59 | 6.50 | 0.61 |
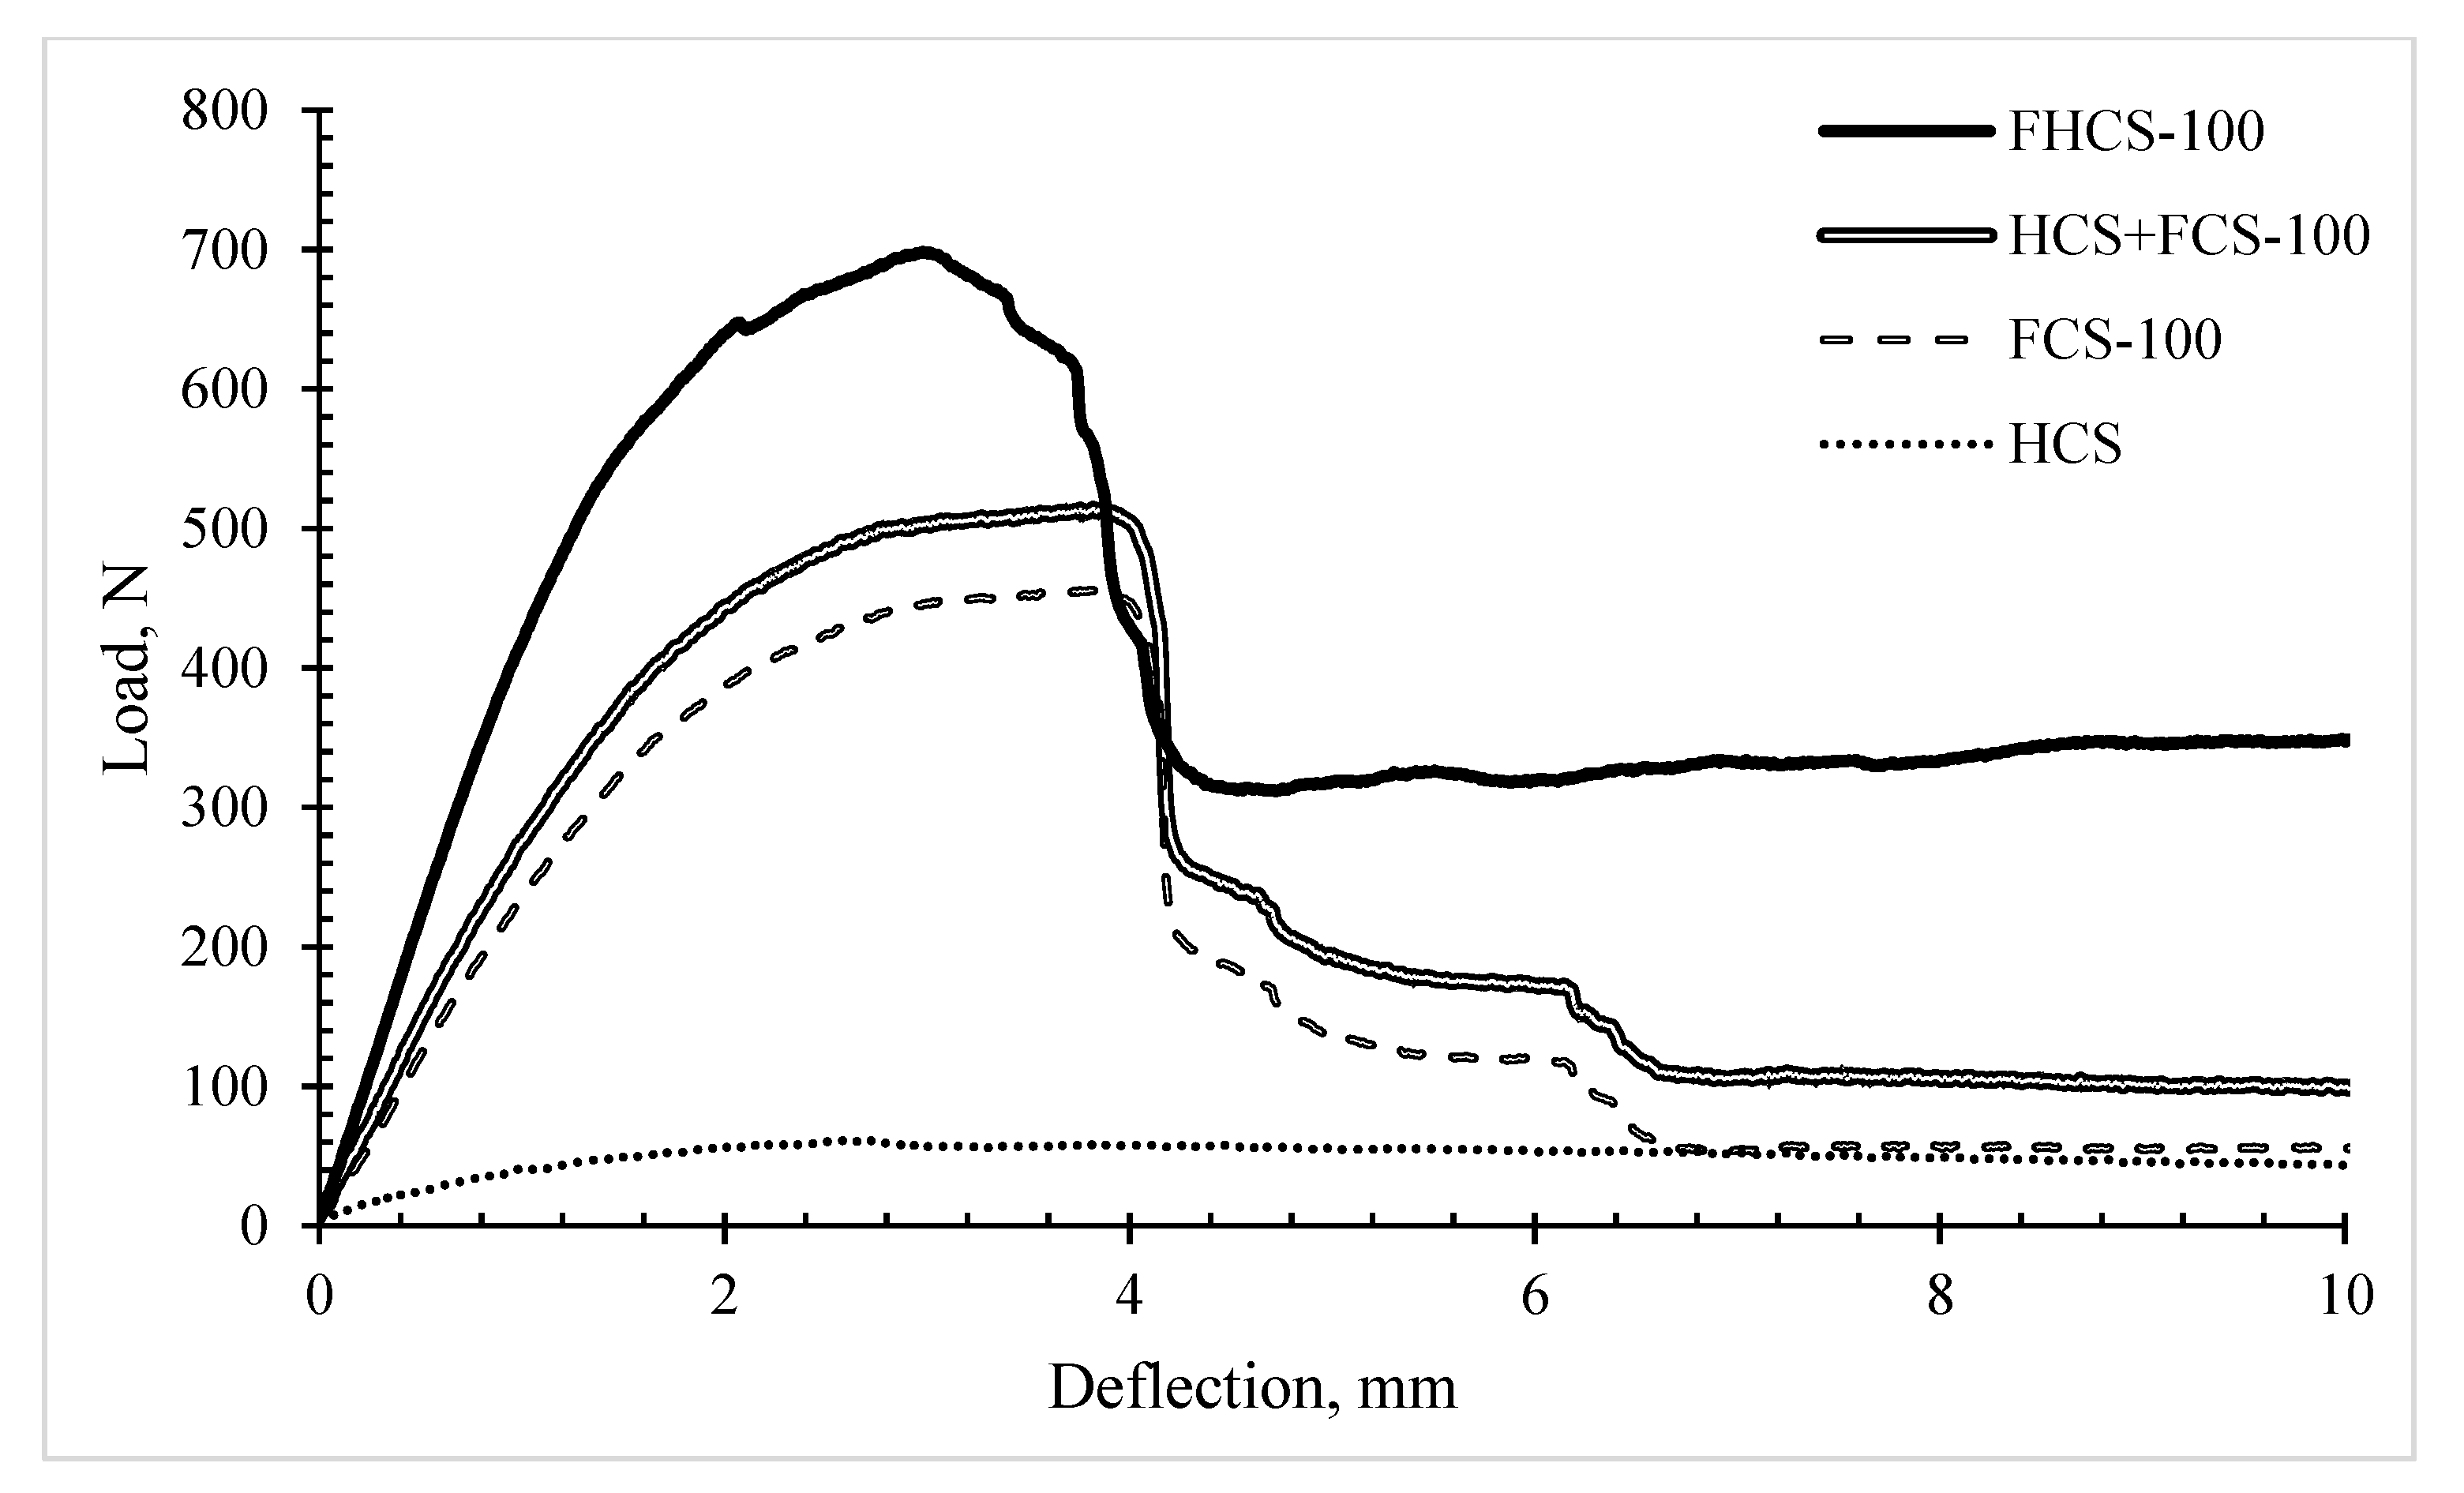
4.2. Flexural Load-deflection Curves and Failure Mechanism
| Sample ID | Failure Sequence |
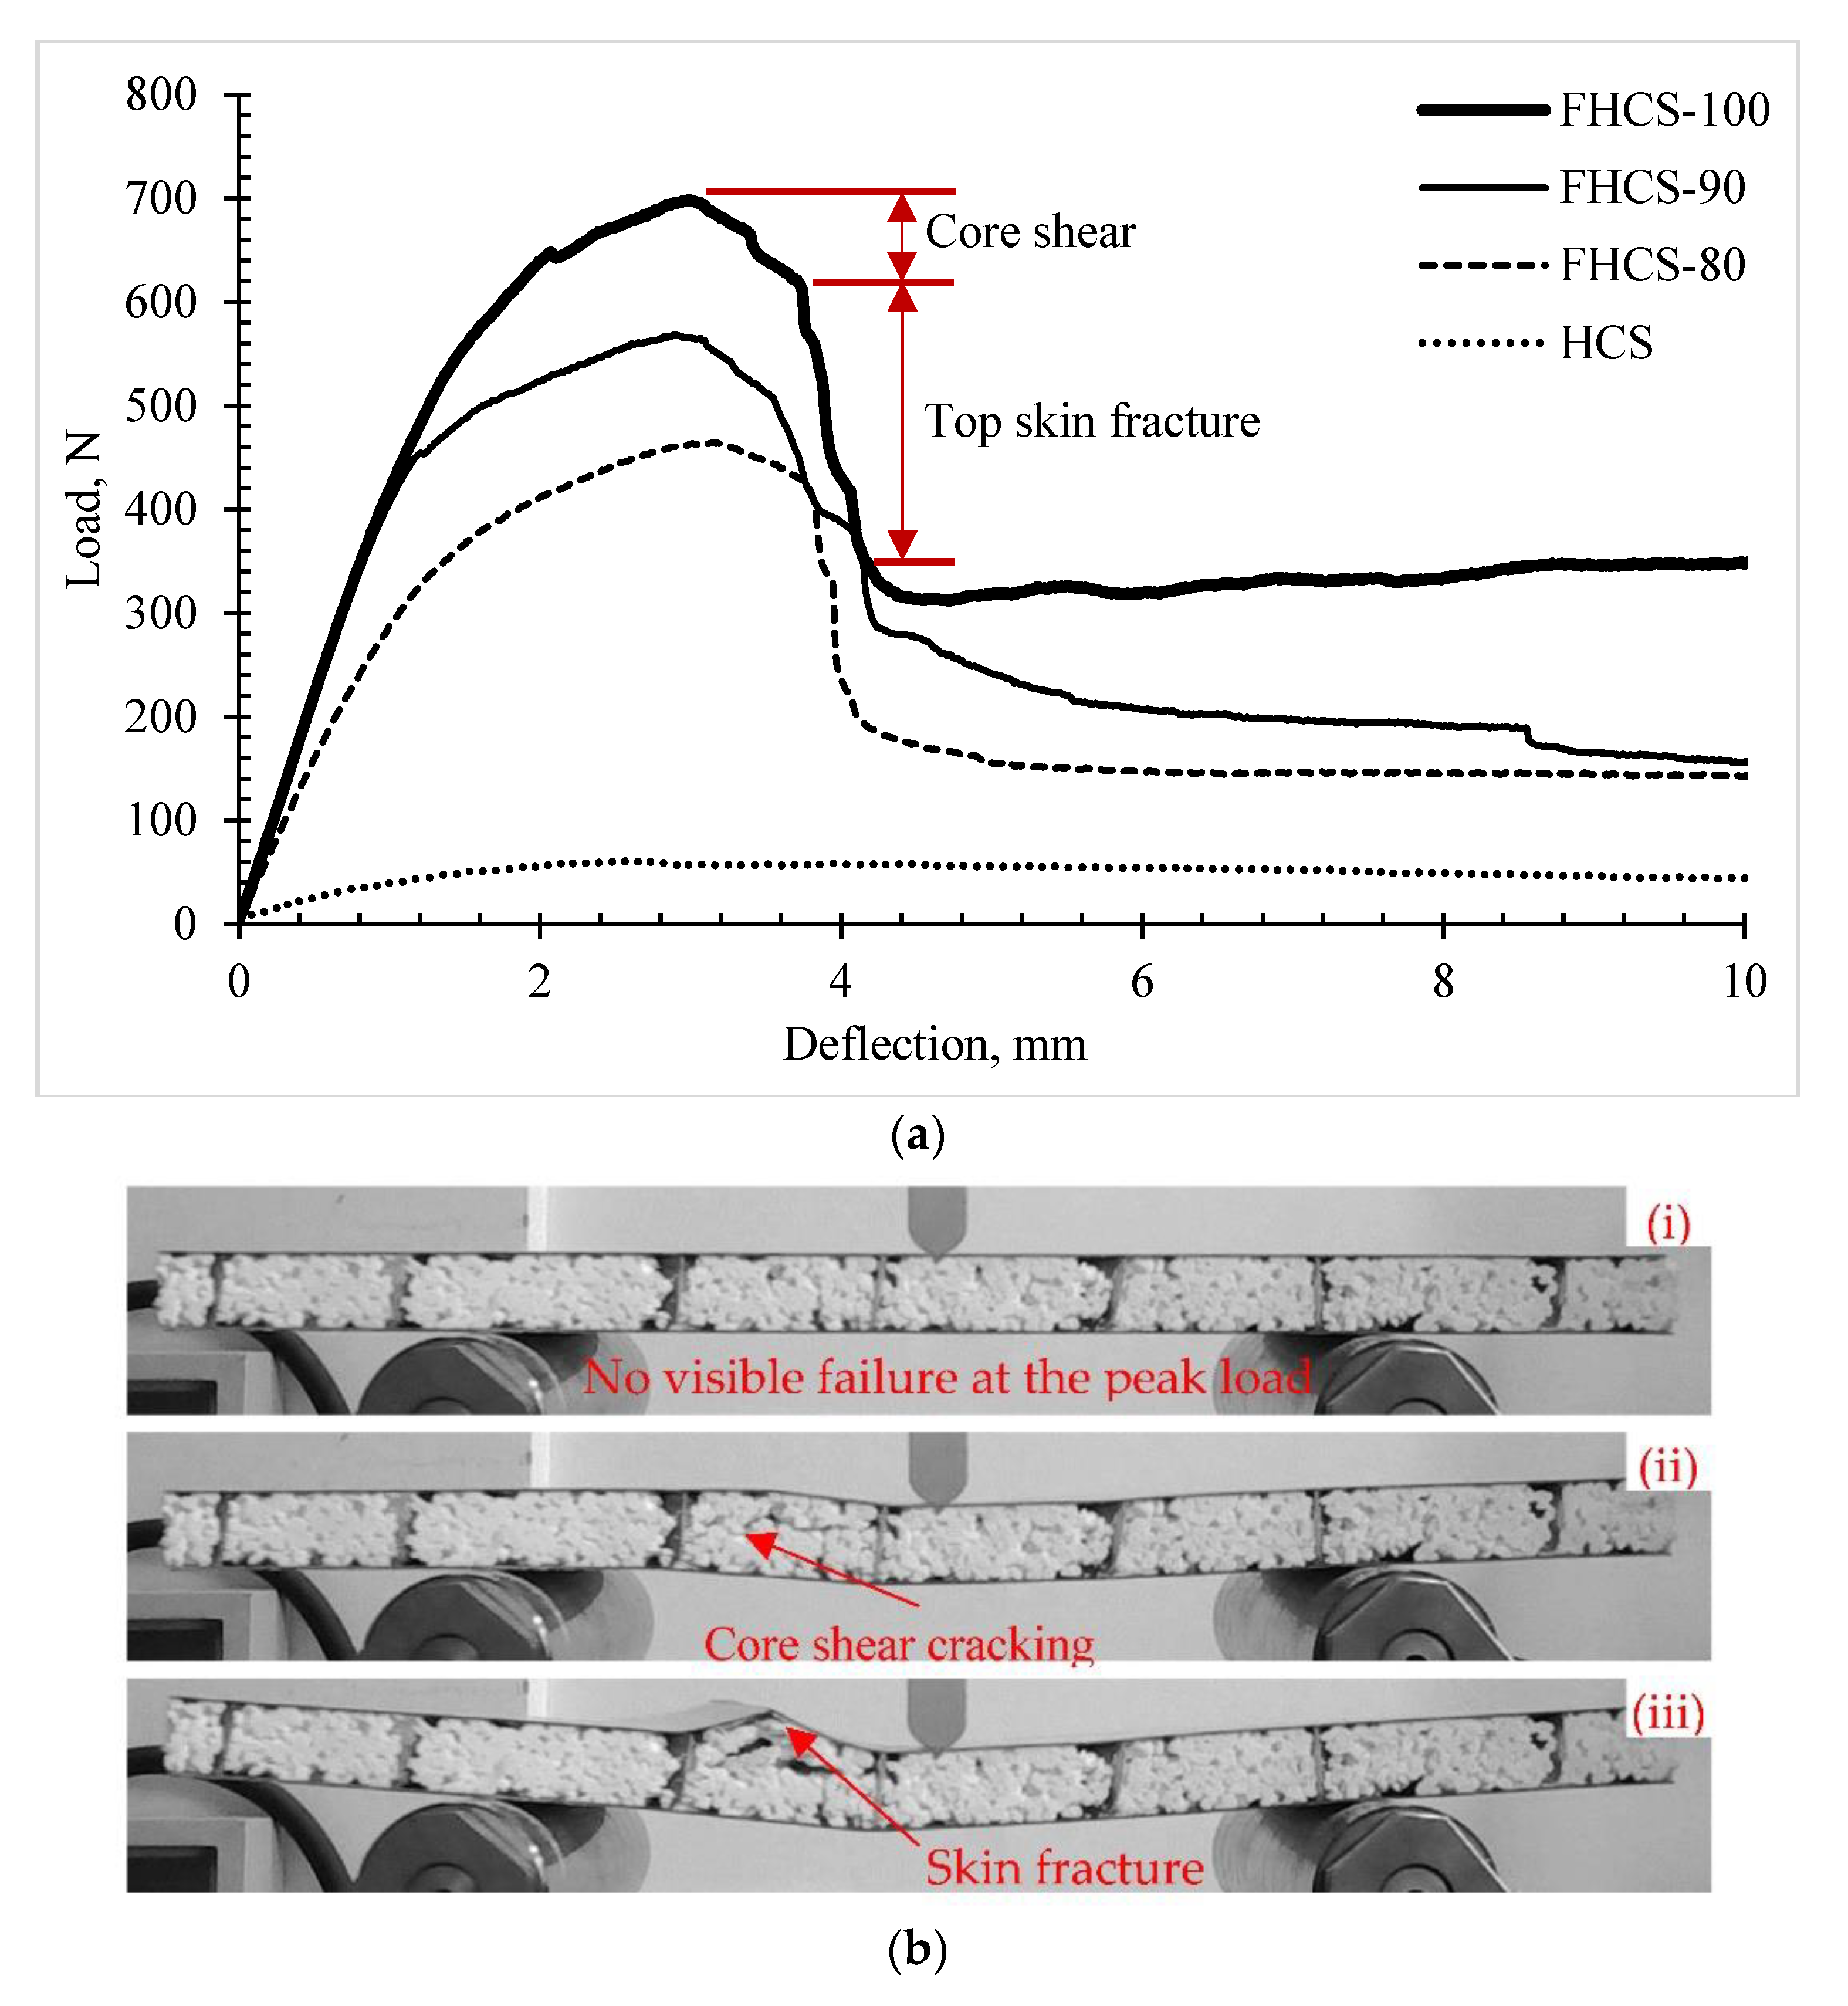
| FHCS - 100 | Core shear – top skin fracture |
| FHCS - 90 | Core shear – top skin fracture |
| FHCS - 80 | Core shear – top skin fracture |
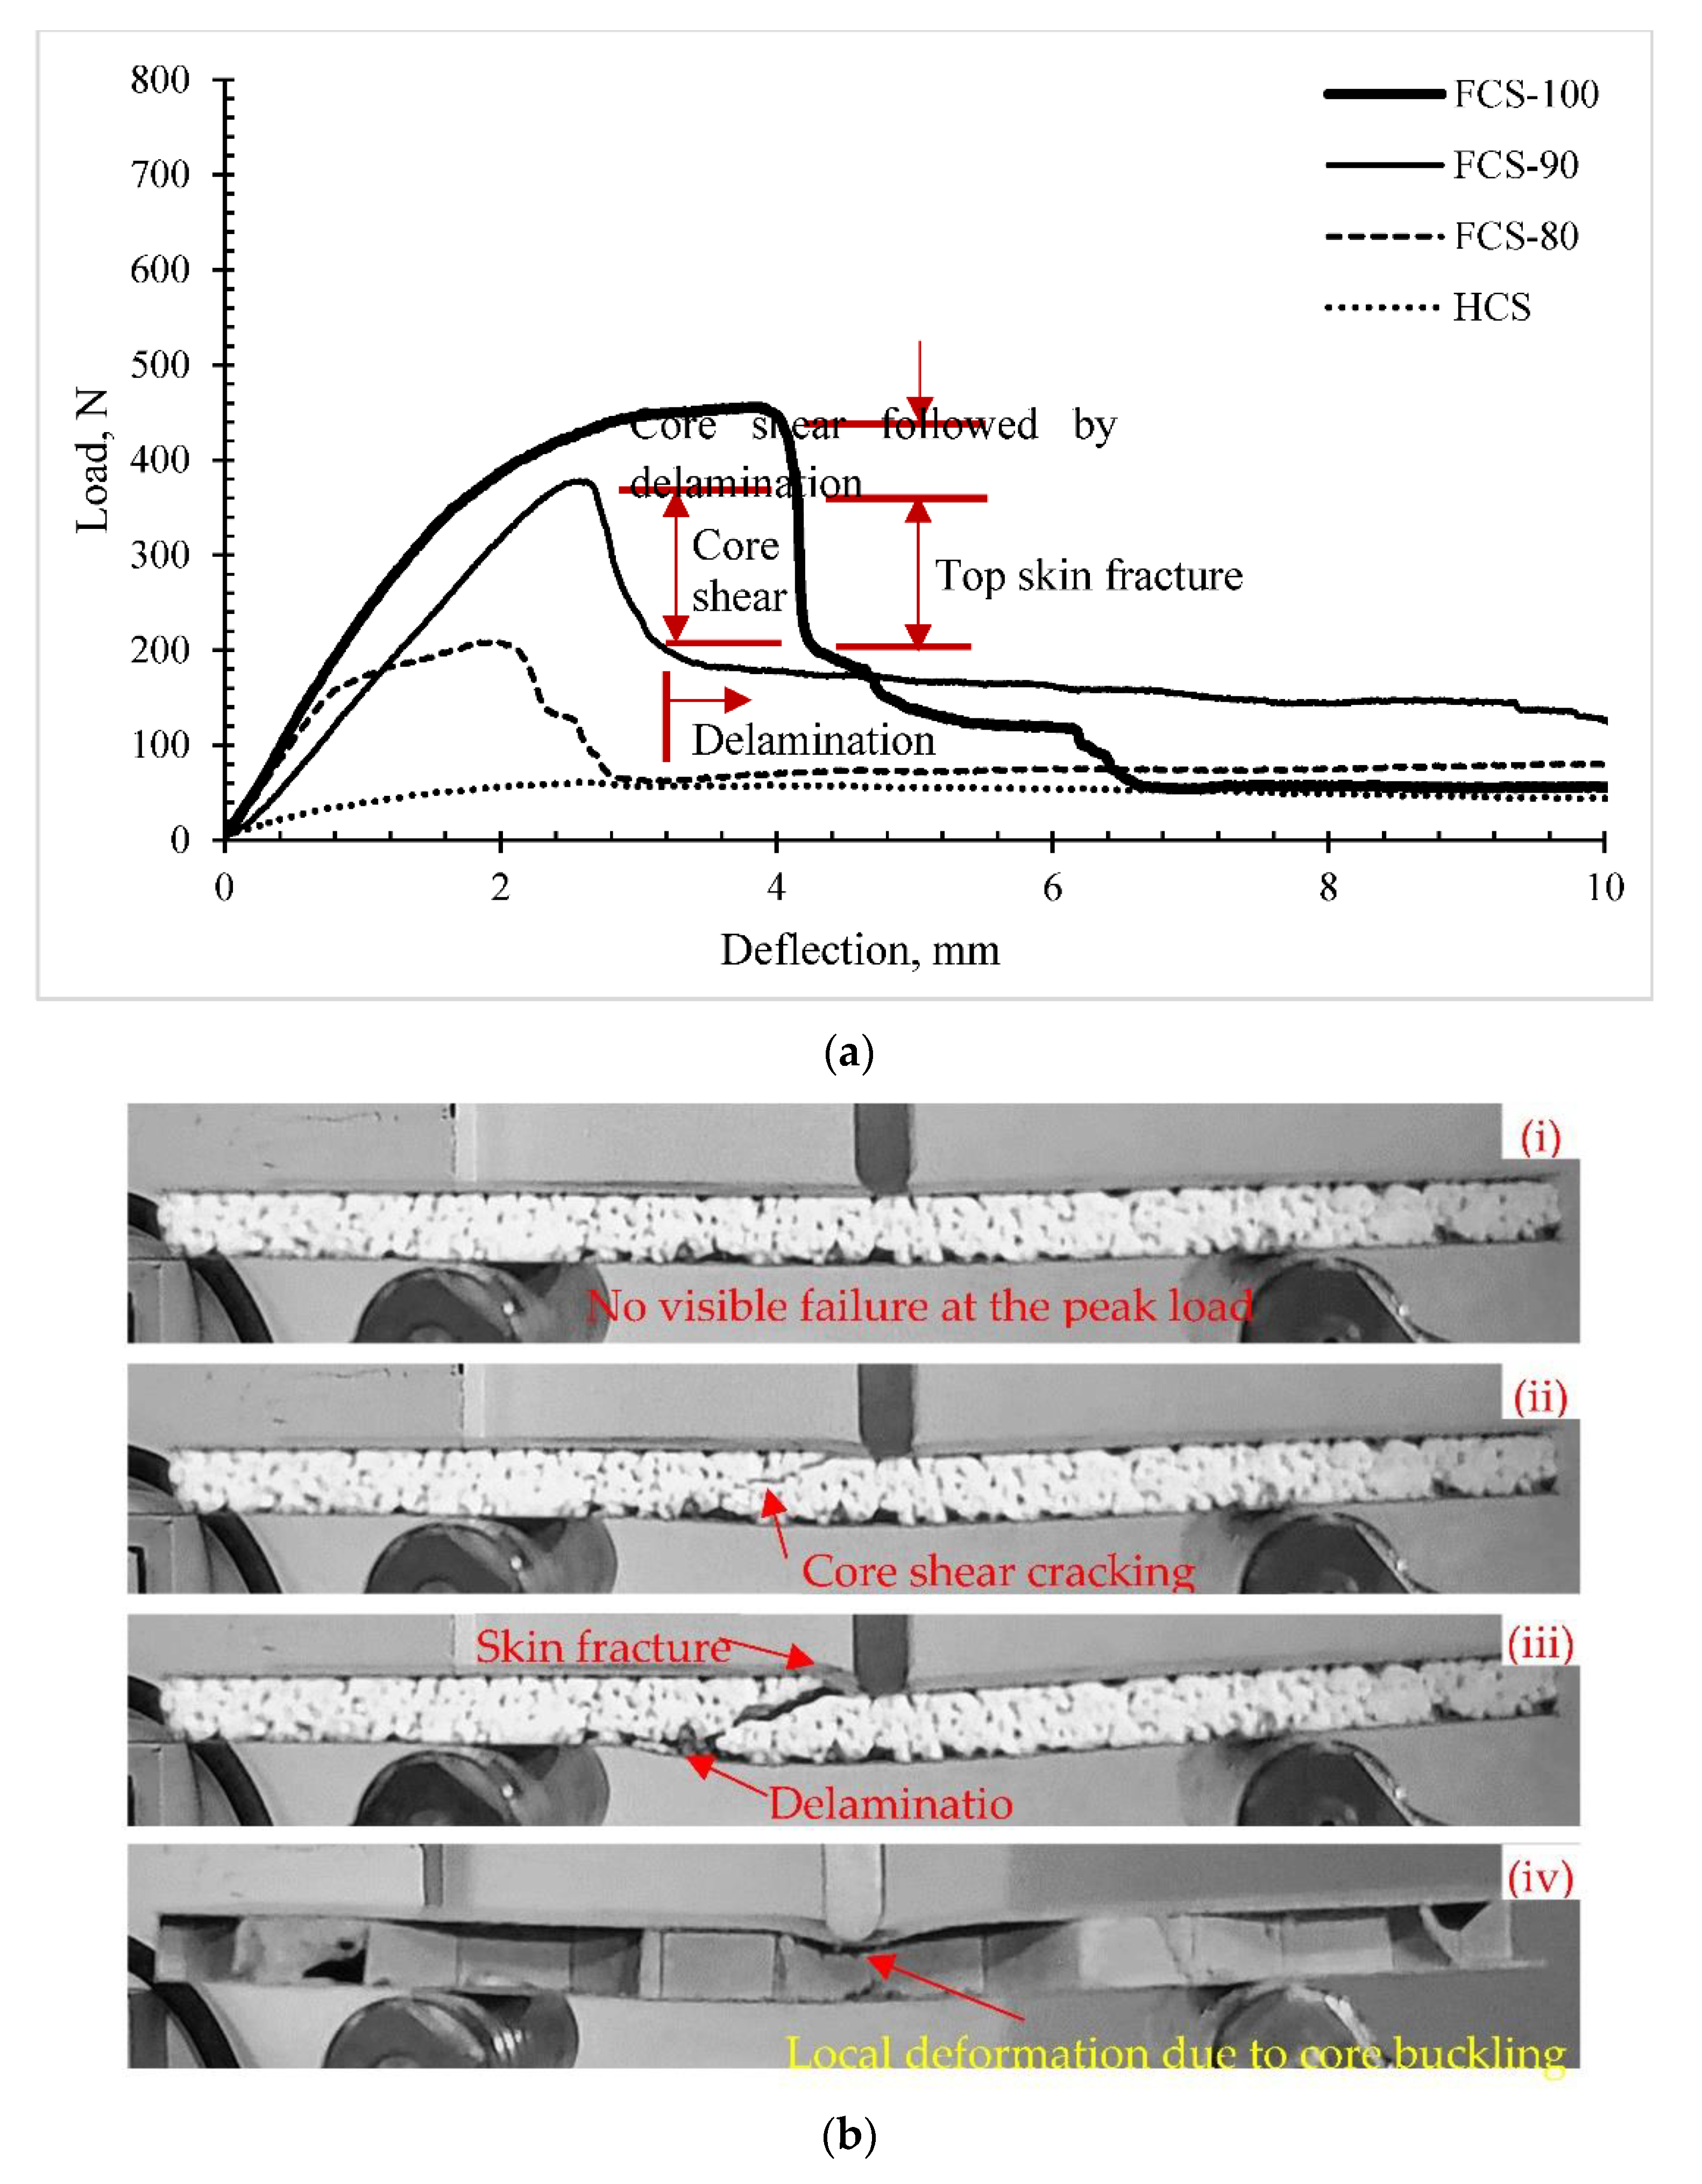
| FCS - 100 | Core shear – delamination - top skin fracture |
| FCS - 90 | Core shear – delamination |
| FCS - 80 | Core shear – delamination |
| HCS | Local buckling of honeycomb core |
4.8. Thermal Behavior
| Reference | Materials | Density(g/cm3) | Thermal Conductivity(W/m.K) |
| [25] | Gypsum Board | 0.65 | 0.159 |
| [36] | Gypsum fiberboard | 1.15 | 0.32 |
| [37] | MDF | 0.696 | 0.0974 |
| [37] | Thin MDF | 0.802 | 0.1104 |
| [41] | Date Palm Waste-MDF sandwich panel | 0.456 | 0.1357 |
| [36] | Oriented strand boards (OSB) or plywood (PWD) | 0.65 | 0.13 |
| [37] | Plywood (Beech) | 0.679 | 0.1304 |
| [40] | Plywood (Scots pine) | 0.58 | 0.10 |
| [40] | Plywood (Black pine) | 0.60 | 0.11 |
| [37] | Particleboard | 0.597 | 0.0965 |
| [25] | Flax-reinforced Portland cement skin with kraft paper honeycomb core | 0.89 | 0.097 |
| [38] | Coconut coir cement board | 1.04 | 0.40 |
| [38] | Commercial flakeboard | 1.04 | 0.36 |
| [38] | Commercial cellulose board | 1.56 | 0.68 |
| [42] | Polystyrene foamed concrete | 0.4 | 0.157 |
| [43] | Cork–gypsum composite | 0.472 | 0.124 |
| [44] | Gypsum composite | 0.88 | 0.13 |
| [45] | Newspaper sandwiched ALC panel | 1.1 | 0.30 |
| Current study | Perlite/sodium silicate foam-based sandwich with Formica sheet skin | 0.40-0.47 | 0.095 - 0.113 |
5. Conclusions
- The flexural properties of the foam-only sandwich structures improved significantly with the addition of paper honeycomb reinforcement, indicating a potential method for enhancing foam core-based sandwich structures. Furthermore, the introduction of perlite/sodium silicate composite foam filling in the cells of the paper honeycomb core resulted in a remarkable increase in the flexural properties of the sandwich structures.
- The paper honeycomb core-based sandwich structure exhibited a reasonable flexural strength of 1.01 MPa, making it suitable for non-load-bearing structures. The density of the sandwich structures increased due to foam filling, but the specific flexural properties were substantially greater than the paper honeycomb core-based sandwiches.
- The failure initiation due to flexural loading in foam only and foam-filled paper honeycomb sandwich structures occurred by core shear cracking. In contrast, the failure in the paper honeycomb core-based sandwich was found to be local deformation due to core buckling.
- The highest facing stress developed in the sandwich structure was lower than the tensile strength of the Formica sheet indicating that the performance of the sandwich structures could be further improved by enhancing the shear strength of the core.
- Core shear failure did not significantly impact the load-bearing capacity of the sandwiches. Instead, the second stage of failure, such as delamination or skin fracture, led to a rapid drop in load-bearing capacity.
- The concentration of sodium silicate and the presence of paper honeycomb reinforcement in the perlite/sodium silicate foam core-based sandwich structures had an insignificant effect on thermal conductivity.
- The thermal conductivity of the foam core-based sandwiches, with and without paper honeycomb, ranged from 0.095 to 0.113 W/mK, which is significantly lower than that of many existing building materials described in the literature. Additionally, the specific flexural properties of the sandwiches studied in this work were comparable to those of common building materials used in non-load-bearing applications.
References
- Berge, B., The ecology of building materials. 2009: Routledge.
- Lanzón, M. and P. García-Ruiz, Lightweight cement mortars: Advantages and inconveniences of expanded perlite and its influence on fresh and hardened state and durability. Construction and Building Materials, 2008. 22(8): p. 1798-1806. [CrossRef]
- Dube, W., L. Sparks, and A. Slifka, Thermal conductivity of evacuated perlite at low temperatures as a function of load and load history. Cryogenics, 1991. 31(1): p. 3-6. [CrossRef]
- Ennis, D. Perlite mining and reclamation in the no aqua peaks, Taos County, New Mexico. in 62nd Field Conference Geology of the Tusas Mountains–Ojo Caliente: New, Mexico, USA, New Mexico Geological Society Guidebook. 2011.
- Yilmazer, S. and M.B. Ozdeniz, The effect of moisture content on sound absorption of expanded perlite plates. Building and Environment, 2005. 40(3): p. 311-318. [CrossRef]
- Rashad, A.M., A synopsis about perlite as building material–A best practice guide for Civil Engineer. Construction and Building Materials, 2016. 121: p. 338-353. [CrossRef]
- Jack, M. and C.E. Rahr, Building board of fiber and asphalt coated perlite. 1953, Google Patents.
- Sherman, N. and J.H. Cameron, Method of manufacturing improved mineral board. 1981, Google Patents.
- Shastri, D. and H.S. Kim, A new consolidation process for expanded perlite particles. Construction and Building Materials, 2014. 60: p. 1-7. [CrossRef]
- Vimmrova, A., et al., Lightweight gypsum composites: Design strategies for multi-functionality. Cement and Concrete Composites, 2011. 33(1): p. 84-89. [CrossRef]
- Karua, P., M. Arifuzzaman, and M.S. Islam, Effect of jute fiber reinforcement on the mechanical properties of expanded perlite particles-filled gypsum composites. Construction and Building Materials, 2023. 387: p. 131625. [CrossRef]
- Arifuzzaman, M. and H.S. Kim, Novel mechanical behaviour of perlite/sodium silicate composites. Construction and Building Materials, 2015. 93: p. 230-240. [CrossRef]
- Arifuzzaman, M. and H.S. Kim. Flatwise Compression and Flexural Behaviour of Perlite/Sodium Silicate Composite Foam. in Applied Mechanics and Materials. 2017. Trans Tech Publ. [CrossRef]
- Arifuzzaman, M. and H.S. Kim, Prediction and evaluation of density and volume fractions for the novel perlite composite affected by internal structure formation. Construction and Building Materials, 2017. 141: p. 201-215. [CrossRef]
- Arifuzzaman, M. and H.S. Kim, Plane Stress/Strain Compressive Behavior of Perlite Composite Foam. Journal of Testing and Evaluation, 2019. 47(4): p. 2905-2925. [CrossRef]
- Adhikary, P., M. Arifuzzaman, and E. Kabir, Compressive properties of expanded perlite based particulate composite for the application in building insulation Board. Journal of Engineering Advancements, 2020. 1(1): p. 01-05. [CrossRef]
- Karua, P. and M. Arifuzzaman, Compressive behavior of perlite/sodium silicate composite foam modified by boric acid. Metallurgical and Materials Engineering, 2022. 28(1): p. 103-124. [CrossRef]
- Takey, A.A.N., et al., Effect of Nylon Fiber Reinforcement on Mechanical Behavior of Expanded Perlite/Sodium Silicate Composites, in 2nd International Conference on Mechanical Engineering and Applied Sciences (ICMEAS). 2022, MIST: Dhaka, Bangladesh.
- Tian, Y.L., et al., A study of effect factors on sodium silicate based expanded perlite insulation board strength. Applied Mechanics and Materials, 2013. 405: p. 2771-2777. [CrossRef]
- Al Abir, A., M.O. Faruk, and M. Arifuzzaman. Novel expanded perlite based composite using recycled expanded polystyrene for building material applications. in International Conference on Mechanical, Industrial and Energy Engineering. 2020.
- Arifuzzaman, M. and H.S. Kim, Novel flexural behaviour of sandwich structures made of perlite foam/sodium silicate core and paper skin. Construction and Building Materials, 2017. 148: p. 321-333. [CrossRef]
- Wang, D., Impact behavior and energy absorption of paper honeycomb sandwich panels. International Journal of Impact Engineering, 2009. 36(1): p. 110-114. [CrossRef]
- Dongmei, W., Cushioning properties of multi-layer corrugated sandwich structures. Journal of Sandwich Structures & Materials, 2009. 11(1): p. 57-66. [CrossRef]
- Chen, Z. and N. Yan, Investigation of elastic moduli of Kraft paper honeycomb core sandwich panels. Composites Part B: Engineering, 2012. 43(5): p. 2107-2114. [CrossRef]
- Shahbazi, S., et al., Cementitious Insulated Drywall Panels Reinforced with Kraft-Paper Honeycomb Structures. Buildings, 2022. 12(8): p. 1261. [CrossRef]
- Fu, Y. and P. Sadeghian, Flexural and shear characteristics of bio-based sandwich beams made of hollow and foam-filled paper honeycomb cores and flax fiber composite skins. Thin-Walled Structures, 2020. 153: p. 106834. [CrossRef]
- Abd Kadir, N., et al. Experimental study on energy absorption of foam filled kraft paper honeycomb subjected to quasi-static uniform compression loading. in IOP Conference Series: Materials Science and Engineering. 2016. IOP Publishing. [CrossRef]
- Abd Kadir, N., et al. Experimental study of low-velocity impact on foam-filled Kraft paper honeycomb structure. in IOP Conference Series: Materials Science and Engineering. 2018. IOP Publishing. [CrossRef]
- Safarabadi, M., et al., Experimental and numerical study of buckling behavior of foam-filled honeycomb core sandwich panels considering viscoelastic effects. Journal of Sandwich Structures & Materials, 2021. 23(8): p. 3985-4015. [CrossRef]
- Sarkar, S.T., A.S.M. Aziz Naser; Ahammad, Raju; Islam, Md Shariful; Arifuzzaman, Md, Mechanical behavior of sandwich structure made of perlite foam core and JFRP skin, in 7th International Conference on Mechanical, Industrial and Energy Engineering (ICMIEE2022). 2022, Faculty of Mechanical Engineering, Khulna University of Engineering & Technology: Khulna, Bangladesh. p. ICMIEE22-212-1-5.
- Hossain, G.M.I.K., Pranto; Arifuzzaman, Md, Mechanical Characterization of Novel Sandwich Structures Made of Perlite/Epoxy Core with JFRP Facings, in 7th International Conference on Engineering Research, Innovation and Education (ICERIE2023). 2023, School of Applied sciences & Technology, SUST: Sylhet, Bangladesh. p. 341-1-7.
- Zenkert, D., An Introduction to Sandwich Structures, Student Edition. Dan Zenkert, 2005. 110.
- Pflug, J., et al. Continuously produced honeycomb cores. in INTERNATIONAL SAMPE SYMPOSIUM AND EXHIBITION. 2003. SAMPE; 1999.
- C393/C393M-11, A. Standard Test Method for Core Shear Properties of Sandwich Constructions by Beam Flexure. 2016.
- Barragán, V., et al., Testing a simple Lee's disc method for estimating throuh-plane thermal conductivity of polymeric ion-exchange membranes. International Journal of Heat and Mass Transfer, 2022. 184: p. 122295.
- Casagrande, D., P. Grossi, and R. Tomasi, Shake table tests on a full-scale timber-frame building with gypsum fibre boards. European Journal of Wood and Wood Products, 2016. 74: p. 425-442. [CrossRef]
- Thoemen, H., Wood-based panels: an introduction for specialists. 2010: Brunel University Press.
- Asasutjarit, C., et al., Development of coconut coir-based lightweight cement board. Construction and Building Materials, 2007. 21(2): p. 277-288. [CrossRef]
- Islam, M.M. and H.S. Kim, Sandwich composites made of syntactic foam core and paper skin: Manufacturing and mechanical behavior. Journal of Sandwich Structures & Materials, 2012. 14(1): p. 111-127. [CrossRef]
- Demirkir, C., et al., Influence of aging procedure on bonding strength and thermal conductivity of plywood panels. ACTA PHYSICA POLONICA A, 2016. 129(6): p. 1230-1234. [CrossRef]
- Haseli, M., M. Layeghi, and H.Z. Hosseinabadi, Characterization of blockboard and battenboard sandwich panels from date palm waste trunks. Measurement, 2018. 124: p. 329-337. [CrossRef]
- Sayadi, A.A., et al., Effects of expanded polystyrene (EPS) particles on fire resistance, thermal conductivity and compressive strength of foamed concrete. Construction and building materials, 2016. 112: p. 716-724. [CrossRef]
- Cherki, A.-b., et al., Experimental thermal properties characterization of insulating cork–gypsum composite. Construction and building materials, 2014. 54: p. 202-209. [CrossRef]
- San-Antonio-González, A., et al., Lightweight material made with gypsum and extruded polystyrene waste with enhanced thermal behaviour. Construction and Building Materials, 2015. 93: p. 57-63. [CrossRef]
- Ng, S.-C. and K.-S. Low, Thermal conductivity of newspaper sandwiched aerated lightweight concrete panel. Energy and Buildings, 2010. 42(12): p. 2452-2456. [CrossRef]
Disclaimer/Publisher’s Note: The statements, opinions and data contained in all publications are solely those of the individual author(s) and contributor(s) and not of MDPI and/or the editor(s). MDPI and/or the editor(s) disclaim responsibility for any injury to people or property resulting from any ideas, methods, instructions or products referred to in the content. |
© 2023 by the authors. Licensee MDPI, Basel, Switzerland. This article is an open access article distributed under the terms and conditions of the Creative Commons Attribution (CC BY) license (http://creativecommons.org/licenses/by/4.0/).


