1. Introduction
The depletion of ore reserves in the world is necessitating the search for the secondary sources of metals such as tailings (Álvarez et al., 2021; Mulenshi, 2021; Sarker et al., 2022; Vardanyan et al., 2019), slag (Gabasiane et al., 2021; Gorai et al., 2003; Lohmeier et al., 2021; Piatak et al., 2015; Sipunga, 2015), and electronic waste printed circuit boards (Franke et al., 2020; Jadhav & Hocheng, 2015; Łukomska et al., 2022; Mori de Oliveira et al., 2022; Park et al., 2017; Pietrelli et al., 2018; Trinh et al., 2021). Copper is one of the metals whose ore reserves have been depleted in many areas, with slag re-processing being common as a way of supplementing the fresh concentrates in smelters (Derkowska et al., 2021). Approximately 2 tons of slag per tonne of copper produced is generated in a typical pyrometallurgical process (Echeverry-Vargas et al., 2017; Gorai et al., 2003; Piatak et al., 2015). The composition of the slag is dependent on the mineralogy of the ore, but it typically contains oxides of gangue elements such as iron, silicon, magnesium, calcium, phosphorus and copper.
Namibia Custom Smelters in the Republic of Namibia is a standalone operation with no mining activities on site, i.e. they buy the concentrates from producers. There is always a continuous need to supplement the primary source with secondary materials such as the produced slag. The smelter can treat complex copper concentrates such as those containing arsenic (As). The smelter consists of an Ausmelt top submerged lance furnace, two Peirce Smith converters, sulphuric acid plant, slag milling and flotation plant and an arsenic trioxide production plant. That process allows the smelter to produce blister copper, sulphuric acid and arsenic trioxide. The blister copper (98.5% Cu) is delivered to refineries in Asia and Europe where it is further refined to copper metal. The Arsenic trioxide is sold worldwide, and the sulphuric acid is sold to Namibian companies in the uranium and copper industry for leaching purposes. Since 1964 when the smelter commenced with a blast furnace operation, historic slag has been stockpiled. Acknowledging the improvement in the technology over the decades, the historic slag can possibly be reprocessed to recover copper and other metal values. Previous studies on the slag samples collected on the dumps in the smelter area showed that there were some recoverable metal values including the high-tech elements such as germanium (Ettler et al., 2022; Jarosikova et al., 2017). The objective of this study was to characterize that historic slag chemically and mineralogically in order to identify all the commercially extractable elements and explain the conditions under which the phases were formed.
2. Materials and Methods
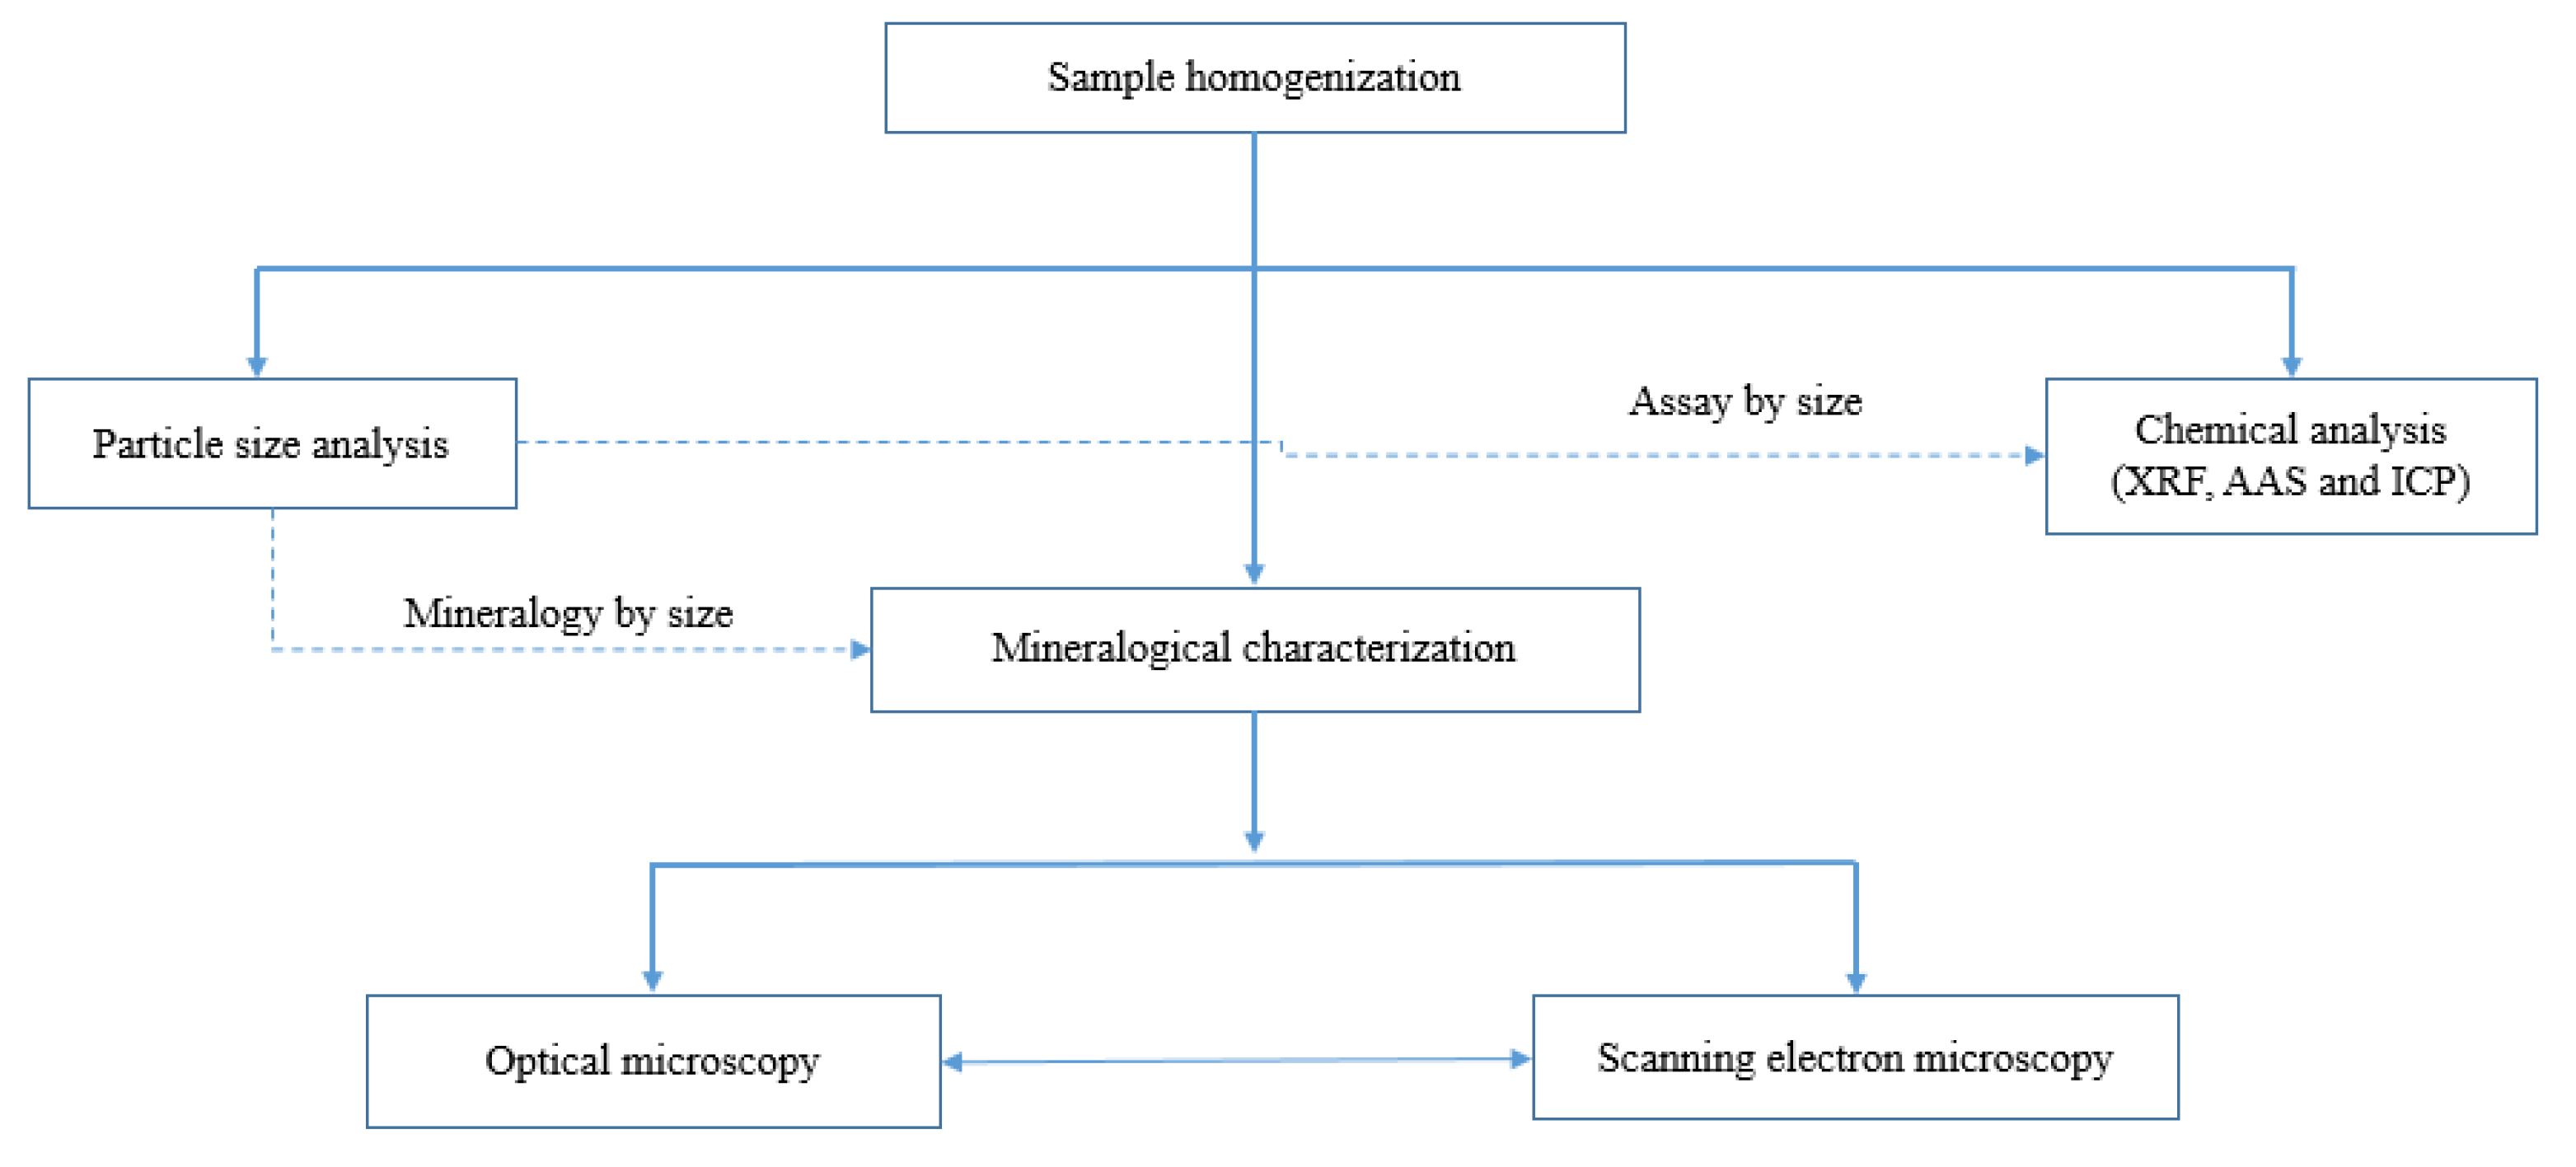
The smelter prepared a representative 20 kg sample which was sampled from a bulk slag sample obtained from a historic stockpile onsite. The received sample was already crushed to -5 mm. This was blended using the coning and quartering method prior to splitting. The rotary splitter was used to split the blended sample into 1 kg aliquots that were used for particle size analysis, chemical analyses and mineralogical characterization as shown in
Figure 1.
Particle size analysis was performed on two of the 1 kg sub-samples, but using different techniques, i.e., one sample was subjected to dry screening using the vibrating sieve shaker for 15 minutes while the other sample was manually wet screened. Sieves with the aperture sizes ranging between 38 and 3350 µm were used. Wet screening products were dried overnight in the oven set at a temperature of 80°C. The size-by-size products were reserved for chemical analysis and mineralogical characterization.
Chemical analysis was determined using three different techniques and thus providing validation of the assays. AAS analysis of Fe, Pb, Ca, Zn and Cu were performed on a Thermo Scientific ICE 3000 series Atomic Absorption Spectrometer. The ICP-OES analyses were conducted using the Perkin Elmer Optima 8000. XRF analyses were performed using the benchtop X-ray fluorescence (XRF) spectrometer model NEX CG supplied by Applied Rigaku Technologies from Austin, Texas, United States of America (USA). This benchtop XRF machine uses an in-built calibration procedure referred to as the multi-channel analyser (MCA) calibration software. Analysis was done on composite head sample as well as samples in the five particle size ranges +3350 µm, +850, +300, +75 and -75 µm. The chemical analysis was also done on the dried products after the grindability tests, classified into six granulometric ranges +300 µm, +212, +150, +106, +75 and -75 µm. The analysis of the classified slag materials was aimed at identifying the possibility of a preferential partition or concentration of valuable metals in slag particles in certain granulometric sizes. The AAS and ICP-OES samples were digested using aqua-regia (hydrochloric acid: nitric acid [1:3]) solution. For each sample, 1.0 g was added to 25 ml of aqua regia solution in a 100 ml beaker and heated for 2 hours. Following digestion, the sample was filtered and transferred with the help of 2% nitric acid in a 100 ml volumetric flask. Appropriate dilution factors were applied to allow the measurements of the concentration of the analytes.
The microstructures and phase distributions of the granulometric ranges were analysed in backscattered and in secondary electron modes in a scanning electron microscope (SEM) machine. The samples for microscopy consisted of two types:
Loose powders for observation of the particle morphologies and phases in the outer layers of as received condition
Slag material mounted on cold resin, ground on grit papers then polished to metallographic surface condition using diamond slurries up to the 3 micrometers for observation inside the cross sections of the particles.
The samples of the materials obtained after granulometric separation in six particle size ranges of +3350, -3350+850, -850+300, -300+75, -75+38, and -38 µm were hot mounted on resin and polished for observation using the JEOL JSM-IT300 scanning electron microscope coupled with the Thermo Scientific NS7 energy dispersive spectroscopy (EDS) software (Advancedlab, Switzerland). The samples were lightly carbon coated using the Quorum Q150T sputter coater (Advancedlab, Switzerland). SEM analysis was done in high vacuum in the backscattered mode (BSE) at an acceleration voltage of 15kV, a probe current of 50 nA, and a working distance of 15 mm. Other samples taken from these classified granulometric size ranges were attached on carbon tapes and observed in the SEM secondary electron mode without polishing. These samples were also mounted on a polished thin section to allow for observation in a BX51 Olympus optical microscope in both reflection and transmission modes for phase identification.
3. Results and Discussions
3.1. Particle Size Analysis of the Received Slag Material
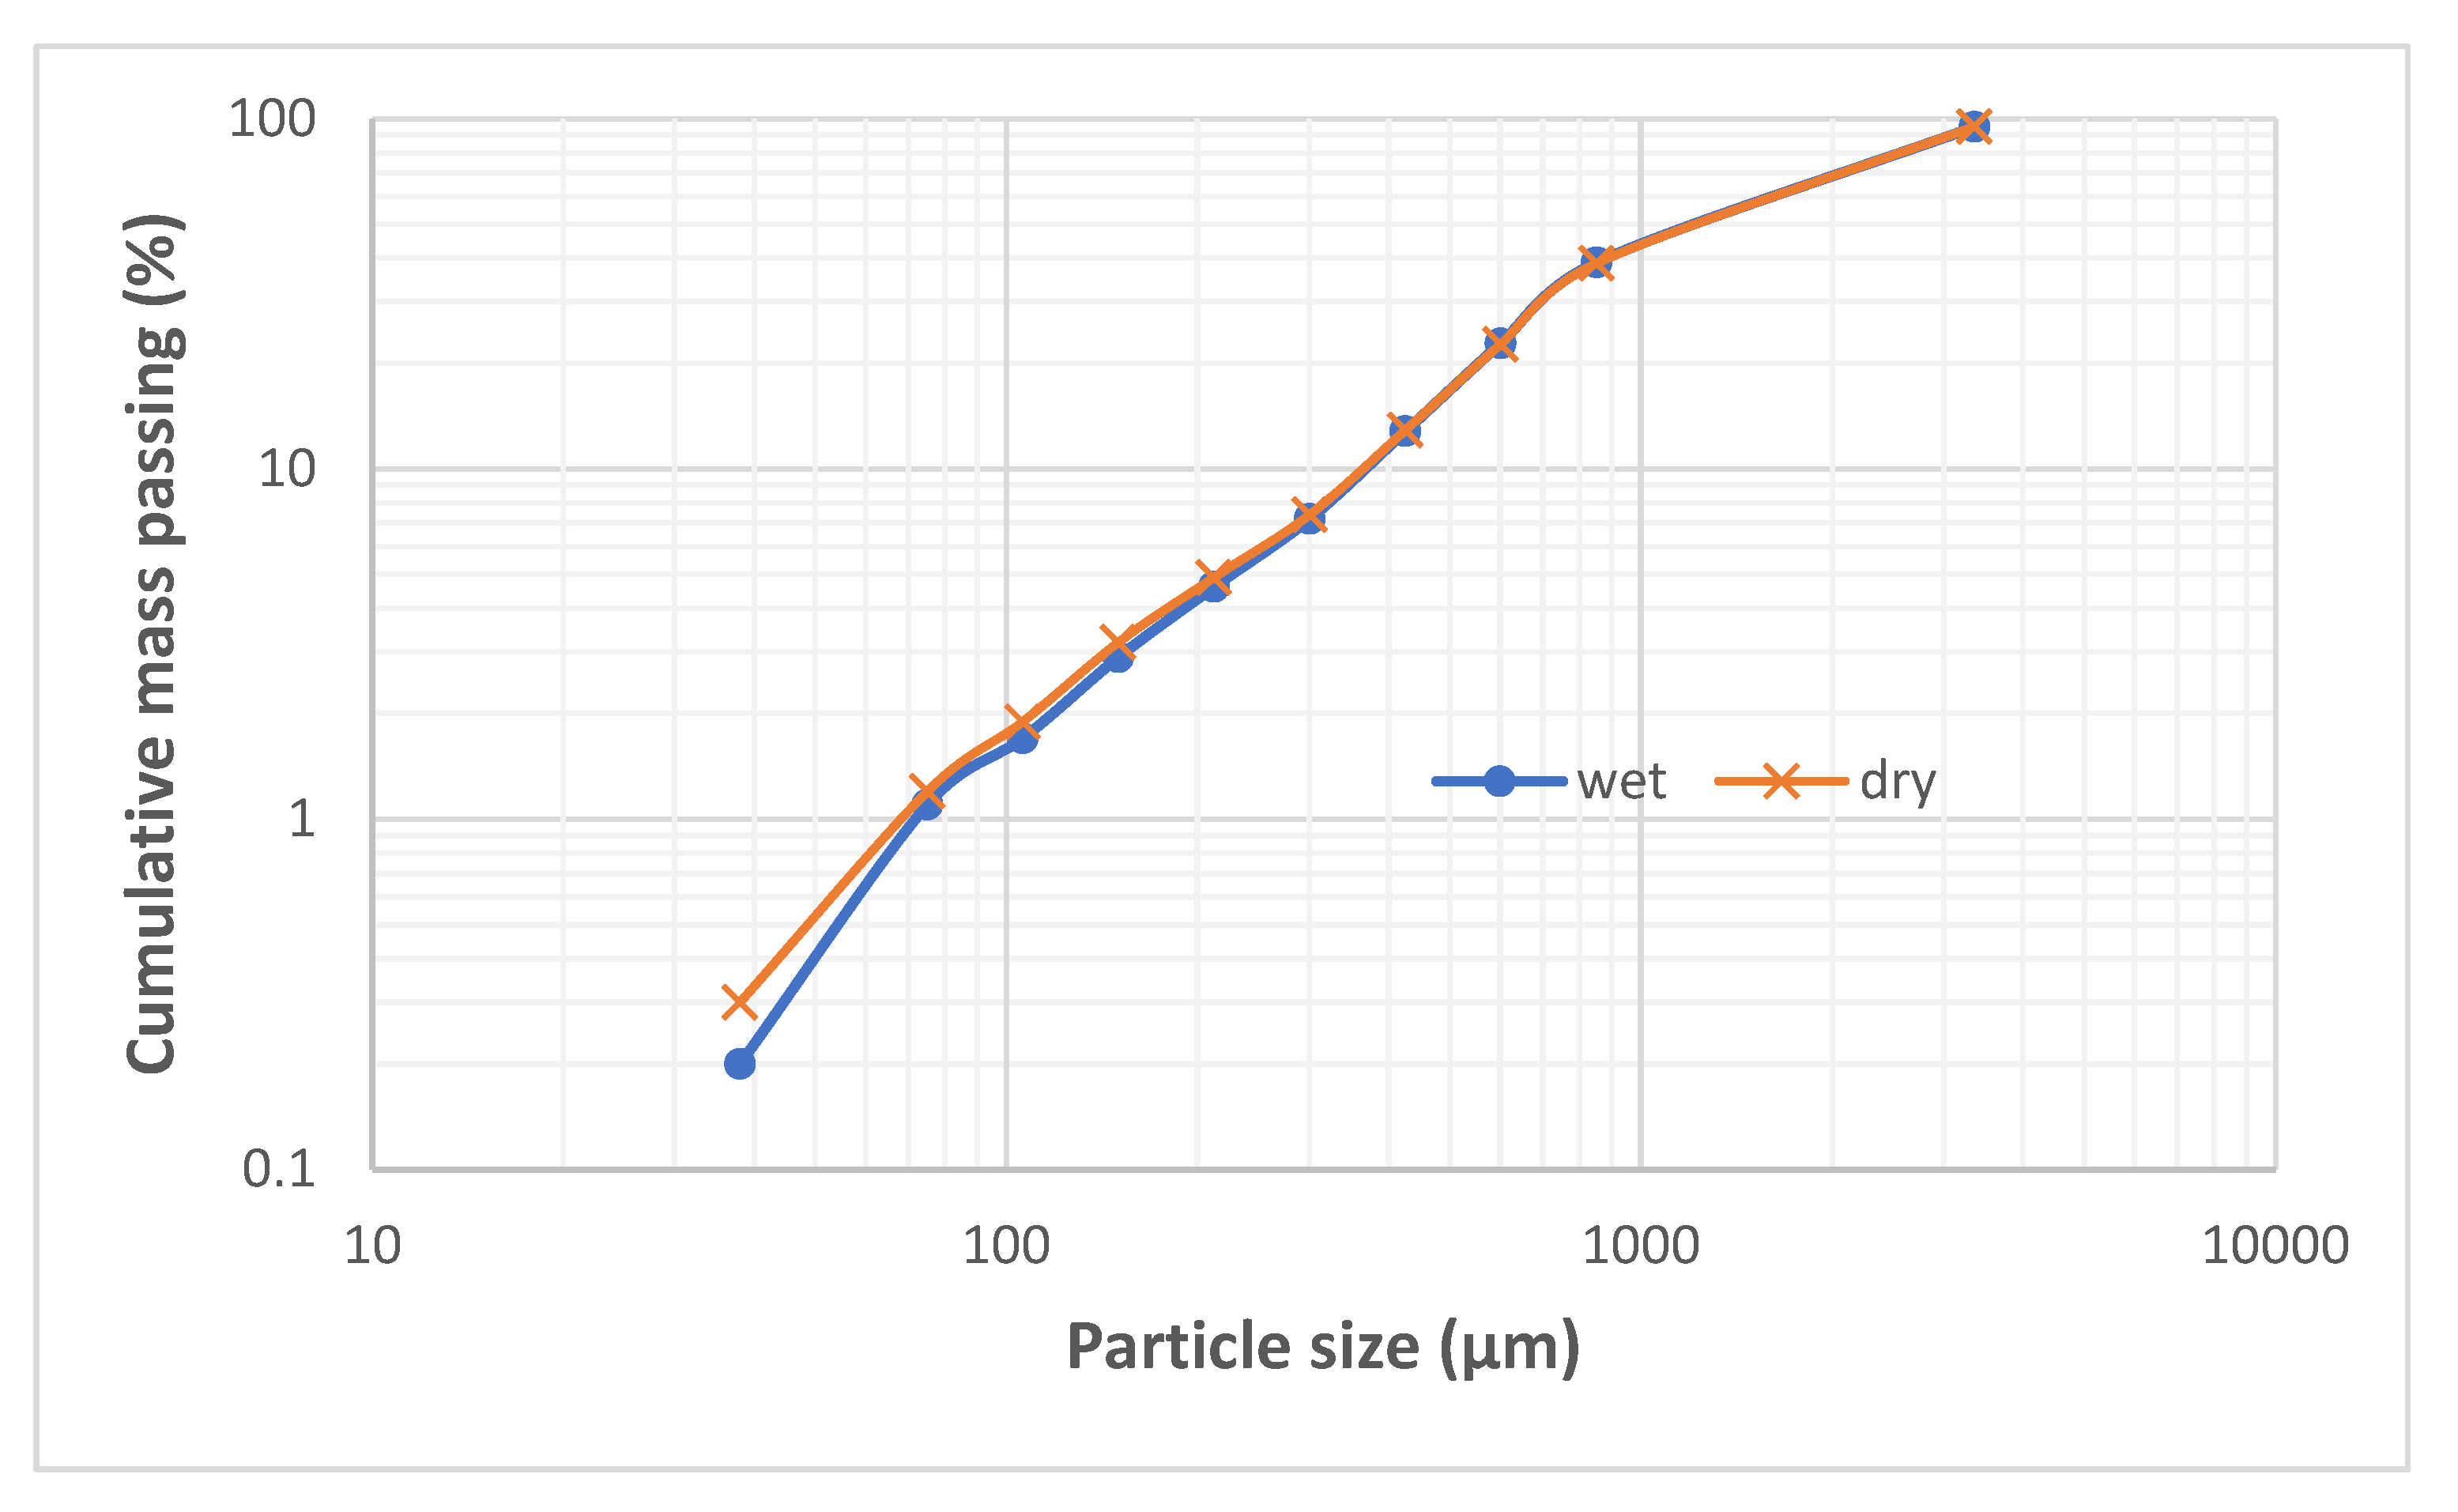
Figure 2 presents the particle size distributions of the received smelter slag after wet and dry screening. Since the size distributions of wet and dry sieving matched, it can be concluded that the slag material was not contaminated with soluble materials or the fine airborne materials from the surrounding fields of the dump. It can be observed that the ‘as received’ slag sample was 95% passing 3.35 mm while the particles that are coarser than 300 µm and those finer than 75 µm constitute 92 % (w/w) and 1.2 % (w/w) respectively of the slag sample. The 80 % passing size of the as-received smelter slag material is 2.5 mm.
3.2. Chemical Analysis
The chemical compositions of the composite smelter slag samples are listed in
Table 1. As expected for a variety of analytical instruments, there are differences in the assays of various metals as measured by AAS, ICP and XRF techniques. The copper assays range between 0.25 and 0.41% while that of iron ranges between 9.16 and 11.87%.
The assay-by-size (ABS) results are listed in
Table 2. It is acknowledged that in
Table 2, only the results of the coarsest size fraction (+3.35 mm) and finest size fraction (-75 μm) are presented, with the rest of the ABS results included in
Appendix A. ICP and XRF assays for copper and arsenic are comparable for both finest and coarsest size fractions. In general, it can be observed that the contents of metal values (with an exception of Fe, Zn, and Mn) are higher in the -75 μm (liberated particles) and lowest in the +3.35 mm (unliberated size fraction). Since -75 µm constitutes 1.2% (w/w) as shown in
Figure 2, the ICP assay of 1.08% Cu suggests that about 5% of the total copper in the slag is contained in the -75 µm size fraction. The 95% of the total copper is still locked in the slag particles coarser than +75 μm.
3.3. Morphology and Phase Distribution Characterisation of the Slag Materials
3.3.1. Scanning Electron Microscopy
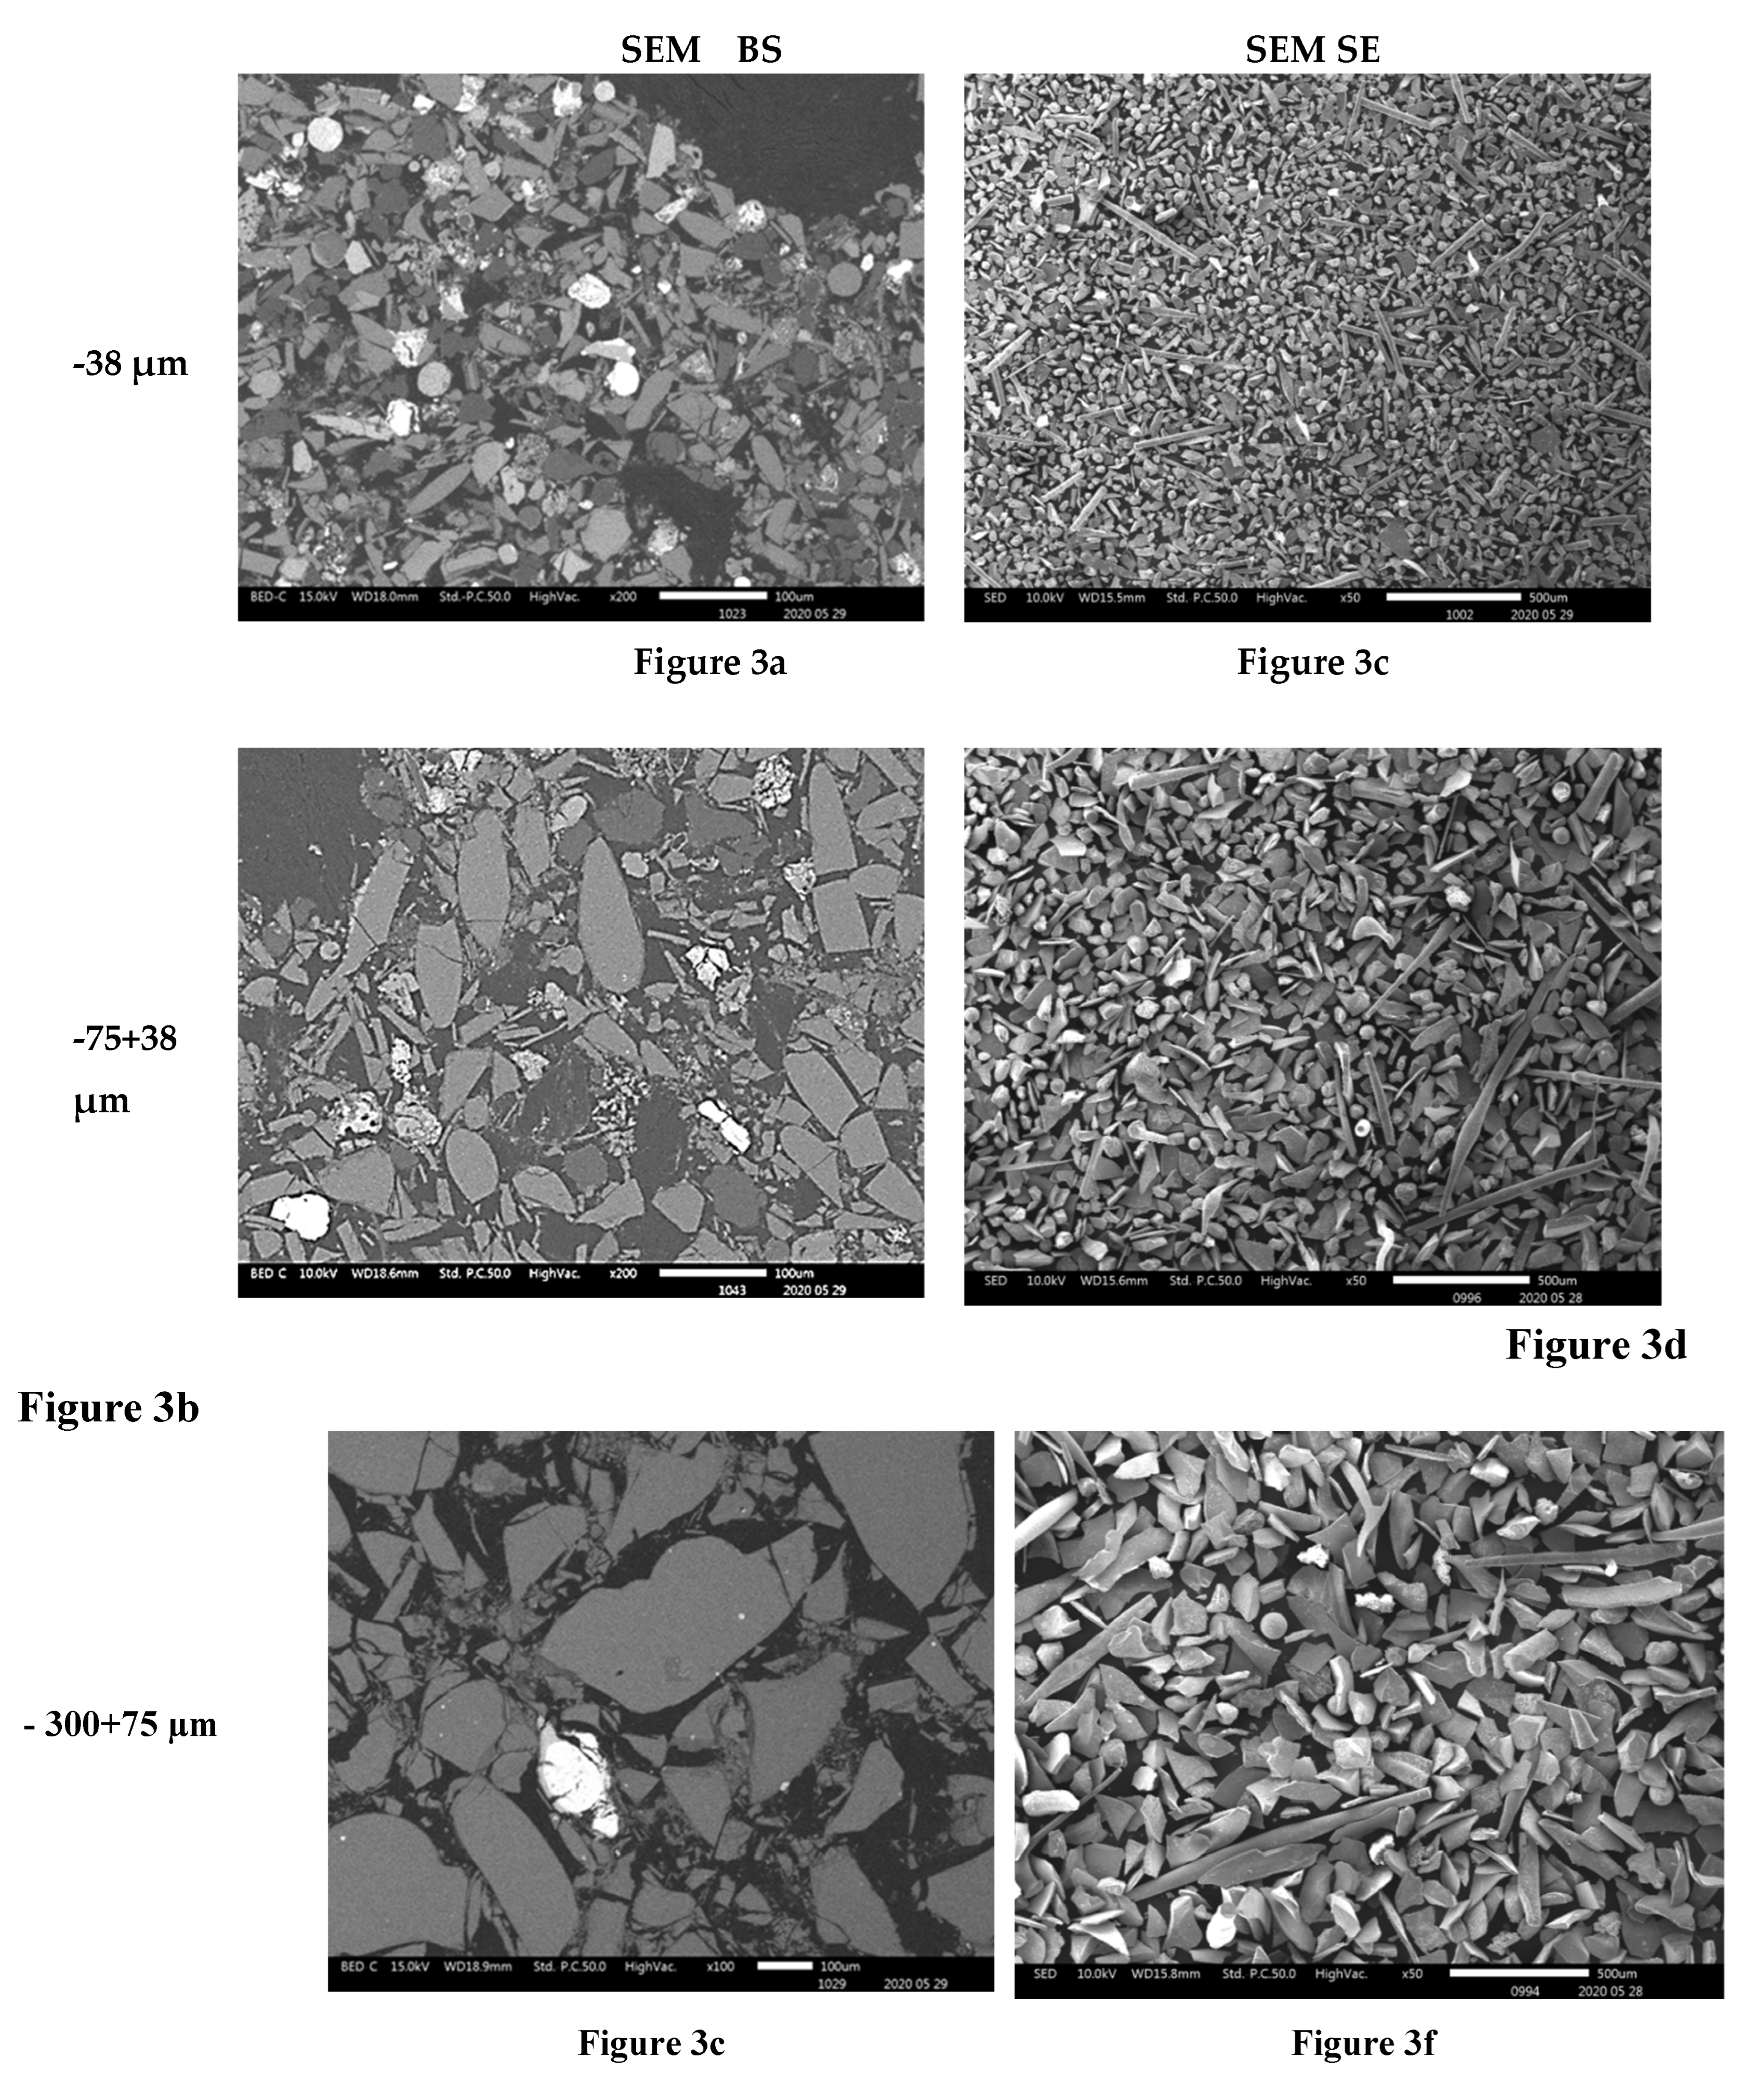
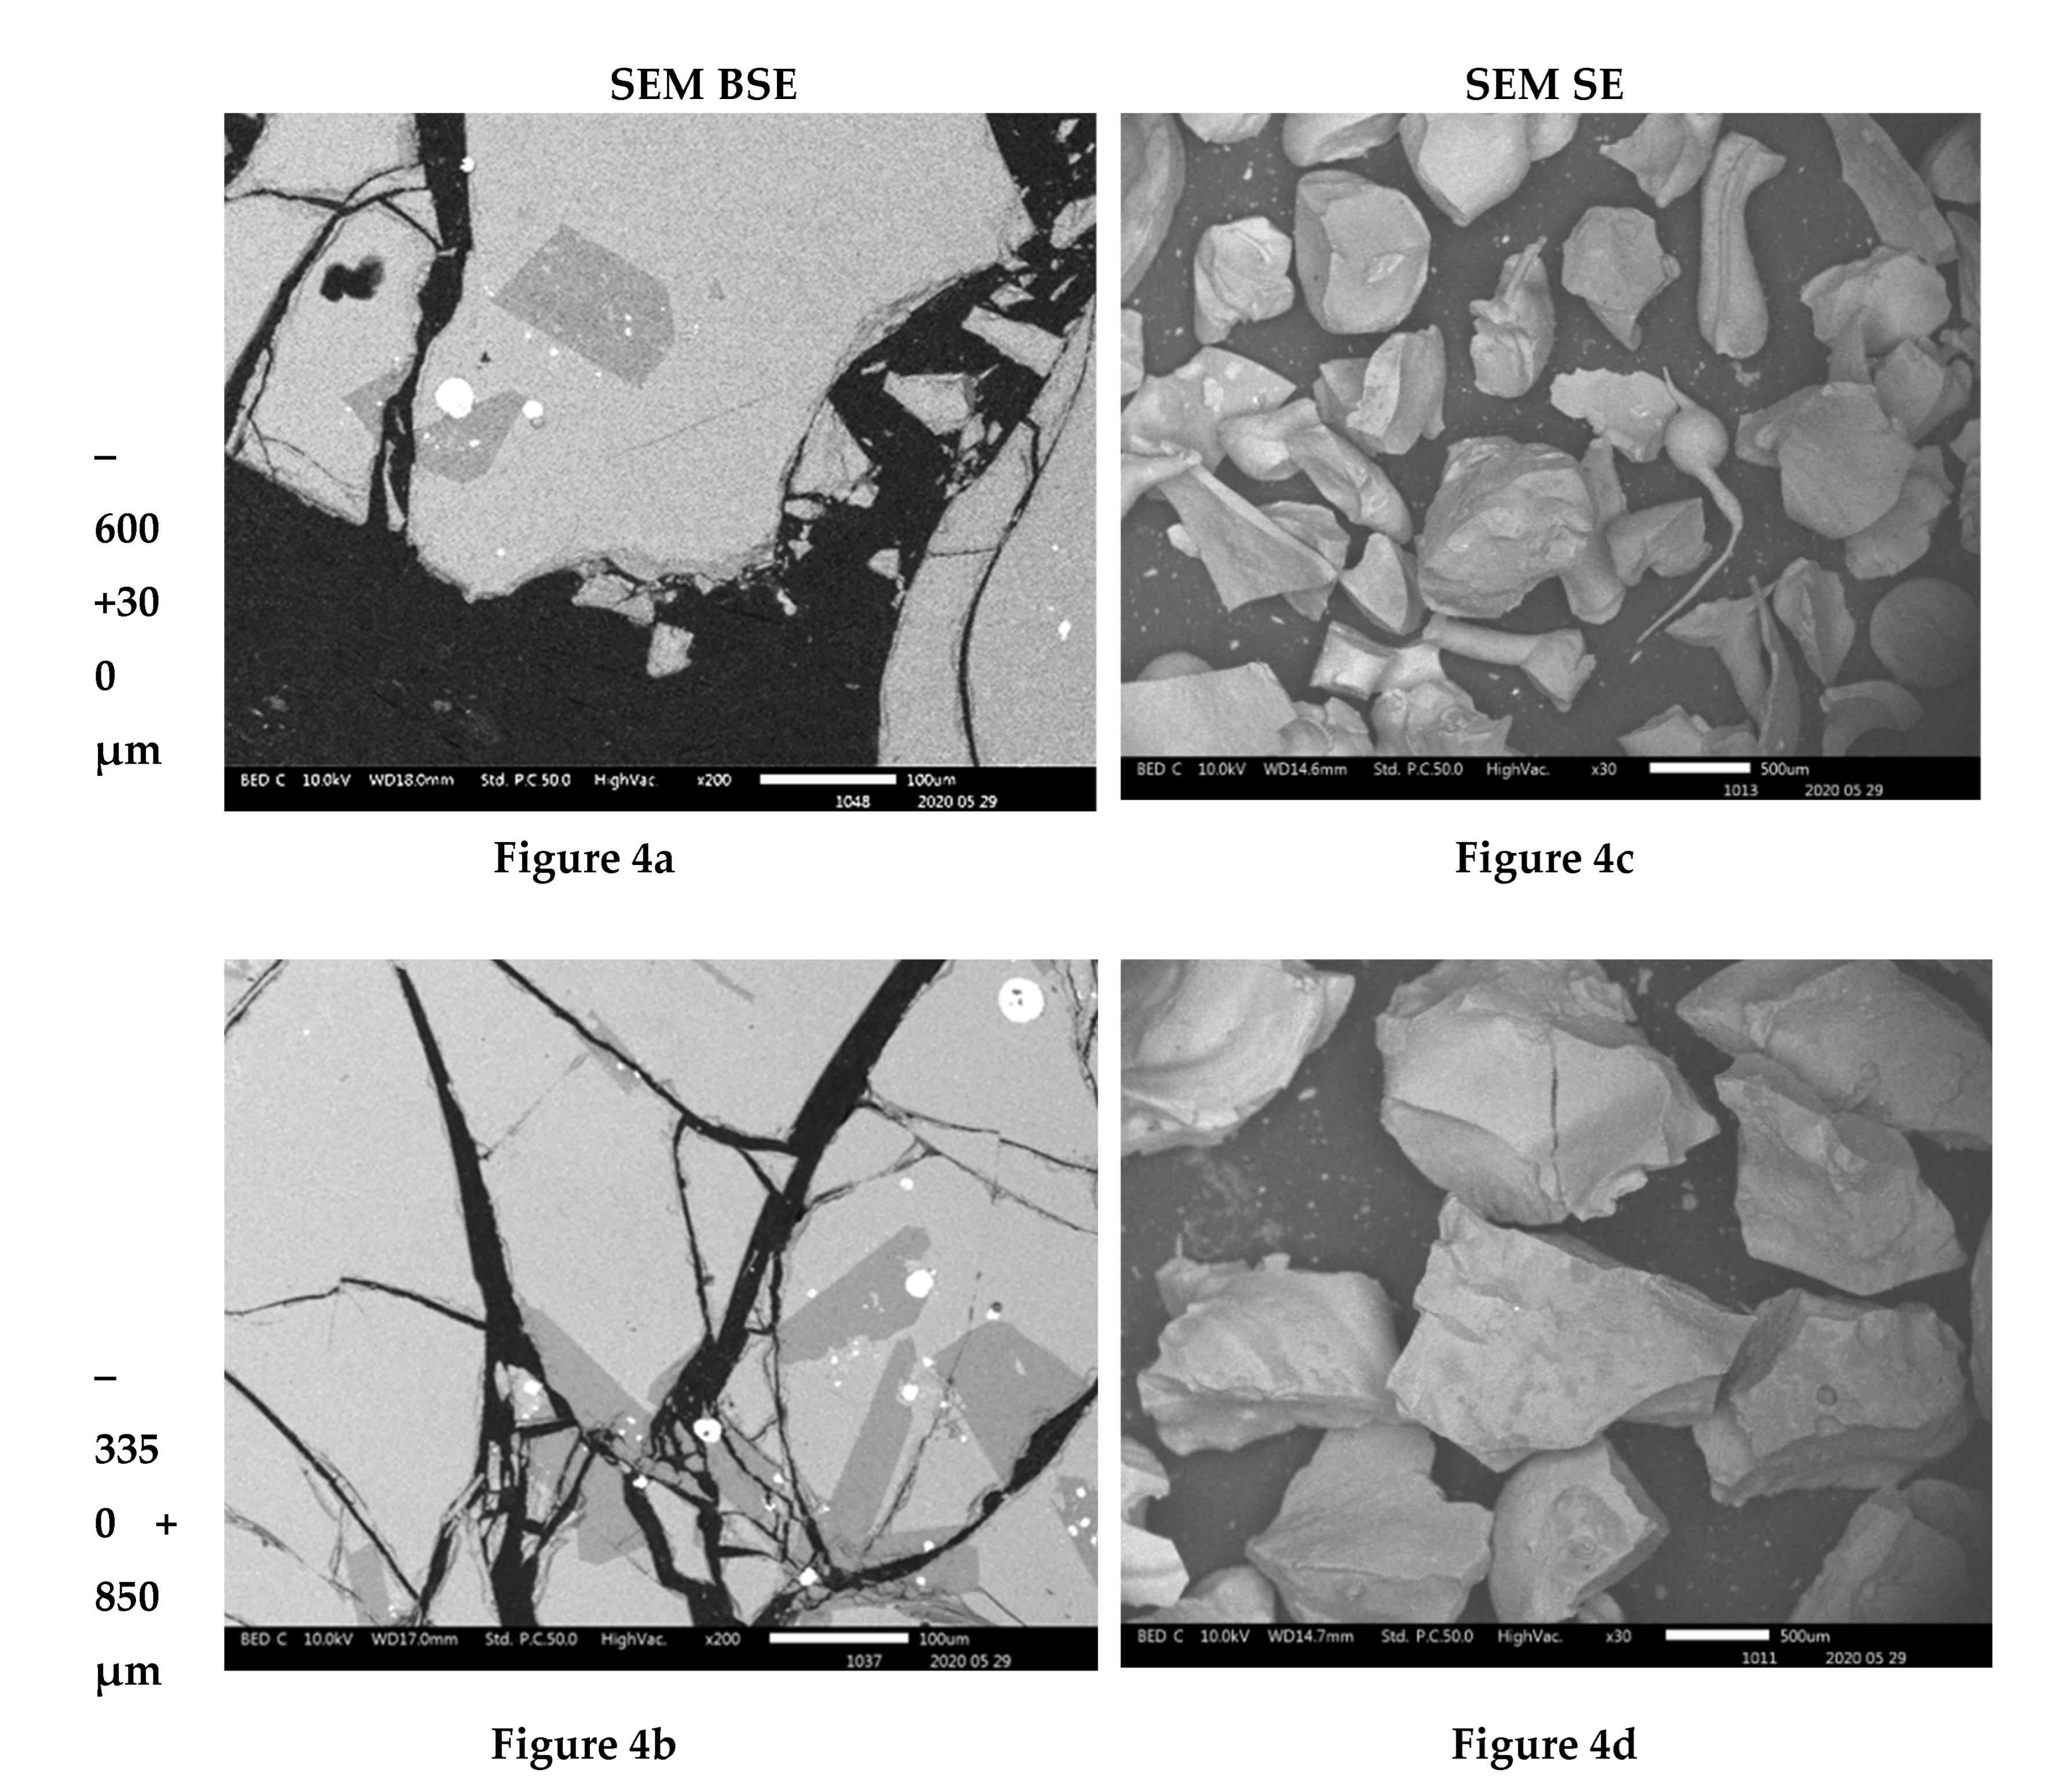
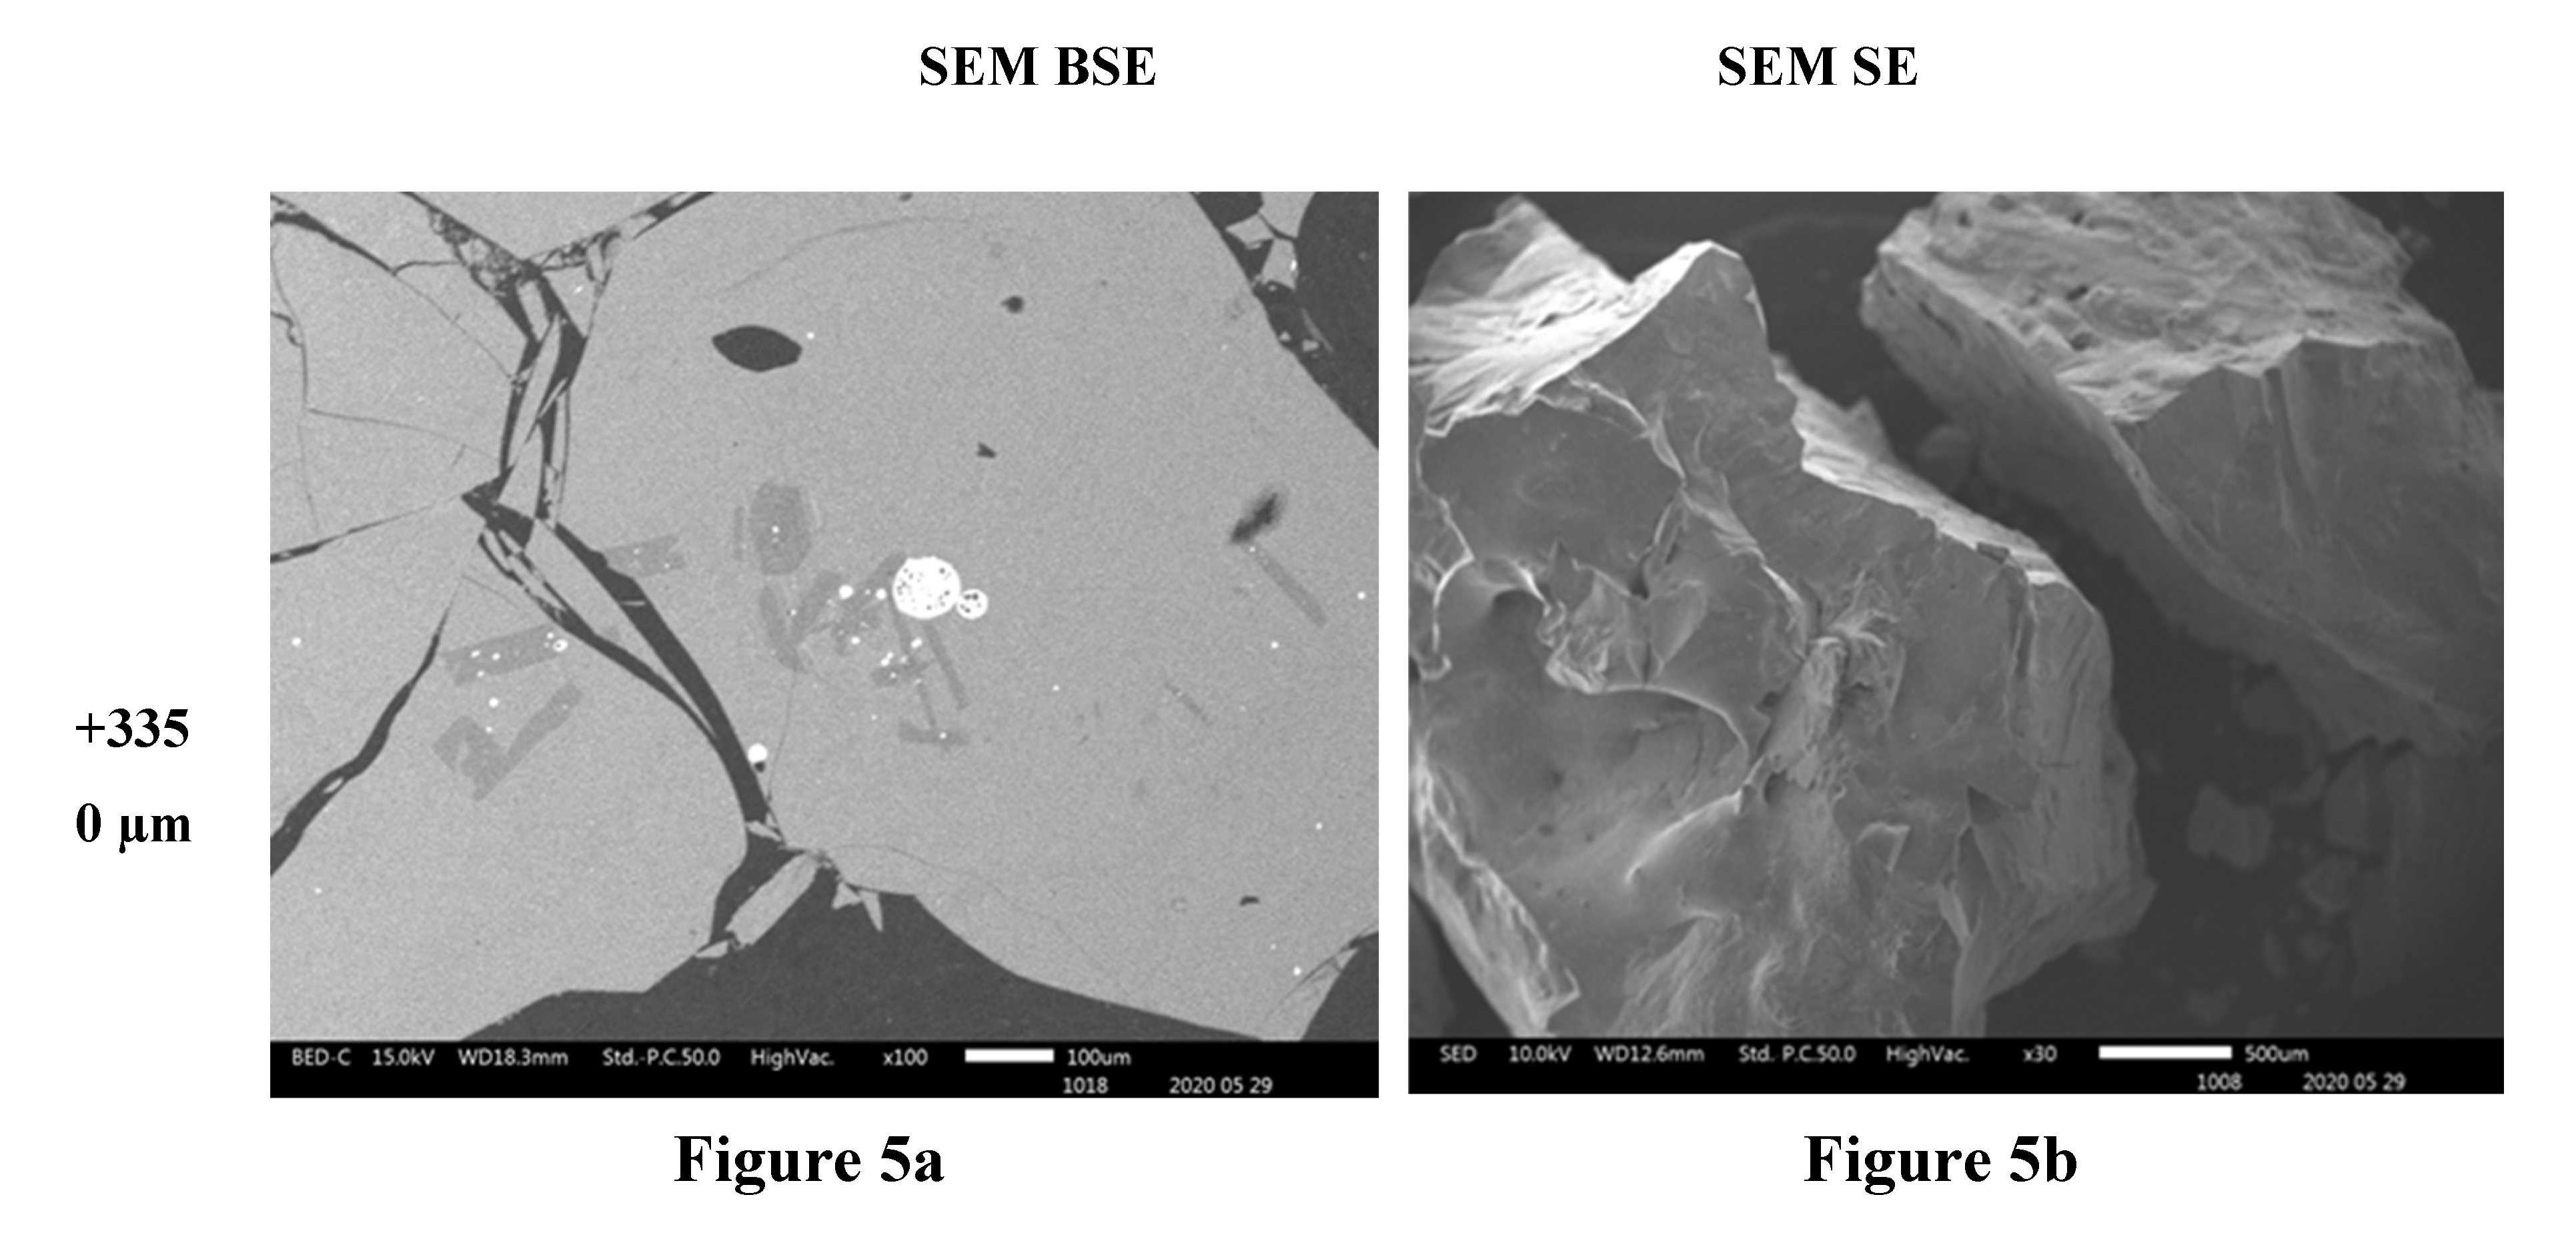
The compositional contrast observed in backscattered (BSE) mode images (
Figure 4a,
Figure 3b,c,
Figure 4a,b and
Figure 5a) indicate that higher proportions of particles of material phases containing the heavy elements were found in the fine particles ( -38 µm and -75+38 µm). The proportion of the phases of heavy elements is lower in the particles coarser than 300 µm. SEM BSE also revealed that the particles of the heavy metal phases present in the fine granulometric size ranges were separated from the slag matrix particles (i.e., higher degree of liberation between particles of metallic and slag phases). The separation of these particles from the slag matrix is attributed to the non-miscibility between the molten slag and the metal compounds contained in the matte that were mechanically dragged when tapping the slag from the hearth zone of the smelting furnace.
The morphologies and sizes of the particles of the matte or metal phases and the slag matrix particles were investigated under secondary electrons (SE) mode observation in the SEM machine. The images of
Figure 3,
Figure 4 and
Figure 5 illustrate the actual shapes. The SEM SE images indicate higher proportion of the high aspect ratio (Length / Diameter) needle-like particles present in the finer materials of -38 µm (
Figure 3c). These needle-like particles are relatively coarser within the fine size material fraction, but their relative volumetric proportion in the slag material decreases as the granulometric size ranges increase in the -75+38 µm (
Figure 3d) and then in the -300+75 µm (
Figure 3f). Finally, no needle-like particles are observed in the coarse size ranges of slag material fractions above 300 µm (
Figure 4c,d and
Figure 5b). The nature and formation mechanism of the needle-like particles is discussed in the next section.
The scanning electron microscopy images show that the small particles of matte or metal phases (high reflectance) found in the coarse granulometric ranges, above 300 µm (
Figure 4 and
Figure 5), were rather trapped by occlusion inside the smelting liquid slag and solidified upon quenching in the high pressure water jet. Large slag particles have cracks that formed during the fast quenching in the water jet. The formation of the cracks is attributed to the low thermal conductivity of the slag (Derin et al., 2003; Kang et al., 2014; Matsushita et al., 2011; Sibarani et al., 2020) and the difference in coefficients of thermal expansion, thus shrinkage, between the slag and the matte (metal) phases, which result in thermal stresses inside the solidified material. The particle size distribution in
Figure 2 suggested that the materials of granulometric size larger than 300 µm represent about 90% (w/w) of the sample of the received historic slag material. It, therefore, implies that the major quantities of matte and metal phases, that were mechanically dragged with the slag, are trapped inside the slag particles larger than 300 µm but their concentration values in these large particles are lower than in the finer materials (<300 µm). The fine particle size ranges (<300 μm) represent only about 8% (w/w) of the historic smelter slag but with higher contents of matte and metal phases.
3.3.2. Morphology and Composition of Fine Particle Materials
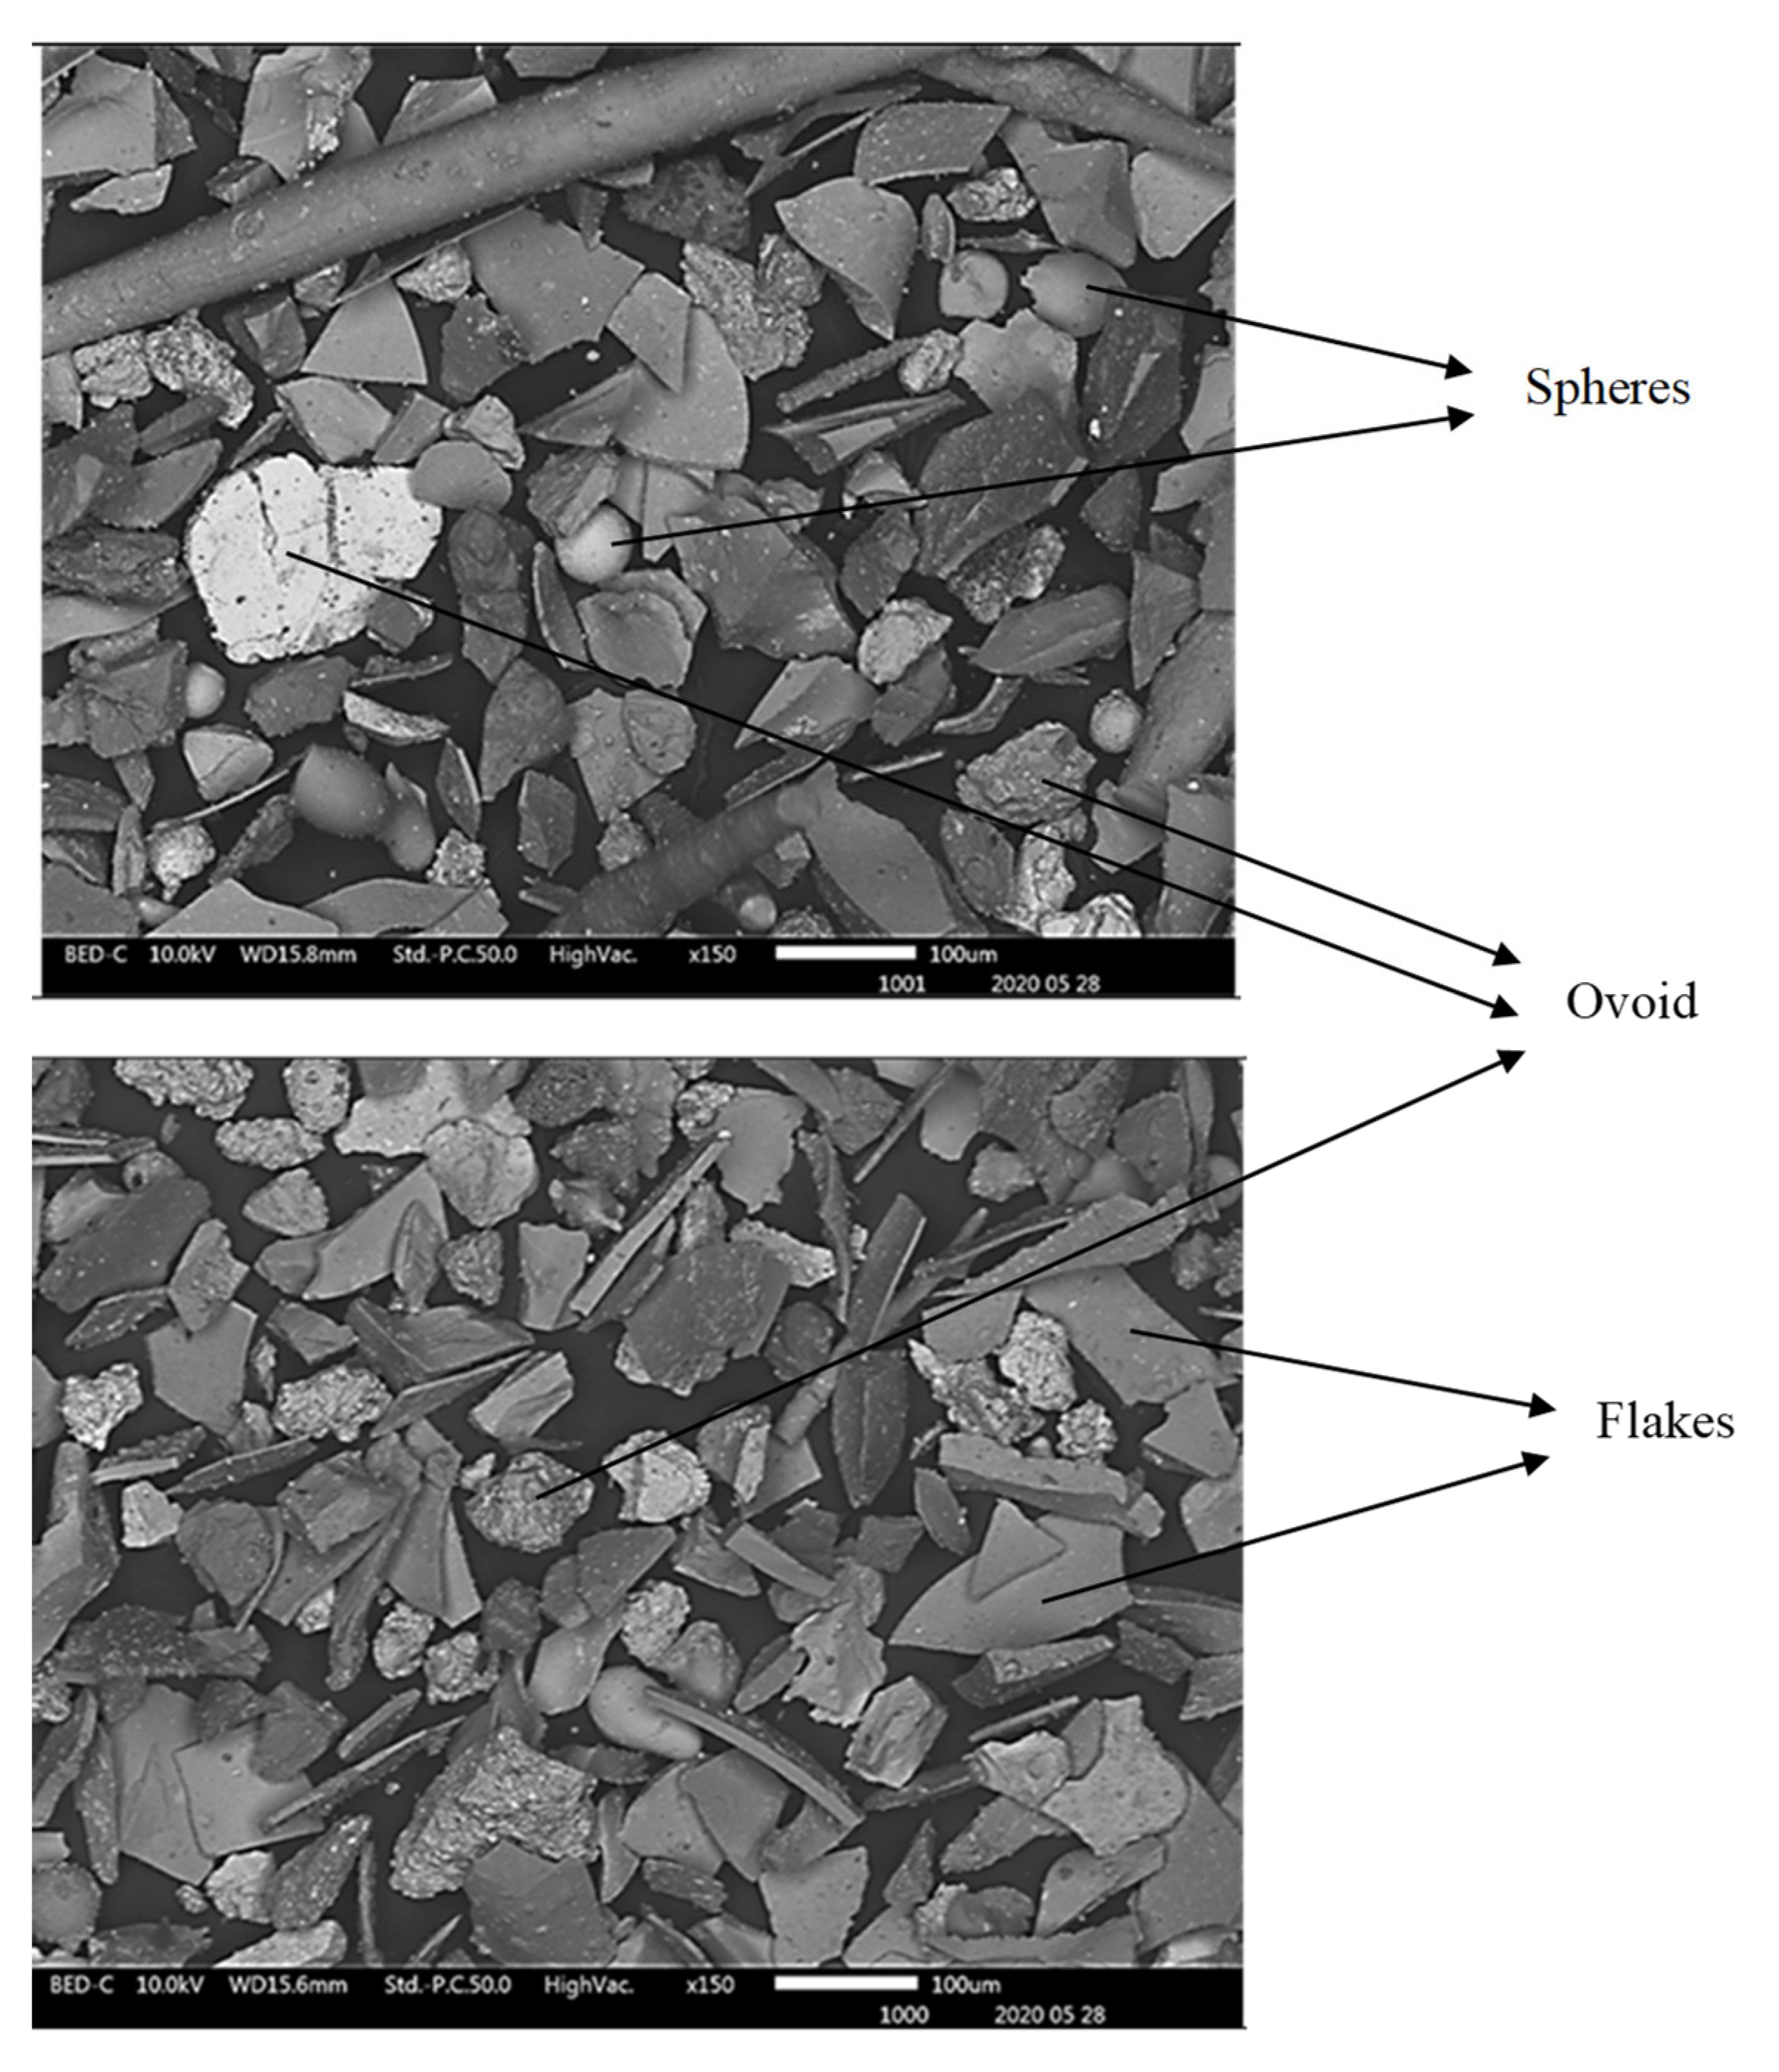
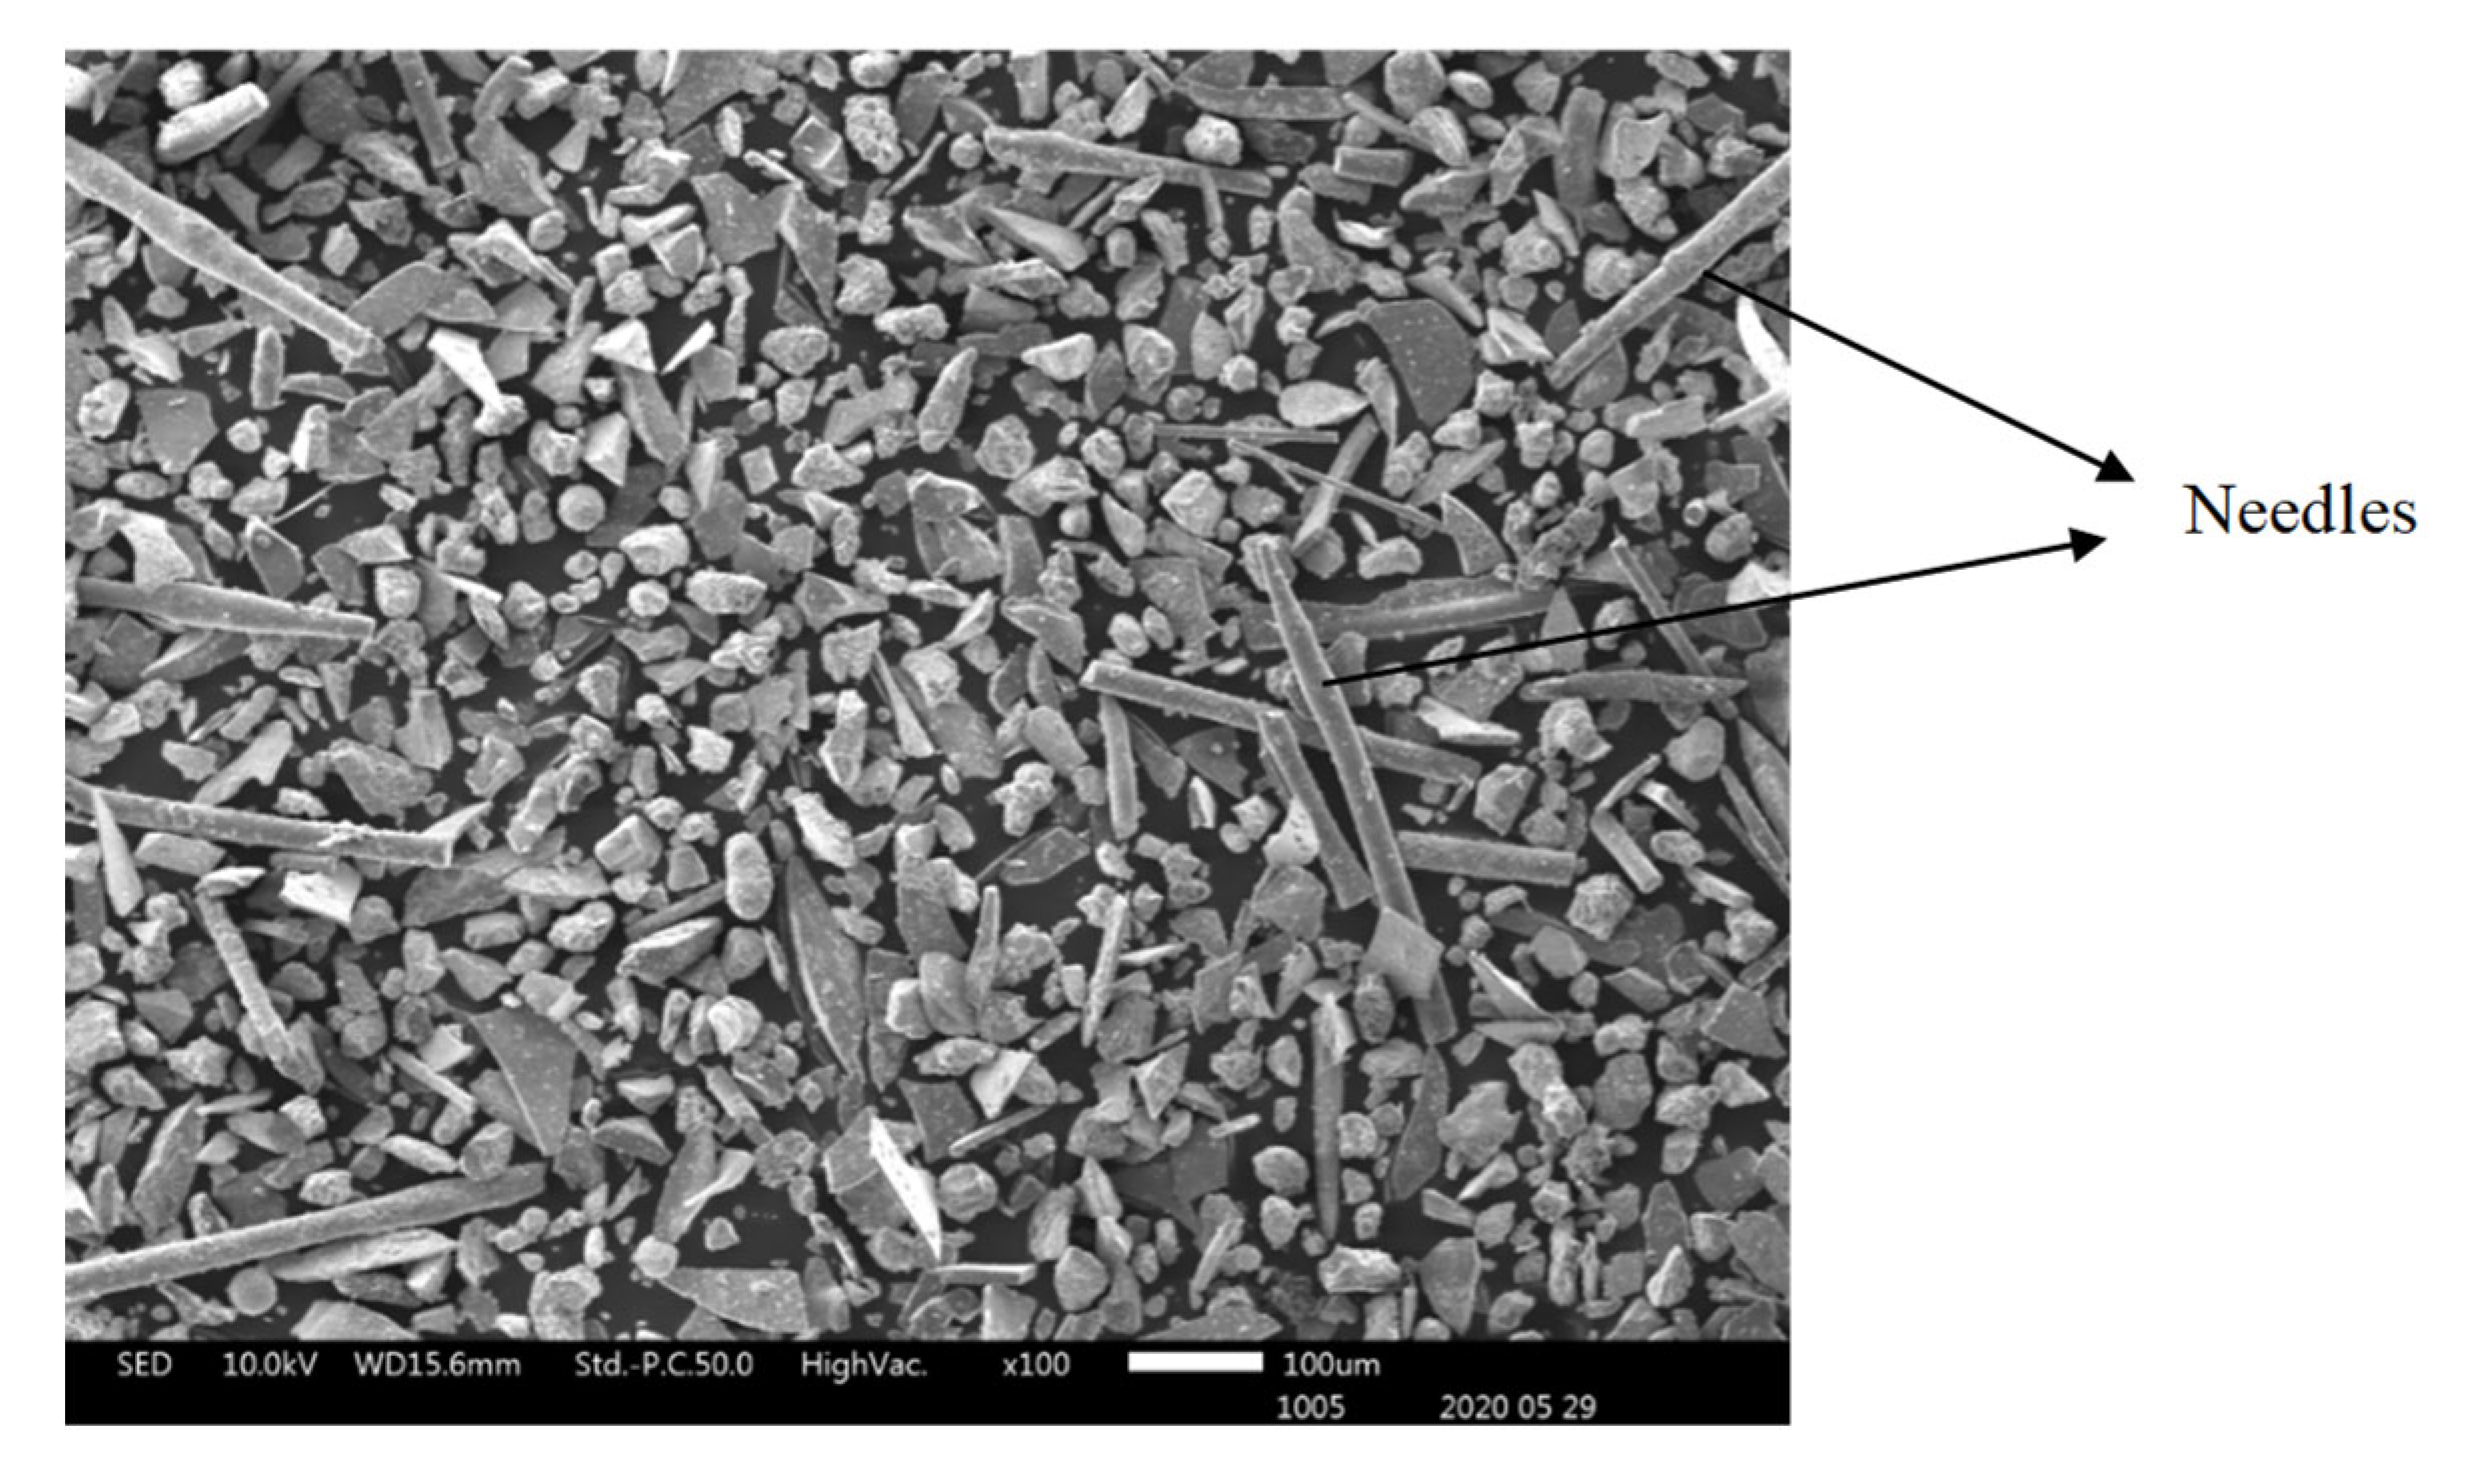
The SEM SE observation of particles of the received slag sample material collected in granulometric ranges smaller than 300 µm revealed four types of particle shapes as shown in
Figure 6 and
Figure 7, i.e., the flakes, the spheres with smooth surfaces, the needle-like particles, and the ovoid particles with rough surfaces. The SEM SE images of
Figure 6 and
Figure 7, infer that the flaky particles represent the main constituent of the slag materials in all particle size ranges obtained after sieving the historic slag material. The ovoid particles with rough surfaces are present in a wide size range from 30 to 200 µm. The SEM SE images suggest the ovoid particles are the second important phase present in the material passing the 300 µm sieves. The needle-like particles have aspect ratios (Length / Diameter) higher than 10. Such particles of length bigger than 500 µm have passed through the 38 µm sieve square apertures because their diameter is as small as 25 – 30 µm. It is likely that the needles present in the slag material were longer than 1000 µm, and were broken into halves during sieving in the laboratory. The spherical particles compose the least proportion of phase found in the slag material that passed through the 300 µm sieves. They have diameter range 30 – 70 µm and are distinguishable from the ovoid by their smooth surface appearance under SEM SE mode.
Energy Dispersive X-Ray (EDX) spectroscopy analysis of these four types of particles in the slag sample indicates that they are different phases in compositions. Their corresponding composition ranges are given in
Table 3. The EDX method is considered as semi-quantitative, but has the advantage of evaluating the composition of selected grains or regions withing the sample of materials under consideration. The method is not recommended for the quantification of light elements, thus the oxygen contents only serve as qualitative indicators of the oxide phases present in the slag material. Similarly the sulphur contents reveal the presence of the sulphide phases.
The results of the EDX area analysis of the particles of the slag materials infer the following:
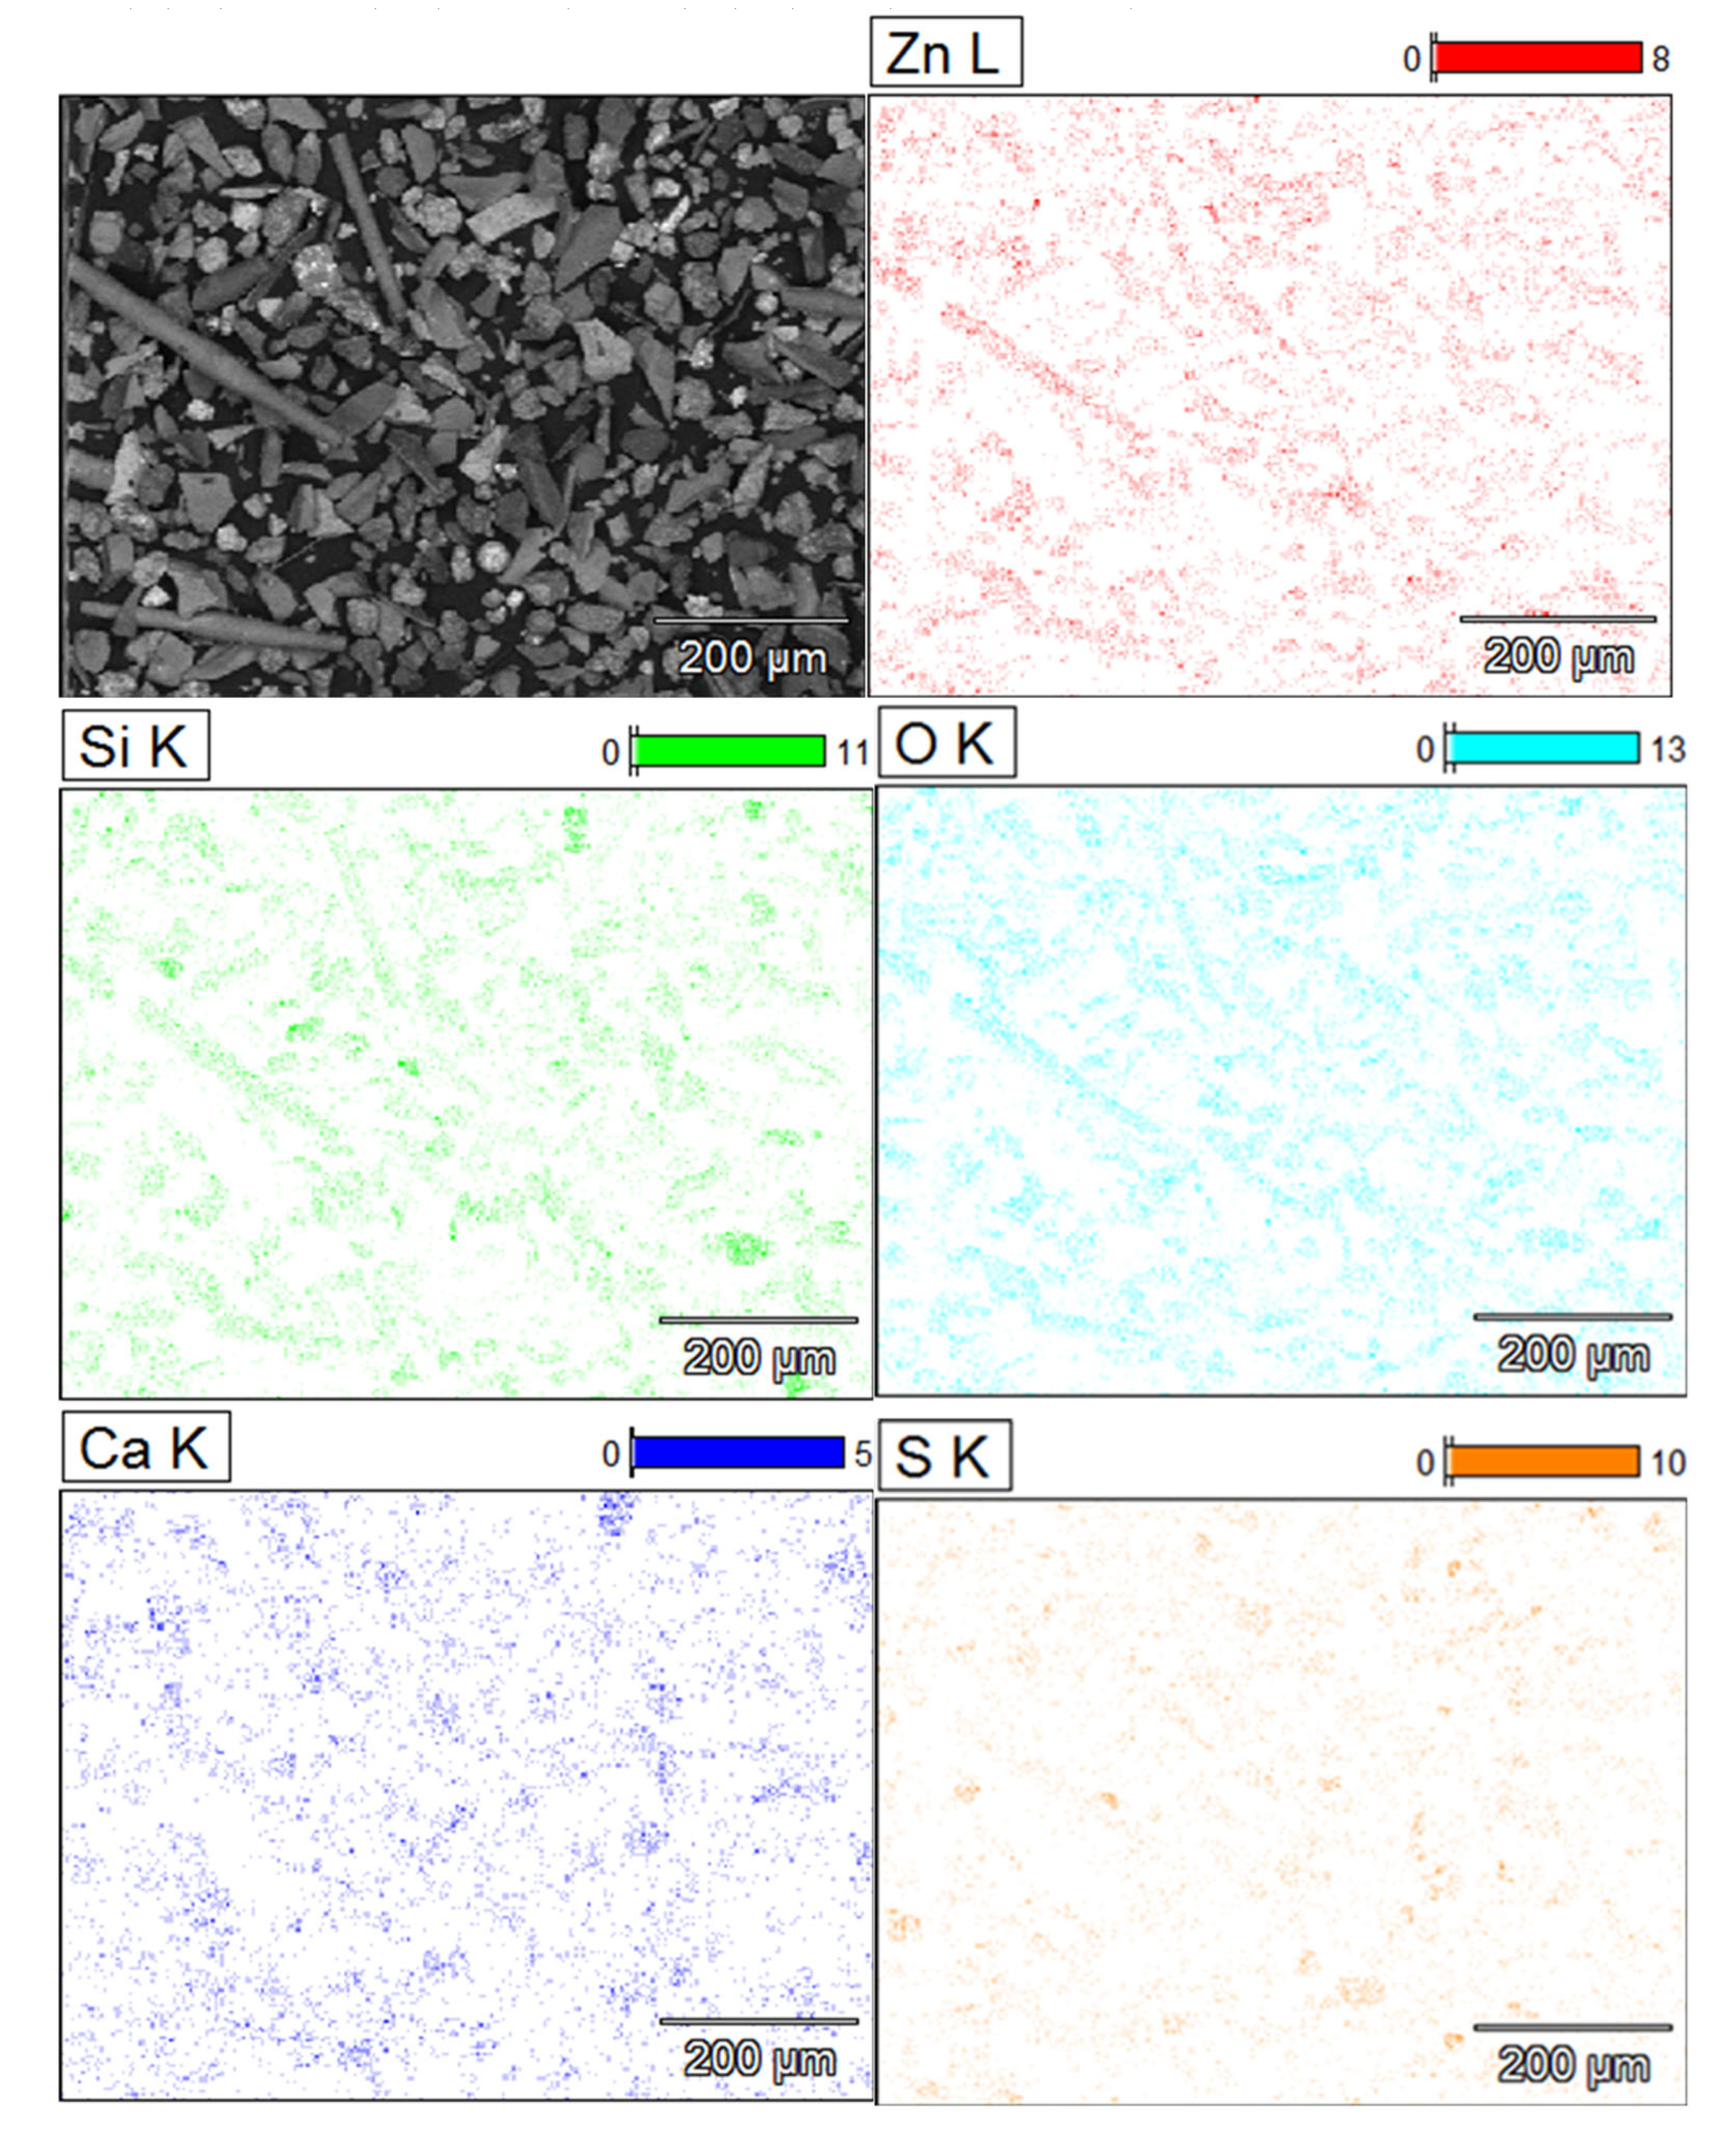
The flaky particles (i.e. the main component of the solid slag) consist of metal oxide compounds or [(Fe, Ca, Mg, Zn, Al, Si) O]. The flake type of particles contain the highest zinc content of 11 – 15 % (w/w) of all the particles present in the slag. The elemental mapping of
Figure 8 shows the preferential location of zinc inside the regions of the flake and needle-like shape particles. The flake type of particles have the lowest contents of sulphide formers Pb and Cu. The EDX analysis showed no peaks for arsenic and germanium in these particles
The needle-like particles are also composed of the [(Fe, Ca, Mg, Zn, Al, Si) O] compounds, however with higher silicon and lead contents, and lower calcium content than those found the flakes. An acidity index (1) of the slag is introduced to compare the chemistry of the flake shape and the needle-like particles components of the historic slag material as follows:
The calculation yields values of the acidity index equal to 0.5 for the flakes and 1.2 for the needle-like particles of the slag material, i.e., the acidity index of the needles is more than double that of the flakes. This difference suggests that the molten slag in the smelting furnace contained at least two different liquid phases; one main liquid phase of the composition of the flakes and a second liquid phase, in smaller quantity, of the composition as the needle-like particles. The needles phases therefore are much higher in silica-rich phases than other shapes. This second liquid might have consisted of droplets or veins that formed the elongated needles (L > 500 µm) with fine cross section diameters (D < 75 µm) upon tapping and quenching of the slag in the high-pressure water jet. The higher acid index of the needle-like shape particles indicates the tendency of formation of polymeric silicates with tridimensional structures, which results in high viscosity of the molten slag phase. The coexistence of significant numbers of the needle-like particles with the flakes in the fine granulometry size ranges may be ascribed to the separation, due to lack of miscibility, of the two phases in liquid slag inside the hearth of the furnace. Some micron and sub-micron size particles, of similar appearance to the ovoid and spherical shape phase are trapped onto the surface of the needle-like particles, not onto the flake-shaped particles. It is inferred, therefore, that the high viscosity of the liquid phase of high acidity index (needle-like) hindered the decantation of the droplets of liquid sulphide (metal) phases through the hearth zone into the matte or metal phase.
On the other hand, the ovoid particles are distinguishable by their rough surfaces and have very low contents in oxide formers Si, Ca, Fe Mg, Al and Zn. They rather have the highest concentrations of Cu, Fe, As and S along with the second highest content of Pb of all the four types of particles encountered in the historic slag material. It is concluded from the results of EDX analysis in
Table 3 that the ovoid particles consist of the sulphide compounds such as Cu
2S, FeS, PbS and As
2S
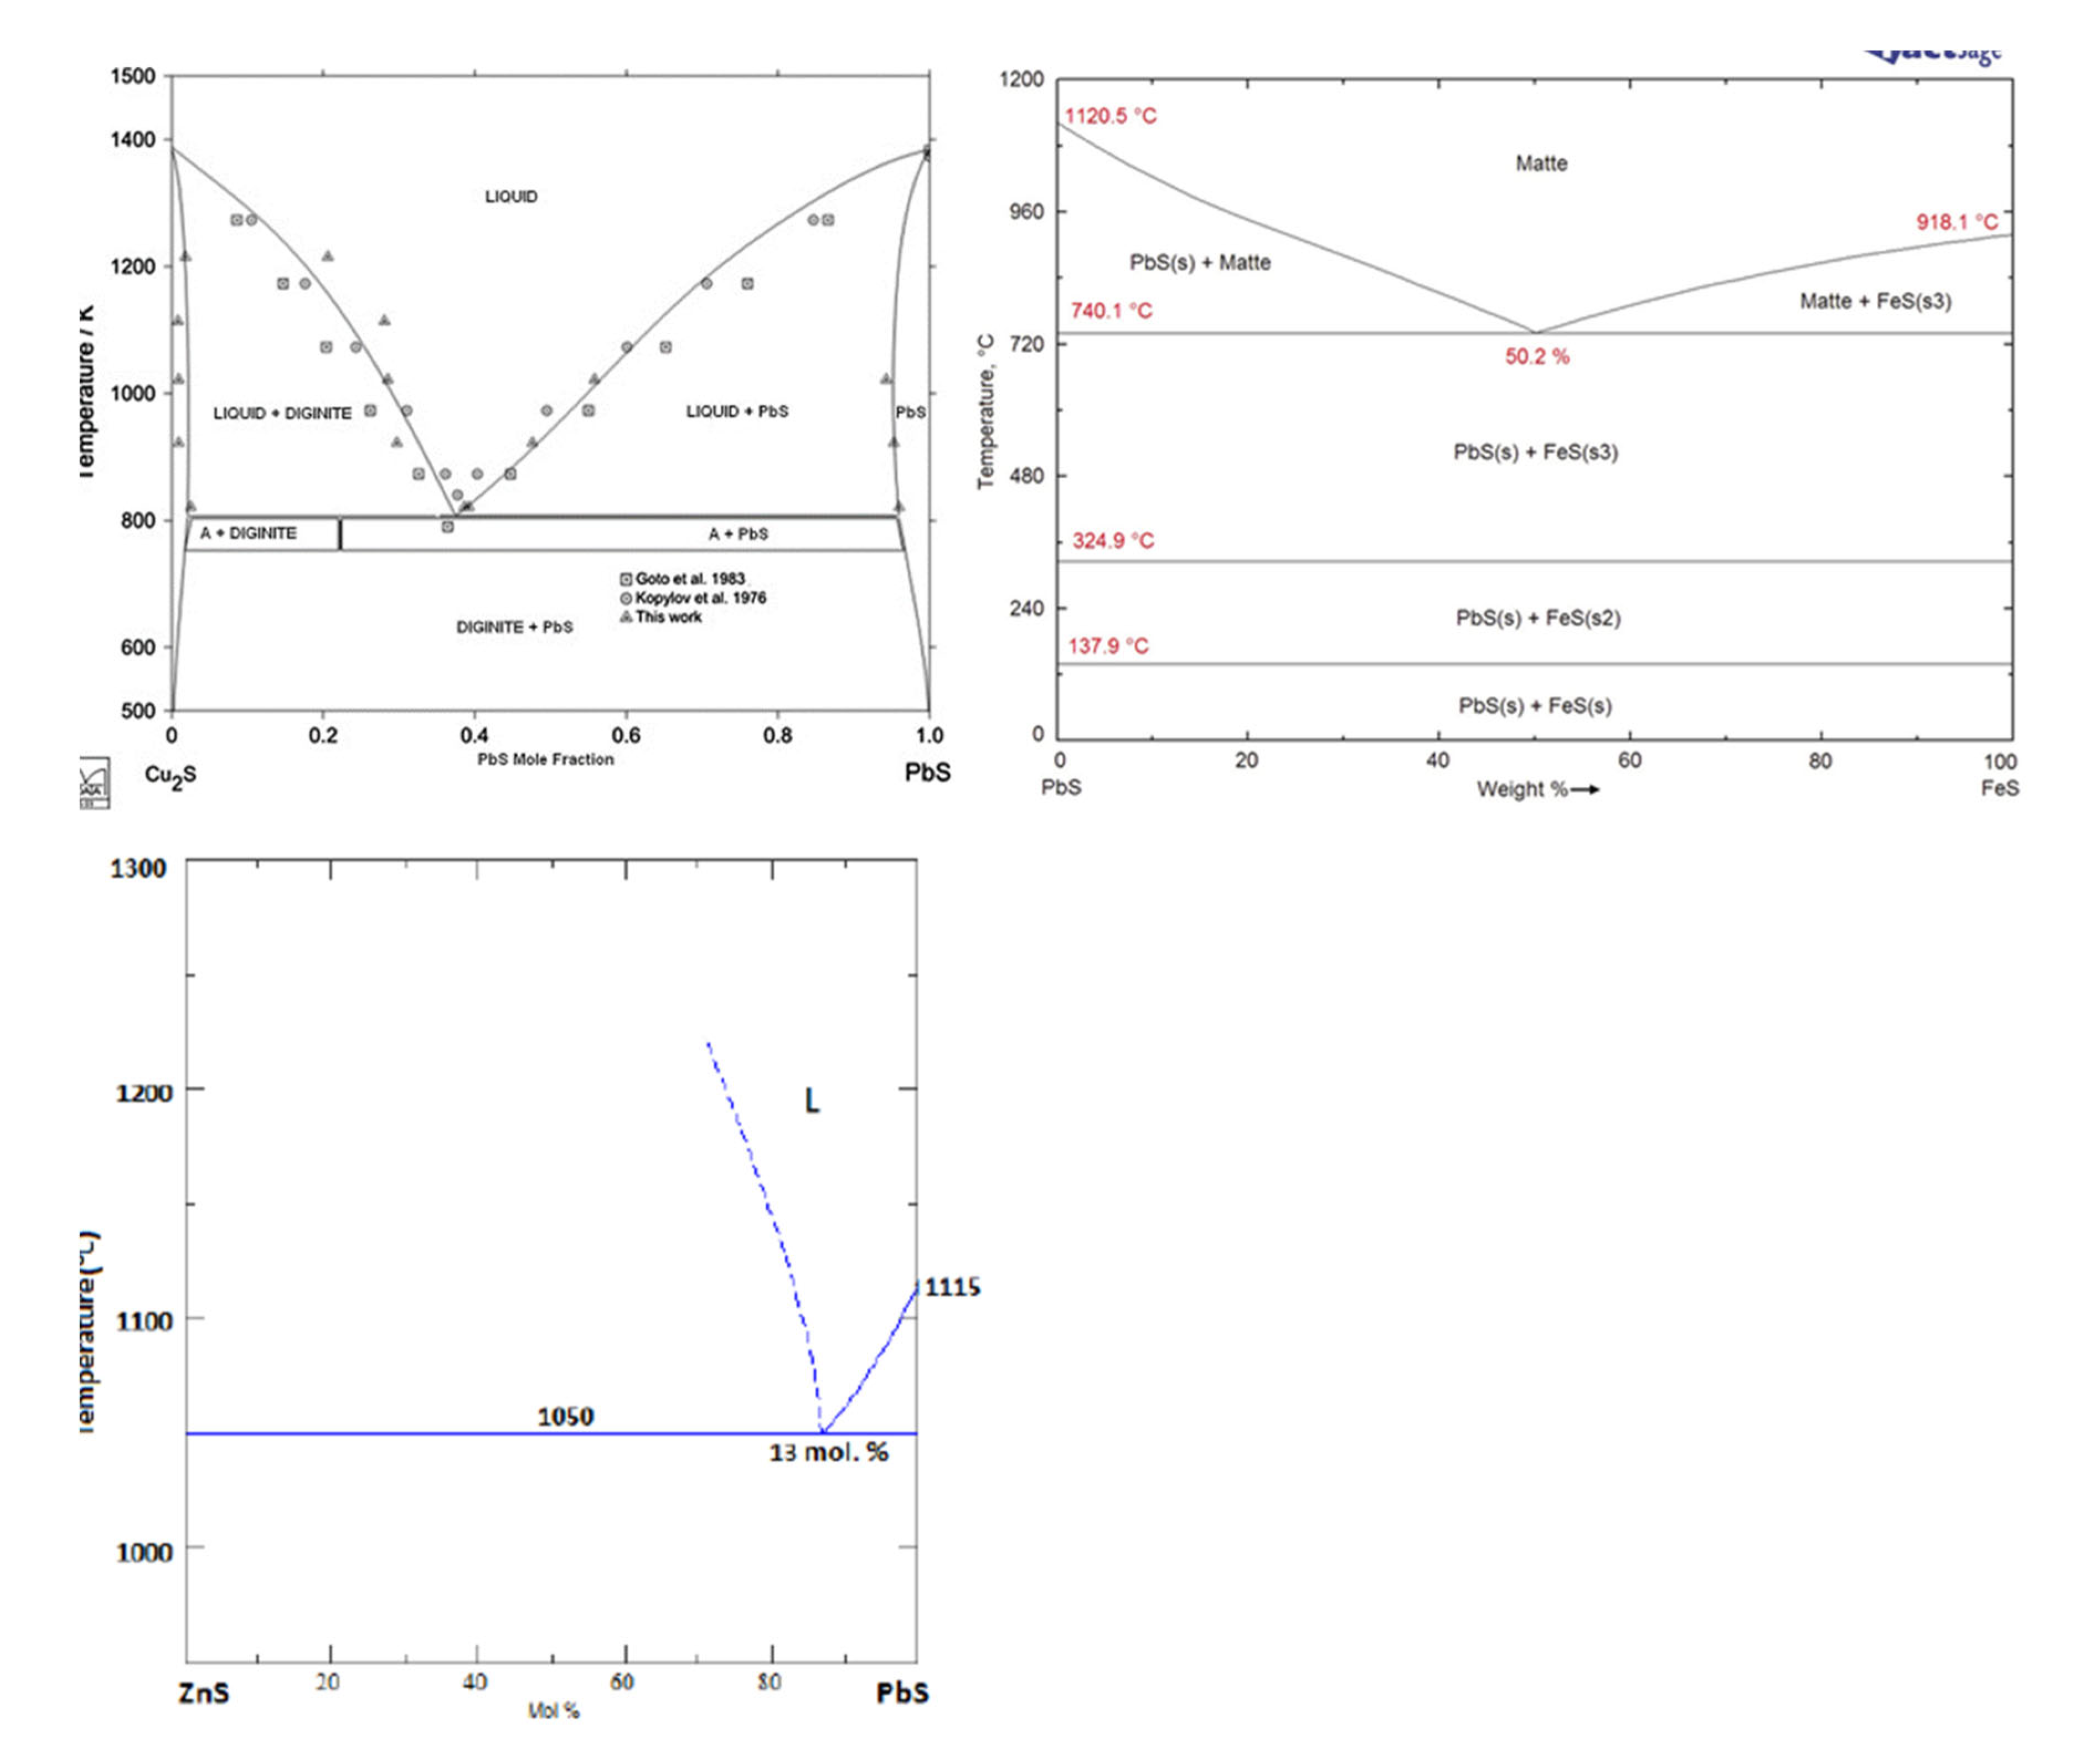
3 that constituted the matte product in the smelter. The wide range of variation of the four elements Cu, Fe, Pb and As is ascribed to the heterogenity within the ovoid shape particles due to the separation of non-miscible sulphides phases upon cooling. The calculated equilibrium phase diagrams in
Figure 9, show the lack of miscibility between PbS and the other sulphides such as FeS, Cu
2S or ZnS below 600°C. The lack of miscibility with other sulphides and metals is also exploited as a means of producing high grade mattes and Pb metal in smelting furnace.
Finally, the spherical particles with smooth surfaces have the highest Pb content of all the four types of particles, which reaches 79 %(w/w) in some areas, with relatively low sulphur. The strong oxygen peak infers that these particles consist of a mixture of PbO and Pb metal formed in the melt upon the conversion reactions (2) and (3) The spherical particles have dissolved some amounts of Si, Fe, As and Zn. The appearance of these free particles in the slag material shows that their material is not miscible either with the liquid slag (flakes and needle-like particles materials) nor with the sulphide material of the ovoid shape particles.
The EDX analysis suggested the presence of arsenic and germanium was in the sulphide constituents of the ovoid shape particles and in the high Pb content spherical particles. The Lα X-ray energies of germanium and arsenic are close to each other at 1.188 keV and 1.282 keV, respectively. The EDX method showed little selectivity between these two elements especially in the presence of low germanium concentration and low as expected in this case. This method of analysis suggests that arsenic and germanium are collected in the ovoid shape particles of the sulphide phases and more in the spherical particles of the (Pb, PbO, PbS) phase. The sulphide ovoid shape particles and the lead spherical particles would contain up to 1600 ppm and 6300 ppm germanium respectively. It should however be recalled here that according to the results of particle size clasification, these particles and all the slag material passing the sieve at 300 µm represent about 8 %b(w/w) of the total mass of slag sample received. A conservative approach based on the estimation that those particles only represent 2 % (w/w) of the slag material yield a germanium content within the range 32 – 126 ppm in the historic smelter slag received.
3.3.3. Morphology and Composition of Coarse Size (>300µm) Slag Particles
The morphologies of the slag particles within the size ranges +300 – 600 µm, +600 – 850 µm and +850 – 3350 µm are illustrated in
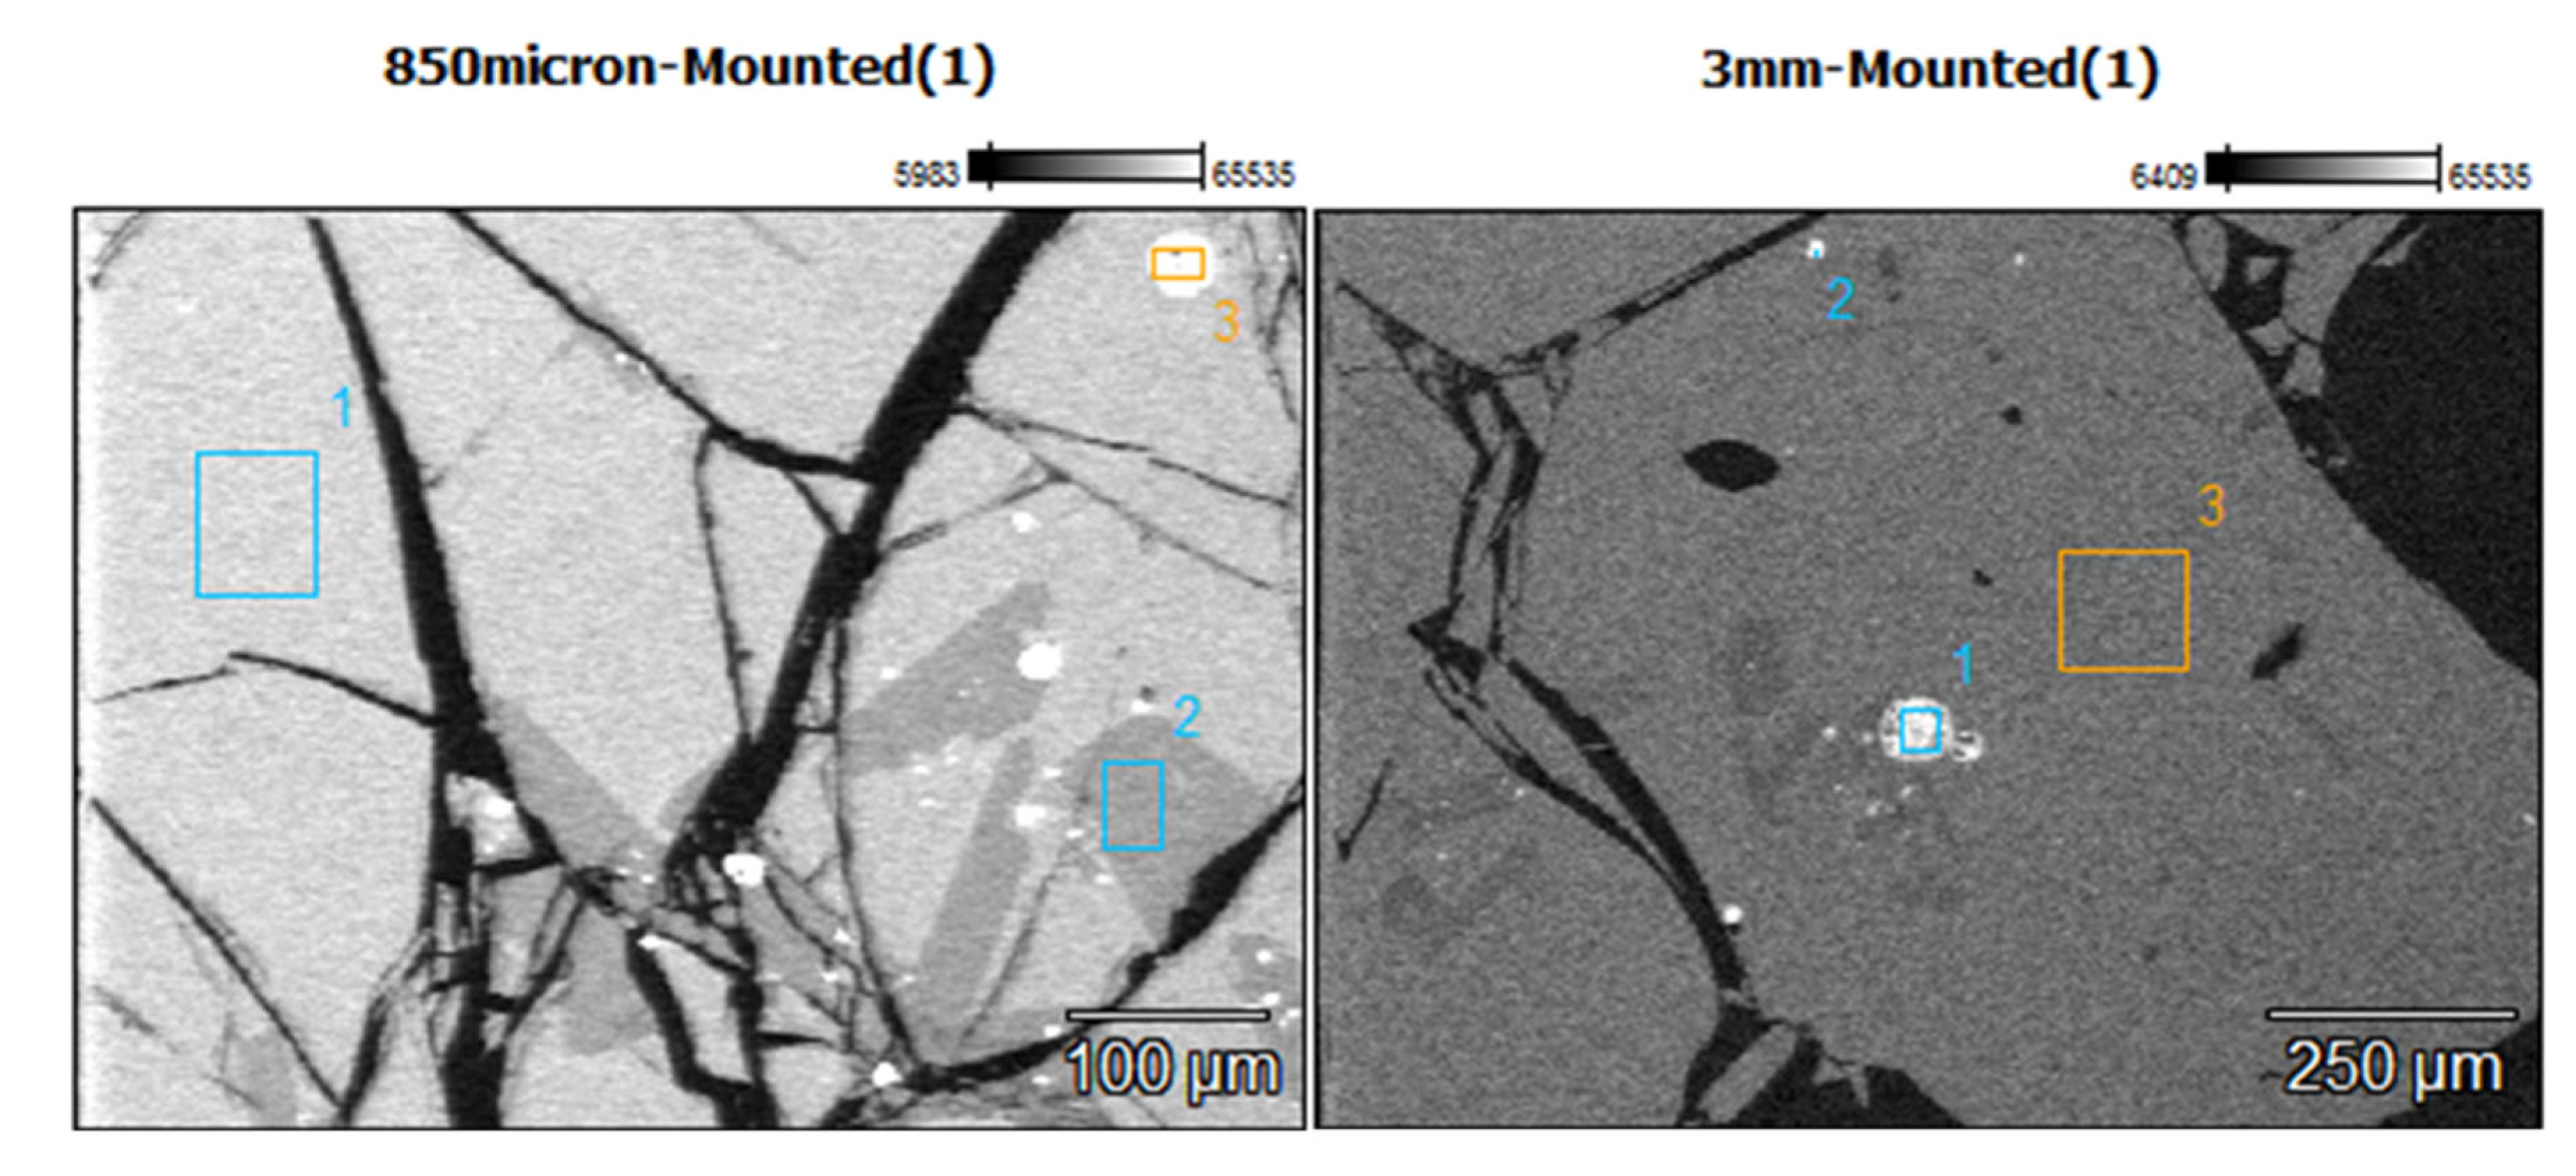
Figure 10. Unlike the fine particle size ranges (<300 µm) where flakes, needles, ovoid and spherical shape particles were found, the coarser particles are bulky and irregular multifaceted with multiple cracks. These coarse particles contain some amount of small particles of entrapped matte or metals as seen in the micrographs of the polished particles of sizes larger than 850 µm and 3350 µm. The EDX chemical analysis of the phases present in these coarse slag particles (in
Table 4) indicates the presence of two slag phases and the small particles of matte or metal phases.
Table 4 shows that the matrix and the secondary phases of the bulky slag particles (>300 µm) have chemical composition ranges similar to that of the flaky particles found in the fine materials (< 300 µm). It therefore infers that the formation of the small flakes resulted from grinding of the molten slag by the high-velocity flow water jet, whereas the coarse bulky slag particles were formed in the low-velocity flow regions of the water jet. Pressure and flow rate distribution inside the water jet determined the granulometric distribution of the solidified slag.
The secondary phase found in the coarse slag particles has slightly higher silicon and calcium contents, but lower Pb content than the main phase of the slag matrix. The matrix and the secondary phases of the coarse particles have acidity index 0.4 and 0.7 respectively, which are close to the acidity index i = 0.5 of the flake shape particles found in the fine material of the received sample of historic smelter slag. It was noticed earlier that the needle-like shape particles only formed at high acidity index 1.2, under high silicon content (37 wt%), which lead to the polymerisation of silicate structures. These silicates have higher viscosity at the slag melting temperature.
3.3.4. Optical Microscopy Analysis of the Slag Constituents
As a way of simplifying the process of identification, all phases identified are given names of natural equivalents. The process of slag formation leads also to the formation of glass and several silicate phases with specific shapes that have been identified both under the SEM and in optical microscopy. Glass is mainly silicate material that is formed when silicate melt is cooled rapidly. The petrography is better understood by realizing that in the slag development, free metal particles become droplets in the slag, and then cool down and tend to form spherical shapes. The following sulphide phases have been identified: galena (PbS); wurtzite (ZnS); sphalerite (ZnS); chalcopyrite (CuFeS2); pyrrhotite (Fe1-x S); pyrite (FeS2); minor cubanite (CuFe2S3) and covellite (CuS). The silicates present include fayalite (Fe2SiO4), monticellite (CaMgSiO4), mellilite (Ca(Mg,Fe,Zn)Si2O7), anorthite (CaAl2Si2O8) and Pb-Plagioclase (PbAl2Si2O8). Zn, Mg, Fe, and Ca spinels and wuestite (FeO) are also present.
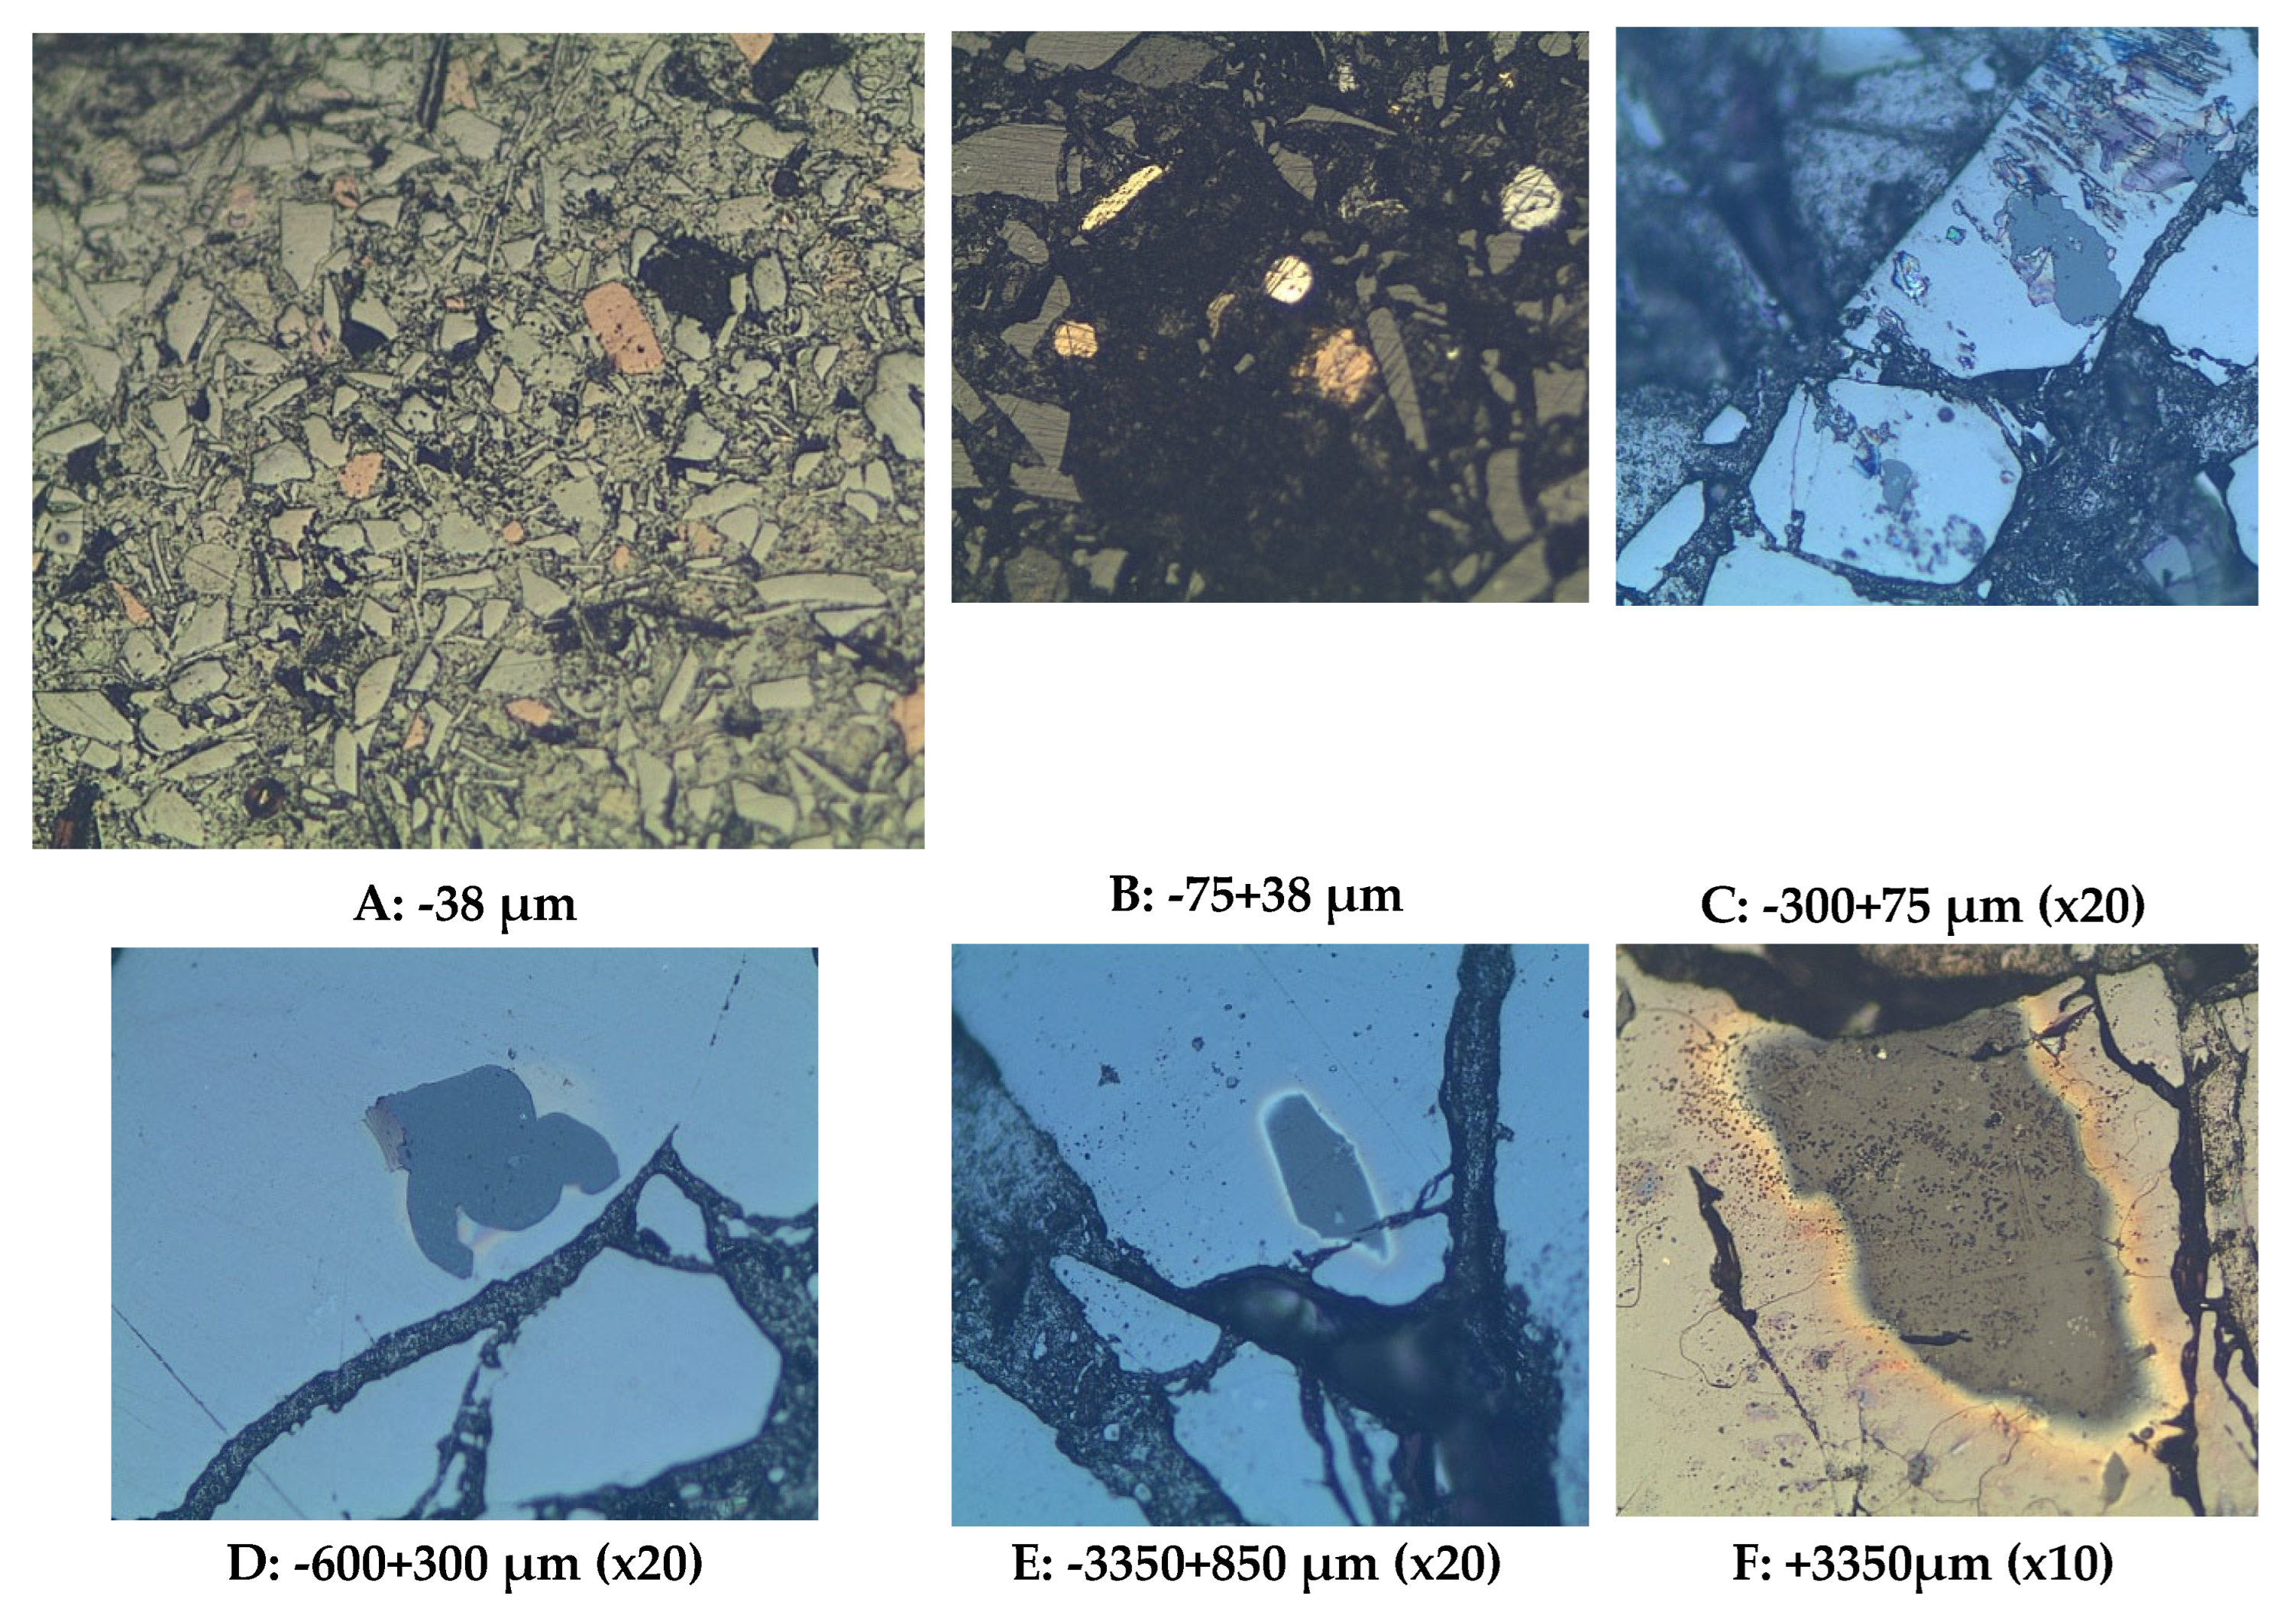
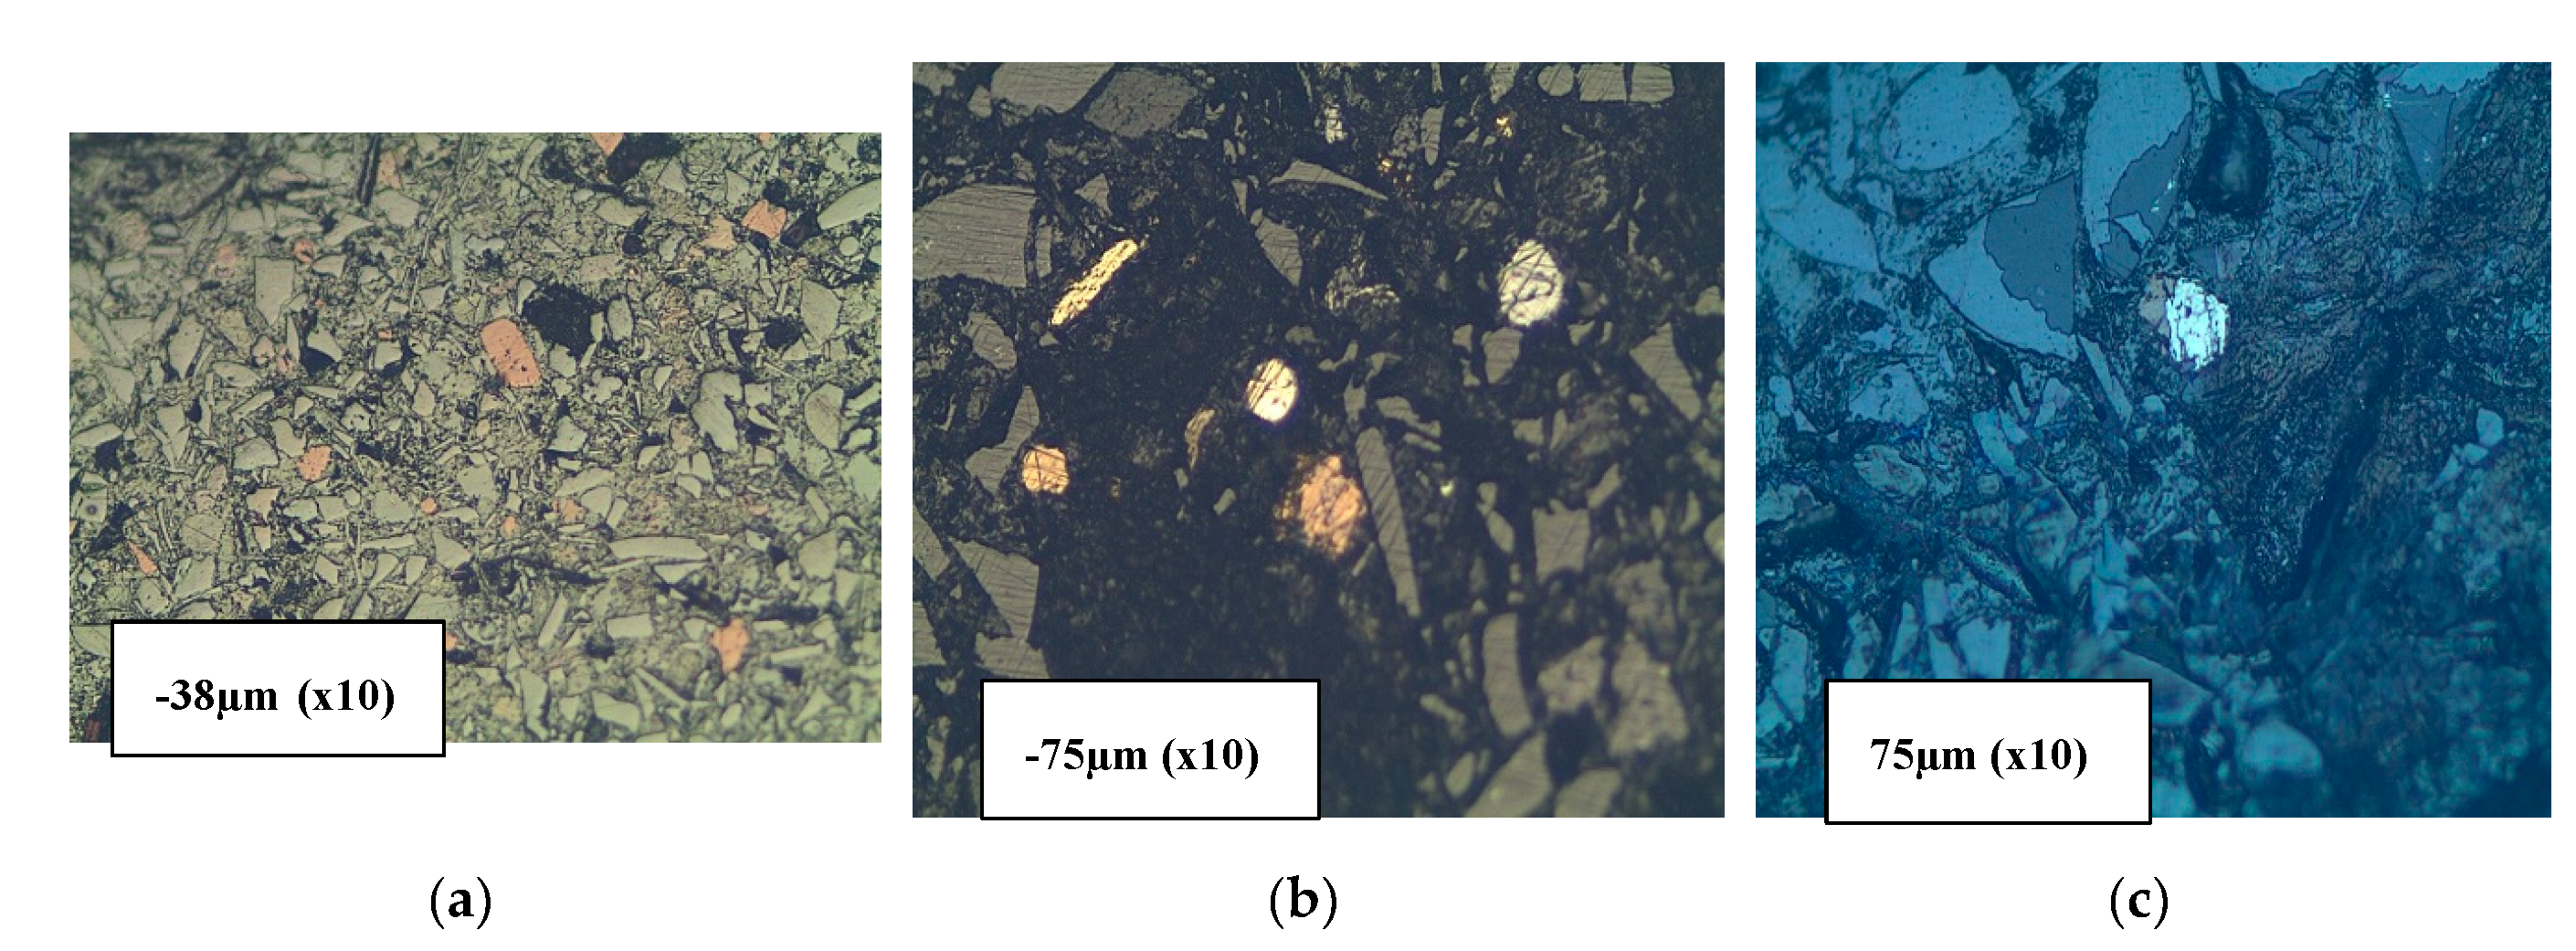
Six size fractions (-38, -75+38, -300+75, -600+300, -3350+850, and +3350 µm) of polished mounted samples were analyzed with the optical microscope, with results shown in
Figure 11 and
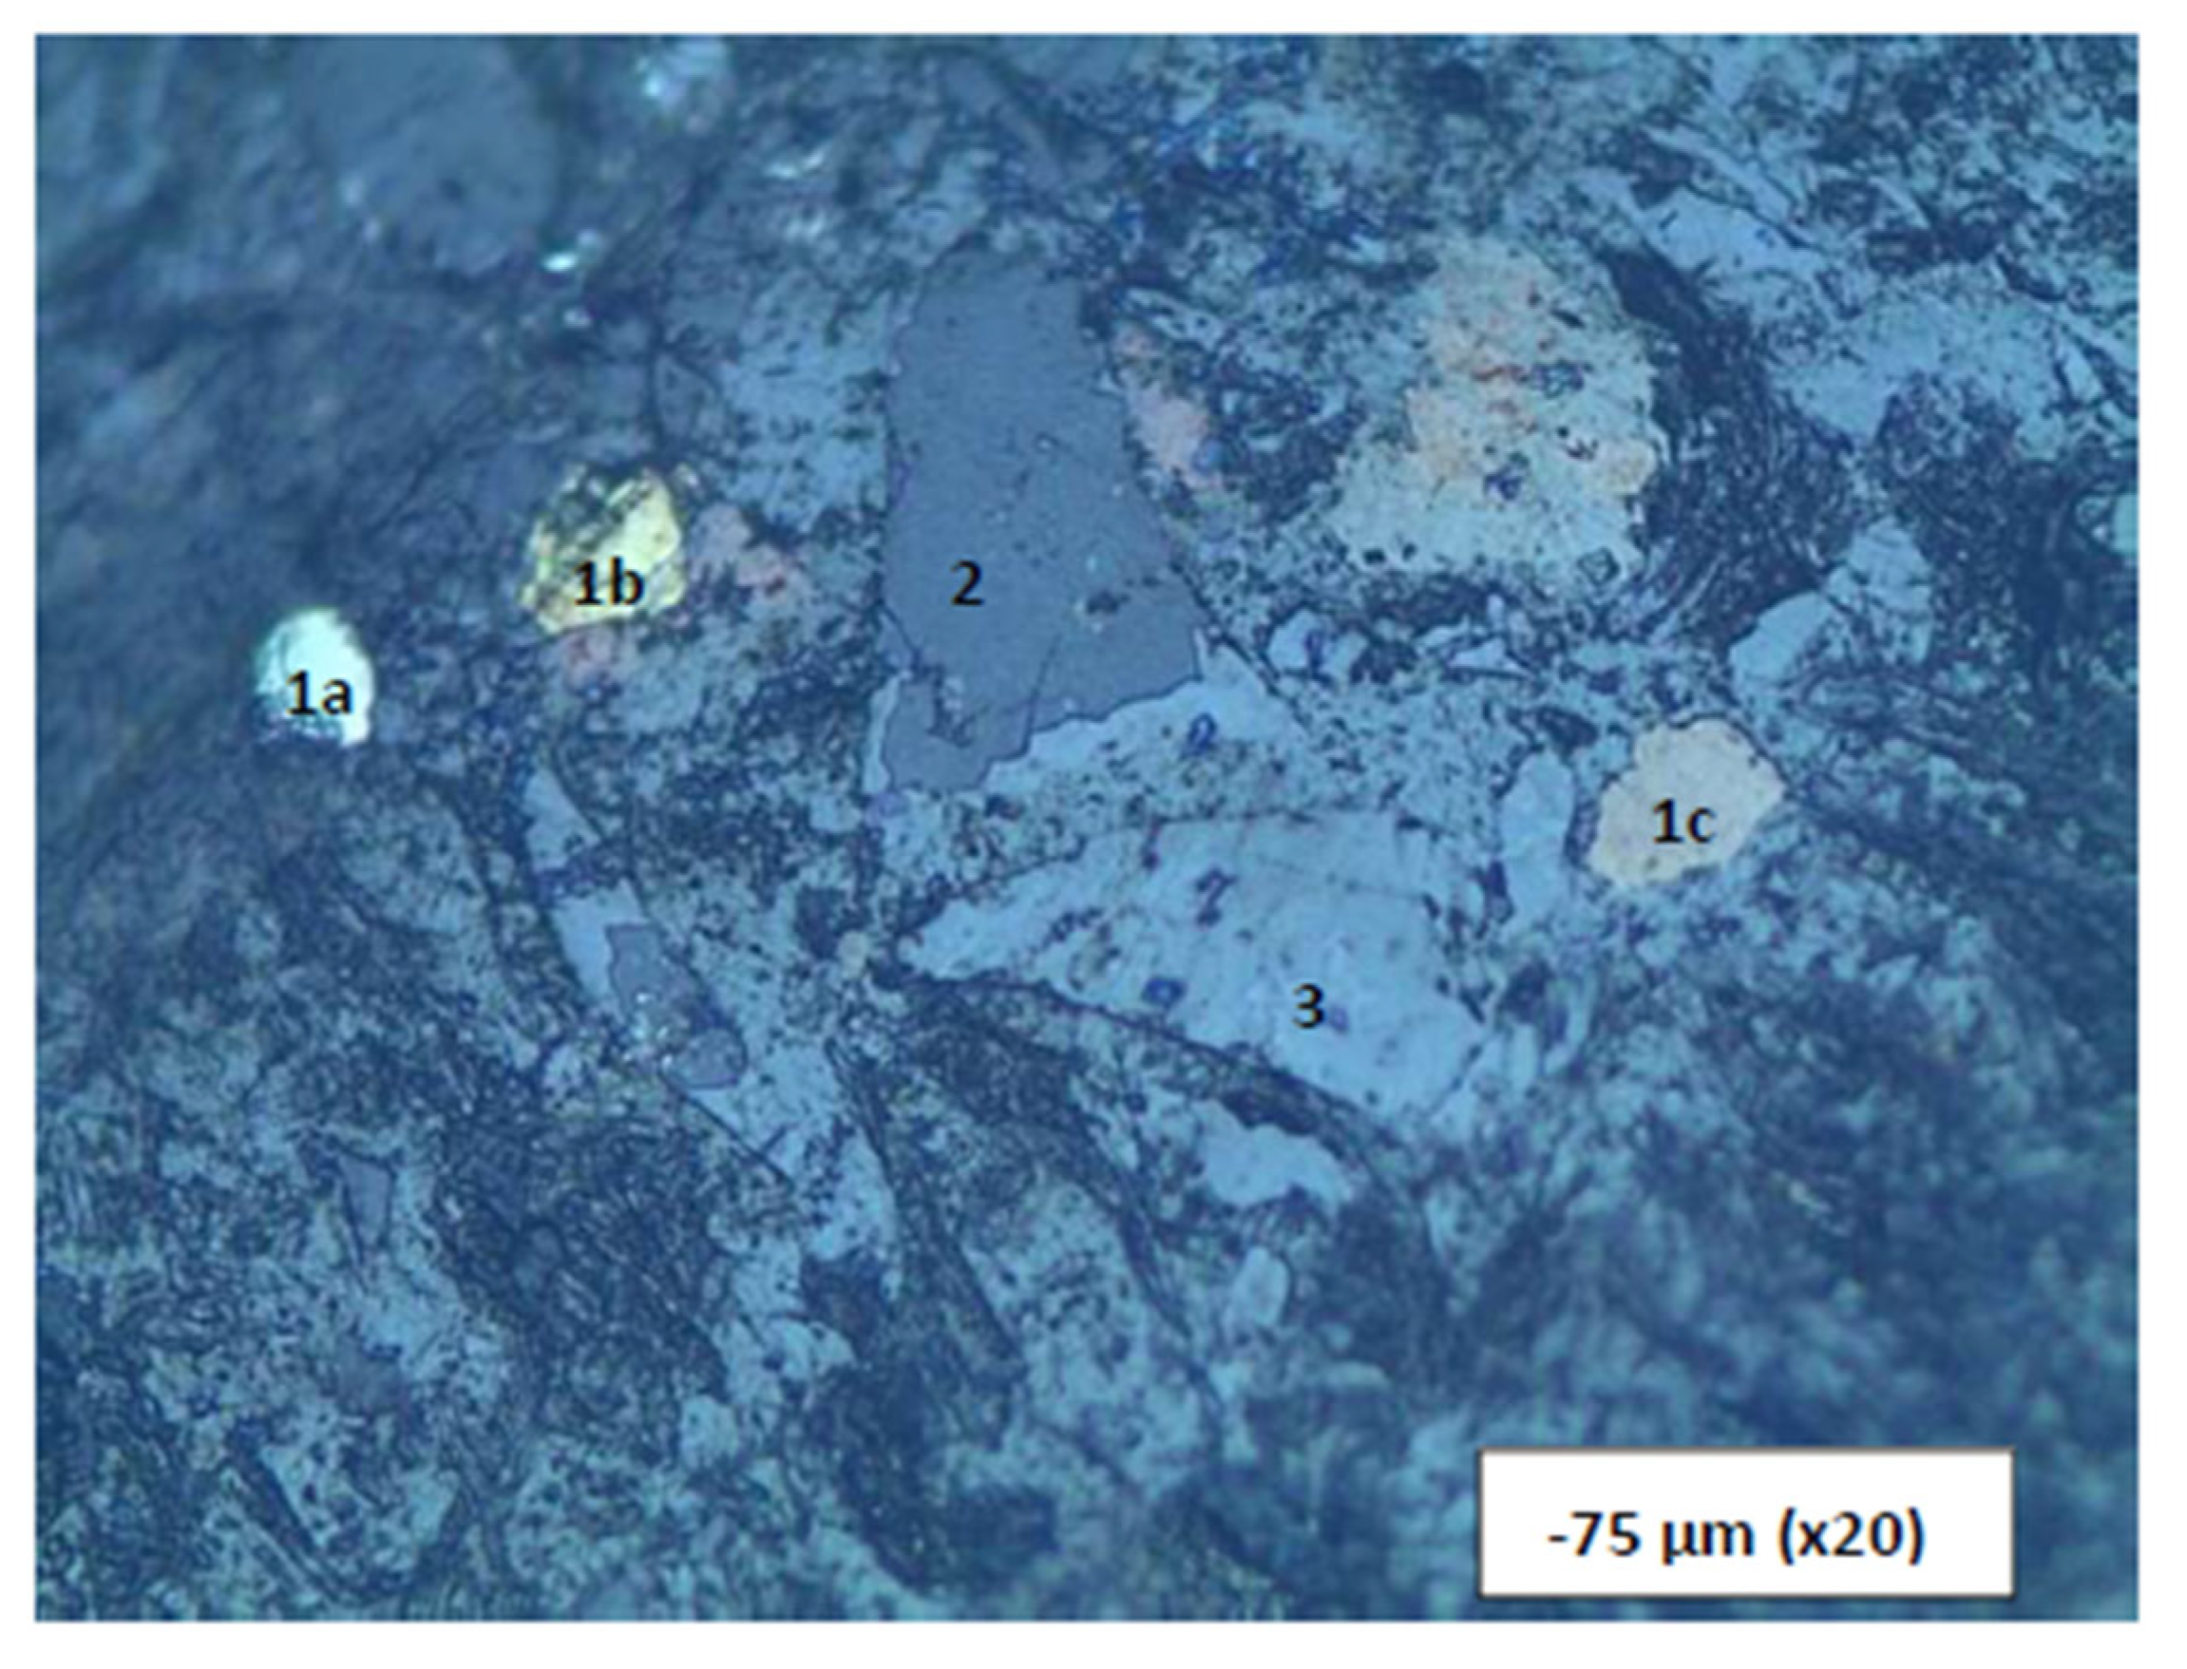
Figure 12. In comparing photographs from the SEM and from the optical microscopy, it is worth noting that brightness in SEM is a function of atomic number whereas in microscopy it is a function of the bonding structure. The spinels (Zn, Mg, Fe, and Ca spinels) appear to be the first ones to form in the scorification process. The metallic phase are dominant in the -38, -75+38, -300+75 µm fractions. The coarse-grained samples contain fewer grains of metallic phases. Three main phases were observed, namely the silicate phase (slag), metallic phase and the sulphide phases as shown in
Figure 11. The silicate phases are mainly glass, silicate phases and metallic and sulphide phases.
The analysis of
Figure 12 also reveals that the metallic and sulphide phases are predominantly contained in the slag finer size fractions (-38, -75+38 and -300+75 µm) whereas the sulphide phase is also present in the coarser size fractions (300, 850 and 3350 µm).
The SEM was used to determine the elemental composition of the phases. The metallic phase consists of elements such as copper (Cu), lead (Pb), germanium (Ge) and some zinc (Zn). Metallic phases in finer size fraction occur as interstitial grains within the slag matrix and this shows that the metals can easily be separated from the slag (
Figure 13).
The silicate phase consists mostly of olivine, pyroxenes rich in zinc whereas the sulphide phases are predominantly made up of lead sulphide (PbS) grains which are being rimmed by copper and zinc sulphides; occasionally chalcopyrite occurs as a single phase. This proposes that PbS crystallized first as droplets in the slag, followed by ZnS attaching itself, together with CuS, on the nucleated PbS phases. The sulphide phase occurs within the slag matrix.
Figure 14.
In A, a nearly perfect sphere of PbS. A PbS phase occurring in B within the slag with bright edges being rimmed by CuS and ZnS. The grey phase in B and C has a high amount of ZnS.
Figure 14.
In A, a nearly perfect sphere of PbS. A PbS phase occurring in B within the slag with bright edges being rimmed by CuS and ZnS. The grey phase in B and C has a high amount of ZnS.
The composition of glass was verified by the SEM, it is variable and enriched in Ca and Fe. There are several angular grains of feldspars (
Figure 12 and
Figure 13). These attest to the fact that the duration of melting of the historic slag in the furnace was not high enough to allow for good formation of euhedral crystals or the temperature of slag formation was not sufficiently high (Hauptmann, 2007) to completely melt the furnace charge. Spinels in the slag represent the formation of oxide phases. Some of these spinels will form if oxidation conditions are not high enough in the slag, verging towards reducing conditions where sulphide droplets are stable and form minerals. The most commonly observed sulphides are galena (PbS), wurtzite and sphalerite (ZnS), pyrrhotite (Fe
1-x S); and various sulphides of Cu and Fe such as pyrite (FeS
2), cubanite, covellite and chalcocite. Wurtzite is a high temperature phase that forms at about 1020 ֠C (Ettler & Johan, 2003) and contains some Fe as observed in the SEM. This suggests that temperatures of that order were at least reached in the furnace.
The important finding here is that the sulphide phases are interstitial and can be liberated from the slag. The scanning microscopy analysis of the slag material shows the presence of the free particles of matte phase and metal (ovoid and spherical) phases in material of size ranges below 300 µm. Slag particles coarser than 300 µm have trapped the matte and metal particles inside. The coarse particles of slag material have large cracks, which indicate that they are brittle and friable. The interfaces between the matte or metal particles and the slag material are incoherent with very little or no bonding strength, this results in the complete separation between them at particle sizes below 300 µm. It may therefore be necessary to mill the slag material to 300 µm to achieve the liberation of all the matte and metal particles trapped inside the coarse slag particles.
4. Conclusions and Recommendations
The depletion of the ore reserves in the world necessitates the search for secondary sources such as slags for the continued production of metals. The smelter in Namibia accumulated a significant amount of blast furnace slag during its operating life which can be traced back to 1964. A representative slag sample was prepared for mineralogical characterization using a combination of analytical and mineralogical techniques (AAS, XRF, ICP OES, SEM and optical microscopy). The chemical analyses showed that the metal values contained in the slag were mainly copper, lead, and zinc whose average contents were approximately 0.3%Cu, 2.4%Pb and 3.2%Zn. About 10.5%Fe was also contained in the slag. Germanium is a trace element, with its concentration estimated from the SEM EDX analysis to be in the range of 32 – 126 ppm. Optical and scanning electron microscopy have shown the mineral phases for both metals and slag. This information is useful in developing the extraction methods for various metals in the slag.
The granulometric classification shows high volume fractions of sulphide particles present in the slag material of the size ranges smaller than 300 µm, and are readily separable from the slag material. The presence of liberated sulphide particles shows that there is no interface bonding between the sulphide phases and the slag matrix, thus mechanical separation between these phases is feasible.
Most sulphide and metal particles are trapped inside the slag particles larger than 300 µm, which represent about 90% of the slag material. The large cracks observed in the SEM and optical images suggest that these coarse slag particles are brittle and friable. A low energy mechanical milling or breaking system will therefore suffice to fracture the large slag particles as a means to liberate the trapped sulphide particles.
Based on the elemental analysis and mineralogical characterisation work undertaken, it is recommended that metallurgical test work be carried out to determine an economically viable and safe process route for recovery of valuable metals contained in the slag. The target metals would include Zn, Pb, Cu, Ge, Mo and Ga. The metallurgical test work proposed includes pre-concentration of valuable minerals using mineral processing methods, followed by either hydrometallurgical or pyrometallurgical techniques.
Data Availability Statement
Data is contained within the article.
Acknowledgments
The authors would like to thank the Namibian Custom Smelter management for granting us the permission to use some of the project findings in this paper. The laboratory staff in the Department of Civil, Mining and Process Engineering at the Namibia University of Science and Technology (NUST) are acknowledged for their assistance during the test work, microscopy and logistics.
Conflicts of Interest
The authors declare no conflict of interest.
Appendix A: Assay-by Size
Table A1.
Assay by size from AAS.
Table A1.
Assay by size from AAS.
| Elements |
Elemental composition (%w/w) |
| +3350 µm |
-3350+850 µm |
-850+300 µm |
-300+75 µm |
-75 µm |
| Si |
|
|
|
|
|
| Ca |
11.07 |
11.81 |
|
10.81 |
8.34 |
| Mn |
|
|
|
|
|
| Fe |
9.01 |
11.97 |
|
10.7 |
11.05 |
| Cd |
|
|
|
|
|
| Ni |
|
|
|
|
|
| Cu |
0.33 |
0.33 |
|
0.51 |
1.51 |
| Zn |
0.8 |
0.86 |
|
0.86 |
1.05 |
| As |
|
|
|
|
|
| Mg |
|
|
|
|
|
| Co |
|
|
|
|
|
| Pb |
3.33 |
3.97 |
|
4.37 |
5.53 |
| Ag |
|
|
|
|
|
| Ge |
|
|
|
|
|
| Mo |
|
|
|
|
|
| Other (%) |
75.46 |
71.06 |
|
72.75 |
72.52 |
Table A2.
Assay by size from ICP.
Table A2.
Assay by size from ICP.
| Elements |
Elemental composition (%w/w) |
| +3350 µm |
-3350+850 µm |
-850+300 µm |
-300+75 µm |
-75 µm |
| Si |
|
|
|
|
|
| Ca |
|
|
|
|
|
| Mn |
0.12 |
0.14 |
0.15 |
0.13 |
0.09 |
| Fe |
10.45 |
14.29 |
17.81 |
14.53 |
9.75 |
| Cd |
0.01 |
0.01 |
0.01 |
0.02 |
0.05 |
| Ni |
0.001 |
0.001 |
0.002 |
0.001 |
0.001 |
| Cu |
0.28 |
0.33 |
0.35 |
0.45 |
1.08 |
| Zn |
3.08 |
3.12 |
3.16 |
2.98 |
2.1 |
| As |
0.23 |
0.3 |
0.32 |
0.38 |
0.71 |
| Mg |
2.45 |
2.66 |
2.9 |
2.67 |
0 |
| Co |
0.01 |
0.012 |
0.012 |
0.011 |
0.008 |
| Pb |
2.03 |
2.23 |
2.28 |
2.23 |
2.04 |
| Ag |
0.0013 |
nd |
0.004 |
nd |
nd |
| Ge |
nd |
nd |
nd |
nd |
nd |
| Mo |
|
|
|
|
|
| Other (%) |
81.3377 |
76.907 |
73.002 |
76.598 |
84.171 |
Table A3.
Assay by size from XRF.
Table A3.
Assay by size from XRF.
| Elements |
Elemental composition (%w/w) |
| +3350 µm |
-3350+850 µm |
-850+300 µm |
-300+75 µm |
-75 µm |
| Si |
|
|
|
|
|
| Ca |
|
|
|
|
|
| Mn |
0.13 |
0.13 |
0.08 |
0.15 |
0.14 |
| Fe |
10.02 |
8.96 |
5.35 |
8.22 |
11.91 |
| Cd |
|
|
|
|
|
| Ni |
|
|
|
|
|
| Cu |
0.26 |
0.21 |
0.11 |
0.2 |
1.06 |
| Zn |
7.13 |
5.7 |
2.93 |
4.72 |
7.37 |
| As |
0.18 |
0.14 |
0.08 |
0.2 |
0.88 |
| Mg |
|
|
|
|
|
| Co |
|
|
|
|
|
| Pb |
2 |
1.55 |
0.74 |
1.07 |
2.92 |
| Ag |
|
|
|
|
|
| Ge |
|
|
|
|
|
| Mo |
0.19 |
0.12 |
0.06 |
0.11 |
0.19 |
| Other (%) |
80.09 |
83.19 |
90.65 |
85.33 |
75.53 |
References
- Álvarez, M. L., Méndez, A., Rodríguez-Pacheco, R., Paz-Ferreiro, J., & Gascó, G. (2021). Recovery of zinc and copper from mine tailings by acid leaching solutions combined with carbon-based materials. Applied Sciences (Switzerland), 11(11). [CrossRef]
- Derin, B., Cinar, F., & Yiicel, O. (2003). The Electrical Characteristics of Copper Slags in a 270 Kva Dc Arc Furnace. 3rd BMC-2003-Ohrid, R. Macedonia, 265–270.
- Derkowska, K., Świerk, M., & Nowak, K. (2021). Reconstruction of copper smelting technology based on 18–20th-century slag remains from the old copper basin, Poland. Minerals, 11(9). [CrossRef]
- Echeverry-Vargas, L., Rojas-Reyes, N. R., & Estupiñán, E. (2017). Characterization of copper smelter slag and recovery of residual metals from these residues. Revista Facultad de Ingeniería, 26(44), 61–71. [CrossRef]
- Ettler, V., & Johan, Z. (2003). Minéralogie des phases métalliques des mattes sulfurées de la métallurgie du plomb. Comptes Rendus Geoscience, 335(14), 1005–1012. [CrossRef]
- Ettler, V., Mihaljevič, M., Strnad, L., Kříbek, B., Hrstka, T., Kamona, F., & Mapani, B. (2022). Gallium and germanium extraction and potential recovery from metallurgical slags. Journal of Cleaner Production, 379(October). [CrossRef]
- Franke, D., Suponik, T., Nuckowski, P. M., Golombek, K., & Hyra, K. (2020). Recovery of metals from printed circuit boards by means of electrostatic separation. Management Systems in Production Engineering, 28(4), 213–219. [CrossRef]
- Gabasiane, T. S., Danha, G., Mamvura, T. A., Mashifana, T., & Dzinomwa, G. (2021). Characterization of copper slag for beneficiation of iron and copper. Heliyon, 7(4), e06757. [CrossRef]
- Gorai, B., Jana, R. K., & Premchand. (2003). Characteristics and utilisation of copper slag - A review. Resources, Conservation and Recycling, 39(4), 299–313. [CrossRef]
- Hauptmann, A. (2007). The Archaeometallurgy of Copper (1st ed.). Springer Berlin, Heidelberg. [CrossRef]
- Jadhav, U., & Hocheng, H. (2015). Hydrometallurgical Recovery of Metals from Large Printed Circuit Board Pieces. Scientific Reports, 5(101), 1–10. [CrossRef]
- Jarosikova, A., Ettler, V., Mihaljevic, M., Kribek, B., & Mapani, B. (2017). The pH-dependent leaching behavior of slags from various stages of a copper smelting process: Environmental implications. Journal of Environmental Management, 187, 178–186. [CrossRef]
- Kang, Y., Lee, J., & Morita, K. (2014). Thermal conductivity of molten slags: A review of measurement techniques and discussion based on microstructural analysis. ISIJ International, 54(9), 2008–2016. [CrossRef]
- Lohmeier, S., Lottermoser, B. G., Schirmer, T., & Gallhofer, D. (2021). Copper slag as a potential source of critical elements - A case study from Tsumeb, Namibia. Journal of the Southern African Institute of Mining and Metallurgy, 121(3), 129–142. [CrossRef]
- Łukomska, A., Wiśniewska, A., Dąbrowski, Z., Lach, J., Wróbel, K., Kolasa, D., & Domańska, U. (2022). Recovery of Metals from Electronic Waste-Printed Circuit Boards by Ionic Liquids, DESs and Organophosphorous-Based Acid Extraction. Molecules, 27(15). [CrossRef]
- Matsushita, T., Watanabe, T., Hayashi, M., & Mukai, K. (2011). Thermal, optical and surface/interfacial properties of molten slag systems. International Materials Reviews, 56(5–6), 287–323. [CrossRef]
- Mori de Oliveira, C., Bellopede, R., Tori, A., & Marini, P. (2022). Study of Metal Recovery from Printed Circuit Boards by Physical-Mechanical Treatment Processes. 121. [CrossRef]
- Mulenshi, J. (2021). Reprocessing historical tailings for possible remediation and recovery of critical metals and minerals – The Yxsjöberg case. Lulea University of Technology.
- Park, I., Yoo, K., Alorro, R. D., Kim, M. S., & Kim, S. K. (2017). Leaching of copper from cuprous oxide in aerated sulfuric acid. Materials Transactions, 58(10), 1500–1504. [CrossRef]
- Piatak, N. M., Parsons, M. B., & Seal, R. R. (2015). Characteristics and environmental aspects of slag: A review. In Applied Geochemistry (Vol. 57). Elsevier Ltd. [CrossRef]
- Pietrelli, L., Francolini, I., Piozzi, A., & Vocciante, M. (2018). Metals recovery from printed circuit boards: The pursuit of environmental and economic sustainability. Chemical Engineering Transactions, 70, 271–276. [CrossRef]
- Sarker, S. K., Haque, N., Bhuiyan, M., Bruckard, W., & Pramanik, B. K. (2022). Recovery of strategically important critical minerals from mine tailings. Journal of Environmental Chemical Engineering, 10(3), 107622. [CrossRef]
- Sibarani, D., Hamuyuni, J., Luomala, M., Lindgren, M., & Jokilaakso, A. (2020). Thermal Conductivity of Solidified Industrial Copper Matte and Fayalite Slag. Jom, 72(5), 1927–1934. [CrossRef]
- Sipunga, E. (2015). Optimization of the flotation of copper smelter slags from Namibia Custom Smelters ’ Slag Mill Plant. University of Witwatersrand.
- Trinh, H. B., Lee, J., Kim, S., Lee, J. C., Aceituno, J. C. F., & Oh, S. (2021). Selective recovery of copper from industrial sludge by integrated sulfuric leaching and electrodeposition. Metals, 11(1), 1–13. [CrossRef]
- Vardanyan, N., Sevoyan, G., Navasardyan, T., & Vardanyan, A. (2019). Recovery of valuable metals from polymetallic mine tailings by natural microbial consortium. Environmental Technology (United Kingdom), 40(26), 3467–3472. [CrossRef]
Figure 1.
Process diagram for the methodology employed to characterize the copper slag.
Figure 1.
Process diagram for the methodology employed to characterize the copper slag.
Figure 2.
Particle size distribution of unwashed (dry sieved) and water washed (wet sieved)) historic smelter slag materials.
Figure 2.
Particle size distribution of unwashed (dry sieved) and water washed (wet sieved)) historic smelter slag materials.
Figure 3.
SEM BSE of polished slag particles (3a, 3b and 3c) and SE of received slag material (3d, 3e and 3f) micrographs showing the shapes of the particles. The high reflectance phases are metallic sulphides, whereas the rest of the material are silicates.
Figure 3.
SEM BSE of polished slag particles (3a, 3b and 3c) and SE of received slag material (3d, 3e and 3f) micrographs showing the shapes of the particles. The high reflectance phases are metallic sulphides, whereas the rest of the material are silicates.
Figure 4.
SEM BSE of polished slag particles (4a and 4b) and SE of received slag material (4c and 4d) micrographs showing the shapes of the particles. The high reflectance phases are metal sulphides of Cu, Zn, Pb and Fe.
Figure 4.
SEM BSE of polished slag particles (4a and 4b) and SE of received slag material (4c and 4d) micrographs showing the shapes of the particles. The high reflectance phases are metal sulphides of Cu, Zn, Pb and Fe.
Figure 5.
SEM BSE of polished slag particles (5a) and SE of received slag material (5b) micrographs showing the shapes of the particles. The high reflectance phases are metal sulphides of Cu, Zn, Pb and Fe.
Figure 5.
SEM BSE of polished slag particles (5a) and SE of received slag material (5b) micrographs showing the shapes of the particles. The high reflectance phases are metal sulphides of Cu, Zn, Pb and Fe.
Figure 6.
SEM SE images showing particles of different morphologies and sizes in the slag material of granulometry range between 75 and 300 µm.
Figure 6.
SEM SE images showing particles of different morphologies and sizes in the slag material of granulometry range between 75 and 300 µm.
Figure 7.
SEM SE image showing needle-like slag particles in material received with particle sizes smaller than 38 µm.
Figure 7.
SEM SE image showing needle-like slag particles in material received with particle sizes smaller than 38 µm.
Figure 8.
Elemental mapping of slag material showing the presence of Zinc along with silicon, and calcium in the flakes and the needle-like particles of oxide phase particles. Needles have less caclium compared to other shapes.
Figure 8.
Elemental mapping of slag material showing the presence of Zinc along with silicon, and calcium in the flakes and the needle-like particles of oxide phase particles. Needles have less caclium compared to other shapes.
Figure 9.
Calculated equilibrium phase diagrams showing the lack of miscibility between PbS and other metal sulphides below 600°C.
Figure 9.
Calculated equilibrium phase diagrams showing the lack of miscibility between PbS and other metal sulphides below 600°C.
Figure 10.
SEM BS image showing the matrix, a secondary phase and matte fine particles areas in slag particules larger than 850 µm.
Figure 10.
SEM BS image showing the matrix, a secondary phase and matte fine particles areas in slag particules larger than 850 µm.
Figure 11.
A classical occurrence of the slag material showing the different phases present. Three phases in a -75 µm size fraction. 1a (pyrite), b (chalcopyrite), and c (pyrrhotite) = metallic sulphide phases; 2 = sulphide phase (ZnS); 3 = silicate phase (spinel in slag). Length of bottom of photograph = 2 mm. The metallic phases are in the order of 0.15-0.25 mm in size.
Figure 12.
Phases (metallic, oxide and sulphide phases) within various size fractions indicated at the bottom of each photograph: A: Mostly slag with minor pyrrhotite; B: Grains of chalcopyrite (bright yellow) with pyrrhotite, dull yellow; C: Large galena phases (PbS) with enclosed sphalerite (ZnS); D and E: mainly galena phases enclosing low reflectance probable ZnS; E:A metalloid of probably spinel with wurtzite (ZnS). Length of bottom photograph = 0.4 mm.
Figure 13.
Metallic phases occurring as individual grains within the slag in the finer size fractions. In A the morphology of the slag material is observed as being of various sizes and shapes. In B (center the sulphide phases occur as spherical phases, indicating a high temperature of formation as droplets in the slag. In C (far right) is an example showing the very bright ovoid phase (sulphide); intermediate brightness, spinels and very low brightness, silicates.
Table 1.
Elemental compositions of the composite historic smelter slag samples.
Table 1.
Elemental compositions of the composite historic smelter slag samples.
| Elements |
Elemental composition (%w/w) |
| AAS |
ICP OES |
XRF |
| Si |
|
- |
|
| Ca |
11.26 |
- |
|
| Mn |
|
0.11 |
0.13 |
| Fe |
11.87 |
10.33 |
9.16 |
| Cd |
|
0.01 |
|
| Ni |
|
0.002 |
|
| Cu |
0.41 |
0.28 |
0.25 |
| Zn |
1.88 |
2.19 |
5.49 |
| As |
|
0.25 |
0.2 |
| Mg |
|
nd |
|
| Co |
|
0.008 |
|
| Pb |
4.16 |
1.578 |
1.51 |
| Ag |
|
nd |
|
| Ge |
|
nd |
|
| Mo |
|
- |
0.15 |
| Other (%) |
70.42 |
85.24 |
83.11 |
Table 2.
Assay by size fractions of smelter slag materials from AAS, ICP and XRF.
Table 2.
Assay by size fractions of smelter slag materials from AAS, ICP and XRF.
| Elements |
AAS (%) |
ICP (%) |
XRF (%) |
| +3350 µm |
-75 µm |
+3350 µm |
-75 µm |
+3350 µm |
-75 µm |
| Si |
|
|
|
|
|
|
| Ca |
11.07 |
8.34 |
|
|
|
|
| Mn |
|
|
0.12 |
0.09 |
0.13 |
0.14 |
| Fe |
9.01 |
11.05 |
10.45 |
9.75 |
10.02 |
11.91 |
| Cd |
|
|
0.01 |
0.05 |
|
|
| Ni |
|
|
0.001 |
0.001 |
|
|
| Cu |
0.33 |
1.51 |
0.28 |
1.08 |
0.26 |
1.06 |
| Zn |
0.8 |
1.05 |
3.08 |
2.1 |
7.13 |
7.37 |
| As |
|
|
0.23 |
0.71 |
0.18 |
0.88 |
| Mg |
|
|
2.45 |
0 |
|
|
| Co |
|
|
0.01 |
0.008 |
|
|
| Pb |
3.33 |
5.53 |
2.03 |
2.04 |
2.00 |
2.92 |
| Ag |
|
|
0.0013 |
nd |
|
|
| Ge |
|
|
nd |
nd |
|
|
| Mo |
|
|
|
|
0.19 |
0.19 |
| Other (%) |
75.46 |
72.52 |
81.3377 |
84.171 |
80.09 |
75.53 |
Table 3.
EDX semi-quantitative area analysis composition ranges in % (w/w) of particles in received slag material passing the 300 µm sieves. (The oxygen and sulphur contents are only indicative of the oxide and sulfide phases present).
Table 3.
EDX semi-quantitative area analysis composition ranges in % (w/w) of particles in received slag material passing the 300 µm sieves. (The oxygen and sulphur contents are only indicative of the oxide and sulfide phases present).
| Element |
Flakes |
Needles |
Ovoid |
Spheres |
| Si |
13 - 19 |
14 - 37 |
< 0.4 |
0.3 – 9.0 |
| Ca |
12 – 20 |
< 9.0 |
- |
<1.8 |
| Fe |
4 – 21 |
12 - 20 |
1.0 – 39 |
<9.0 |
| Zn |
11 – 15 |
8.7 - 17 |
0.3 – 1.4 |
1.7 – 3.0 |
| Pb |
0.7 – 2.6 |
3.4 – 7.0 |
15 – 39 |
48 – 79 |
| Cu |
0.0 – 1.2 |
0.0 – 0.93 |
12 – 44 |
3.7 – 4.4 |
| As |
- |
- |
2.5 – 30 |
2.5 – 15 |
| Ge |
- |
- |
<0.16 |
<0.63 |
| Mg |
3.8 – 5.3 |
< 5.0 |
- |
<0.07 |
| Al |
1.1 – 2.8 |
1.9 – 2.8 |
- |
- |
| S |
< 0.6 |
< 0.4 |
1.3 – 55 |
<4.0 |
| O |
29 - 37 |
27 - 34 |
<7.0 |
9.0 - 20 |
Table 4.
EDX semi-quantitative area analysis composition ranges in % (w/w) of the phases observed in coarse slag particles (+300 µm – 3350 µm). The oxygen and sulphur contents are only indicative of the oxide or sulphide compounds present.
Table 4.
EDX semi-quantitative area analysis composition ranges in % (w/w) of the phases observed in coarse slag particles (+300 µm – 3350 µm). The oxygen and sulphur contents are only indicative of the oxide or sulphide compounds present.
| Element |
Slag matrix |
Secondary phase of the slag |
Trapped Matte/metal particles |
| Si |
12 – 13 |
19 |
1.2 – 8.7 |
| Ca |
12 – 16 |
21 |
0.5 – 1.8 |
| Fe |
19 – 23 |
3 |
4.3 – 8.6 |
| Zn |
13 – 17 |
13 |
2.3 – 3.0 |
| Pb |
< 6.9 |
< 0.7 |
48 – 59 |
| Cu |
- |
- |
15 – 16 |
| As |
- |
- |
2.7 – 3.2 |
| Ge |
- |
- |
0 – 0.63 |
| Mg |
3.2 – 4.1 |
4.7 |
- |
| Al |
2.0 – 2.1 |
1.2 |
0.2 – 0.4 |
| S |
< 0.3 |
- |
0.4 – 0.9 |
| O |
25 - 29 |
38 |
9.7 - 12 |
|
Disclaimer/Publisher’s Note: The statements, opinions and data contained in all publications are solely those of the individual author(s) and contributor(s) and not of MDPI and/or the editor(s). MDPI and/or the editor(s) disclaim responsibility for any injury to people or property resulting from any ideas, methods, instructions or products referred to in the content. |
© 2023 by the authors. Licensee MDPI, Basel, Switzerland. This article is an open access article distributed under the terms and conditions of the Creative Commons Attribution (CC BY) license (http://creativecommons.org/licenses/by/4.0/).

