Submitted:
27 July 2023
Posted:
28 July 2023
You are already at the latest version
Abstract
Keywords:
1. Introduction
2. Materials and Methods
2.1. Collecting Longissimus Dorsi Samples
2.2. Determining Intramuscular Fat and Fatty Acids
2.3. DNA Extraction, Genotyping and Quality Control
2.3.1. DNA Extraction, Genotyping
2.3.2. Quality Control and Genotype Imputation
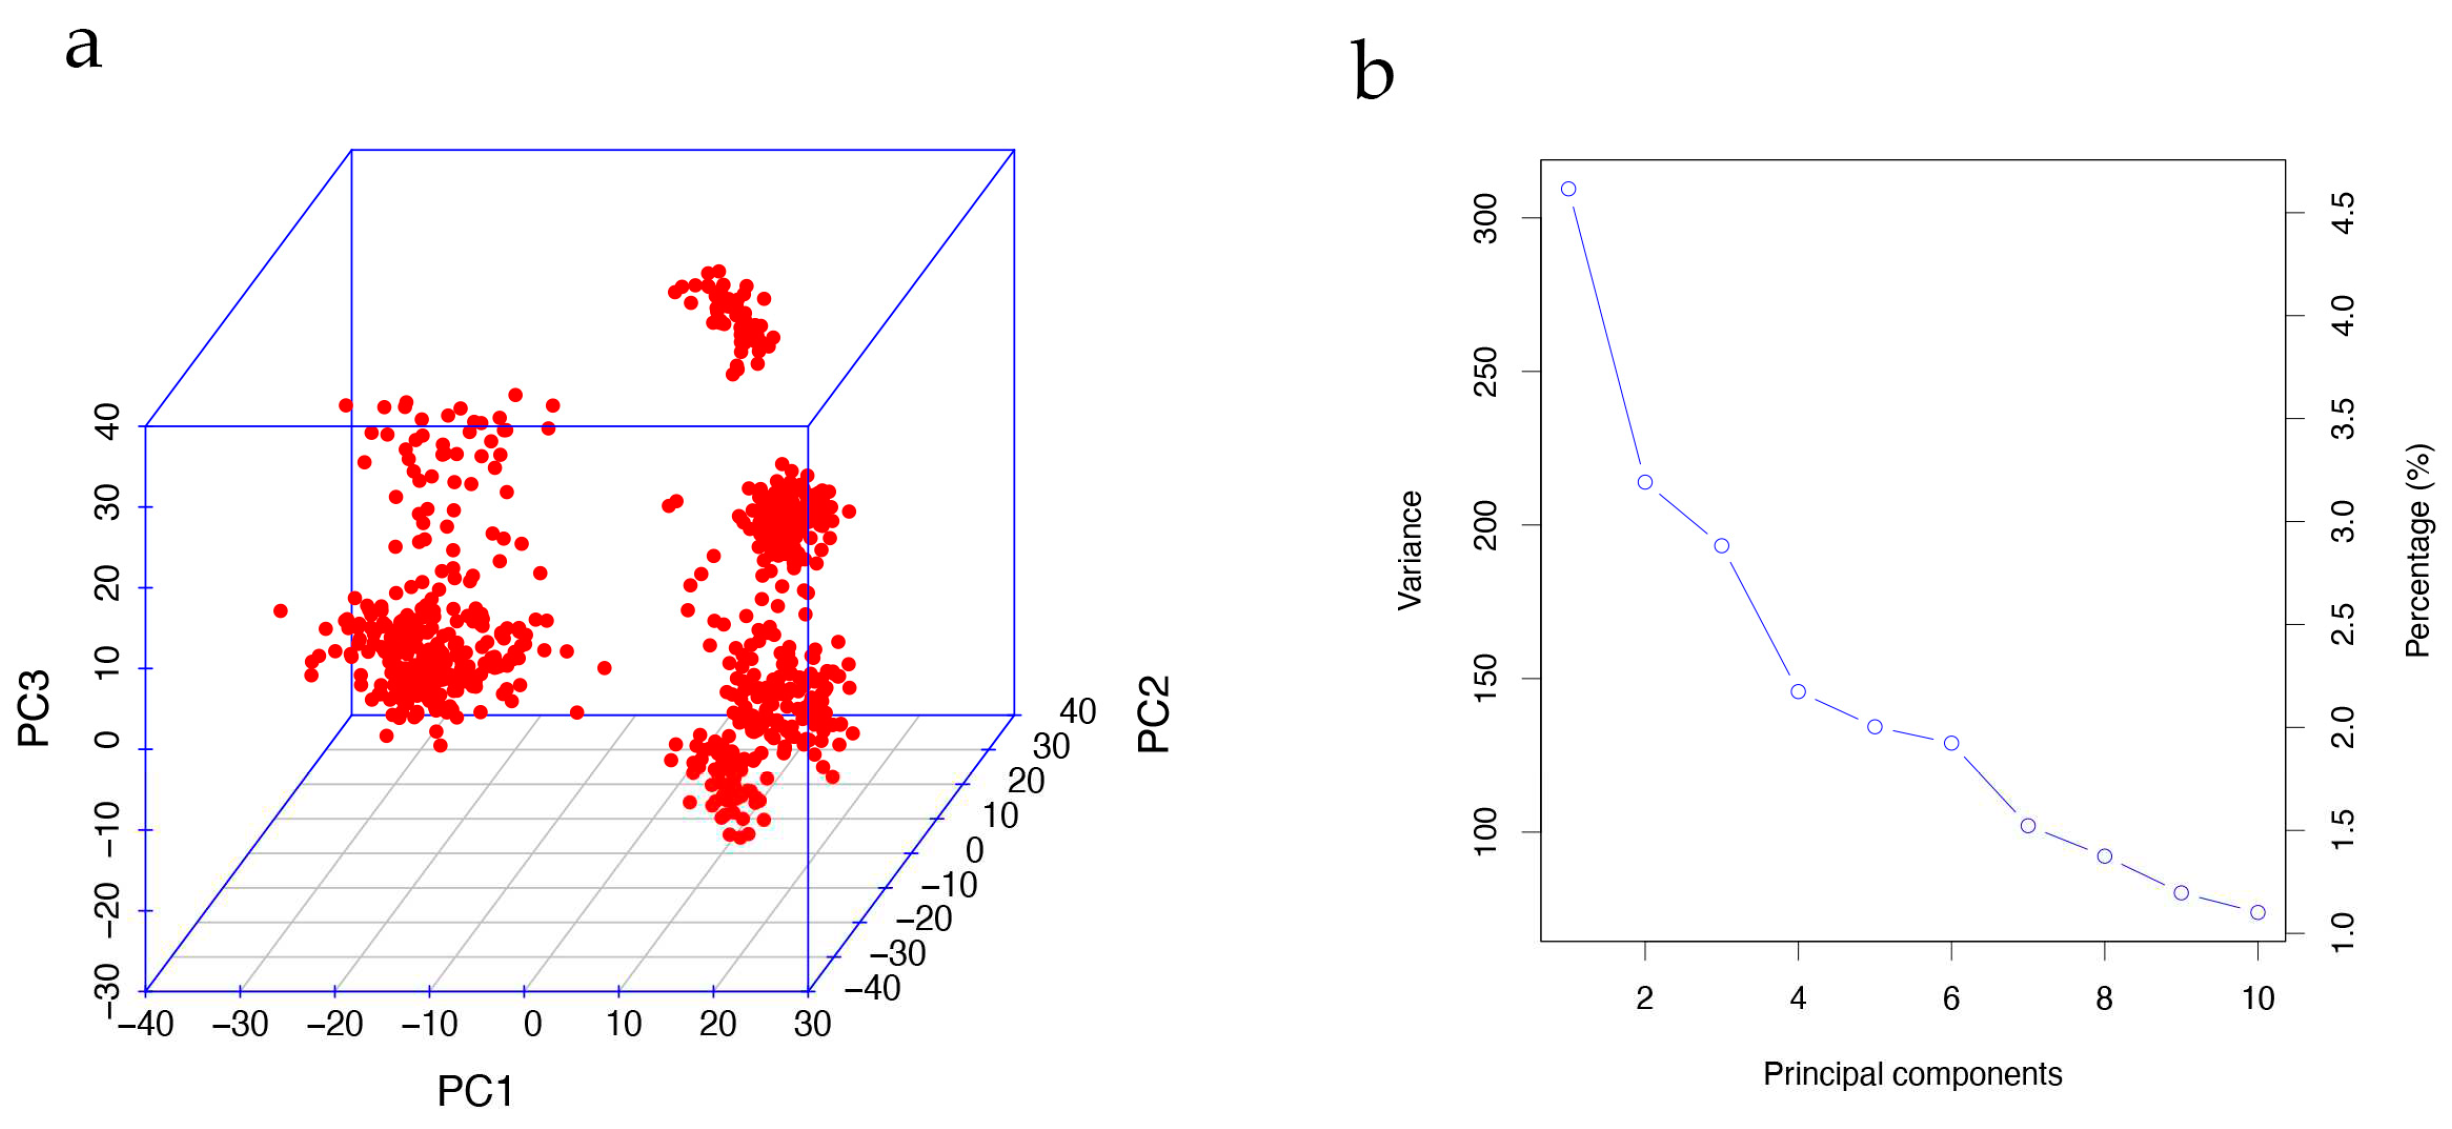
2.4. Population stratification
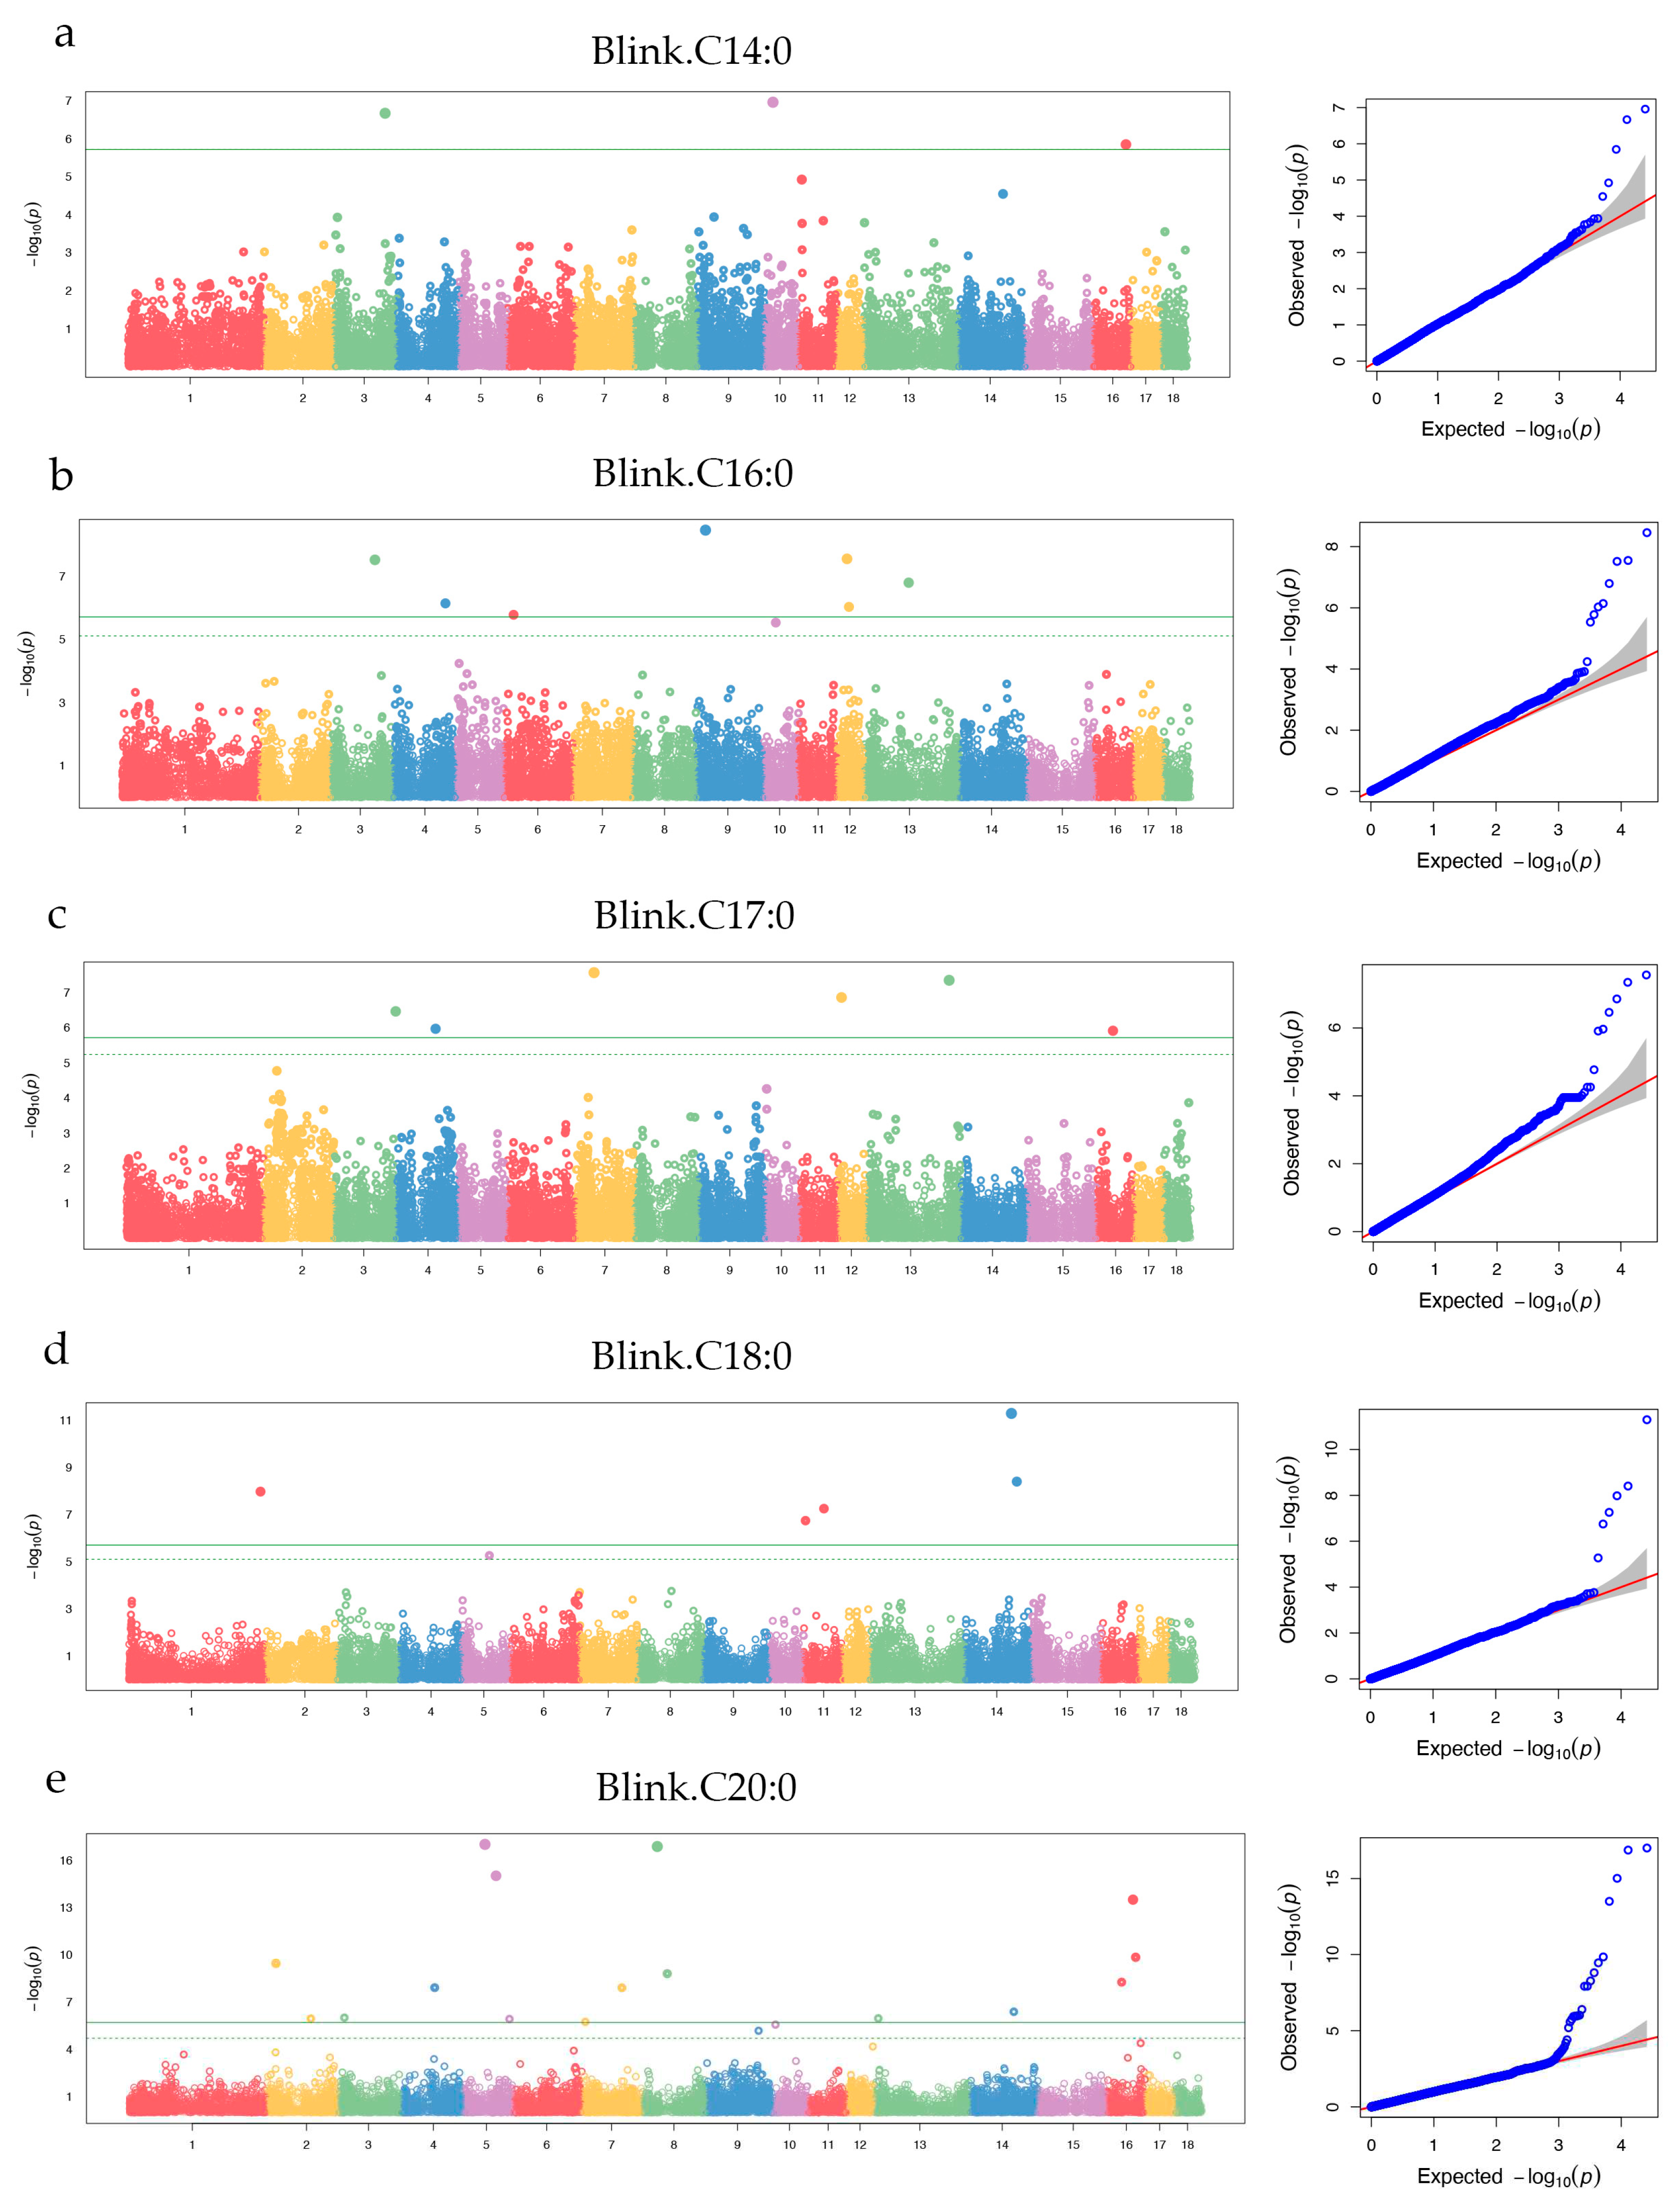
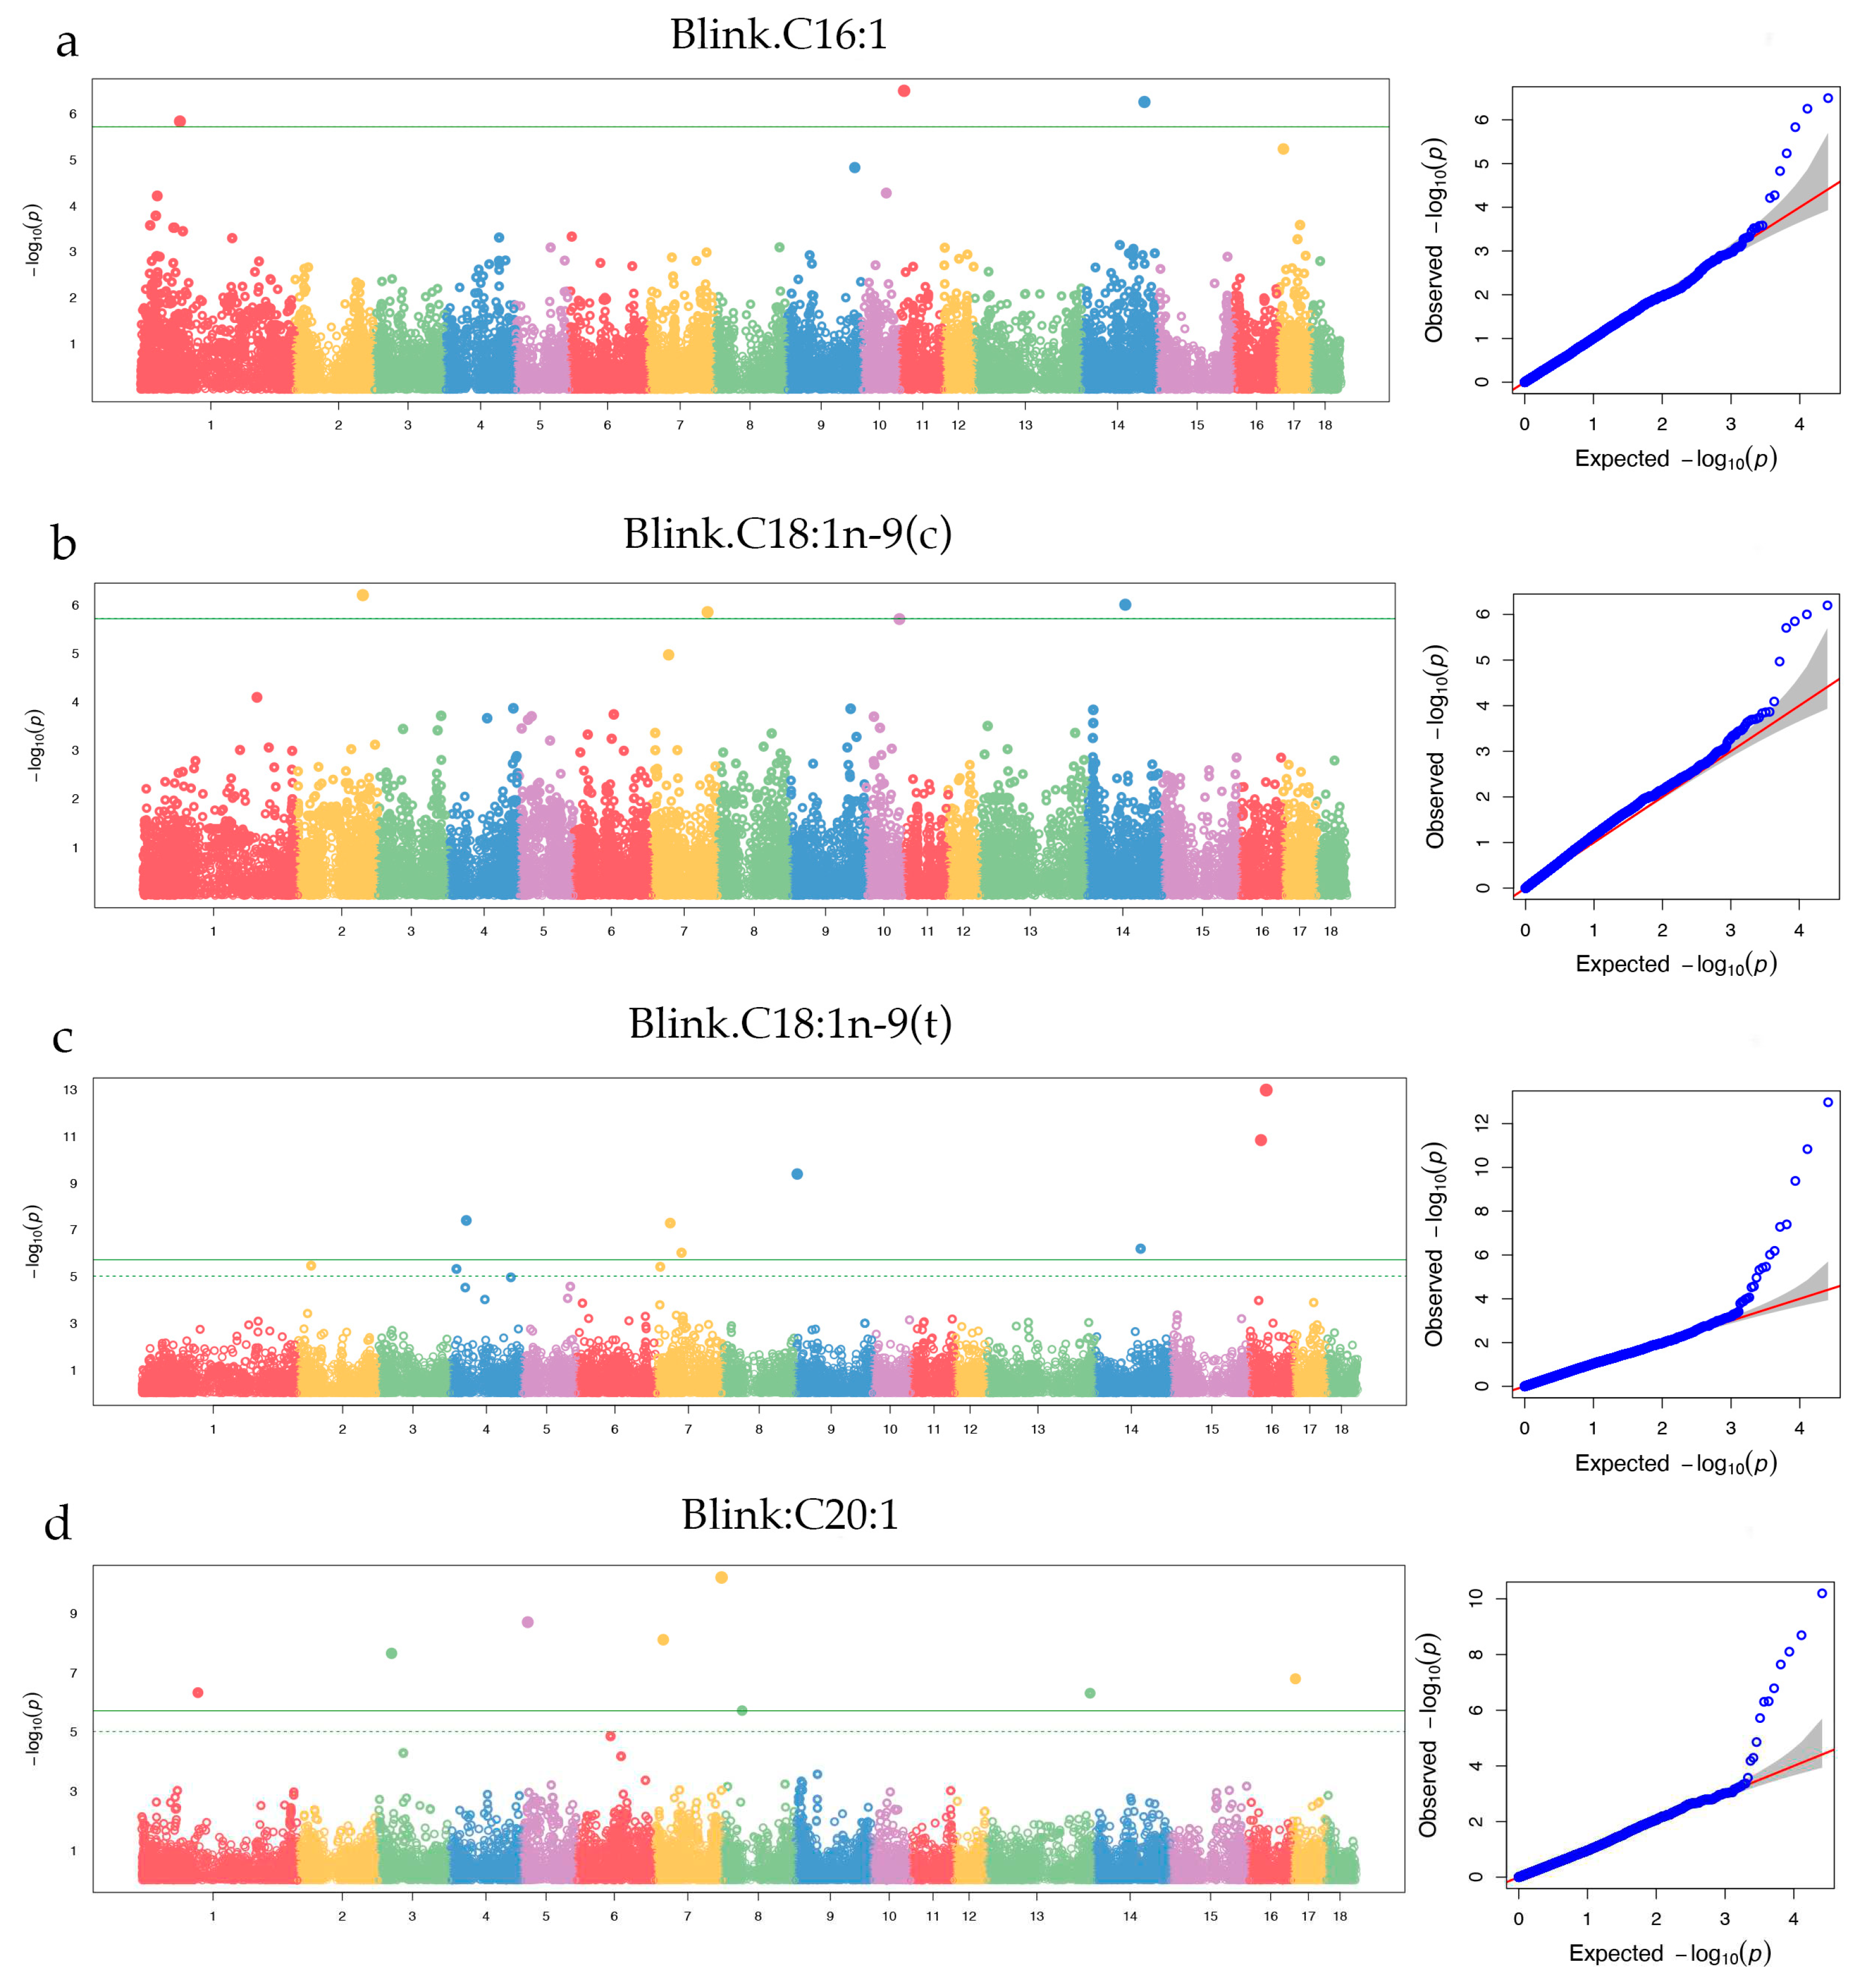
2.5. Genome-wide association study
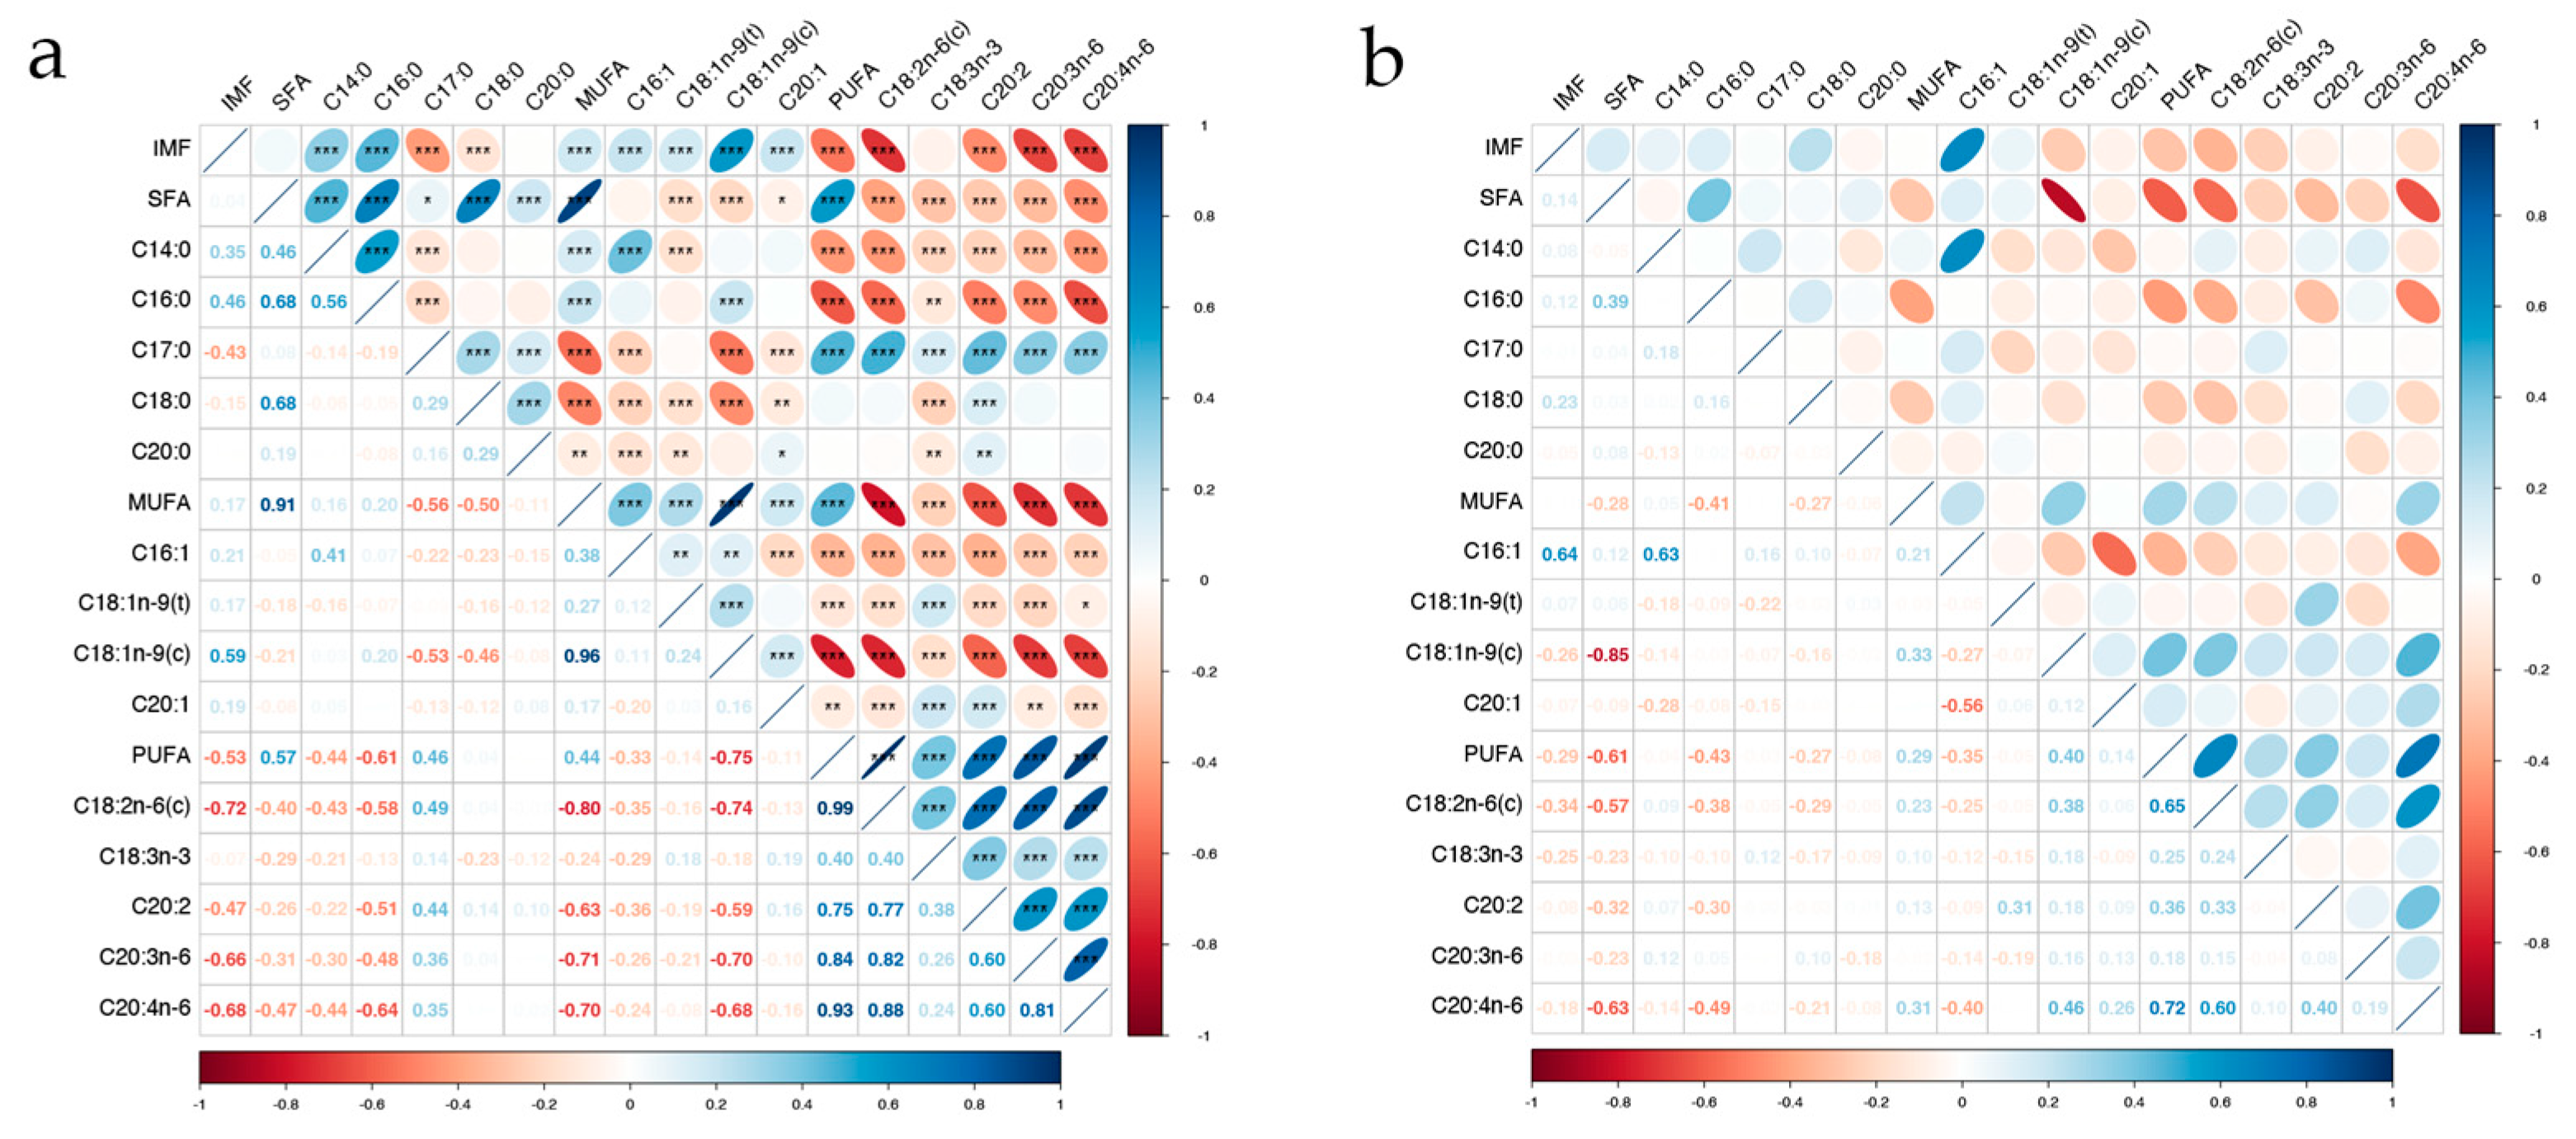
2.6. Estimation of Hertability and Genetic correlation
2.7. Identificaiton of Candidate Genes
2.8. Functional Enrichment analysis
3. Results
3.1. Descriptions Statistics of IMF and fatty acids composition
3.2. Estimation of Genetic parameter
3.3. Genome-wide assciation study results for fatty acids
3.3.1. SFA
3.3.2. MUFA
3.3.3. PUFA
3.4. Identification of candidate genes
| Fatty acid | SNP | CHR | POS (bp) | MAF 1 | p-value | PVE (%) 2 | Candidate gene 3 | Location (bp) 4 |
|---|---|---|---|---|---|---|---|---|
| SFA | ||||||||
| C14:0 | WU_10.2_3_116903421 | 3 | 116,903,421 | 0.10 | 2.15 × 10⁻⁷ | 2.98 | ALK | Within |
| H3GA0053711 | 10 | 19,975,279 | 0.39 | 1.10 × 10⁻⁷ | 4.21 | HNRNPU | (-) 46,502 | |
| ASGA0074106 | 16 | 75,024,639 | 0.20 | 1.43 × 10⁻⁶ | 6.30 | MFAP3 | Within | |
| C16:0 | ALGA0020228 | 3 | 102,155,060 | 0.27 | 3.04 × 10⁻⁸ | 0.96 | CAMKMT | (-) 67,527 |
| WU_10.2_4_119395133 | 4 | 119,395,133 | 0.20 | 7.24 × 10⁻⁷ | 0.71 | CEPT1 | Within | |
| ASGA0027821 | 6 | 20,665,813 | 0.08 | 1.66 × 10⁻⁶ | 1.87 | --- | --- | |
| MARC0001638 | 9 | 20,050,249 | 0.38 | 3.49 × 10⁻⁹ | 1.54 | --- | --- | |
| M1GA0024654 | 12 | 23,711,351 | 0.25 | 2.83 × 10⁻⁸ | 1.49 | NPEPPS | Within | |
| ASGA0053936 | 12 | 28,196,313 | 0.10 | 9.35 × 10⁻⁷ | 2.46 | CA10 | (-) 73,699 | |
| ALGA0071522 | 13 | 101,058,816 | 0.48 | 1.60 × 10⁻⁷ | 0.92 | P2RY1 / RAP2B | (+) 24,652 / (-) 272,878 | |
| C17:0 | WU_10.2_3_142168876 | 3 | 142,168,876 | 0.22 | 3.47 × 10⁻⁷ | 1.63 | ENSSSCG00000008655 | Within |
| WU_10.2_4_89693248 | 4 | 89,693,248 | 0.13 | 1.09 × 10⁻⁶ | 0.98 | ATP1B1 / DPT | (-) 142,688 / (+) 276,076 | |
| ALGA0040777 | 7 | 41,624,144 | 0.44 | 2.75 × 10⁻⁸ | 1.06 | ENSSSCG00000027922 | (-) 6,957 | |
| WU_10.2_12_7644839 | 12 | 7,644,839 | 0.02 | 1.40 × 10⁻⁷ | 5.94 | SDK2 | (-) 101,272 | |
| ASGA0059505 | 13 | 191,280,771 | 0.01 | 4.53 × 10⁻⁸ | 11.39 | ENSSSCG00000012009 | (+) 96,319 | |
| ASGA0097154 | 16 | 38,383,883 | 0.35 | 1.23 × 10⁻⁶ | 0.74 | MIER3 / GPBP1 | (-) 92,572 / (+) 147,193 | |
| C18:0 | ALGA0010606 | 1 | 302,716,687 | 0.02 | 1.05 × 10⁻⁸ | 5.30 | SWI5 | Within |
| WU_10.2_11_3591593 | 11 | 3,591,593 | 0.45 | 1.78 × 10⁻⁷ | 0.96 | CDK8 | Within | |
| DRGA0011206 | 11 | 45,910,375 | 0.02 | 5.51 × 10⁻⁸ | 6.85 | KLHL1 | (-) 344,156 | |
| WU_10.2_14_106229446 | 14 | 106,229,446 | 0.09 | 5.06 × 10⁻¹² | 6.06 | DKK1 / PRKG1 | (+) 111,773 / (-) 24,033 | |
| ALGA0080940 | 14 | 118,552,421 | 0.30 | 3.94 × 10⁻⁹ | 1.79 | AVPI1 | Within | |
| C20:0 | WU_10.2_2_19459316 | 2 | 19,459,316 | 0.01 | 3.53 × 10⁻¹⁰ | 0.50 | U5 / EXT2 | (+) 53,530 / (-) 248,965 |
| MARC0046666 | 2 | 99,366,616 | 0.10 | 1.11 × 10⁻⁶ | 0.04 | MEF2C | (+) 481,344 | |
| WU_10.2_3_13474115 | 3 | 13,474,115 | 0.17 | 9.65 × 10⁻⁷ | 0.03 | SNORA79 | (-) 6,713 | |
| ALGA0025658 | 4 | 75,387,791 | 0.03 | 1.21 × 10⁻⁸ | 2.18 | ARMC1 | (+) 213,167 | |
| DRGA0005776 | 5 | 46,748,561 | 0.01 | 9.76 × 10⁻¹⁸ | 0 | IPO8 | (-) 37,690 | |
| H3GA0016783 | 5 | 71,996,403 | 0.36 | 9.65 × 10⁻¹⁶ | 0.12 | IL17RA/ CECR2 | (+) 216,815 / (-) 1,304 | |
| WU_10.2_5_102656712 | 5 | 102,656,712 | 0.01 | 1.17 × 10⁻⁶ | 0.19 | --- | --- | |
| WU_10.2_7_6641603 | 7 | 6,641,603 | 0.06 | 1.79 × 10⁻⁶ | 0.04 | OFCC1 | (+) 394,140 | |
| MARC0077077 | 7 | 90,165,851 | 0.03 | 1.22 × 10⁻⁸ | 0.02 | U4 | (-) 483,532 | |
| ALGA0047587 | 8 | 36,220,598 | 0.01 | 1.33 × 10⁻¹⁷ | 89.85 | --- | --- | |
| ALGA0049475 | 8 | 58,905,523 | 0.02 | 1.57 × 10⁻⁹ | 0.38 | TMEM165 / REST | (+) 136,496 / (-) 65,988 | |
| WU_10.2_13_7954310 | 13 | 7,954,310 | 0.02 | 1.07 × 10⁻⁶ | 0.13 | EFHB / PP2D1 | (+) 156,176 / (-) 17,027 | |
| H3GA0041501 | 14 | 98,921,568 | 0.37 | 4.07 × 10⁻⁷ | 0.02 | ALOX5 | Within | |
| MARC0054269 | 16 | 33,826,642 | 0.45 | 5.43 × 10⁻⁹ | 0.04 | ITGA1 | Within | |
| WU_10.2_16_59778879 | 16 | 59,778,879 | 0.12 | 3.17 × 10⁻¹⁴ | 0.48 | SLIT3 | Within | |
| ASGA0073724 | 16 | 65,860,356 | 0.38 | 1.45 × 10⁻¹⁰ | 0.06 | --- | --- | |
| MUFA | ||||||||
| C16:1 | ALGA0004246 | 1 | 80,989,471 | 0.19 | 1.47 × 10⁻⁶ | 8.55 | PREP | (+) 97,088 |
| MARC0099145 | 11 | 7,302,533 | 0.26 | 3.19 × 10⁻⁷ | 2.20 | ALOX5AP / MEDAG | (+) 14,970 / (-) 94,001 | |
| ALGA0081341 | 14 | 127,218,925 | 0.42 | 5.58 × 10⁻⁷ | 2.81 | U6 | (+) 142,743 | |
| C18:1n-9(c) | ALGA0015731 | 2 | 132,199,278 | 0.37 | 6.33 × 10⁻⁷ | 0.67 | PRDM6 | Within |
| WU_10.2_7_113985448 | 7 | 113,985,448 | 0.337 | 1.41 × 10⁻⁶ | 1.67 | FLRT2 | (-) 371,757 | |
| ASGA0064960 | 14 | 77,566,009 | 0.34 | 9.97 × 10⁻⁷ | 0.41 | RUFY2 | Within | |
| C18:1n-9(t) | H3GA0012422 | 4 | 31,763,547 | 0.02 | 4.00 × 10⁻⁸ | 0.73 | RSPO2 | (-) 39,304 |
| DIAS0004691 | 7 | 29,798,220 | 0.02 | 5.20 × 10⁻⁸ | 1.37 | RXRB / COL11A2 | (+) 30,602 / (-) 98 | |
| ASGA0033619 | 7 | 52,577,418 | 0.02 | 9.68 × 10⁻⁷ | 0.52 | MCM3 / PAQR8 | (+) 22,826 / (-) 58,073 | |
| H3GA0025990 | 9 | 2,779,787 | 0.01 | 4.13 × 10⁻¹⁰ | 2.69 | SYT9 | Within | |
| ALGA0079386 | 14 | 91,261,955 | 0.29 | 6.50 × 10⁻⁷ | 0.26 | NRG3 / SNORA31 | (+) 153,379 / (-) 56,774 | |
| H3GA0046208 | 16 | 22,351,887 | 0.01 | 1.46 × 10⁻¹¹ | 45.24 | CAPSL | Within | |
| DRGA0016063 | 16 | 32,872,449 | 0.04 | 1.06 × 10⁻¹³ | 31.52 | ISL1 | (+) 313,447 | |
| C20:1 | ASGA0004095 | 1 | 113,473,890 | 0.24 | 4.76 × 10⁻⁷ | 0.79 | ENSSSCG00000004527 | (-) 459,563 |
| ASGA0085560 | 3 | 26,316,304 | 0.36 | 2.27 × 10⁻⁸ | 1.43 | GP2 /GPR139 | (+) 23,724 / (-)218,640 | |
| WU_10.2_5_13180559 | 5 | 13,180,559 | 0.38 | 2.03 × 10⁻⁹ | 0.85 | CRY1 | Within | |
| ASGA0031521 | 7 | 17,152,543 | 0.02 | 7.91 × 10⁻⁹ | 6.73 | CDKAL1 | Within | |
| 7_134762912 | 7 | 134,762,912 | 0.26 | 6.37 × 10⁻¹¹ | 1.67 | SCARNA6 | (+) 112,451 | |
| ALGA0111031 | 8 | 41,395,488 | 0.25 | 1.91 × 10⁻⁶ | 2.27 | USP46 | (-) 246,632 | |
| ASGA0059943 | 13 | 210,282,758 | 0.10 | 4.97 × 10⁻⁷ | 0.82 | CLDN14 / SIM2 | (+) 125,384 / (-) 157,224 | |
| H3GA0047778 | 17 | 7,610,059 | 0.03 | 1.62 × 10⁻⁷ | 3.49 | --- | --- | |
| PUFA | ||||||||
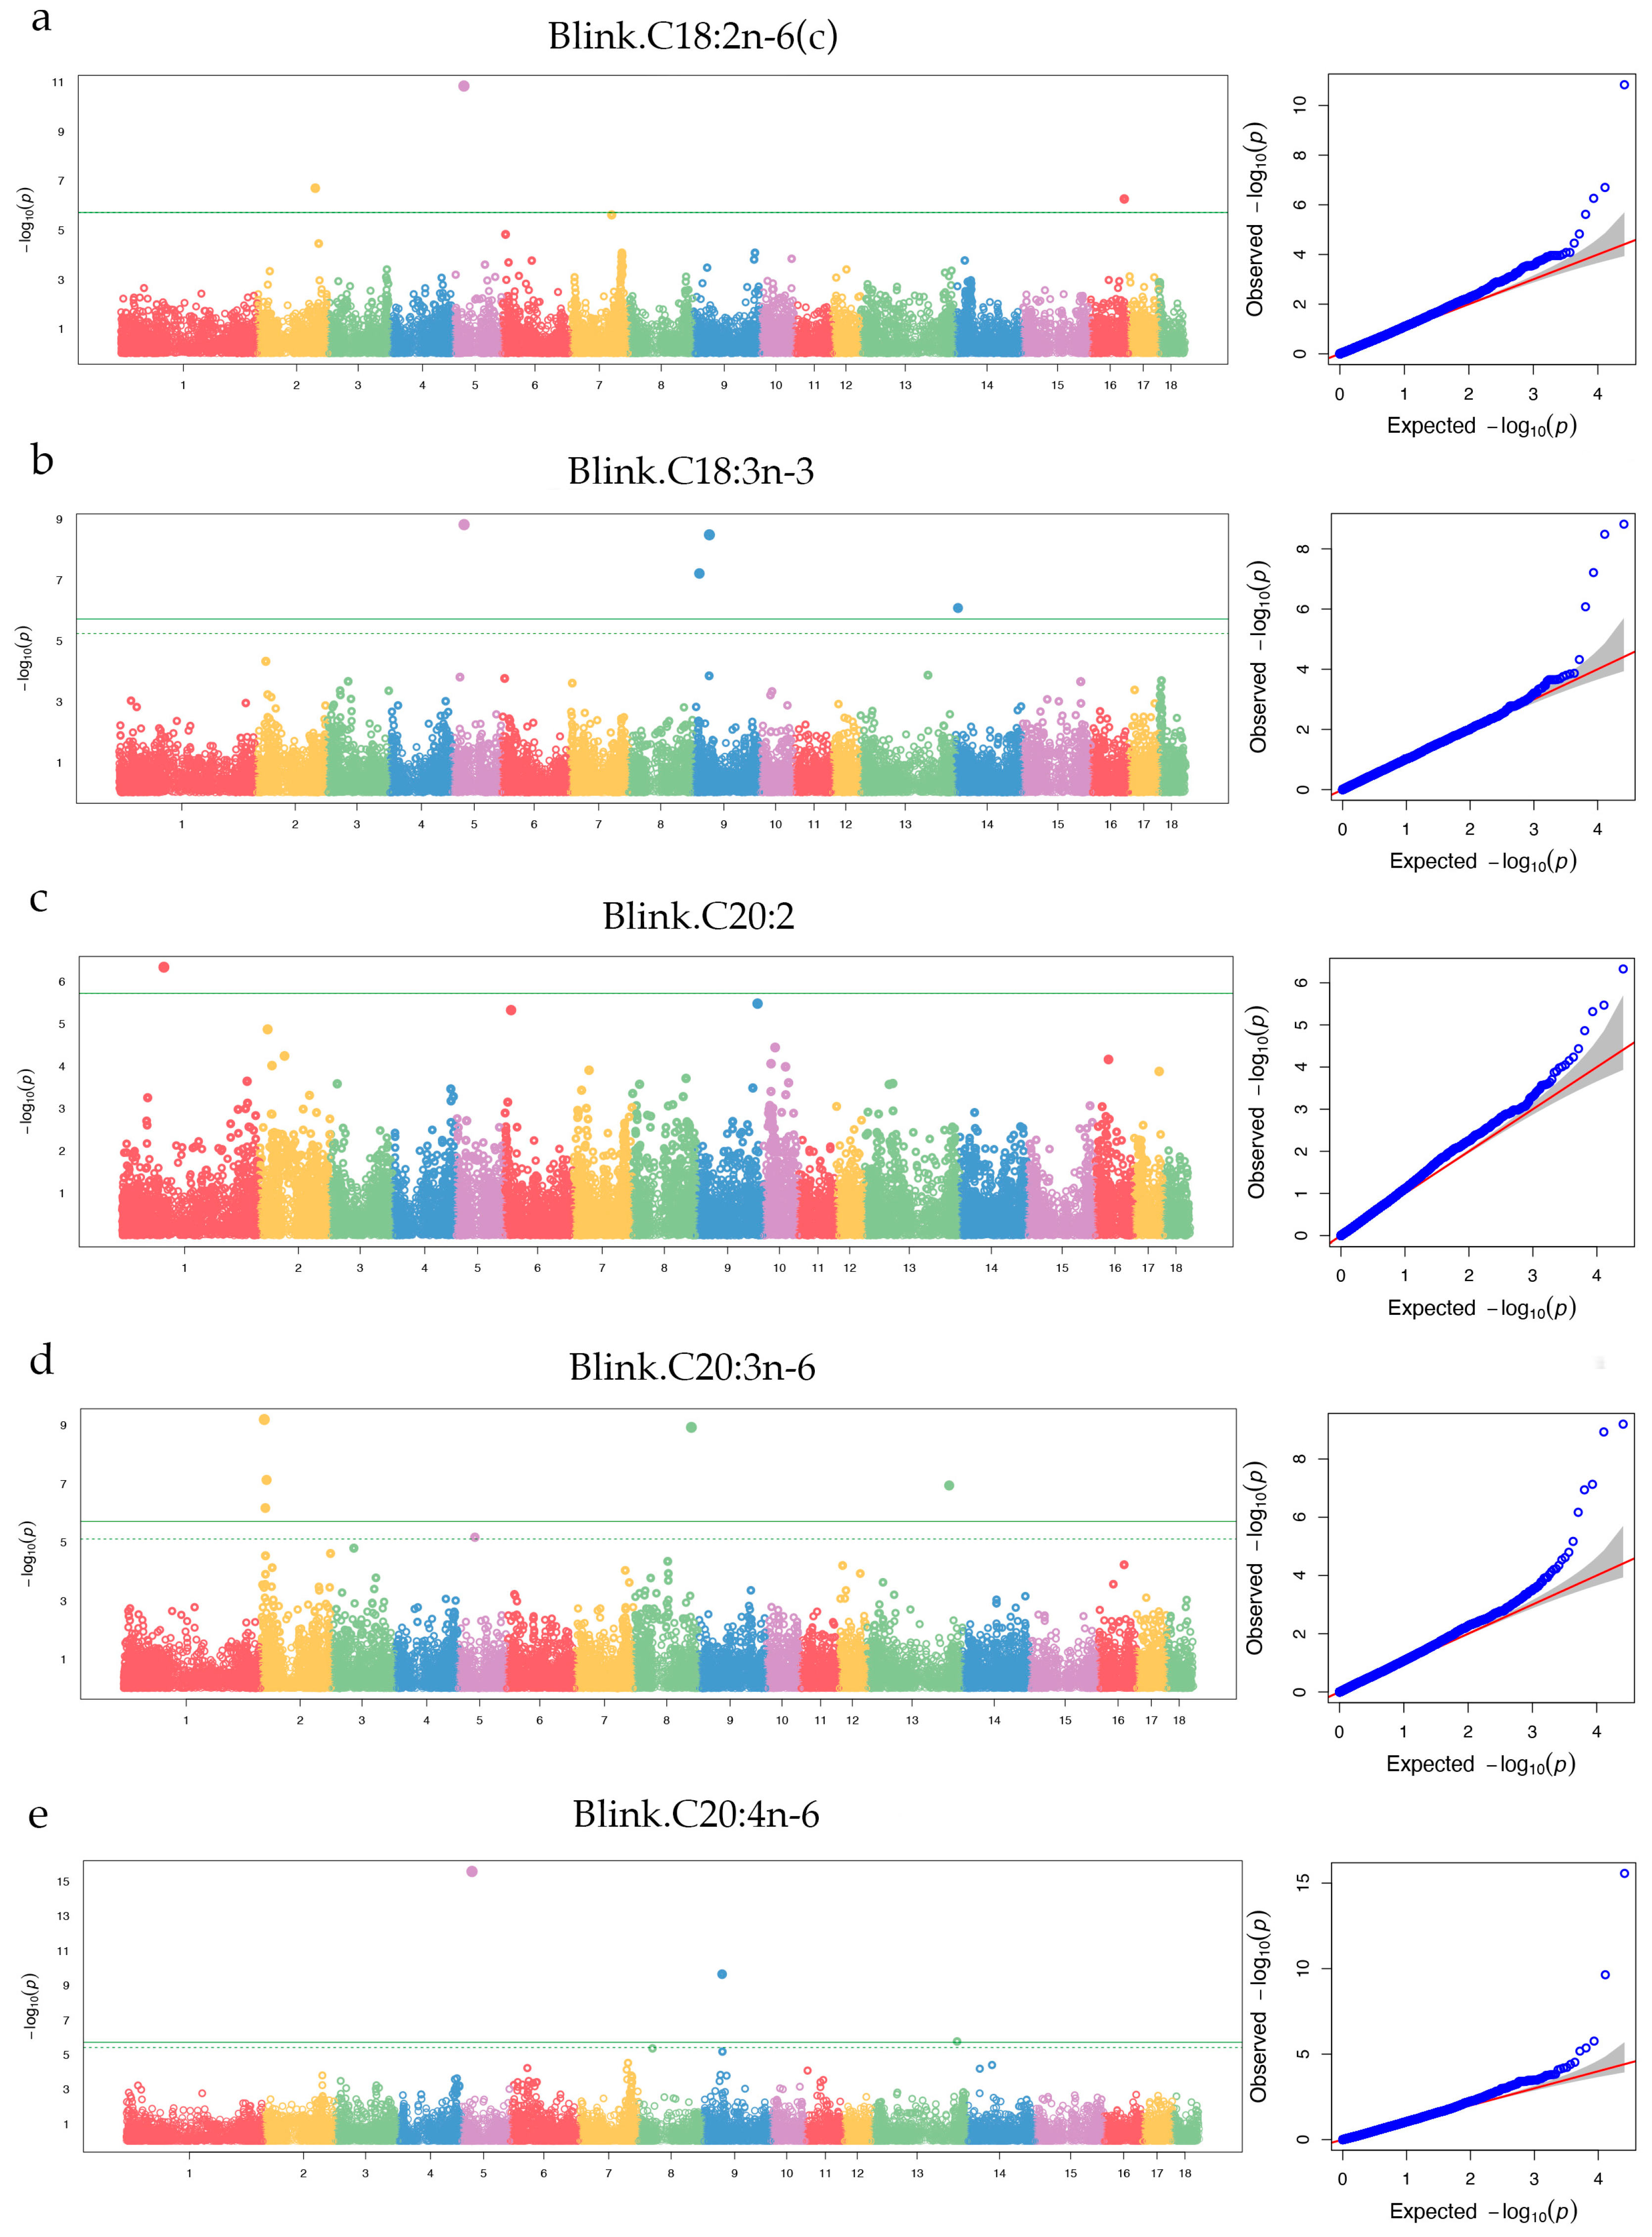
| C18:2n-6(c) | ALGA0015731 | 2 | 132,199,278 | 0.37 | 1.99 × 10⁻⁷ | 2.10 | CEP120 | Within |
| WU_10.2_5_24153921 | 5 | 24,153,921 | 0.02 | 1.45 × 10⁻¹¹ | 18.22 | RDH16 / NDUFA4L2 | (+) 14,897 / (-) 8,844 | |
| ASGA0085192 | 16 | 76,899,854 | 0.05 | 5.47 × 10⁻⁷ | 6.33 | ENSSSCG00000017077 | (+) 100,159 | |
| C18:3n-3 | MARC0014875 | 5 | 26,784,432 | 0.01 | 1.52 × 10⁻⁹ | 21.92 | SLC16A7 | Within |
| ALGA0111381 | 9 | 14,991,770 | 0.02 | 6.15 × 10⁻⁸ | 5.51 | ssc-mir-708 | (-) 128,707 | |
| DRGA0009320 | 9 | 37,972,729 | 0.08 | 3.28 × 10⁻⁹ | 16.44 | ENSSSCG00000014993 | Within | |
| ASGA0060681 | 14 | 5,504,363 | 0.42 | 8.41 × 10⁻⁷ | 1.53 | SNORA25 | (+) 236,965 | |
| C20:2 | ALGA0004743 | 1 | 96,303,394 | 0.08 | 4.70 × 10⁻⁷ | 10.78 | ENSSSCG00000022379 | (-) 50,039 |
| C20:3n-6 | WU_10.2_2_7173969 | 2 | 7,173,969 | 0.23 | 6.35 × 10⁻¹⁰ | 2.14 | FLRT1 / OTUB1 | (+) 76,045 / (-) 30,744 |
| WU_10.2_2_9630034 | 2 | 9,630,034 | 0.19 | 6.76 × 10⁻⁷ | 2.15 | SDHAF2 | Within | |
| ALGA0106081 | 2 | 12,459,648 | 0.18 | 7.40 × 10⁻⁸ | 1.62 | ENSSSCG00000022943 | (+) 6,189 | |
| ASGA0039809 | 8 | 130,628,617 | 0.18 | 1.18 × 10⁻⁹ | 1.84 | EIF4E | Within | |
| ALGA0115480 | 13 | 187,857,350 | 0.11 | 1.14 × 10⁻⁷ | 1.57 | ROBO2 | (+) 5,756 | |
| C20:4n-6 | ALGA0031262 | 5 | 23,686,043 | 0.01 | 2.71 × 10⁻¹⁶ | 31.76 | PTGES3 | Within |
| WU_10.2_9_42529952 | 9 | 42,529,952 | 0.02 | 2.28 × 10⁻¹⁰ | 7.56 | C11orf87 / U1 | (+) 440,896 / (-) 52,775 | |
| WU_10.2_13_194176619 | 13 | 194,176,619 | 0.22 | 1.73 × 10⁻⁶ | 1.20 | U6 | (+) 137,764 | |
3.5. Functional Enrichment of Candidata Genes
4. Discussion
4.1. Phenotypic and genetic Correlations
4.2. Candidate genes for fatty acid composition
5. Conclusions
Supplementary Materials
Author Contributions
Funding
Institutional Review Board Statement
Informed Consent Statement
Data Availability Statement
Conflicts of Interest
References
- Ou, S.; Cai, Y.; Chen, F.; He, S.; Chen, J.; Yang, L.; Ouyang, F.; He, J. Comparative Study on Growth Performance, Carcass Traits, and Meat Quality Traits of Ningxiang Pig and Du Long Hybrid Pig. Swine Production 2017, 65-69. https://doi.org/10.13257/j.cnki.21-1104/s.2017.05.021. [CrossRef]
- Yang, F. Comparative Study on Gene Migration Analysis and GBC Estimation Methods in Ningxiang Pig Population. Master, Hunan Agricultural University, 2021.
- Zhu, B.; Gao, H.; Yang, F.; Li, Y.; Yang, Q.; Liao, Y.; Guo, H.; Xu, K.; Tang, Z.; Gao, N.; et al. Comparative Characterization of Volatile Compounds of Ningxiang Pig, Duroc and Their Crosses (Duroc × Ningxiang) by Using SPME-GC-MS. Foods (Basel, Switzerland) 2023, 12, 1059. https://doi.org/10.3390/foods12051059. [CrossRef]
- Song, Y.; Gao, H.; Zhang, Y.; Yu, L.; He, J.; Xu, K. Determination of Carcass and Meat Quality Traits of Ningxiang Pig and Duning Binary Hybrid Pig. Chinese Journal of Animal Husbandry 2021, 57, 68-72. https://doi.org/10.19556/j.0258-7033.20210112-03. [CrossRef]
- Grassi, S.; Benedetti, S.; Opizzio, M.; Nardo, E.D.; Buratti, S. Meat and Fish Freshness Assessment by a Portable and Simplified Electronic Nose System (Mastersense). Sensors (Basel) 2019, 19. https://doi.org/10.3390/s19143225. [CrossRef]
- Khan, M.I.; Jo, C.; Tariq, M.R. Meat flavor precursors and factors influencing flavor precursors--A systematic review. Meat Sci 2015, 110, 278-284. https://doi.org/10.1016/j.meatsci.2015.08.002. [CrossRef]
- Guo, Q.; Kong, X.; Hu, C.; Zhou, B.; Wang, C.; Shen, Q.W. Fatty Acid Content, Flavor Compounds, and Sensory Quality of Pork Loin as Affected by Dietary Supplementation with l-arginine and Glutamic Acid. J Food Sci 2019, 84, 3445-3453. https://doi.org/10.1111/1750-3841.14959. [CrossRef]
- Bleicher, J.; Ebner, E.E.; Bak, K.H. Formation and Analysis of Volatile and Odor Compounds in Meat-A Review. Molecules 2022, 27. https://doi.org/10.3390/molecules27196703. [CrossRef]
- Chen, D.; Wang, X.; Guo, Q.; Deng, H.; Luo, J.; Yi, K.; Sun, A.; Chen, K.; Shen, Q. Muscle Fatty Acids, Meat Flavor Compounds and Sensory Characteristics of Xiangxi Yellow Cattle in Comparison to Aberdeen Angus. Animals : an open access journal from MDPI 2022, 12. https://doi.org/10.3390/ani12091161. [CrossRef]
- Zhao, Y. The Effect and Mechanism of Shallot Essential Oil on the Metabolism of Meat Sheep Fat and the Composition of Volatile Flavors. Doctor, Inner Mongolia Agricultural University, 2022.
- Zhang, Y.; Zhang, J.; Gong, H.; Cui, L.; Zhang, W.; Ma, J.; Chen, C.; Ai, H.; Xiao, S.; Huang, L.; et al. Genetic correlation of fatty acid composition with growth, carcass, fat deposition and meat quality traits based on GWAS data in six pig populations. Meat Sci 2019, 150, 47-55. https://doi.org/10.1016/j.meatsci.2018.12.008. [CrossRef]
- Westerling, D.; Hedrick, H. Fatty Acid Composition of Bovine Lipids as Influenced by Diet, Sex and Anatomical Location and Relationship to Sensory Characteristics. J Anim Sci 1978, 48. https://doi.org/10.2527/jas1979.4861343x. [CrossRef]
- Melton, S.; Amiri, M.; Davis, G.; Backus, W. Flavor and Chemical Characteristics of Ground Beef from Grass-, Forage-Grain- and Grain-Finished Steers. J Anim Sci 1981, 55. https://doi.org/10.2527/jas1982.55177x. [CrossRef]
- de Oliveira Otto, M.C.; Wu, J.H.; Baylin, A.; Vaidya, D.; Rich, S.S.; Tsai, M.Y.; Jacobs, D.R., Jr.; Mozaffarian, D. Circulating and dietary omega-3 and omega-6 polyunsaturated fatty acids and incidence of CVD in the Multi-Ethnic Study of Atherosclerosis. J Am Heart Assoc 2013, 2, e000506. https://doi.org/10.1161/jaha.113.000506. [CrossRef]
- Lands, B.; Bibus, D.; Stark, K.D. Dynamic interactions of n-3 and n-6 fatty acid nutrients. Prostaglandins, leukotrienes, and essential fatty acids 2018, 136, 15-21. https://doi.org/10.1016/j.plefa.2017.01.012. [CrossRef]
- Lands, B. Historical perspectives on the impact of n-3 and n-6 nutrients on health. Progress in lipid research 2014, 55, 17-29. https://doi.org/10.1016/j.plipres.2014.04.002. [CrossRef]
- Merino, J.; Guasch-Ferré, M.; Ellervik, C.; Dashti, H.; Sharp, S.; Wu, P.; Overvad, K.; Sarnowski, C.; Kuokkanen, M.; Lemaitre, R.; et al. Quality of dietary fat and genetic risk of type 2 diabetes: individual participant data meta-analysis. BMJ (Clinical research ed.) 2019, 366, l4292. https://doi.org/10.1136/bmj.l4292. [CrossRef]
- Bibus, D.; Lands, B. Balancing proportions of competing omega-3 and omega-6 highly unsaturated fatty acids (HUFA) in tissue lipids. Prostaglandins, leukotrienes, and essential fatty acids 2015, 99, 19-23. https://doi.org/10.1016/j.plefa.2015.04.005. [CrossRef]
- Ding, R.; Yang, M.; Quan, J.; Li, S.; Zhuang, Z.; Zhou, S.; Zheng, E.; Hong, L.; Li, Z.; Cai, G.; et al. Single-Locus and Multi-Locus Genome-Wide Association Studies for Intramuscular Fat in Duroc Pigs. Frontiers in genetics 2019, 10, 619. https://doi.org/10.3389/fgene.2019.00619. [CrossRef]
- Wang, Y.; Ning, C.; Wang, C.; Guo, J.; Wang, J.; Wu, Y. Genome-wide association study for intramuscular fat content in Chinese Lulai black pigs. Asian-Australas J Anim Sci 2019, 32, 607-613. https://doi.org/10.5713/ajas.18.0483. [CrossRef]
- Viterbo, V.S.; Lopez, B.I.M.; Kang, H.; Kim, H.; Song, C.W.; Seo, K.S. Genome wide association study of fatty acid composition in Duroc swine. Asian-Australas J Anim Sci 2018, 31, 1127-1133. https://doi.org/10.5713/ajas.17.0779. [CrossRef]
- Purcell, S.; Neale, B.; Todd-Brown, K.; Thomas, L.; Ferreira, M.A.; Bender, D.; Maller, J.; Sklar, P.; de Bakker, P.I.; Daly, M.J.; et al. PLINK: a tool set for whole-genome association and population-based linkage analyses. American journal of human genetics 2007, 81, 559-575. https://doi.org/10.1086/519795. [CrossRef]
- Wang, J.; Zhang, Z. GAPIT Version 3: Boosting Power and Accuracy for Genomic Association and Prediction. Genomics, proteomics & bioinformatics 2021, 19, 629-640. https://doi.org/10.1016/j.gpb.2021.08.005. [CrossRef]
- Pook, T.; Mayer, M.; Geibel, J.; Weigend, S.; Cavero, D.; Schoen, C.C.; Simianer, H. Improving Imputation Quality in BEAGLE for Crop and Livestock Data. G3 (Bethesda) 2020, 10, 177-188. https://doi.org/10.1534/g3.119.400798. [CrossRef]
- Teslovich, T.; Musunuru, K.; Smith, A.; Edmondson, A.; Stylianou, I.; Koseki, M.; Pirruccello, J.; Ripatti, S.; Chasman, D.; Willer, C.; et al. Biological, Clinical, and Population Relevance of 95 Loci for Blood Lipids. Nature 2010, 466, 707-713. https://doi.org/10.1038/nature09270. [CrossRef]
- Yin, L.; Zhang, H.; Tang, Z.; Yin, D.; Fu, Y.; Yuan, X.; Li, X.; Liu, X.-L.; Zhao, S. HIBLUP: an integration of statistical models on the BLUP framework for efficient genetic evaluation using big genomic data. Nucleic Acids Research 2023, 51. https://doi.org/10.1093/nar/gkad074. [CrossRef]
- Raudvere, U.; Kolberg, L.; Kuzmin, I.; Arak, T.; Adler, P.; Peterson, H.; Vilo, J. g:Profiler: a web server for functional enrichment analysis and conversions of gene lists (2019 update). Nucleic acids research 2019, 47. https://doi.org/10.1093/nar/gkz369. [CrossRef]
- Chang, C.C.; Chow, C.C.; Tellier, L.C.; Vattikuti, S.; Purcell, S.M.; Lee, J.J. Second-generation PLINK: rising to the challenge of larger and richer datasets. Gigascience 2015, 4, 7. https://doi.org/10.1186/s13742-015-0047-8. [CrossRef]
- Huang, M.; Liu, X.; Zhou, Y.; Summers, R.M.; Zhang, Z. BLINK: a package for the next level of genome-wide association studies with both individuals and markers in the millions. Gigascience 2019, 8. https://doi.org/10.1093/gigascience/giy154. [CrossRef]
- Crespo-Piazuelo, D.; Criado-Mesas, L.; Revilla, M.; Castello, A.; Noguera, J.L.; Fernandez, A.I.; Ballester, M.; Folch, J.M. Identification of strong candidate genes for backfat and intramuscular fatty acid composition in three crosses based on the Iberian pig. Sci Rep 2020, 10, 13962. https://doi.org/10.1038/s41598-020-70894-2. [CrossRef]
- Jiang, Q.; Li, C.; Yu, Y.; Xing, Y.; Xiao, D.; Zhang, B. Comparison of fatty acid profile of three adipose tissues in Ningxiang pigs. Anim Nutr 2018, 4, 256-259. https://doi.org/10.1016/j.aninu.2018.05.006. [CrossRef]
- Zhang, W.; Zhang, J.; Cui, L.; Ma, J.; Chen, C.; Ai, H.; Xie, X.; Li, L.; Xiao, S.; Huang, L.; et al. Genetic architecture of fatty acid composition in the longissimus dorsi muscle revealed by genome-wide association studies on diverse pig populations. Genet Sel Evol 2016, 48, 5. https://doi.org/10.1186/s12711-016-0184-2. [CrossRef]
- Popova, T.; Givko, N. Fatty acid profile of the backfat layers in four pig breeds. Food Science and Applied Biotechnology 2019, 2, 24. https://doi.org/10.30721/fsab2019.v2.i1.66. [CrossRef]
- Lee, J.B.; Kang, Y.J.; Kim, S.G.; Woo, J.H.; Shin, M.C.; Park, N.G.; Yang, B.C.; Han, S.H.; Han, K.M.; Lim, H.T.; et al. GWAS and Post-GWAS High-Resolution Mapping Analyses Identify Strong Novel Candidate Genes Influencing the Fatty Acid Composition of the Longissimus dorsi Muscle in Pigs. Genes 2021, 12. https://doi.org/10.3390/genes12091323. [CrossRef]
- Xing, Y.; Wu, X.; Xie, C.; Xiao, D.; Zhang, B. Meat Quality and Fatty Acid Profiles of Chinese Ningxiang Pigs Following Supplementation with N-Carbamylglutamate. Animals : an open access journal from MDPI 2020, 10. https://doi.org/10.3390/ani10010088. [CrossRef]
- Xing, Y.; Yu, Y.; Xie, C.; Wu, X.; Xiao, D.; Yang, Z.; Zhang, B. Effect of Linseed Oil on Long Chain Fatty Acid Profile of Different Tissues in Ningxiang Pigs. Chinese Journal of Animal Nutrition 2020, 32, 2567-2574. https://doi.org/10.3969/j.issn.1006-267x.2020.06.016. [CrossRef]
- Zhu, B.; Niu, H.; Zhang, W.; Wang, Z.; Liang, Y.; Guan, L.; Guo, P.; Chen, Y.; Zhang, L.; Guo, Y.; et al. Genome wide association study and genomic prediction for fatty acid composition in Chinese Simmental beef cattle using high density SNP array. BMC Genomics 2017, 18, 464. https://doi.org/10.1186/s12864-017-3847-7. [CrossRef]
- Yang, B.; Zhang, W.; Zhang, Z.; Fan, Y.; Xie, X.; Ai, H.; Ma, J.; Xiao, S.; Huang, L.; Ren, J. Genome-wide association analyses for fatty acid composition in porcine muscle and abdominal fat tissues. PloS one 2013, 8, e65554. https://doi.org/10.1371/journal.pone.0065554. [CrossRef]
- Demets, R.; Gheysen, L.; Van Loey, A.; Foubert, I. Antioxidative capacity of microalgal carotenoids for stabilizing n-3LC-PUFA rich oil: Initial quantity is key. Food Chem 2023, 406, 135044. https://doi.org/10.1016/j.foodchem.2022.135044. [CrossRef]
- Wang, L.; Nong, Q.; Zhou, Y.; Sun, Y.; Chen, W.; Xie, J.; Zhu, X.; Shan, T. Changes in Serum Fatty Acid Composition and Metabolome-Microbiome Responses of Heigai Pigs Induced by Dietary N-6/n-3 Polyunsaturated Fatty Acid Ratio. Front Microbiol 2022, 13, 917558. https://doi.org/10.3389/fmicb.2022.917558. [CrossRef]
- Wang, L.; Zhang, S.; Huang, Y.; You, W.; Zhou, Y.; Chen, W.; Sun, Y.; Yi, W.; Sun, H.; Xie, J.; et al. CLA improves the lipo-nutritional quality of pork and regulates the gut microbiota in Heigai pigs. Food Funct 2022, 13, 12093-12104. https://doi.org/10.1039/d2fo02549c. [CrossRef]
- Mayer, C.; Côme, M.; Ulmann, L.; Martin, I.; Zittelli, G.C.; Faraloni, C.; Ouguerram, K.; Chénais, B.; Mimouni, V. The Potential of the Marine Microalga Diacronema lutheri in the Prevention of Obesity and Metabolic Syndrome in High-Fat-Fed Wistar Rats. Molecules 2022, 27. https://doi.org/10.3390/molecules27134246. [CrossRef]
- Calder, P.C. Very long-chain n-3 fatty acids and human health: fact, fiction and the future. Proceedings of the Nutrition Society 2018, 77, 52-72. https://doi.org/10.1017/S0029665117003950. [CrossRef]
- Nong, Q.; Wang, L.; Zhou, Y.; Sun, Y.; Chen, W.; Xie, J.; Zhu, X.; Shan, T. Low Dietary n-6/n-3 PUFA Ratio Regulates Meat Quality, Reduces Triglyceride Content, and Improves Fatty Acid Composition of Meat in Heigai Pigs. Animals : an open access journal from MDPI 2020, 10. https://doi.org/10.3390/ani10091543. [CrossRef]
- Waszkiewicz-Robak, B.; Szterk, A.; Rogalski, M.; Rambuszek, M.; Kruk, M.; Rokowska, E. Nutritional value of raw pork depending on the fat type contents in pigs feed. Acta Sci Pol Technol Aliment 2015, 14, 153-163. https://doi.org/10.17306/j.Afs.2015.2.17. [CrossRef]
- Xie, L.; Qin, J.; Rao, L.; Tang, X.; Cui, D.; Chen, L.; Xu, W.; Xiao, S.; Zhang, Z.; Huang, L. Accurate prediction and genome-wide association analysis of digital intramuscular fat content in longissimus muscle of pigs. Anim Genet 2021, 52, 633-644. https://doi.org/10.1111/age.13121. [CrossRef]
- Zhang, J.; Zhang, Y.; Gong, H.; Cui, L.; Huang, T.; Ai, H.; Ren, J.; Huang, L.; Yang, B. Genetic mapping using 1.4M SNP array refined loci for fatty acid composition traits in Chinese Erhualian and Bamaxiang pigs. J Anim Breed Genet 2017, 134, 472-483. https://doi.org/10.1111/jbg.12297. [CrossRef]
- Zhang, Z.; Zhang, Z.; Oyelami, F.O.; Sun, H.; Xu, Z.; Ma, P.; Wang, Q.; Pan, Y. Identification of genes related to intramuscular fat independent of backfat thickness in Duroc pigs using single-step genome-wide association. Anim Genet 2021, 52, 108-113. https://doi.org/10.1111/age.13012. [CrossRef]
- Gol, S.; Pena, R.N.; Rothschild, M.F.; Tor, M.; Estany, J. A polymorphism in the fatty acid desaturase-2 gene is associated with the arachidonic acid metabolism in pigs. Sci Rep 2018, 8, 14336. https://doi.org/10.1038/s41598-018-32710-w. [CrossRef]
- Criado-Mesas, L.; Ballester, M.; Crespo-Piazuelo, D.; Castello, A.; Benitez, R.; Fernandez, A.I.; Folch, J.M. Analysis of porcine IGF2 gene expression in adipose tissue and its effect on fatty acid composition. PloS one 2019, 14, e0220708. https://doi.org/10.1371/journal.pone.0220708. [CrossRef]
- Realini, C.E.; Pavan, E.; Purchas, R.W.; Agnew, M.; Johnson, P.L.; Bermingham, E.N.; Moon, C.D. Relationships between intramuscular fat percentage and fatty acid composition in M. longissimus lumborum of pasture-finished lambs in New Zealand. Meat Sci 2021, 181, 108618. https://doi.org/10.1016/j.meatsci.2021.108618. [CrossRef]
- Li, B.; Yang, J.; He, J.; Gong, Y.; Xiao, Y.; Zeng, Q.; Xu, K.; Duan, Y.; He, J.; Ma, H. Spatiotemporal Regulation and Functional Analysis of Circular RNAs in Skeletal Muscle and Subcutaneous Fat during Pig Growth. Biology 2021, 10. https://doi.org/10.3390/biology10090841. [CrossRef]
- Mi, L.; Zhao, X.Y.; Li, S.; Yang, G.; Lin, J.D. Conserved function of the long noncoding RNA Blnc1 in brown adipocyte differentiation. Molecular metabolism 2017, 6, 101-110. https://doi.org/10.1016/j.molmet.2016.10.010. [CrossRef]
- Shen, X.; Zhang, Y.; Ji, X.; Li, B.; Wang, Y.; Huang, Y.; Zhang, X.; Yu, J.; Zou, R.; Qin, D.; et al. Long Noncoding RNA lncRHL Regulates Hepatic VLDL Secretion by Modulating hnRNPU/BMAL1/MTTP Axis. Diabetes 2022, 71, 1915-1928. https://doi.org/10.2337/db21-1145. [CrossRef]
- Zayed, M.A.; Jin, X.; Yang, C.; Belaygorod, L.; Engel, C.; Desai, K.; Harroun, N.; Saffaf, O.; Patterson, B.W.; Hsu, F.F.; et al. CEPT1-Mediated Phospholipogenesis Regulates Endothelial Cell Function and Ischemia-Induced Angiogenesis Through PPARα. Diabetes 2021, 70, 549-561. https://doi.org/10.2337/db20-0635. [CrossRef]
- Lan, Q.; Liufu, S.; Liu, X.; Ai, N.; Xu, X.; Li, X.; Yu, Z.; Yin, Y.; Liu, M.; Ma, H. Comprehensive analysis of transcriptomic and metabolomic profiles uncovered the age-induced dynamic development pattern of subcutaneous fat in Ningxiang pig. Gene 2023, 880, 147624. https://doi.org/10.1016/j.gene.2023.147624. [CrossRef]
- Ningning, B. Research of Experssion of DPT and HTRA1 in Adipose tissue remodeling. Master, Shanghai Jiaotong University, 2018.
- Strakovsky, R.S.; Pan, Y.X. A decrease in DKK1, a WNT inhibitor, contributes to placental lipid accumulation in an obesity-prone rat model. Biology of reproduction 2012, 86, 81. https://doi.org/10.1095/biolreprod.111.094482. [CrossRef]
- Yang, Z.; Huang, X.; Zhang, J.; You, K.; Xiong, Y.; Fang, J.; Getachew, A.; Cheng, Z.; Yu, X.; Wang, Y.; et al. Hepatic DKK1-driven steatosis is CD36 dependent. Life science alliance 2023, 6. https://doi.org/10.26508/lsa.202201665. [CrossRef]
- Zhang, W.; Li, X.; Jiang, Y.; Zhou, M.; Liu, L.; Su, S.; Xu, C.; Li, X.; Wang, C. Genetic architecture and selection of Anhui autochthonous pig population revealed by whole genome resequencing. Frontiers in genetics 2022, 13, 1022261. https://doi.org/10.3389/fgene.2022.1022261. [CrossRef]
- Li, C.; Sun, D.; Zhang, S.; Wang, S.; Wu, X.; Zhang, Q.; Liu, L.; Li, Y.; Qiao, L. Genome wide association study identifies 20 novel promising genes associated with milk fatty acid traits in Chinese Holstein. PloS one 2014, 9, e96186. https://doi.org/10.1371/journal.pone.0096186. [CrossRef]
- Revilla, M.; Puig-Oliveras, A.; Castelló, A.; Crespo-Piazuelo, D.; Paludo, E.; Fernández, A.I.; Ballester, M.; Folch, J.M. A global analysis of CNVs in swine using whole genome sequence data and association analysis with fatty acid composition and growth traits. PloS one 2017, 12, e0177014. https://doi.org/10.1371/journal.pone.0177014. [CrossRef]
- Shi, L.; Lv, X.; Liu, L.; Yang, Y.; Ma, Z.; Han, B.; Sun, D. A post-GWAS confirming effects of PRKG1 gene on milk fatty acids in a Chinese Holstein dairy population. BMC Genet 2019, 20, 53. https://doi.org/10.1186/s12863-019-0755-7. [CrossRef]
- Pedrosa, V.B.; Schenkel, F.S.; Chen, S.Y.; Oliveira, H.R.; Casey, T.M.; Melka, M.G.; Brito, L.F. Genomewide Association Analyses of Lactation Persistency and Milk Production Traits in Holstein Cattle Based on Imputed Whole-Genome Sequence Data. Genes 2021, 12. https://doi.org/10.3390/genes12111830. [CrossRef]
- Xu, Z.; Wu, J.; Zhou, J.; Zhang, Y.; Qiao, M.; Sun, H.; Li, Z.; Li, L.; Chen, N.; Oyelami, F.O.; et al. Integration of ATAC-seq and RNA-seq analysis identifies key genes affecting intramuscular fat content in pigs. Frontiers in nutrition 2022, 9, 1016956. https://doi.org/10.3389/fnut.2022.1016956. [CrossRef]
- Ren, H.; Xiao, W.; Qin, X.; Cai, G.; Chen, H.; Hua, Z.; Cheng, C.; Li, X.; Hua, W.; Xiao, H.; et al. Myostatin regulates fatty acid desaturation and fat deposition through MEF2C/miR222/SCD5 cascade in pigs. Communications biology 2020, 3, 612. https://doi.org/10.1038/s42003-020-01348-8. [CrossRef]
- Shinjo, T.; Iwashita, M.; Yamashita, A.; Sano, T.; Tsuruta, M.; Matsunaga, H.; Sanui, T.; Asano, T.; Nishimura, F. IL-17A synergistically enhances TNFα-induced IL-6 and CCL20 production in 3T3-L1 adipocytes. Biochemical and biophysical research communications 2016, 477, 241-246. https://doi.org/10.1016/j.bbrc.2016.06.049. [CrossRef]
- Chen, H.J.; Yan, X.Y.; Sun, A.; Zhang, L.; Zhang, J.; Yan, Y.E. High-Fat-Diet-Induced Extracellular Matrix Deposition Regulates Integrin-FAK Signals in Adipose Tissue to Promote Obesity. Molecular nutrition & food research 2022, 66, e2101088. https://doi.org/10.1002/mnfr.202101088. [CrossRef]
- Williams, A.S.; Kang, L.; Zheng, J.; Grueter, C.; Bracy, D.P.; James, F.D.; Pozzi, A.; Wasserman, D.H. Integrin α1-null mice exhibit improved fatty liver when fed a high fat diet despite severe hepatic insulin resistance. The Journal of biological chemistry 2015, 290, 6546-6557. https://doi.org/10.1074/jbc.M114.615716. [CrossRef]
- Wu, Y.; Sun, H.; Song, F.; Huang, C.; Wang, J. Deletion of Alox5 gene decreases osteogenic differentiation but increases adipogenic differentiation of mouse induced pluripotent stem cells. Cell and tissue research 2014, 358, 135-147. https://doi.org/10.1007/s00441-014-1920-y. [CrossRef]
- Zhang, Z.; Feng, A.C.; Salisbury, D.; Liu, X.; Wu, X.; Kim, J.; Lapina, I.; Wang, D.; Lee, B.; Fraga, J.; et al. Collaborative interactions of heterogenous ribonucleoproteins contribute to transcriptional regulation of sterol metabolism in mice. Nature communications 2020, 11, 984. https://doi.org/10.1038/s41467-020-14711-4. [CrossRef]
- Zhao, M.; Shen, L.; Ouyang, Z.; Li, M.; Deng, G.; Yang, C.; Zheng, W.; Kong, L.; Wu, X.; Wu, X.; et al. Loss of hnRNP A1 in murine skeletal muscle exacerbates high-fat diet-induced onset of insulin resistance and hepatic steatosis. Journal of molecular cell biology 2020, 12, 277-290. https://doi.org/10.1093/jmcb/mjz050. [CrossRef]
- Hitachi, K.; Kiyofuji, Y.; Nakatani, M.; Tsuchida, K. Myoparr-Associated and -Independent Multiple Roles of Heterogeneous Nuclear Ribonucleoprotein K during Skeletal Muscle Cell Differentiation. International journal of molecular sciences 2021, 23. https://doi.org/10.3390/ijms23010108. [CrossRef]
- Bag, S.; Ramaiah, S.; Anbarasu, A. fabp4 is central to eight obesity associated genes: a functional gene network-based polymorphic study. Journal of theoretical biology 2015, 364, 344-354. https://doi.org/10.1016/j.jtbi.2014.09.034. [CrossRef]
- Wang, S.; Cao, Q.; Cui, X.; Jing, J.; Li, F.; Shi, H.; Xue, B.; Shi, H. Dnmt3b Deficiency in Myf5(+)-Brown Fat Precursor Cells Promotes Obesity in Female Mice. Biomolecules 2021, 11. https://doi.org/10.3390/biom11081087. [CrossRef]
- Sun, Q.Q.; Zhu, H.; Tang, H.Y.; Liu, Y.Y.; Chen, Y.Y.; Wang, S.; Qin, Y.; Gan, H.T.; Wang, S. RNA analysis of diet-induced sarcopenic obesity in rats. Archives of gerontology and geriatrics 2023, 108, 104920. https://doi.org/10.1016/j.archger.2022.104920. [CrossRef]
- Elias, I.; Ferré, T.; Vilà, L.; Muñoz, S.; Casellas, A.; Garcia, M.; Molas, M.; Agudo, J.; Roca, C.; Ruberte, J.; et al. ALOX5AP Overexpression in Adipose Tissue Leads to LXA4 Production and Protection Against Diet-Induced Obesity and Insulin Resistance. Diabetes 2016, 65, 2139-2150. https://doi.org/10.2337/db16-0040. [CrossRef]
- Walker, M.E.; Matthan, N.R.; Goldbaum, A.; Meng, H.; Lamon-Fava, S.; Lakshman, S.; Jang, S.; Molokin, A.; Solano-Aguilar, G.; Urban, J.F., Jr.; et al. Dietary patterns influence epicardial adipose tissue fatty acid composition and inflammatory gene expression in the Ossabaw pig. The Journal of nutritional biochemistry 2019, 70, 138-146. https://doi.org/10.1016/j.jnutbio.2019.04.013. [CrossRef]
- Li, H.; Heilbronn, L.K.; Hu, D.; Poynten, A.M.; Blackburn, M.A.; Shirkhedkar, D.P.; Kaplan, W.H.; Kriketos, A.D.; Ye, J.; Chisholm, D.J. Islet-1: a potentially important role for an islet cell gene in visceral fat. Obesity (Silver Spring, Md.) 2008, 16, 356-362. https://doi.org/10.1038/oby.2007.76. [CrossRef]
- Singh Ahuja, H.; Liu, S.; Crombie, D.L.; Boehm, M.; Leibowitz, M.D.; Heyman, R.A.; Depre, C.; Nagy, L.; Tontonoz, P.; Davies, P.J. Differential effects of rexinoids and thiazolidinediones on metabolic gene expression in diabetic rodents. Molecular pharmacology 2001, 59, 765-773. https://doi.org/10.1124/mol.59.4.765. [CrossRef]
- Griebel, G.; Ravinet-Trillou, C.; Beeské, S.; Avenet, P.; Pichat, P. Mice deficient in cryptochrome 1 (cry1 (-/-)) exhibit resistance to obesity induced by a high-fat diet. Frontiers in endocrinology 2014, 5, 49. https://doi.org/10.3389/fendo.2014.00049. [CrossRef]
- Choi, W.J.; Jin, H.S.; Kim, S.S.; Shin, D. Dietary Protein and Fat Intake Affects Diabetes Risk with CDKAL1 Genetic Variants in Korean Adults. International journal of molecular sciences 2020, 21. https://doi.org/10.3390/ijms21165607. [CrossRef]
- Zhu, J.; Xu, D.; Yang, R.; Liu, M.; Liu, Y. The triglyceride glucose index and CDKAL1 gene rs10946398 SNP are associated with NAFLD in Chinese adults. Minerva endocrinology 2023, 48, 51-58. https://doi.org/10.23736/s2724-6507.20.03273-3. [CrossRef]
- Gozalo-Marcilla, M.; Buntjer, J.; Johnsson, M.; Batista, L.; Diez, F.; Werner, C.R.; Chen, C.Y.; Gorjanc, G.; Mellanby, R.J.; Hickey, J.M.; et al. Genetic architecture and major genes for backfat thickness in pig lines of diverse genetic backgrounds. Genet Sel Evol 2021, 53, 76. https://doi.org/10.1186/s12711-021-00671-w. [CrossRef]
- Pena, R.N.; Noguera, J.L.; García-Santana, M.J.; González, E.; Tejeda, J.F.; Ros-Freixedes, R.; Ibáñez-Escriche, N. Five genomic regions have a major impact on fat composition in Iberian pigs. Sci Rep 2019, 9, 2031. https://doi.org/10.1038/s41598-019-38622-7. [CrossRef]
- Sun, S.; Zhou, L.; Yu, Y.; Zhang, T.; Wang, M. Knocking down clock control gene CRY1 decreases adipogenesis via canonical Wnt/β-catenin signaling pathway. Biochemical and biophysical research communications 2018, 506, 746-753. https://doi.org/10.1016/j.bbrc.2018.10.134. [CrossRef]
- Toledo, M.; Batista-Gonzalez, A.; Merheb, E.; Aoun, M.L.; Tarabra, E.; Feng, D.; Sarparanta, J.; Merlo, P.; Botrè, F.; Schwartz, G.J.; et al. Autophagy Regulates the Liver Clock and Glucose Metabolism by Degrading CRY1. Cell metabolism 2018, 28, 268-281.e264. https://doi.org/10.1016/j.cmet.2018.05.023. [CrossRef]
- Sardon Puig, L.; Pillon, N.J.; Näslund, E.; Krook, A.; Zierath, J.R. Influence of obesity, weight loss, and free fatty acids on skeletal muscle clock gene expression. American journal of physiology. Endocrinology and metabolism 2020, 318, E1-e10. https://doi.org/10.1152/ajpendo.00289.2019. [CrossRef]
- Wei, H.; Lin, X.; Liu, L.; Peng, X. Flaxseed Polysaccharide Alters Colonic Gene Expression of Lipid Metabolism and Energy Metabolism in Obese Rats. Foods (Basel, Switzerland) 2022, 11. https://doi.org/10.3390/foods11131991. [CrossRef]
- Wang, Y.; Liu, L.; Liu, X.; Tan, X.; Zhu, Y.; Luo, N.; Zhao, G.; Cui, H.; Wen, J. SLC16A7 Promotes Triglyceride Deposition by De Novo Lipogenesis in Chicken Muscle Tissue. Biology 2022, 11. https://doi.org/10.3390/biology11111547. [CrossRef]
- Zhang, J.L.; Du, B.B.; Zhang, D.H.; Li, H.; Kong, L.Y.; Fan, G.J.; Li, Y.P.; Li, P.C.; Liang, C.; Wang, Z.; et al. OTUB1 alleviates NASH through inhibition of the TRAF6-ASK1 signaling pathways. Hepatology (Baltimore, Md.) 2022, 75, 1218-1234. https://doi.org/10.1002/hep.32179. [CrossRef]
- Conn, C.S.; Yang, H.; Tom, H.J.; Ikeda, K.; Oses-Prieto, J.A.; Vu, H.; Oguri, Y.; Nair, S.; Gill, R.M.; Kajimura, S.; et al. The major cap-binding protein eIF4E regulates lipid homeostasis and diet-induced obesity. Nature metabolism 2021, 3, 244-257. https://doi.org/10.1038/s42255-021-00349-z. [CrossRef]
- Mohammadi, H.; Farahani, A.H.K.; Moradi, M.H.; Mastrangelo, S.; Di Gerlando, R.; Sardina, M.T.; Scatassa, M.L.; Portolano, B.; Tolone, M. Weighted Single-Step Genome-Wide Association Study Uncovers Known and Novel Candidate Genomic Regions for Milk Production Traits and Somatic Cell Score in Valle del Belice Dairy Sheep. Animals : an open access journal from MDPI 2022, 12. https://doi.org/10.3390/ani12091155. [CrossRef]
- Laursen, K.B.; Chen, Q.; Khani, F.; Attarwala, N.; Gross, S.S.; Dow, L.; Nanus, D.M.; Gudas, L.J. Mitochondrial Ndufa4l2 Enhances Deposition of Lipids and Expression of Ca9 in the TRACK Model of Early Clear Cell Renal Cell Carcinoma. Frontiers in oncology 2021, 11, 783856. https://doi.org/10.3389/fonc.2021.783856. [CrossRef]
- Deng, S.; Zhao, Q.; Zhen, L.; Zhang, C.; Liu, C.; Wang, G.; Zhang, L.; Bao, L.; Lu, Y.; Meng, L.; et al. Neonatal Heart-Enriched miR-708 Promotes Proliferation and Stress Resistance of Cardiomyocytes in Rodents. Theranostics 2017, 7, 1953-1965. https://doi.org/10.7150/thno.16478. [CrossRef]

| Fatty acid | N | Relative Content (± Sd) (%) | h2 (± Sd) |
|---|---|---|---|
| IMF (Intramuscular Fat) |
691 | 3.65 (± 1.00) | 0.72 (± 0.02) |
|
SFA (Saturated fatty acid) |
691 | 39.35 (± 10.01) | 0.61 (± 0.04) |
| C14:0 (Myristic acid) |
649 | 1.42 (± 0.24) | 0.80 (± 0.03) |
| C16:0 (Palmitic acid) |
651 | 26.38 (± 1.46) | 0.76 (± 0.03) |
| C17:0 (Margaric acid) |
645 | 0.15 (± 0.03) | 0.45 (± 0.08) |
| C18:0 (Stearic acid) |
651 | 13.42 (± 1.62) | 0.89 (± 0.02) |
| C20:0 (Arachidic acid) |
649 | 0.21 (± 0.05) | 0.87 (± 0.04) |
|
MUFA (Monounsaturated fat acid) |
691 | 41.88 (± 10.92) | 0.84 (± 0.02) |
| C16:1 (Palmitoleic Acid) |
650 | 3.28 (± 1.03) | 0.87 (± 0.03) |
| C18:1n-9(t) (Elaidic Acid) |
627 | 0.11 (± 0.03) | 0.37 (± 0.09) |
| C18:1n-9(c) (Oleic acid) |
651 | 40.28 (± 3.13) | 0.74 (± 0.03) |
| C20:1 (Eicosenoic acid) |
650 | 0.80 (± 0.29) | 0.78 (± 0.03) |
| PUFA(Polyunsaturated fatty acid) | 691 | 12.78 (± 4.80) | 0.60 (± 0.03) |
| C18:2n-6(c) (Linoleic acid) |
651 | 10.12 (± 2.57) | 0.61 (± 0.03) |
| C18:3n-3 (α-Linolenic acid: ALA) |
572 | 0.36 (± 0.19) | 0.63 (± 0.08) |
| C20:2 (Eicosa-11,14-dienoic acid) |
649 | 0.33 (± 0.08) | 0.67 (± 0.05) |
| C20:3n-6 (Dihomo-γ-linolenic acid) |
647 | 0.38 (± 0.14) | 0.88 (± 0.03) |
| C20:4n-6 (Arachidonic acid) |
649 | 2.42 (± 1.00) | 0.55 (± 0.05) |
Disclaimer/Publisher’s Note: The statements, opinions and data contained in all publications are solely those of the individual author(s) and contributor(s) and not of MDPI and/or the editor(s). MDPI and/or the editor(s) disclaim responsibility for any injury to people or property resulting from any ideas, methods, instructions or products referred to in the content. |
© 2023 by the authors. Licensee MDPI, Basel, Switzerland. This article is an open access article distributed under the terms and conditions of the Creative Commons Attribution (CC BY) license (http://creativecommons.org/licenses/by/4.0/).


