1. Introduction
With the standardization promotion of in-vehicle Automatic Emergency Call Systems (AECS), in-vehicle emergency mobile communication has become an essential component of vehicle safety assurance. The testing and experimentation of AECS have also become important research directions in the field of Intelligent Connected Vehicles (ICV) [
1,
2]. In recent years, with the development of mobile communication technologies (2G~5G) and the capabilities of Global Navigation Satellite Systems (GNSS), the functionality of AECS has become increasingly comprehensive. Therefore, in order to assess the performance of AECS more comprehensively, it is necessary to conduct research on testing/methods and establish a robust performance evaluation system. The function of AECS is to acquire and transmit accurate vehicle location information after an accident, ensuring its trigger ability and compliance with international standards. The reliability of communication connections and the transmission of the Minimum Set of Data (MSD) are the focal points of system testing [
3]. However, during the transmission of MSD, the GNSS signals received by the positioning system are susceptible to interference and spoofing like in
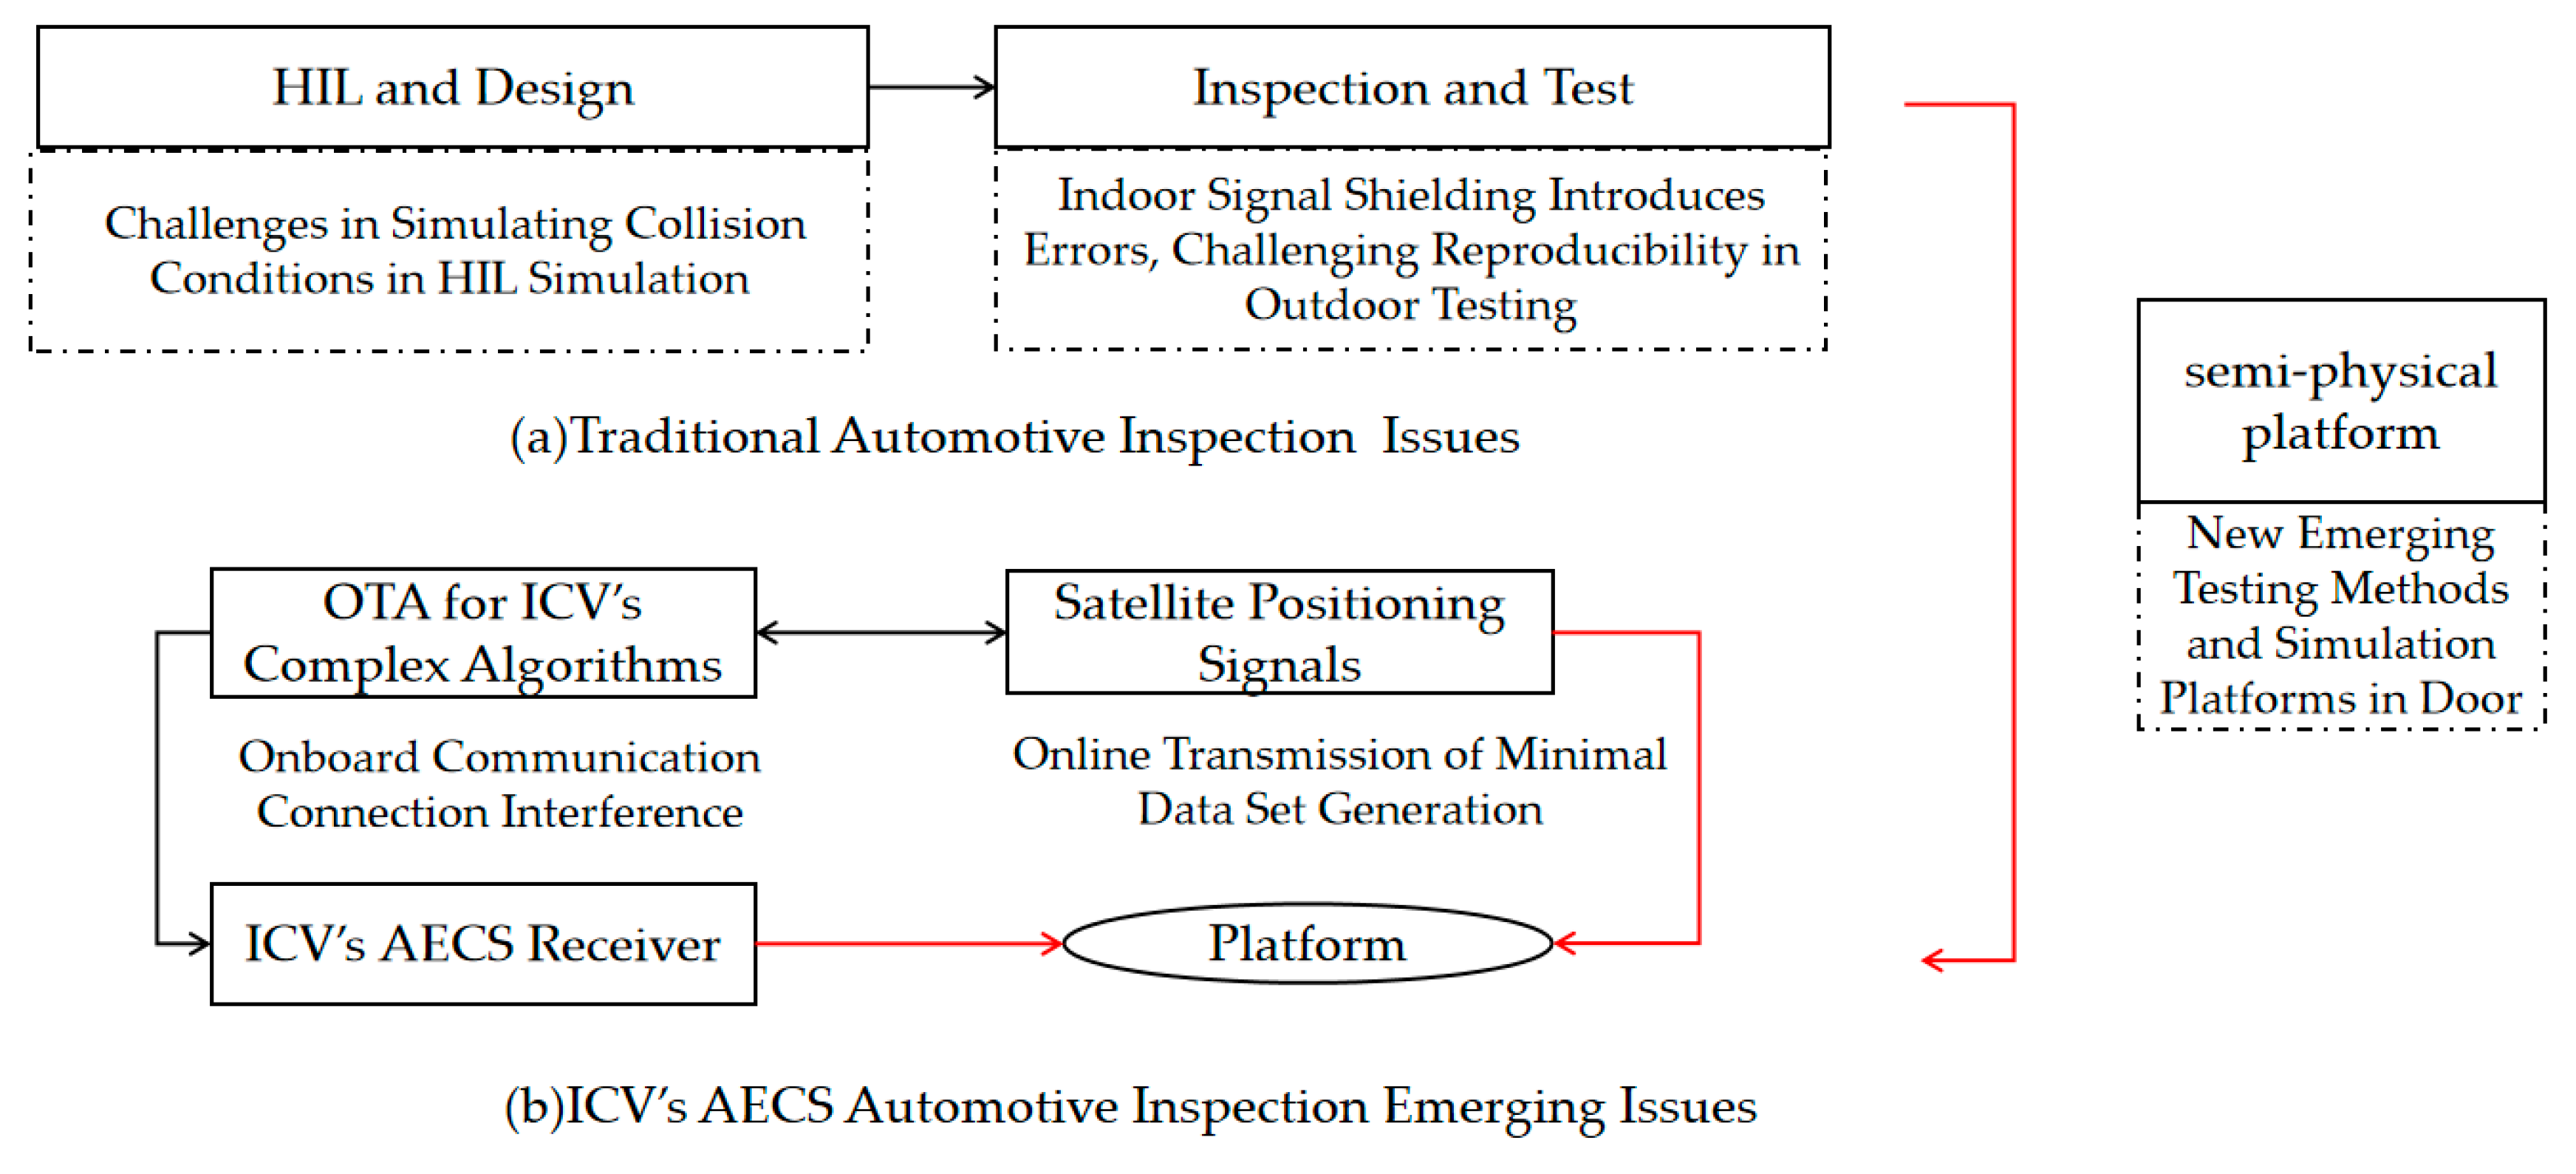
Figure 1 (b), the AECS-related testing for ICV’s test is compared to the traditional testing in (a) are establishment of communication connections is constrained by the accident environment. As a result, there is a significant gap between the actual AECS verification and certification and the system's performance under real accident conditions, further affecting the authenticity of the tests. Moreover, conducting complex real-vehicle tests presents challenges in ensuring reproducibility. Therefore, there is a need to integrate accident scenarios and communication transmission reliability in the research of AECS test and verification methods for ICV.
Nowadays, Intelligent Connected Vehicles (ICV) have made significant breakthroughs in system integration capabilities such as data exchange, positioning accuracy, and sensor utilization [
4,
5,
6]. On one hand, there have been improvements in the quantity and accuracy of data transmission, enabling the system to provide more comprehensive and accurate descriptions of emergency situations. On the other hand, the increased demand for system reliability arises from the sophisticated devices needed to understand accident scenarios and meet other requirements in both in-vehicle and cloud-based intelligent devices. With the upgrading of communication link establishment methods, countries are advancing the standardization of the next-generation ECALL system [
7]. In this context, ICV leverages advanced positioning and navigation technologies, such as Global Navigation Satellite Systems (GNSS), inertial navigation systems, and high-precision map data [
8,
9], to achieve more precise positioning and navigation capabilities. Studying the system's performance under various environmental conditions can help evaluate the adaptability and robustness of AECS. In exploring performance indicators for system positioning, most researchers focus on the impact of receiver and antenna performance and the errors generated by GNSS calculations [
10]. For example, Chen employed an extended Kalman filter and designed a GNSS positioning algorithm based on error states to improve vehicle positioning accuracy [
11]. However, during ICV AECS testis, real positioning information is simulated by generating positioning signals. Distortions in these signals may lead to failures in emergency call tests after collisions, rendering the assessment of positioning performance unreasonable and affecting the normal evaluation of ECALL receiver performance.
Currently, the common approach for studying the reliability of AECS involves comparing the data received and transmitted during simulated and real-vehicle collision tests with the laboratory coordinate position [
12]. The reliability of the tested vehicle's correct positioning is examined by verifying the transmission of the Minimum Set of Data (MSD) to the Public Safety Answering Point (PSAP) and establishing a reliable communication link [
13]. Although relying solely on data from real-vehicle collision tests can provide certain experimental results, it fails to comprehensively cover various emergency situations, and a single scenario cannot simulate other emergency events. Testing based solely on PSAP and communication link establishment cannot comprehensively assess the overall performance of in-vehicle AECS, making it difficult to obtain key indicators such as response time, system reliability, and positioning accuracy. This poses challenges for conducting AECS inspections and evaluations.
AECS is directly related to vehicle collision conditions, and research on vehicle collisions includes real-vehicle experiments, collision numerical simulations, collision strategies, and vehicle navigation rules. The establishment of collision models primarily focuses on numerical simulation and data analysis. Yin conducted simulation tests using a control strategy that considers distance and acceleration compensation to study the collision safety distance model and provide collision patterns for different parameters [
14]. Sun used deep reinforcement learning to construct a vehicle collision risk assessment model and updated strategies in a partially observable training environment to predict collision conditions [
15]. However, vehicle collision research involves complex traffic environments and driving decision-making in various scenarios. Numerical simulation methods face challenges in acquiring annotated data, relying on incorrect domain knowledge, and being limited by data quality issues. Therefore, some scholars have started to establish simulation platforms for Intelligent Connected Vehicles [
13,
16,
17]. These platforms utilize embedded systems, real-time decision-making platforms, control strategies [
18], vehicle dynamics, and address data acquisition challenges for special conditions while also addressing emergency communication [
19].
Furthermore, conducting collision tests on intelligent connected vehicles is costly and the control process is variable, which limits their application in large-scale testing and evaluation. It becomes challenging to comprehensively test and simulate the system, as well as simulate various emergency situations and evaluate the system's responsiveness in different scenarios. In this regard, in-vehicle simulation provides a solution by rapidly establishing virtual collision scenarios, flexibly adjusting collision parameters, and facilitating the creation of complex models in conjunction with physical components. Wang proposed a general model considering the cooperative interaction between humans, vehicles, and the road environment, and used this model to study vehicle collision warning algorithms [
20]. Some researchers have focused on studying the factors affecting the vehicle operating environment. Rana, Shohel established a monitoring system based on road surface vibration characterized by roughness parameters, using vehicle dynamics and parameter estimation methods to build a data acquisition platform [
21]. On the other hand, in terms of collision data research, Novat Norris employed machine learning methods based on Bayesian inference to statistically analyze field data of collisions involving autonomous vehicles [
22]. Chen, on the other hand, developed a collision prediction model using a GA-optimized neural network, with six parameters related to collisions selected as inputs to predict collision severity. The model also accounted for the impact of vehicle-to-vehicle communication [
23]. However, there are few comprehensive studies that combine environmental factors with the transmission of positioning information in AECS. Therefore, by leveraging the characteristics of in-vehicle simulation, a semi-physical simulation system can be established to simulate various environmental conditions realistically while ensuring stable triggering of the vehicle. This approach can harness the advantages of simulating collisions and software simulations, generate random or specific positioning information through the simulation of the Global Navigation Satellite System (GNSS) [
24,
25,
26], and address the challenges of real-vehicle and multi-scenario testing [
27].
This paper primarily focuses on the research of AECS test methods based on satellite signal simulation. It aims to establish a semi-physical simulation platform for vehicle emergency calls. The system's phase noise is the main analysis object. The causes of phase noise are further analyzed, and experimental designs are employed for verification. The simulated experimental results are recorded and analyzed under different environmental conditions, such as temperature and vibration. The objective is to simulate the impact of various environmental parameters on signal propagation and reception. The research aims to assess the performance and reliability of AECS under different environmental conditions.
2. Causes and Simulation Modeling of System Errors
The AECS test significantly differs from traditional communication tests due to its incorporation of multiple factors of interference within a real-vehicle collision environment. These factors include environmental temperature, impact loads, and random loads. In the simulation testing platform, we comprise both bench tests and signal simulation components. The satellite signal simulation enables the system to replicate position signals under simulated real-vehicle collision conditions. These generated signals impact the performance of RF connectors and internal electronic components within the signal generation system, and they are susceptible to mechanical vibration and random vibration. The impact loads place stress on the local oscillator generator in the signal generation system, resulting in unstable short-term oscillator frequencies. Furthermore, the environmental temperature and accompanying thermal stress contribute to system instability. It is important to note that the influences arising from these testing conditions exhibit a linear correlation with time. [
28,
29].
When constructing an error model for satellite signal simulation and emulation systems, it is essential to consider various factors that contribute to system errors. These factors include frequency errors, time-base synchronization errors, phase errors of different components, clock errors, and power errors. Consequently, it becomes necessary to analyze the influence of the experimental environment on frequency and phase parameters.
2.1. Frequency Errors Generated by the Environment
In the investigation of error factors in satellite signal simulation and emulation systems, frequency error emerges as a crucial parameter. During real-vehicle collision tests, the impact load exhibits a non-linear effect on the crystal structure of the oscillators within the satellite signal generation system, thereby causing frequency fluctuations [
30]. The dominant frequency of the generated signal typically falls within a specific range. To characterize the influence of vehicle collision-induced vibrations on the system's frequency [
31], the upper limit of the frequency distribution and the maximum stress are examined. Moreover, the impact of stress on the crystal's frequency response in a single-degree-of-freedom system can be approximated as a linear or nearly-linear relationship between stress and frequency variation within the material. When an impact load is applied to the crystal material, the resulting stress induces load migration [
29], resulting in frequency fluctuations. The stress induced by the impact load can be mathematically represented as follows:
Where: k describing the relationship between stress and frequency deviation, v is stress Force applied by the impact load.
Quartz oscillators exhibit varied force-frequency effects, meaning that different oscillators may respond differently to external forces. The relationship between frequency fluctuations and external forces for oscillators exposed to impacts can be expressed as follows:
Where: Δfc: Frequency deviation; k: Force-frequency coefficient; f0: External force. The force-frequency coefficient, denoted as 'k', signifies the sensitivity of the oscillator to external forces. It quantifies the extent of frequency deviation caused by a specific external force.
The value of the force-frequency coefficient can differ based on the type and design of the oscillator. In the AECS test, collision tests are typically performed either on a test rig or a real vehicle using track traction, resulting in impacts and vibrations. Consequently, the testing system must account for the influence of random vibrations on satellite signal simulation. Referring to equations (1) and (2), the frequency error caused by vibrations on the generated signal can be expressed as follows:
where,
k1 and
k2 represent the factors that quantify the impact of random vibration amplitude and random variation, respectively. When the amplitude and variance of random vibrations increase, the frequency deviation of the components also increases. In other words, higher levels of random vibration amplitude and variation result in larger frequency offsets in the components.
2.2. Time-base Synchronization Error and Clock Error
Time-base synchronization error refers to the deviation between the internal clock of the signal generation system and the actual clock. When this error is significant, it can impact the timing relationship between the generated signal and the actual satellite signal, thus reducing the accuracy of signal generation. In applications like AECS, which require precise simulation of satellite signals, multiple test instruments with different clocks are often utilized. In such cases, time-base synchronization errors can introduce system errors. However, these errors are relatively minor and can be mitigated using software systems that are less susceptible to environmental factors. The clock source within the satellite signal simulation and emulation system itself may also exhibit stability issues. During equipment operation, if the inspection process is prolonged, slight variations in clock frequency may occur over time. Additionally, clock errors in subsystems can influence the time-base synchronization error. When analyzing environmental factors, it is important to minimize clock drift and mitigate the impact of time-base synchronization. The expression for the error in time-base synchronization can be represented as:
In the satellite simulation system, the actual synchronization error comprises clock offset and clock drift. and represent the time offsets of the receiver generator and vector signal generator, respectively. represents the frequency at the transmission end.
In AECS tests, various devices may be used in the simulation system, and each device can be considered as an independent subsystem within the simulation system. The clock error of subsystem is composed of an ideal clock signal and a clock error signal, and it can be expressed as:
The gain error coefficient, , represents the sensitivity of the subsystem i to clock errors and determines the magnitude of the impact on the clock error. The fixed clock offset, , represents the initial deviation of the clock from the ideal synchronization time. The clock drift,in(3)curse the gradual change in the , clock frequency over time.
The precise values of the gain error coefficient, fixed clock offset, and clock drift are determined by the clock accuracy of the devices employed in generating satellite signals within the AECS simulation system. To ensure accurate modeling, various sources of noise are considered in the error models, and the clock error analysis incorporates the clock accuracy of the simulation system utilized in AECS tests.2.1.3 System Output Power Error
2.3. System Output Power Error
System power loss refers to the energy loss of the generated signals during the transmission process due to factors such as circuit components and connectors, resulting in a decrease in output power. The presence of nonlinear components in the equipment can cause distortion and introduce errors in the output power. Under harsh testing conditions, thermal equilibrium of the generator can be disrupted, leading to temperature drift. Additionally, different test environment temperatures can result in linear offset errors in the output power, depending on the temperature coefficient of the components. The variation in system output power error due to temperature can be expressed as:
Where ΔP represents the change in system output power error, denotes the power temperature coefficient, Tout corresponds to the current temperature, and Tin represents the reference temperature. It is important to note that for linear components, the temperature coefficient remains constant regardless of any fluctuations in temperature.
Based on the above analysis, the performance of the satellite signal simulation system within the emergency call simulation and test platform is influenced by environmental conditions in three key aspects. Firstly, during collision tests, vibrations and impact forces can be transmitted to various components and RF connection lines of the signal simulation system, potentially causing positional shifts or damage, which, in turn, impacts the accuracy and stability of the signals generated. Secondly, variations in environmental temperature can result in changes in component performance, such as frequency drift and power fluctuations. Lastly, the structure of the satellite simulation system utilized in AECS tests needs to be determined during experiments, enabling the selection of an appropriate clock source for the simulation system and the implementation of software-based clock corrections to account for time deviations. Therefore, in the design and optimization of the simulation system, it is crucial to comprehensively consider the errors arising from vibration, impact, and temperature in the environment and accurately assess the impact of these factors on system performance. This approach facilitates improved accuracy and stability, allowing for more precise simulation of vehicle collision scenarios and evaluation of the performance of emergency call systems.2.2. Phase Noise Error Model Based on Power Density
3. Semi-Physical Simulation System for Post-Collision Emergency Call
Based on the analysis in the previous section, environmental factors have an impact on system errors, resulting in frequency fluctuations and unstable signal frequencies, which in turn lead to phase noise. Therefore, phase noise serves as an indicator of frequency stability, and by measuring phase noise in a semi-physical simulation system, the quality of signal generation can be analyzed and evaluated.
3.1. Phase Noise Error Model Based on Power Density
Given that phase noise is an important metric for assessing frequency [
32], it is selected as the parameter to represent the frequency of the simulation model system in the emergency call simulation platform. Consequently, the phase noise error of the satellite signal generation system within the semi-physical simulation platform is modeled.
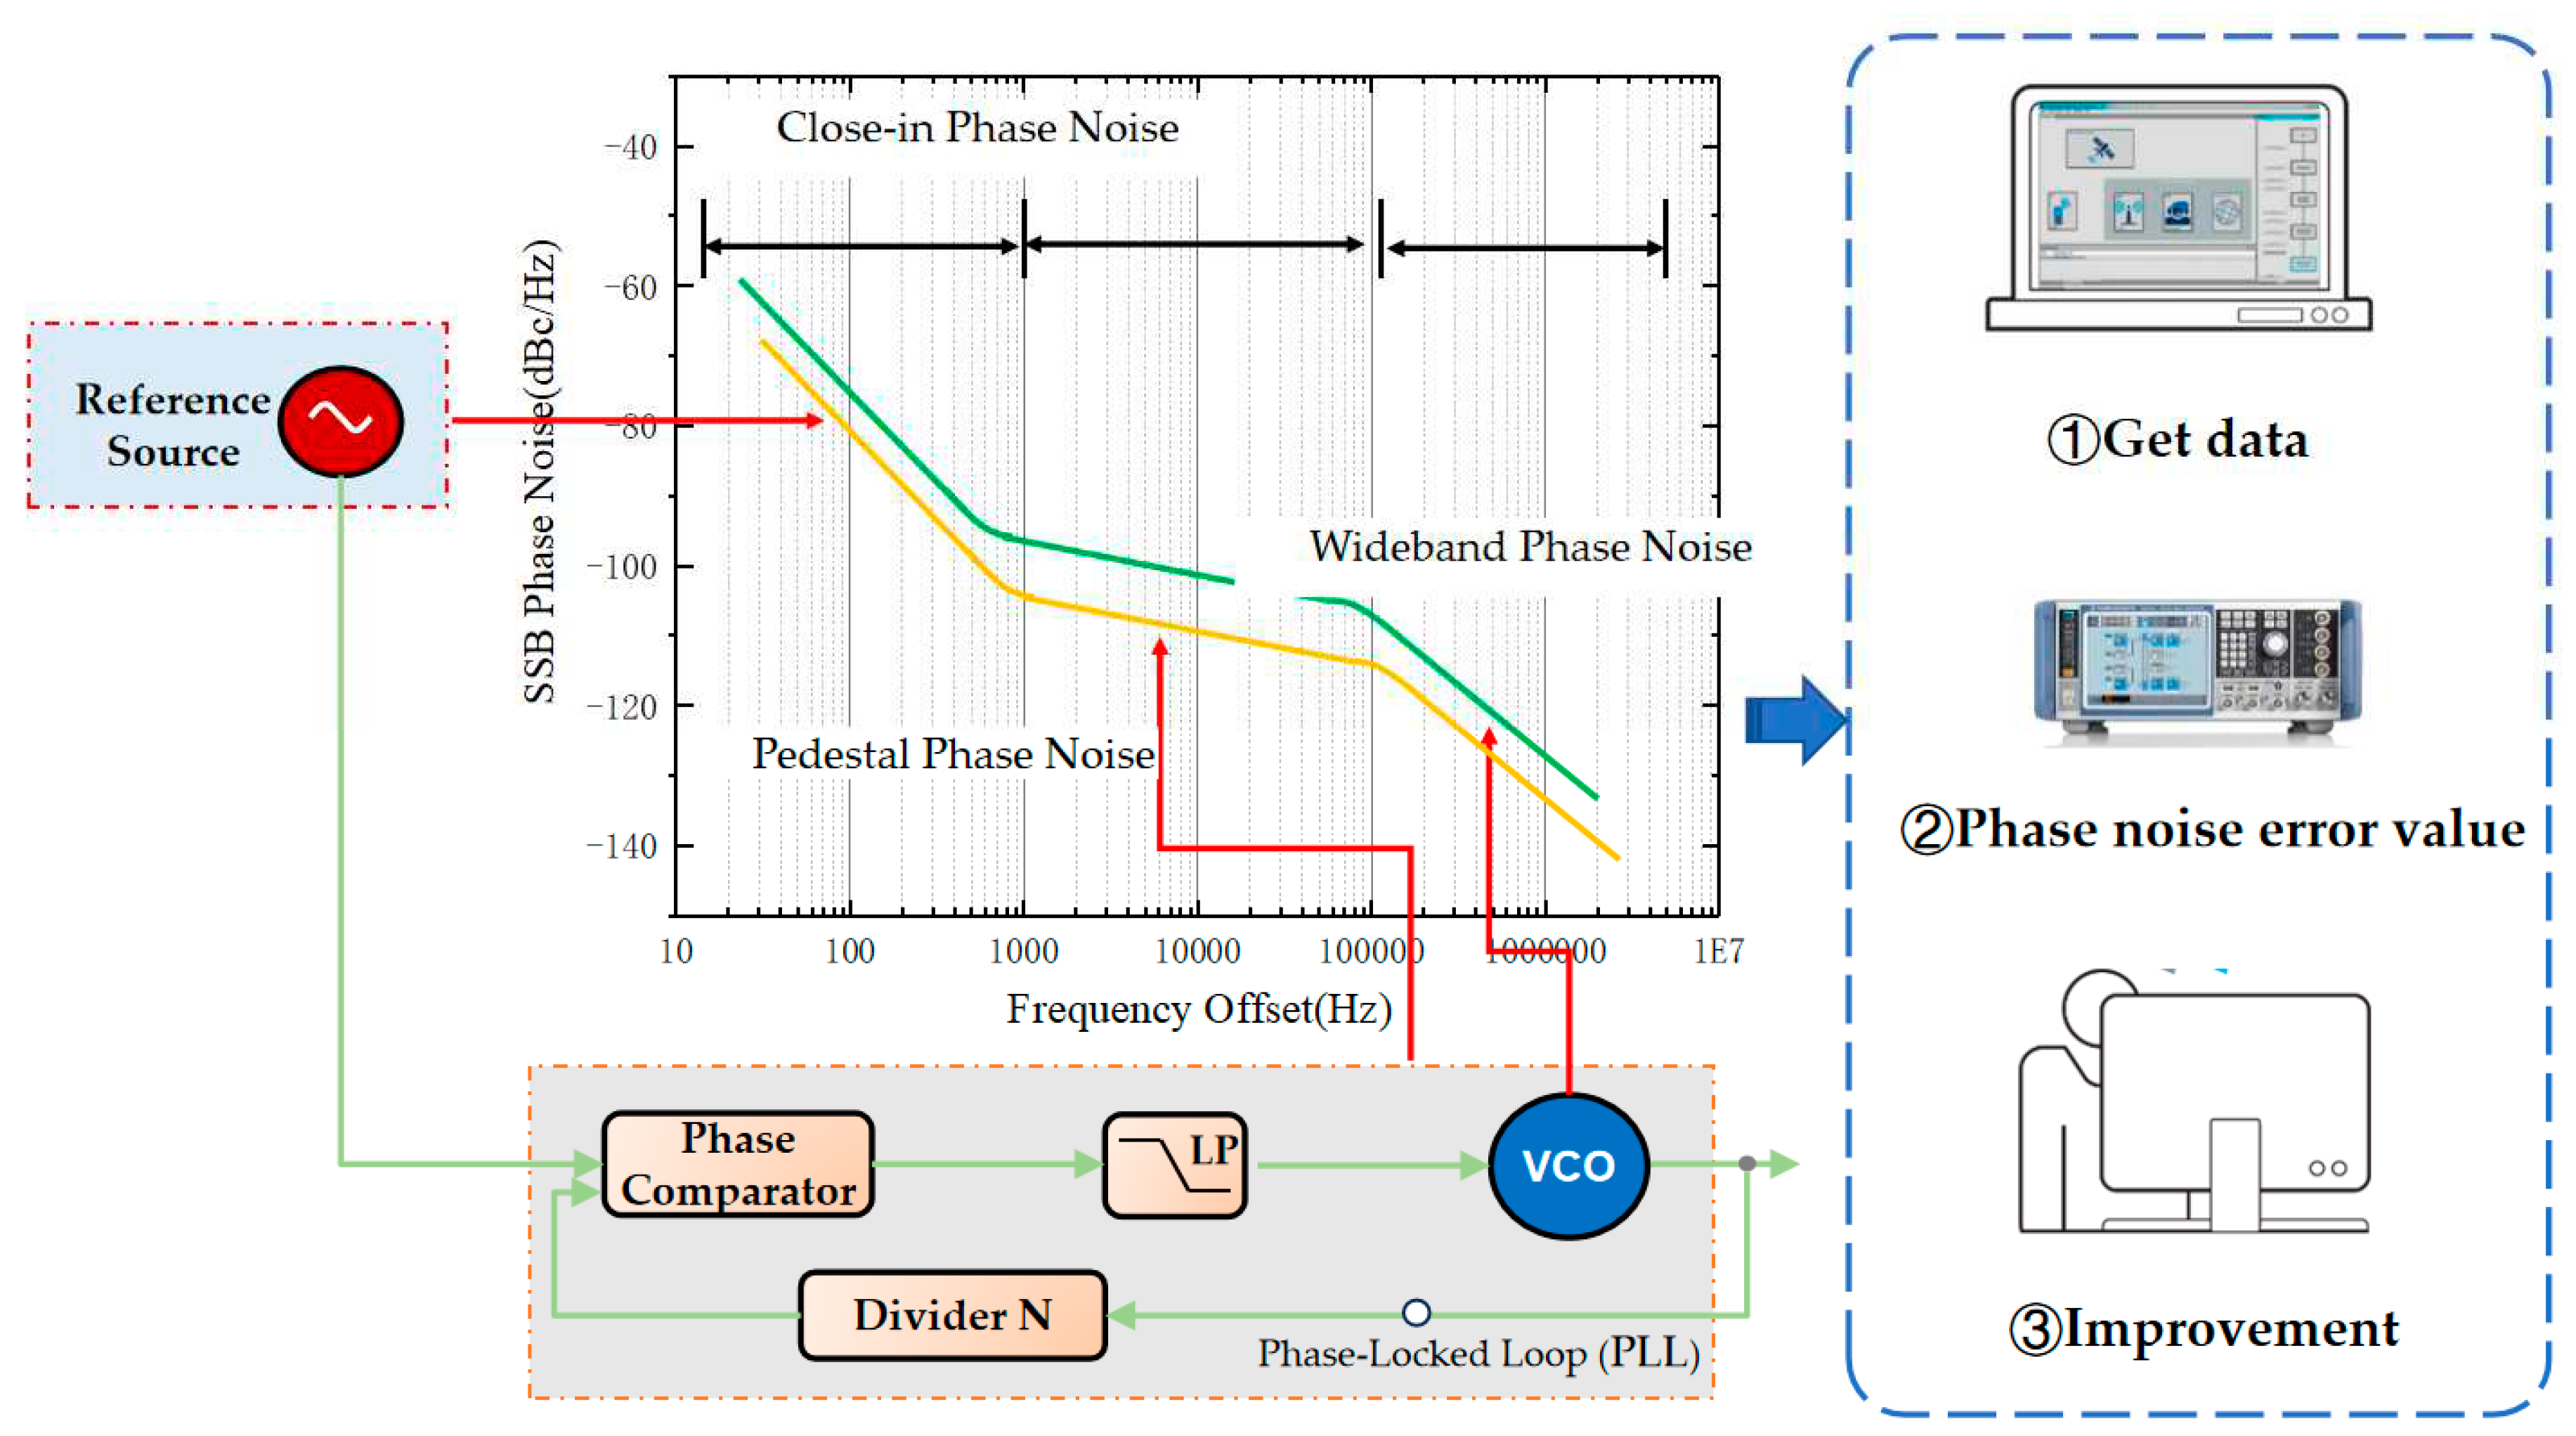
The system's phase noise predominantly consists of three components: noise near the carrier frequency, pedestal noise, and wideband phase noise. Hence, the error value of source "i" at time "t" can be expressed as follows:
The Fourier transform of the above equation yields the power spectral density of the system's phase noise, which is mathematically represented as:
f1 represents the frequency offset of the reference source, f2 represents the frequency offset of the analog signal source, and f3 represents the frequency offset of the voltage-controlled oscillator (VCO).
In the previous section, we have obtained the expressions for the main error parameters' frequencies and the minor error parameters. Considering the possibility of multiple independent error sources in the system, let's assume there are m independent error sources in the satellite signal simulation system. We model various components of the electronic elements corresponding to each error source, including clock oscillators, phase-locked loops (PLLs), amplifiers, and RF ports. By modeling these components, we can more comprehensively consider the impact of factors such as hardware noise, nonlinear distortion, and frequency drift. This allows for a more comprehensive analysis and evaluation of the performance of the entire signal simulation system.
Among them, for the linear part, the obtained transfer matrix is denoted as H, which represents a time-invariant system error model. The ideal error function of the system can be represented as follows:
In the equation, ai represents the coefficient of error source i, and the remaining terms denote the product of the error transfer matrix and Gaussian white noise. By summing these terms, we can obtain the error model based on the power spectral density of the phase noise.
Based on the above error model, we utilize the normalized root mean square error (NRMSE) as an evaluation metric to assess the phase noise deviation of the satellite signal generation system under different operating conditions. By calculating the NRMSE, we can objectively measure the difference between the system output and the ideal output and normalize it for comparative analysis across various operating conditions. This evaluation method helps us gain a more accurate understanding of the system's performance under different conditions, including the magnitude and impact of phase noise. The formula for calculating the normalized root mean square error (Equation 9) is represented as:
In the equation, represents the sample representation variable of phase noise at the same frequency point.
To achieve the objectives of this study, this paper establishes a semi-physical simulation platform based on GNSS signal generation using a vector signal generator, wireless communication tester, and collision environment simulation testing system. Considering that post-collision emergency call system simulations mainly focus on receiver performance and overlook errors caused by signal distortion, the research on post-collision emergency call system simulation primarily focuses on receiver performance while neglecting errors caused by signal distortion [
34]. Therefore, a hardware-in-the-loop testing method is proposed that replicates the environmental factors as the primary concern. By introducing a phase noise model and a method for generating GNSS intermediate frequency signals, the aim is to improve the traditional positioning information simulation methods based solely on numerical statistics. This approach allows for the combination of real-world scenario information and simulation accuracy in AECS tests. It focuses on evaluating the performance of the AECS system under different environmental conditions and more accurately simulates vehicle collision scenarios, providing important tools and support for AECS development and verification methods.
3.1. Positioning Information Simulation System
Based on the signal sources [29, 35], the platform has established a GNSS satellite signal generation system for generating GPS and Beidou satellite signals. We have constructed a positioning information simulation system that includes key components such as the Synthesizer Unit, IQ Unit, Output Unit, and Step Attenuator. The system's flowchart is shown in
Figure 2.
The system principle is illustrated in the diagram shown below. In the Synthesizer Unit, we utilize a synthesizer to generate an intermediate frequency signal of a specific frequency. The local reference source, a quartz crystal oscillator, generates the local oscillator sinusoidal signal, represented as:
In the equation, S
LO represents the local reference source quartz crystal oscillator generating the local oscillator sinusoidal signal, and F
LO denotes the oscillator frequency. Through the IQ Unit, phase modulation and frequency conversion are performed to simulate variations in carrier frequency and carrier phase. This process can be represented as:
The amplitude synthesis of the signal is represented by AL and ALO, where AL represents the amplitude of the baseband signal, and ALG represents the amplitude gain. The data code set for the signal is denoted by D, while τ represents the signal delay. Based on the L1 frequency of the Beidou satellite, Doppler frequency shift, and the frequency settings f1, fd of the reference source, the final modulated signal is obtained with fLO and passed as input to the Output Unit. It is worth noting that, as discussed in the previous section regarding timing errors and clock errors, since there are multiple signal sources involved in generating the positioning information in the environmental simulation system, this paper employs the clock with higher precision in the vector signal generator as the reference source.
The generated intermediate frequency (IF) signal undergoes processing in the Output Unit, which includes filtering and power adjustment, to meet the requirements of the simulation. To simulate signal strength variations in different scenarios, a step attenuator is employed to attenuate the signal. The system interacts dynamically with the collision environment generation system through the SCPI interface. Errors caused by external factors such as temperature, humidity, mechanical stress, etc., need to be validated and analyzed by controlling the input of environmental variables. This allows for the validation of the sensor data generated by the standard receiver under different environmental conditions and verifies the impact of the error model in the system under various test conditions and inspection requirements.
3.2. Emergency Call Simulation Platform
In this paper, we propose a semi-physical Hardware-in-the-Loop (HIL) approach for emergency call simulation. This method combines the positioning information simulation system with the collision environment simulation system, generating the positioning signal as the output of the platform. This integration makes the simulation platform more suitable for validating error models and aids in identifying vulnerable components within the hardware.
The architecture of the emergency call simulation platform is depicted in
Figure 3, where the satellite signal generation system plays a critical role. By employing the provided platform and combining it with the content from the previous section, AECS indoor detection test cases can be formulated. The satellite signal generation system consists of both a generator model and physical hardware components. The generator model's parameters are set via the SCPI interface. Based on the principles and specifications of the GNSS system, the generator model can produce intermediate frequency signal waveforms that resemble real satellite signals. The physical hardware provides the actual signal generator, ensuring that the generated signals match those in the real environment to guarantee signal accuracy and reliability.
The error analysis section is used to evaluate the measurement errors and stability of the system, conducting an analysis of both linear and nonlinear effects on system measurement errors [
36]. Factors such as signal attenuation, noise, multipath effects, and others are considered in their impact on positioning performance. Additionally, we pay attention to random measurement errors with repeatability, such as temperature drift. By analyzing these error sources in detail, we can understand the system's performance and reliability under different conditions. As shown in
Figure 4, a simplified phase noise model is obtained, depicting its relationship with the corresponding system modules. Various components in the simulation system exhibit nonlinear characteristics influenced by environmental factors, leading to nonlinear error effects. By analyzing the phase noise, we can determine the locations where environmental factors affect the system.
The collision environment generation and testing system is used for environmental simulation and physical experimental validation in the simulation section. We simulate collision environments, including factors such as vehicle collisions, vibrations, and changes in environmental conditions before and after collisions in the testing area. By conducting semi-physical validation under various combinations of simulated collision conditions, such as temperature and vibration, we can evaluate the performance and reliability of AECS (Assisted Emergency Call Systems) in real collision environments. This part also involves comparing and analyzing the simulation results with experimental data to validate the effectiveness and accuracy of the simulation testing platform.
The entire architecture provides a comprehensive semi-physical simulation testing platform for emergency call simulations. The satellite signal generation system generates real intermediate frequency signals, while the error analysis section evaluates the system's measurement errors and stability. The collision environment generation and testing system simulate real collision environments and conduct physical experimental validation. Together, these components create a platform that enables thorough testing and validation of emergency call systems.
3.3. Semi-Physical Simulation Testing Process
The Semi-Physical Simulation Testing Process is essential for evaluating system performance, validating design and functionality, mitigating risks, and achieving cost and time efficiency. By combining physical elements with simulated components, it enables realistic assessment of system behavior, identifies potential issues, verifies design specifications, and reduces the likelihood of failures in real-world applications. This controlled testing environment allows for repeated testing and iteration, leading to reliable and optimized systems before costly deployments or extensive field testing. Process as follows:
Using the collision testing unit in the semi-physical simulation platform, real signal observations from the testing area and system phase noise observations under generated signals are collected separately. The collected data is then subjected to outlier removal processing to ensure the reliability and accuracy of the observations.
By controlling the parameters of the satellite signal generation system, different positioning conditions are simulated by altering the environmental conditions in which the system operates. This allows for the simulation of various vehicle collision scenarios, levels of vibration, and temperature changes. For the simulation of vibration and temperature environments, vibration characteristic parameters are calculated based on historical data from real vehicle and simulated collision tests to ensure accurate environmental simulation.
The weights of each error source in the error model are initialized. By triggering the emergency call device, the simulation system transmits the simulated environmental parameters to the AECS and records the system's response and performance under different environmental conditions.
Analysis and calculation of errors for different scenarios are performed. The timing errors and clock errors are validated by selecting a reference source with high precision. For the validation of other environmental factors, such as temperature drift, it follows the testing requirements outlined in the emergency call regulations. Samples that meet the overall qualification tests specified in UNR144 are selected for error analysis.
4. Results and Analysis
To validate the stability and effectiveness of the semi-physical simulation model and analyze the key influencing factors in vehicle emergency call tests, experiments were conducted at the National Automotive Quality Supervision and Inspection Center in Beijing. A verification experiment of the emergency call in-collision environment simulation model was designed, and different environmental conditions and interferences encountered during the actual vehicle collision process were simulated. Test data corresponding to these conditions were generated using the satellite signal generation system in the semi-physical simulation setup.
4.1. Experimental Setup
The experimental setup consists of two main components: the positioning information generation based on vehicle collision conditions and error analysis. To obtain the key influential parameters of the simulation model under realistic conditions, a remote data acquisition and control system was designed for data collection in the experimental scenario.
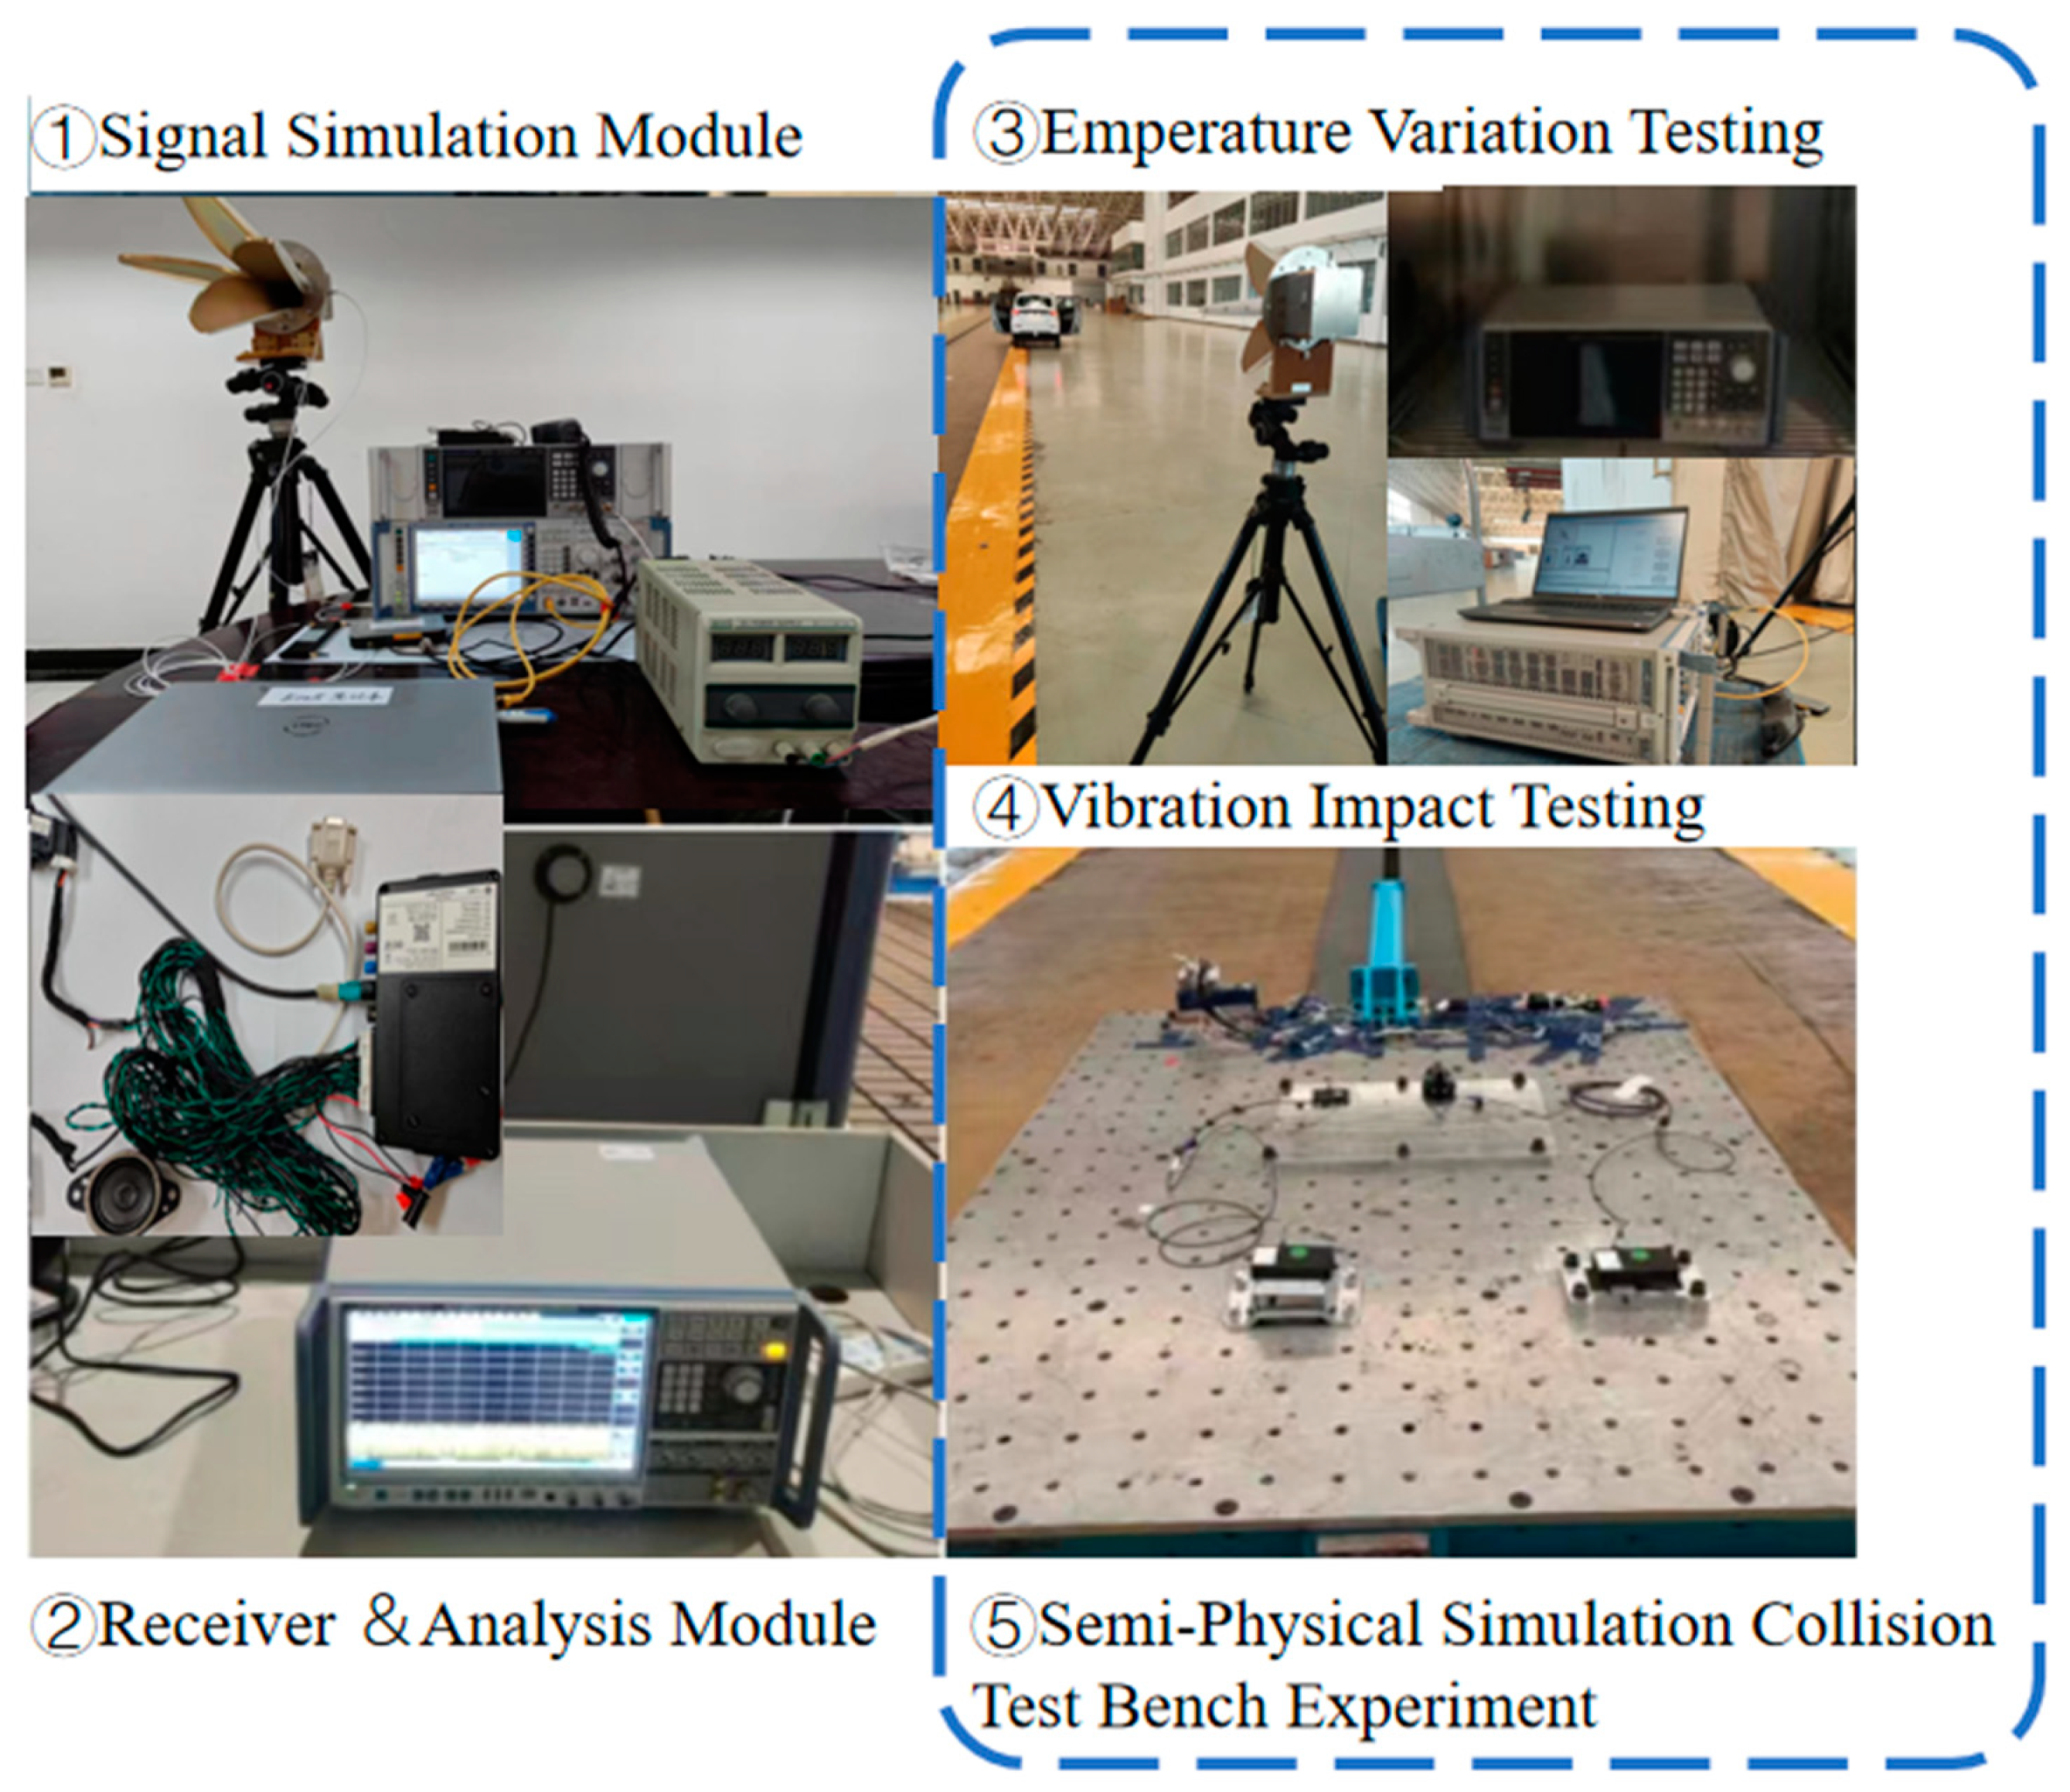
Figure 5 illustrates the simulation scene and the corresponding AECS test after a collision, demonstrating the effectiveness of the simulation scenario.
Prior to the experimental analysis, the signal generation component of the simulation model was integrated into different environmental chambers to control the environmental factors. The temperature outside the environmental chamber was maintained stable, and system data was observed using a signal analyzer [
37]. Simultaneously, a remote data acquisition system recorded GNSS signal data. Once the satellite signal generation system reached the specified environmental conditions and remained relatively stable in the environmental chamber, the AECS was triggered, and data collection began, including the environmental temperature, impact amplitude, and timestamps of various components.
After obtaining the MSD (Minimum Set of Data) information of the AECS using the CMW500 wireless communication tester, it is confirmed that the positioning signal is generated by the satellite signal generation system, and the operating conditions are recorded. Subsequently, the parameters of the environmental chamber are controlled to change to the next set value and maintained for 10 minutes. The collected experimental data is then analyzed for phase noise using the FSWP-50 analyzer, with the parameters set as specified in the table. Finally, the data is uploaded through the CAN bus or serial port, and the influence weights are analyzed using the error model established in the platform.
Table 1.
Parameter settings in satellite signal simulation.
Table 1.
Parameter settings in satellite signal simulation.
| Parameters |
Range or Values |
| Number of traces |
6 |
| Signal Level(dBm) |
-25.506 |
| Integrated Measurements Range (Hz) |
10~10000000 |
| Total simulation duration/(s) |
138 |
| Spurious Removal Threshold(dBm) |
6 |
4.2. Results Analysis
In this study, using the sensors and external environmental chambers integrated into the semi-physical simulation platform, three sets of experiments were designed to compare and analyze the effects of signal generation under different parameters. These experiments focused on high-temperature and low-temperature environments, impact vibration conditions, and normal operating conditions. The data collection and analysis equipment used in the experiments were described in
Section 3.1. Each set of experiments involved data collection for four central frequency points corresponding to different satellite positioning systems: B2a: 1176.45MHz, B1C: 1575.42MHz, B3I: 1268.52MHz, and B1I: 1561.098MHz. The phase noise data was collected for each category, and different gradients of environmental variables were tested for each category.
Table 2.
Summary of Collected Positioning Information Datasets.
Table 2.
Summary of Collected Positioning Information Datasets.
| Test # |
Signal Frequency (MHz) |
Temperature gradient |
Vibration gradient |
Clock Sources Precision |
| 1 |
1176.45 |
7 |
3 |
High |
| 2 |
1575.42 |
7 |
3 |
Low |
| 3 |
1268.52 |
7 |
1 |
High |
| 4 |
1561.098 |
1 |
3 |
High |
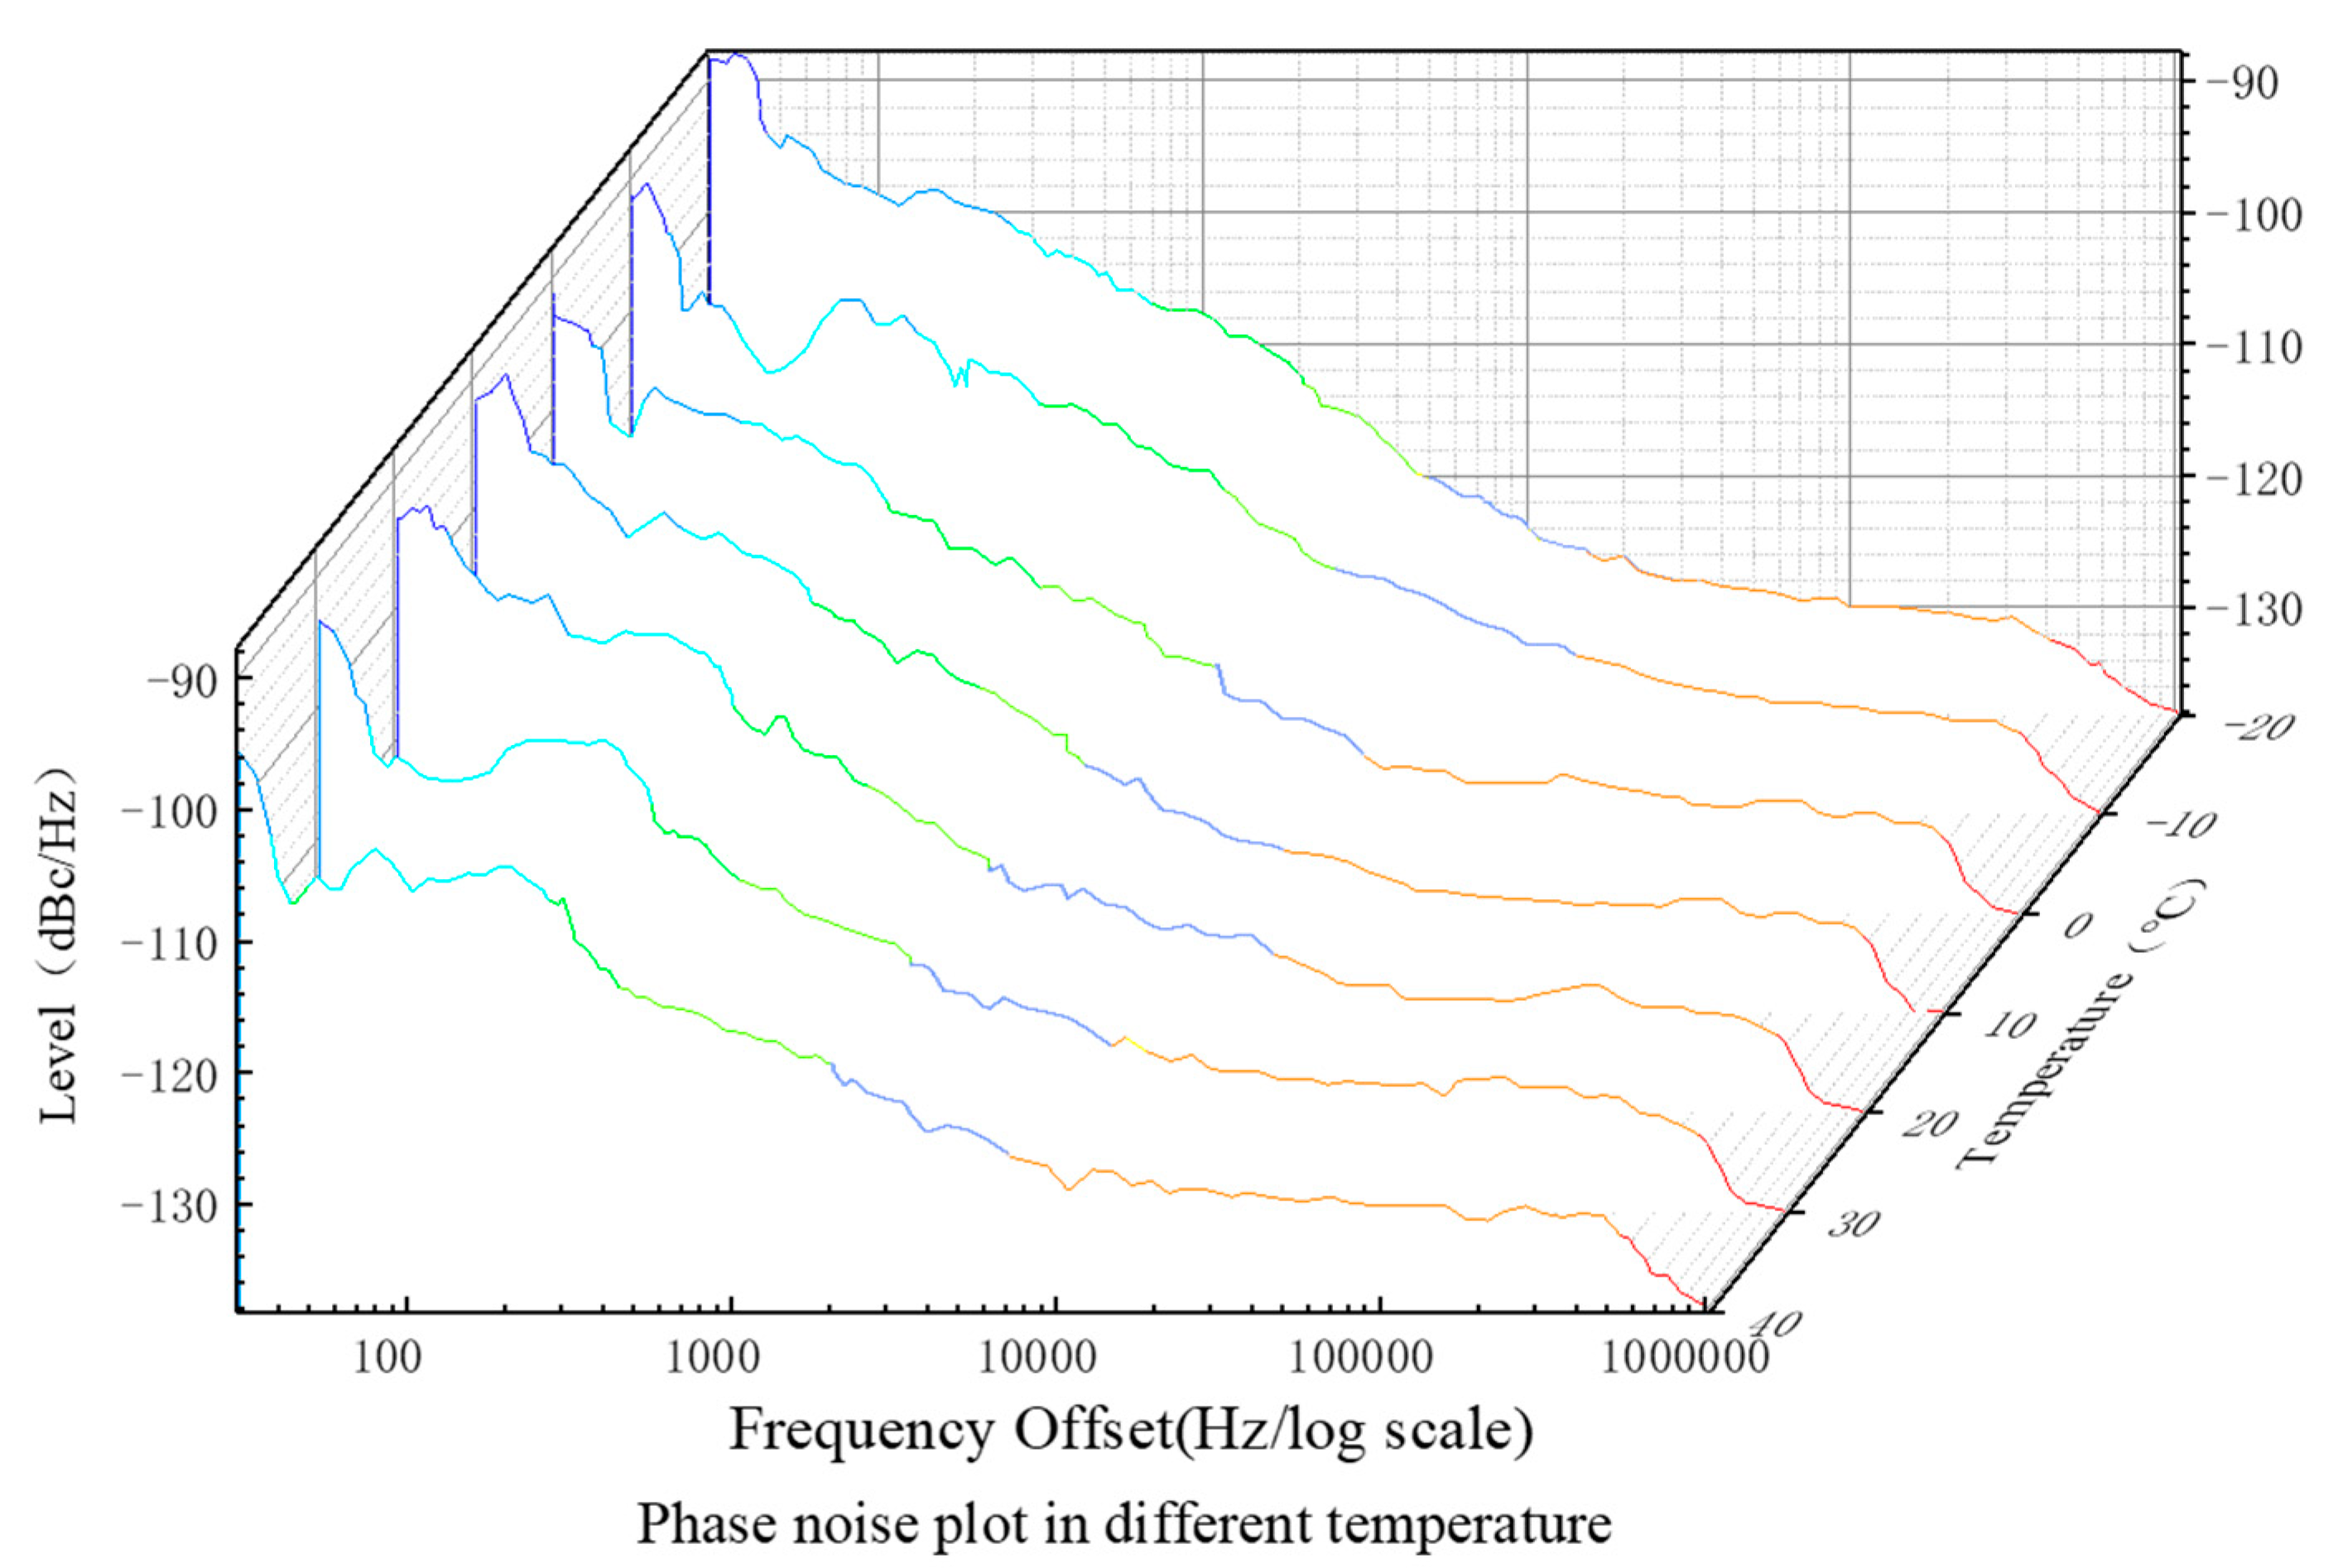
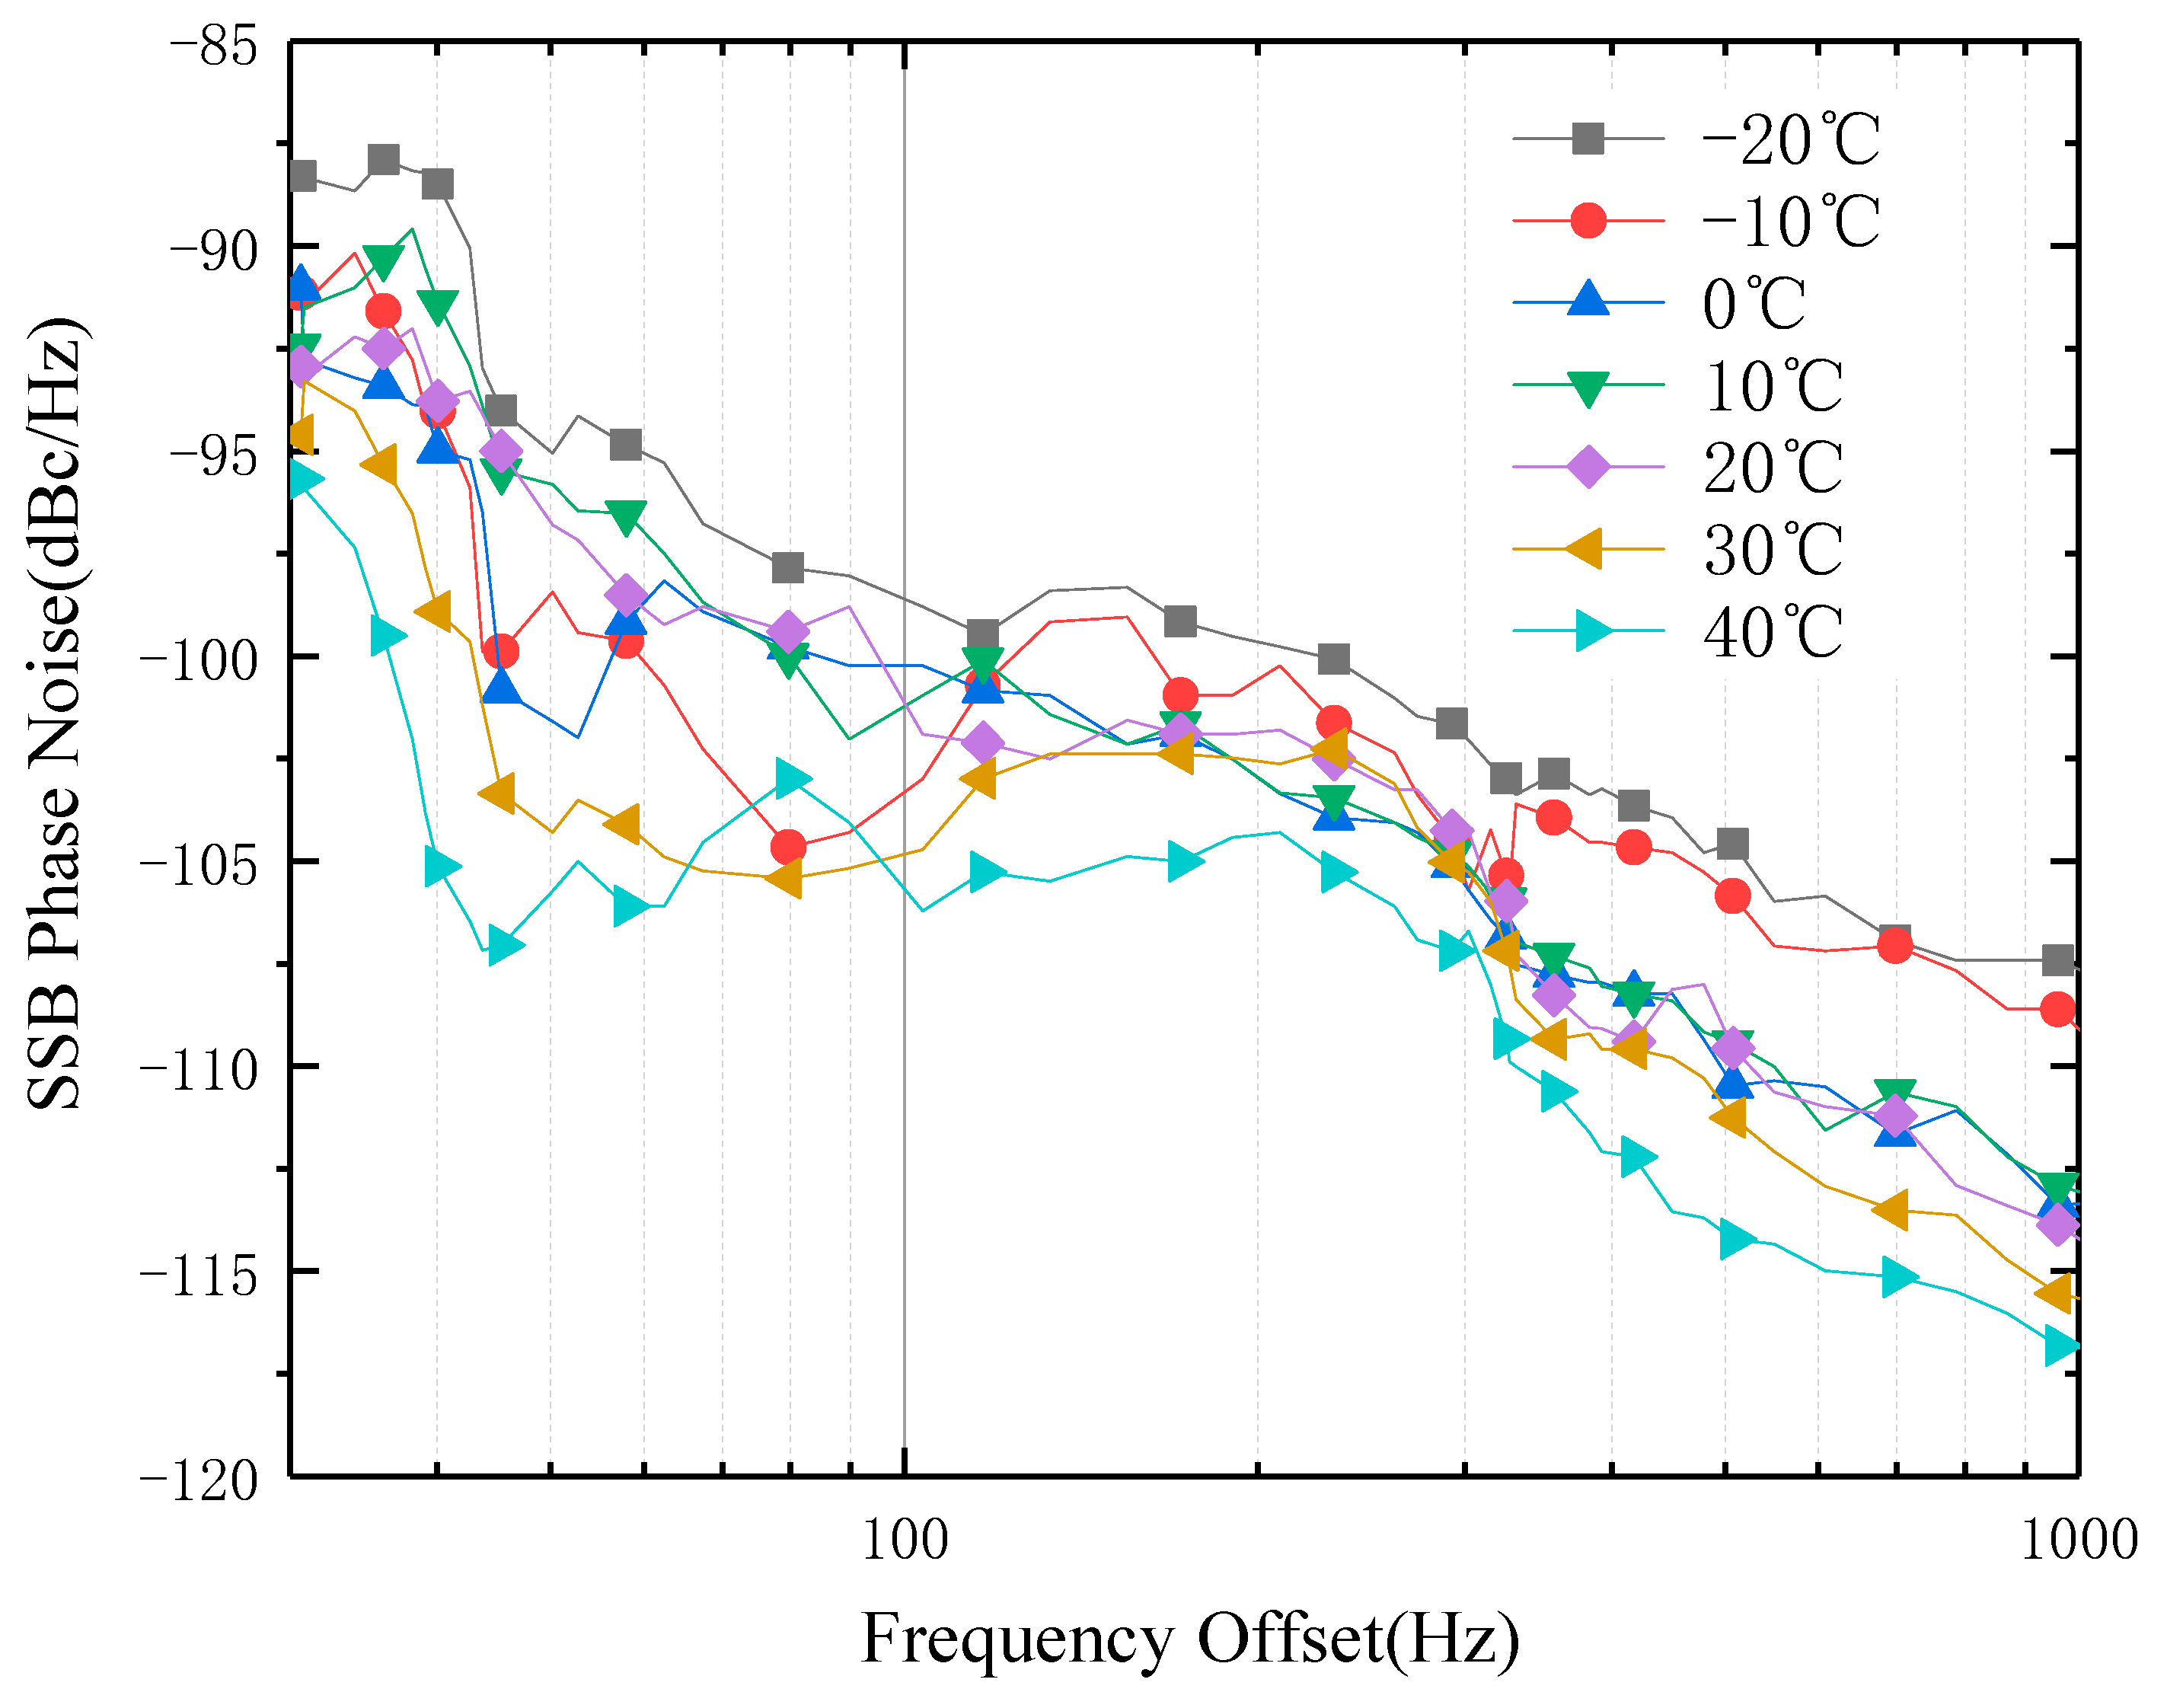
Taking the phase noise at 1575.42MHz as an example, the simulated errors generated in high and low-temperature environments were divided into 7 gradients based on the experimental conditions. A comparative test was conducted with temperature ranging from -20°C to 40°C. Through simulation and experimentation,
Figure 5 presents the single-side phase noise within the integrated measurement range of 10 to 10000KHz under different temperature gradients. It reflects the frequency offset at this frequency center.
From
Figure 6, it can be observed that the overall impact of temperature on phase noise is relatively small. The phase noise is lower at 40°C compared to the normal test temperature of 20°C, while it is higher at the low temperature of -20°C. Taking the phase noise at room temperature as the baseline, the absolute values of the normalized root mean square error (NRMSE) for the phase noise generated at 40°C and -20°C are 1.13% and 2.12%, respectively. This indicates a negative correlation between environmental temperature and generated phase noise. Furthermore, it can be seen from the graph that the influence of temperature on system phase noise is mainly concentrated in the near-carrier phase noise within the frequency range of 10 to 1000Hz. The phase noise variations in the ranges of 1000 to 100KHz and 100KHz to 1MHz, which correspond to the pedestal noise φ2 and wideband phase noise φ3, respectively, show similar trends.
The influence of temperature on the system is primarily present in the near-carrier range of 10 to 1000Hz, as shown in
Figure 7. From the graph, it can be observed that at -20°C (low temperature) compared to 40°C (high temperature), the maximum error value is 11 dBm.
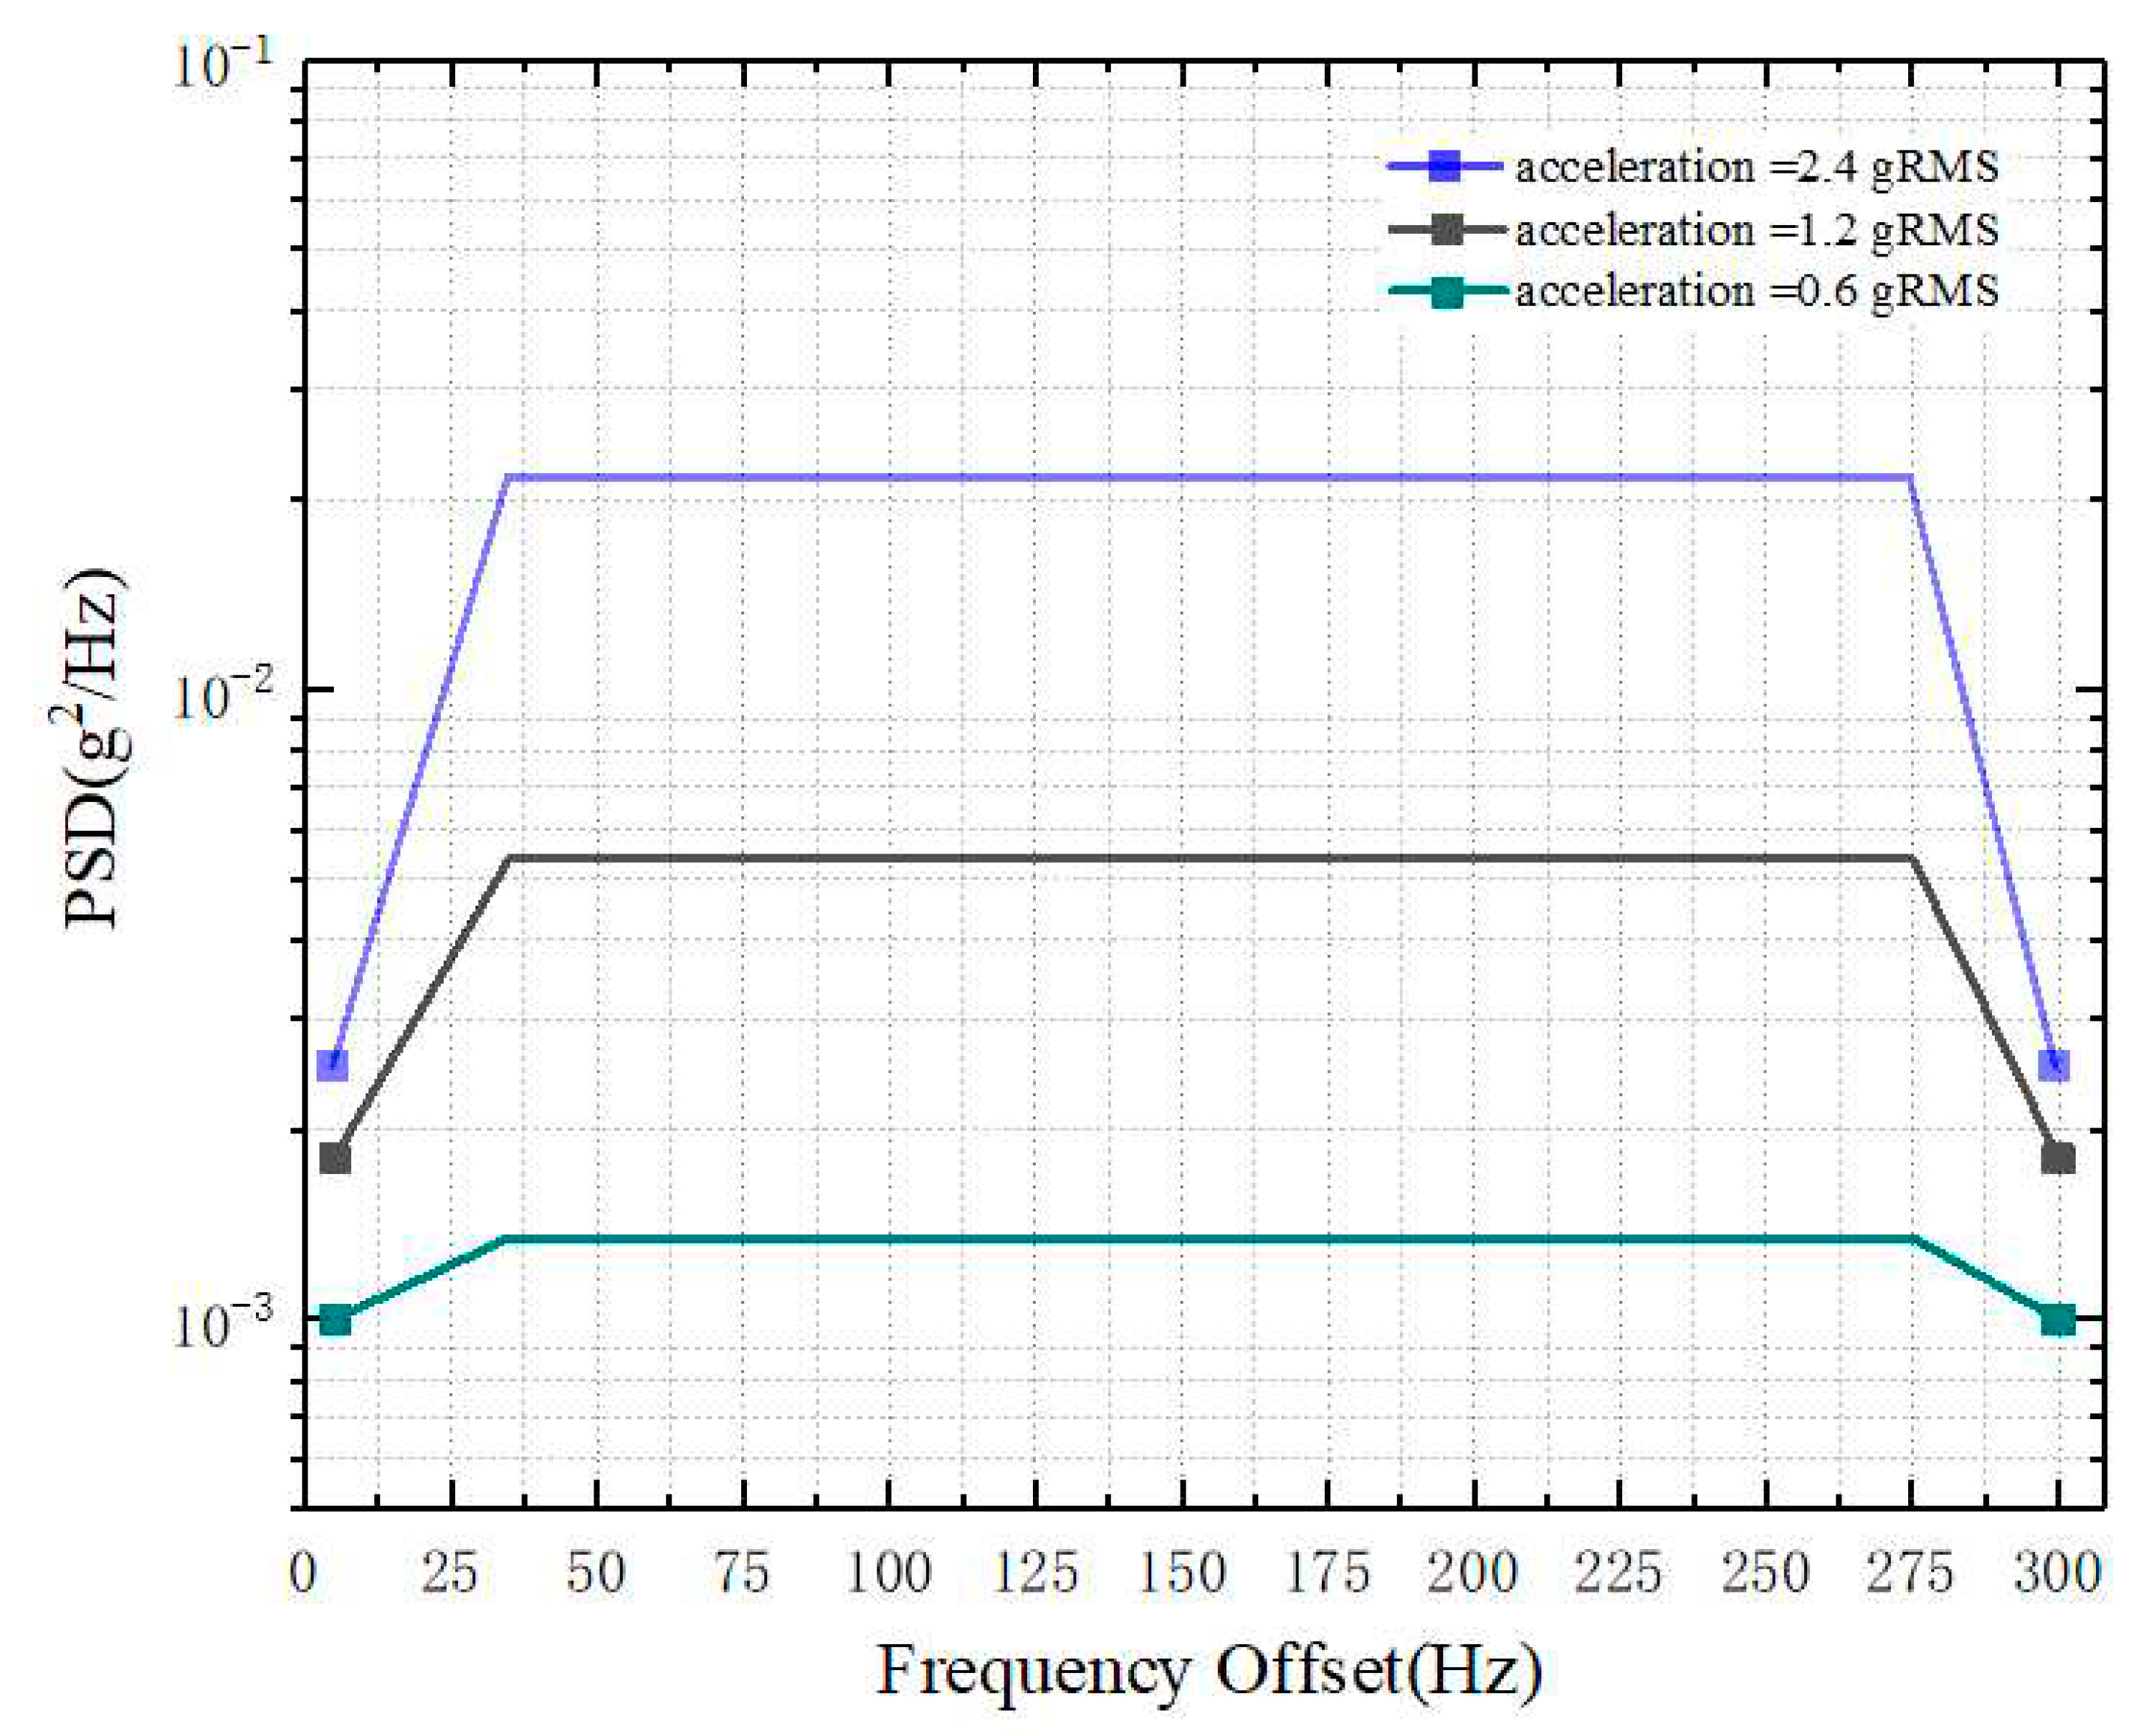
When considering the impact of impact vibration, the design differentiates it from random vibration based on amplitude and frequency. The number of impact vibrations and amplitude gradients are set in reference to the impact of a real vehicle collision on the ground. The simulation aims to replicate the impact of the test platform and the actual vehicle on the ground during the traction and collision processes. In this study, vibration with a jump value of less than 2mm within the range of 0-300Hz is used to simulate random vibrations. Power Spectral Density (PSD) is used to represent the operating conditions under different random vibration scenarios.
Figure 8 shows the PSD curves for three different operating conditions used in this study.
Figure 8 represents the three vibration conditions used in the environmental simulation experiments, simulating different levels of random vibration and impact.
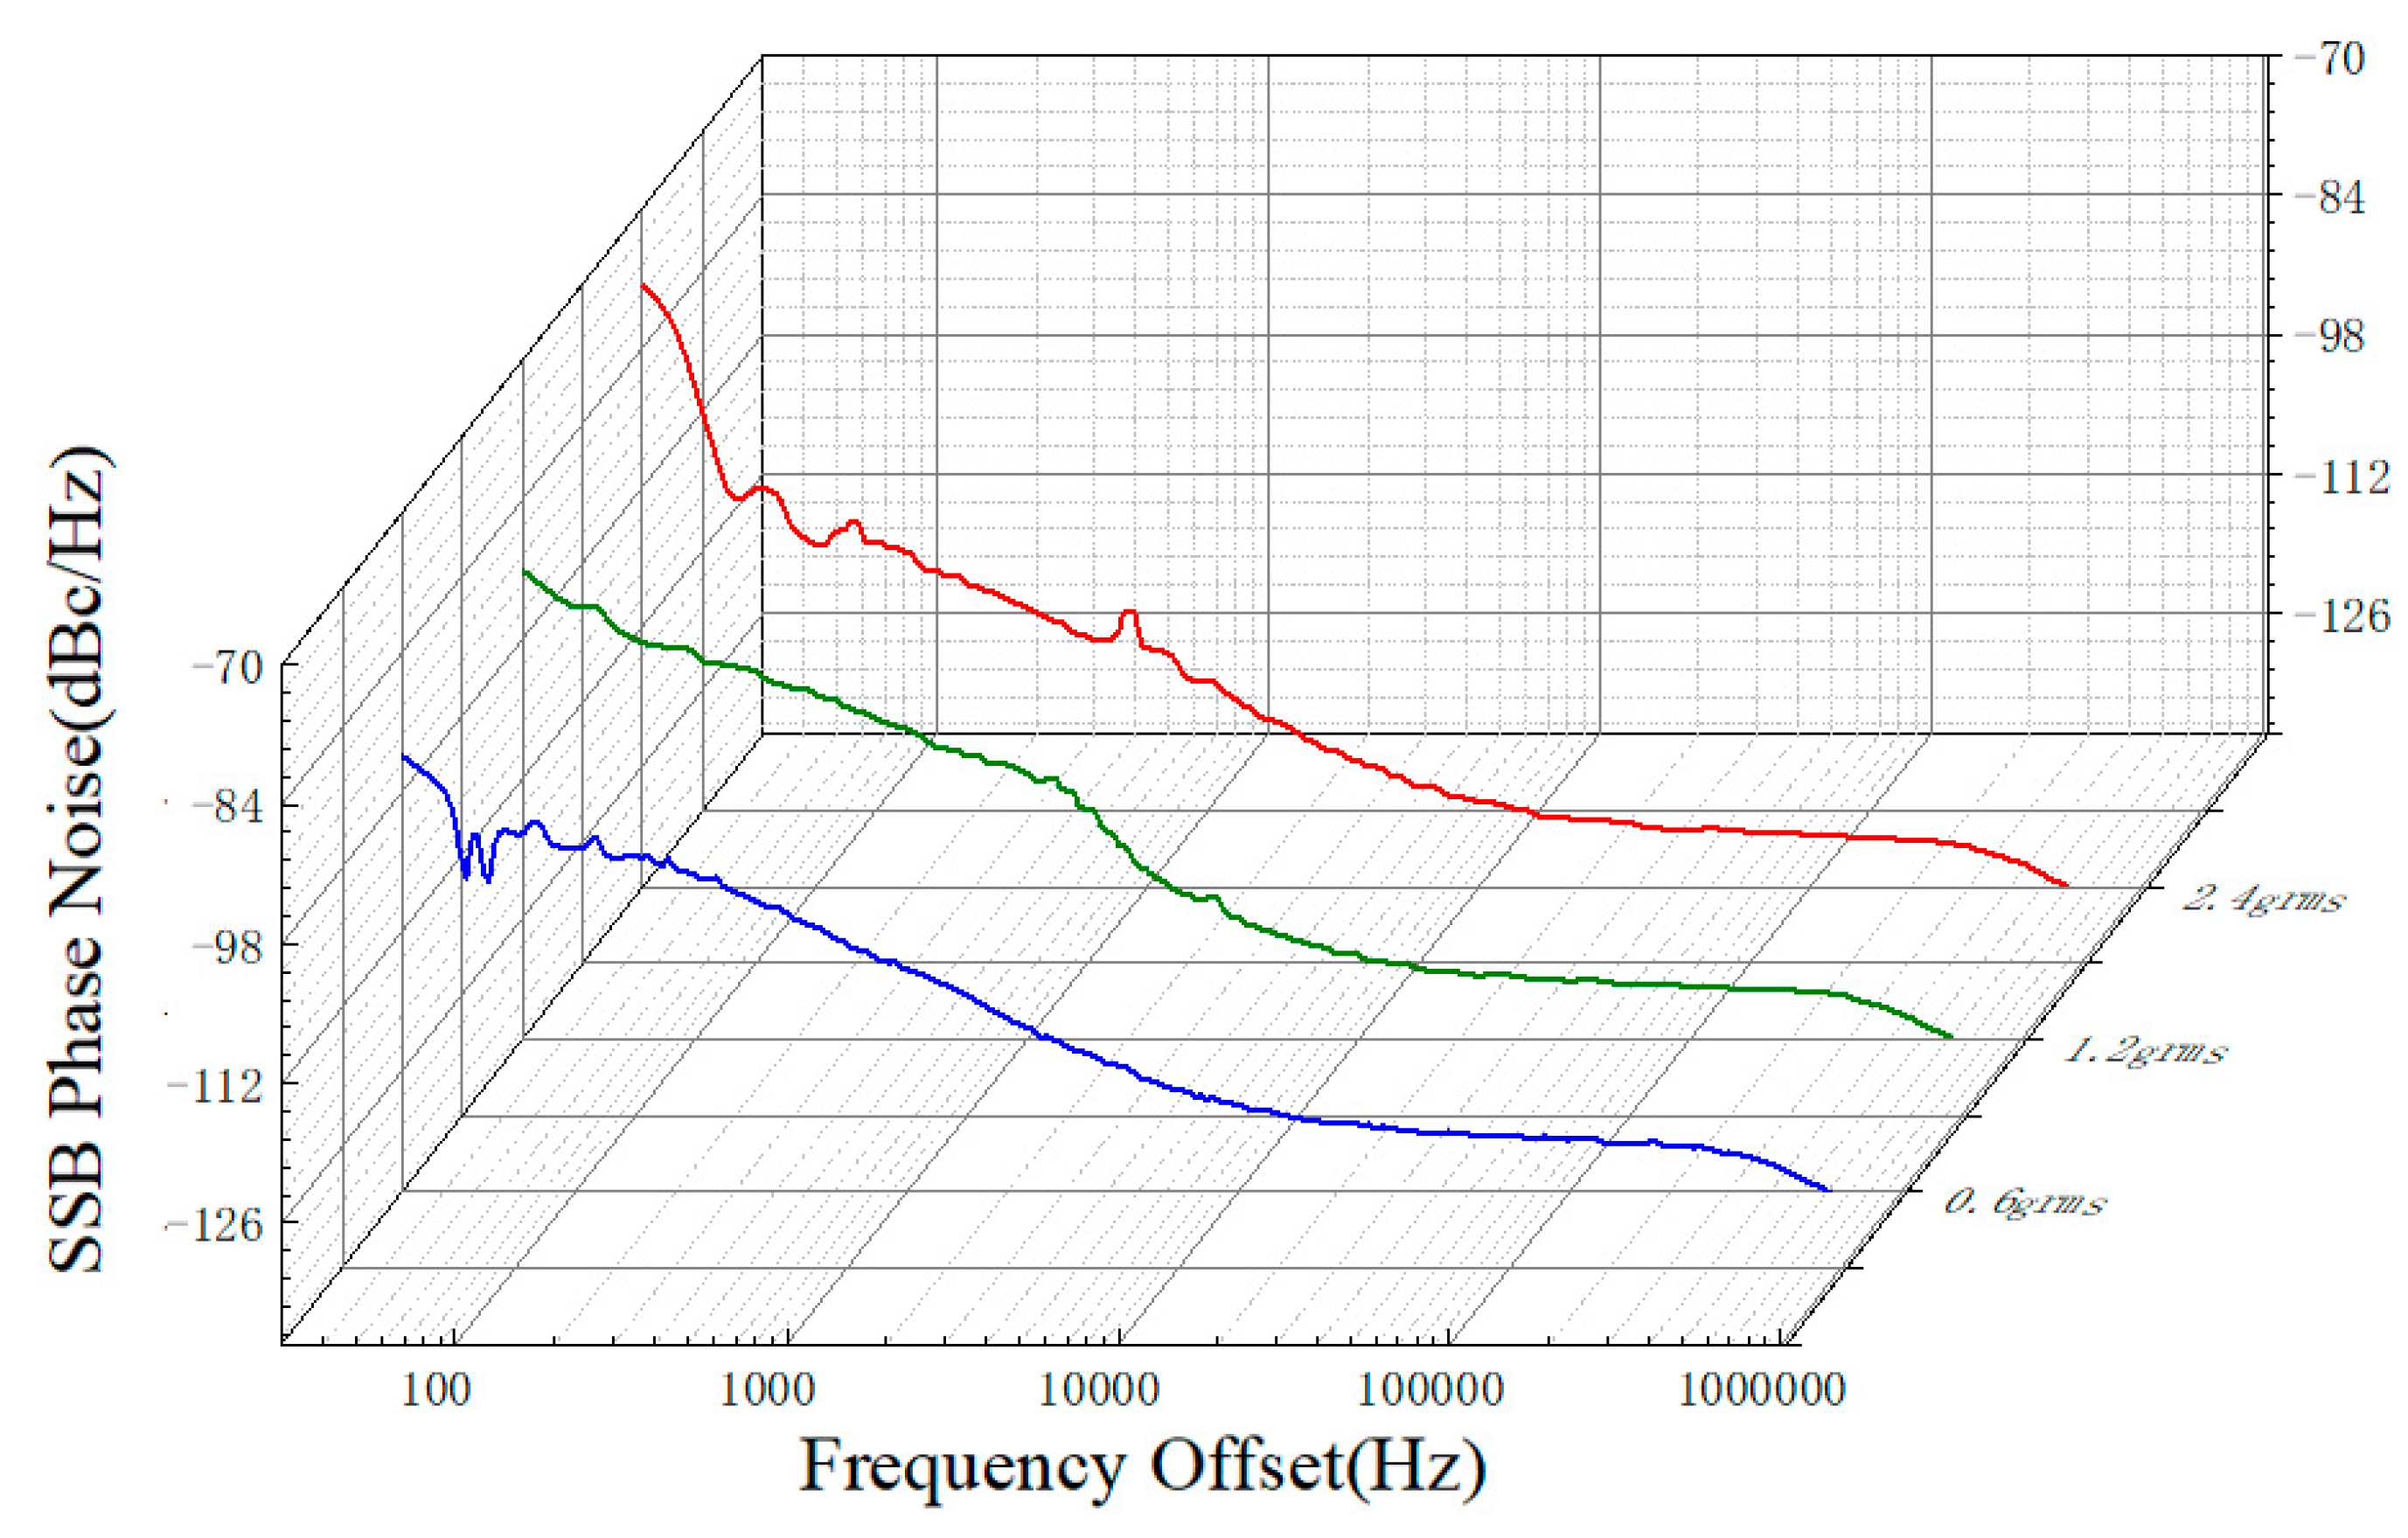
In the experiment, three different environmental conditions with different power spectral densities were used. Under a temperature of 20°C, the signal generation system was placed inside the vibration environmental chamber, and different vibration gradients were set, as shown in
Figure 8.
Figure 8 presents the phase noise results of the system under three different power spectral density conditions. Through the simulation experiment, the influence of the set value of random vibration on phase noise can be obtained. It can be observed from the figure that both the near-carrier phase noise in the range of 10-1000Hz and the pedestal phase noise in the range of 1000-100KHz are affected by vibration interference.
From the full-band curve in
Figure 9, the blue curve represents the phase noise under the 0.6g RMS condition. It can be observed that as the power spectral density (PSD) of random vibration increases, the phase noise of the signal also increases. With the increase in PSD, the absolute values of the normalized root mean square error (NRMSE) of the phase noise generated by the signal increase by 6.3% and 8.95% respectively. In the pedestal phase noise range of 1000-100KHz, both the 2.4g RMS and 1.2g RMS conditions exhibit an increase in phase noise.
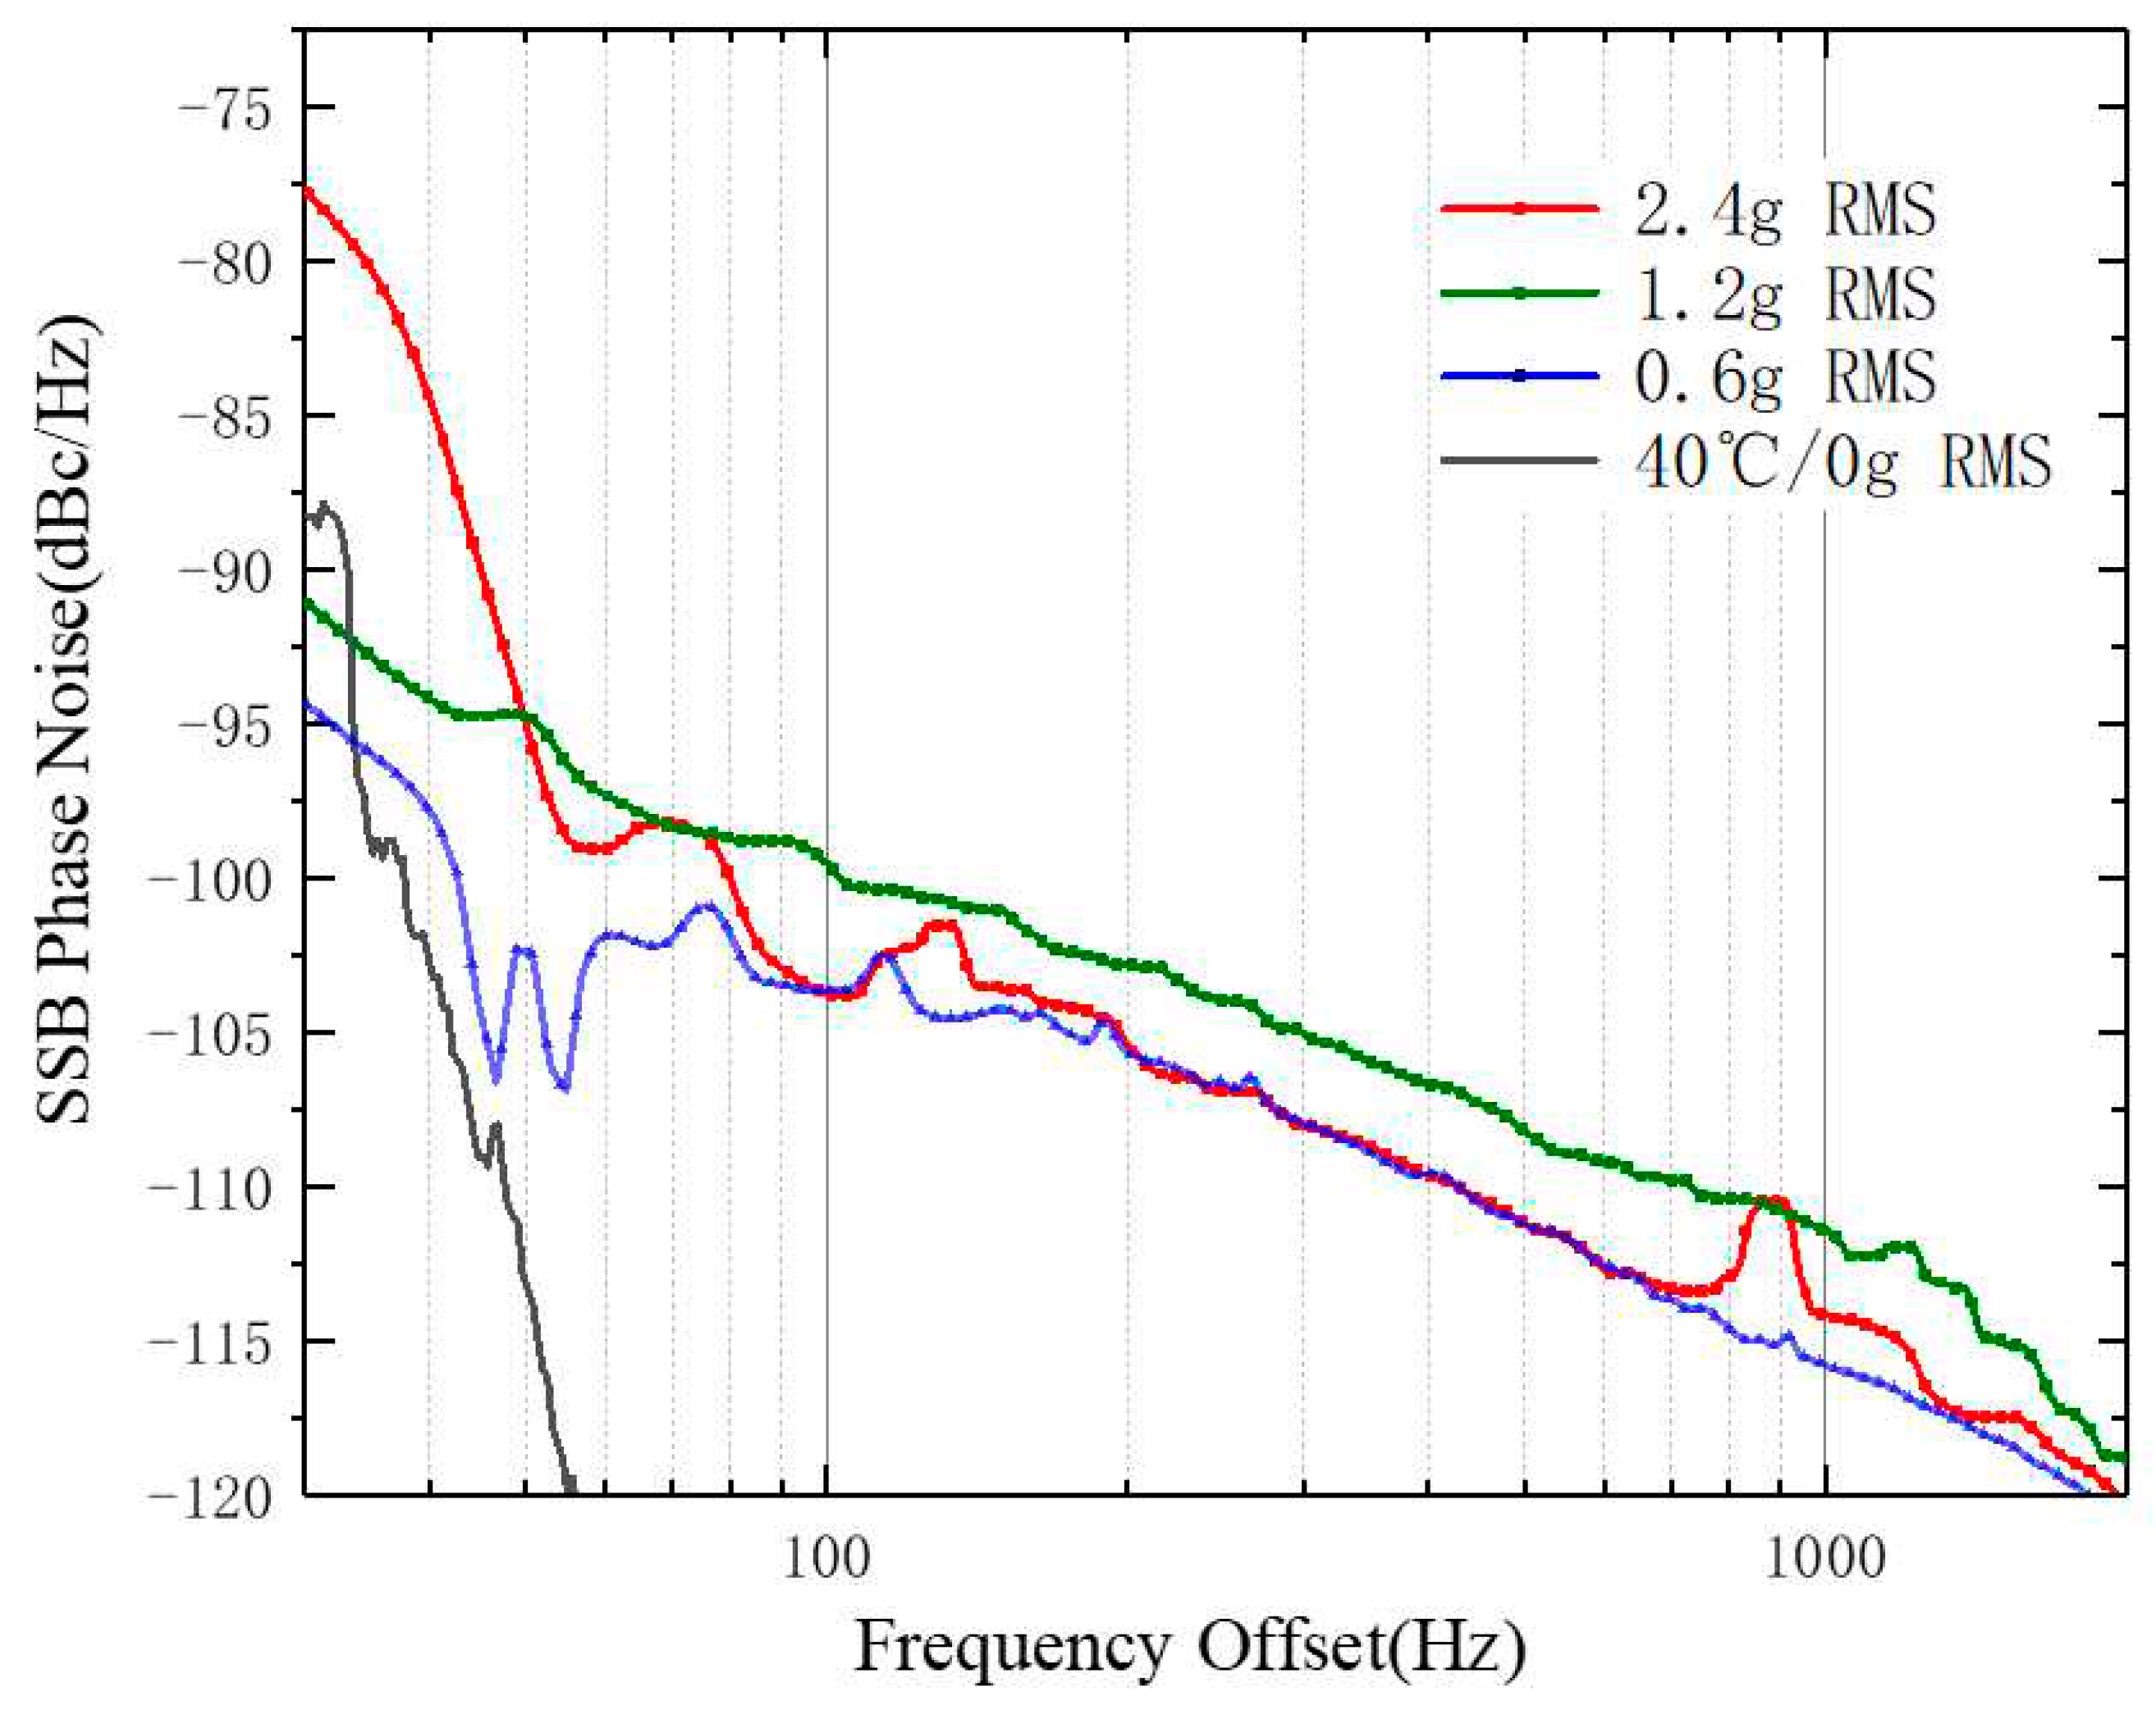
Additionally,
Figure 10 shows a comparison of the phase noise curves in the near-carrier range for the 0-100Hz interval. Under the conditions of 2.4g RMS and 0.6g RMS, the maximum phase noise error is 17 dBm, which is significantly higher than the phase noise under the gray curve representing no vibration (0g RMS) and high-temperature conditions in the same frequency center. Compared to the error caused by temperature, vibration has a greater impact on the frequency in the near-carrier range. Under the 1.2g RMS condition, the impact of vibration on this frequency range is relatively smooth.
Based on the proposed error model in this paper and considering the structure of the satellite signal generation system and the experimental results, it can be concluded that temperature and vibration have a significant impact on the phase noise in the near-carrier range, but their impact on the pedestal phase noise and wideband phase noise is relatively small. The experiments show that when the power spectral density exceeds 1.2g RMS, the phase noise increases significantly, and it becomes challenging for the simulation system to obtain accurate positioning information. Furthermore, it can be inferred that environmental factors primarily affect the signal source and PLL (Phase-Locked Loop) in the generation system, ultimately interfering with the accuracy of the semi-physical simulation system. On the other hand, the VCO (Voltage-Controlled Oscillator) in the oscillation circuit is less affected by environmental factors.
4.3. Discussion
A comprehensive analysis of the experimental results from the simulation platform allows us to summarize some discussion.
The experiment categorizes the factors affecting the signal generation system into two main types: random errors and systematic errors. This categorization emphasizes the need for experimenters to use at least two different types of observations to gain a broader understanding of the phenomena observed. As the simulation model becomes more complex, further research can be conducted to explore the relationship between the signal generation system and the communication reliability of various subsystems in the AECS.
This paper only discusses the challenges posed by the structural configuration of the semi-physical simulation platform on the experiments. However, in certain cases, different physical structures of semi-physical simulation models can also improve the communication effectiveness of the AECS system. To further enhance the platform, the authors can investigate and modify the physical architecture of the semi-physical simulation model, including the number and orientation of vehicle antennas and the ground station model. These modifications aim to further improve the platform's performance under anticipated conditions.
In conclusion, the phase noise metric used in this study revealed statistically significant differences between conditions with and without environmental influences. This result is particularly evident under experimental conditions involving random vibration and impact stress (PSD > 1.2g RMS), as the traction vibration caused by uneven laboratory terrain can greatly affect these variables.
Author Contributions
Conceptualization, YiNing Fu. and XinDong Ni.; methodology, YiNing Fu. and XinDong Ni; software, YiNing Fu; validation, YiNing Fu. and XinDong Ni; formal analysis, JingXuan Yang; investigation, M.R.K.; resources, M.R.K.; data curation, M.R.K.; writing—original draft preparation, M.R.K.; writing—review and editing, YiNing Fu. Zhe Fang and XinDong Ni; visualization, Zhe Fang.; supervision, Zhe Fang ; project administration, Zhe Fang.; funding acquisition, BingJian Wang. All authors read and agreed to the published version of the manuscript.
