
Submitted:
31 July 2023
Posted:
01 August 2023
You are already at the latest version
Abstract
Commercially available paraffin wax LTP ST, manufactured in Poland by POLWAX, was used as a phase change material (PCM) for passive cooling of a LED panel containing 28 high power light emitting diodes (LEDs). Paraffin wax LTP ST of density = 930 kgm-3 at room temperature (RT) was chosen over other POLWAX waxes (LUXOLINA, LUXOLINA-ST, LTP 56-20) because of its melting point range (44.5 – 55.4)℃, relatively high latent heat of fusion H = 218.8 Jg-1, high specific heat Cp = 2.11 Jg-1K-1 and thermal conductivity k=0.233 Wm-1K-1 at 0 ℃ [1]. The thermophysical properties were studied in samples of pure LTP ST paraffin and doped with multi-walled carbon nanotubes (1.99, 3.49, 5.35, 10.49 wt%, MWCNT) or silver nanowires (0.26, 0.32, 1.06, 2.10, 7.35 wt%, SNW). Analysis of the thermal effects of doped samples showed a relative increase in the degree of subcooling, averaging 100% for MWCNT and 46% for SNW , a relative 15÷25% decrease in enthalpy of melting for MWCNT and 14÷16% for SNW. A 44% increase in thermal conductivity was found for the sample containing 5.35 wt% MWCNTs and a 91% increase for 1.06 wt% SNW. The results of cooling efficiency tests for 3 types of developed heat sinks made of AW-2017A aluminum alloy are presented, i.e.: (a) - full system without PCM filling, (b) - system with PCM chamber without intracellular ribs, (c) system with PCM chamber with intracellular fins.
Keywords:
paraffin wax LTP ST
; passive cooling
; panel LEDs
; phase change material PCM
; heat sinks
; carbon nanotubes
; silver nanowires
1. Introduction
Traditional incandescent, fluorescent or halogen lamps are currently being replaced by LEDs due to their energy saving, relatively low price, high operational reliability with a long lifetime of 50,000 h or more vs. 10,000 h for incandescent lamps and a wide range of color temperatures 4500-12,000 K [2]. It is estimated that energy savings resulting from the replacement of traditional lighting with efficient LED on a global scale within 1 year may amount to 1000 TWh, which is equivalent to a reduction of greenhouse gas emissions by about 200 million tons [3]. For this reason, LEDs are eagerly used to illuminate streets, squares, stadiums or parks, in households as cheap indoor lighting, in horticulture to stimulate plant growth and influence their desired characteristics through the selection of light color and duration, in the automotive industry, aerospace, military and many other applications. However, it should be noted that only 20-30% of the total LED energy is total radiant energy, and the rest is converted into heat in nonradiative Shockley-Read-Hall or Auger recombination process between energy carriers occurring in active region of a diode as a result of transfer their excess energy to the semiconductor lattice leading to self-heating of the junction [4]. In the absence of a tailored cooling system, the temperature of the p-n junction can rise above 120 , damaging the LED [5]. It is well known that an increase in the junction temperature Tj of the LED directly reduces its lifetime (the time after which the light output or the lamp lumen maintenance factor reaches 70% of that initial output), lighting power and photometric flux, with Sökmen et al. [6] found that the percentage decrease in LED photometry in the junction temperature range (25-150) is 10% for every 25 increase in Tj. The decrease in luminous flux and associated luminous efficacy with increasing temperature Tj of the LED is due to a decrease in the probability of carrier recombination in the active region and, in proportion to the increase in Tj, an increase in the rate of non-radiative recombination [7]. Narendran and Gu [8] investigated several white LEDs from the same manufacturer which were subjected to life tests at different ambient temperatures. Taking into account exponentially decays of device lifetime with the temperature increases they estimated the lifetime decrease from about 50,000 h to 9000 h when the device temperature at T-point (cathode side) increased from 38 to 58 It follows from the above considerations that, in order to maintain the performance of LEDs over the long term, it is necessary to keep the junction temperature relatively low. In engineering practice, two types of cooling systems for electronic components are used: passive or active cooling. Each of these methods has its own advantages and drawbacks. It should be noted, however, that although active cooling systems are more efficient than passive systems, they require an external energy source to operate, which makes them more unreliable. Unlike active cooling systems for thermal energy management, passive technology based on latent heat thermal energy storage (LHTES) during the reversible melting/crystallization processes occurring in phase change materials (PCM) is more reliable and cheaper. Thermal energy (TE) can be stored effectively at high volumetric density in the form of latent heat unlike other forms of storage such as sensible heat (TE is stored by changing the temperature of the medium) or thermochemical heat (TE is absorbed or released by breaking and reforming molecular bonds in a completely reversible reaction) [9]. Commercial paraffin waxes which are cheaper than pure paraffins, have a great potential to become a good PCM candidate for LHTES due to their high volumetric thermal energy storage density, non-toxicity, good thermal and chemical stability, little or no supercooling, lack of phase separation, good self-nucleating properties on freezing and reasonable price. Paraffin waxes which are mixture (more than 75%) of heavy saturated hydrocarbons ( with mostly iso-alkanes, cyclo-alkanes and alkyl benzene [10] have a moderate latent heat of fusion (ΔH about 200 J⋅g-1), useful melting temperature range from sub-zero to above 100 [11] but their main drawback is low thermal conductivity (k about 0.2 Wm-1 K-1) [12] which influences the extension of the charging / discharging time of the heat storage systems in the processes of melting / solidification waxes. Low thermal conductivity of paraffin waxes can be enhanced using different techniques such as addition of nanoparticles, nanopowders or nanowires (carbon nanotubes, metals, oxide or carbide ceramics), by addition of expanded graphite, high thermal conductivity metallic foams (Cu, Ni, Al) or by encapsulation with extended pins or fins of different shapes to increase surface of heat transfer [13]. The research on the influence of various additives on the improvement of thermal conductivity of composites containing paraffin as PCM material was carried out both experimentally and numerically. Zhang et al. used non-equilibrium molecular dynamics simulations of paraffin/EVA/graphene nanocomposites as phase change materials [14] and revealed that the nanocomposite with the addition of 0.7 wt% graphene had the highest value of effective thermal conductivity equals 0.4331 Wm-1K-1 at 313 K when changing of graphene content from 0 to 7.0 wt%. Additives used to increase the effective thermal conductivity k of paraffin include, for example: Multi-Walled Carbon Nanotubes (MWCNT) and activated carbon by a dispersion technique (experimentally confirmed by Sahan et al. [15] increase in k-value by 34% -39%), expanded graphite (EG) and nano-metals particles (Cu, Al, Ni, Fe) giving the best result for paraffin-EG(11%)- Cu(1.9%) composite (experimentally confirmed by Ma et al. [16] increase in k-value from 0.216 Wm-1K-1 for pure paraffin to 3.825 Wm-1K-1 for the composite at 30 ). It should be added, however, that obtaining such a large improvement in thermal conductivity of the composite is associated only with very little decreases of phase change enthalpy and phase change temperature. Khan Z. and Khan Z.A. [17] used 3D computational models to optimize LHS system including paraffin, graphene nano-platelets (GNP) and longitudinal, circular and wire-wound fins as extended surfaces in vertical shell-and-tube configurations. They found that melt front movement of PCM, natural convection and heat transfer performance significantly depend on geometrical orientation of extended surfaces and volume concentration of GNP. The results of numerical simulations showed a 23-fold reduction in the melting time of 1% GNP doped paraffin (optimal amount of GNP in the range of 1 - 5%) for wire-wound fins configurations. Hosseinizadeh et al. [18] studied both experimentally and numerically effects of power levels, fin geometry (height, thickness) and number of fins on thermal performance of PCM-based heat sink. The authors concluded that by reducing the distance between the fins and increasing their height the melting period is reduced and the melting onset time of PCM is delayed while an increase in fin thickness had a slight contribution in enhancement of thermal performance. When approaching the development of a PCM-based heat sink with fins, it is useful to keep in mind several guidelines given by Hua et al. [19] gathered from literature reports. These observations relate to the shape of the fins, their thickness, the way they are arranged, the volume fractions of the fins and the PCM relative to the total volume of the heat sink. It follows that a fin volume fraction of 9% best improves heat transfer between the heat sink and the surroundings, which was confirmed experimentally by Baby and Balaji [20]. In case of PCM volume fraction, 90%, is usually chosen. The fin arrangement (alternating or linear) should be chosen depending on whether the heat sink contains PCM or not. For a heat sink without PCM, a staggered arrangement is preferred regardless of fin shape [21]. However, there is little work in the available literature on the effect of silver nanoparticles on the effective heat transfer enhancement of paraffin waxes. Kalidasan et al. [22] studied the effect of addition of graphene-silver (Gr:Ag) nanopowder for enhancement thermal energy storage of organic paraffin RT50 for effective utilization of solar energy. It was found that the addition of 1.0 wt.% Gr:Ag increased the effective thermal conductivity by 53.77% (from 0.212 to 0.326 Wm-1K-1) and only slightly reduced the latent heat of fusion of RT50 from 157.5 (pure RT50) to 157.3 J⋅g-1. It is also difficult to find papers in which the authors have investigated the effect of nano-additives with a weight percentage greater than 1% on the enhancement of heat transfer of paraffin waxes. The present work fits into this niche and, in addition, the effect of MWCNTs and silver nanowires on the thermal properties of commercially available and relatively cheap LTP ST paraffin was assessed.
2. Materials and Methods
The paraffin waxes LTP 56/20, LUXOLINA, LUXOLINA-ST and LTP ST were supplied by the national company POLWAX S.A., based in 38-200 Jasło, Poland. The materials were derived from crude oil processing (LTP 56/20, stearin 0.5%), contact refining of slack waxes (LUXOLINA, stearin 2.5%), composition of refined paraffin hydrocarbons with stearic acid (LUXOLINA-ST, oil<4.0%, stearin 10%), composition of paraffins with stearic acid(LTP ST, oil < 0.75%, stearin 30%). The density of the tested paraffins at 20.0 , determined by the double weighing method (in air and in water) using a RADWAG X/60/220 analytical balance (RADWAG, 26-600 Radom, Poland) with a readability of 0.01 / 0.1 mg, were: 890, 830, 870 and 930 kg⋅m-3, respectively [1]. Multi-walled carbon nanotubes (MWCNT) with an outer diameter of 5÷20 nm, length 1÷25 μm and wall number 2÷15 [23] were purchased from SMART NANOTECHNOLOGIES (32-566 Alwernia, Poland). The second nanomaterial was silver nanowires (SNW) with an average diameter of 50 nm and a length 5÷50 μm [24], purchased from the 3D NANO company (30-702 Kraków, Poland). Literature reports indicate that the density, specific heat and thermal conductivity of MWNCTs at RT are ρ=2100 kg⋅m-3, Cp=550 J⋅kg-1K-1 and k=2000 Wm-1K-1, respectively [25].
Based on the previously performed TG/DTG/DTA thermogravimetric and DSC microcalorimetric studies of the above-mentioned paraffins, the results of which are presented in [Table 1, Table 2 and Table 3], LTP ST paraffin was selected for further research as a phase transformation material for the construction of a passive cooling system for LED panels due to its (melting range (44.5 - 55.4) ℃, high latent heat of fusion ΔH = 218.8 J⋅g-1, high specific heat Cp = 2.11 J⋅kg-1K-1 and thermal conductivity k = 0.233 Wm-1K-1 at 0 ℃).
2.1. Preparation of LTP ST Paraffin with Nano-Additives
Samples of LTP ST paraffin for testing thermophysical properties with MWNCN or SNW nanoparticles were prepared by mechanical dispersion method. Continuous stirring during the cooling process produced a relatively homogeneous mixture when MWCNTs were added. The mass fraction of MWCNT dopant was determined using a RADWAG X/60/220 laboratory balance by weighing the crucible twice with the nano-additive alone and after adding paraffin wax. A section of the test material was taken from the central part of the respective mixture. Samples doped with MWCNTs with the following percentage mass fractions were obtained by the above method: 1.99%, 3.49%, 5.35%, 10.49%. Higher values for the mass fractions of carbon nanotubes, were difficult to achieve due to mixing problems caused by the change in consistency of the compound from liquid to solid. The SNW-doped LTP ST paraffin wax samples, in contrast to the MWCNT-doped ones, proved to be inhomogeneous in volume, despite intensive mixing of the resulting solution. In this case, the determination of the mass fraction of silver nanotubes in the paraffin matrix was carried out in two ways. One, by determining the density of the pure LTP ST wax and the density of the LTP wax with the addition of SNW by the buoyancy method in air and water using formula (Equation 1), and two, by the TG/DTG-DTA thermogravimetric method using STA 2500 Regulus, NETZSCH, Gerätebau GmbH, Selb, Germany and material samples previously subjected to DSC testing. The mass fractions of silver nanowires in LTP ST paraffin wax determined first were: 0.26%, 0.32% and 1.06%, while those determined from thermogravimetric studies were: 2.1% and 7.35%. The densities of LTP ST pure and doped with MWCNT or SNW are given in Table 1 and Table 2.
where:
- mass fraction of nano additive; - density of nano additive; - density of LTP ST paraffin wax
The explanation for the resulting differences in the percentage mass fractions of SNW in LTP ST may be as follows. The density of wax and wax with silver nanotubes was determined for the samples prepared for thermal diffusivity tests using a LFA 467 low-temperature diffusometer, NETZSCH Gerätebau GmbH, Selb, Germany. The samples were cylindrical in shape with a diameter of 12.7 mm and a height of 2.15÷2.20 mm. It can be assumed that the silver nanotubes were fairly evenly distributed in such a volume of wax. Thus, the mass fractions of SNW in LTP ST determined from equation (Equation 1) can be considered representative. On the other hand, in the case of thermogravimetric measurements, the mass of the test samples was a few milligrams. Hence, with such a small mass of samples occupying a volume of the order of 25 µL (each), it was possible to encounter an area of paraffin solution in which the silver nanotubes were concentrated. Guided by the thermogravimetric results, the mass fractions of the silver nanotubes in the LTP ST paraffin wax were assumed in the DSC studies to be: 2.1% and 7.35%.
2.2. Test Apparatus and Methodology
A DSC 404 F1 Pegasus flow-type differential scanning calorimeter, NETZSCH Gerätebau GmbH, Selb, Germany, was used to study thermal effects and specific heat. The mass of the LTP ST paraffin samples doped with nano-additives for DSC testing ranged from 11.49 mg to 14.02 mg. The samples were sealed in an aluminium pan covered with a lid with a pinhole. Thermal effects and specific heat were determined for a second heating and cooling occurring at a rate of 10 K⋅min-1 in an inert helium atmosphere with a flow rate of 40 mL⋅min-1 over the temperature range (-60÷120)(MWCNT ) and (-30÷90) (SNW ). The specific heat was determined using the 3-curve method and applying the DIN 51007 standard or Cp-ratio method implemented in the NETZSCH Proteus ver. 6.1 software. Sapphire (α - Al2O3) with a mass of 24.53 mg was used as the reference material. The reference and sample crucibles were initially annealed at 520 for 20 min. Two evacuations of the furnace chamber were applied before each measurement. At the beginning and end of each heating/cooling segment, the sample was left in thermal equilibrium for 20 min. A second heating/cooling cycle was included in the analysis to eliminate effects related to the history of the test material. The temperature and sensitivity calibration of the DSC instrument was carried out using reference materials: In, Sn, Bi and Zn.
The thermal diffusivity of the test specimens was determined using the pulse method with the LFA 467 instrument over the temperature range of (-50 ÷30) with a step of 20 . The test specimens were disc-shape with a diameter of 12.60-12.70 mm and a thickness of 2.15 to 2.20 mm, and their front and back surfaces were sprayed with GRAPHIT33 (Kontakt Chemie, CRC Industries Deutschland GmbH, Iffezheim, Germany) with a thickness of approximately 10 µm [28]. For each temperature, the xenon lamp generated 3 pulses sequentially, each with a duration of 0.6 ms. The theoretical Cowan model [29] with pulse correction was used to determine the thermal diffusivity using non-linear regression. Based on thermal diffusivity studies, the specific heat and thermal conductivity were also determined by a comparative method [1] for the tested LTP ST paraffin-based compositions using the reference material pyroceram 9606.
3. Passive Cooling System Design
In order to carry out heat transfer studies of the passive cooling system and to benchmark the temperature characteristics obtained, three different versions of the heat sinks shown in Figure 1 were designed:
(a) heat sink without PCM filling - no chamber - configuration A;
(b) heat sink with PCM chamber without intra-chamber fins - configuration B;
(c) heat sink with PCM chamber with intracellular fins - configuration C
with the LED panel shown in Figure 2 under test.
The individual components of the heat sinks were made by machining on a HAAS TM-1P CNC milling machine, ensuring a high accuracy of the design geometry. The material used was PA6 aluminum alloy (PN/EN: 2017A; ISO: AlCu4MgSi(A)) with well-known thermo-physical properties [30]. Each of the designed heat sinks was tested for the cooling efficiency of the LED panel shown in Figure 2 and fixed as shown in Figure 3.
3.1. Measurement System and Data Acquisition
The temperature at the characteristic points of the system (Figure 3) and the ambient temperature were measured using K-type sheathed thermocouples (NiCr - NiAl) of outer sheath diameter . The temperature at the main measurement point of the LED panel was chosen as an indirect criterion for comparing different configurations of the passive cooling system. The control measurement points were necessary to select the boundary conditions in the computer simulations carried out. The thermocouples were connected to an NI 9211 thermocouple card plugged into the NI CompactDAQ Chassis cDAQ - 9172 from National Instruments. The recorded thermoelectric signal was converted to a temperature value and stored on the computer disk. The entire measurement process was controlled from the LabVIEW Signal Express computer software. A view of the measurement system during the test is shown in Figure 4.
4. Results and Discussion
4.1. Results of Measurements of Thermophysical Properties
In order to determine the thermal degradation temperature of LTP ST paraffin, it was assumed in thermogravimetric tests carried out with the STA 2500 Regulus that this corresponds to the value at which a 5% loss of initial sample mass occurs. This information is necessary to determine a safe temperature range for other tests. Figure 5 shows a thermogram for pure LTP ST paraffin and for paraffin doped with 2.1 wt% silver nanowires. The thermal degradation temperature for pure LTP ST paraffin is 191.7, which is 3.7 lower than LTP ST with SNW. The process occurs most rapidly at 246.7 (-17% ⋅min-1) for pure and at 276.1 (-13%⋅min-1) for doped paraffin. The increase in temperature for LTP paraffin with SNW, at which thermal degradation starts, may be due to a modification of the paraffin structure leading to an increase in its activation energy while the decrease in the rate of thermal degradation may be due to a more uniform heat distribution in the test sample due to the much higher thermal conductivity of silver nanowires than of the LTP ST paraffin itself. Based on the results of the TG/DTG-DTA tests, an upper temperature limit for further LTP ST paraffin studies of 100 has been adopted.
Selected LTP ST paraffin wax was doped with multi-walled carbon nanotubes to increase the thermal conductivity of this material. Samples with four different mass fractions in the range of up to 10.5 wt% were subjected to DSC tests, using identical measurement procedures and parameters to those used when testing pure LTP ST paraffin. The recorded DSC signals of LTP ST paraffin doped with MWCNTs are shown in Figure 6 and their apparent specific heat in Figure 7. The first, smaller peak, visible in Figure 6, is related to the solid-solid phase transition. Such a phase transition is probably due to the reorganization of the crystal structure from orthorhombic to hexagonal, which is typical for alkanes with an even number of carbon atoms in the range 20 < n < 32 [31]. The second, larger peak, relates to the solid/liquid phase transition in the case of heating or the liquid/solid phase transition in the case of cooling.
Comparing the DSC curves obtained (Figure 6), it can be seen that the MWCNT samples are characterized, in the phase transition region, by much flatter runs than for pure wax. This translates into a decrease in the specific enthalpy of melting/solidification. The lowest specific enthalpy of melting value of 170.2 J∙g-1 is characterized by the LTP ST sample + 10.49 wt% CNTs, which is the sample with the highest mass fraction of the nano-additive. As the amount of MWCNT in the sample increases, the paraffin mass fraction value decreases, which is responsible for the proportional decrease in the specific enthalpy of the phase transformation. The doping also caused an average doubling of the subcooling with respect to pure LTP ST paraffin wax.
The recorded DSC signals of LTP ST paraffin doped with SNW are shown in Figure 8 and their apparent specific heat in Figure 9. A summary of the characteristic values of the temperature and specific enthalpies of the phase transformations of LTP ST wax doped with MWCNTs or SNW is shown in Table 3.
For the purposes of numerical simulations, the coefficients of the linear regression equation are given in Table 4 separately for the solid (s) and liquid (l) phases of the sensible specific heat capacity in the form .
The analysis of the thermal effects of the doped LTP ST samples showed that (Table 3) the relative increase in the degree of supercooling was on average 100% for carbon nanotubes, and in relation to silver nanowires it was equal to 36% for 2.1% SNW and 55% for 7.35% SNW. The relative decrease in latent heat of fusion was in the range of 15÷25% for samples doped with MWCNT and 14÷16% for samples doped with SNW.
The results of thermal diffusivity tests in the temperature range -60÷30 for the LTP ST paraffin doped with nano-additives using the impulse method and applying the LFA 467 diffusometer are shown in Figure 10 and Figure 11 and tabulated in Table 5. Additionally, it was possible to determine the thermal conductivity by the comparative method using the reference material pyroceram 9606 with known thermophysical properties. The test results of thermal conductivity are shown in Figure 12 and Figure 13 and tabulated in Table 6. The numerical values of thermal diffusivity and thermal conductivity are given with expanded uncertainties with coverage factor k=2. Total standard uncertainties were determined based on type A uncertainty, related to random errors, and type B uncertainty, corresponding to systematic errors.
Based on the results of thermal diffusivity tests of pure LTP ST paraffin and paraffin doped with nano-additives in the temperature range from -60℃ to 30℃, an increase in its value can be observed in proportion to the increase in their mass fraction. The average increase in thermal diffusivity of samples with MWCNT addition compared to pure paraffin was: 30% for 1.99% CNT, 37% for 3.49% CNT and 44% for 5.35% CNT. In the case of silver nanowires, a relative increase in thermal diffusivity was observed at the level of: 24% for 0.26% SNW, 26% for 0.32% SNW and 91% for 1.06% SNW.
The doping of LTP ST paraffin wax with multi-walled carbon nanotubes did not show a significant improvement in the thermal conductivity of the tested samples (Table 6). For the sample with the highest mass fraction of MWCNT of 5.35 wt%, the increase in thermal conductivity compared to pure LTP ST paraffin wax at T=10℃ was less than 5%. This value is within the measurement error range. For lower temperature values, this increase was slightly larger and at T=-10 it amounted to 17%. The use of silver nanowires increased the thermal conductivity of LTP ST paraffin wax to a greater extent than the MWCNT. The relative increase in thermal conductivity at T=10 was 5% for the 0.26% SNW, 13% for the 0.32% SNW and 94% for the 1.06% SNW (Table 6).
The decrease in the thermal diffusivity of LTP ST paraffin doped with carbon nanotubes of silver nanowires with increasing temperature, as seen in Figure 10 and Figure 11, can be attributed to changes in material properties and microstructural effects. It is well known that CNT and SNW nano-additives have a high aspect ratio. When carbon nanotubes or silver nanowires are dispersed in LTP ST paraffin, they create additional phonon scattering centers and introduce interfacial thermal resistance. In insulating materials, which include paraffins, phonons are the main energy carriers. As the temperature increases, the number of phonons also increases, leading to more phonon scattering. As a result, the ability of the materials to conduct heat decreases in relative to their ability to store heat, which corresponds to a decrease in thermal diffusivity. The sharp decrease in thermal diffusivity seen in Figure 10 and Figure 11 for temperature higher than 10 can be attributed to paraffin solid-solid phase transition associated with the reorganization of the paraffin LTP ST structure from orthorhombic to hexagonal.
The addition of carbon nanotubes or silver nanowires to LTP ST paraffin results in an increase in thermal conductivity as their mass fraction increases, as can be seen in Figure 12 and Figure 13. This is due to the formation of an increasing number of pathways in paraffin doped with nano-additives with high thermal conductivity, which facilitates heat transfer. The decrease in thermal conductivity of SNW-doped LTP ST paraffin in the temperature range from –60 to 20, as seen in Figure 12, may be due to the increase in the number of inelastic collisions between phonons and silver nanowires, resulting in the loss of some of their thermal energy and a decrease in thermal conductivity. The thermal conductivity of LTP ST paraffin doped with MWCNT, shown in Figure 13, behaves slightly differently. In the temperature range from -50 to -10, an increase of thermal conductivity is visible and then its values start to decrease. The decrease in thermal conductivity with increasing temperature above -10 in the case of carbon nanotubes (Figure 13) may be related to the rapid transfer of atomic vibrations from one end to the other in MWCNT with a regular crystalline structure, rather than to the scattering of phonons on it [32].
4.2. Experimental Results of the Passive Cooling System
Experimental results on the performance of a passive cooling system for LED panels supplied with 34.5 W of DC power from a stabilized PPS 2017 power supply (American Reliance, Inc., Pasadena, CA 91103 USA) are shown in Figure 14. The temperature measurement points are marked in Figure 4. The following colors have been assigned to the measurement points: red - temperature on the board near the LED, green - fin, yellow - PCM, black – room.
The results of testing the cooling efficiency of the LED panel using the developed types of heat sinks in configuration A, B and C (Figure 14) allow to conclude that:
- ✓
- The cooling system in configuration A is characterized by a compact design, which translated into a relatively low thermal resistance compared to other designs with PCM chambers. The temperature difference between the LED panel and the measurement point located on the side surface of the fin (at state state) averaged 1.1.
- ✓
- Equipping the system (heat sink) with a paraffin-filled chamber (configuration B) increased the thermal stabilization time of the working system from 260 min up to 480 min, i.e. by 185% compared to configuration A. There was also a decrease in the maximum excess temperature of the LED panel by 4.4% compared to configuration A. The temperature difference between the LED panel and the fin increased to 3.7 This increase is a consequence of the higher thermal resistance at the interface of the LED panel and the fin. This is due to the fact that the the effective thermal conductivity of the chamber containing the PCM for configuration B is significantly lower than the thermal conductivity of the solid AW2017A material used to build the heat sink in configuration A.
- ✓
- Configuration C has a 127% longer thermal stabilization time compared to system A. The temperature difference between the LED panel and the fin was 2.1. The use of fins inside the PCM chamber improved the heat transfer to the phase change material and to the lid with external fins. This is evidenced by a direct comparison of configurations B and C with configuration A, which shows lower surface temperatures for the LED panel in configuration C in the first 130 min of operation. In the longer term, the heat sink in configuration B, with more PCM material, gains the advantage. The PCM chamber of C-system was reduced by the volume of in-chamber fins, which was 18.7% of the original volume of the B-system chamber.
- ✓
- The temperature course of the PCM material is characterized by a variable temperature rise rate in the range of 38÷48, which corresponds to the melting of LTP ST paraffin wax and is consistent with the DSC results.
It should be noted here that the PCM material used for the study was pure LTP ST paraffin without nano-additives due to the relatively high purchase cost of purchase, especially of silver nanowires.
5. Conclusions
The paper presents the results of experimental studies of the thermophysical parameters of POLWAX’s commercially available LTP ST paraffin doped with multi-walled carbon nanotubes or silver nanowires with relatively high mass fraction. The results of temperature measurements at selected points of the developed versions of the LED panel cooling systems in configurations A, B and C are also presented. Based on the results obtained, it was concluded that:
- ✓
- Latent heat of fusion decreased by 25.1% for 10.49 wt% of MWNCT and 15.7% for 7.35 wt% of SNW compared to pure LTP ST paraffin (Table 3). The relative decrease in the latent heat of fusion in the case of MWCNT can be expressed by the correlation formula Δh/h = -1.179⋅wt% -13.128, R2=0.9644.
- ✓
- The average increase in thermal diffusivity in the temperature range from -50 to 30 was 23.0%, 27.0%, 93.5% respectively for 0.26 wt%, 0.32 wt%, 1.06 wt% of SNW and 29.7%, 36.3%, 43.9% respectively for 1.99 wt%, 3.49 wt%, 5.35 wt% of MWCNT in relation to thermal diffusivity of LTP ST pure paraffin (Table 5).
- ✓
- The average increase in thermal conductivity in the temperature range from -50 to 30 was 7.2%, 12.4%, 105.1% for 0.26 wt%, 0.32 wt%, 1.06 wt% SNW and -6.6%, 3.3%, 7.1%, respectively for 1.99 wt%, 3.49 wt%, 5.35 wt% MWCNT relative to the thermal conductivity of pure LTP ST paraffin (Table 6).
- ✓
- The use of the heat sink in configuration C to cool the LED panel while it was in operation increased the time by 127% compared to configuration A, after which the LED panel temperature stabilized at 58 (Figure 14D).
The experimental results of thermophysical parameters of pure LTP ST paraffin and doped with MWCNT or SNW presented in this work can be used in the process of numerical modelling of heat transfer with phase transitions of the first kind. The numerical simulations results obtained in this way can be validated against the temperature measurements presented in this paper using the developed heat sinks versions.
Author Contributions
Conceptualization: (J.Z.), methodology (J.Z., P.Z.), investigations (J.Z., P.Z., P.K.), writing – original draft: (J.Z.), supervision: (J.Z.). All authors have read and agreed to the published version of the manuscript.
Funding
This research received no external funding.
Data Availability Statement
Not applicable. All data of this research are presented in this article.
Acknowledgments
The authors would like to thank Mateusz Zieliński from MUT for his help with the graphs.
Conflict of Interest
The authors declare no conflict of interest.
References
- Zbińkowski, P.; Zmywaczyk, J.; Koniorczyk, P. Experimental investigations of thermophysical properties of some paraffin waxes industrially manufactured in Poland. AIP Conference Proceedings 2017, 1866, 040044. [Google Scholar]
- Khandekar, S.; Sahu, G.; Muralidhar, K.; Gatapova, E.Y.; Kabov, O.A.; Hu, R.; Luo, X.; Zhao, L. Cooling of high-power LEDs by liquid sprays: Challenges and prospects. Appl. Therm. Eng. 2021, 184, 115640. [Google Scholar] [CrossRef]
- Pimputkar, S.; Speack, J.S.; DenBaars, S.P.; Nakamura, S. Prospects for LED lighting, Nat. Photon 2009, 3, 180–182. [Google Scholar] [CrossRef]
- Lasance, C.J.M.; Poppe, A. (Eds.) Thermal management for LED Applications; Springer: New York, 2014. [Google Scholar]
- Kandasamy, R.; Wang, X.Q.; Mujumdar, A.S. Transient cooling of electronics using phase change material (PCM)-based heat sinks. Appl. Therm. Eng. 2008, 28, 1047–1057. [Google Scholar] [CrossRef]
- Sökmen, K.F.; Yürüklü, E.; Yamankaradeniz, N. Appl. Therm. Eng. 2016, 94, 534–542. [CrossRef]
- Weling, G.; Xuejiao, J.; Fei, Y.; Bifeng, C.; Wei, G.; Ying, L.; Weiwei, Y. Characteristics of high power LEDs at high and low temperature. J. Semicond. 2011, 32, 044007. [Google Scholar]
- Narendran, N.; Gu, Y. Life of LED-Based White Light Sources. IEEE/OSA Journal of Display Technology 2005, 1, 167–171. [Google Scholar] [CrossRef]
- Banaszek, J.; Domanski, R.; Rebow, M.; El-Sagier, F. Experimental study of solid-liquid phase change in a spiral thermal energy storage unit. Appl. Therm. Eng 1999, 19, 1253–1277. [Google Scholar] [CrossRef]
- Himran, S.; Suwono, A.; Mansoori, G.A. Characterization of Alkanes and Paraffin Waxes for Application as Phase Change Energy Storage Medium. Energy Sources 1994, 16, 117–128. [Google Scholar] [CrossRef]
- Mehling, H.; Cabeza, L.F. Heat and Cold Storage with PCM. An up to date introduction into basics and applications (Springer, 2008), Heat and Mass Transfer Vol. 308.
- Farid, M.M.; Khudhair, A.M.; Razack, S.A.K.; Al-Hallaj, S. A review on phase change energy storage: materials and applications. Energy Convers. Manag. 2004, 45, 1597–1615. [Google Scholar] [CrossRef]
- Al-Yasiri, Q.; Szabó, M. Paraffin as a Phase Change Material to Improve Building Performance: An Overview of Applications and Thermal Conductivity Enhancement Techniques. Renew. Energy Environ. Sustain. 2021, 6, 38. [Google Scholar] [CrossRef]
- Zhang, M.; Wang, C.; Luo, A.; Liu, Z.; Zhang, X. Molecular dynamics simulation on thermophysics of paraffin/EVA/ graphene nanocomposites as phase change materials. Appl. Therm. Eng. 2020, 166, 114639. [Google Scholar] [CrossRef]
- Sahan, N.; Fois, M.; Paksoy, H. The effects of various carbon derivative additives on the thermal properties of paraffin as a phase change material. Int. J. Energy Res. 2016, 40, 198–206. [Google Scholar] [CrossRef]
- Ma, C.; Zhang, Y.; Chen, X.; Song, X.; Tang, K. Experimental study of an enhanced phase change material of paraffin/ expanded graphite/nano-metal particles for a personal cooling system. Materials (Basel) 2020, 13, 980. [Google Scholar] [CrossRef] [PubMed]
- Khan, Z.; Khan, Z.A. Role of extended fins and graphene nano-platelets in coupled thermal enhancement of latent heat storage system. Energy Convers. Manag. 2020, 224, 113349. [Google Scholar] [CrossRef]
- Hosseinizadeh, S.F.; Tan, F.L.; Moosania, S.M. Experimental and numerical studies on performance of PCM-based heat sink with different configurations of internal fins. Appl. Therm. Eng. 2011, 31, 3827–3838. [Google Scholar] [CrossRef]
- Hua, W.; Zhang, L.; Zhang, X. Research on passive cooling of electronic chips based on PCM: A review. J. Mol. Liq. 2021, 340, 117183. [Google Scholar] [CrossRef]
- Baby, R.; Balaji, C. Thermal management of electronics using phase change material based pin fin heat sinks, 6th European Thermal Sciences Conference (Eurotherm 2012). Journal of Physics: Conference Series 2012, 395, 012134. [Google Scholar]
- Ali, H.M.; Ashraf, M.J.; Giovannelli, A.; Irfan, M.; Irshad, T.B.; Hamid, H.M.; Hassan, F.; Arshad, A. Thermal management of electronics: An experimental analysis of triangular, rectangular and circular pin-fin heat sinks for various PCMs. Int. J. Heat Mass Transf. 2018, 123, 272–284. [Google Scholar] [CrossRef]
- Kalidasan, B.; Pandey, A.K.; Rahman, A.; Yadav, A.; Samykano, M.; Tyagi, V.V. Graphene-silver hybrid nanoparticle based organic phase change materials for enhancement thermal energy storage. sustainability 2022, 14, 13240. [Google Scholar] [CrossRef]
- Available online: https://www.smartnanotechnologies.com.pl (accessed on 26 June 2023).
- Available online: https://3d-nano.com (accessed on 26 June 2023).
- Alizadeh, H.; Pourpasha, H.; Heris, S.Z.; Estell´e, P. Experimental investigation on thermal performance of covalently functionalized hydroxylated and non-covalently functionalized multi-walled carbon nanotubes/transformer oil nanofluid. Case Studies in Thermal Engineering 2022, 31, 101713. [Google Scholar] [CrossRef]
- Kim S.H., Mulholland G.W., M.R. Zachariah G.W. Density measurement of size selected multiwalled carbon nanotubes by mobility-mass characterization. Carbon 2009, 47, 1297–1302. [CrossRef]
- Wiśniewski, S. Heat transfer; PWN; Warszawa, 1988; ISBN 83-01-07917-7; (In Polish).
- Panas, A.J.; Szczepaniak, R.; Stryczniewicz, W.; Omen, Ł. Thermophysical properties of temperature-sensitive paint. Materials 2021, 14, 2035. [Google Scholar] [CrossRef]
- Cowan, R.D. Pulse method of measuring thermal diffusivity at high temperatures. J. Appl. Phys. 1963, 34, 926–927. [Google Scholar] [CrossRef]
- Panas, A.J.; Panas, J.J.; Polakowski, H.; Piątkowski, T. Badania zależności temperaturowych rozszerzalności cieplnej i ciepła właściwego stopu glinu PA-6, Biuletyn WAT Vol. LX, Nr 4, 2011 (in Polish).
- Zmywaczyk, J.; Zbińkowski, P.; Smogór, H.; Olejnik, A.; Koniorczyk, P. Cooling of high-power LED lamp using a commercial paraffin wax. Int. J. Thermophys 2017, 38, 45. [Google Scholar] [CrossRef]
- Mamaodva, S.; Baba, T.; Mori, T.; Huseynov, A.; Zeynalov, E. Thermal transport properties of MWCNT based natural Azerbaijani bentonite ceramic composities. Int. J. Thermophys 2023, 44, 91. [Google Scholar] [CrossRef]
Figure 1.
Designed cooling and temperature stabilization systems in three configurations: A, B, C.
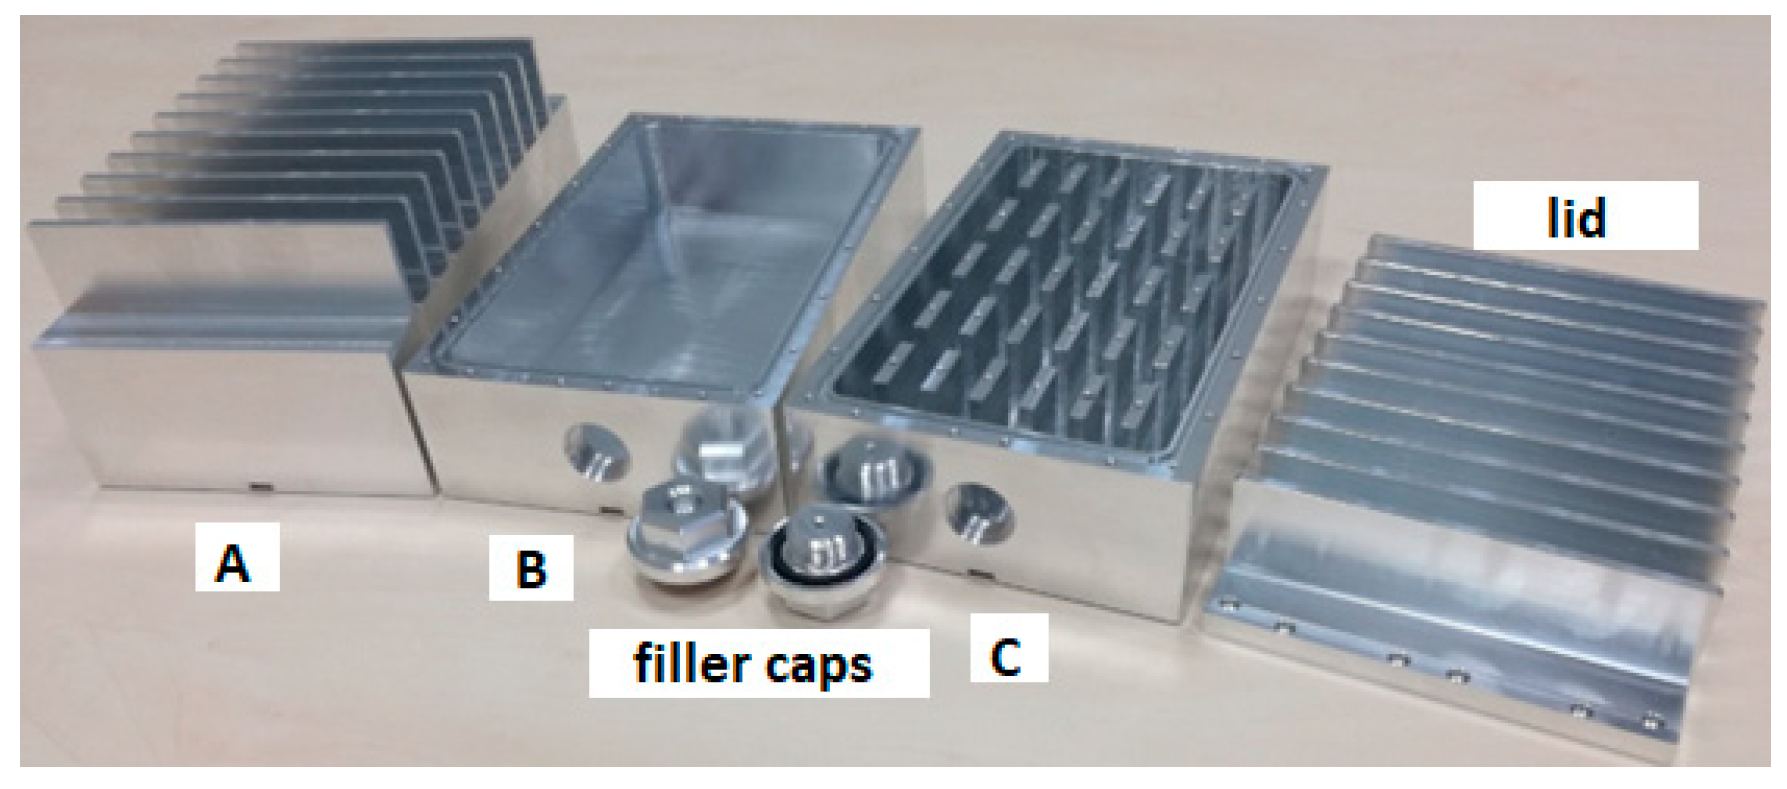
Figure 2.
View of the LED panel.
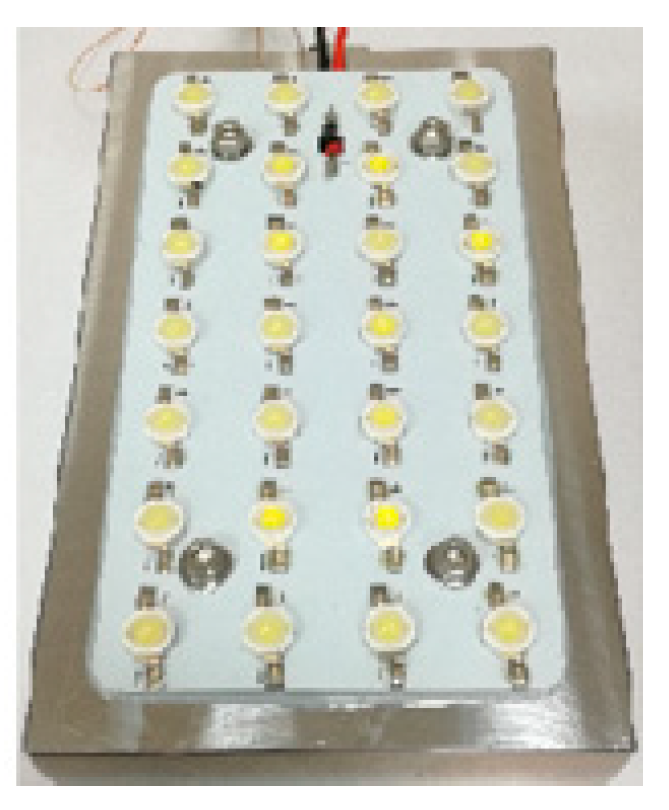
Figure 3.
Passive cooling system installation drawing - based on configuration C, 1 - 28W Power LED panel, 2 – LED panel fixing screws, 3 - PCM material filler plug.
Figure 3.
Passive cooling system installation drawing - based on configuration C, 1 - 28W Power LED panel, 2 – LED panel fixing screws, 3 - PCM material filler plug.
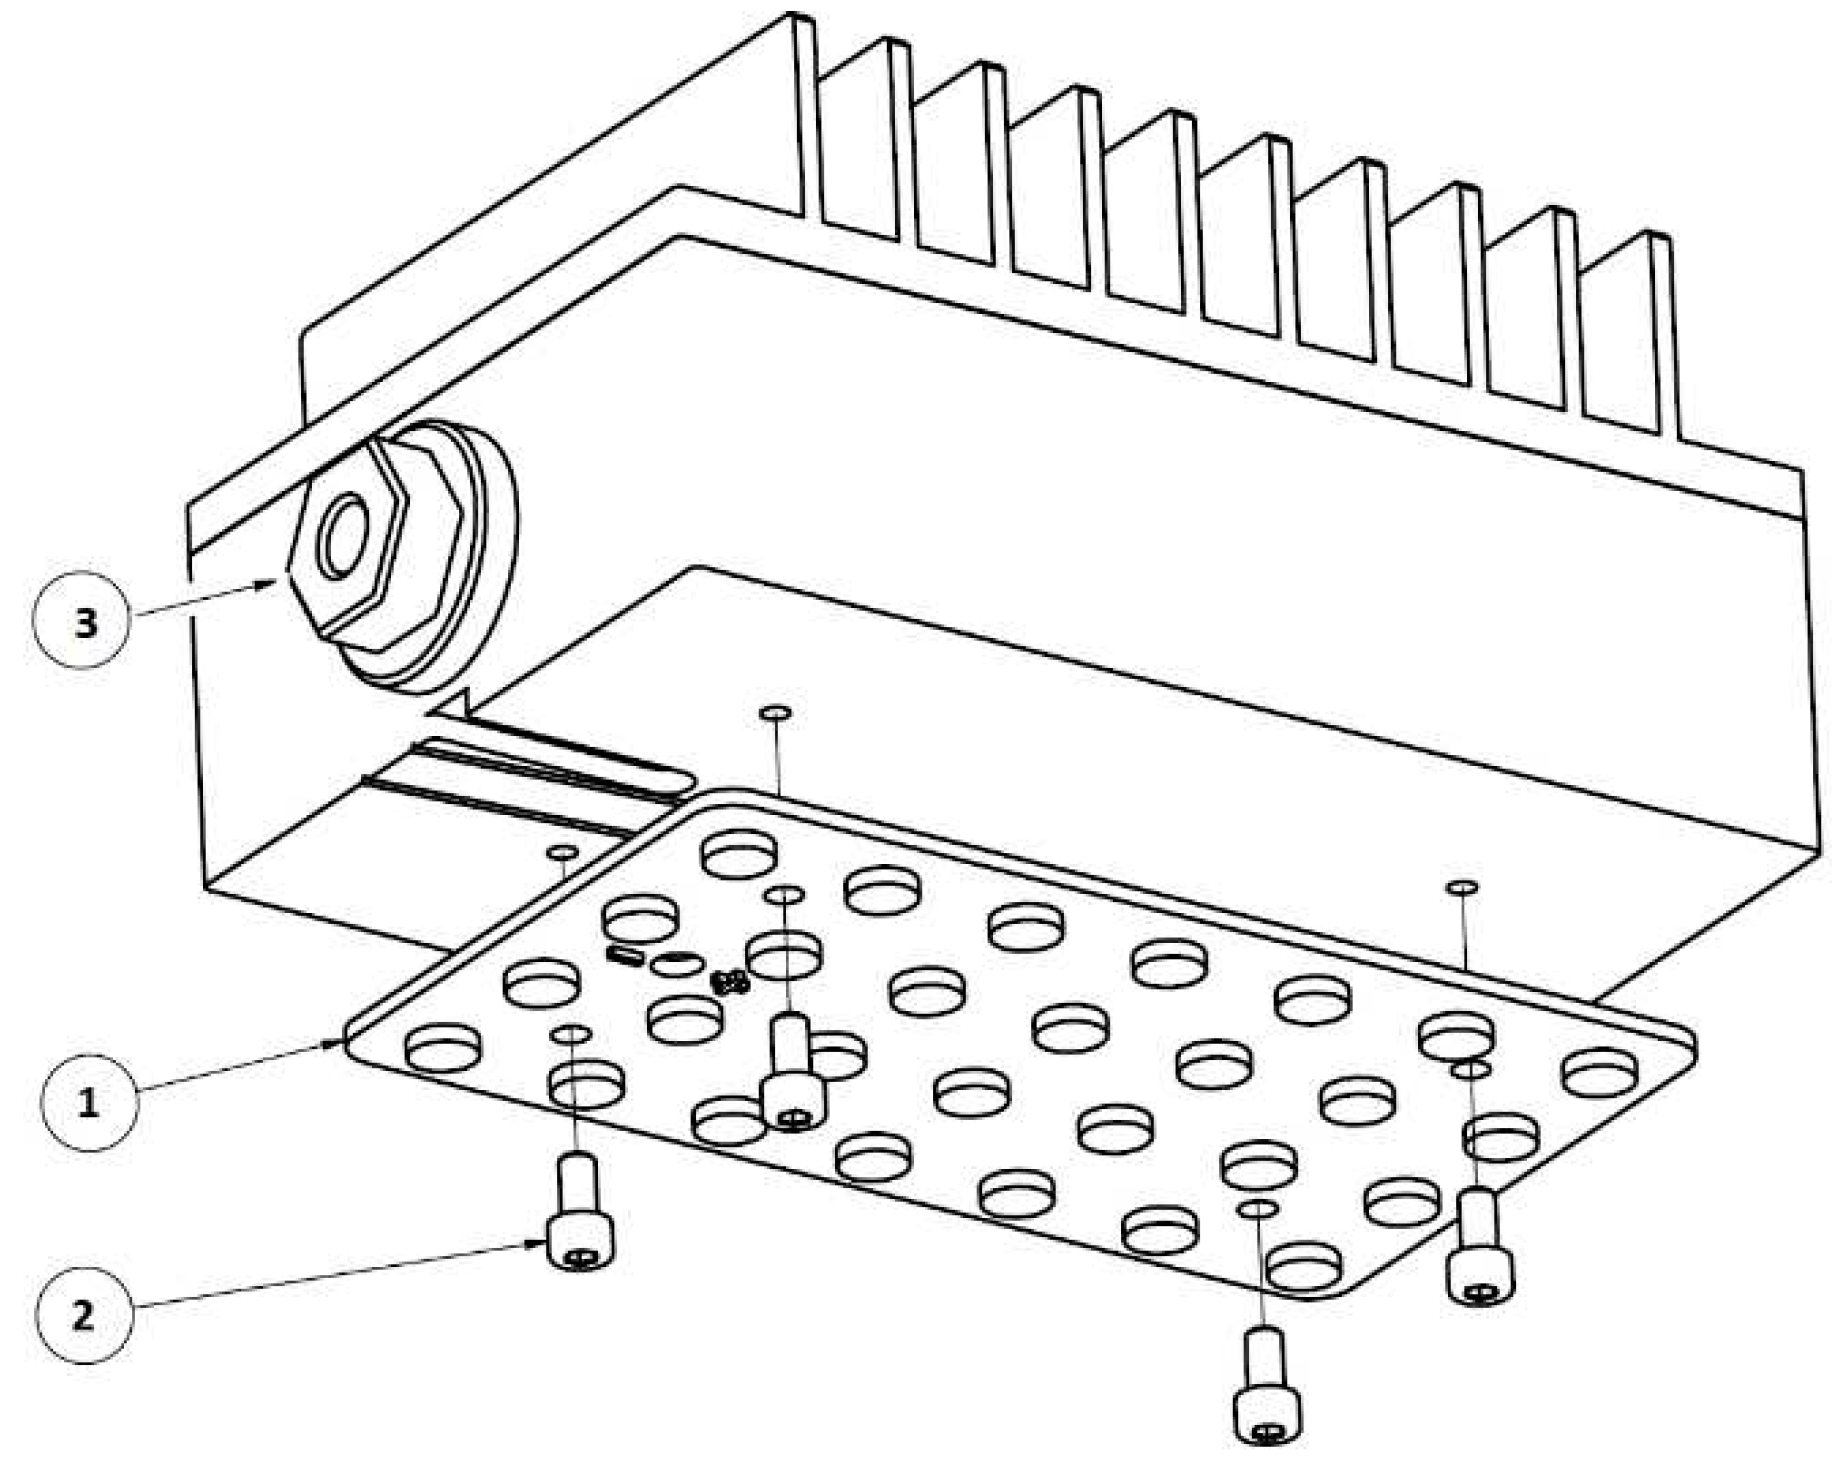
Figure 4.
Arrangement of the hot junctions of the thermocouples in the tested system in configuration B, 1 main temperature measurement point of the LED panel (in red); 2÷4 control temperature measurement points (in green) sequentially of the LED panel, the PCM material and the side surface of the cover fin.
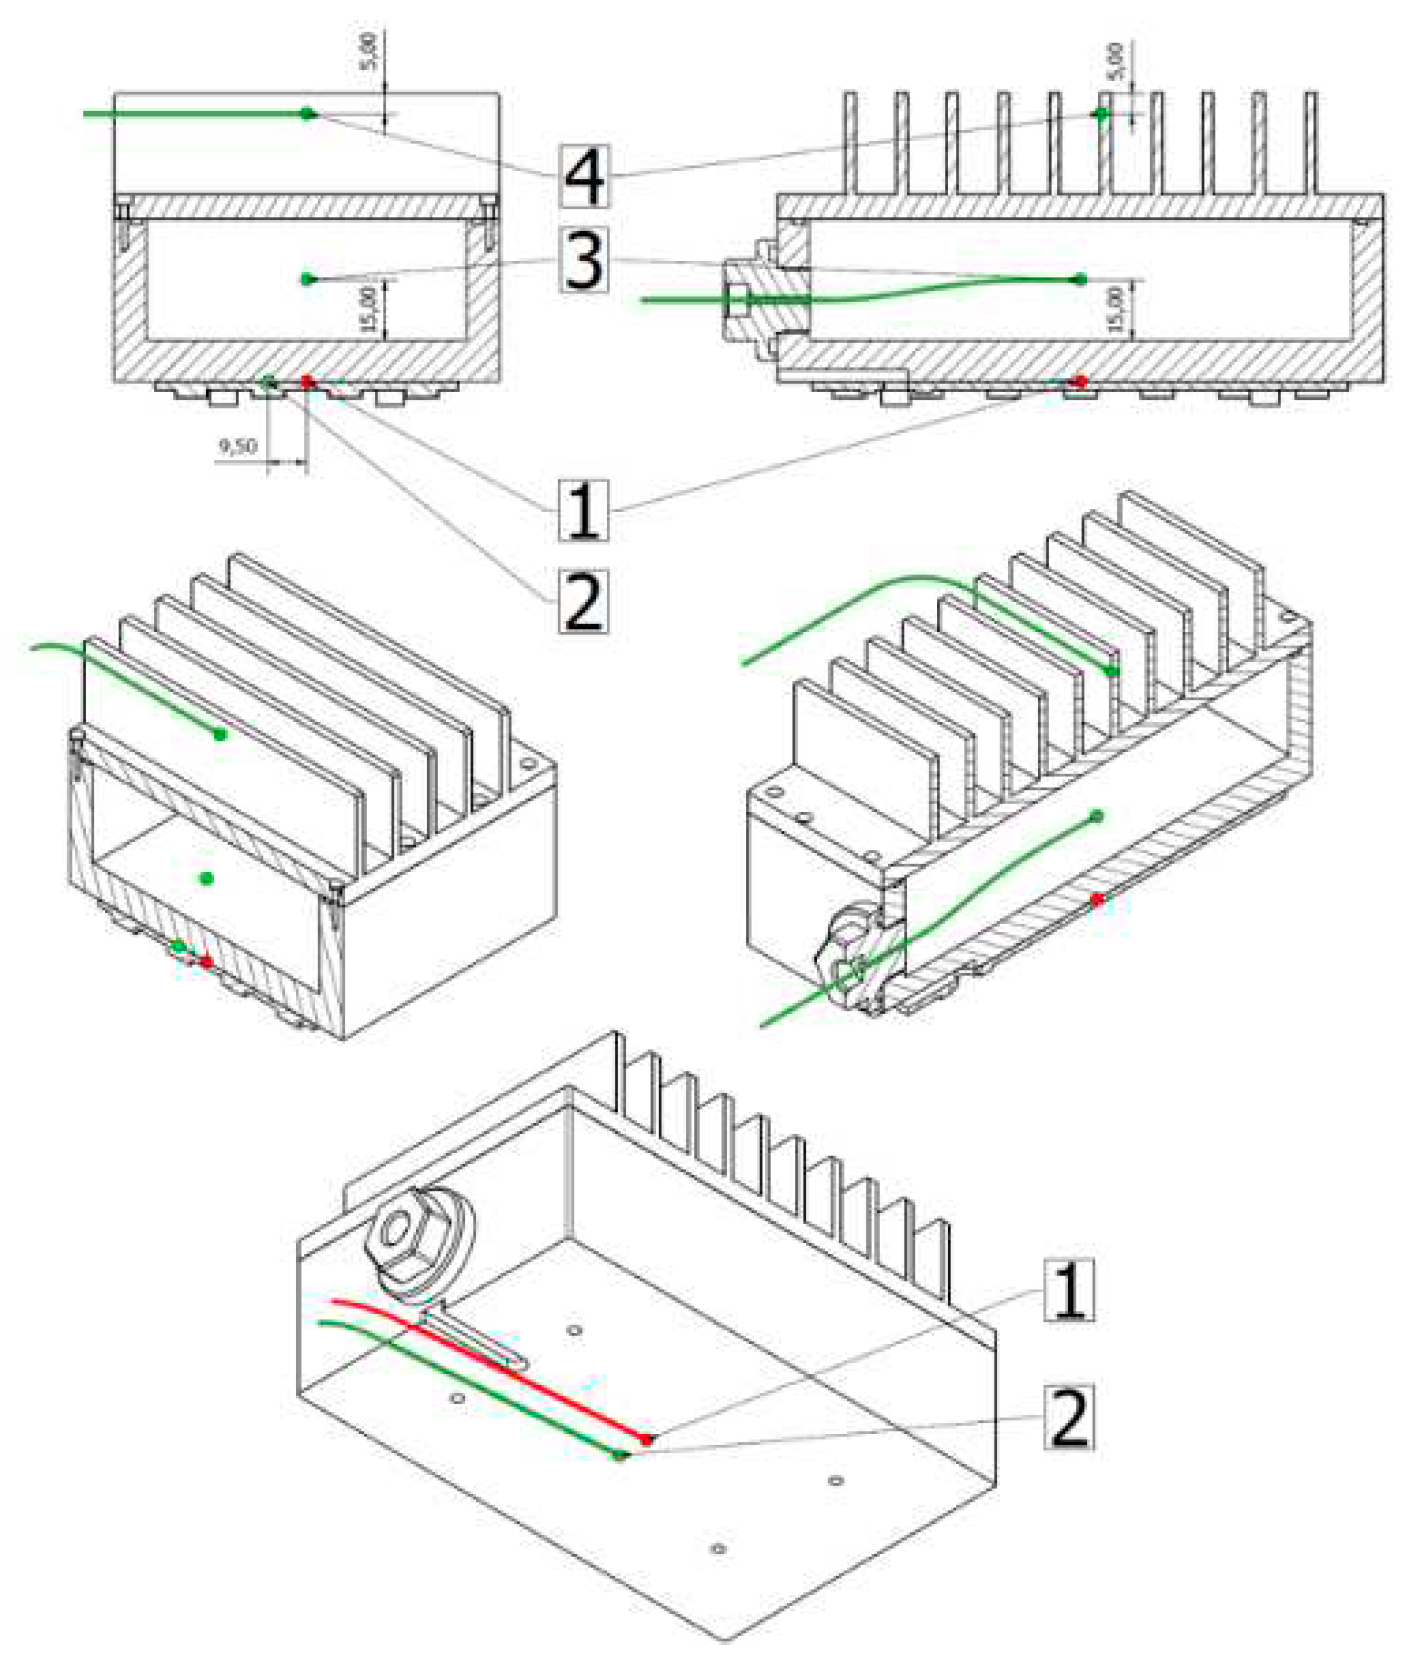
Figure 5.
TG/DTG thermogram of pure LTP ST and doped with 2.1 wt% silver nanowires obtained with STA 2500 Regulus (HR stands for heating rate).
Figure 5.
TG/DTG thermogram of pure LTP ST and doped with 2.1 wt% silver nanowires obtained with STA 2500 Regulus (HR stands for heating rate).
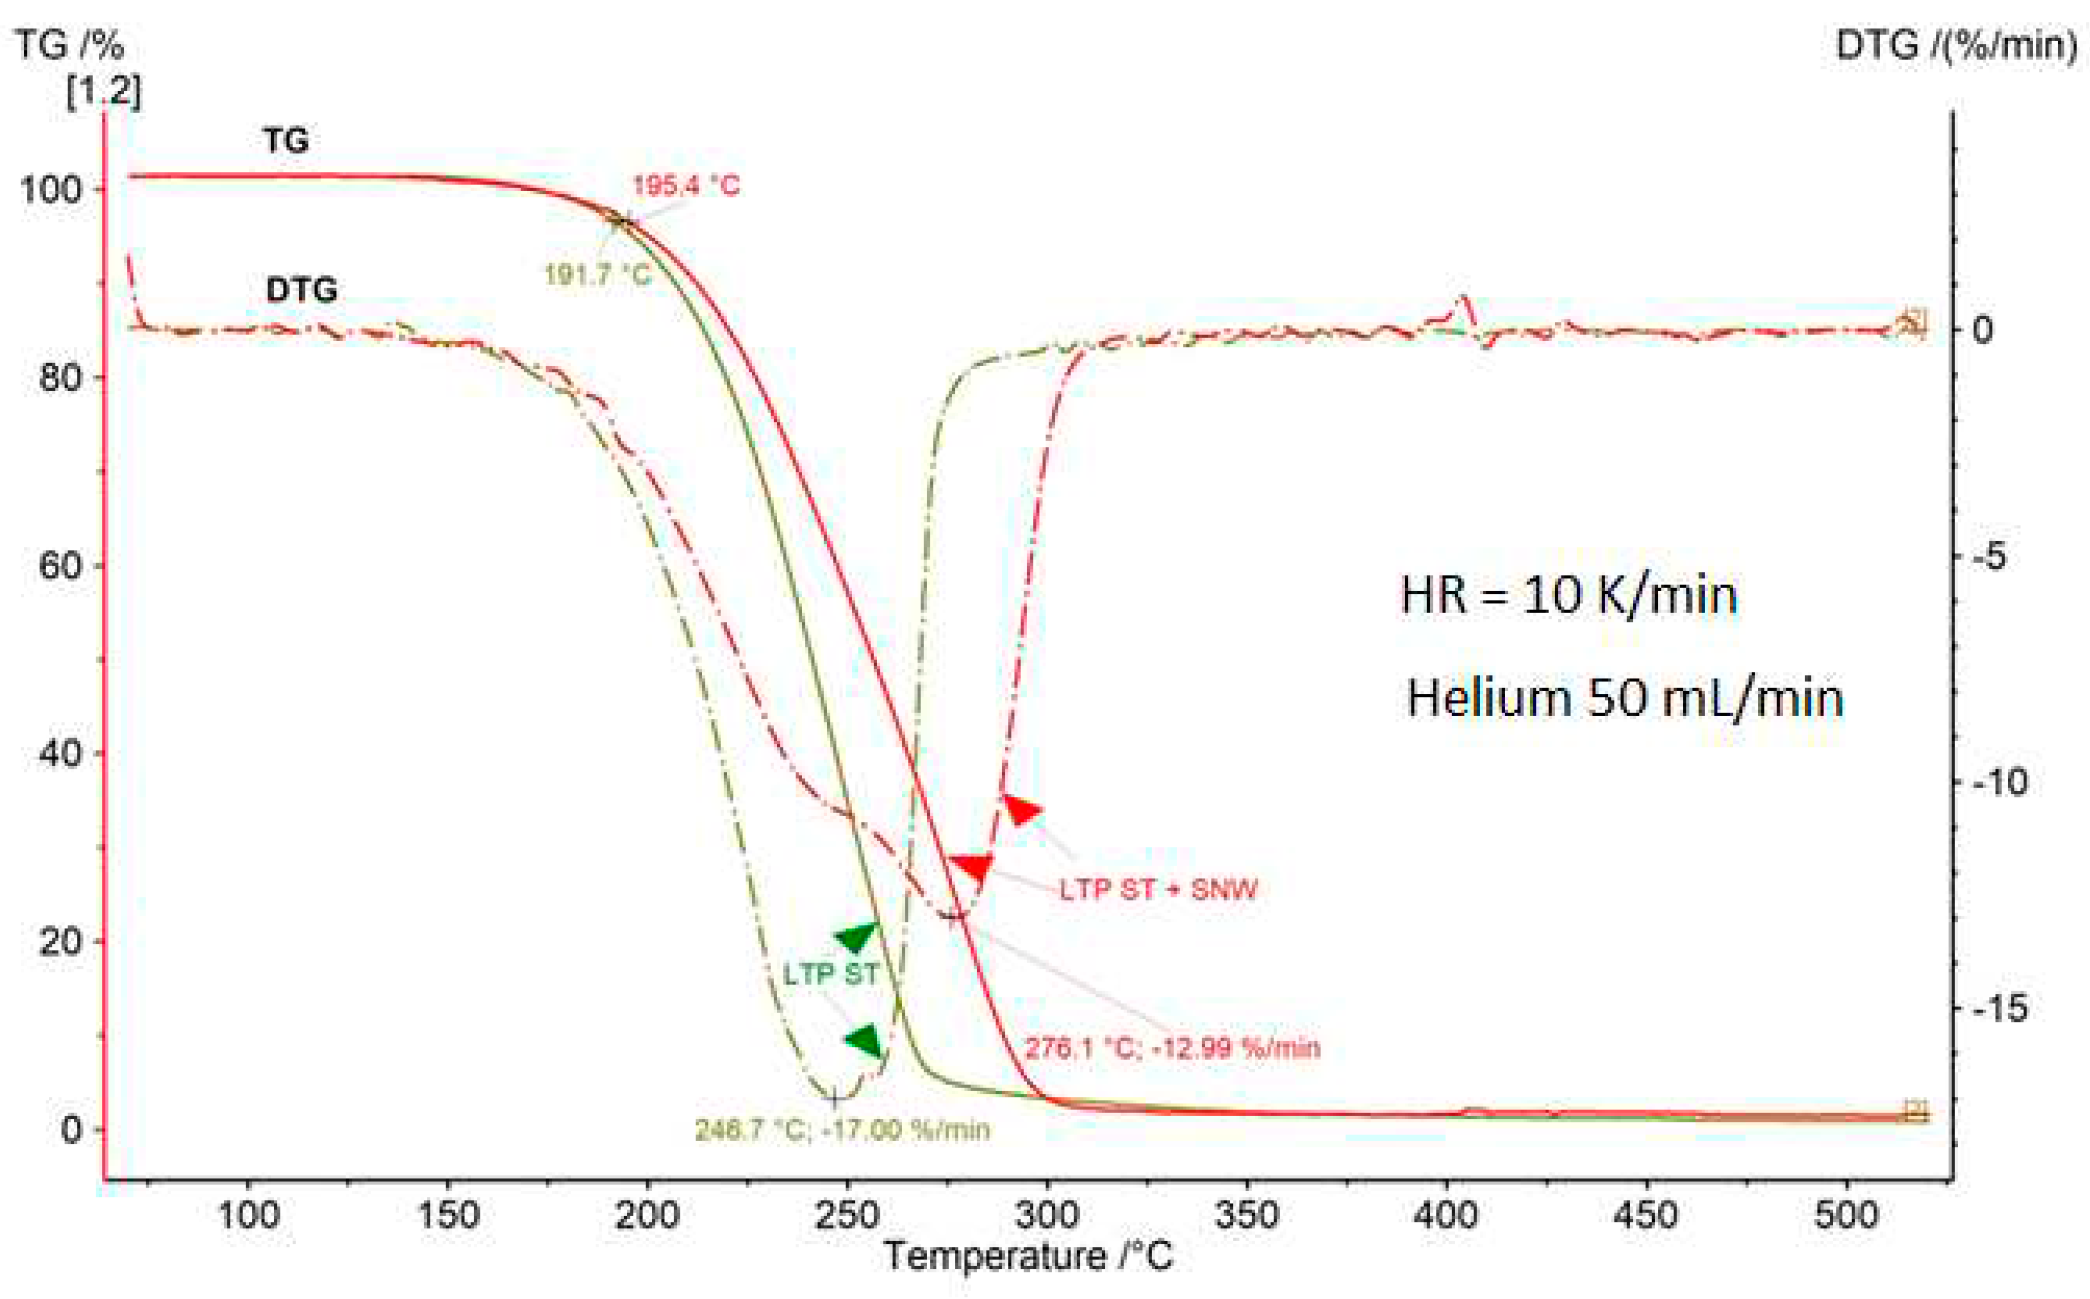
Figure 6.
DSC thermogram of LTP ST paraffin doped with multi-walled carbon nanotubes labelled as CNT.
Figure 6.
DSC thermogram of LTP ST paraffin doped with multi-walled carbon nanotubes labelled as CNT.
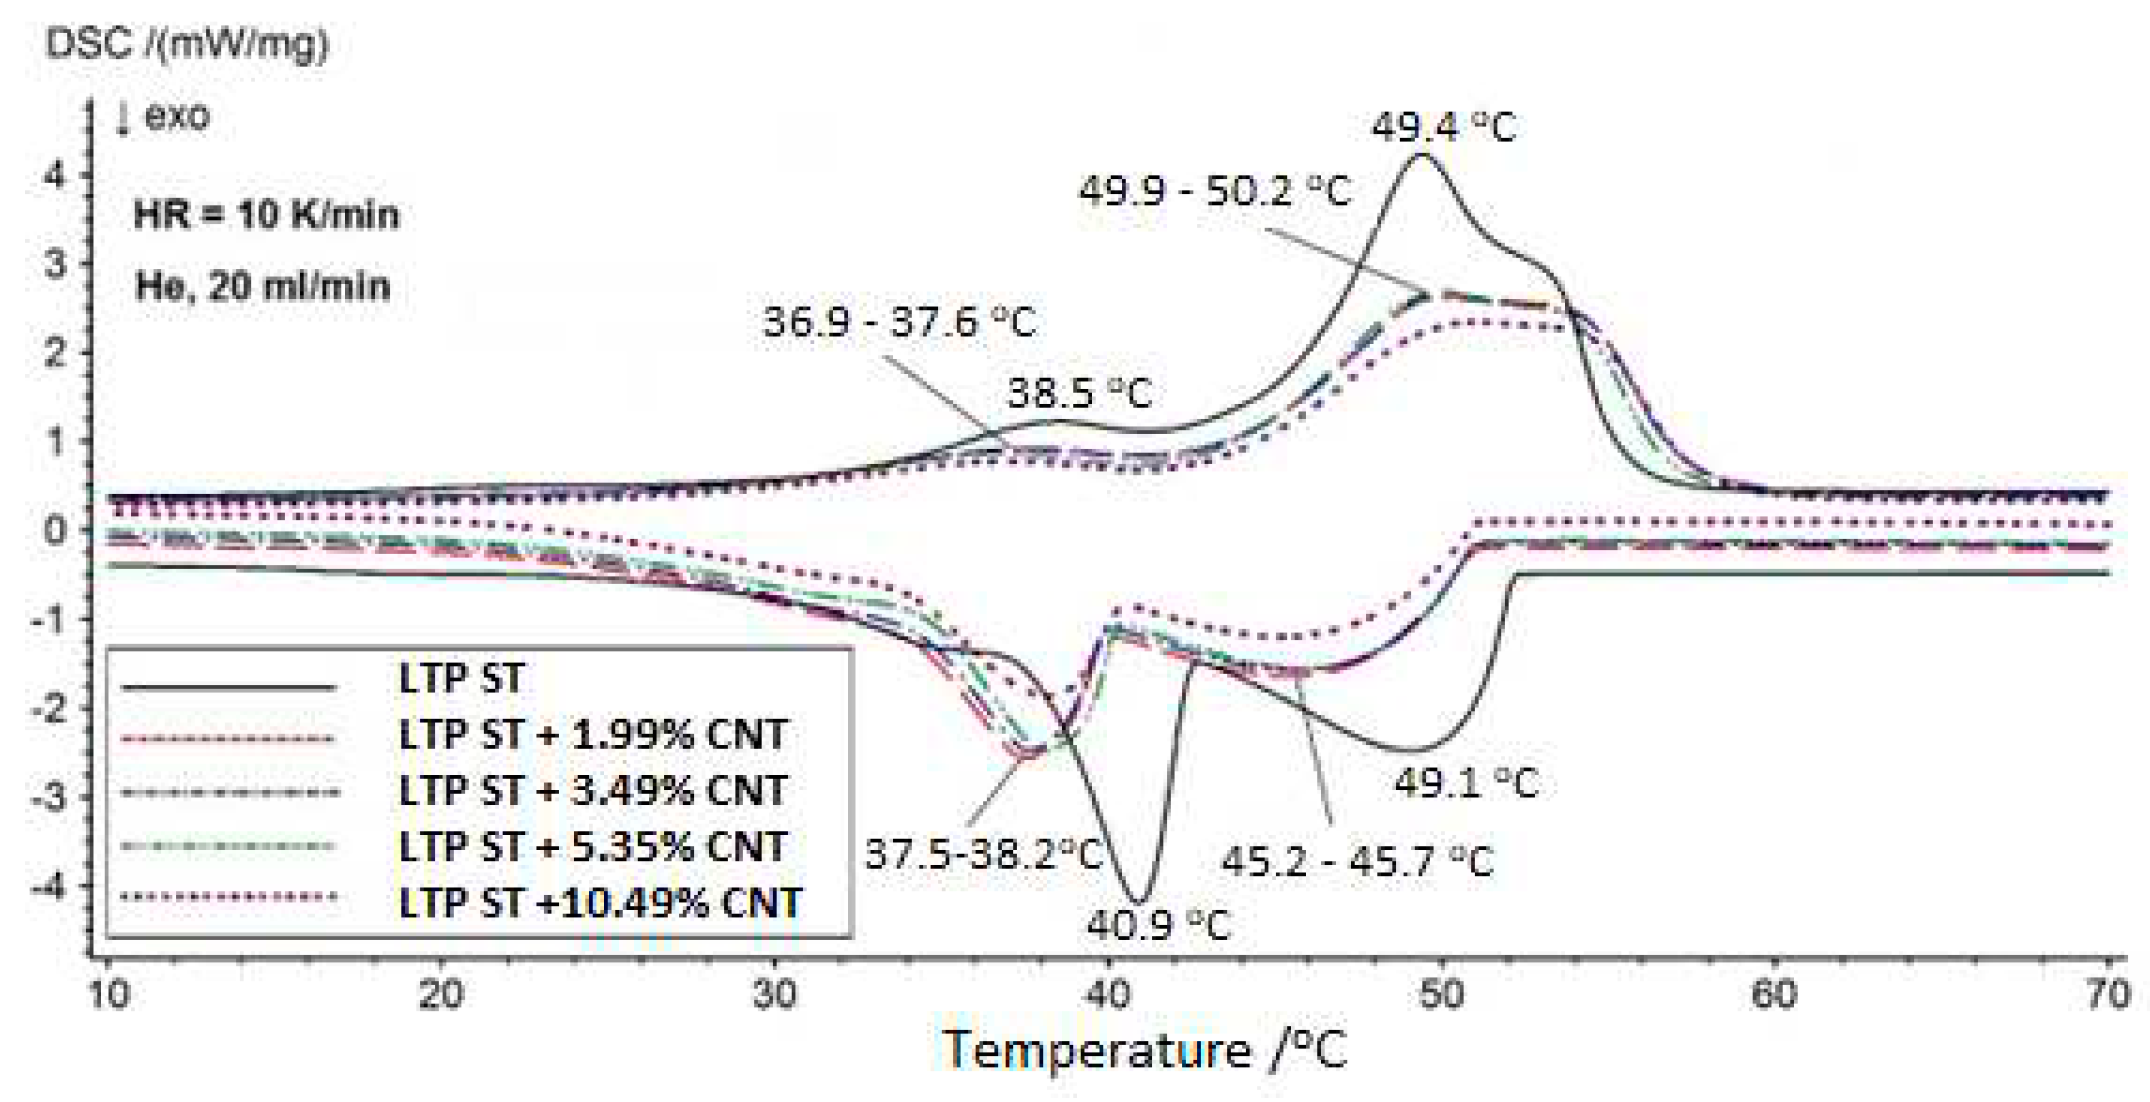
Figure 7.
Apparent specific heat of LTP ST paraffin doped with multi-walled carbon nanotubes.
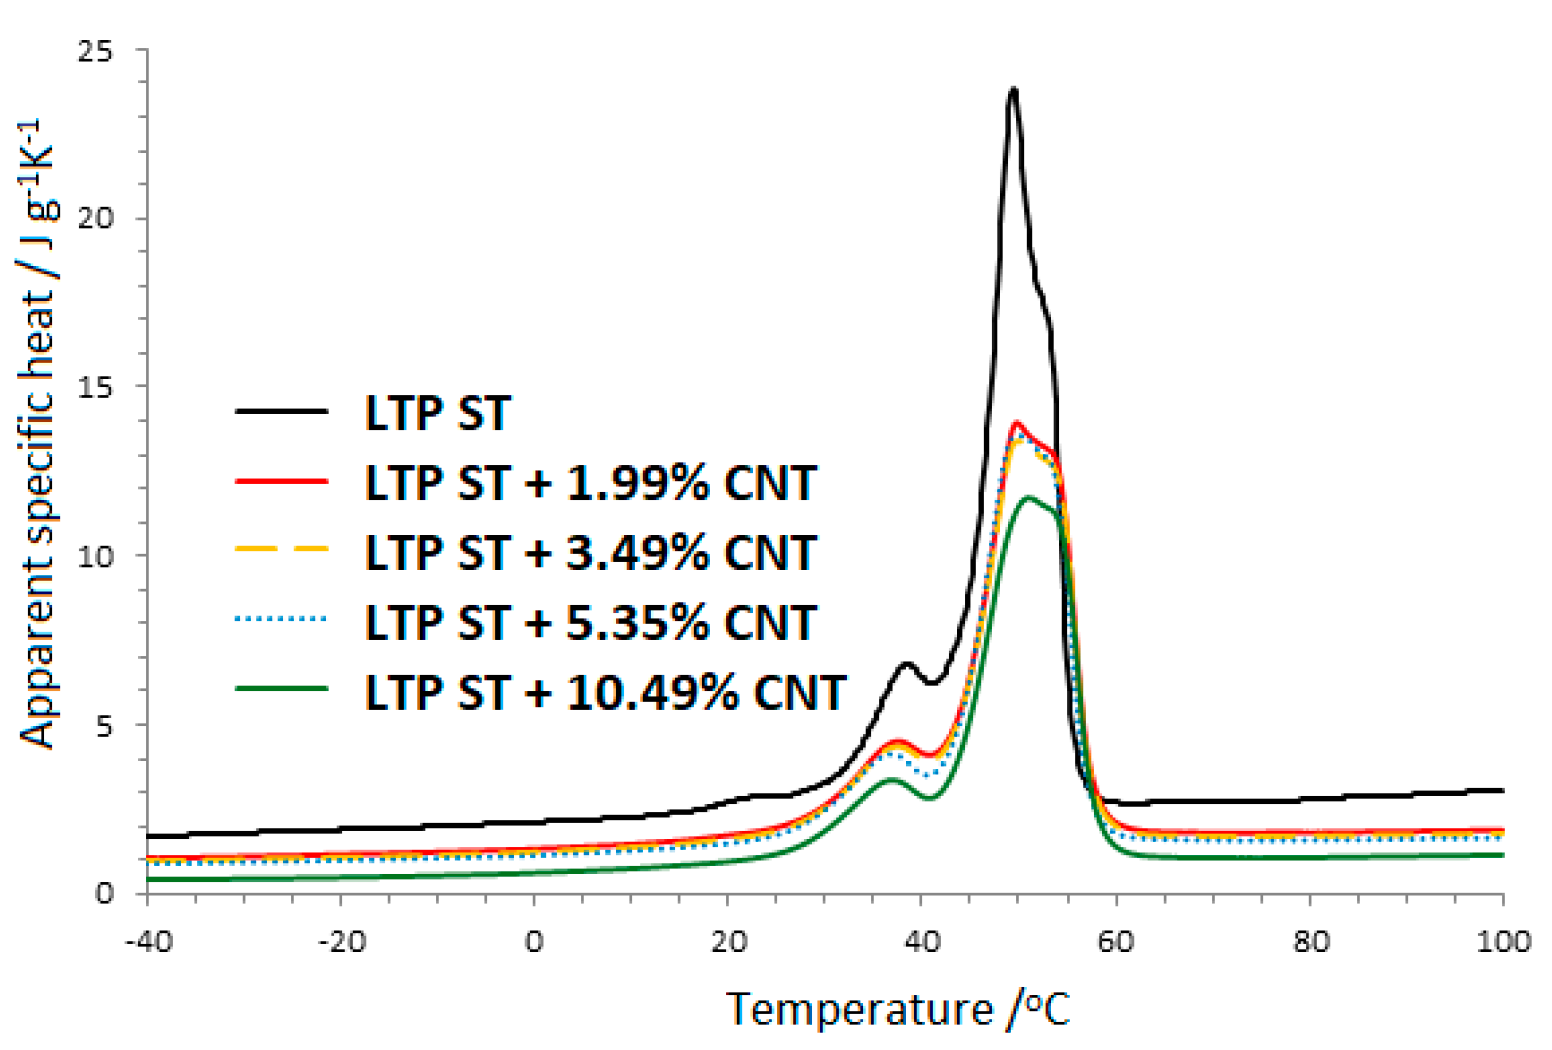
Figure 8.
DSC thermogram of LTP ST paraffin doped with silver nanowires.
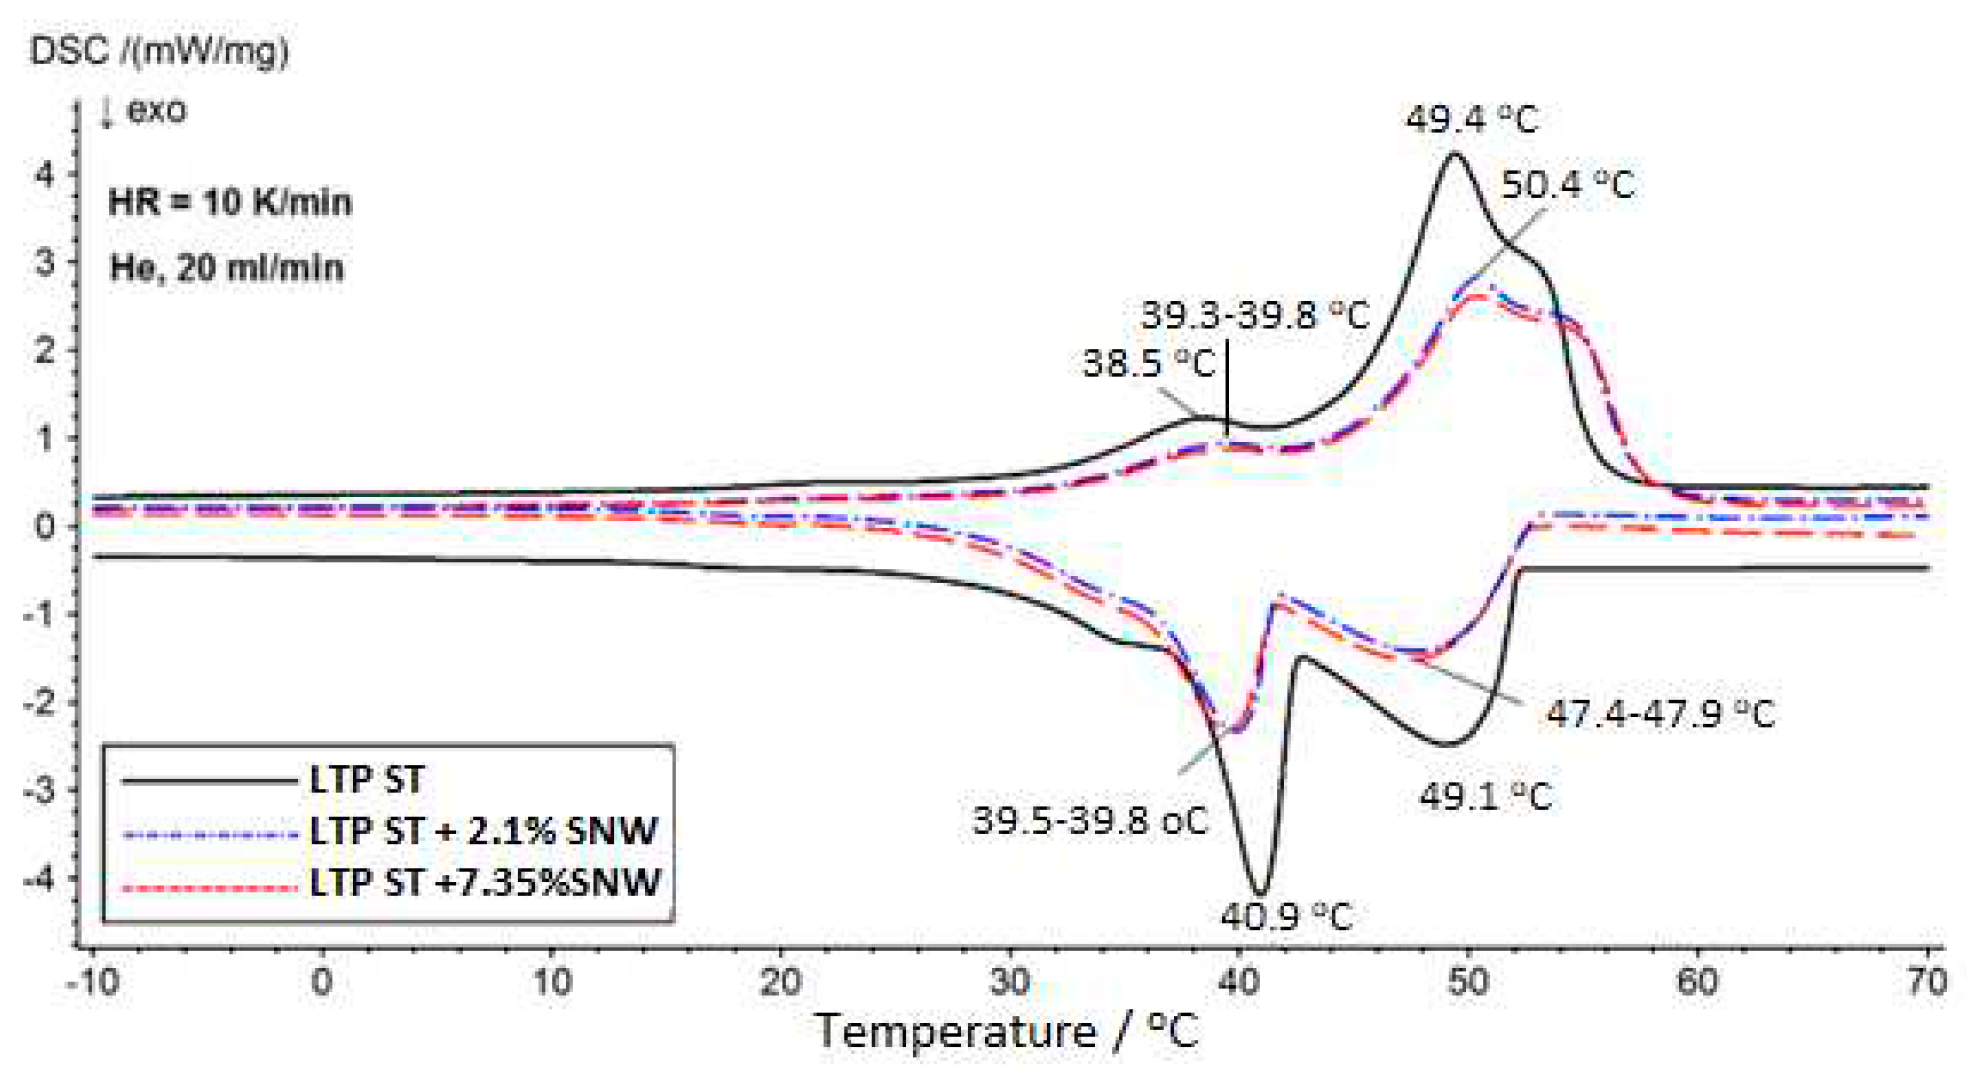
Figure 9.
Apparent specific heat of LTP ST paraffin doped with silver nanowires.
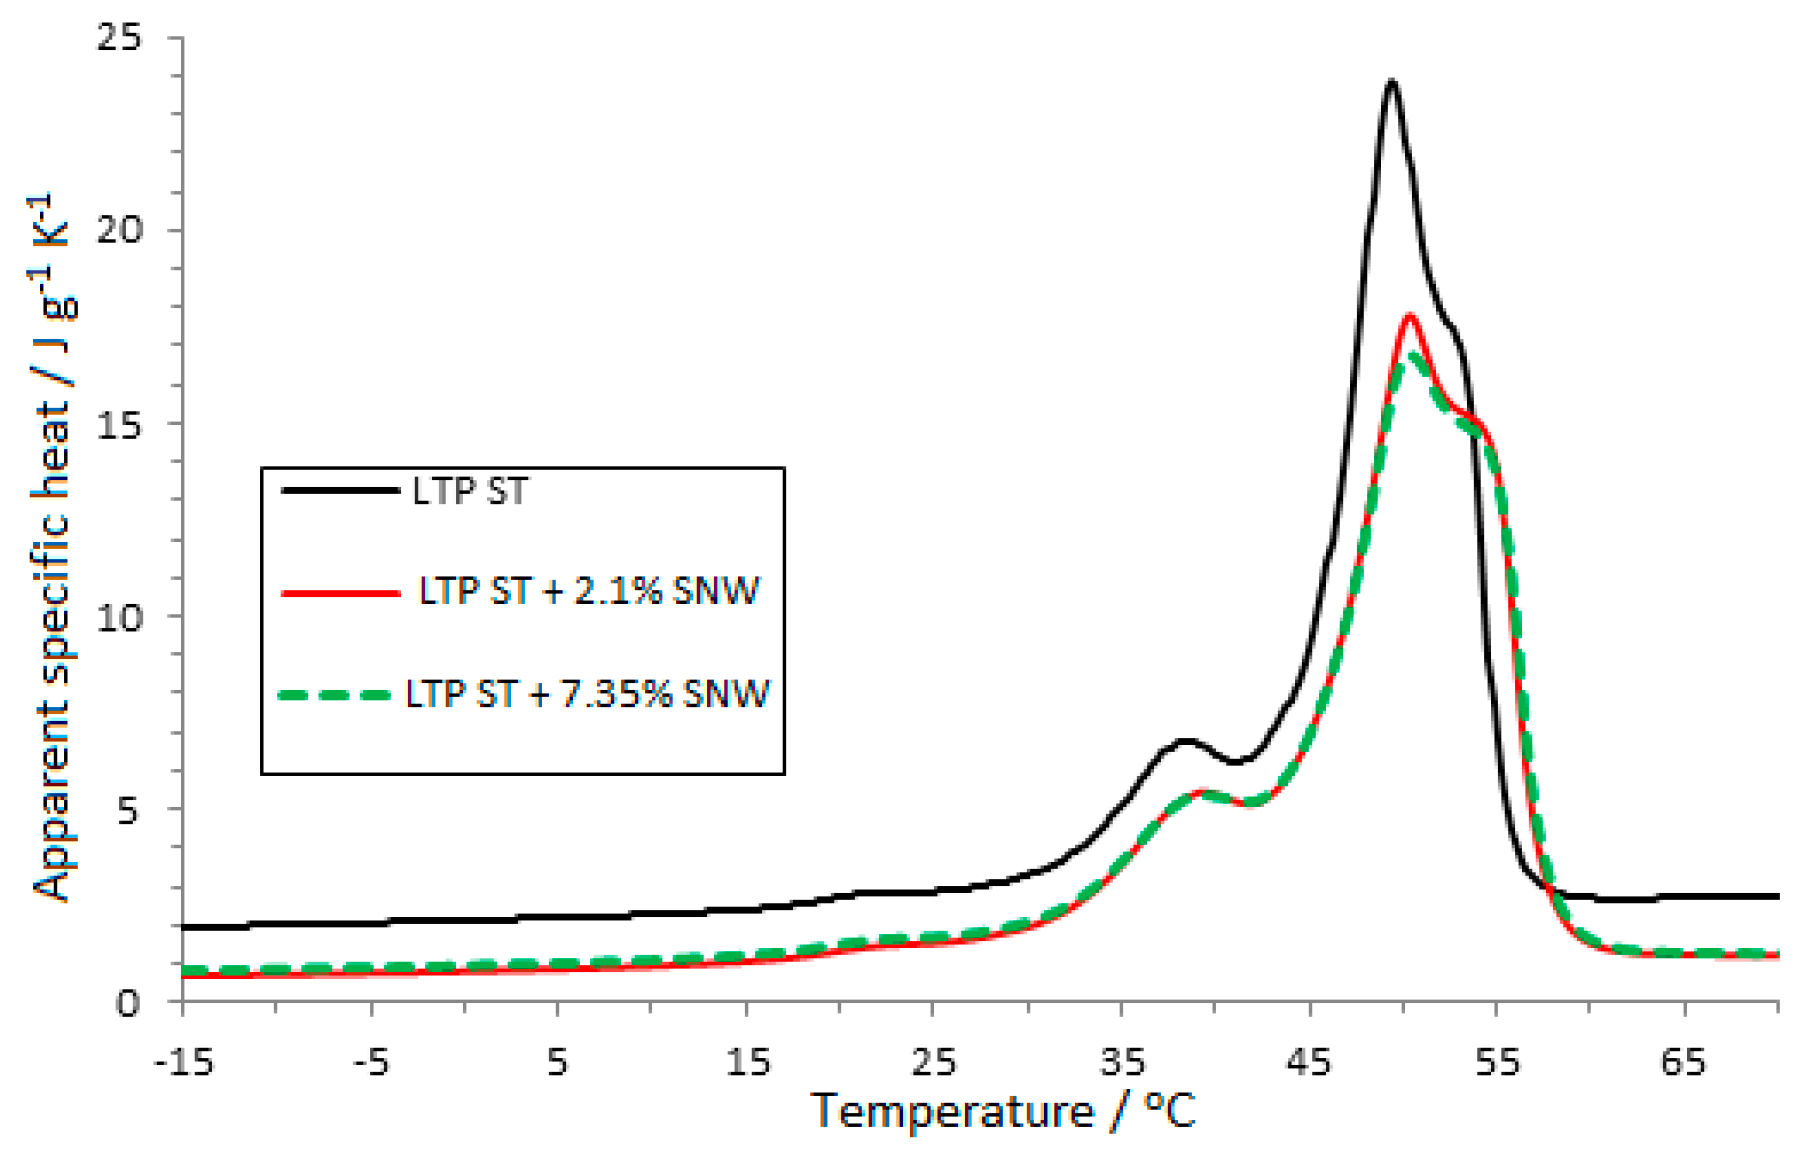
Figure 10.
Thermal diffusivity of LTP paraffin doped with silver nanowires determined using LFA 467.
Figure 10.
Thermal diffusivity of LTP paraffin doped with silver nanowires determined using LFA 467.
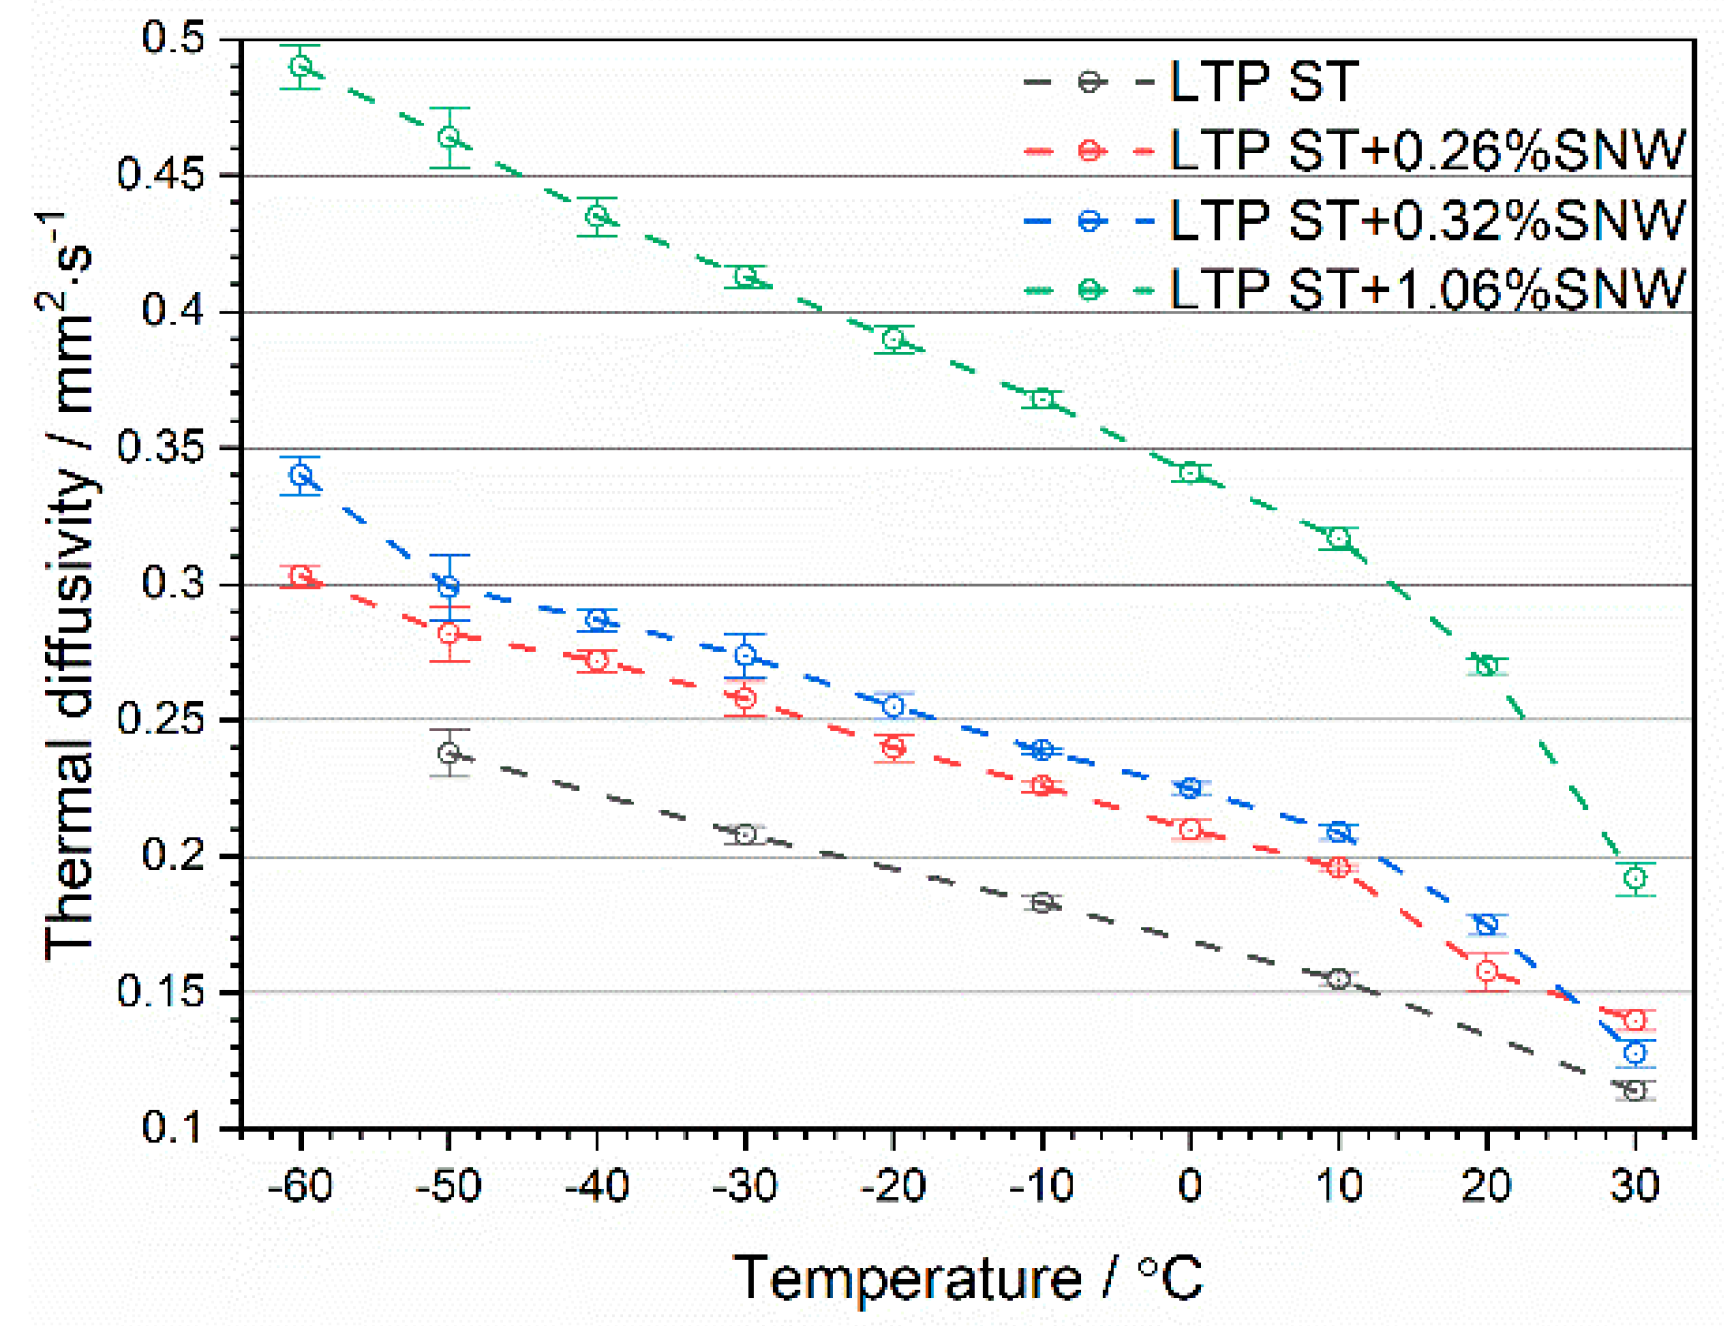
Figure 11.
Thermal diffusivity of LTP paraffin doped with carbon nanotubes determined using LFA 467.
Figure 11.
Thermal diffusivity of LTP paraffin doped with carbon nanotubes determined using LFA 467.
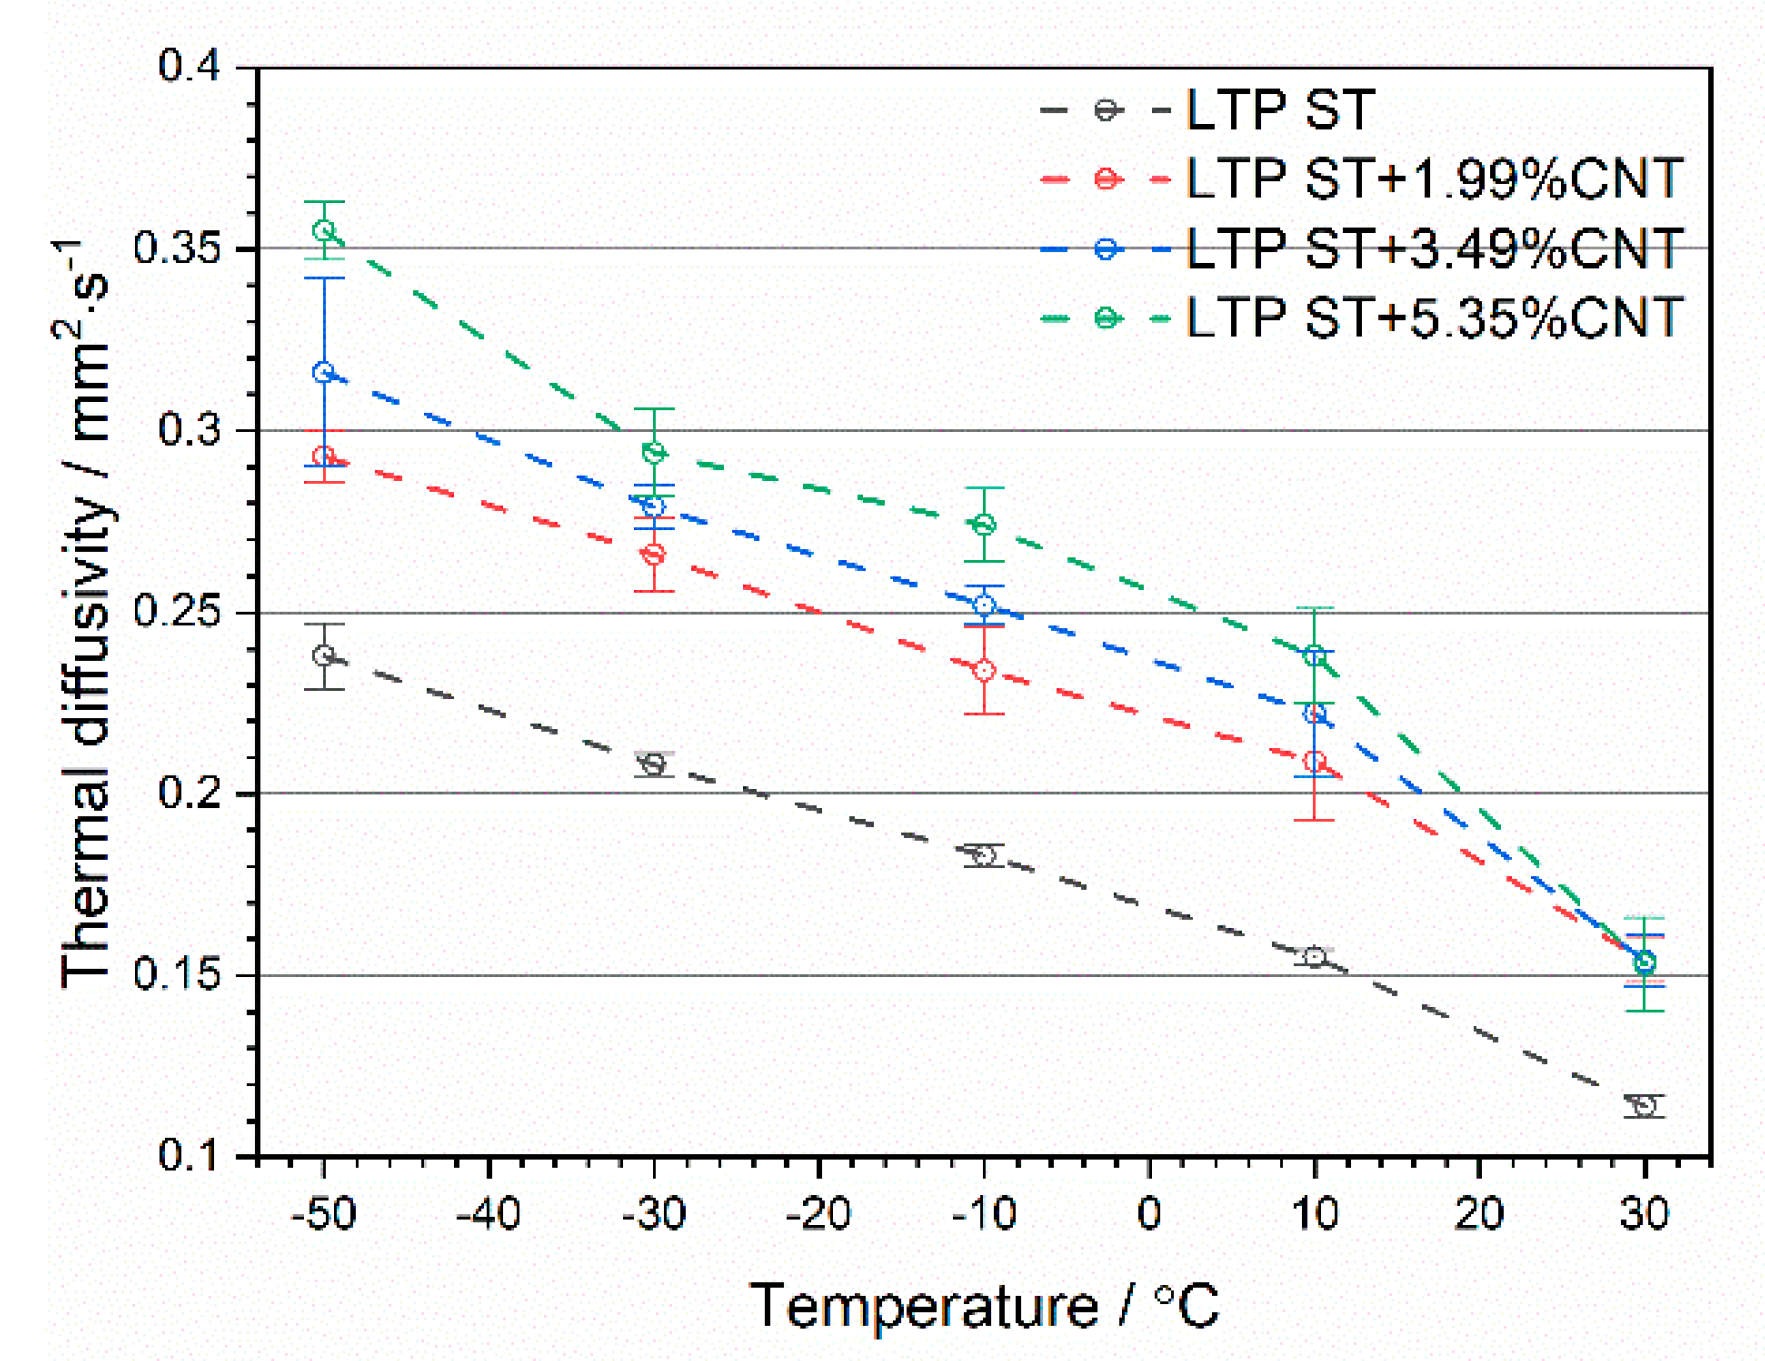
Figure 12.
Thermal conductivity of LTP paraffin doped with silver nanowires determined using LFA 467 and pyroceram 9606 ref. material.
Figure 12.
Thermal conductivity of LTP paraffin doped with silver nanowires determined using LFA 467 and pyroceram 9606 ref. material.
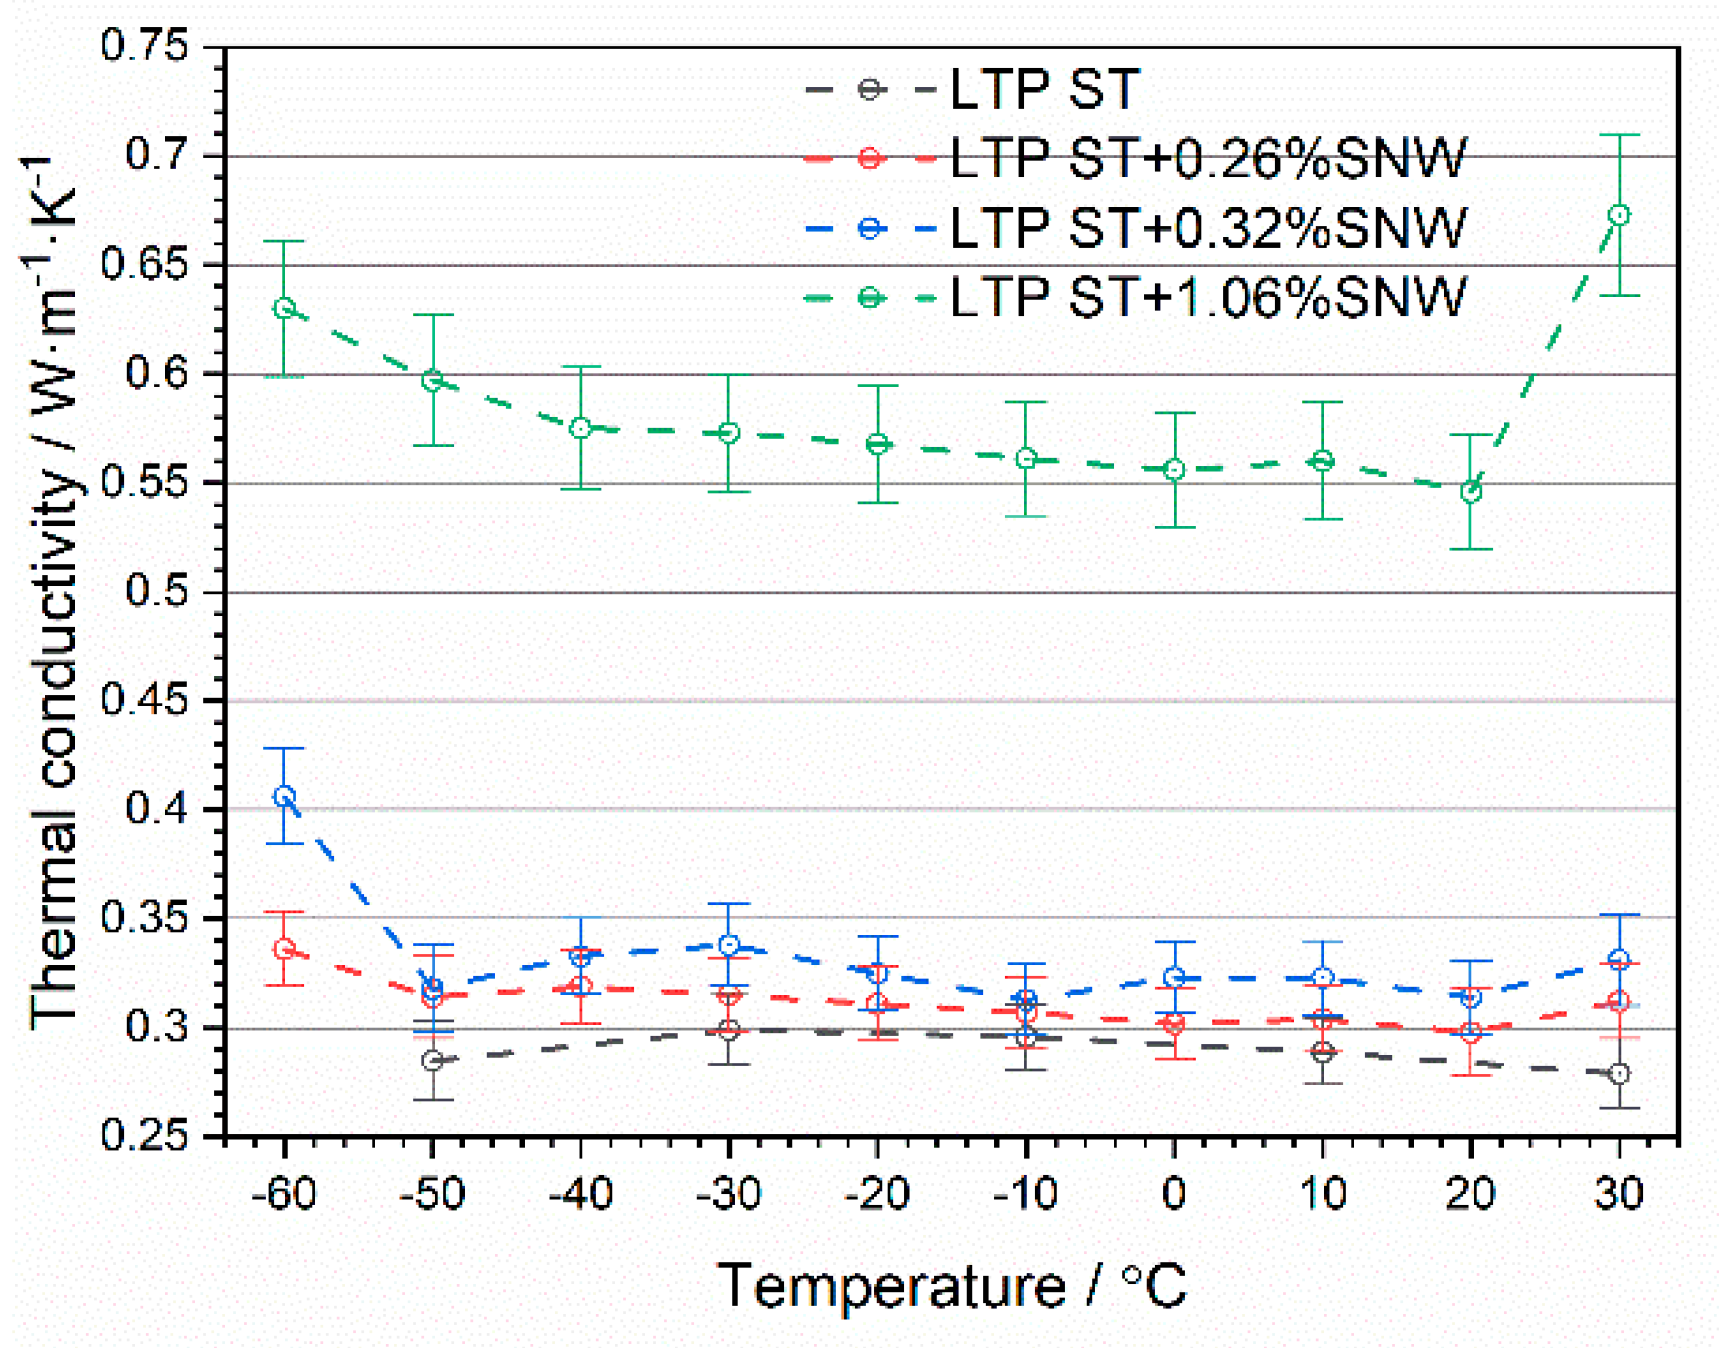
Figure 13.
Thermal conductivity of LTP paraffin doped with carbon nanotubes determined using LFA 467 and pyroceram 9606 ref. material.
Figure 13.
Thermal conductivity of LTP paraffin doped with carbon nanotubes determined using LFA 467 and pyroceram 9606 ref. material.

Figure 14.
Temperature changes as a function of time for configurations (A, B, C) during operation of the LED panel.
Figure 14.
Temperature changes as a function of time for configurations (A, B, C) during operation of the LED panel.
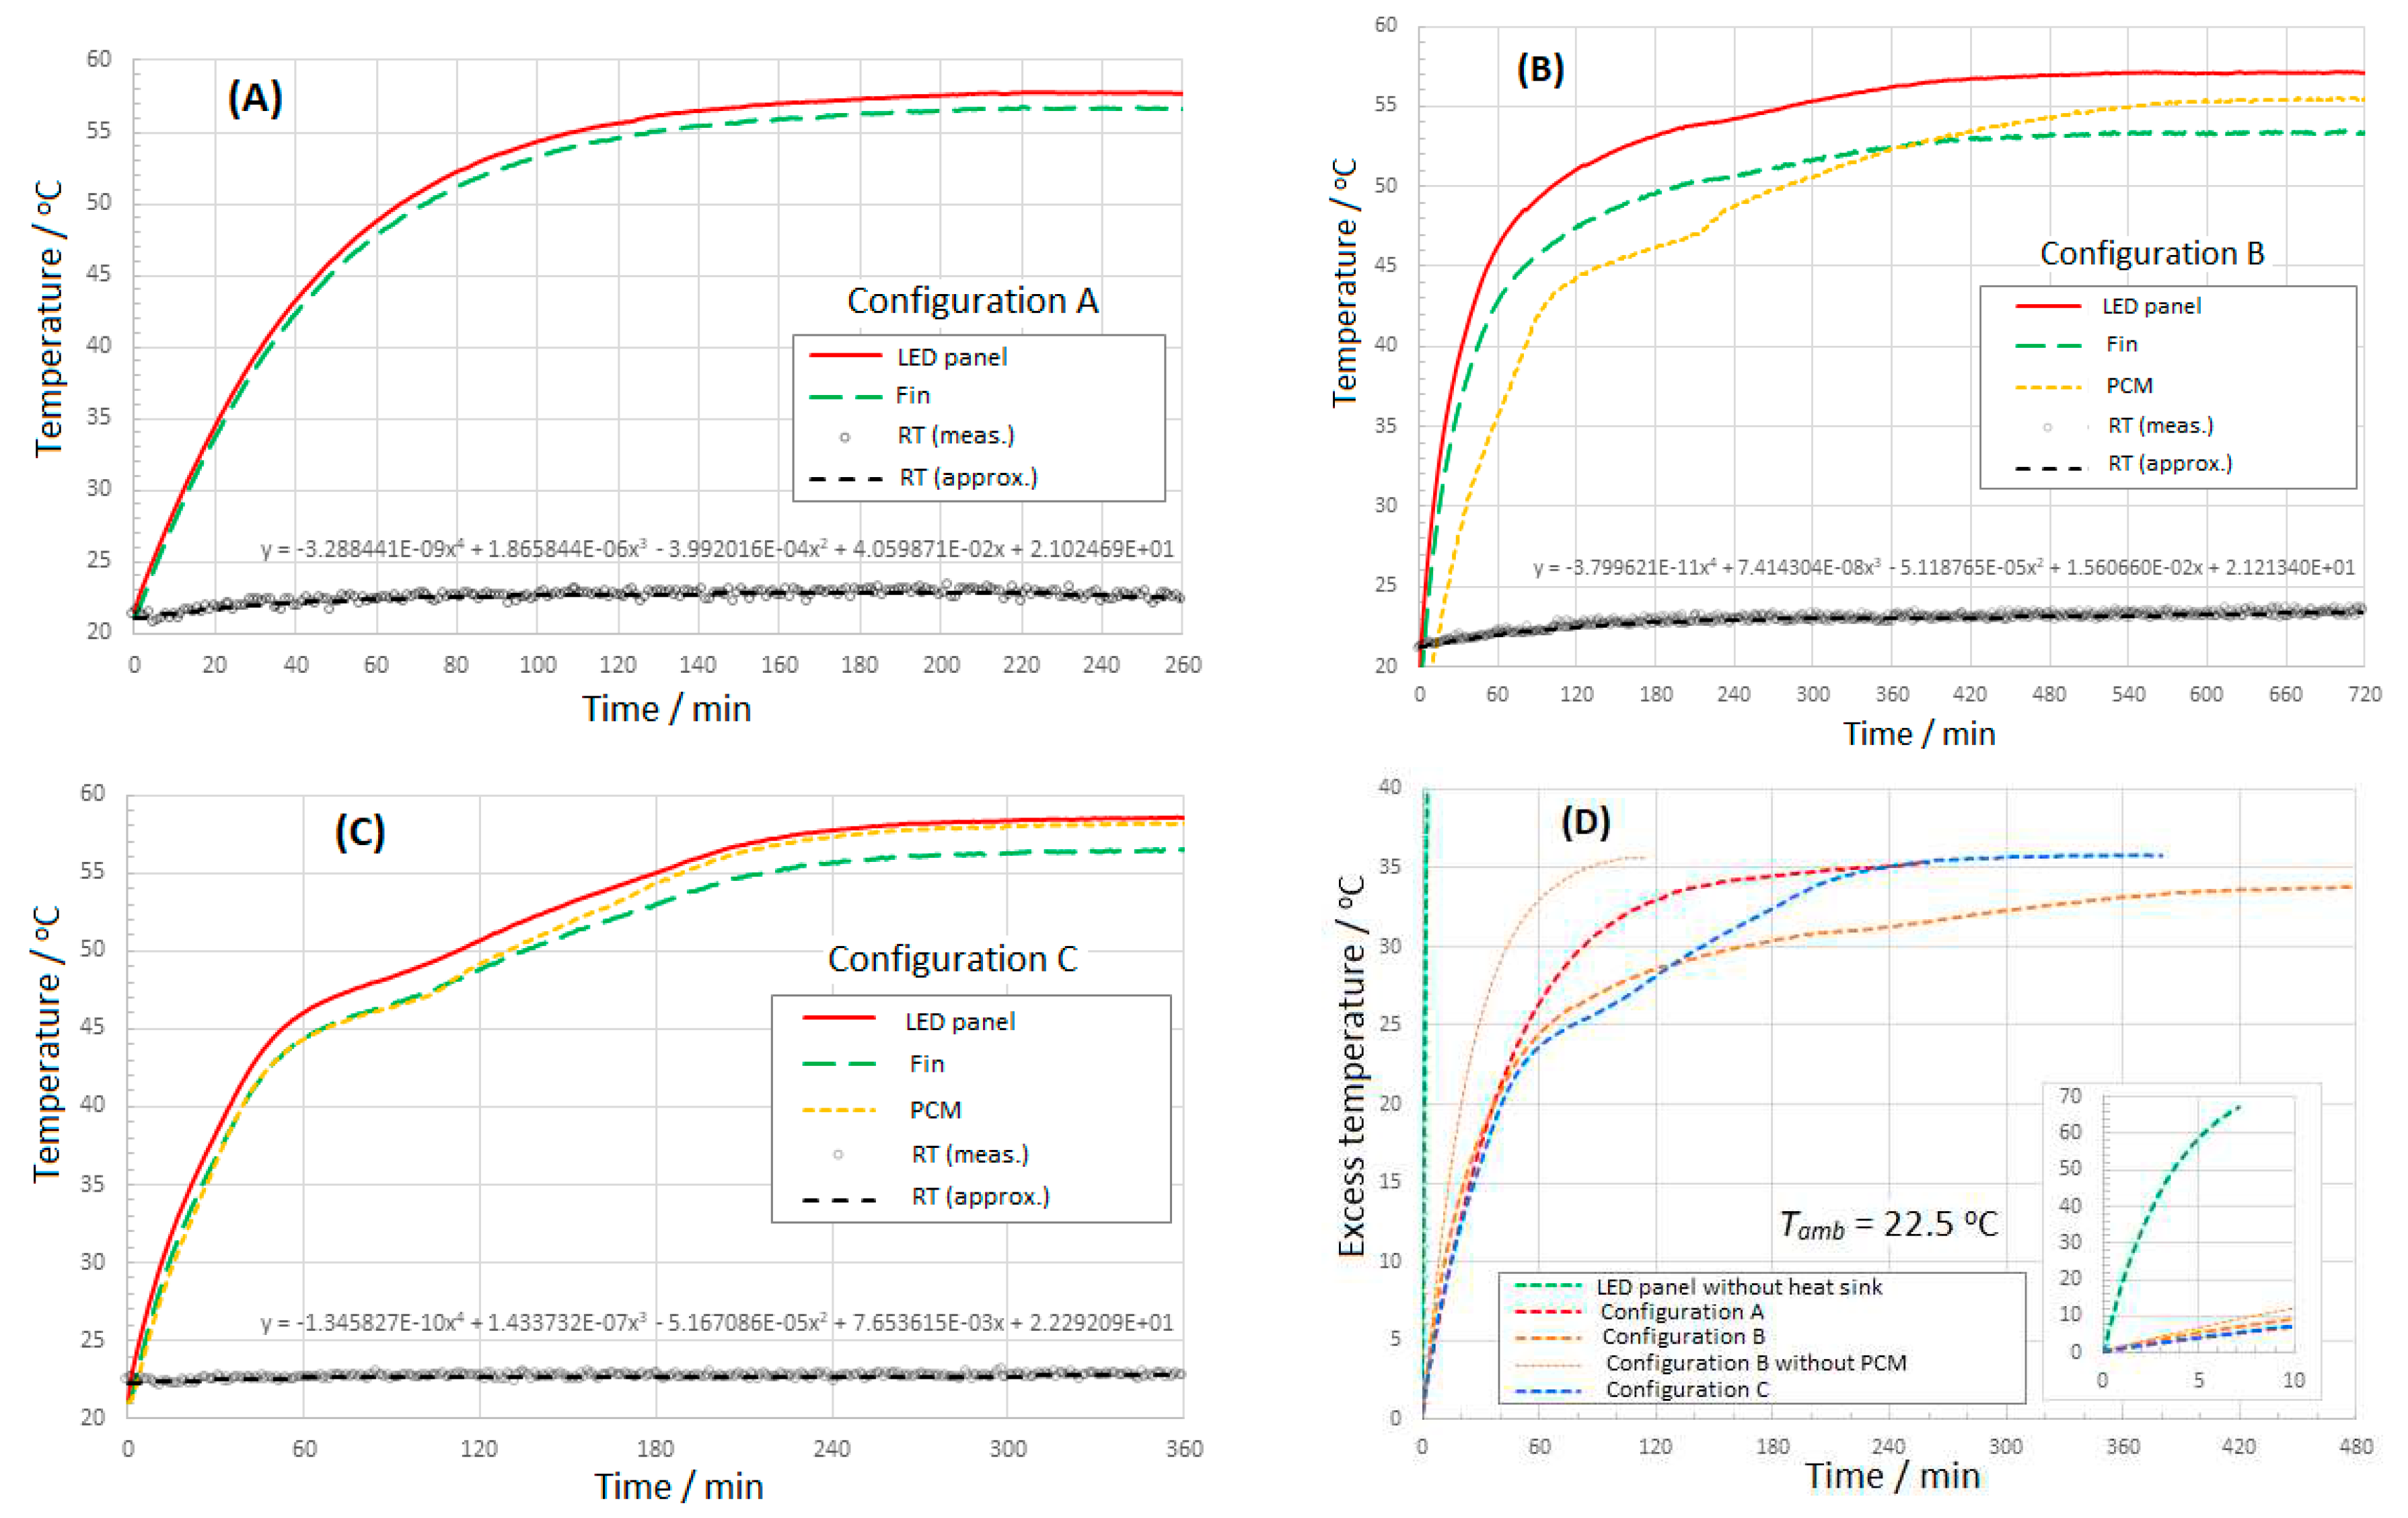

Table 1.
Density of pure and silver nanowire doped (SNW) LTP ST wax at T=24.5
| Sample/ | LTP ST | 0.26% SNW | 0.32% SNW | 1.06% SNW |
|---|---|---|---|---|
| density kg⋅m-3/ |
930.00(0.62%) | 954.76(0.11%) | 960.53(0.05%) | 1031.57(0.08%) |
Table 2.
Density of doped (SNW, MWCNT) LTP ST wax at T=24.5 determined from Equation (1).
| Sample/ | 2.1% SNW | 7.35% SNW | 1.99% CNT | 3.49% CNT | 5.35% CNT | 10.49% CNT |
|---|---|---|---|---|---|---|
| density kg⋅m-3/ |
1130.97(0.54%) | 1633.40(0.34%) | 946.12(1.09%) | 958.27(1.25%) | 973.34(1.50%) | 1015.00(2.16%) |
Table 3.
Results of thermal effects of LTP ST paraffin wax doped with MWCNTs or SNW (wt%). Characteristic temperature values (T) of phase transformations are indicated by: subscripts h - heating, c - cooling; superscripts I - solid phase transformation, II - melting/solidification, on - onset of thermal effect, max - peak value, end - endset of thermal effect; subcooling (); specific enthalpies () - during heating and () during cooling.
| Sample | LTP ST | 1.99% CNT | 3.49% CNT | 5.35% CNT | 10.49% CNT | 2.1% SNW | 7.35% SNW |
|---|---|---|---|---|---|---|---|
| / | 30.8 | 27.2 | 26.9 | 26.1 | 25.5 | 30.9 | 31.0 |
| / | 38.5 | 37.6 | 37.5 | 36.9 | 37.0 | 39.3 | 39.5 |
| / | 44.5 | 42.8 | 42.8 | 42.8 | 41.2 | 44.3 | 44.4 |
| / | 49.4 | 49.9 | 50.1 | 50.2 | 51.1 | 50.4 | 50.4 |
| / | 55.4 | 57.7 | 57.4 | 57.0 | 57.9 | 57.3 | 57.6 |
| / | 52.1 | 50.9 | 51.0 | 51.0 | 51.1 | 52.8 | 52.5 |
| / | 40.9/ 49.1 | 37.5/ 45.4 | 37.7/ 45.5 | 38.1/ 45.7 | 38.2/ 45.2 | 39.8/ 47.7 | 39.4/ 47.4 |
| / | 3.3 | 6.8 | 6.4 | 6.0 | 6.8 | 4.5 | 5.1 |
| / | 227.2 | 192.8 | 189.2 | 180.2 | 170.2 | 195.9 | 191.5 |
| / | -230.0 | -193.2 | -187.8 | -182.0 | -168.0 | -192.1 | -192.5 |
Table 4.
Coefficients of the linear regression equation for the solid (s) and liquid (l) phases of the sensible specific heat capacity.
Table 4.
Coefficients of the linear regression equation for the solid (s) and liquid (l) phases of the sensible specific heat capacity.
| Sample | 1.99% CNT | 3.49% CNT | 5.35% CNT | 10.49% CNT | 2.1% SNW | 7.35% SNW |
|---|---|---|---|---|---|---|
Table 5.
Results of thermal diffusivity measurements of LTP ST paraffin itself and with nano-additives.
Table 5.
Results of thermal diffusivity measurements of LTP ST paraffin itself and with nano-additives.
| -60 | 0.303±0.004 | 0.340±0.007 | 0.490±0.008 | ||||
| -50 | 0.282±0.010 | 0.299±0.012 | 0.464±0.011 | 0.293±0.007 | 0.316±0.026 | 0.335±0.008 | 0.238±0.009 |
| -40 | 0.272±0.004 | 0.287±0.004 | 0.435±0.007 | ||||
| -30 | 0.258±0.006 | 0.274±0.008 | 0.413±0.004 | 0.266±0.010 | 0.279±0.006 | 0.294±0.012 | 0.208±0.003 |
| -20 | 0.240±0.005 | 0.255±0.005 | 0.390±0.005 | ||||
| -10 | 0.226±0.002 | 0.239±0.001 | 0.368±0.003 | 0.234±0.012 | 0.252±0.005 | 0.274±0.010 | 0.183±0.003 |
| 0 | 0.210±0.004 | 0.225±0.002 | 0.341±0.003 | ||||
| 10 | 0.196±0.001 | 0.209±0.003 | 0.317±0.004 | 0.209±0.016 | 0.222±0.017 | 0.238±0.013 | 0.155±0.002 |
| 20 | 0.158±0.007 | 0.175±0.004 | 0.270±0.003 | ||||
| 30 | 0.140±0.004 | 0.128±0.005 | 0.192±0.006 | 0.154±0.006 | 0.154±0.007 | 0.153±0.013 | 0.114±0.003 |
Table 6.
Results of the thermal conductivity measurements of LTP ST paraffin itself and with nano-additives.
Table 6.
Results of the thermal conductivity measurements of LTP ST paraffin itself and with nano-additives.
| -60 | 0.336±0.017 | 0.406±0.022 | 0.630±0.031 | |||||
| -50 | 0.314±0.019 | 0.318±0.020 | 0.597±0.030 | 0.249±0.014 | 0.307±0.029 | 0.311±0.017 | 0.285±0.018 | |
| -40 | 0.319±0.017 | 0.333±0.017 | 0.575±0.028 | |||||
| -30 | 0.315±0.017 | 0.338±0.019 | 0.573±0.027 | 0.261±0.016 | 0.304±0.027 | 0.327±0.021 | 0.299±0.016 | |
| -20 | 0.311±0.017 | 0.325±0.017 | 0.568±0.027 | |||||
| -10 | 0.307±0.016 | 0.313±0.016 | 0.561±0.026 | 0.283±0.020 | 0.302±0.016 | 0.347±0.022 | 0.296±0.015 | |
| 0 | 0.302±0.016 | 0.323±0.016 | 0.556±0.026 | |||||
| 10 | 0.304±0.015 | 0.326±0.017 | 0.560±0.027 | 0.282±0.025 | 0.298±0.027 | 0.303±0.022 | 0.289±0.015 | |
| 20 | 0.298±0.020 | 0.314±0.017 | 0.546±0.026 | |||||
| 30 | 0.312±0.017 | 0.331±0.021 | 0.673±0.037 | 0.276±0.018 | 0.285±0.019 | 0.265±0.026 | 0.279±0.016 |
Disclaimer/Publisher’s Note: The statements, opinions and data contained in all publications are solely those of the individual author(s) and contributor(s) and not of MDPI and/or the editor(s). MDPI and/or the editor(s) disclaim responsibility for any injury to people or property resulting from any ideas, methods, instructions or products referred to in the content. |
© 2023 by the authors. Licensee MDPI, Basel, Switzerland. This article is an open access article distributed under the terms and conditions of the Creative Commons Attribution (CC BY) license (https://creativecommons.org/licenses/by/4.0/).
Copyright: This open access article is published under a Creative Commons CC BY 4.0 license, which permit the free download, distribution, and reuse, provided that the author and preprint are cited in any reuse.


