Submitted:
28 July 2023
Posted:
01 August 2023
You are already at the latest version
Abstract
Keywords:
1. Introduction
2. Materials and Methods
2.1. Cell culture and reagents
2.2. Laser-captured microdissection (LCM)
2.3. Quantitative real-time PCR (qPCR)
2.4. Western Blotting
2.5. Tumor sphere formation assay
2.6. Migration assay
2.7. Ectopic expression of Orai3
2.8. SOCE assay (Single-cell Ca2+ imaging)
2.9. Cell Proliferation Assay
2.10. Anchorage-independent growth
2.11. In vivo xenograft tumor assay
2.12. ALDH1 assay
2.13. Small Interfering RNA (siRNA) Transfection
2.14. Mouse models
2.15. Statistical analysis
3. Result
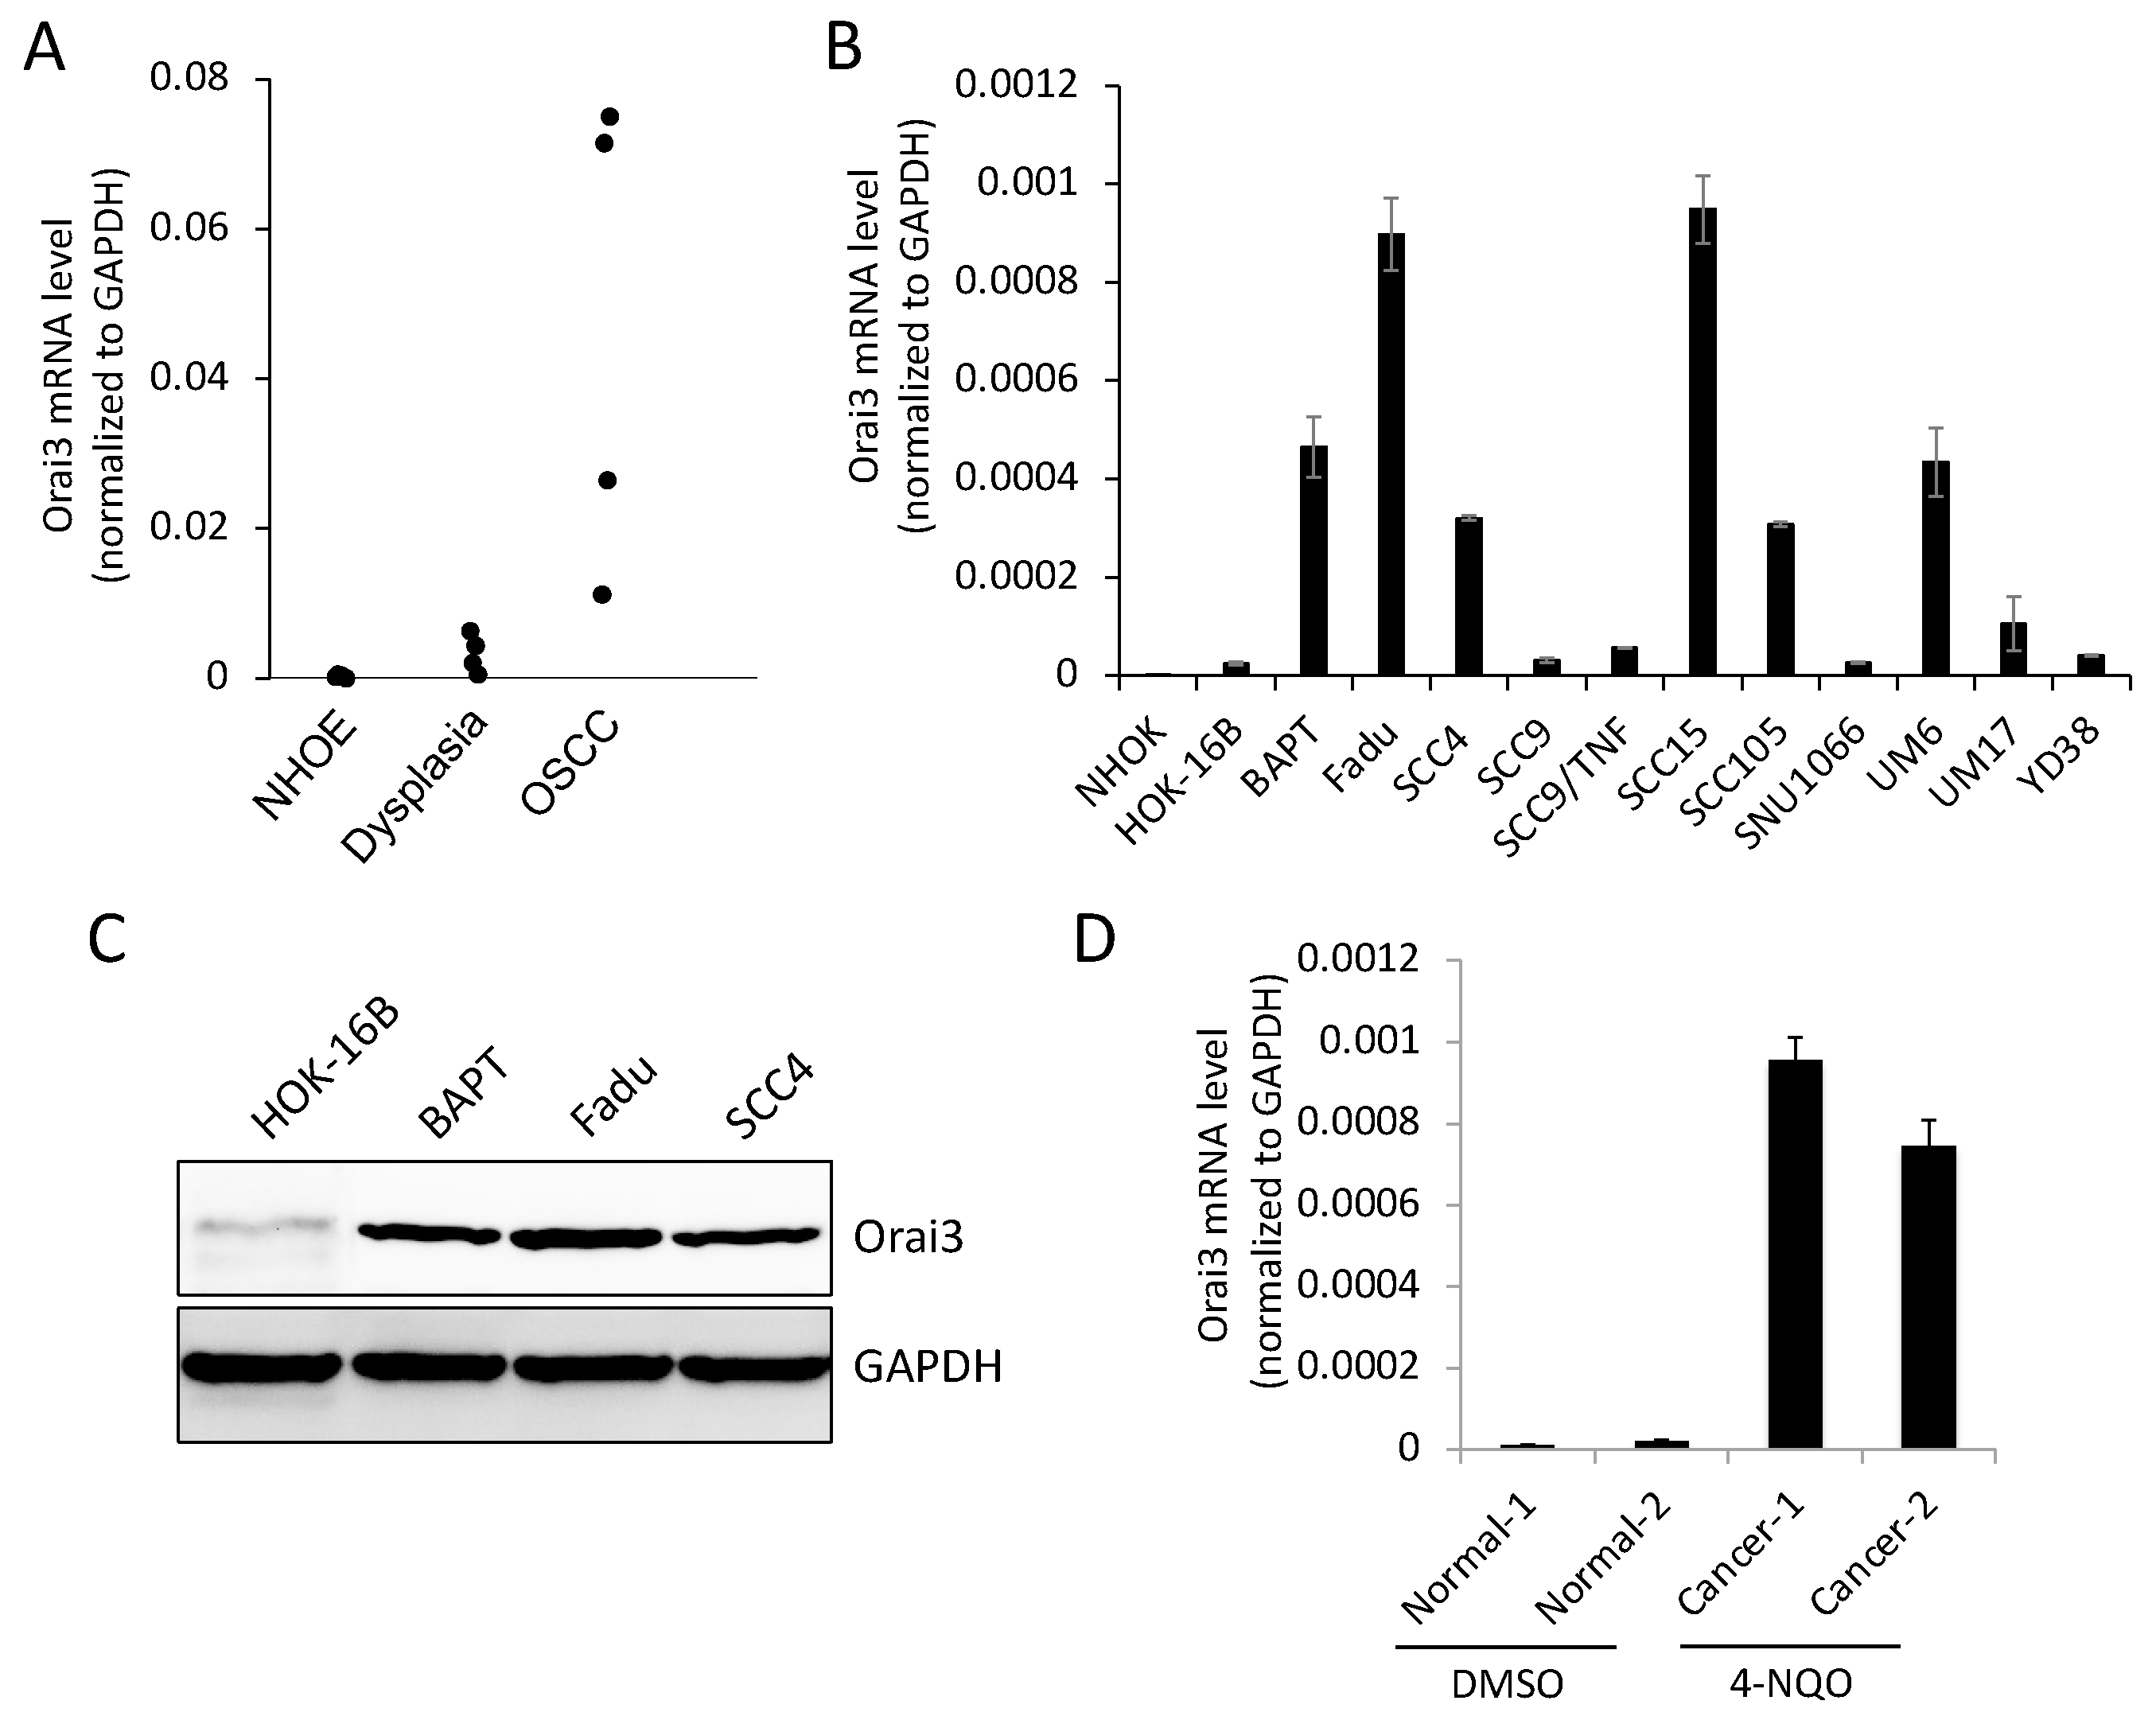
3.1. Stepwise increase of Orai3 expression during oral carcinogenesis
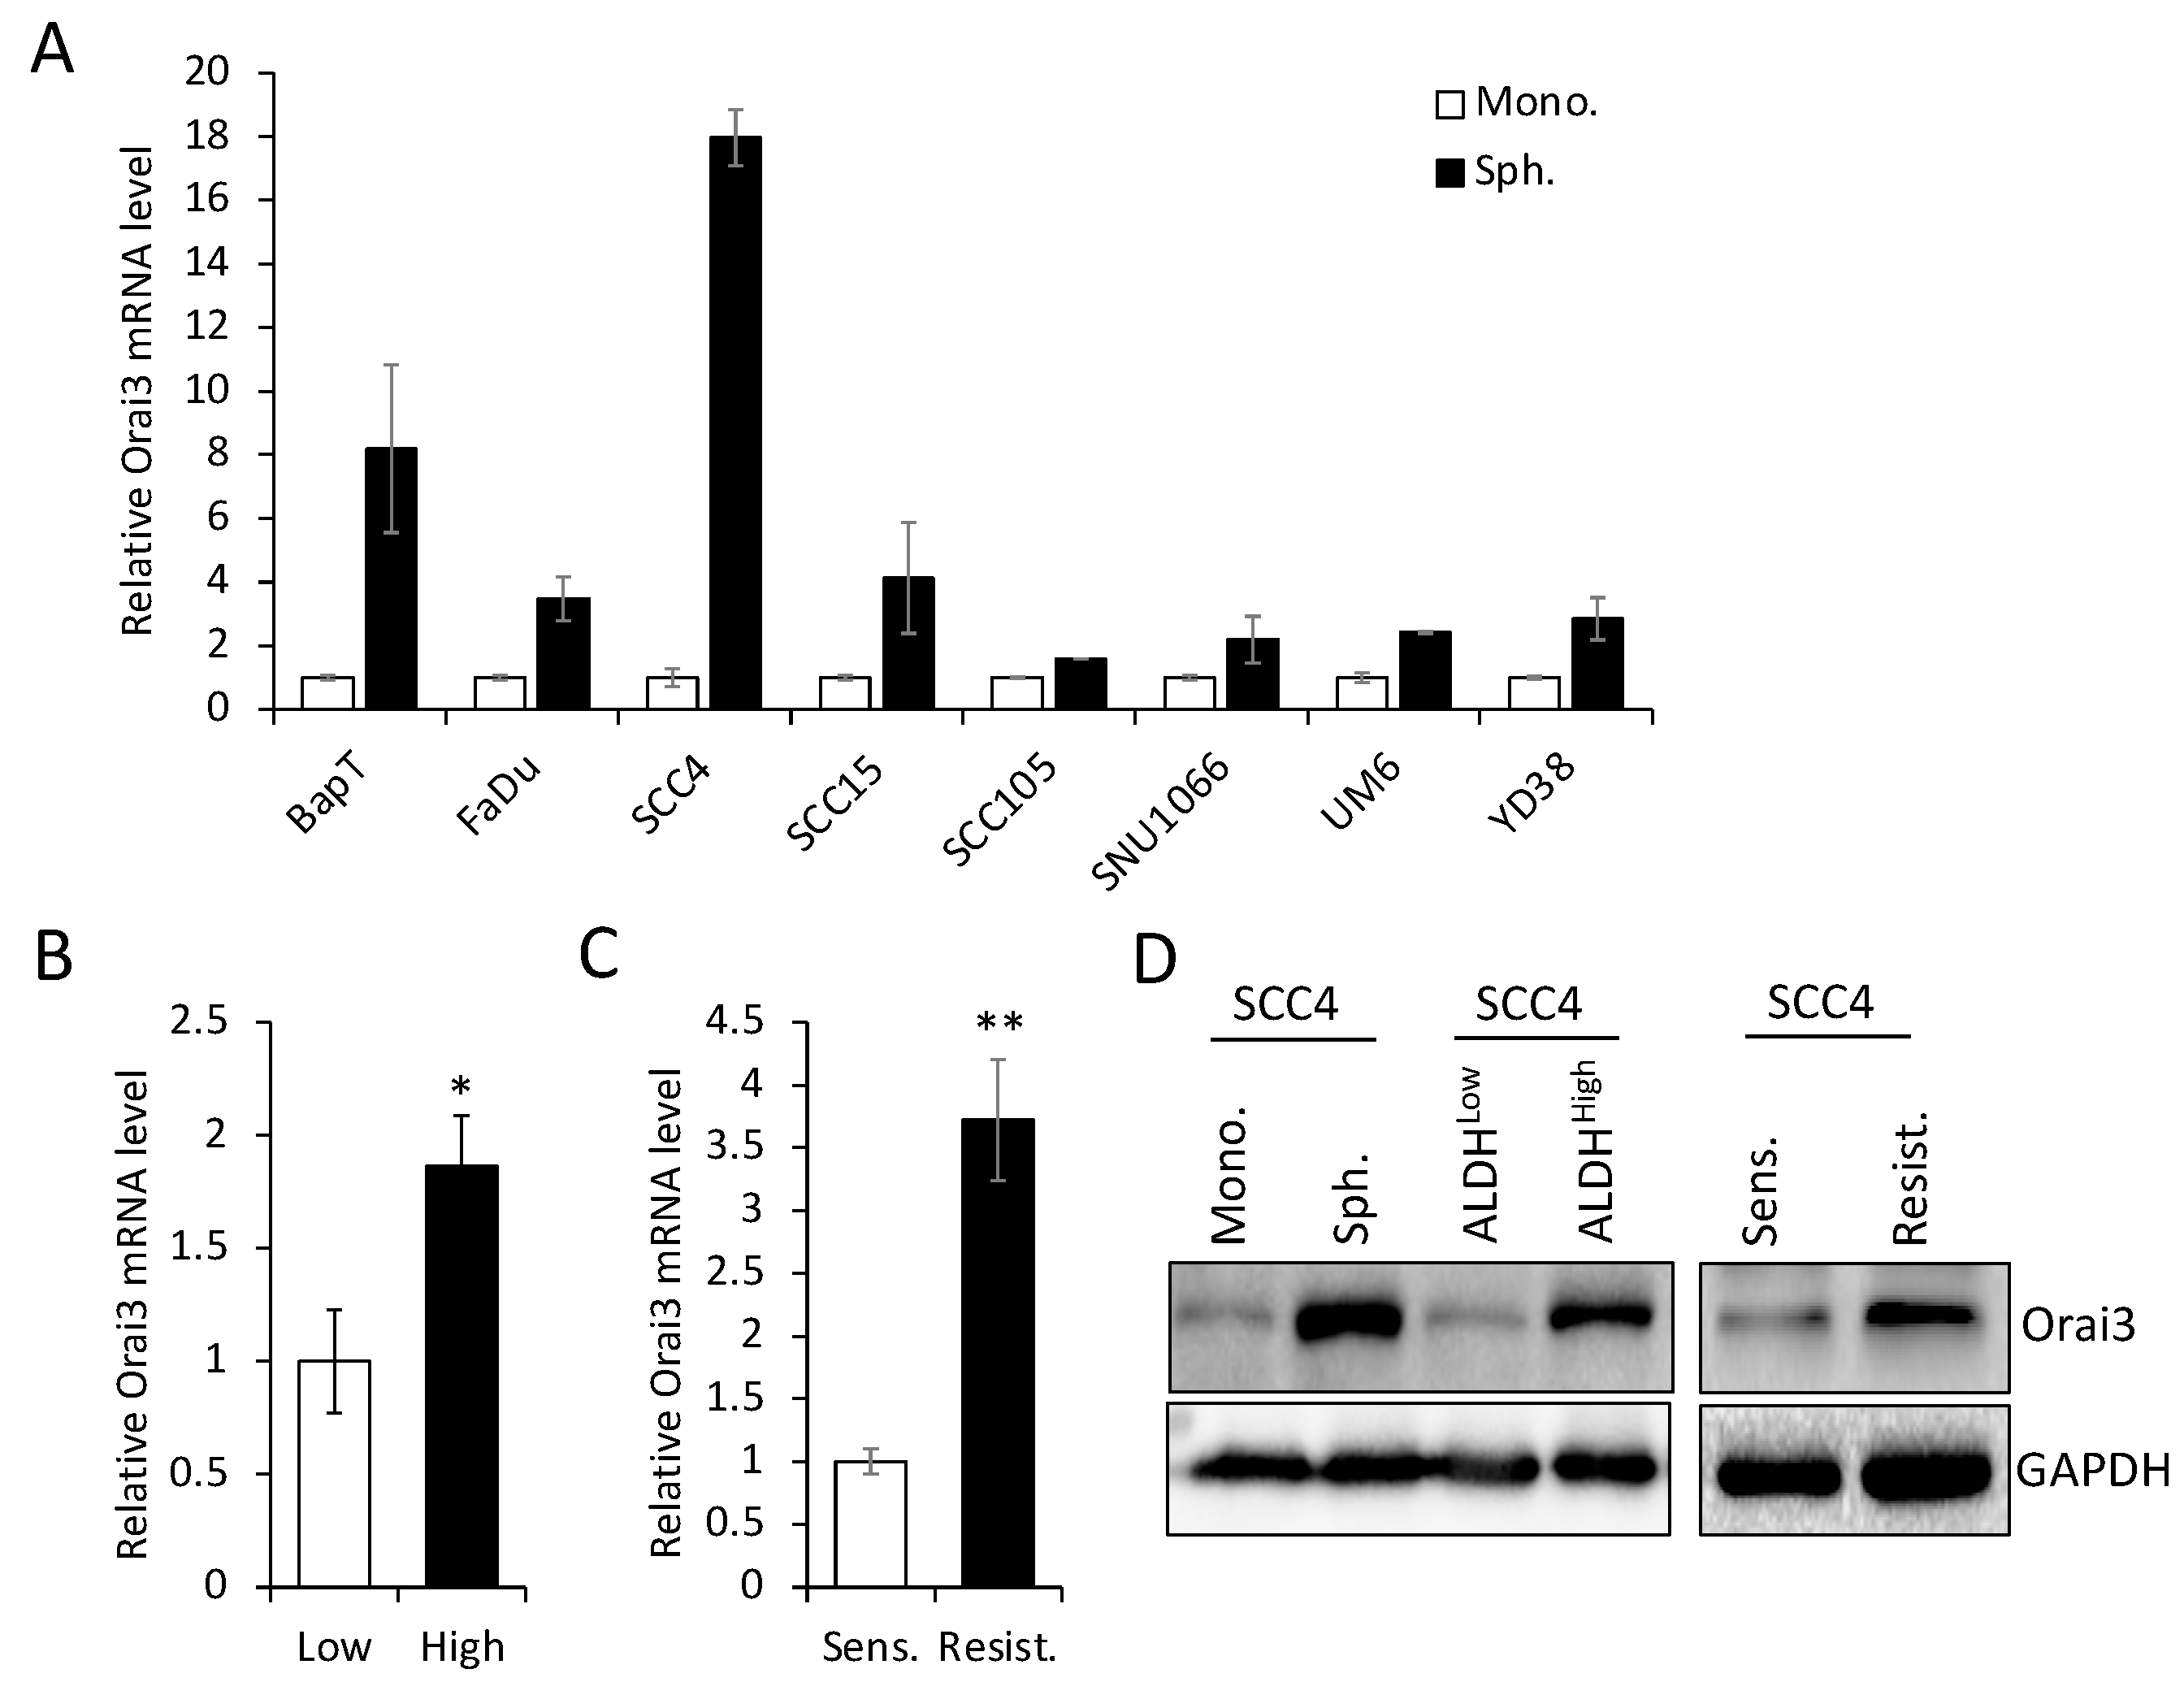
3.2. Orai3 is enriched in CSC populations derived from OSCC
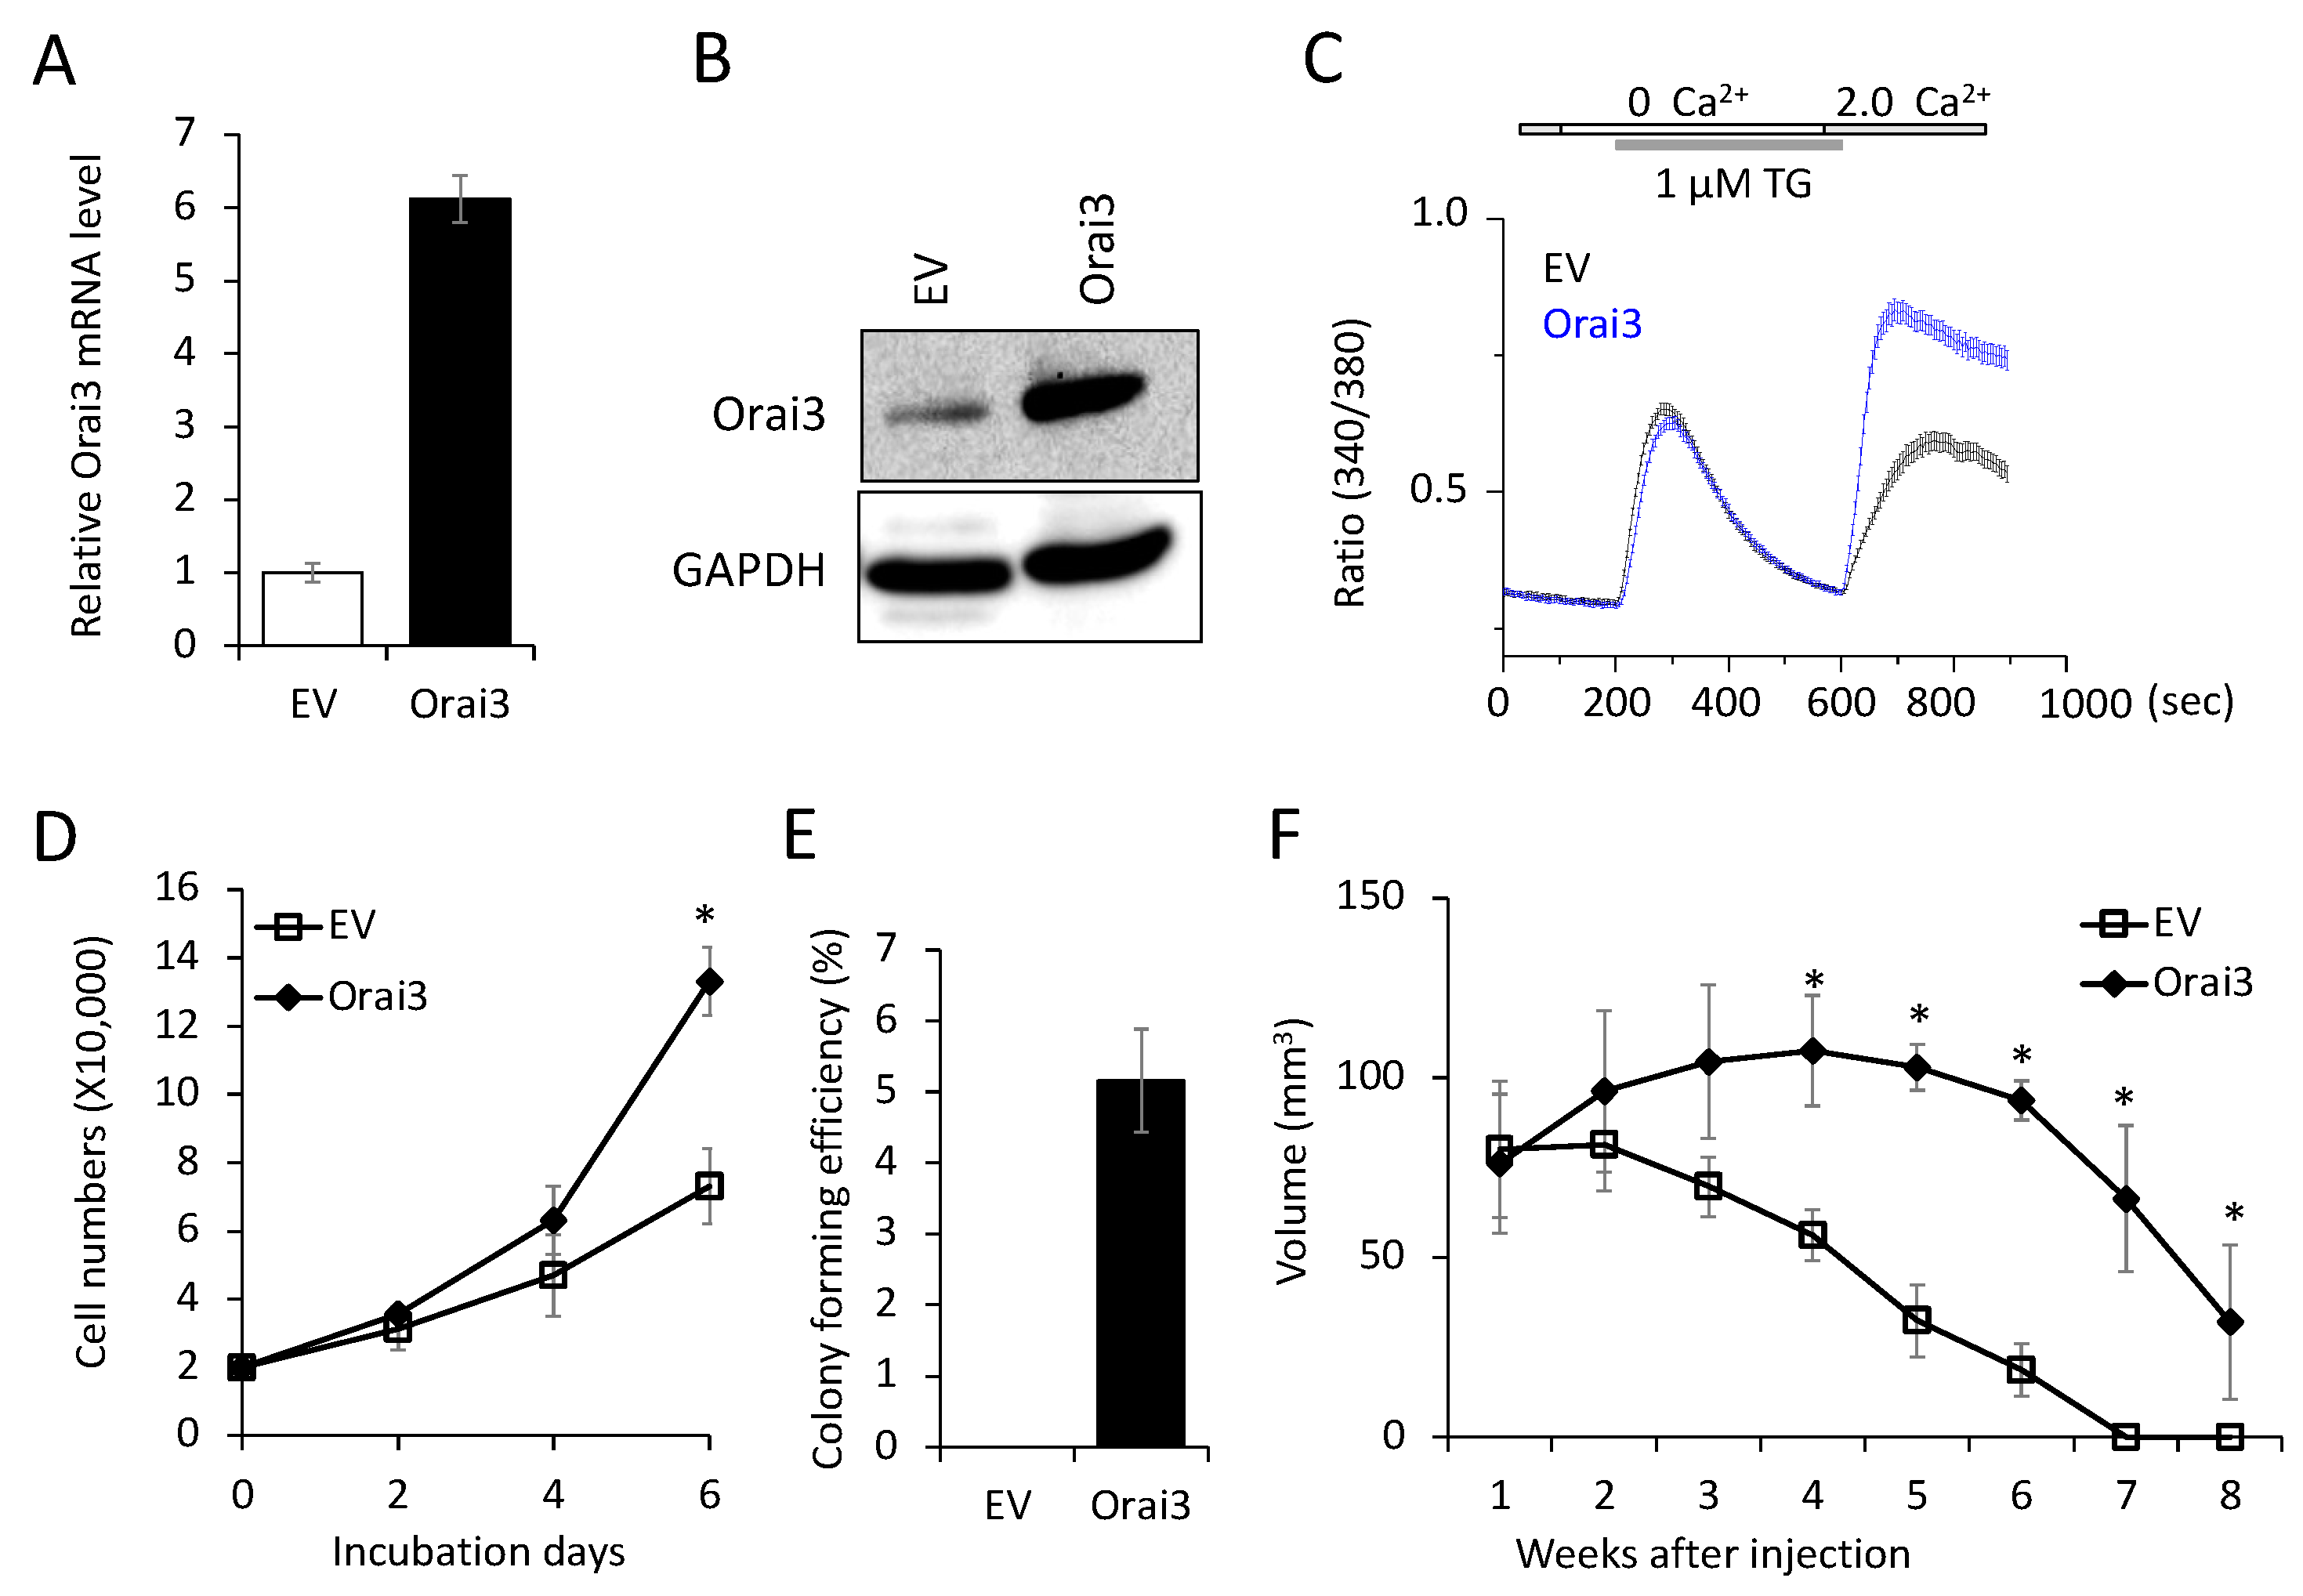
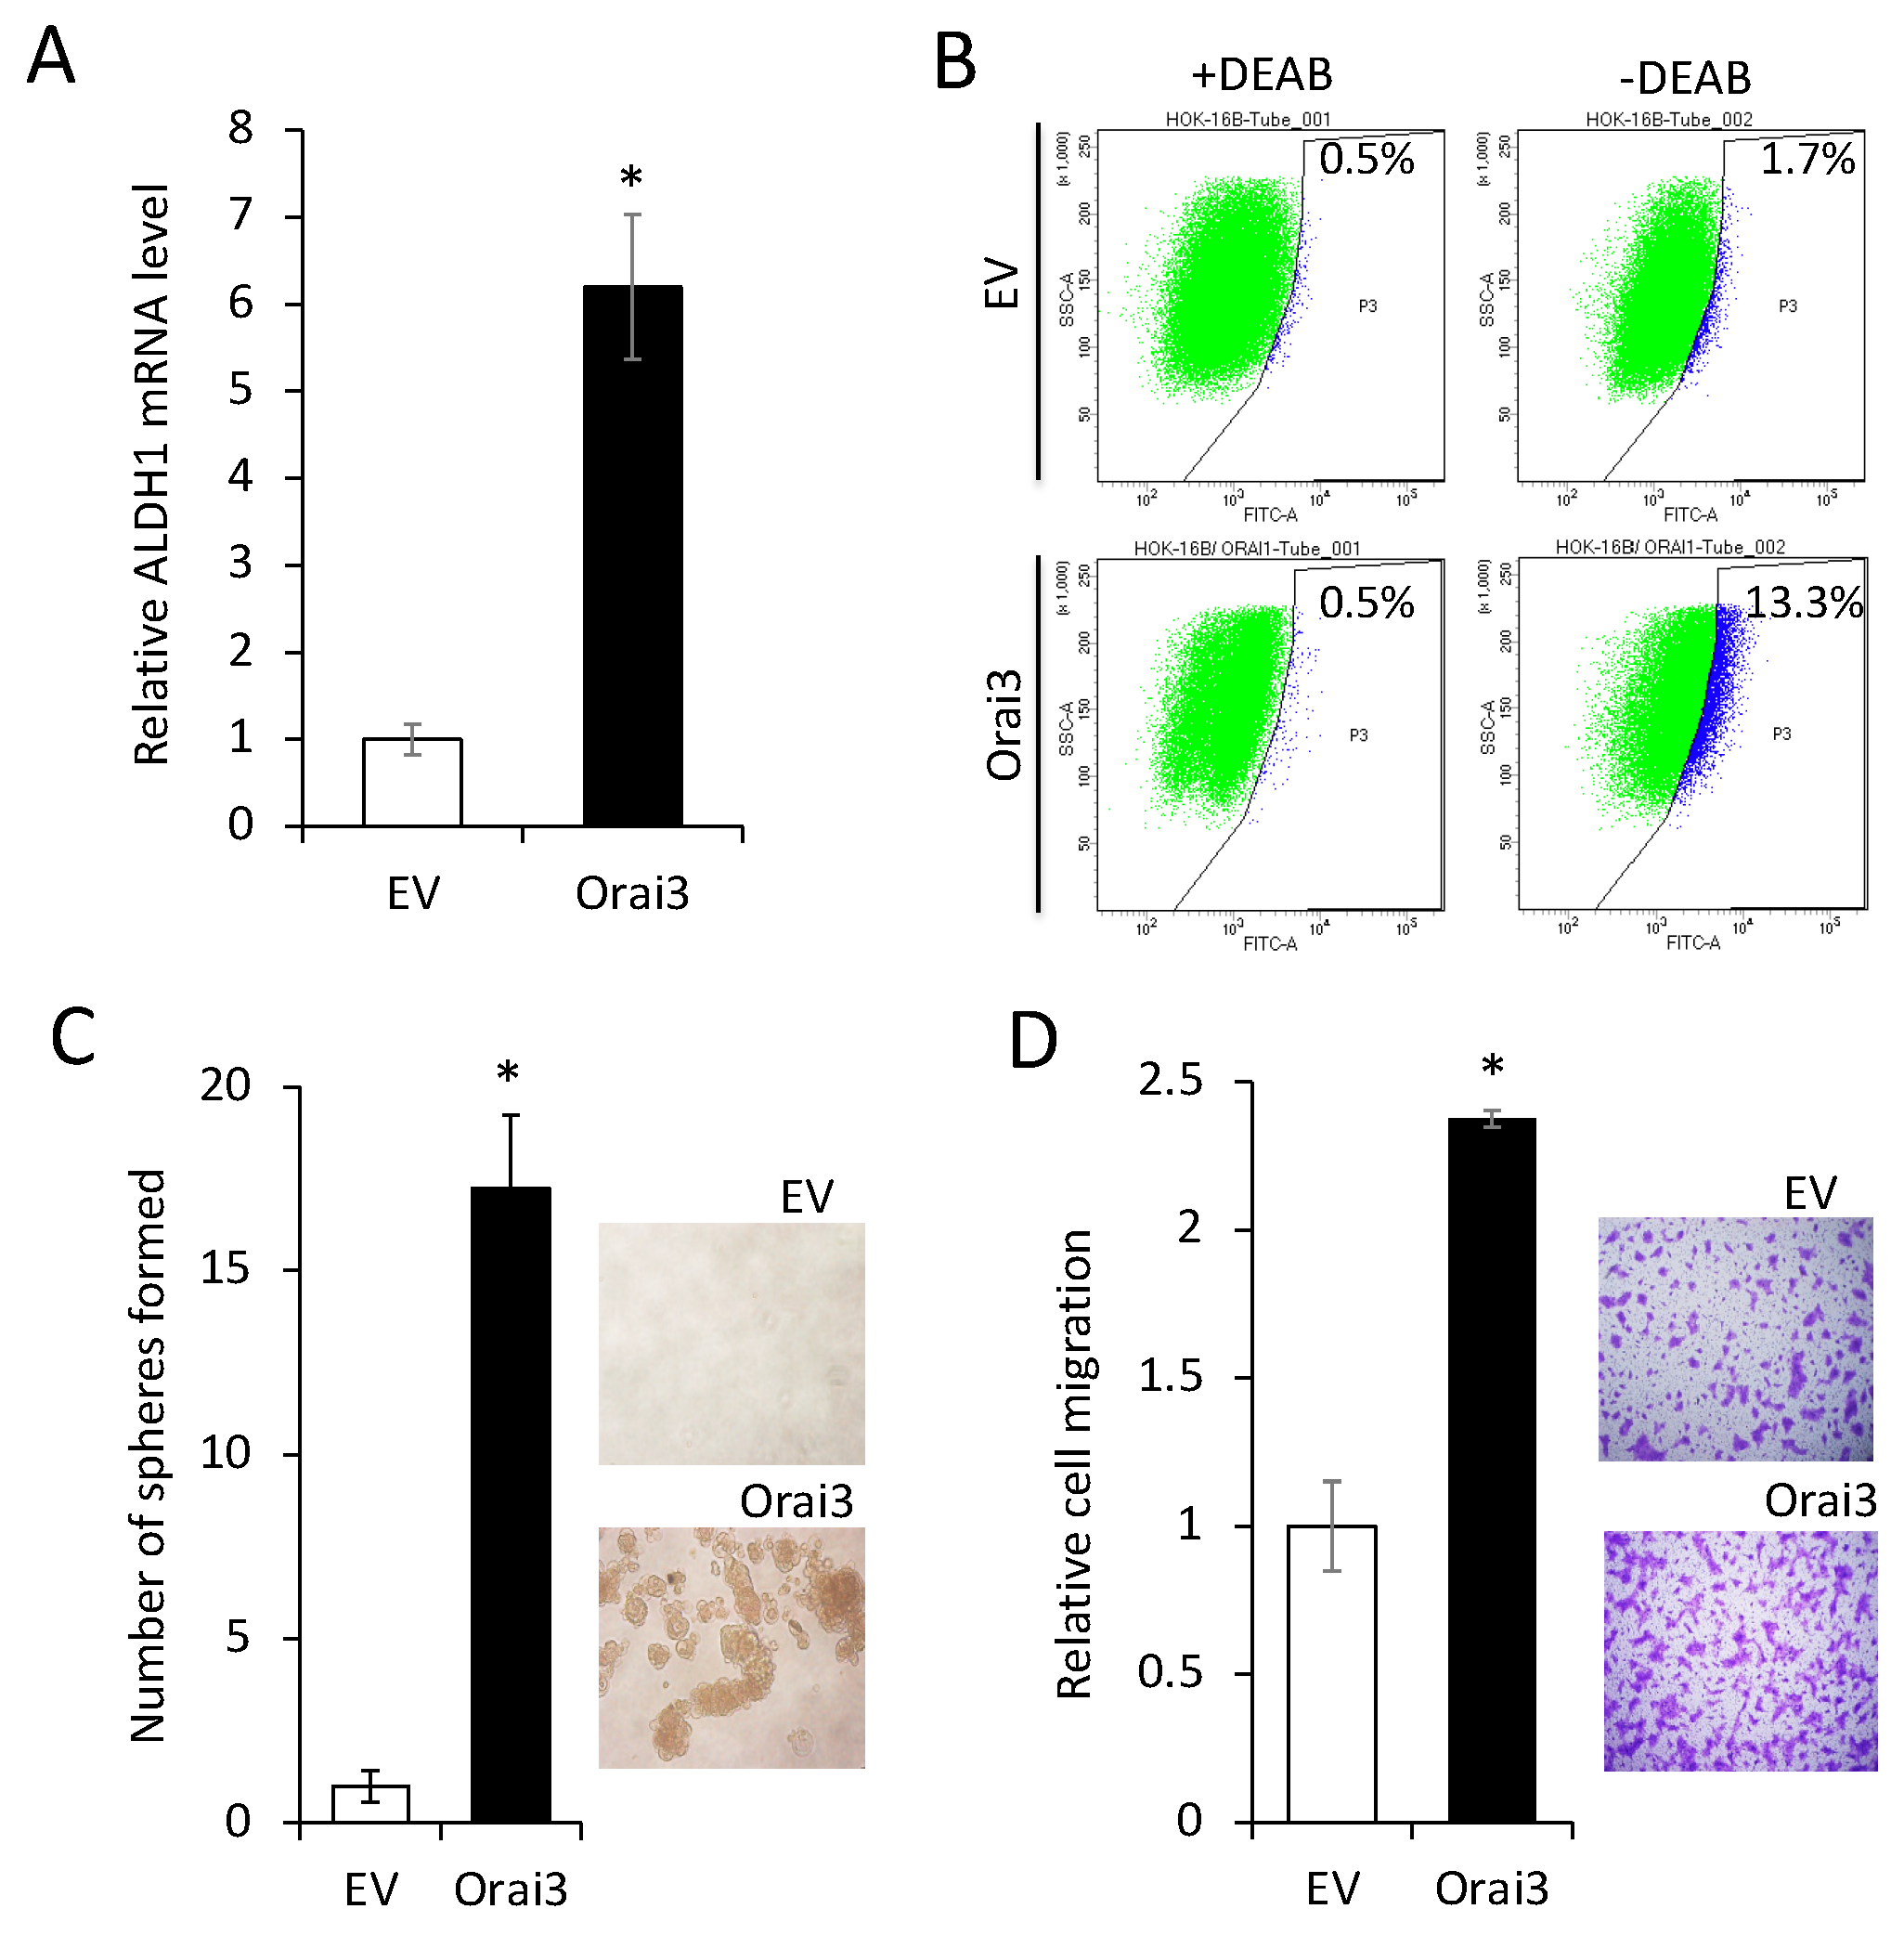
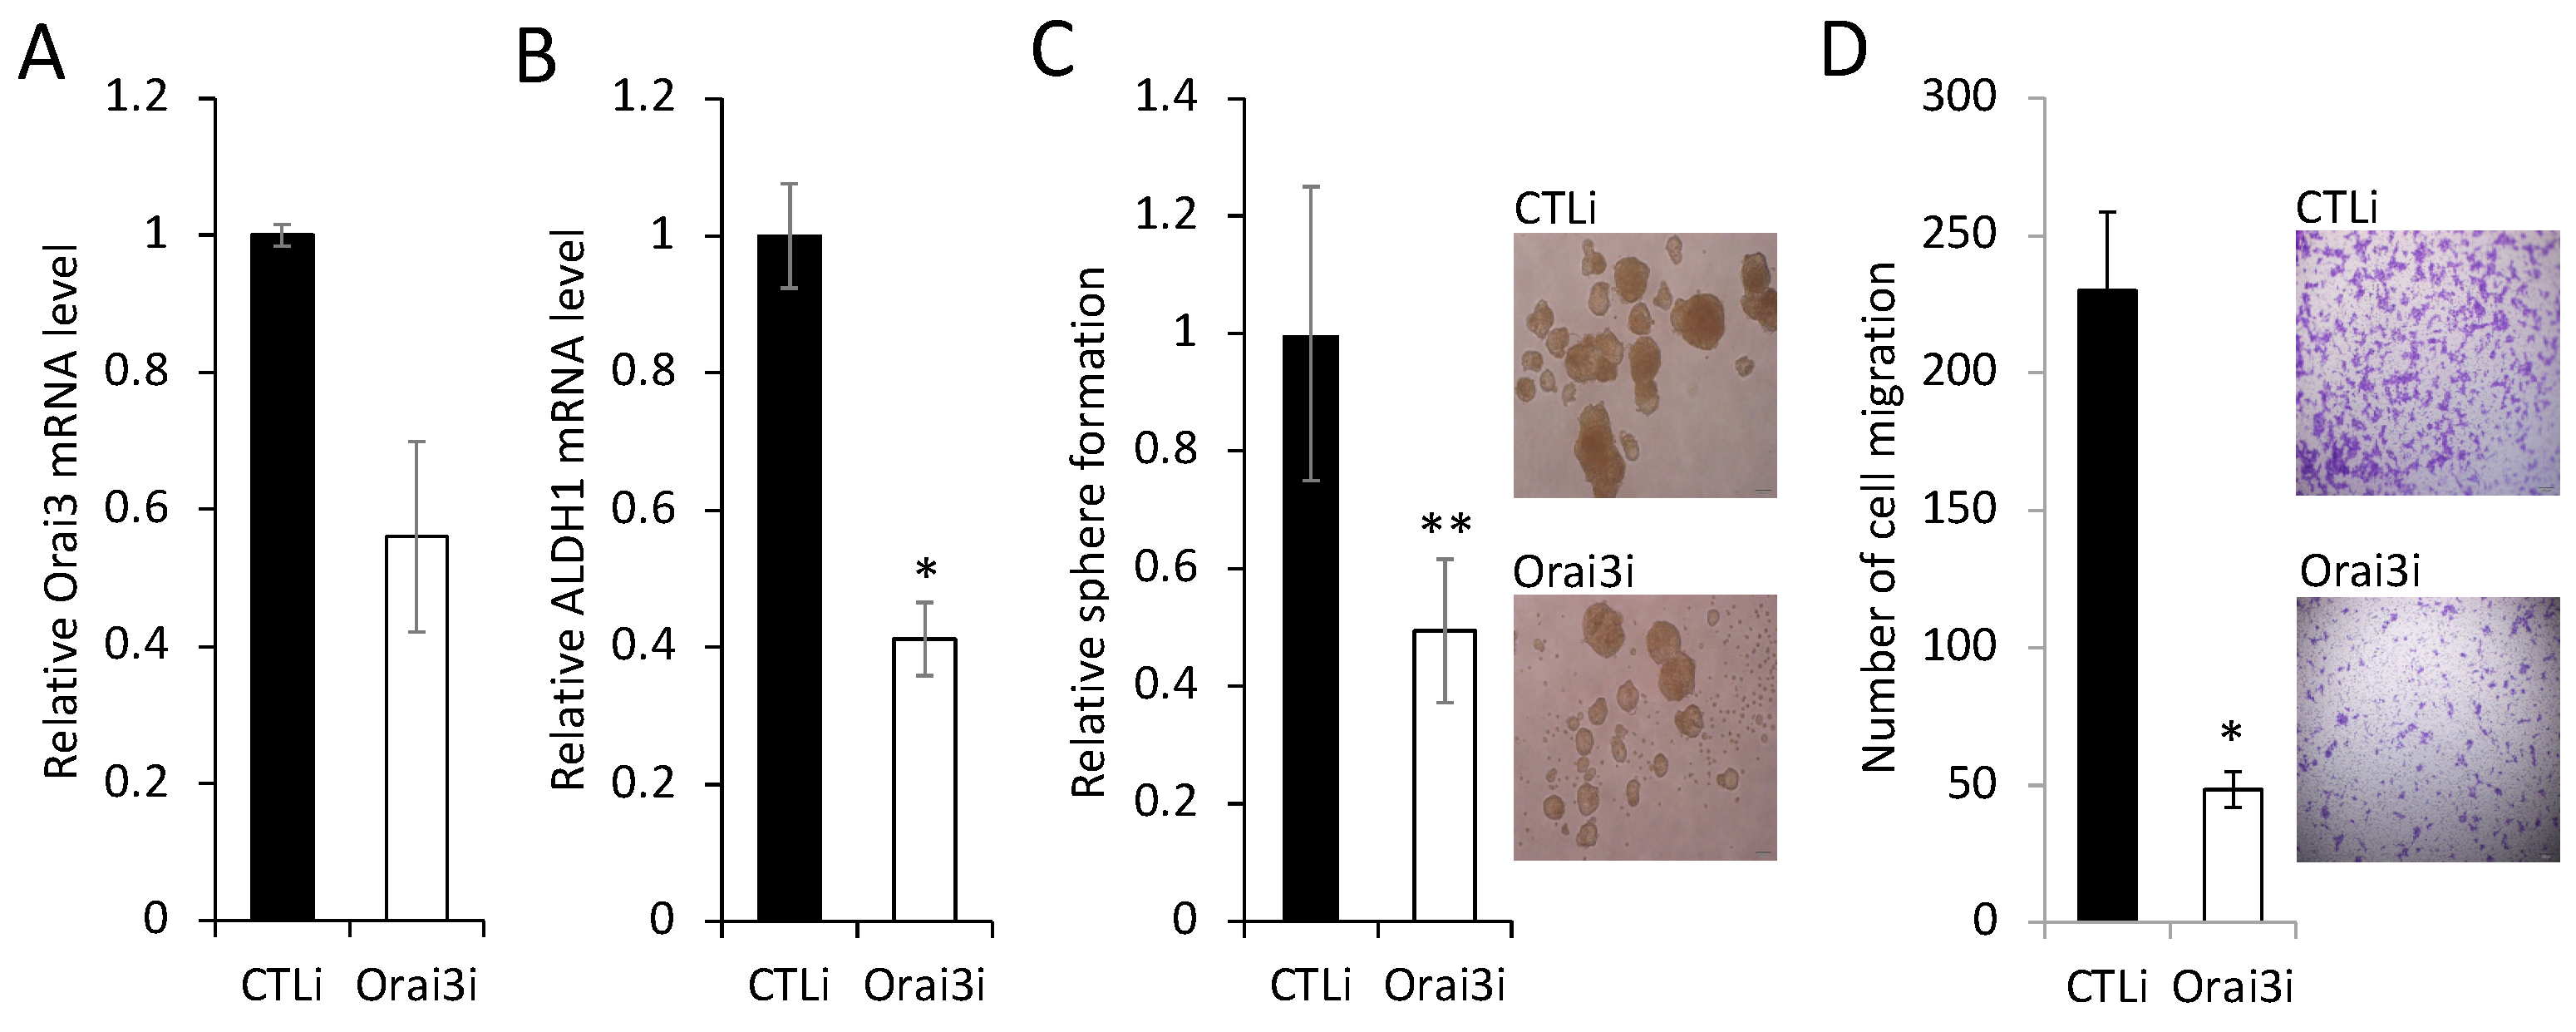
3.3. Elevated Orai3 supports CSC phenotype
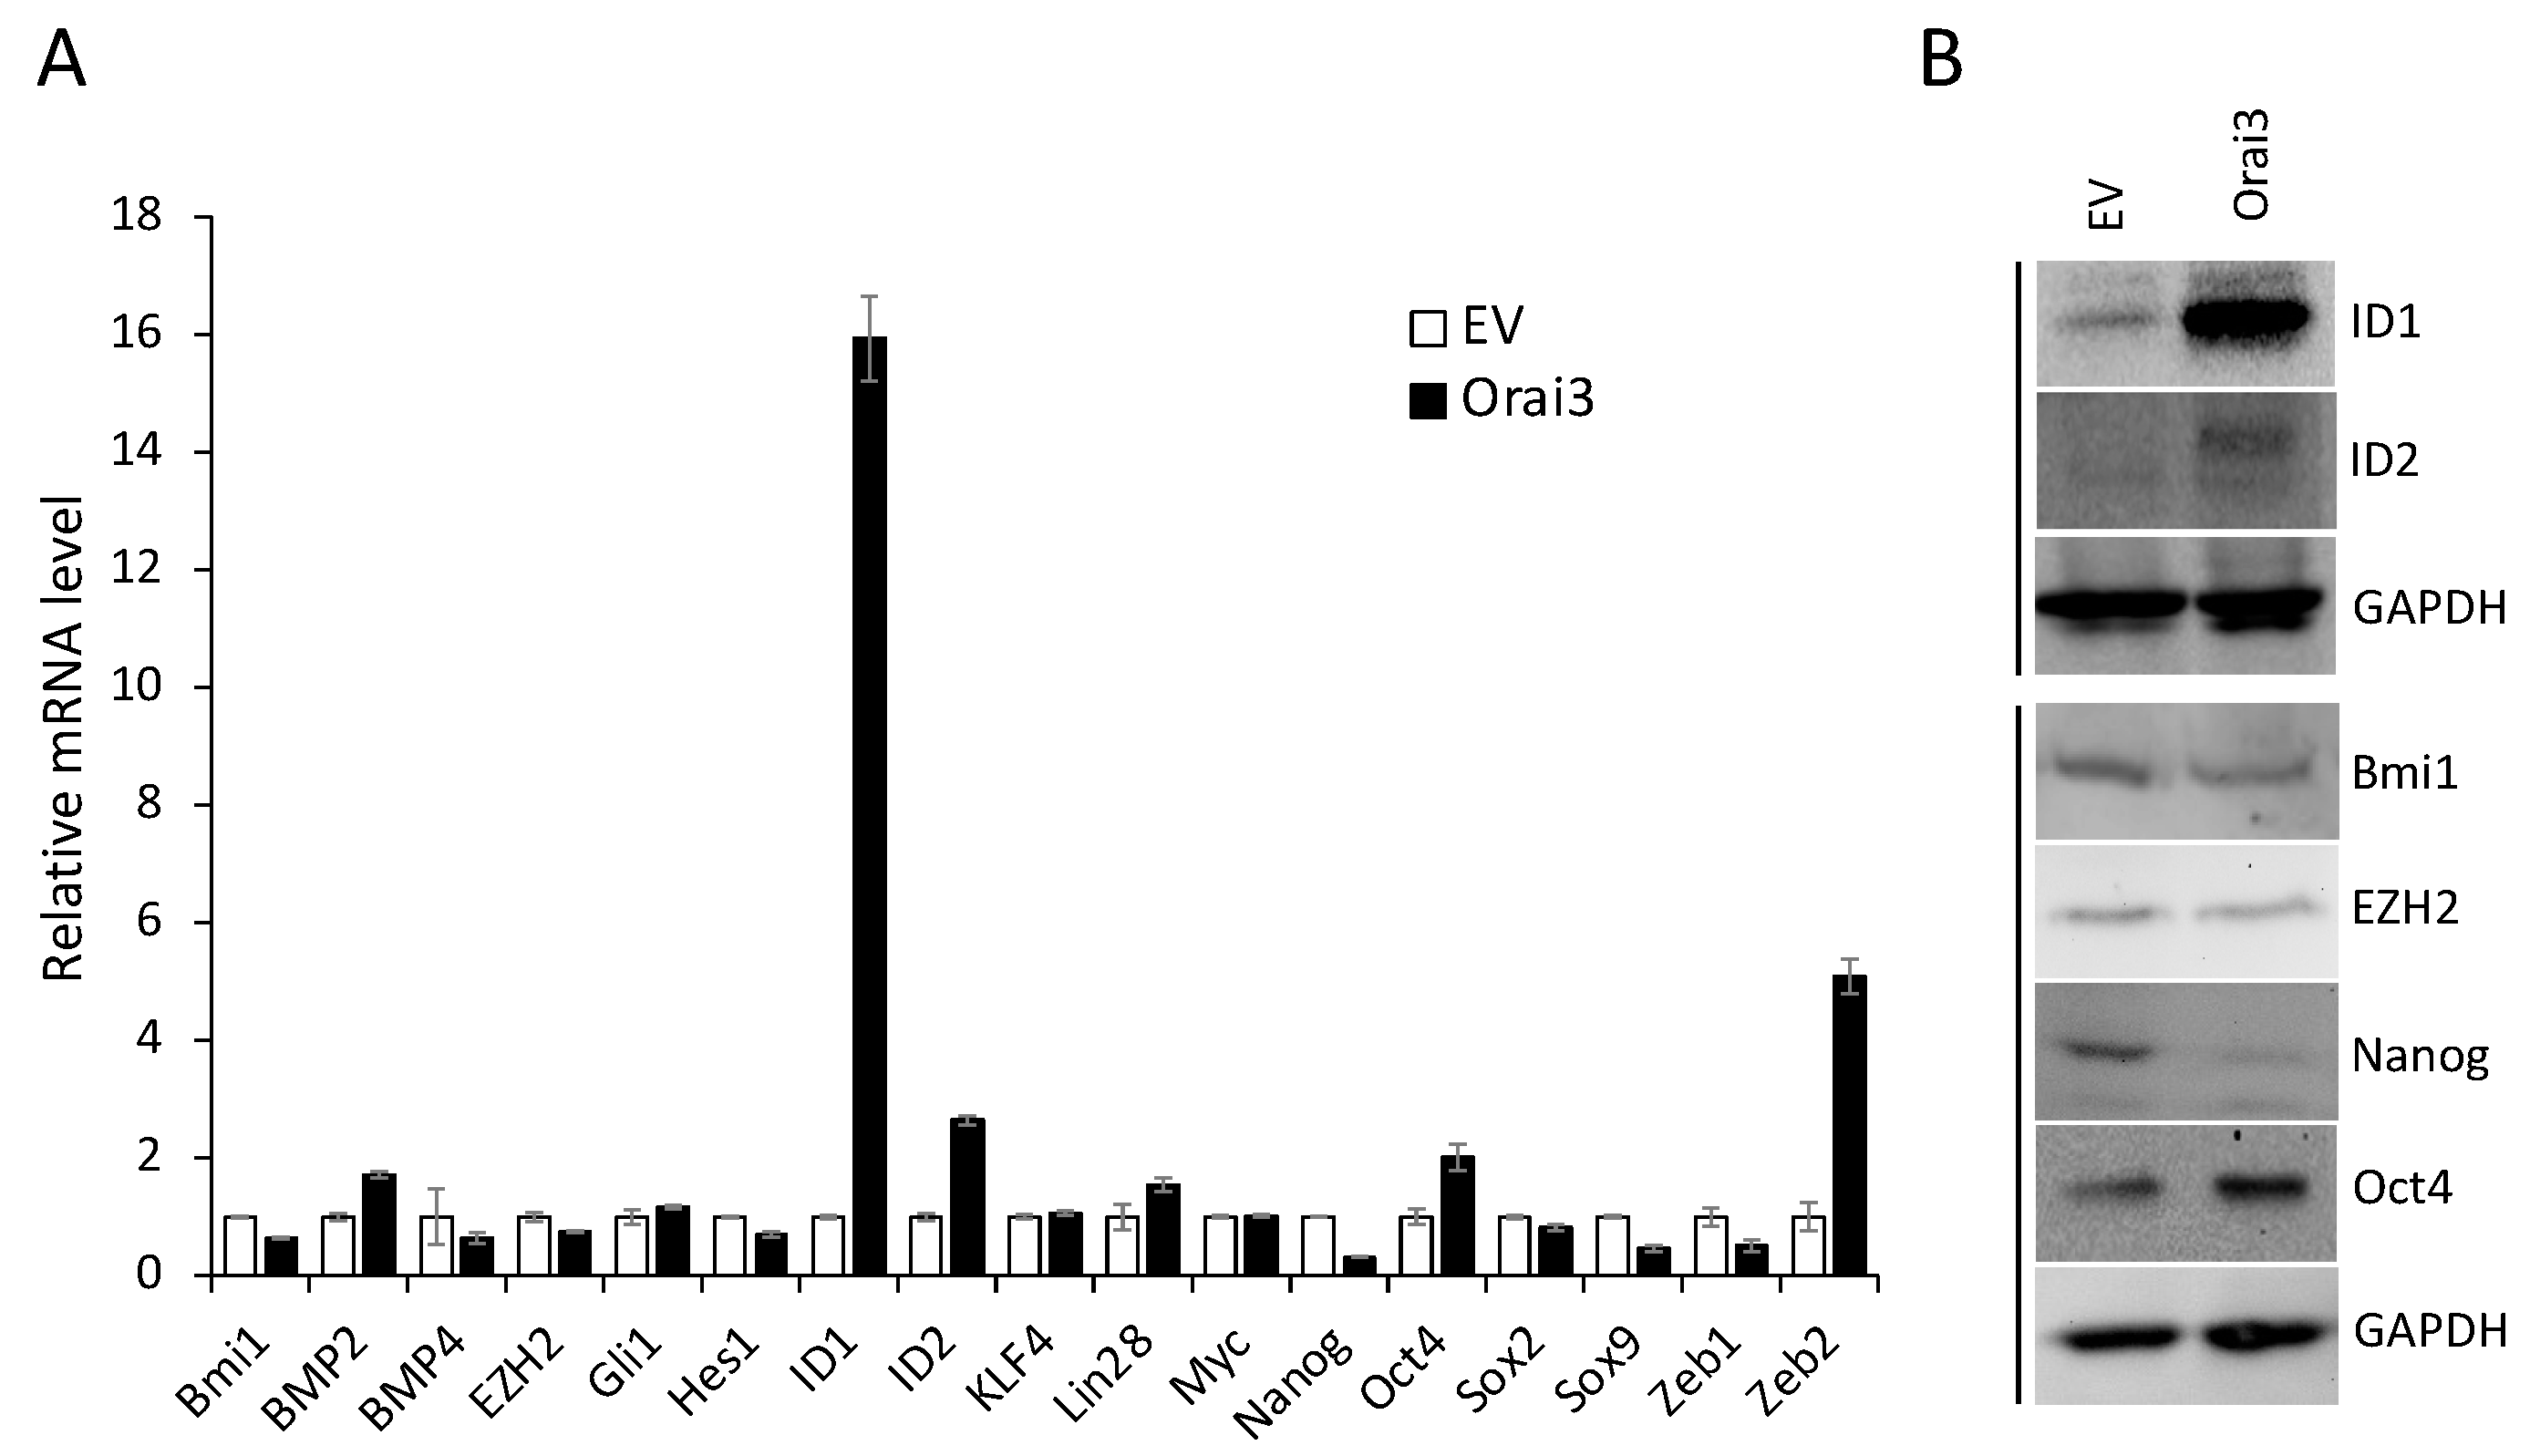
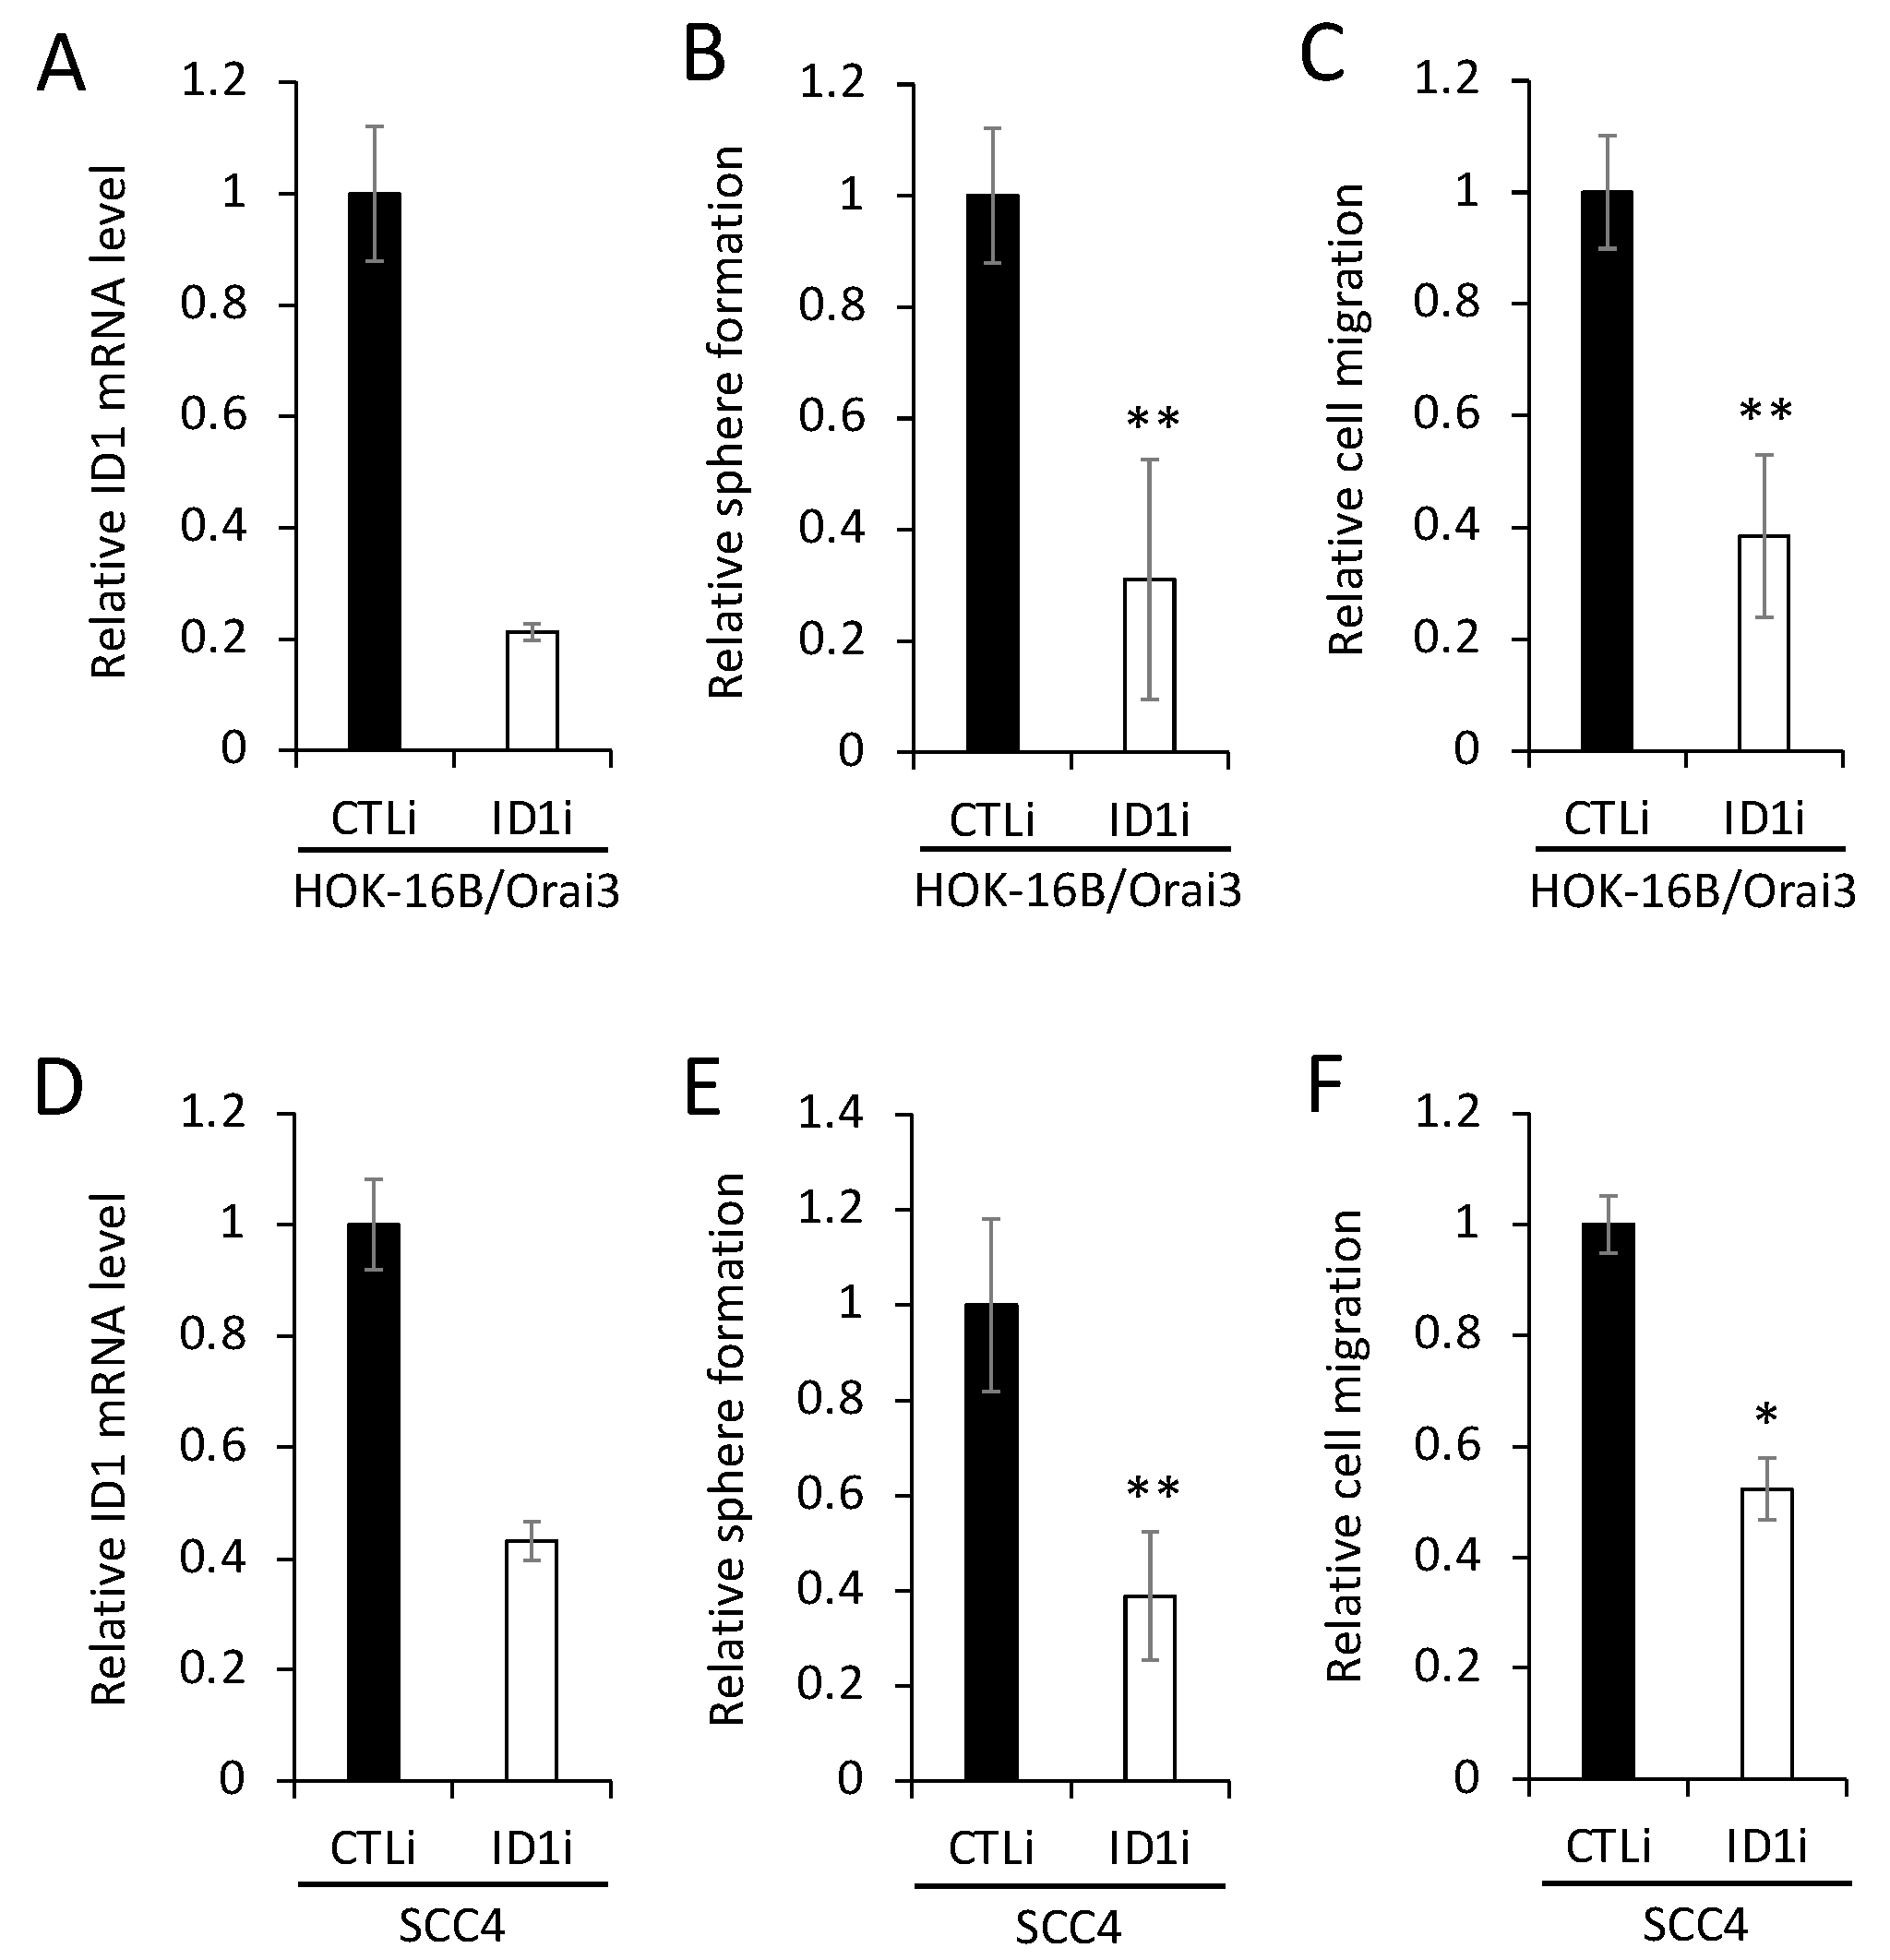
3.4. ID1 is required for Orai3-induced CSC phenotype
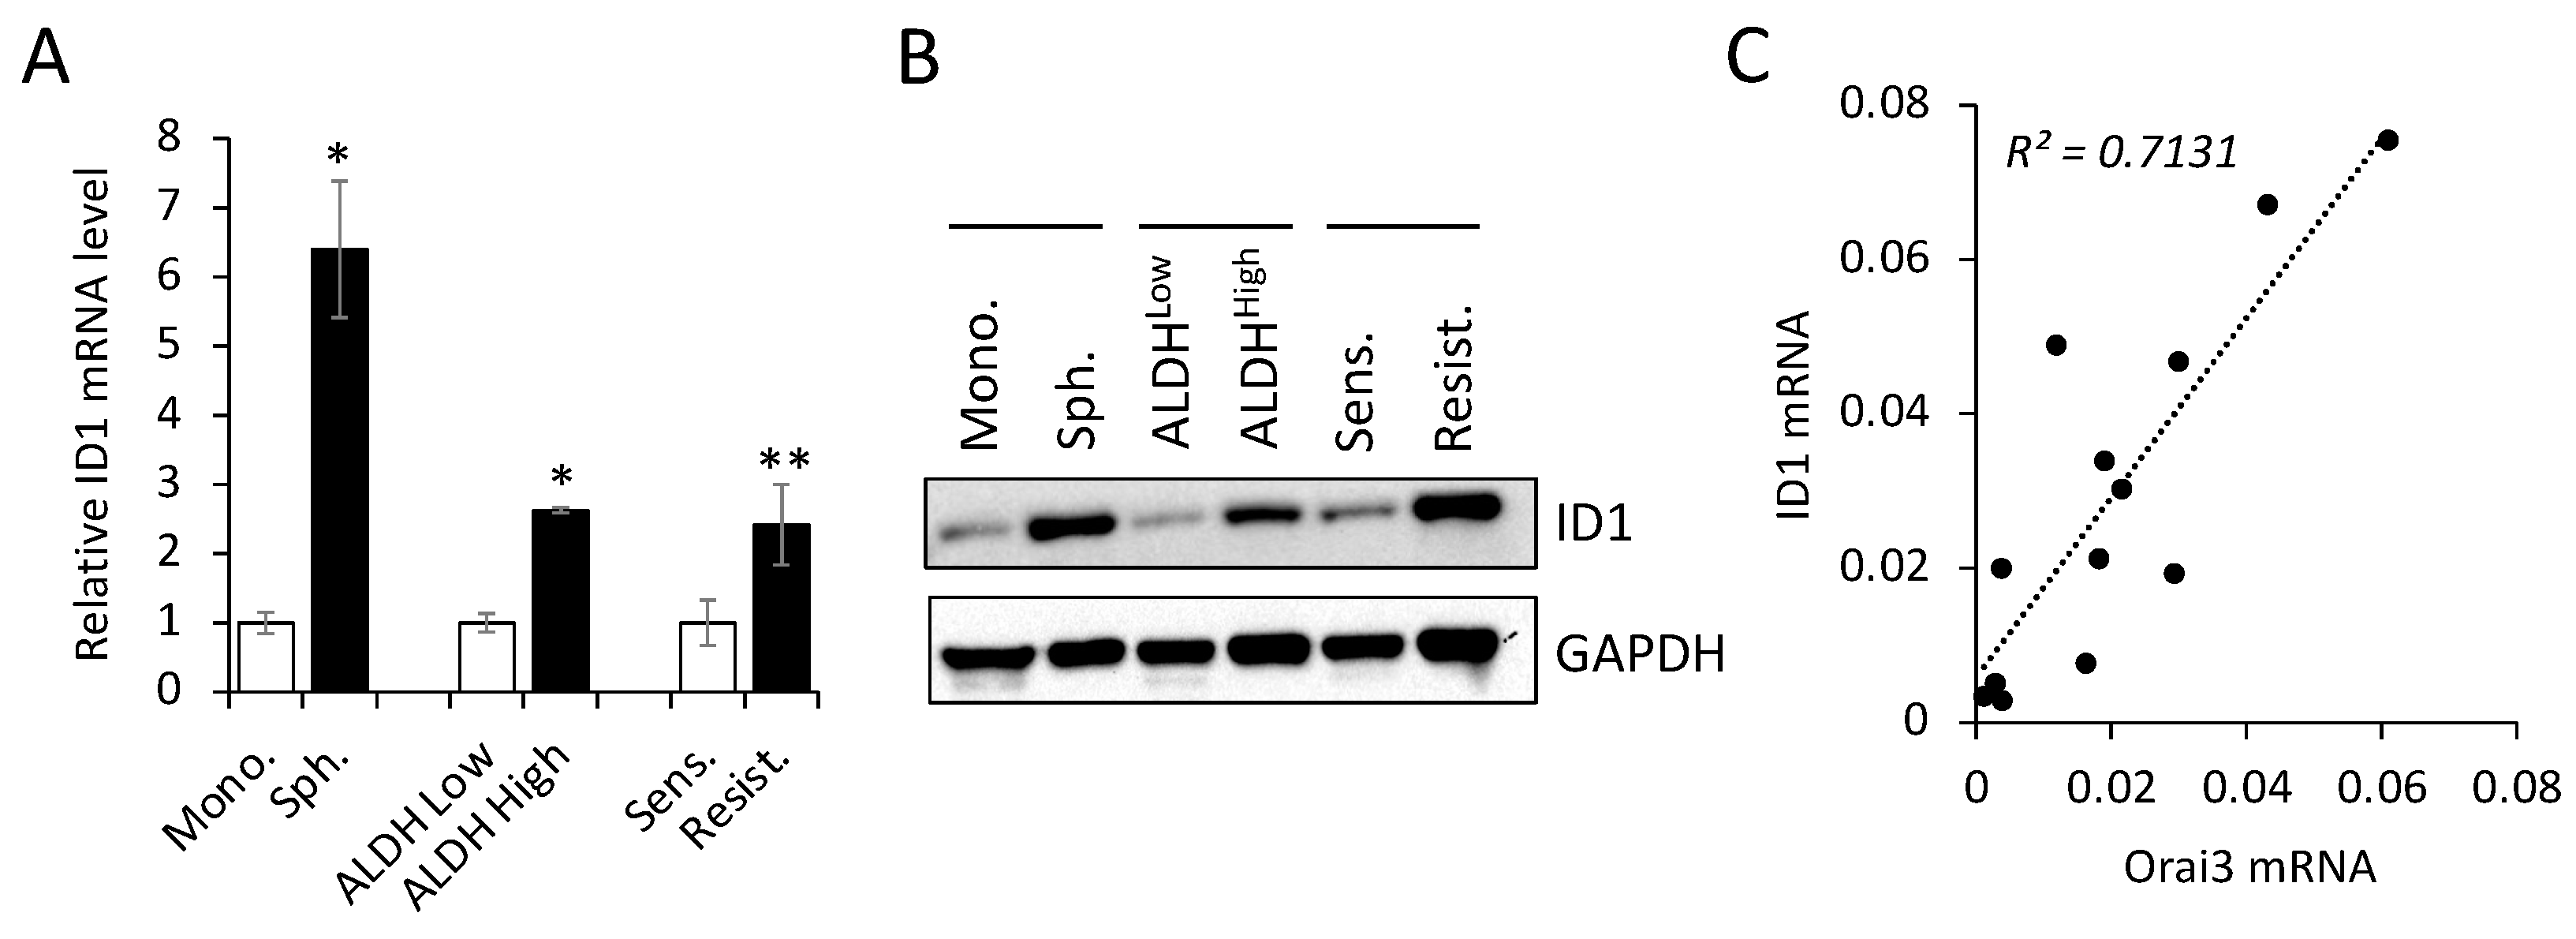
3.5. Orai3 and ID1 are highly expressed in CSC-enriched populations, and their expression levels are positively correlated in OSCC cells
4. Discussion
Author Contributions
Funding
Institutional Review Board Statement
Informed Consent Statement
Data Availability Statement
Acknowledgments
Conflicts of Interest
Abbreviations
References
- Nassar, D.; Blanpain, C. Cancer Stem Cells: Basic Concepts and Therapeutic Implications. Annu Rev Pathol 2016, 11, 47–76. [Google Scholar] [CrossRef] [PubMed]
- Shin, K.-H.; Kim, R.H. An Updated Review of Oral Cancer Stem Cells and Their Stemness Regulation. 2018, 23, 189–200. [Google Scholar] [CrossRef] [PubMed]
- Warnakulasuriya, S.; Reibel, J.; Bouquot, J.; Dabelsteen, E. Oral epithelial dysplasia classification systems: predictive value, utility, weaknesses and scope for improvement. J Oral Pathol Med 2008, 37, 127–133. [Google Scholar] [CrossRef]
- Brennan, M.; Migliorati, C.A.; Lockhart, P.B.; Wray, D.; Al-Hashimi, I.; Axell, T.; Bruce, A.J.; Carpenter, W.; Eisenberg, E.; Epstein, J.B.; et al. Management of oral epithelial dysplasia: a review. Oral Surg Oral Med Oral Pathol Oral Radiol Endod, 2007; 103 Suppl, S19 e11–12. [Google Scholar] [CrossRef]
- Marcial, V.A.; Pajak, T.F.; Mohiuddin, M.; Cooper, J.S.; al Sarraf, M.; Mowry, P.A.; Curran, W.; Crissman, J.; Rodriguez, M.; Velez-Garcia, E. Concomitant cisplatin chemotherapy and radiotherapy in advanced mucosal squamous cell carcinoma of the head and neck. Long-term results of the Radiation Therapy Oncology Group study 81-17. Cancer 1990, 66, 1861–1868. [Google Scholar] [CrossRef] [PubMed]
- Berridge, M.J.; Bootman, M.D.; Roderick, H.L. Calcium signalling: dynamics, homeostasis and remodelling. Nat Rev Mol Cell Biol 2003, 4, 517–529. [Google Scholar] [CrossRef]
- Monteith, G.R.; McAndrew, D.; Faddy, H.M.; Roberts-Thomson, S.J. Calcium and cancer: targeting Ca2+ transport. Nat Rev Cancer 2007, 7, 519–530. [Google Scholar] [CrossRef] [PubMed]
- Roderick, H.L.; Cook, S.J. Ca2+ signalling checkpoints in cancer: remodelling Ca2+ for cancer cell proliferation and survival. Nat Rev Cancer 2008, 8, 361–375. [Google Scholar] [CrossRef]
- Prevarskaya, N.; Skryma, R.; Shuba, Y. Calcium in tumour metastasis: new roles for known actors. Nat Rev Cancer 2011, 11, 609–618. [Google Scholar] [CrossRef]
- Monteith, G.R.; McAndrew, D.; Faddy, H.M.; Roberts-Thomson, S.J. Calcium and cancer: targeting Ca2+ transport. Nat Rev Cancer 2007, 7, 519–530. [Google Scholar] [CrossRef]
- Flourakis, M.; Lehen’kyi, V.; Beck, B.; Raphael, M.; Vandenberghe, M.; Abeele, F.V.; Roudbaraki, M.; Lepage, G.; Mauroy, B.; Romanin, C.; et al. Orai1 contributes to the establishment of an apoptosis-resistant phenotype in prostate cancer cells. Cell Death Dis 2010, 1, e75. [Google Scholar] [CrossRef]
- Yang, S.; Zhang, J.J.; Huang, X.Y. Orai1 and STIM1 are critical for breast tumor cell migration and metastasis. Cancer Cell 2009, 15, 124–134. [Google Scholar] [CrossRef]
- Liu, H.; Hughes, J.D.; Rollins, S.; Chen, B.; Perkins, E. Calcium entry via ORAI1 regulates glioblastoma cell proliferation and apoptosis. Exp Mol Pathol 2011, 91, 753–760. [Google Scholar] [CrossRef] [PubMed]
- Kim, J.H.; Lkhagvadorj, S.; Lee, M.R.; Hwang, K.H.; Chung, H.C.; Jung, J.H.; Cha, S.K.; Eom, M. Orai1 and STIM1 are critical for cell migration and proliferation of clear cell renal cell carcinoma. Biochem Biophys Res Commun 2014, 448, 76–82. [Google Scholar] [CrossRef] [PubMed]
- Zhu, H.; Zhang, H.; Jin, F.; Fang, M.; Huang, M.; Yang, C.S.; Chen, T.; Fu, L.; Pan, Z. Elevated Orai1 expression mediates tumor-promoting intracellular Ca2+ oscillations in human esophageal squamous cell carcinoma; 2014.
- Lee, S.H.; Rigas, N.K.; Lee, C.R.; Bang, A.; Srikanth, S.; Gwack, Y.; Kang, M.K.; Kim, R.H.; Park, N.H.; Shin, K.H. Orai1 promotes tumor progression by enhancing cancer stemness via NFAT signaling in oral/oropharyngeal squamous cell carcinoma. Oncotarget 2016. [Google Scholar] [CrossRef] [PubMed]
- Wang, L.; Hao, J.; Zhang, Y.; Yang, Z.; Cao, Y.; Lu, W.; Shu, Y.; Jiang, L.; Hu, Y.; Lv, W.; et al. Orai1 mediates tumor-promoting store-operated Ca2+ entry in human gastrointestinal stromal tumors via c-KIT and the extracellular signal-regulated kinase pathway. Tumour Biol 2017, 39, 1010428317691426. [Google Scholar] [CrossRef]
- Xia, J.; Wang, H.; Huang, H.; Sun, L.; Dong, S.; Huang, N.; Shi, M.; Bin, J.; Liao, Y.; Liao, W. Elevated Orai1 and STIM1 expressions upregulate MACC1 expression to promote tumor cell proliferation, metabolism, migration, and invasion in human gastric cancer. Cancer Lett 2016, 381, 31–40. [Google Scholar] [CrossRef]
- Deng, W.; Wang, J.; Zhang, J.; Cai, J.; Bai, Z.; Zhang, Z. Orai1, a Direct Target of microRNA-519, Promotes Progression of Colorectal Cancer via Akt/GSK3beta Signaling Pathway. Dig Dis Sci 2016, 61, 1553–1560. [Google Scholar] [CrossRef]
- Zhan, Z.Y.; Zhong, L.X.; Feng, M.; Wang, J.F.; Liu, D.B.; Xiong, J.P. Over-expression of Orai1 mediates cell proliferation and associates with poor prognosis in human non-small cell lung carcinoma. Int J Clin Exp Pathol 2015, 8, 5080–5088. [Google Scholar]
- Srikanth, S.; Gwack, Y. Chapter Eight - Molecular Regulation of the Pore Component of CRAC Channels, Orai1. In Current Topics in Membranes; Murali, P., Ed.; Academic Press, 2013; Volume 71, pp. 181–207. [Google Scholar]
- Cantonero, C.; Sanchez-Collado, J.; Gonzalez-Nunez, M.A.; Salido, G.M.; Lopez, J.J.; Jardin, I.; Rosado, J.A. Store-independent Orai1-mediated Ca(2+) entry and cancer. Cell Calcium 2019, 80, 1–7. [Google Scholar] [CrossRef]
- Lee, S.H.; Rigas, N.K.; Lee, C.R.; Bang, A.; Srikanth, S.; Gwack, Y.; Kang, M.K.; Kim, R.H.; Park, N.H.; Shin, K.H. Orai1 promotes tumor progression by enhancing cancer stemness via NFAT signaling in oral/oropharyngeal squamous cell carcinoma. Oncotarget 2016, 7, 43239–43255. [Google Scholar] [CrossRef]
- Singh, A.K.; Roy, N.K.; Bordoloi, D.; Padmavathi, G.; Banik, K.; Khwairakpam, A.D.; Kunnumakkara, A.B.; Sukumar, P. Orai-1 and Orai-2 regulate oral cancer cell migration and colonisation by suppressing Akt/mTOR/NF-kappaB signalling. Life Sci 2020, 261, 118372. [Google Scholar] [CrossRef] [PubMed]
- Shin, K.H.; Bae, S.D.; Hong, H.S.; Kim, R.H.; Kang, M.K.; Park, N.H. miR-181a shows tumor suppressive effect against oral squamous cell carcinoma cells by downregulating K-ras. Biochemical and Biophysical Research Communications 2011, 404, 896–902. [Google Scholar] [CrossRef] [PubMed]
- Gwack, Y.; Srikanth, S.; Feske, S.; Cruz-Guilloty, F.; Oh-hora, M.; Neems, D.S.; Hogan, P.G.; Rao, A. Biochemical and functional characterization of Orai proteins. J Biol Chem 2007, 282, 16232–16243. [Google Scholar] [CrossRef] [PubMed]
- Kim, K.D.; Srikanth, S.; Yee, M.K.; Mock, D.C.; Lawson, G.W.; Gwack, Y. ORAI1 deficiency impairs activated T cell death and enhances T cell survival. Journal of immunology 2011, 187, 3620–3630. [Google Scholar] [CrossRef]
- Park, N.H.; Gujuluva, C.N.; Baek, J.H.; Cherrick, H.M.; Shin, K.H.; Min, B.M. Combined oral carcinogenicity of HPV-16 and benzo(a)pyrene: an in vitro multistep carcinogenesis model. Oncogene 1995, 10, 2145–2153. [Google Scholar]
- Chen, W.; Kang, K.L.; Alshaikh, A.; Varma, S.; Lin, Y.-L.; Shin, K.-H.; Kim, R.; Wang, C.-Y.; Park, N.-H.; Walentin, K.; et al. Grainyhead-like 2 (GRHL2) knockout abolishes oral cancer development through reciprocal regulation of the MAP kinase and TGF-β signaling pathways. Oncogenesis 2018, 7, 38. [Google Scholar] [CrossRef]
- Najafi, M.; Farhood, B.; Mortezaee, K. Cancer stem cells (CSCs) in cancer progression and therapy. J Cell Physiol 2019, 234, 8381–8395. [Google Scholar] [CrossRef]
- Shin, K.H.; Kim, R.H. An Updated Review of Oral Cancer Stem Cells and Their Stemness Regulation. Crit Rev Oncog 2018, 23, 189–200. [Google Scholar] [CrossRef]
- Martin, C.E.; Nguyen, A.; Kang, M.K.; Kim, R.H.; Park, N.H.; Shin, K.H. DYRK1A is required for maintenance of cancer stemness, contributing to tumorigenic potential in oral/oropharyngeal squamous cell carcinoma. Exp Cell Res 2021, 405. [Google Scholar] [CrossRef]
- 10. yexcr.2021.11 2656.
- Mori, S.; Chang, J.T.; Andrechek, E.R.; Matsumura, N.; Baba, T.; Yao, G.; Kim, J.W.; Gatza, M.; Murphy, S.; Nevins, J.R. Anchorage-independent cell growth signature identifies tumors with metastatic potential. Oncogene 2009, 28, 2796–2805. [Google Scholar] [CrossRef] [PubMed]
- Lasorella, A.; Benezra, R.; Iavarone, A. The ID proteins: master regulators of cancer stem cells and tumour aggressiveness. Nat Rev Cancer 2014, 14, 77–91. [Google Scholar] [CrossRef] [PubMed]
- Nayak, S.; Goel, M.M.; Makker, A.; Bhatia, V.; Chandra, S.; Kumar, S.; Agarwal, S.P. Fibroblast Growth Factor (FGF-2) and Its Receptors FGFR-2 and FGFR-3 May Be Putative Biomarkers of Malignant Transformation of Potentially Malignant Oral Lesions into Oral Squamous Cell Carcinoma. PLoS One 2015, 10, e0138801. [Google Scholar] [CrossRef] [PubMed]
- Ozretic, L.; Wagner, S.; Huebbers, C.U.; Gattenlohner, S.; Klussmann, J.P.; Beutner, D.; Zander, T.; Buettner, R.; Quaas, A. FGFR1 amplification and co-overexpression of c-MYC in oropharyngeal squamous cell carcinoma. Oral Oncol 2016, 54, e7–e9. [Google Scholar] [CrossRef]
- Dvorak, P.; Dvorakova, D.; Hampl, A. Fibroblast growth factor signaling in embryonic and cancer stem cells. FEBS Lett 2006, 580, 2869–2874. [Google Scholar] [CrossRef]
- Gotoh, N. Control of stemness by fibroblast growth factor signaling in stem cells and cancer stem cells. Curr Stem Cell Res Ther 2009, 4, 9–15. [Google Scholar] [CrossRef]
- Lee, S.H.; Kieu, C.; Martin, C.E.; Han, J.; Chen, W.; Kim, J.S.; Kang, M.K.; Kim, R.H.; Park, N.H.; Kim, Y.; et al. NFATc3 plays an oncogenic role in oral/oropharyngeal squamous cell carcinomas by promoting cancer stemness via expression of OCT4. Oncotarget 2019, 10, 2306–2319. [Google Scholar] [CrossRef]
- Lee, C.R.; Lee, S.H.; Rigas, N.K.; Kim, R.H.; Kang, M.K.; Park, N.H.; Shin, K.H. Elevated expression of JMJD6 is associated with oral carcinogenesis and maintains cancer stemness properties. Carcinogenesis 2016, 37, 119–128. [Google Scholar] [CrossRef]
- Patel, S.S.; Shah, K.A.; Shah, M.J.; Kothari, K.C.; Rawal, R.M. Cancer stem cells and stemness markers in oral squamous cell carcinomas. Asian Pac J Cancer Prev 2014, 15, 8549–8556. [Google Scholar] [CrossRef]
- Meyer, M.J.; Fleming, J.M.; Lin, A.F.; Hussnain, S.A.; Ginsburg, E.; Vonderhaar, B.K. CD44posCD49fhiCD133/2hi defines xenograft-initiating cells in estrogen receptor-negative breast cancer. Cancer Res 2010, 70, 4624–4633. [Google Scholar] [CrossRef]
- Sanchez-Collado, J.; Jardin, I.; Lopez, J.J.; Ronco, V.; Salido, G.M.; Dubois, C.; Prevarskaya, N.; Rosado, J.A. Role of Orai3 in the Pathophysiology of Cancer. Int J Mol Sci 2021, 22. [Google Scholar] [CrossRef] [PubMed]
- Clay, M.R.; Tabor, M.; Owen, J.H.; Carey, T.E.; Bradford, C.R.; Wolf, G.T.; Wicha, M.S.; Prince, M.E. Single-Marker Identification of Head and Neck Squamous Cell Carcinoma Cancer Stem Cells with Aldehyde Dehydrogenase. Head and Neck-Journal for the Sciences and Specialties of the Head and Neck 2010, 32, 1195–1201. [Google Scholar] [CrossRef] [PubMed]
- Ota, N.; Ohno, J.; Seno, K.; Taniguchi, K.; Ozeki, S. In vitro and in vivo expression of aldehyde dehydrogenase 1 in oral squamous cell carcinoma. Int J Oncol 2014, 44, 435–442. [Google Scholar] [CrossRef] [PubMed]
- Richard, V.; Sebastian, P.; Nair, M.G.; Nair, S.N.; Malieckal, T.T.; Kumar, T.R.S.; Pillai, M.R. Multiple drug resistant, tumorigenic stem-like cells in oral cancer. Cancer Letters 2013, 338, 300–316. [Google Scholar] [CrossRef] [PubMed]
- Lee, Y.F.; Miller, L.D.; Chan, X.B.; Black, M.A.; Pang, B.; Ong, C.W.; Salto-Tellez, M.; Liu, E.T.; Desai, K.V. JMJD6 is a driver of cellular proliferation and motility and a marker of poor prognosis in breast cancer. Breast Cancer Res 2012, 14. [Google Scholar] [CrossRef] [PubMed]
- Doi 10.1186/Bcr3200.
- Davis, F.M.; Peters, A.A.; Grice, D.M.; Cabot, P.J.; Parat, M.O.; Roberts-Thomson, S.J.; Monteith, G.R. Non-stimulated, agonist-stimulated and store-operated Ca2+ influx in MDA-MB-468 breast cancer cells and the effect of EGF-induced EMT on calcium entry. PLoS One 2012, 7, e36923. [Google Scholar] [CrossRef]
- Perk, J.; Iavarone, A.; Benezra, R. Id family of helix-loop-helix proteins in cancer. Nat Rev Cancer 2005, 5, 603–614. [Google Scholar] [CrossRef]
- Zhao, Z.; Bo, Z.; Gong, W.; Guo, Y. Inhibitor of Differentiation 1 (Id1) in Cancer and Cancer Therapy. Int J Med Sci 2020, 17, 995–1005. [Google Scholar] [CrossRef]
- Lai, X.; Liao, J.; Lin, W.; Huang, C.; Li, J.; Lin, J.; Chen, Q.; Ye, Y. Inhibitor of DNA-binding protein 1 knockdown arrests the growth of colorectal cancer cells and suppresses hepatic metastasis in vivo. Oncol Rep 2014, 32, 79–88. [Google Scholar] [CrossRef]
- Cheng, Y.J.; Tsai, J.W.; Hsieh, K.C.; Yang, Y.C.; Chen, Y.J.; Huang, M.S.; Yuan, S.S. Id1 promotes lung cancer cell proliferation and tumor growth through Akt-related pathway. Cancer Lett 2011, 307, 191–199. [Google Scholar] [CrossRef]
- Gumireddy, K.; Li, A.P.; Kossenkov, A.V.; Cai, K.Q.; Liu, Q.; Yan, J.C.; Xu, H.; Showe, L.; Zhang, L.; Huang, Q.H. ID1 Promotes Breast Cancer Metastasis by S100A9 Regulation. Mol Cancer Res 2014, 12, 1334–1343. [Google Scholar] [CrossRef] [PubMed]
- Sachdeva, R.; Wu, M.; Smiljanic, S.; Kaskun, O.; Ghannad-Zadeh, K.; Celebre, A.; Isaev, K.; Morrissy, A.S.; Guan, J.; Tong, J.F.; et al. ID1 Is Critical for Tumorigenesis and Regulates Chemoresistance in Glioblastoma. Cancer Research 2019, 79, 4057–4071. [Google Scholar] [CrossRef] [PubMed]
- Sun, Y.; Lai, X.; Yu, Y.; Li, J.; Cao, L.; Lin, W.; Huang, C.; Liao, J.; Chen, W.; Li, C.; et al. Inhibitor of DNA binding 1 (Id1) mediates stemness of colorectal cancer cells through the Id1-c-Myc-PLAC8 axis via the Wnt/beta-catenin and Shh signaling pathways. Cancer Manag Res 2019, 11, 6855–6869. [Google Scholar] [CrossRef] [PubMed]
- Shin, D.H.; Park, J.H.; Lee, J.Y.; Won, H.Y.; Jang, K.S.; Min, K.W.; Jang, S.H.; Woo, J.K.; Oh, S.H.; Kong, G. Overexpression of Id1 in transgenic mice promotes mammary basal stem cell activity and breast tumorigenesis. Oncotarget 2015, 6, 17276–17290. [Google Scholar] [CrossRef]
- Parekh, A.B.; Putney, J.W., Jr. Store-operated calcium channels. Physiol Rev 2005, 85, 757–810. [Google Scholar] [CrossRef]
- Mancini, M.; Toker, A. NFAT proteins: emerging roles in cancer progression. Nat Rev Cancer 2009, 9, 810–820. [Google Scholar] [CrossRef]
- Daniel, C.; Gerlach, K.; Väth, M.; Neurath, M.F.; Weigmann, B. Nuclear factor of activated T cells—A transcription factor family as critical regulator in lung and colon cancer. International Journal of Cancer 2014, 134, 1767–1775. [Google Scholar] [CrossRef]
- Chamlali, M.; Kouba, S.; Rodat-Despoix, L.; Todesca, L.M.; Petho, Z.; Schwab, A.; Ouadid-Ahidouch, H. Orai3 Calcium Channel Regulates Breast Cancer Cell Migration through Calcium-Dependent and -Independent Mechanisms. Cells 2021, 10. [Google Scholar] [CrossRef]
- Kim, K.D.; Srikanth, S.; Tan, Y.V.; Yee, M.K.; Jew, M.; Damoiseaux, R.; Jung, M.E.; Shimizu, S.; An, D.S.; Ribalet, B.; et al. Calcium signaling via Orai1 is essential for induction of the nuclear orphan receptor pathway to drive Th17 differentiation. J Immunol 2014, 192, 110–122. [Google Scholar] [CrossRef]
- Mistry, H.; Hsieh, G.; Buhrlage, S.; Huang, M.; Park, E.; Cuny, G.; Galinsky, I.; Stone, R.M.; Gray, N.S.; Parmar, K.; et al. Small Molecule Inhibitors of USP1 Target ID1 Degradation in Leukemic Cells and Cause Cytotoxicity. Blood 2013, 122. [Google Scholar] [CrossRef]
Disclaimer/Publisher’s Note: The statements, opinions and data contained in all publications are solely those of the individual author(s) and contributor(s) and not of MDPI and/or the editor(s). MDPI and/or the editor(s) disclaim responsibility for any injury to people or property resulting from any ideas, methods, instructions or products referred to in the content. |
© 2023 by the authors. Licensee MDPI, Basel, Switzerland. This article is an open access article distributed under the terms and conditions of the Creative Commons Attribution (CC BY) license (http://creativecommons.org/licenses/by/4.0/).


