1. Introduction
Renewable energy is going to replace fossil energy in modern power systems. Since renewable energy sources are connected to the power grid through power converters, which will make the power system exhibit the characteristics of high penetration of power electronics. The high penetration of power electronic equipment makes the system coupling between the generation side, load side and transmission network in many forms, with variable oscillation modes, showing strong time-variability, stochasticity, and strong nonlinearity [
1,
2]. As a result, the probability of system oscillations caused by power electronic devices will increase significantly.
To control the broadband oscillation, it is necessary to localize the oscillation source. At present, the oscillation localization methods can be divided into three categories: analytical calculation method, numerical analysis method and data-driven method. The analytical calculation method mainly includes the complex torque coefficient method [
3], the state-space method [
4] and the impedance method [
5], which can accurately reflect the relationship between the oscillation characteristics and the influencing factors. The numerical analysis method mainly solves the power system mathematical model from the perspective of electromechanical transient or electromagnetic transient, in which the energy method is representative of this method[
6]. The above two methods have good interpretability based on the mechanism model, but they are applicable to a single scenario, and their accuracy and generalization ability need to be improved when dealing with the new power system broadband oscillation localization problems with strong randomness and nonlinearity.
Data-driven oscillation source localization methods [
7] are mostly oriented to the engineering programs. It uses actual electrical quantity data as input and builds neural models to realize the localization. There has been some research on deep learning-based oscillation source warning and localization, through the training of neural network models with effective extraction and fitting to the oscillation characteristics. It achieves a high localization accuracy, but its mathematical interpretability is poor.
Aiming at the problems above, the paper proposes an intelligent localization method and system for oscillation sources based on digital twin. A data-driven-mechanism fusion power system oscillation source localization method is proposed, and a power system oscillation source localization system is developed based on the digital twin workshop CloudPSS-XStudio.
2. Digital Twin Construction for Power Systems
2.1. Digital Twin Framework
The concept of digital twin was first proposed by Prof. Michael Grieves of the University of Michigan in 2002. The digital twin makes full use of the physical model, sensor update, operation history and other data, integrates multi-disciplinary, multi-physical quantities, multi-scale and multi-probability simulation processes, completes the mapping in the virtual space, and reflects the whole life cycle of the corresponding physical equipment. Digital twin technology includes the construction of digital space models and various techniques for simulation, analysis, prediction and control, based on the models [
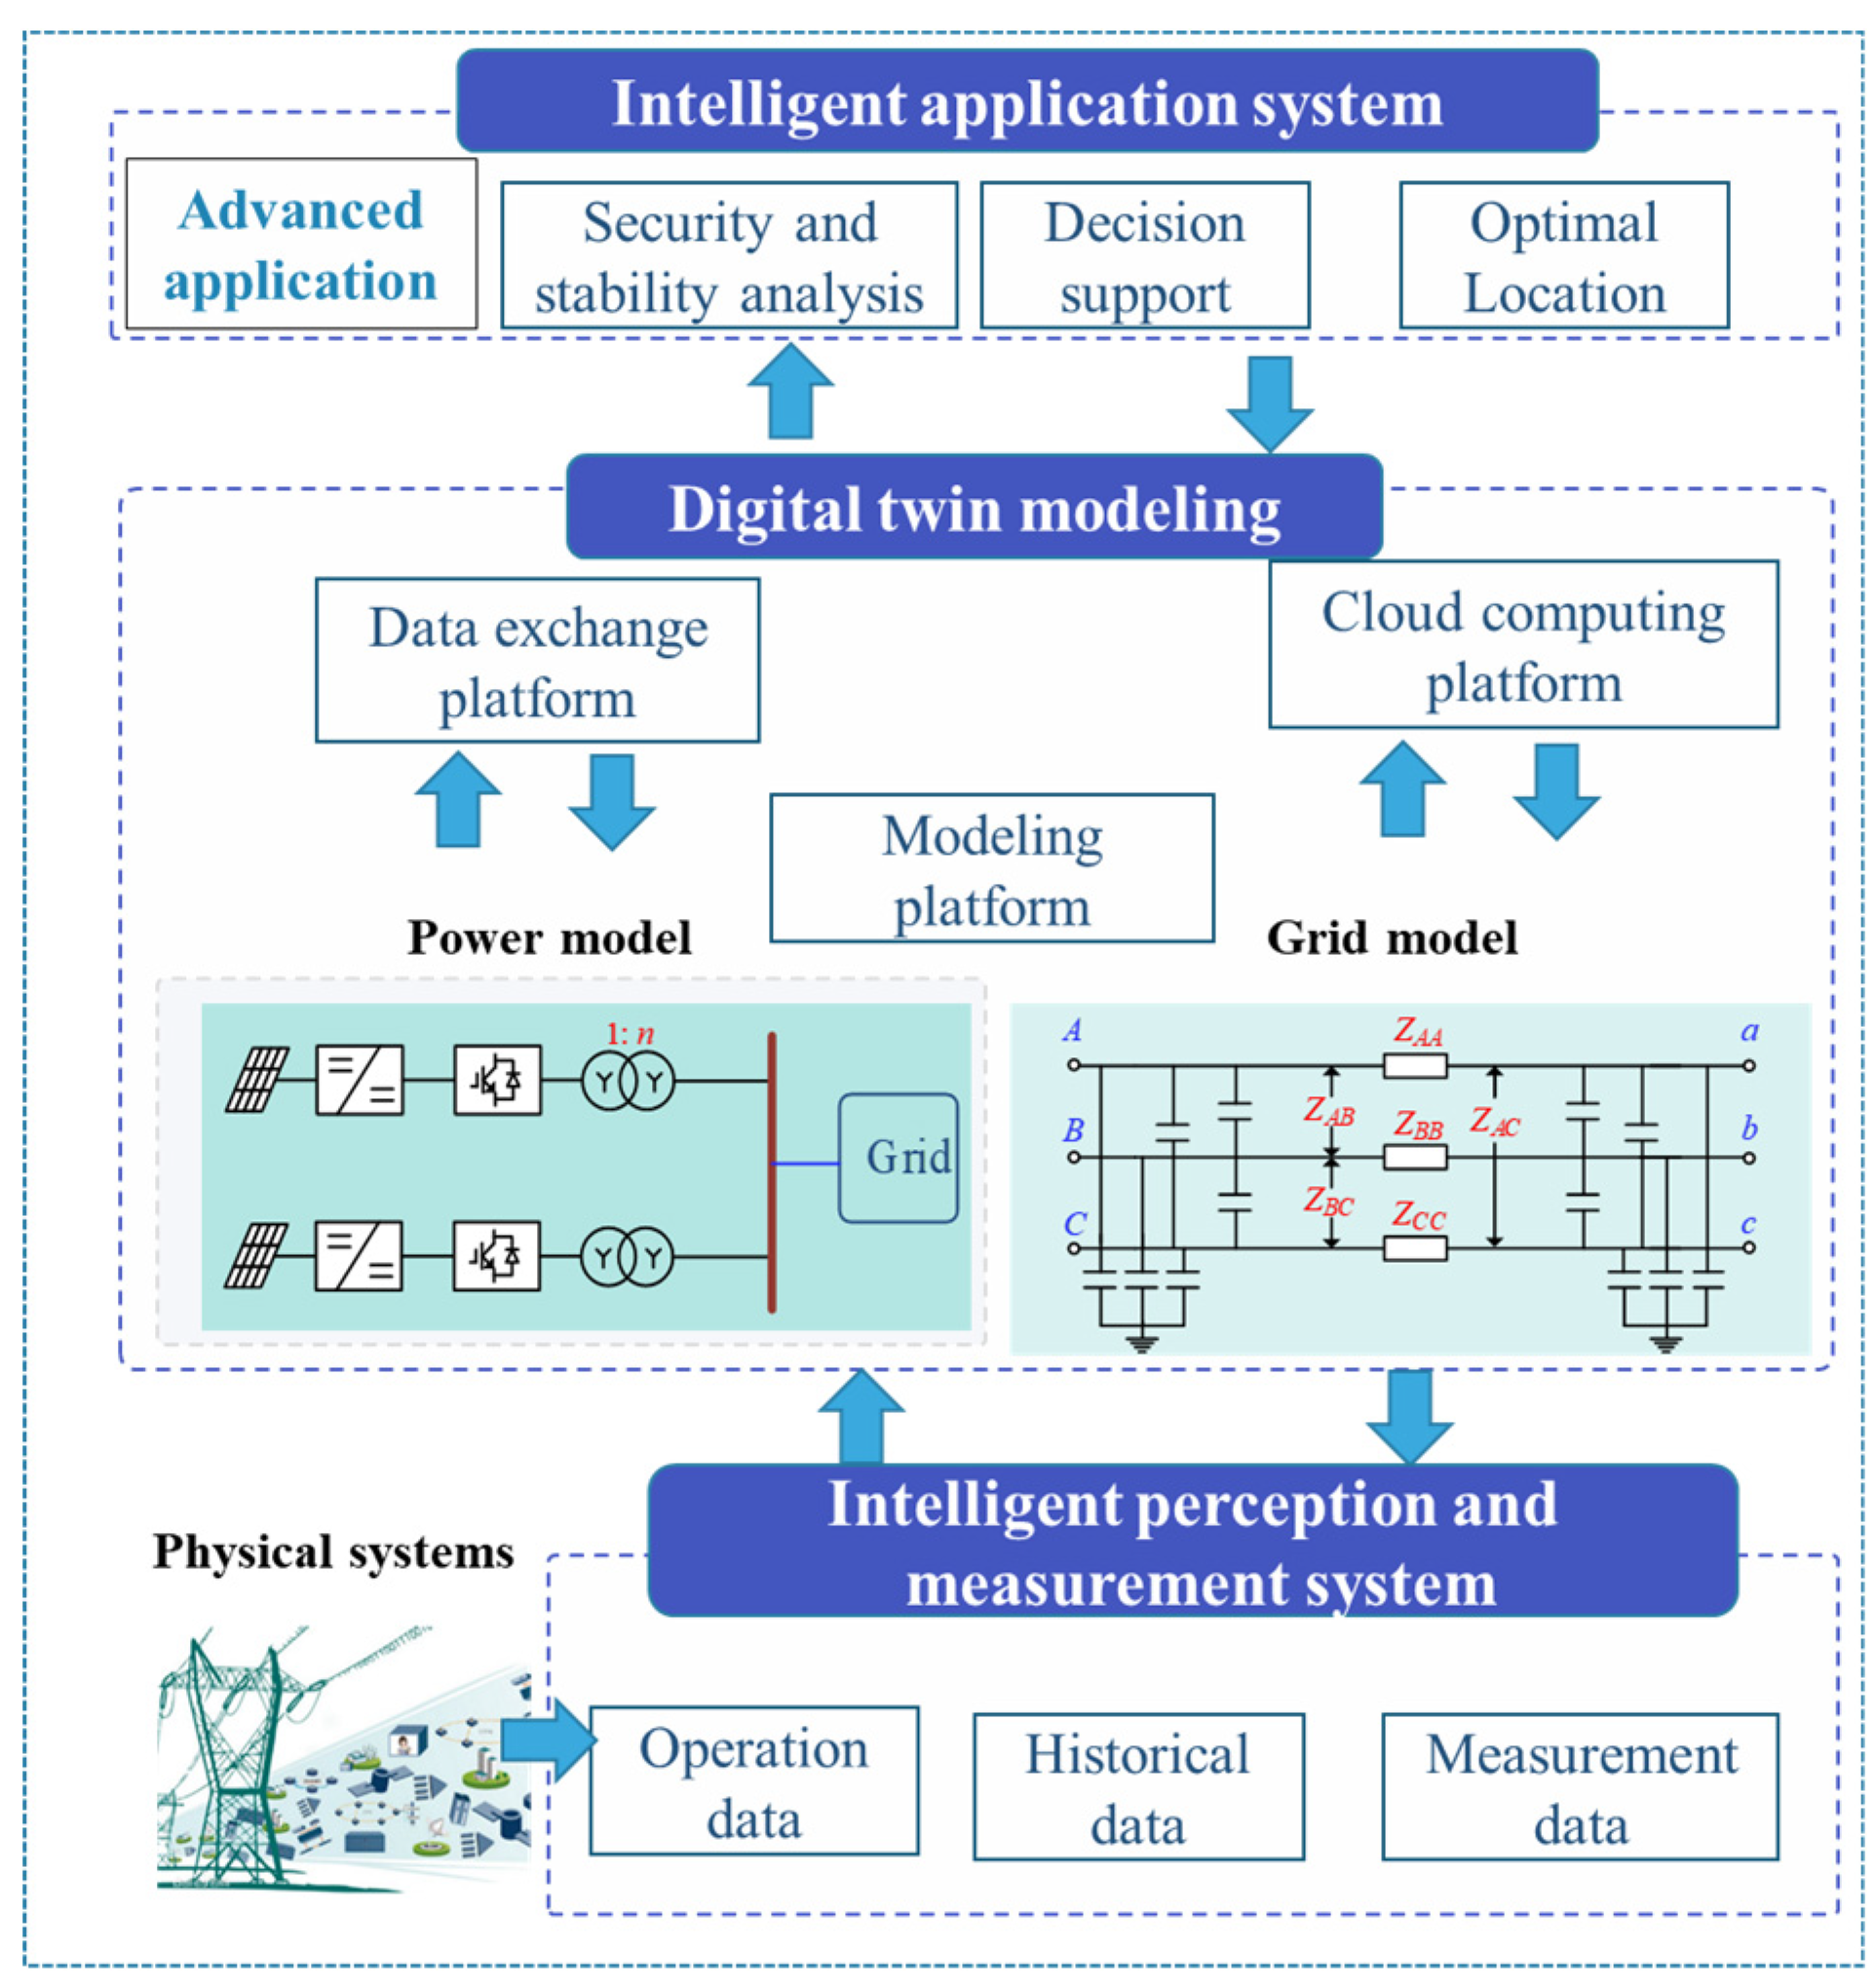
8]. To realize the access and management of data sources and business modules of the digital twin, the digital twin framework shown in
Figure 1 is designed [
9]. In the figure, the intelligent perception system establishes the data interaction between the actual physical system and the digital twin model; the intelligent application system builds various advanced digital applications based on the digital twin model.
2.2. Construction of Digital Twin Application
Based on the digital twin framework shown in
Figure 1, CloudPSS-XStudio, a digital twin workshop for power systems is established [
10], which contains three parts: model workshop CloudPSS SimStudio, function workshop CloudPSS FuncStudio, and application workshop CloudPSS AppStudio. In this paper, CloudPSS XStudio is used to construct a digital twin application for power system oscillation source localization, and the construction process mainly consists of the following three steps. First, the simulation model of the system to be studied is constructed in CloudPSS SimStudio. Second, the data-driven and mechanism fusion oscillation source localization algorithm and program are encapsulated in CloudPSS FuncStudio. Third, the UI and visualization interface are designed in CloudPSS AppStudio to show the results of oscillation source localization in FuncStudio. The construction of the simulation model can be referred to in [
11], and the oscillation source localization algorithm and application construction are described in detail in the following.
3. Oscillation Source Localization Algorithms
There is a need for real-time monitoring and fault location of broadband oscillations in power systems with new energy access. At the same time, there are some practical problems in engineering applications, such as the cost of computing hardware, the inconsistency of PMU sampling frequency, noise interference and data loss, which may occur in the process of signal acquisition and transmission. Therefore, an oscillation source location method is proposed, which includes three aspects: oscillation signal preprocessing, oscillation mode analysis and oscillation source location.
3.1. Acquired Signal Preprocessing
3.1.1. Generative Adversarial Imputation Network
The data-driven oscillation intelligent localization model requires good oscillation samples as the training set. However, the field environment of the actual power system is complex, and system failures or disturbances from the environment may occur in various processes such as data acquisition, measurement, transmission and conversion. It may result in uncertainties such as missing abnormalities of the measurement data and affecting the robustness and accuracy of the subsequent localization model [
12]. In addition, the sampling frequency of the measurement devices in the actual power system is low and there may be differences in sampling frequency between different devices. Besides, the quality of the actual measurement samples is poor, which is not conducive to the training of the localization model. Therefore, in this paper, the generative adversarial imputation network (GAIN) is used to achieve highly accurate repair of missing samples. At the same time, super-resolution measurement of broadband oscillation is realized based on super-resolution (SR) to ensure the synchronization of sampling frequency and data integrity of broadband oscillation measurement samples, which is convenient for the subsequent training of positioning models.
In order to solve the problem of missing data, classical mathematical methods such as mean completer and multiple imputation are often applied to reconstruct missing data. However, these methods ignore the time-series characteristics and correlation of power system measurement data. The restoration accuracy does not meet the requirements of engineering applications. In recent years, some studies have utilized emerging deep learning technology for data restoration, such as residual U-network [
13] and generative adversarial network (GAN) [
14]. However, such methods require a complete data sample for training, and it is difficult to obtain a complete sample in the actual power system, so the methods above are more limited in engineering applications. In contrast, the GAIN is an unsupervised learning model based on GAN, which does not require a complete dataset for training to repair the data [
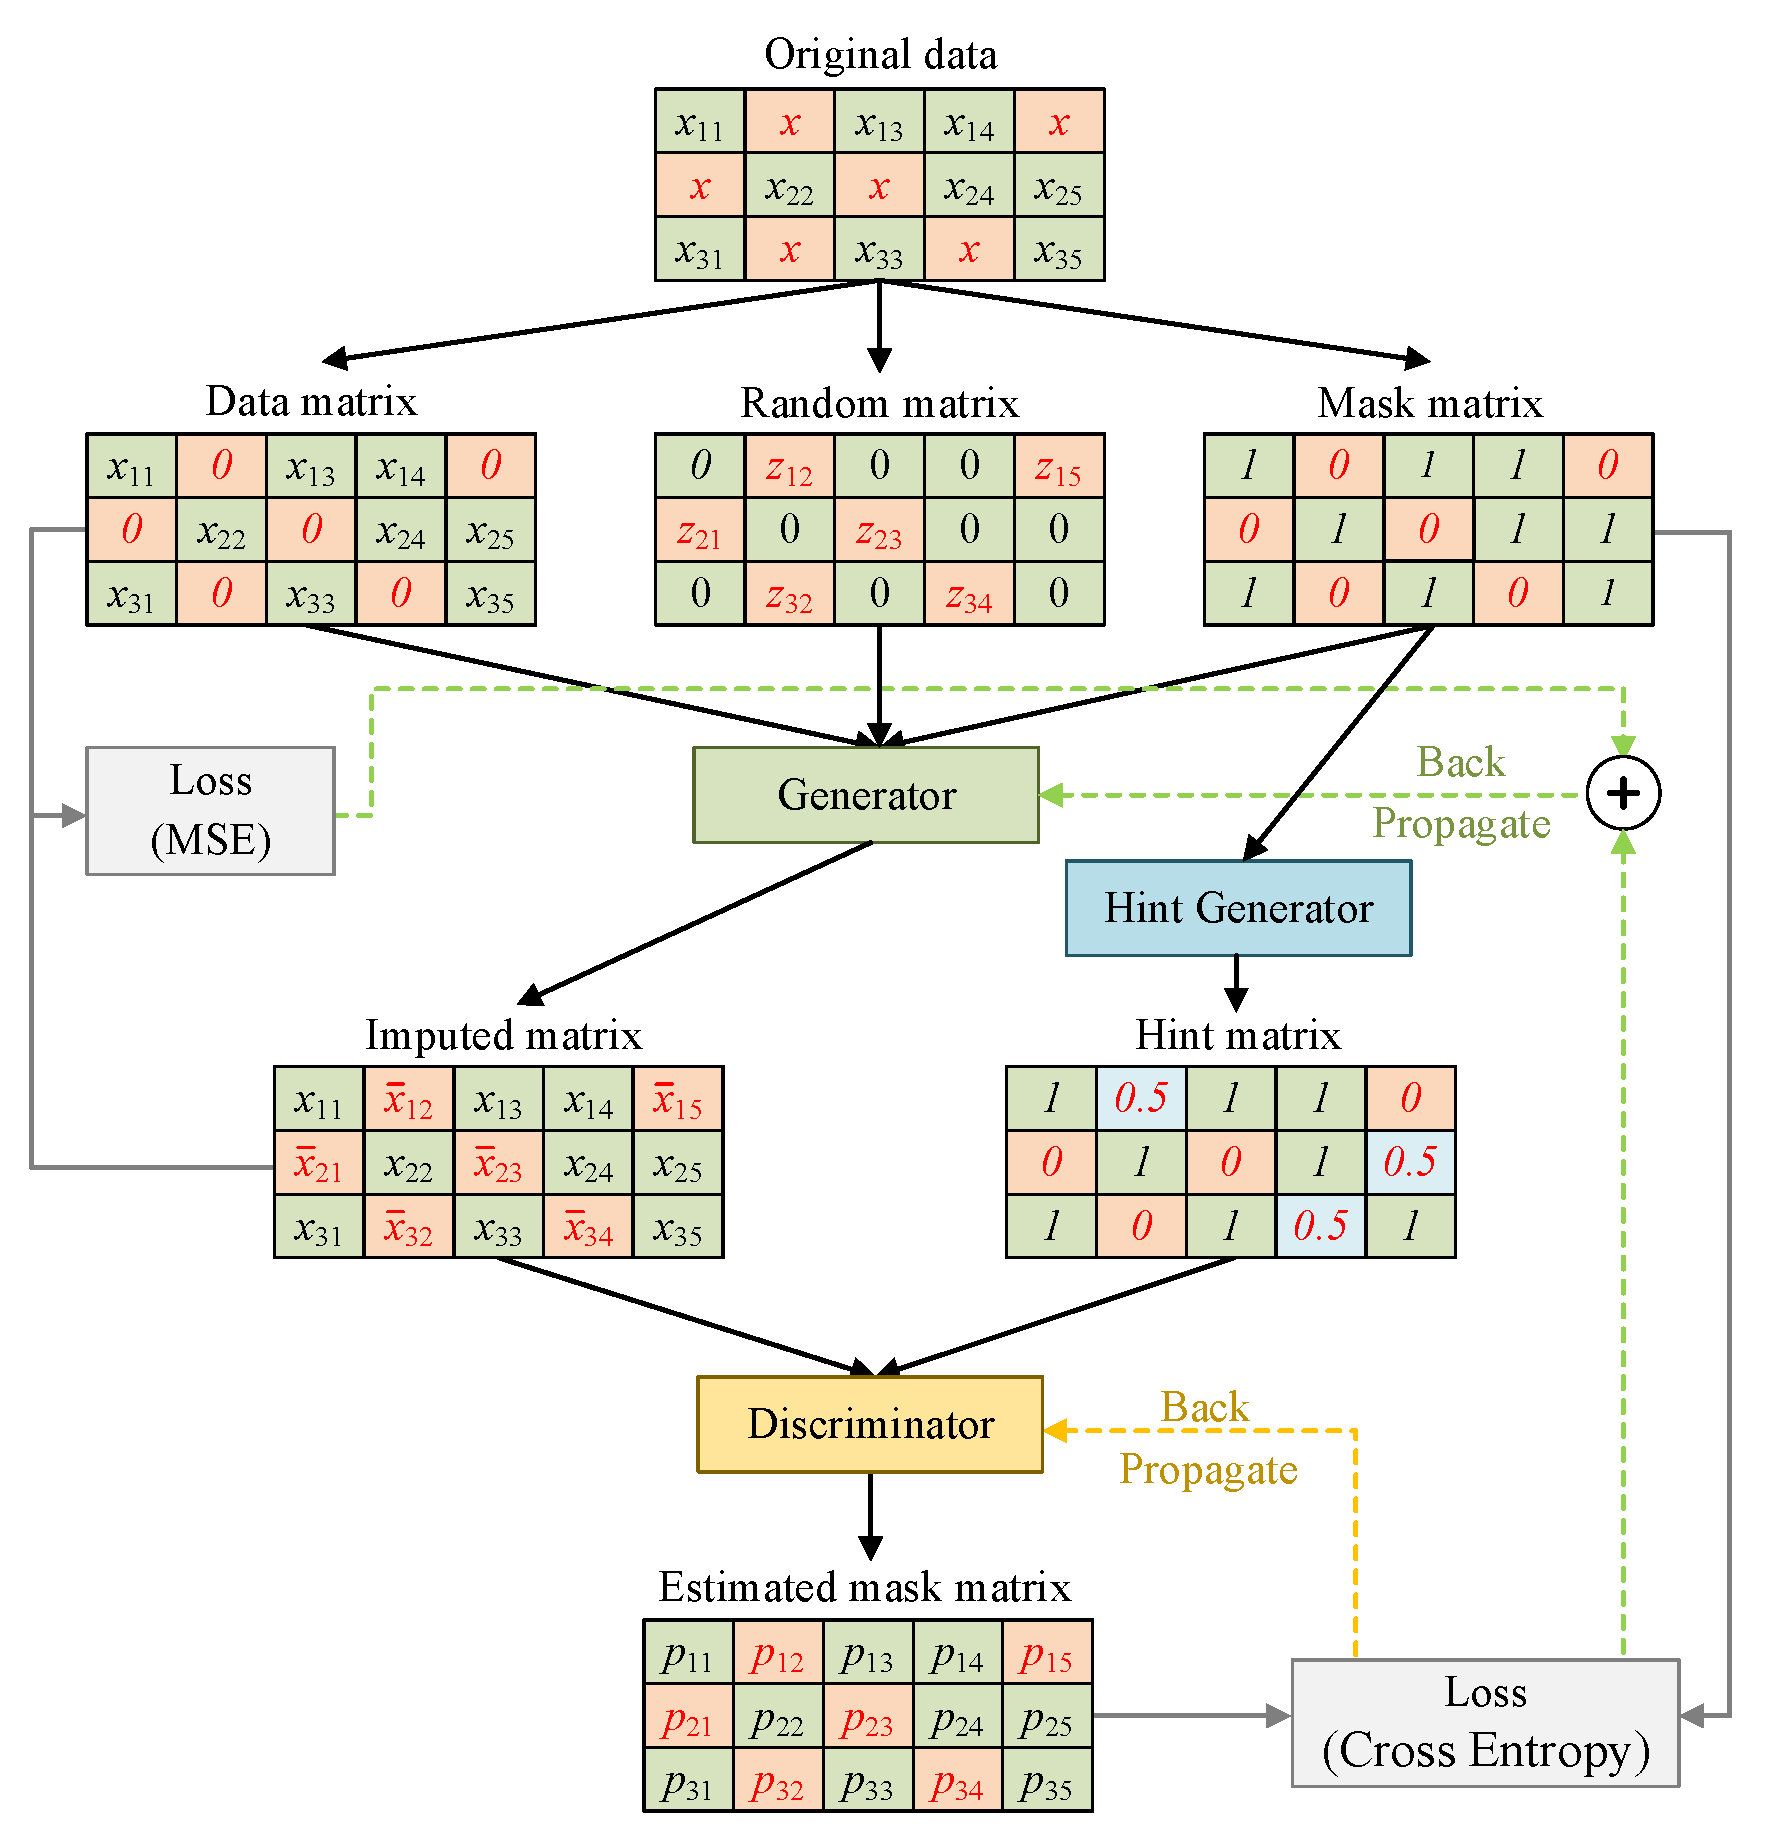
15]. A large number of examples have proved that GAIN still has high repair accuracy in the face of the complexity of data with random missing, continuous missing and noise interference, and its structure is shown in
Figure 2.
Reference [
16] describes the specific training process of the GAIN model. Through adversarial training, the generator can learn the distribution of real elements in the data matrix. The objective function is:
where
M is the mask matrix;
is the matrix after interpolation by
G; and
H is the hint matrix generated by the hint generator, which provides the discriminator with partial information about the missing data and helps to strengthen the antagonistic game process of
G and
D.
After the training of the GAIN model is completed, the timing data of the broadband oscillation samples to be repaired are input into the generator of GAIN. The output is the completed broadband oscillation samples.
3.1.2. Super Resolution Measurement
To cope with the problem of differences between measurement devices with low sampling frequencies, Super-Resolution[
17] is used for the measurement processing of broadband oscillation samples. It recovers multi-source low-frequency data with different sampling frequencies to high-frequency data with a unified sampling frequency to support more accurate and reliable data analysis, model training, and other possible application aspects.
When dealing with timing data of broadband oscillation samples, the method can be summarized as follows:
For a given time period
T, the dimension of the low-frequency data
l is
d, while the dimension of corresponding high-frequency data
h at the reference frequency is 𝛼
d. The super-resolution measure mapping is a function:
. It can be realized by a deep neural network. The neural network is trained using the mean square error with the loss function:
The network is then optimized by minimizing the loss function:
where:
θ is the parameter set of the deep neural network
F. Due to the ill-posedness of the super-resolution measurement problem, regularization is needed to constrain the solution. According to the maximum a posteriori estimation, given a low-frequency sequence
l, the corresponding high-frequency sequence
h can be estimated by the following optimization problem:
Where,
is the distortion measurement term under the Gaussian noise assumption, while
represents the regularization term containing prior information. This equation shows that
h’ is a function of the input
h and the downsampled matrix
A. The maximum a posteriori estimated solution for super-resolution measurements is equivalent to:
When A is fixed, it is equivalent to the super-resolution measurement map constructed above. This equation shows that the prior information is actually contained in the network parameter set θ. The deep neural network uses implied prior knowledge to estimate high-frequency sequences. On the other hand, the proposed deep neural network not only avoids directly modeling the prior distribution of h, but also transforms the optimization problem into an inference problem, which improves the computational efficiency.
In (5), the function
F is implemented using a deep convolutional neural network (CNN). Since the goal of the CNN here is to generate high-frequency signals rather than classification, it is necessary to design a neural network that can capture the timing relationships of the data and satisfy the properties of the super-resolution metrology problem. Therefore, in this paper, based on the super-resolution convolutional neural network (SRCNN) proposed in the research of image super-resolution[
18], its network structure and parameters are improved to meet the requirements above. Besides, the computational inefficiency of the traditional CNN outputting one-dimensional sequential data is solved by adopting a fully convolutional design and parallel processing method. Finally, by inputting the low-frequency measurement data into the trained SRCNN and specifying the required reference sampling frequency, the low-frequency measurement samples can be mapped to the specified reference frequency. It facilitates the subsequent tasks such as broadband oscillation spectrum analysis and localization model training.
3.2. Modal Analysis of Oscillation
Accurate identification of oscillation modes can obtain the frequency, amplitude and other information of the oscillation. It provides effective information support for the subsequent localization of the oscillation source. In this paper, fast Fourier transform (FFT) is used to process the measured values of PMU to obtain its spectral characteristics. Therefore, we can judge the main oscillation components and identify the oscillation modes through it.
Meanwhile, the FFT analysis can be used to determine whether the system is experiencing oscillations. Therefore, the modal analysis in this session can be used as a subsequent startup criterion for the localization of the oscillation source, avoiding the waste of computational resources and transmission bandwidth caused by real-time invocation of the localization network.
3.3. Oscillation Source Localization
3.3.1. Mechanism and Data-Driven Fusion Methods for Oscillation Source Localization
Considering that traditional oscillation localization methods mostly rely on accurate mechanism model, they can only be used in limited situations. Their accuracy and generalization ability need to be improved when dealing with new power system oscillation localization problems with strong stochasticity and strong nonlinearity. Data-driven artificial intelligence methods are mostly engineering-oriented, taking actual electrical data as input and building neural models to realize localization. They are more efficient but less mathematically interpretable. Therefore, this paper intends to use the LSTM, CNN and other neural network models in the data-driven algorithm, combined with the branch potential energy function, to propose a mechanism and data-driven fusion oscillation source localization method.
The branch potential method for oscillation localization in power systems is a classical technique for power system oscillation localization. The core idea is that select a few key branches in a power system and measure their parameters such as current, voltage and phase. Then calculate their power and potential energy. During the operation of the system, the potential energy of these branch components will change periodically as the oscillation occurs [
19]. Therefore, it is possible to determine whether the oscillation occurs by the potential energy change of these branch components.
The branching potential energy method is briefly described below. To simplify the analysis, the classical second-order generator model is used to construct the branch-circuit potential energy function of the system. The rotor equation of motion of the generator is:
Where:
M represents the inertia time constant of the generator,
δ represents the rotor angle of the generator with respect to the infinity system, ω
N represents the rated angular frequency, ω represents the generator electrical angular velocity deviation,
PM represents the generator mechanical power,
PE represents the generator electromagnetic power,
D represents the generator mechanical damping coefficient.
Further, based on the classical second-order model of the generator, deduce the transient energy function of the system. Specifically, taking the angular frequency of a node as the reference angular frequency, the relative angular frequency of each node can be defined as:
Based on the system power balance, substituting Eq. (7) into the generator rotor equation of motion, the transient energy function of the system can be obtained as:
Where:
VK represents the kinetic energy of the system,
Vpb represents the sum of the potential energy of the branch,
VL represents the load energy,
VD represents the damping energy;
ωij represents the difference in angular frequency between nodes
i and
j connected to the branch
k;
ΔωG represents the relative rotational speed of the generator;
ΔωN represents the relative angular frequency of node connected to the loads;
n is the number of nodes of the system, and
i is the number of generators in the system.
The branching potential in a network can be defined as:
where:
PK is the active power of the branch when the oscillation occurs, and
PSK is the active power of the line when the branch is in the steady state.
Oscillation source localization can be achieved based on the trend of the branch potential energy time series trajectory. The potential energy of the branch near the center of oscillation will change substantially [
20].
In recent years, data-driven oscillation source localization methods have been mostly engineering-oriented, using actual electrical quantity data as input to build a model to realize localization. It can achieve the localization of low frequency oscillation fault without a mechanism model. Machine learning-based oscillation source localization methods can effectively extract and fit the oscillation features by training the network and achieving high localization accuracy [
21].
Deep neural networks contain multiple hidden layers. Based on the backpropagation algorithm, the network models can extract effective information from the training samples. In this paper, CNN and LSTM-based branch potential signal localization model are built respectively. The hidden layers of them realize feature extraction and data dimensionality reduction, and the activation function of the output layer is chosen to be softmax function. The model can realize the localization of the oscillation source unit by inputting the branch potential signal.
In order to combine the advantages of mechanism-based and data-driven oscillation source localization methods, this paper combines the branch potential energy method with the data-driven model to build a model. The branch potential energy is used as the model input to realize the precise location of the oscillation source.
Compared with directly taking the electrical quantity time series as input, the branch potential energy can better represent the oscillation of the electrical quantity on the line. Also, the branch potential energy function is relatively simple to construct, and the required information is easier to obtain in actual engineering, which is more economical. The branch potential energy reflects the energy flow direction and energy size on the line. When the oscillation occurs, the direction of the oscillation source can be inferred from it, providing effective information for localization, and better training results can be obtained with data-driven models.
3.3.2. Cross-Validation of Double Solvers
In the oscillation source localization process above, the results obtained by using different computational models may also be different. It will have an negative impact on the judgment. For this reason, this paper proposes a cross-validation method. Its specific process is shown in
Figure 3. First, the KL divergence of the distribution results of different oscillation sources and all distribution samples are calculated separately, and the smallest value is retained; then the smallest KL divergence is normalized and transformed into the relability; finally, the weighted average is used to obtain the final probability of the distribution of the oscillation sources.
For a system with a number
n of PMUs, each prediction distribution result is calculated to obtain a total of n KL divergences. In this paper, the minimum value is selected to enter the next step of normalization. Since
, the minimum divergence is normalized to construct the reliability α, the expression is shown in formula (10).
Where: the KL divergence of the probability distributions P and Q is calculated as follows:
where:
,
are the distribution functions of the two probability distributions.
From equation (10), it can be seen that α∈(0,1), and the smaller the KL divergence, the larger α is, that is, the possibility of the corresponding result being correct is also larger, and vice versa. It can be seen that the α obtained after normalization can correctly reflect the reliability of the results and can be used as valid data for the subsequent process.
Further, the different results obtained by each algorithm are weighted averaged,using the α above, to obtain the final oscillation source localization probability distribution. It is shown in equation (12):
Where: n is the number of solvers, and α
i, p
i(x) are the reliablity and probability distribution of the ith result, respectively.
Double-solver cross-validation unifies the prediction results of different solvers, improving the accuracy and reliability of the prediction results.
4. Development of Oscillation Source Location System Based on Digital Twin Platform CloudPSS-XStuido
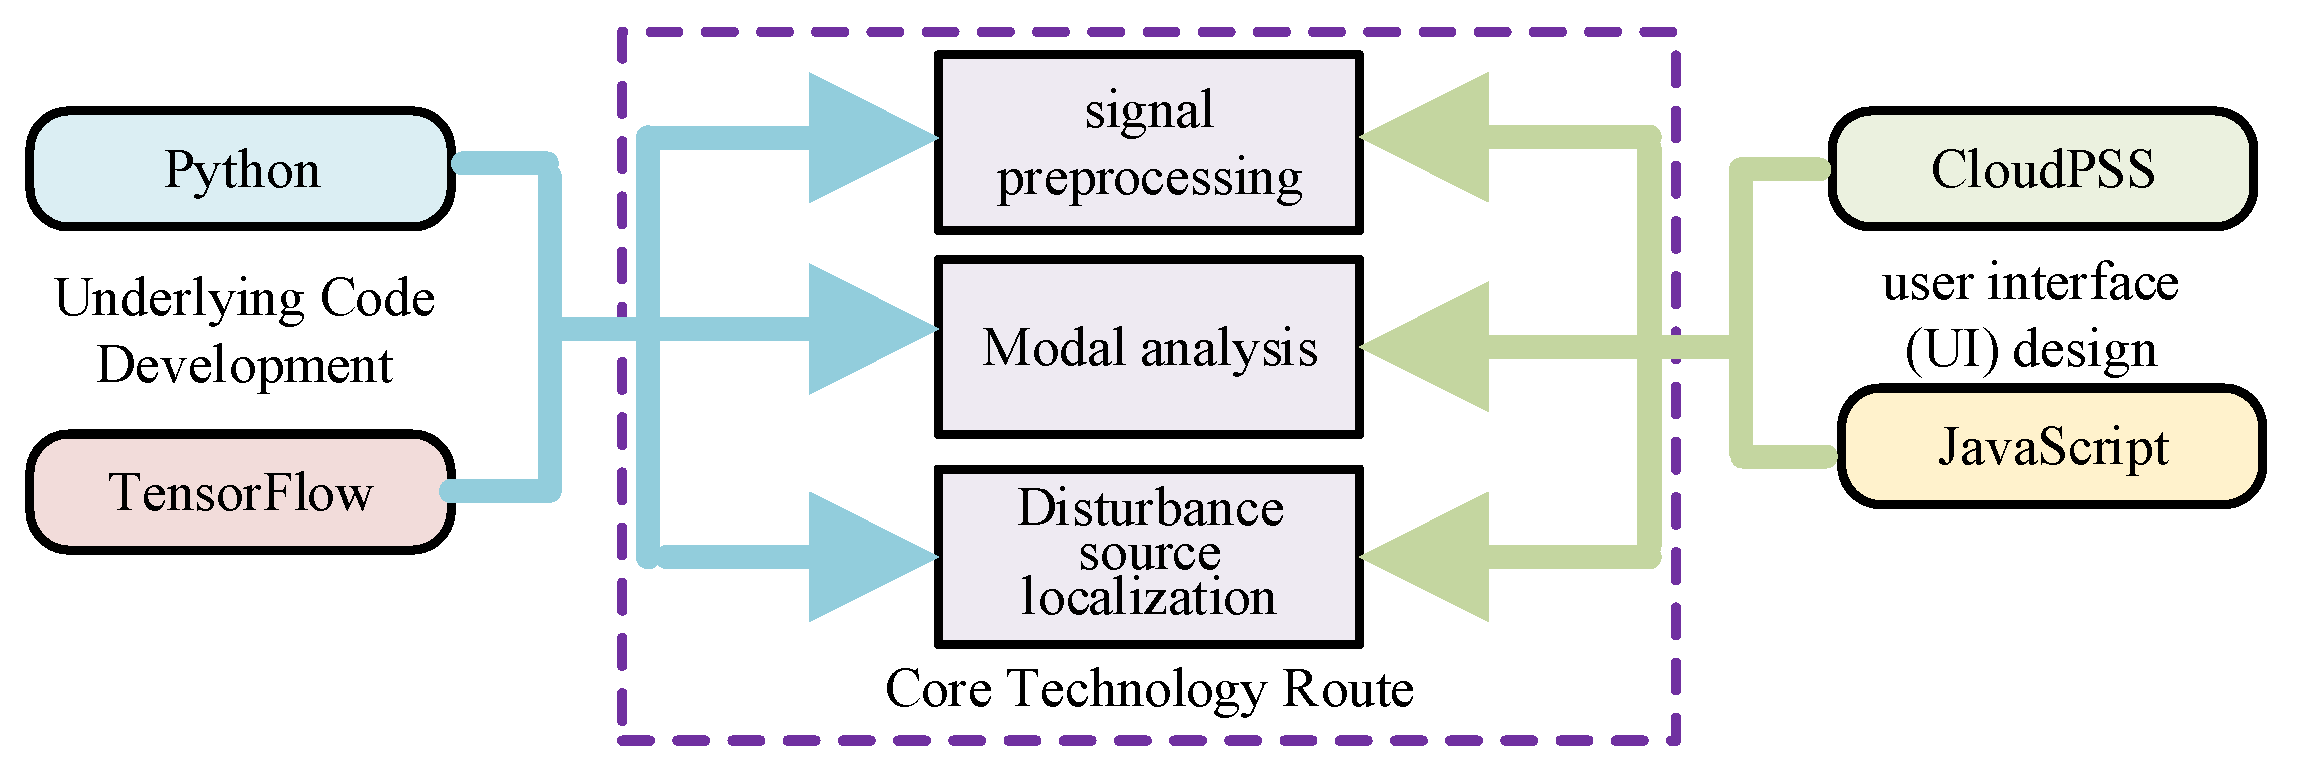
In order to meet the needs of real-time monitoring and fault location in broadband oscillation problem of power system with renewable energy access, the core algorithms of the above steps have been developed based on Python. Besides, the oscillation source localization system has been built based on the CloudPSS XStudio platform and JavaScript. The overall structure of the system is shown in
Figure 4.
The core algorithm of this paper involves deep learning techniques such as GAIN, CNN and LSTM, and involves a large number of computational tasks during local offline training. Hence TensorFlow, an open-source deep learning framework developed by Google is used. It realizes the underlying computation and parallel computation based on C++ and CUDA. It can also efficiently perform large-scale matrix computation and vector operations, which is easy to build and train various neural networks quickly.
Further, the user interface of the oscillation analysis and oscillation source localization system is designed and built based on JavaScript and CloudPSS XStudio platform.
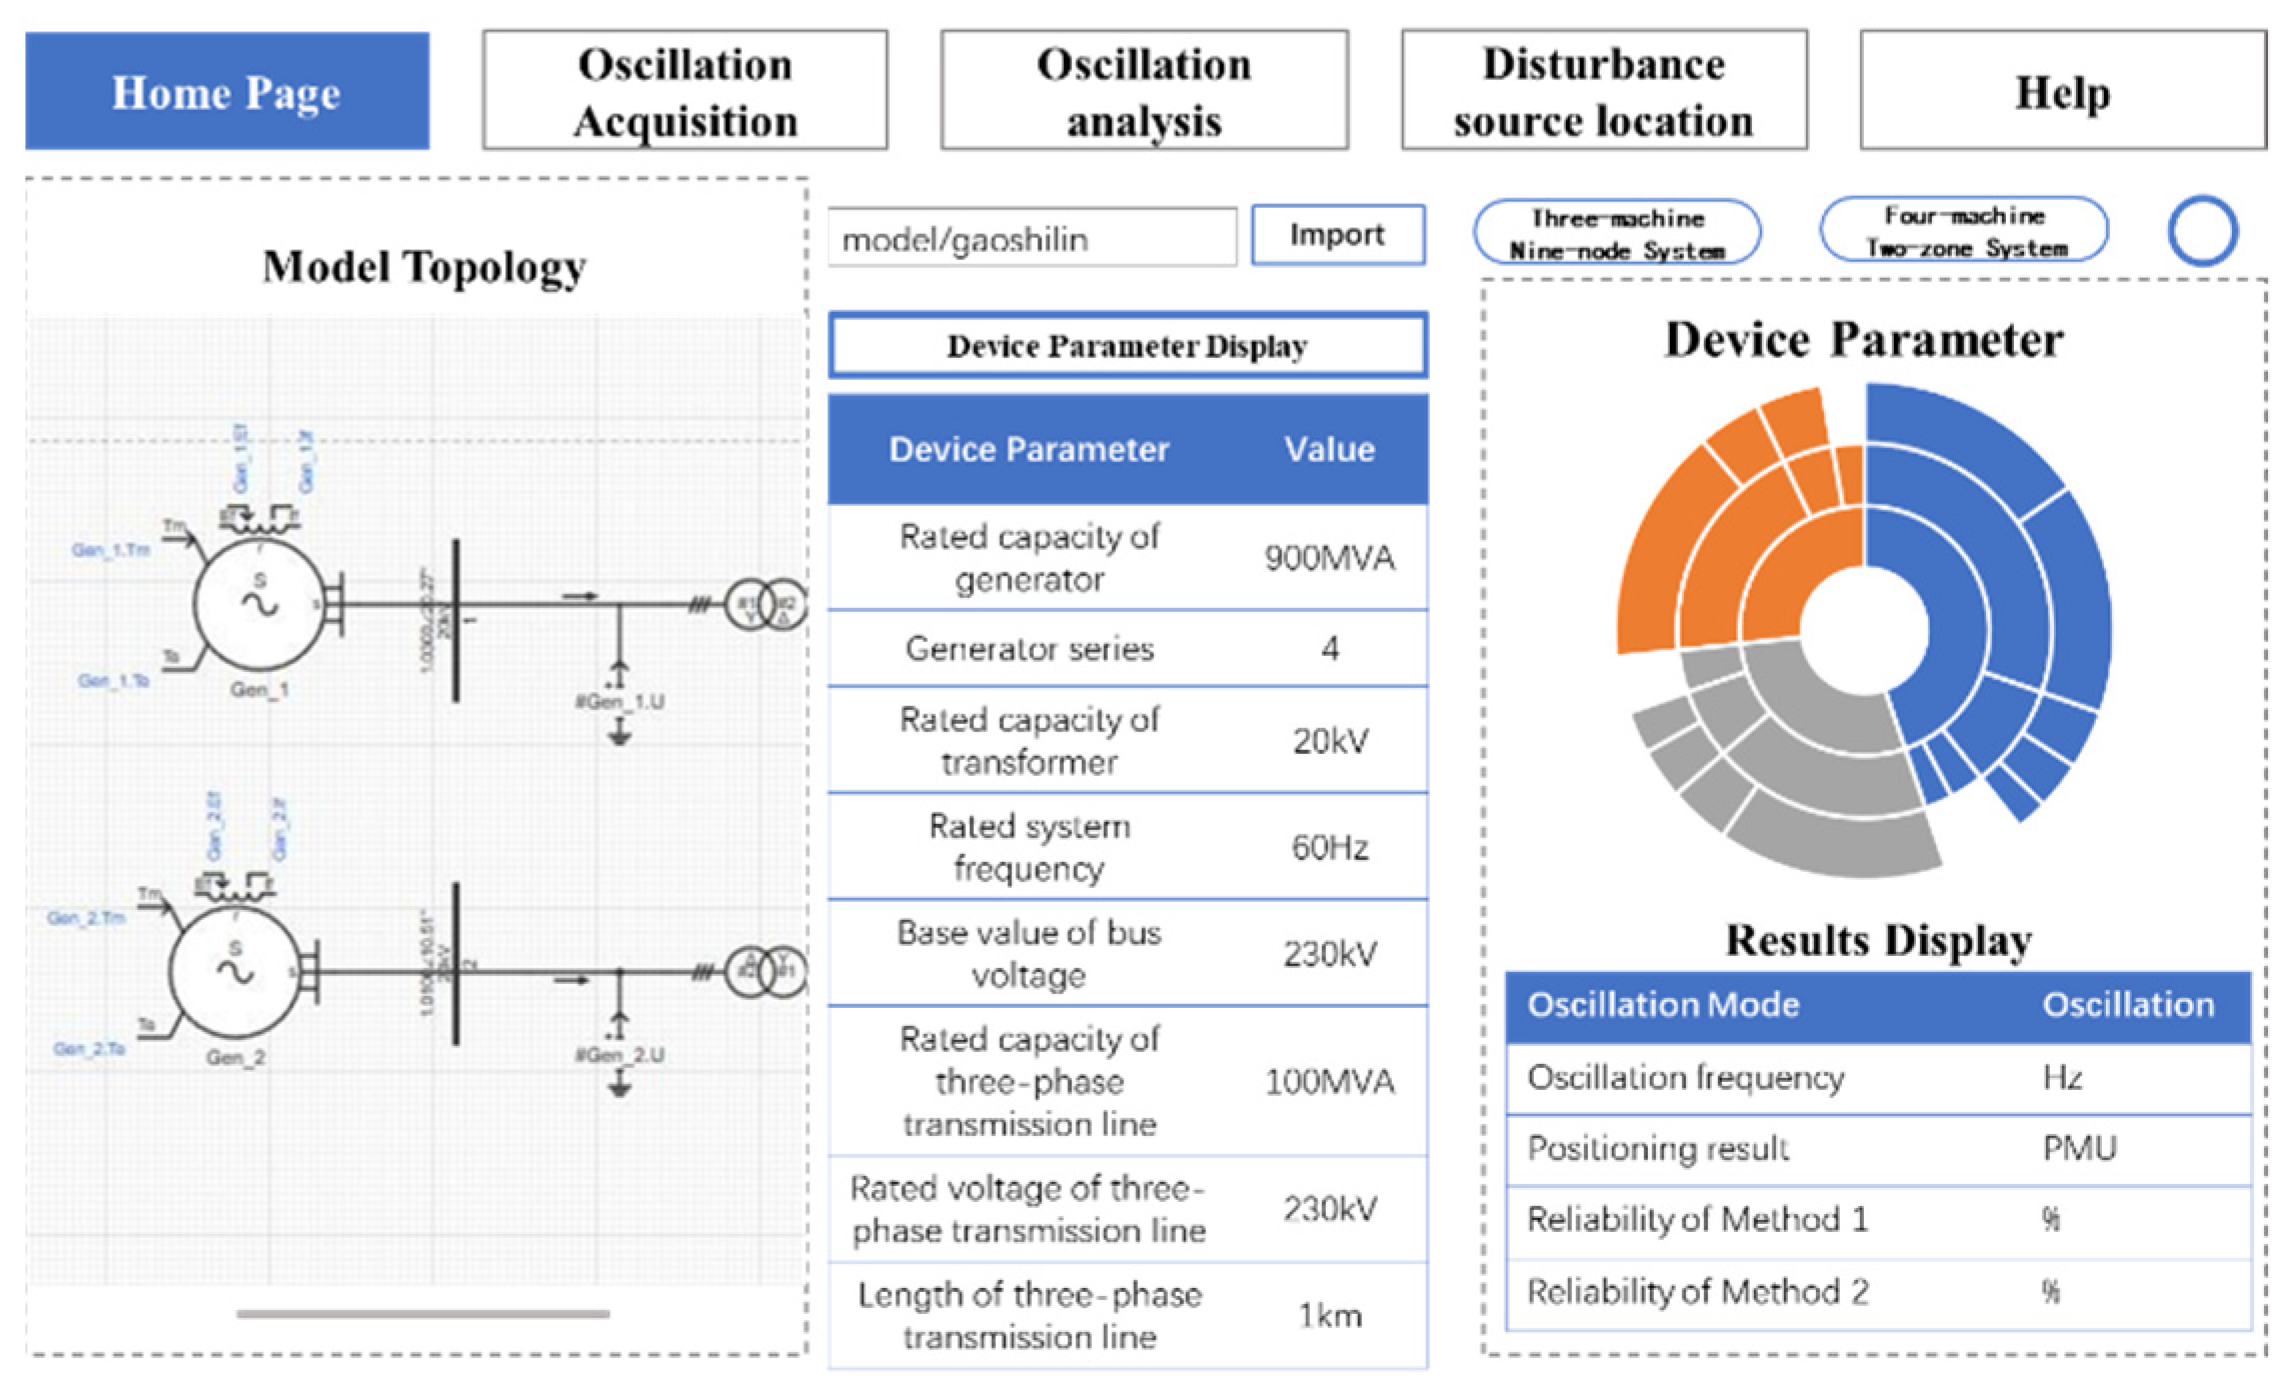
As shown in
Figure 5, users can upload examples on the home page of the software and observe and analyze the topological structure and electrical parameters. The topology diagram of the example and the sunburst chart of the electrical parameters are presented in an interactive form, which is convenient for users to grasp the specific information of the example. In addition, the results of oscillation analysis and oscillation source location are reserved in the lower right corner, which is convenient for users to visually observe and analyze the relationship between calculation examples and oscillation.
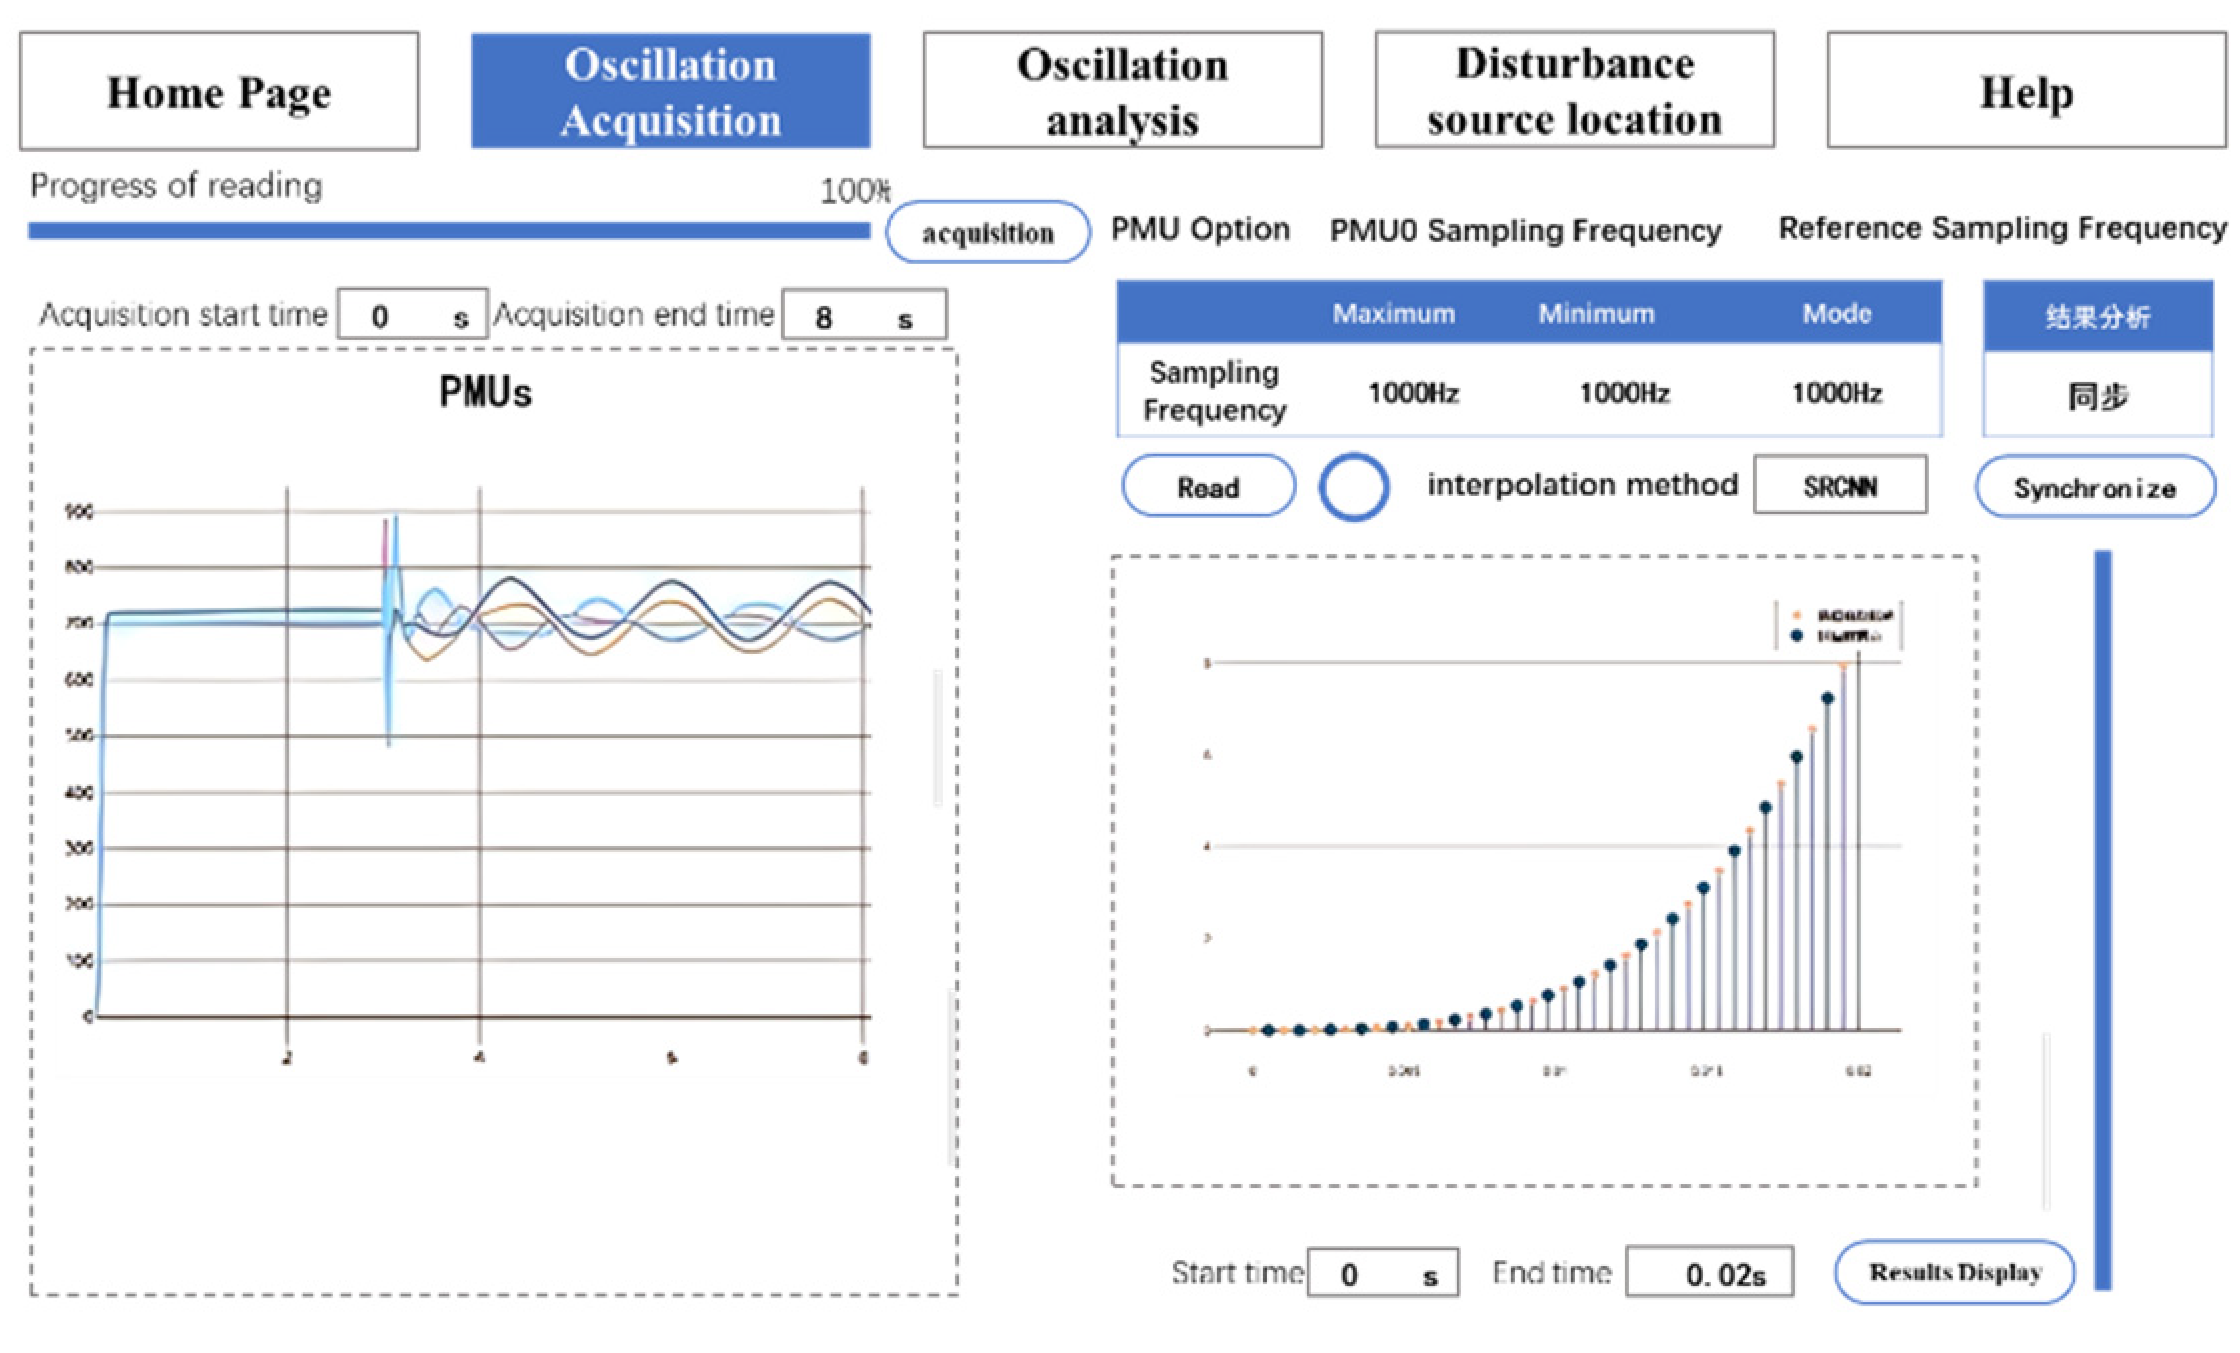
After importing the example, it enters the signal acquisition page, and user can set the start time of signal acquisition. After it starts, the real-time measurement signal curve and the current operation status will appear on the left side of the interface. On the right side of the interface, users can read the pluralities, maximum and minimum values of the sampling frequencies of all PMUs in the current system, as well as the sampling frequency of a specified PMU. Next, you can set the reference frequency and interpolation method according to your needs. Then click the Synchronize button to map the current PMU sampling frequency to the reference sampling frequency for subsequent use.
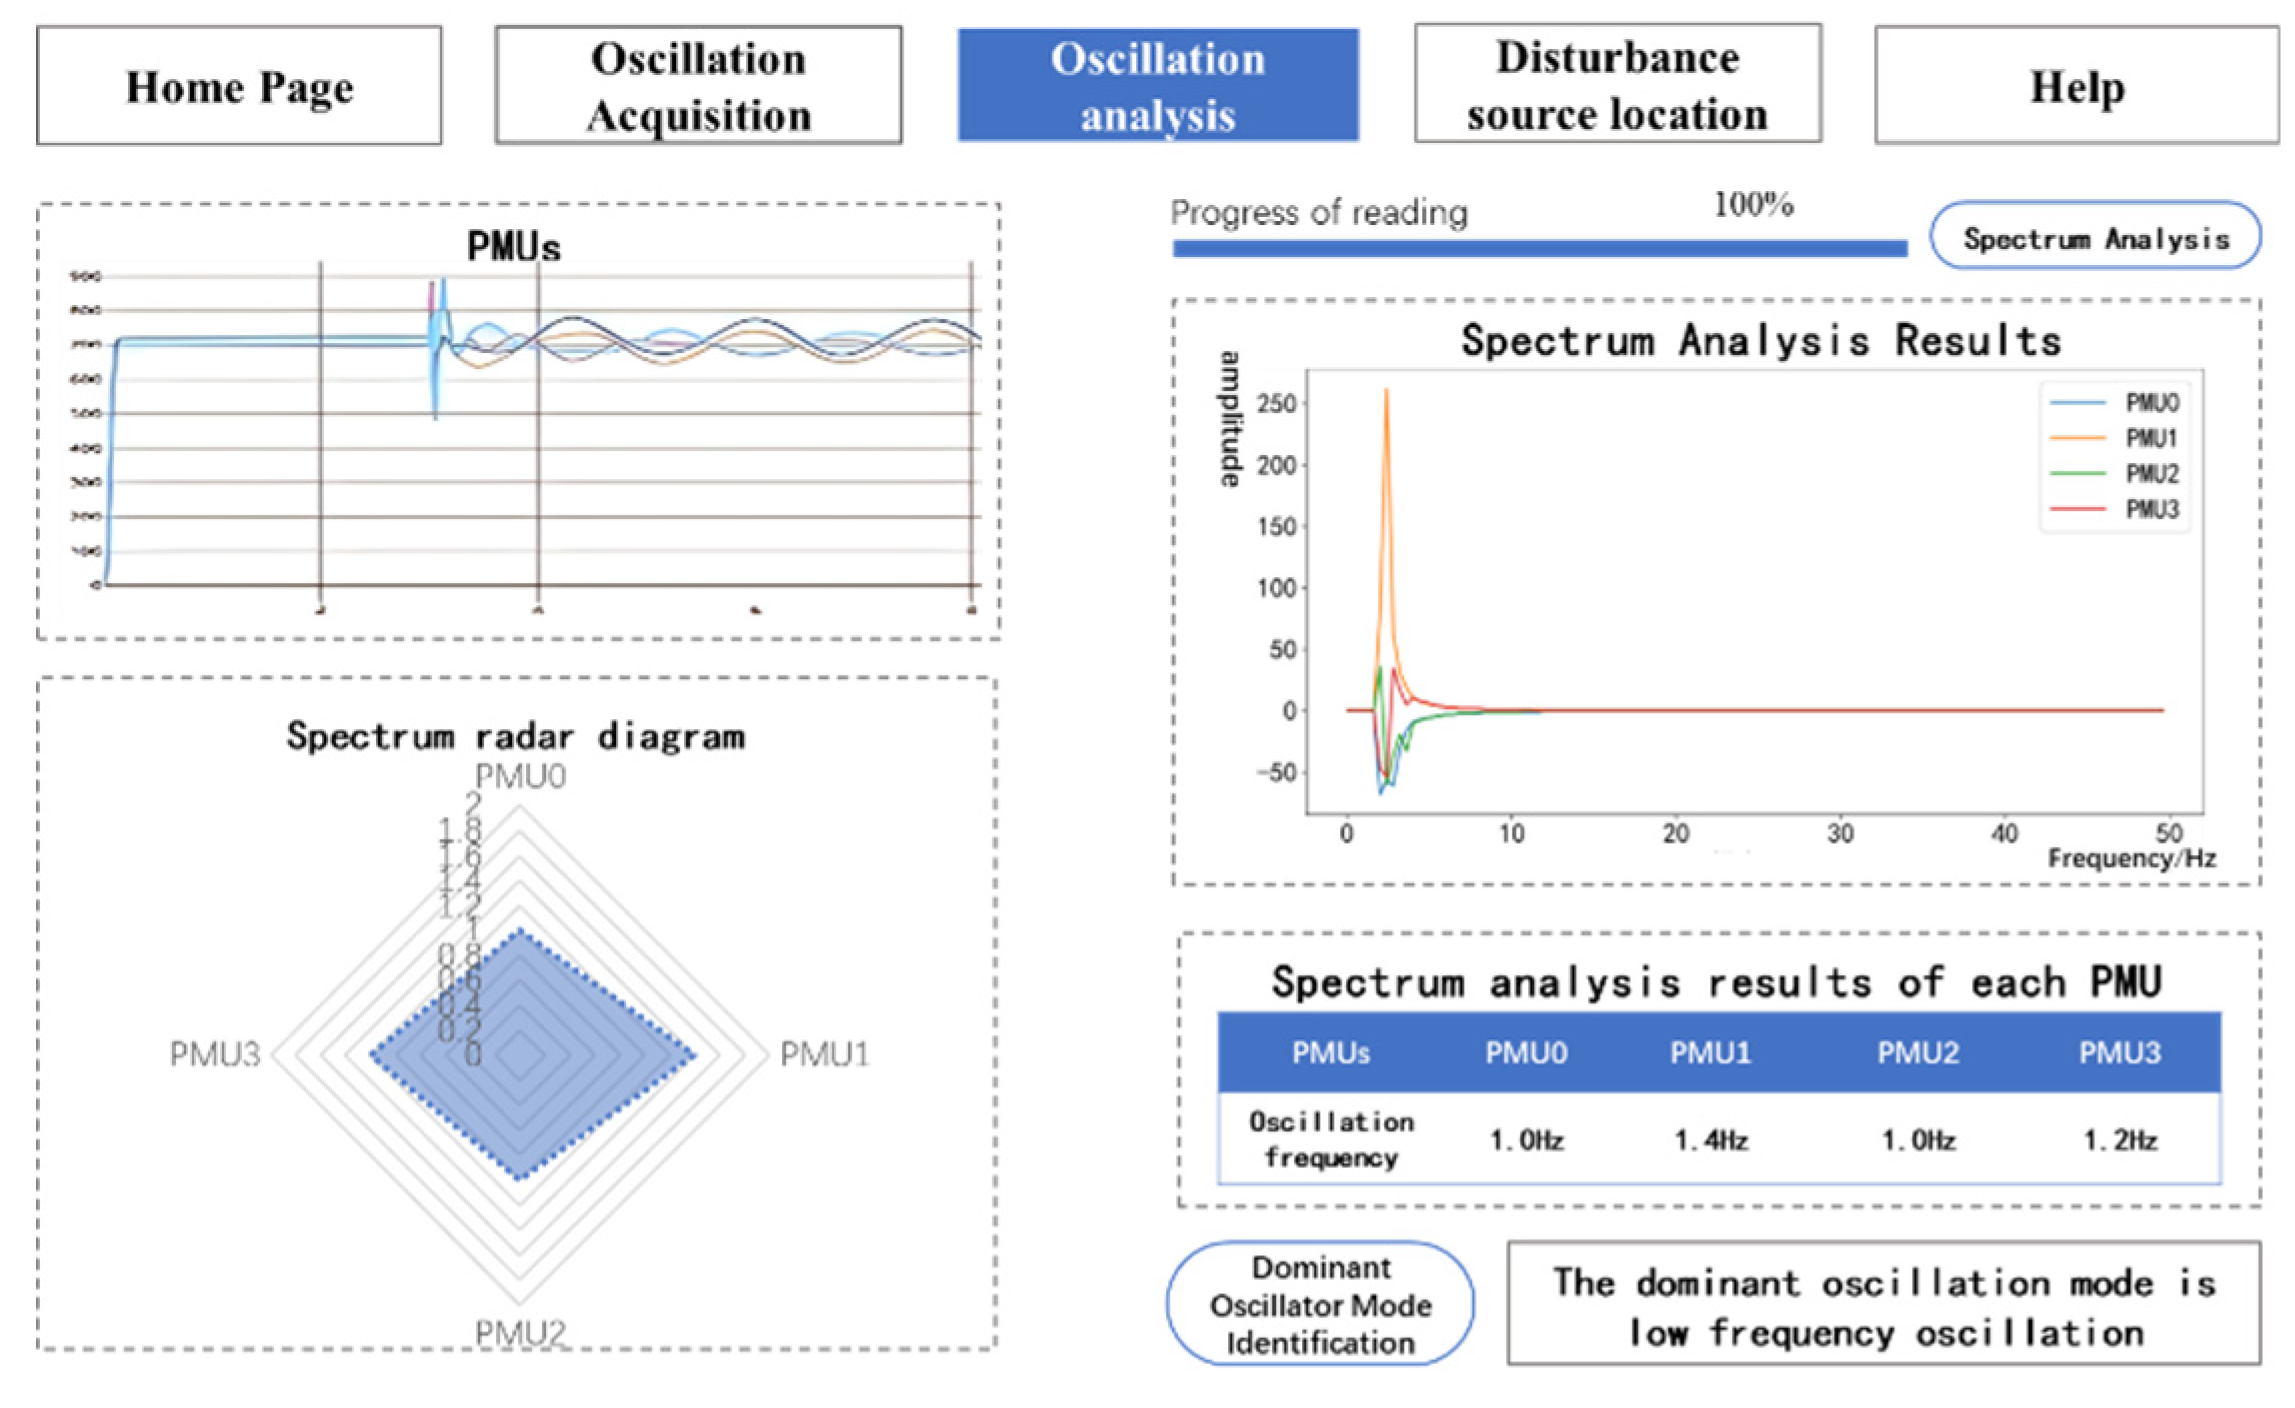
Figure 7.
Oscillation mode analysis page.
Figure 7.
Oscillation mode analysis page.
After the PMU sampling frequency is unified, spectrum analysis can be performed on the collected oscillation signals. This page will display the results in the form of tables, spectrum diagrams and radar diagrams, and identify the dominant oscillation mode in the current calculation example.
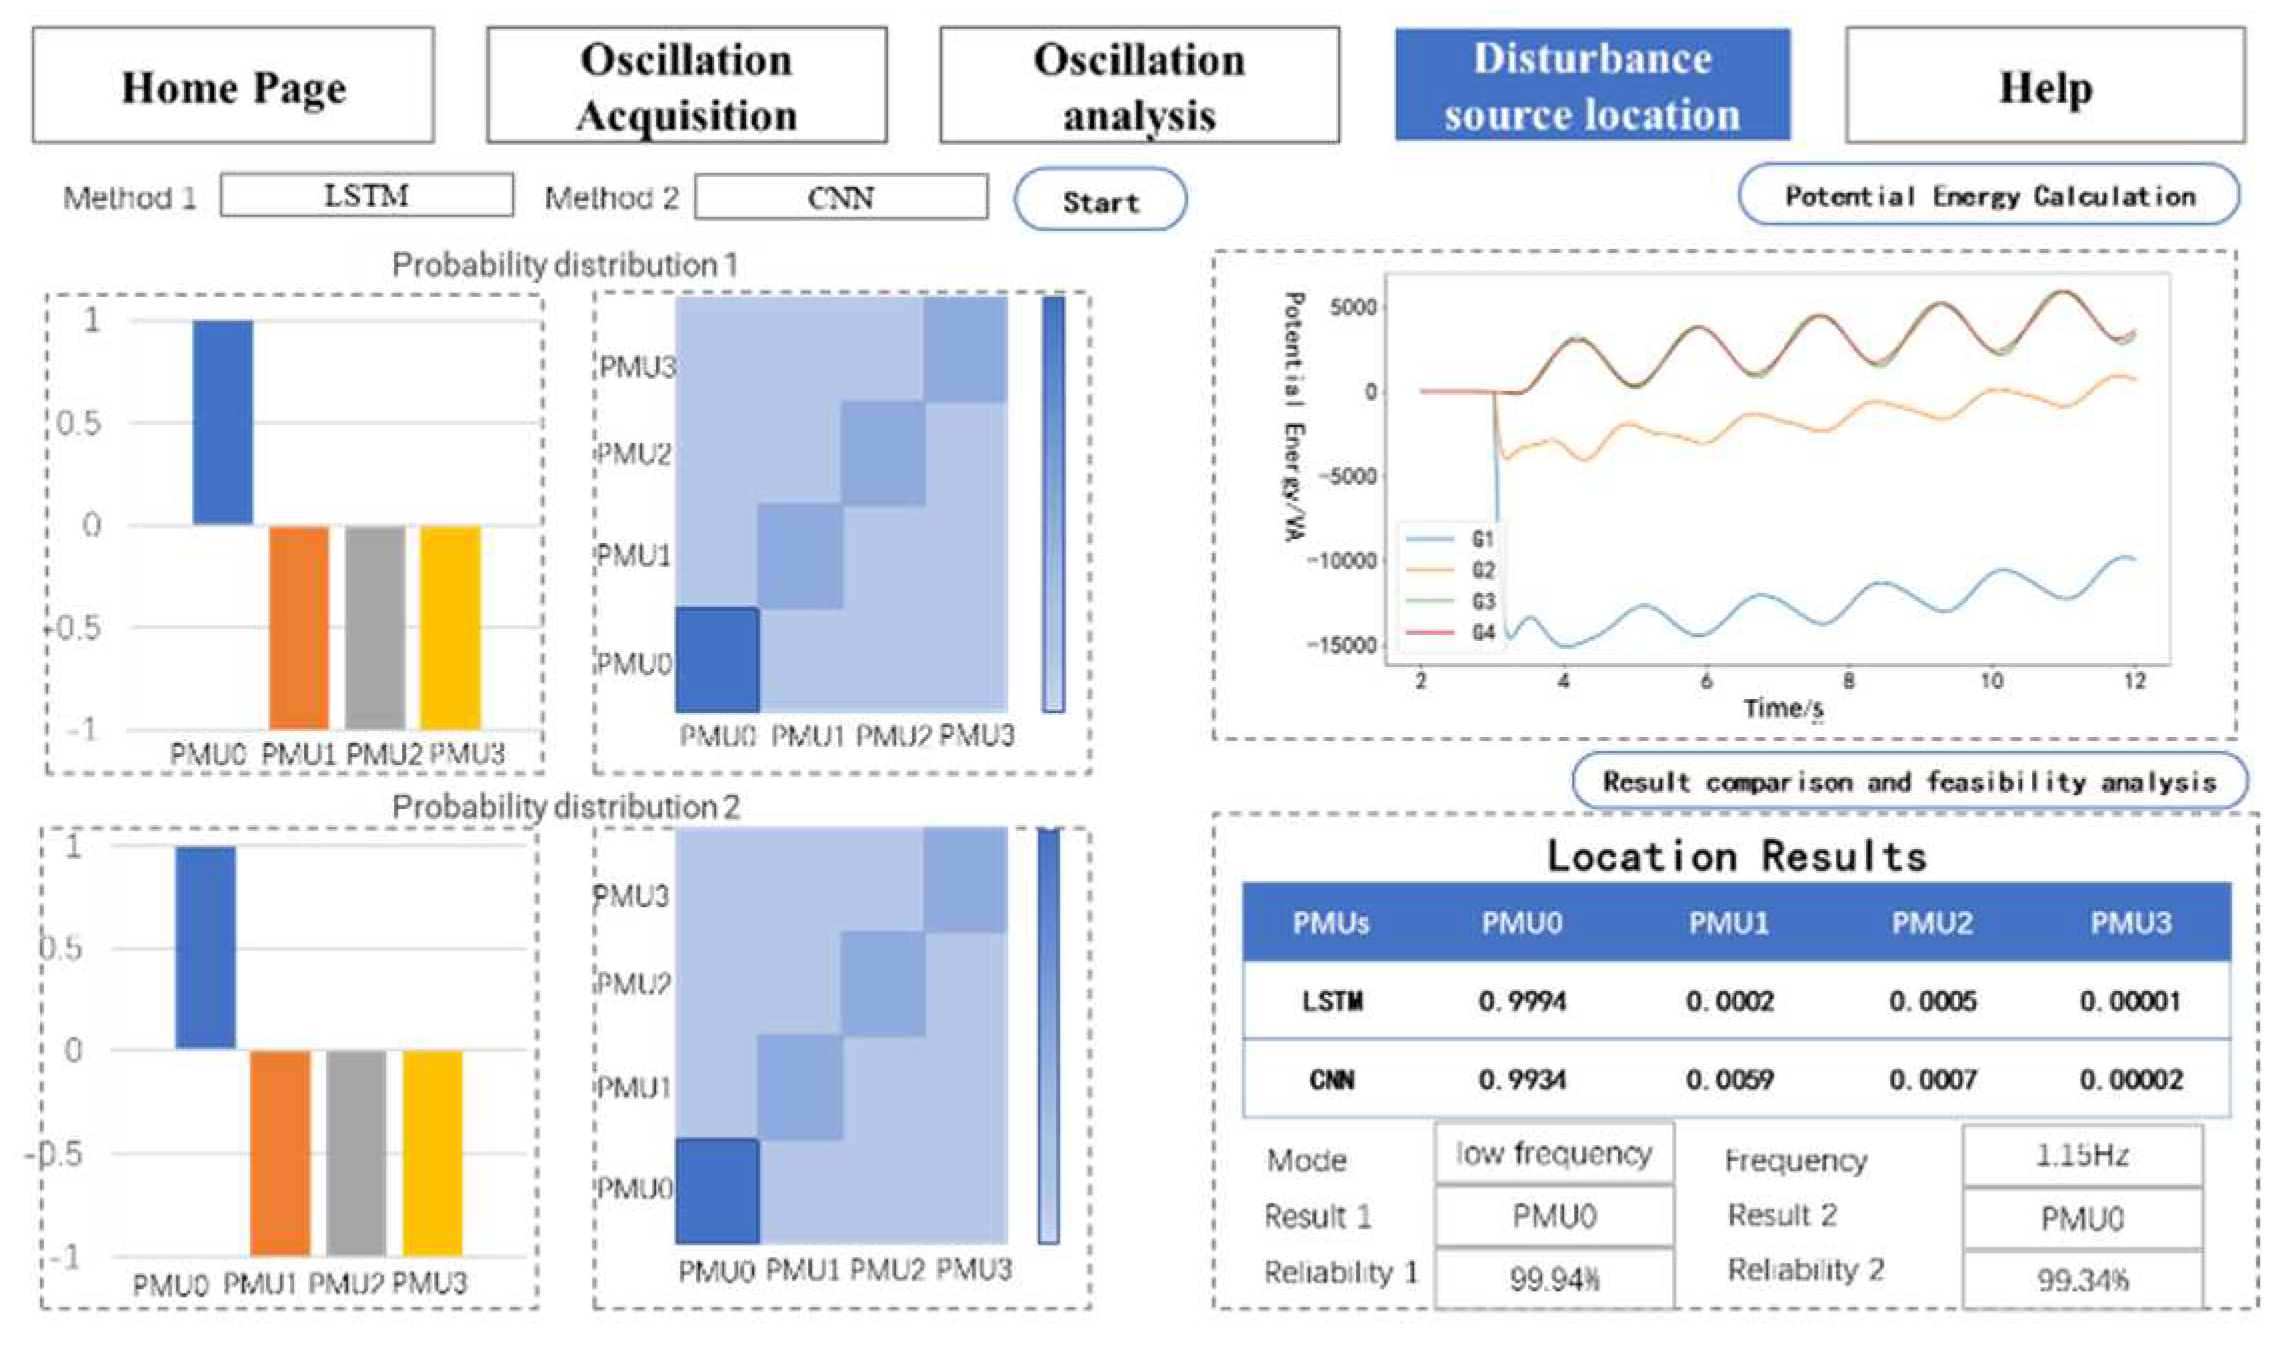
Figure 8.
Disturbance source location page.
Figure 8.
Disturbance source location page.
After completing the spectrum analysis, click the Branch Potential Calculation in the Oscillation Source Location page to output the potential curves of each branch for analysis. Then, users can select any two of the four models for oscillation source localization, and the results are presented in bar charts and distribution probability matrices.
5. Example Test Results
5.1. Example Introduction
In this paper, a four-machine, two-area system containing a 300MW direct-drive wind farm is used for example verification. The system topology is shown in
Figure 9. The example is built based on CloudPSS SimStudio platform. Different oscillation scenarios are simulated by setting parameters such as fault type, fault duration, and grounding resistance value. In each oscillation scenario, the potential energy sequence and power sequence of the four generator branches are calculated by the energy function. Then they are input into the neural network.
5.2. Data Preprocessing Algorithm Validation Test
First, add 30% random data missing to the collected data. Further, select a variety of data restoration algorithms to interpolate the missing data, and the completed data is compared with the original. The error of data restoration results by different methods is shown in
Table 1. The MSE (Mean Square Error) and MMD (Maximum Mean Discrepancy) indicators can measure the data repair accuracy from different angles. It can be seen from
Table 1 that among the four repair algorithms, MSE and MMD of GAIN repair results are both the smallest. It indicates that GAIN has the best repair performance.
5.3. Oscillator Source Localization Algorithm Performance Validation Test
5.3.1. The Results of Localization Based on Branch Potential Energy Function
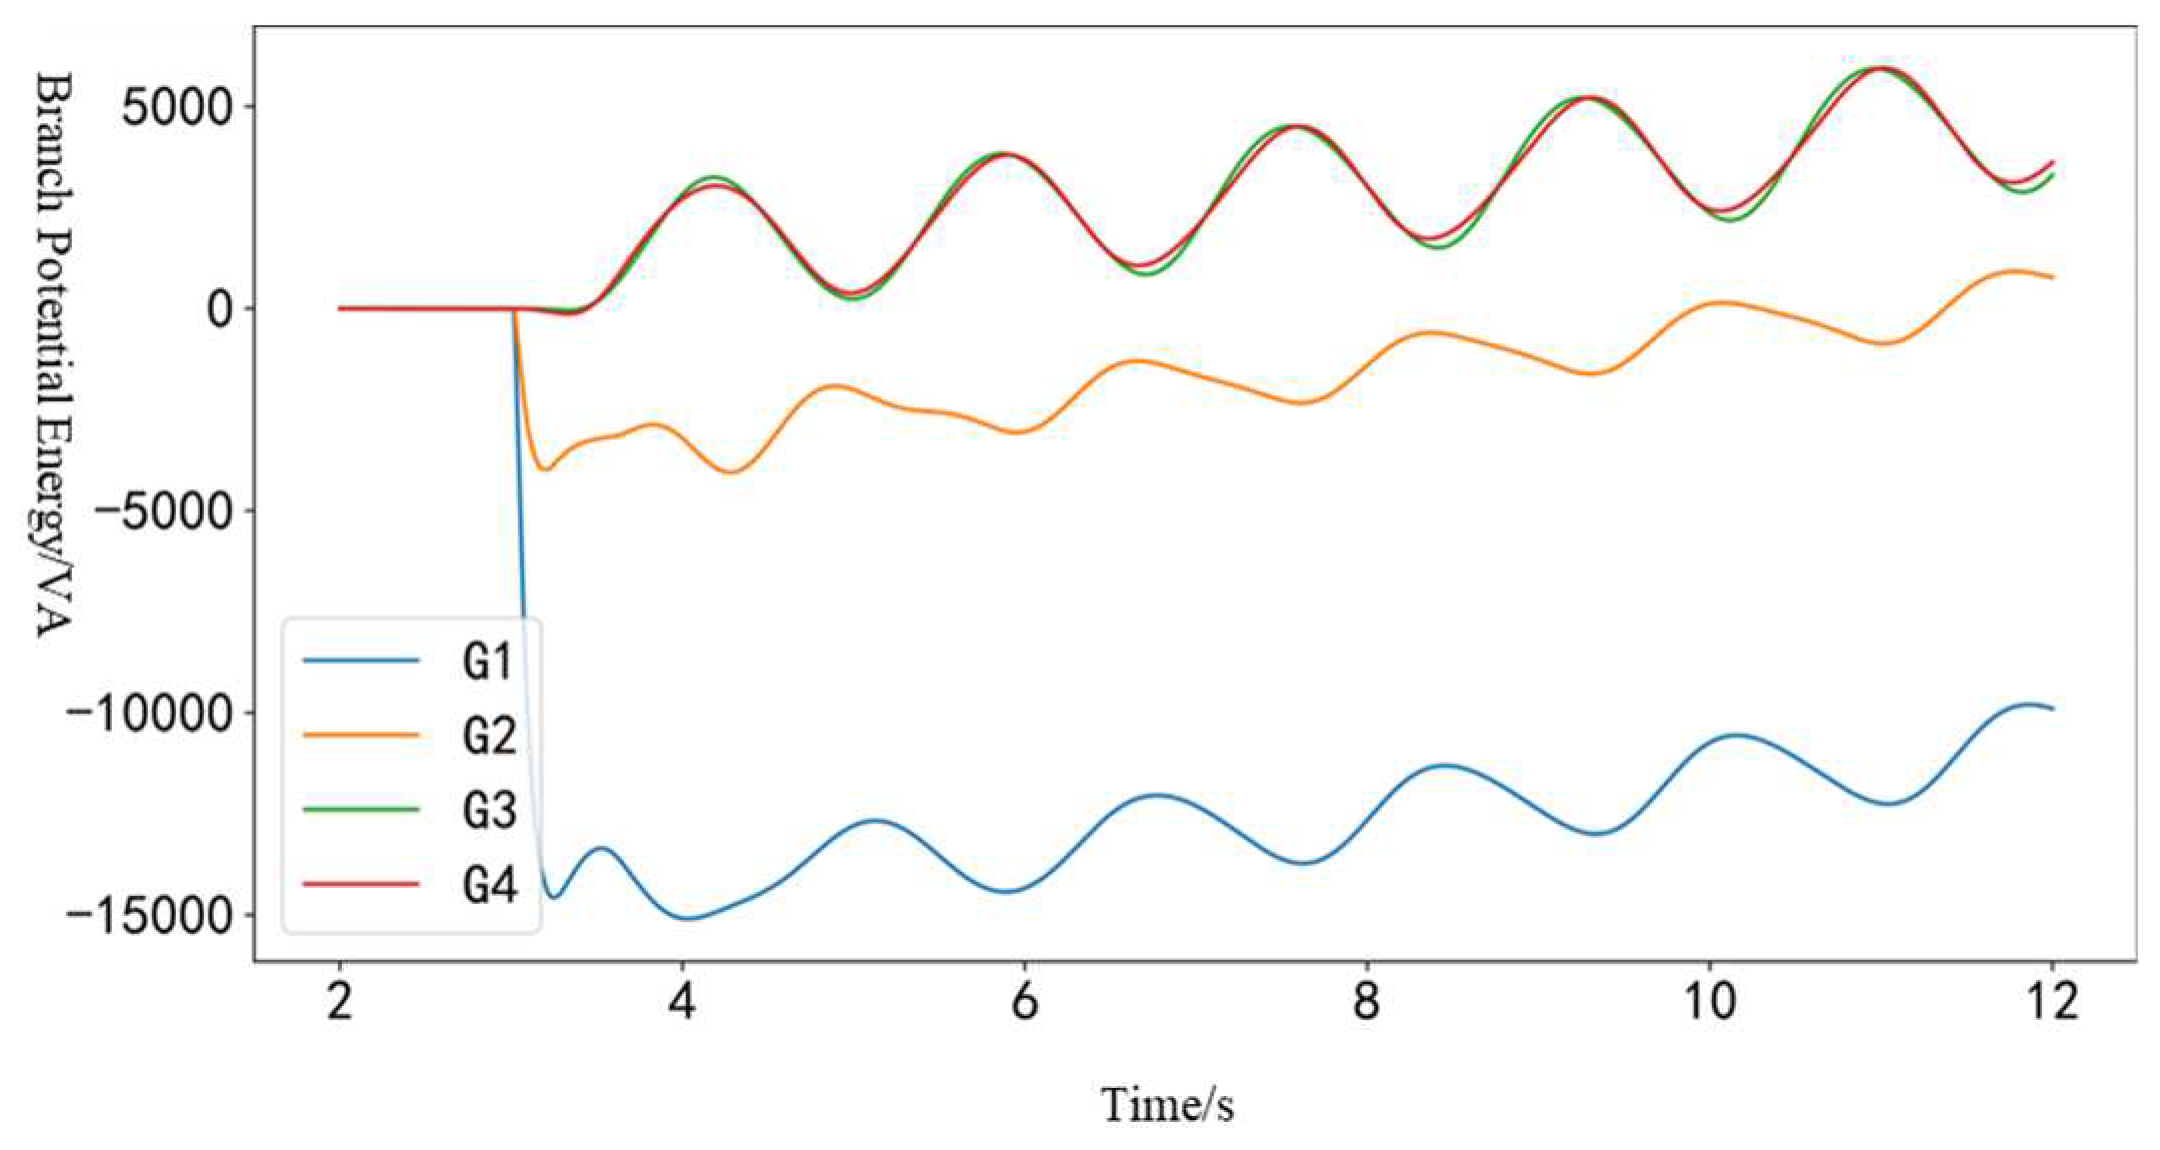
When low-frequency oscillations occur in the system, the potential energy function of the branches near each generator is plotted and the results are shown in
Figure 10.
It can be seen that when the oscillation occurs, the potential energy of the branches 1-6-7 and 2-7 in the same area has decreased to varying degrees. However, the potential energy of the 2-12-11 and 4-11 lines has not changed significantly. Therefore, it can be determined that the oscillation source is in branch 1-6-7 and branch 2-7, but the oscillation source cannot be precisely located.
5.3.2. The Results of Data-Driven Methods
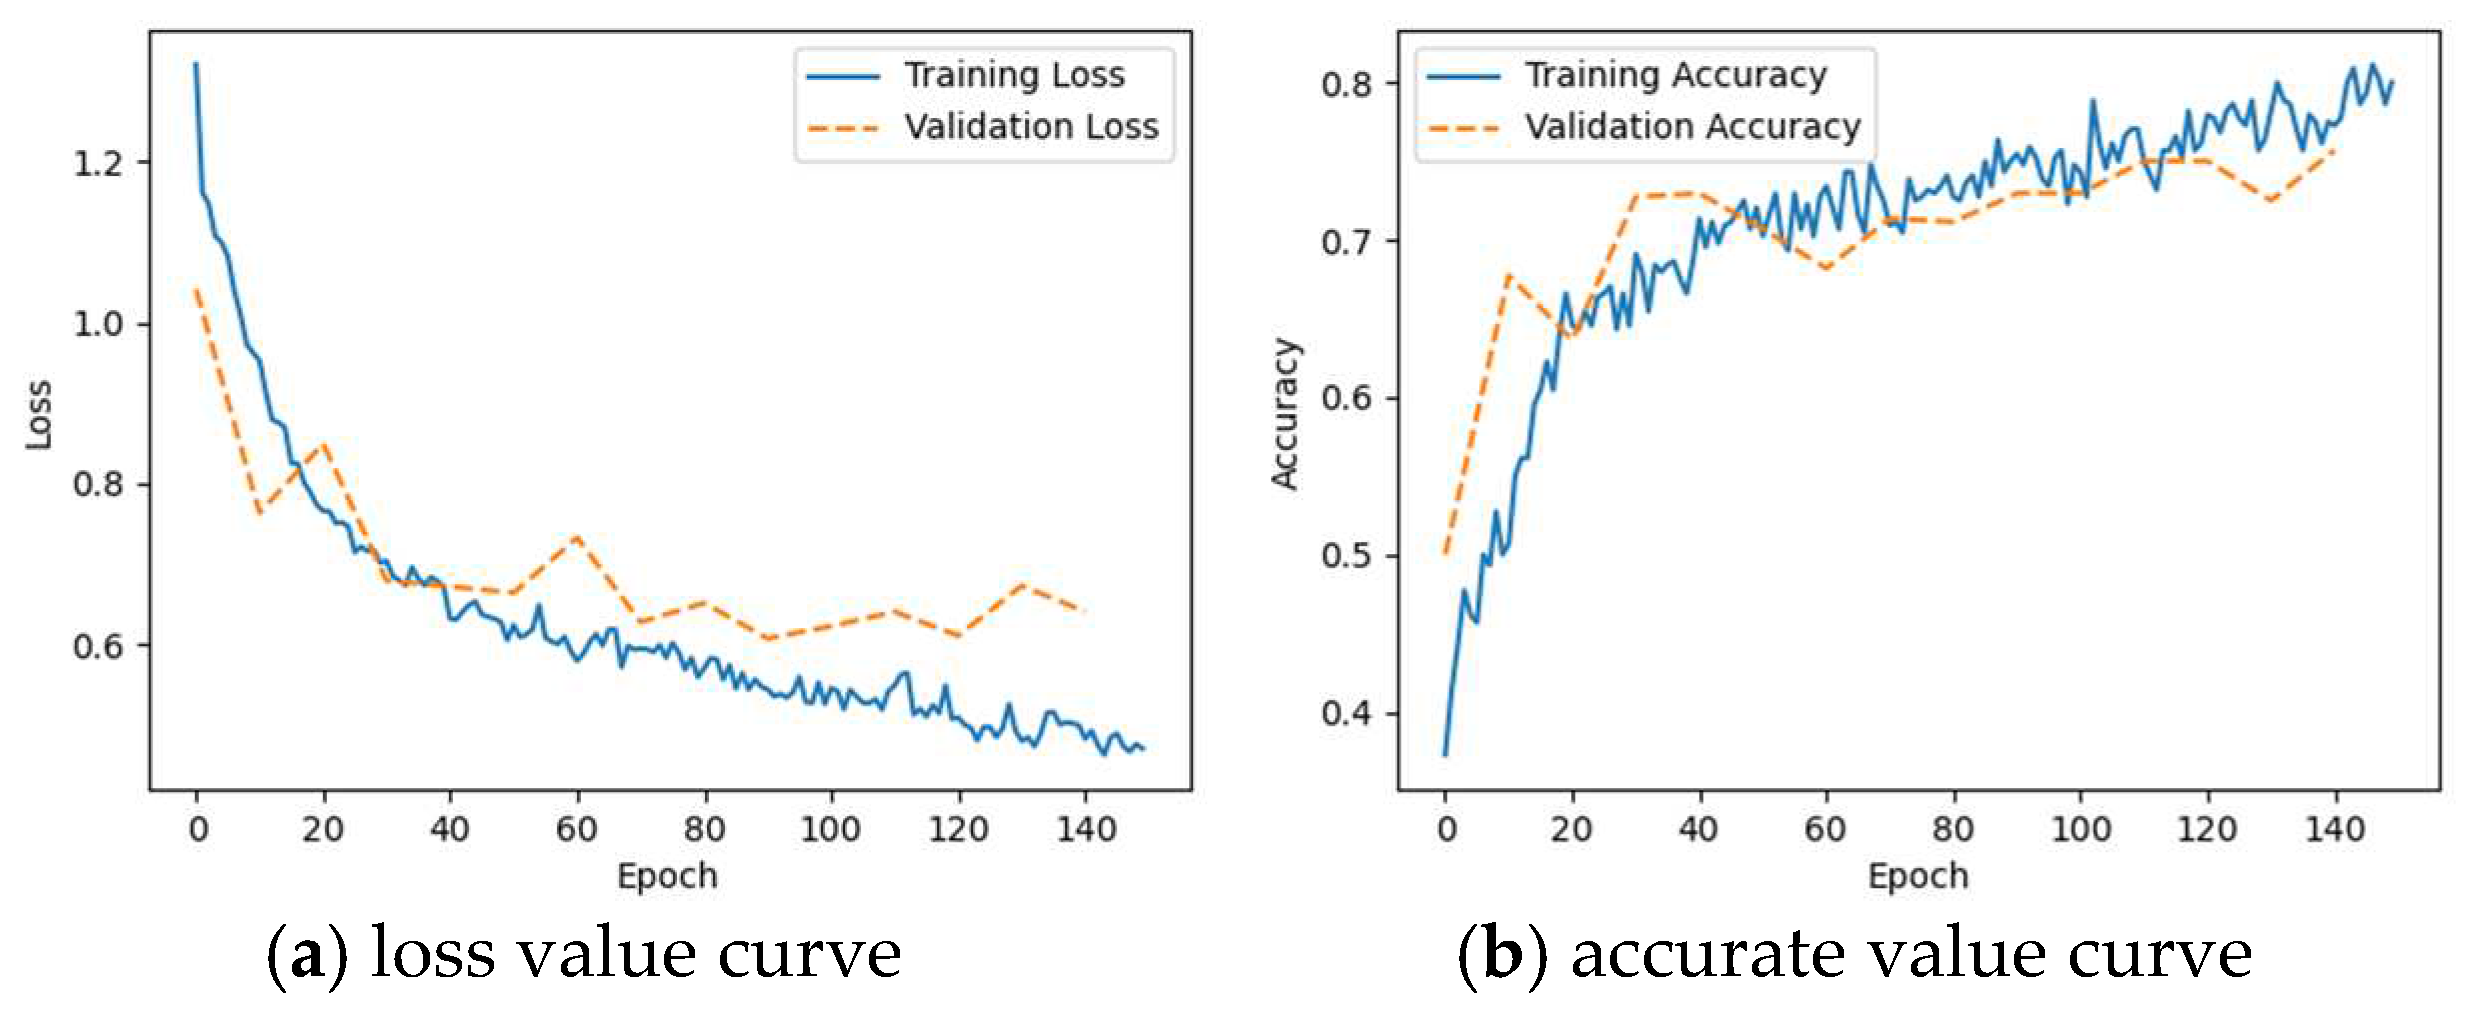
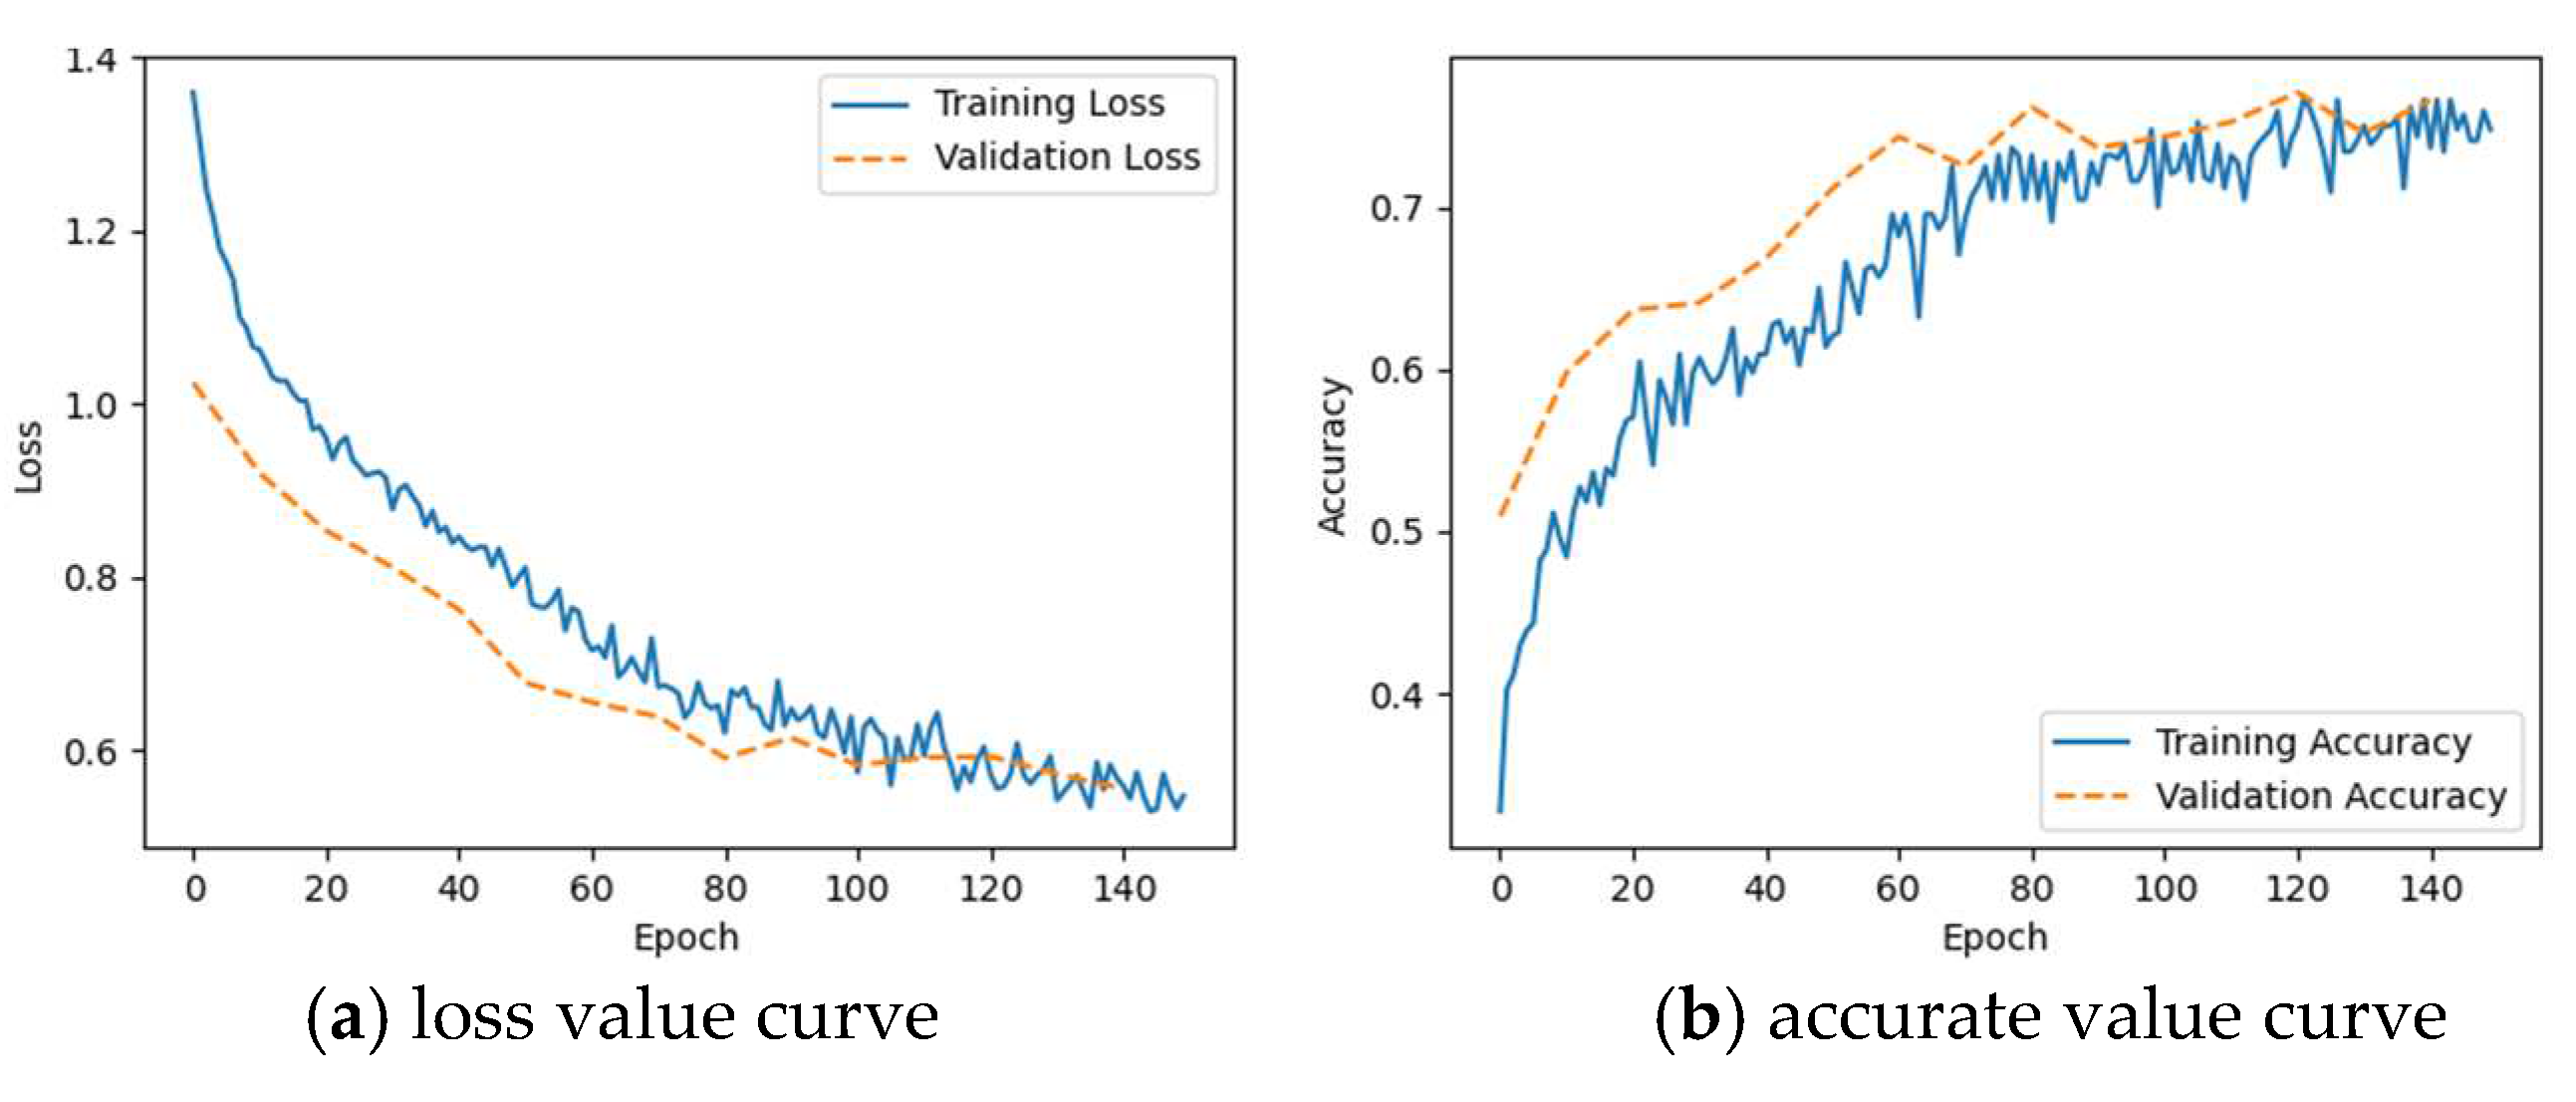
The training process of CNN and LSTM neural networks is tested using the power sequence of the generator as input. The training period is set to 150 and the results are shown in
Figure 11 and
Figure 12, respectively.
The results above show that the accurate value does not improve with the increase of the training period and stays consistently below 0.8. It indicates that inputting the generator power sequence to the neural network is unable to pinpoint the source of oscillation.
5.3.3. The Result of Data-driven Combined with Branch Potential Energy
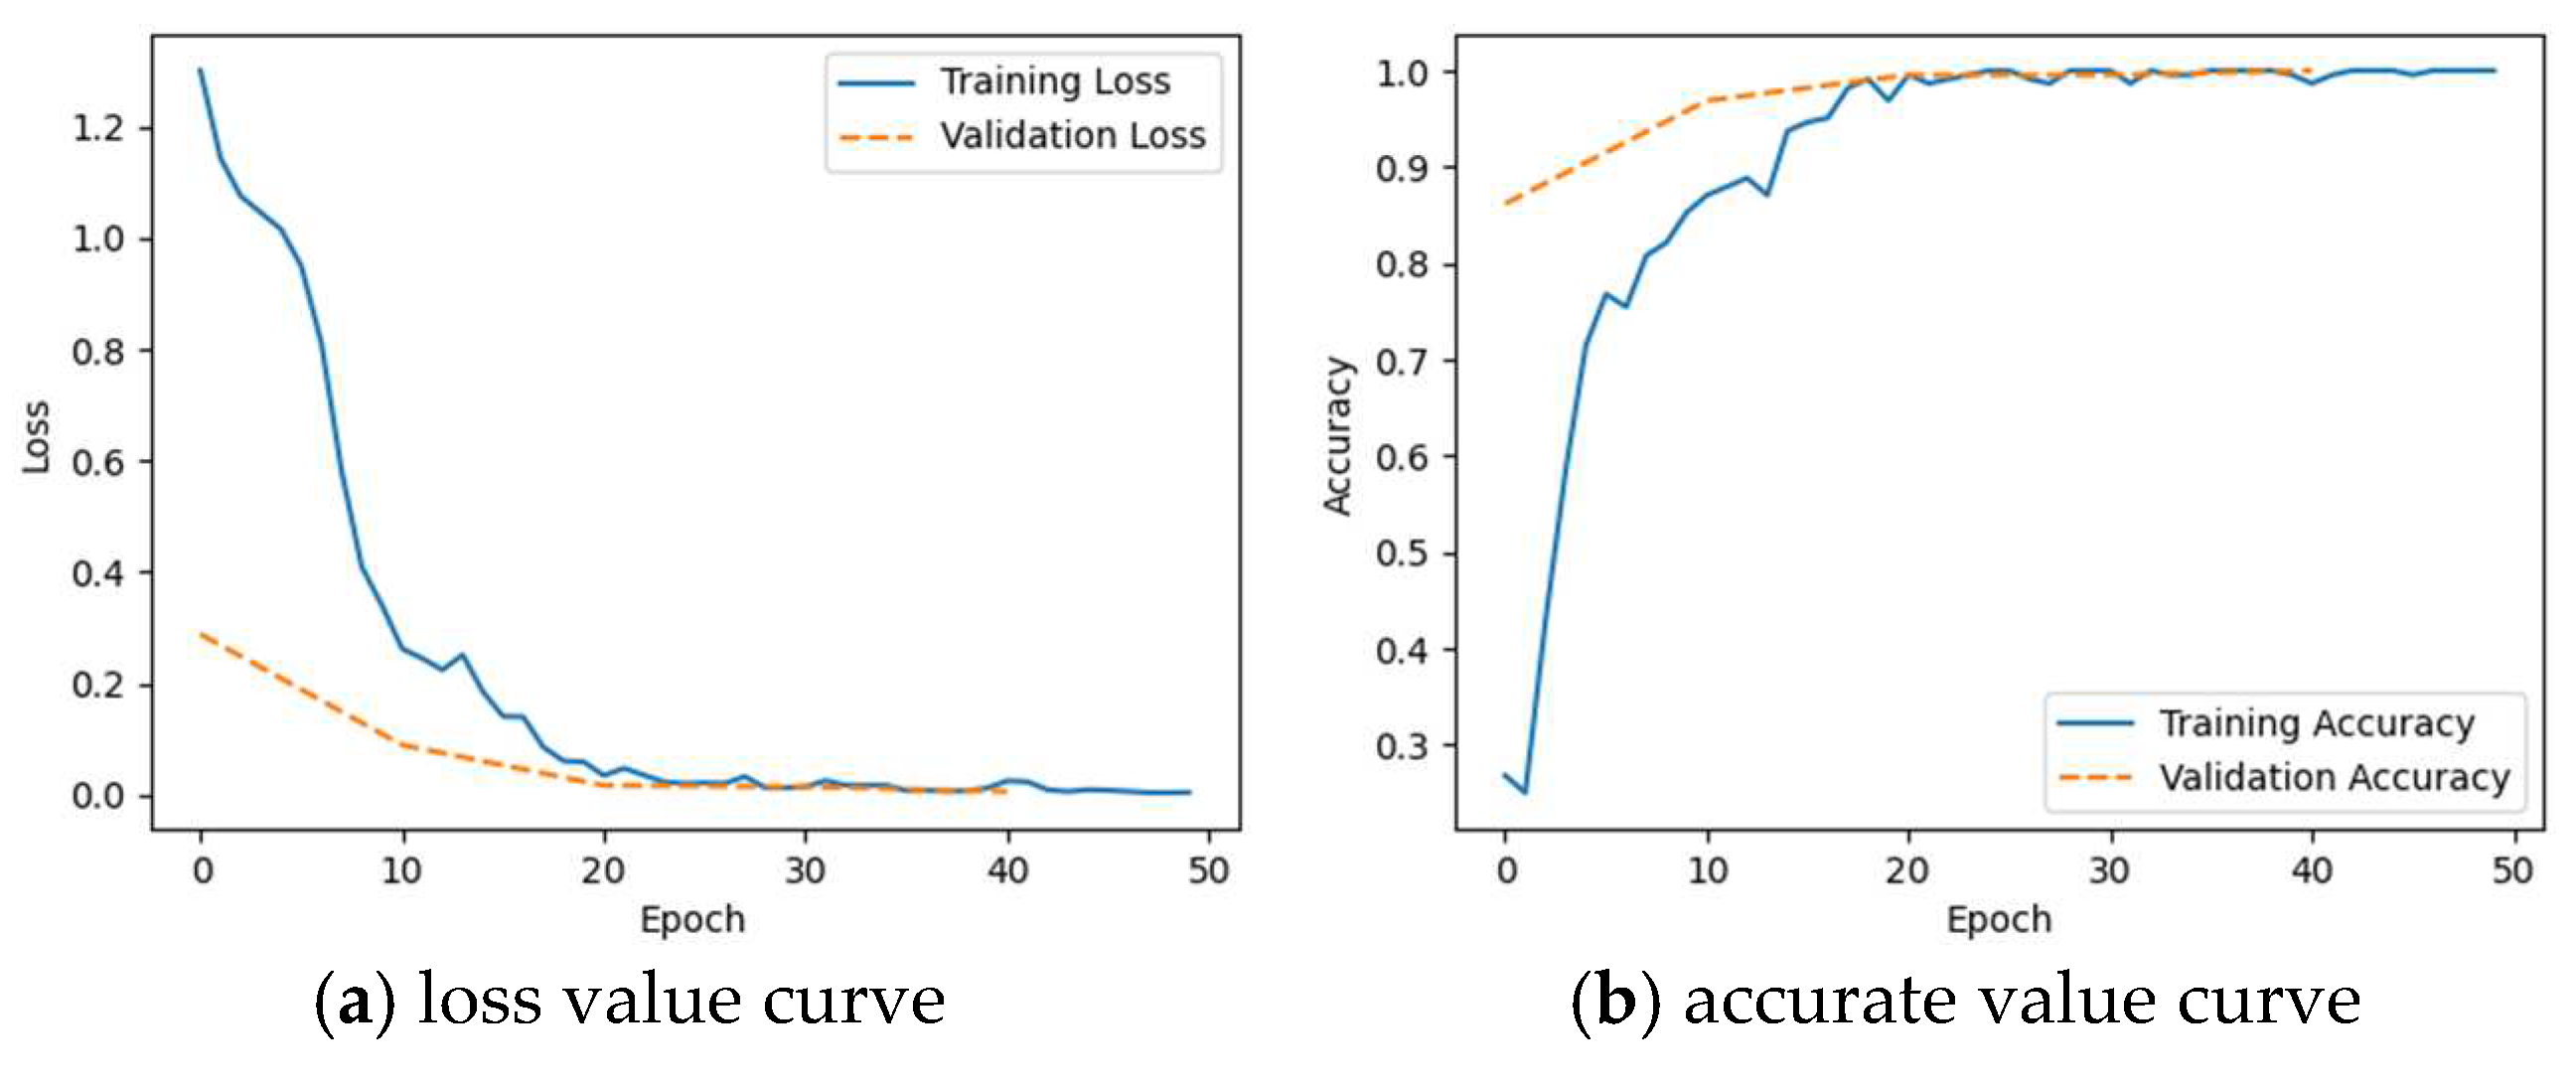
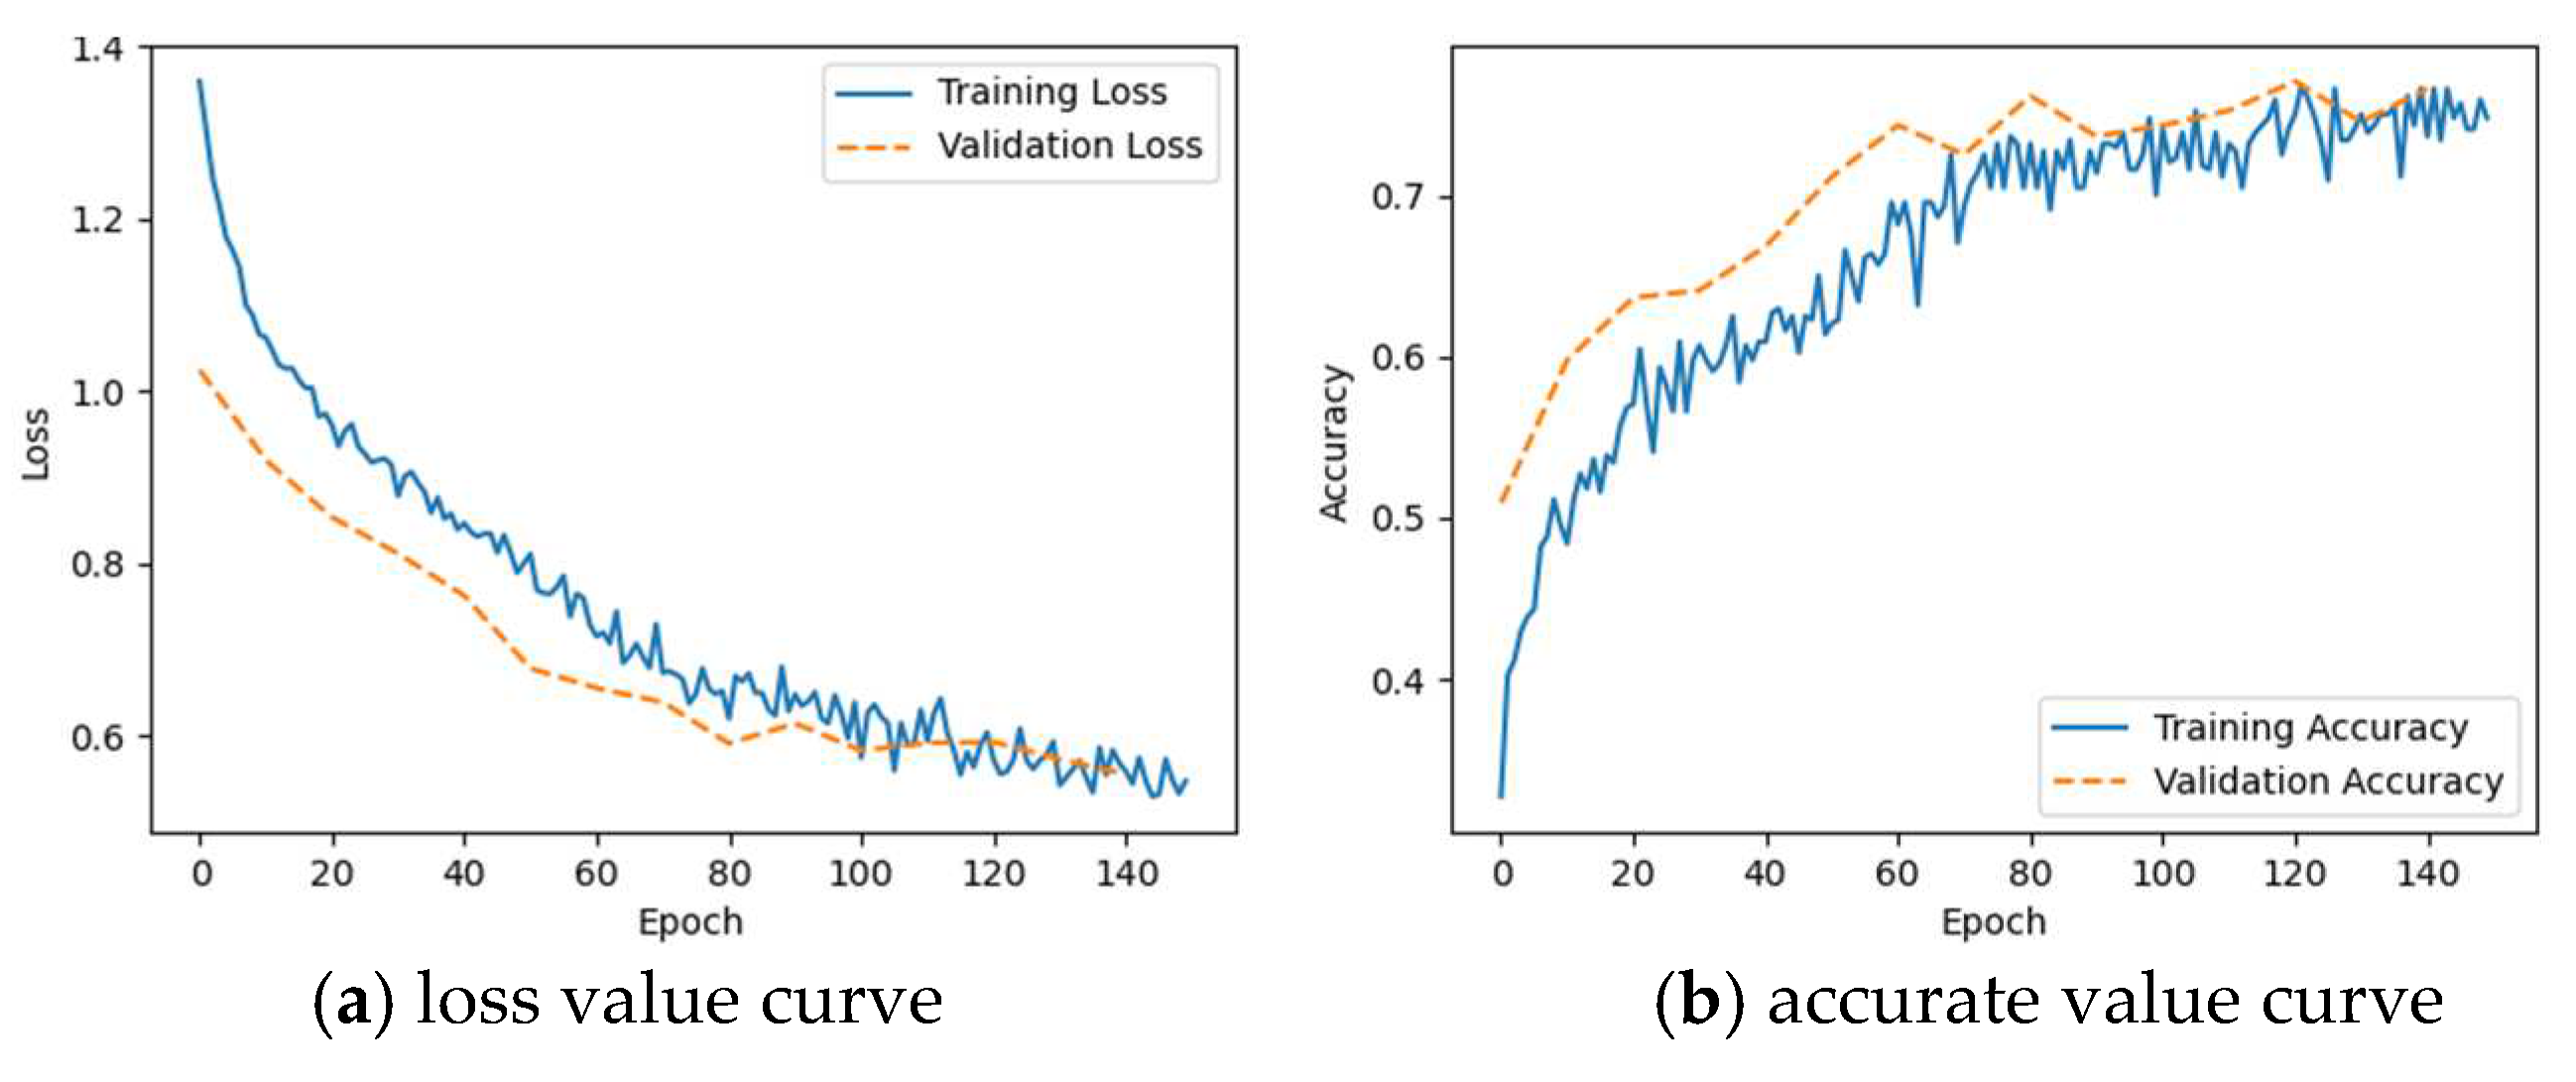
The training process of CNN and LSTM neural networks is tested using the potential energy sequence of each generator branch as input. The training period is set to 50 and the results are shown in
Figure 13 and
Figure 14, respectively.
The loss values converged to 0.006 for CNN and 0.04 for LSTM and the accurate values of both models converged to 1. It indicates that combining the branching potential function with the data-driven method resulted in a substantial improvement in the localization of the oscillating source.
5.3.4. Comparison and cross-validation of the effectiveness of different data-driven methods combined with adding branching potentials
From
Figure 13 and
Figure 14, it can be seen that accurate value of the CNN converges to 1 in about 20 training cycles, while the accurate value of the LSTM converges to 1 in about 30 training cycles. Therefore, it is concluded that the CNN is more effective than the LSTM.
In addition, the two results can be cross-validated for comparison and confidence analysis, which is helpful in confirming the accuracy and reliability of localization. The localization results and reliability indexes are shown in
Table 2 below. The results of the two methods are consistent. It determines that the oscillation source is at PMU0.
6. Conclusions
In this paper, a digital twin-based solution for power system oscillation source localization is proposed in response to the complex oscillation problems occurring in new power systems. It meets the real-time monitoring and fault localization needs of the power system. A data repair method based on a GAIN network and a measurement method of oscillation samples based on super-resolution technology are designed. They solve the problems of missing data and low and inconsistent sampling frequency of measurement devices in the actual power system. An intelligent localization algorithm for the oscillation source is constructed by combining the branch potential function and the data-driven fusion. Besides, the corresponding data-driven localization algorithm is matched for different oscillation modes. They realize the fast and accurate localization of the oscillation source.
Author Contributions
Methodology: L.Y. and Y.W.; Software, L.Y., Y.W. and C.Z.; Writing-Original Draft Preparation, L.Y.; Validation, L.Y., Y.W., C.Z. and Q.J.; Supervision, Y.W.; Conceptualization, S.G. and Z.Z. and Q.J; Writing- Reviewing, S.G., Y.L. and Z.Z.; Investigation, S.G.. All authors have read and agreed to the published version of the manuscript.
Funding
This research was funded by the National Natural Science Foundation of China ,grant number 62101362 and the Fundamental Research Funds for the Central University, grant number YJ202316.
Conflicts of Interest
The authors declare no conflict of interest.
References
- S. Lin, F. Liu and A. Dreglea, "Mode Identification of Broad-band Oscillation Signal Based on Improved VMD Method," 2020 39th Chinese Control Conference (CCC), Shenyang, China, 2020, pp. 6162-6167. [CrossRef]
- N. Ma, X. Xie, Y. Sun, Y. Zhang, Y. Li and P. Liu, "Wide-area Monitoring and Analysis of Wide-band Oscillation in New-type Power Systems," 2022 China International Conference on Electricity Distribution (CICED), Changsha, China, 2022, pp. 345-349. [CrossRef]
- W. Zhai, Q. Jia and G. Yan, "Analysis of sub synchronous oscillation characteristics from a direct drive wind farm based on the complex torque coefficient method," in CSEE Journal of Power and Energy Systems. [CrossRef]
- J. Shen, C. Liu, C. Su, H. Li and W. Wei, "Deepening Research on State Space Analytical Model of HVDC Transmission System," 2021 IEEE 4th International Electrical and Energy Conference (CIEEC), Wuhan, China, 2021, pp. 1-4. [CrossRef]
- J. Shi, L. Yang and M. Zhu, "Impedance Modeling and Interaction Stability Analysis of Grid-Connected Voltage Source Converter Considering Multiple Frequency Coupling Factors," 2021 IEEE 4th International Electrical and Energy Conference (CIEEC), Wuhan, China, 2021, pp. 1-6. [CrossRef]
- L. Chen, Y. Min, Y. -P. Chen and W. Hu, "Evaluation of Generator Damping Using Oscillation Energy Dissipation and the Connection With Modal Analysis," in IEEE Transactions on Power Systems, vol. 29, no. 3, pp. 1393-1402, May 2014. [CrossRef]
- Solanki, Jignesh, S. K. Solanki , and H. U. Banna . "Data Driven Disturbance Source Identification for Power System Oscillations Using Credibility Search Ensemble Learning." IET Smart Grid 2.2(2019):293-300. [CrossRef]
- Grieves, Michael, “Virtually Intelligent Product Systems: Digital and Physical Twins”, 2019. [CrossRef]
- R. Hu, L. Shang, N. Ma, Z. Huang and M. Ou, "Research on The Low-voltage Governance and Evaluation Method for New Distribution System Based on the Digital Twin," 2022 Power System and Green Energy Conference (PSGEC), Shanghai, China, 2022, pp. 806-813. [CrossRef]
- X. Lu, R. Hu and L. Shang, "An LSTM Neural Network-Based Fault Line Detection System Using CloudPSS-XStudio," 2022 Power System and Green Energy Conference (PSGEC), Shanghai, China, 2022, pp. 830-835.
- Z. Tan, Y. Song, S. Gao, Z. Liu, C. Ying and S. Chen, "Automatic Generation and Parameter Verification of Large-scale EMT Simulation Models Based on TSP Projects," 2021 Power System and Green Energy Conference (PSGEC), Shanghai, China, 2021, pp. 107-111.
- Sreehari Venugopal V., R. Sunitha. “Robust Dynamic State Estimation During Missing of PMU Data”, 2018 4th International Conference for Convergence in Technology (I2CT), Mangalore, India, 2018, pp. 1-6.
- Ibtehaz N, Rahman MS, “MultiResUNet : Rethinking the U-Net architecture for multimodal biomedical image segmentation. Neural Networks”, 2020 Jan;volume 121, pp. 74-87. [CrossRef]
- J. Li, Y. Xiao, J. Wu, J. Feng and J. Liu, "Network Flow Generation Based on Reinforcement Learning Powered Generative Adversarial Network," 2021 7th IEEE International Conference on Network Intelligence and Digital Content (IC-NIDC), Beijing, China, 2021, pp. 235-239. [CrossRef]
- Yoon J, Jordon J, Van Der Schaar M. Gain: missing data imputation using generative adversarial nets[C]//Proceedings of the 35th International Conference on Machine Learning. Stockholm:PMLR, 2018.
- Liu Keyan, Zhou Fangze, Zhou Hui, et al. Missing data imputation in transformer district based on improved generative adversarial network[J]. Power System Technology, 2022, 46(08): 3231-3240.
- M. Cao, Z. Liu, X. Huang and Z. Shen, "Research for Face Image Super-Resolution Reconstruction Based on Wavelet Transform and SRGAN," 2021 IEEE 5th Advanced Information Technology, Electronic and Automation Control Conference (IAEAC), Chongqing, China, 2021, pp. 448-451. [CrossRef]
- T. Wu, X. Song, T. Gan, B. Zeng and J. Chen, "Super-resolution Reconstruction of Night-light Images Based on Improved SRCNN," 2022 4th International Conference on Advances in Computer Technology, Information Science and Communications (CTISC), Suzhou, China, 2022, pp. 1-5. [CrossRef]
- Y. Yu, S. Grijalva, J. J. Thomas, L. Xiong, P. Ju and Y. Min, "Oscillation Energy Analysis of Inter-Area Low-Frequency Oscillations in Power Systems," in IEEE Transactions on Power Systems, vol. 31, no. 2, pp. 1195-1203, March 2016. [CrossRef]
- Singh, V. K. Reddy Chiluka, D. J. Trudnowski and M. Donnelly, "A Strategy for Oscillation Source Location Using Closed-Contour Grouping and Energy-Flow Spectra," 2020 IEEE/PES Transmission and Distribution Conference and Exposition (T&D), Chicago, IL, USA, 2020, pp. 1-5. [CrossRef]
- Y Y. Meng, Z. Yu, D. Shi, D. Bian and Z. Wang, "Forced Oscillation Source Location via Multivariate Time Series Classification," 2018 IEEE/PES Transmission and Distribution Conference and Exposition (T&D), Denver, CO, USA, 2018, pp. 1-5. [CrossRef]
|
Disclaimer/Publisher’s Note: The statements, opinions and data contained in all publications are solely those of the individual author(s) and contributor(s) and not of MDPI and/or the editor(s). MDPI and/or the editor(s) disclaim responsibility for any injury to people or property resulting from any ideas, methods, instructions or products referred to in the content. |
© 2023 by the authors. Licensee MDPI, Basel, Switzerland. This article is an open access article distributed under the terms and conditions of the Creative Commons Attribution (CC BY) license (https://creativecommons.org/licenses/by/4.0/).
