This research presents a novel approach for estimating soil organic carbon (SOC) content in agricultural soils using a photocatalytic Chemical Oxygen Demand (PeCOD) analyzer integrated with Geographic Information System (GIS) technology for spatial analysis. The PeCOD method, which relies on photochemical oxidation of organic carbon, demonstrated an uncanny correlation between its values and SOC content, making it a quick and accurate way to estimate SOC levels. Finer materials, such as clayey soils, demonstrated higher SOC content compared to coarser ones and decreased with increasing soil depth. GIS georeferencing enabled precise mapping of SOC distribution and identification of hotspot areas with high SOC content. This study highlights the significance of soil texture and depth on SOC distribution and emphasizes its significance within geological context when studying soil properties. Research results have practical ramifications for sustainable agriculture, climate change mitigation and soil health management - providing farmers and land managers with strategies that increase carbon sequestration while simultaneously improving soil health. Integrating PeCOD analyzer technology with GIS technology offers promising avenues for advanced soil carbon monitoring practices that promote climate-smart agricultural practices.
1. Introduction
Soil organic carbon (OC) serves as an invaluable indicator of soil health, while also playing a pivotal role in mitigating climate emissions through crop uptake and sequestration in agricultural soils. Agriculture and Agri-Food Canada data has demonstrated that Canadian agricultural soils possess the potential to annually capture 11.9 million tons of CO2 emissions from the atmosphere [
1,
2,
3,
4]. Ontario alone accounts for nearly 7 percent of Canada's land area dedicated to agriculture, providing an opportunity to study carbon sequestration as total organic carbon (TOC). Accurate, rapid, and cost-effective estimation of TOC in soil is vital for farmers looking to address climate change mitigation strategies and claim future carbon credits. To this end, the Pan-Canadian Framework on Clean Growth and Climate Change emphasizes emissions reporting options allowing traders to trade verified carbon credits both domestically and internationally [
5].
Currently, measuring soil OC can be accomplished either destructively or nondestructively using methods such as the Walkley-Black (WB) method and dry combustion (DC) [
6,
7,
8,
9,
10,
11,
12]. The Walkley-Black (WB) method is an efficient and widely employed technique for measuring soil organic carbon (SOC). Based on the principle of oxidative digestion, organic matter in soil is broken down and converted into carbon dioxide by this approach. Procedure involves mixing potassium dichromate and concentrated sulfuric acid together in a digestion flask containing soil samples for testing, then heating this solution until organic carbon in the soil has been oxidized by dichromate ions. As part of this oxidation process, the color of the solution changes from orange to green due to dichromate ion reduction and should be allowed to take place for an appropriate length of time in order to ensure complete digestion of organic carbon. After digestion, any excess dichromate is titrated against a ferrous ammonium sulfate solution to determine its consumption; this consumption is proportional to organic carbon levels in soil samples. Calculating SOC content involves using a calibration factor determined from standard solutions with known concentrations of organic carbon. The Walkley-Black method offers an effective yet simple means for estimating soil organic carbon, making it popularly utilized by soil analysis laboratories and research studies alike [
6,
7,
8,
9,
10,
11,
12]. The dry combustion method has long been recognized and widely adopted for evaluating organic carbon content in soil. This technique involves subjecting soil samples to elevated temperatures within a furnace where organic carbon can be converted to carbon dioxide; the technique has proven its accuracy and reliability for measuring this form of organic matter in testing laboratories worldwide [
6,
7,
8,
9,
10,
11,
12].
However, these methods of analysis can be slow, difficult, and expensive; or require toxic chemicals for analysis. To provide an alternative solution MANTECH offers PeCOD analyzers which use photochemical oxidation of organic carbon catalyzed by titanium dioxide as an analytical technique. As the oxidation reaction progresses, an excess electrical charge increases proportionately with organic carbon consumption. An analyzer measures this generated charge by plotting output current (I) against time (t), with its area under the curve directly related to TOC content in a sample. Although our software has been configured to convert integrated area into chemical oxygen demand (COD) values and estimate organic matter content based on these COD values [
13], there remains no reliable method for analyzing soils or interpreting soil-derived data. Success of the research project would be determined if the TOC analysis protocol developed could accurately and precisely identify soil TOC content with at least 95% accuracy and 90% precision, like standard TOC methods [
14,
15,
16,
17]. As part of its validation process, its results should be compared with those generated from standard methods like WB, DC and spectral analyses for comparison purposes.
Monitoring soil organic carbon levels is essential to ensuring that agricultural practices either maintain current levels or contribute to increasing them and sequestering more carbon [
19]. Certain agricultural practices, including tillage, the removal of plant residues and lack of soil coverage between crop seasons are known to help lower TOC in soil. On the contrary, climate-smart approaches that aim at increasing soil TOC through no-till agriculture, cover crop use, and soil amendment with organic or biochar-derived materials like biochar and humic substances have become popular among farmers [
20]. Research currently being undertaken explores the effects of approaches that result in soil inorganic carbon sequestration, such as enhanced rock weathering and soil remineralization, on organic carbon pools [
21]. Soil organic carbon can also be considered meta-stable, as its degradation could release greenhouse gases such as CH4 and N2O into the environment. With all these research topics - many already adopted by farmers - it is imperative that reliable, cost-effective, and swift methods of measuring TOC levels across spatial and temporal scales, considering both soil heterogeneity in terms of area and depth [
19].
For the purpose of this project, the research team introduced the fractionation of soils as well as using geographic information system (GIS) software to geo-reference soil sampling locations to be used as viable aids to determine organic carbon content for current and future prediction purposes. Physical fractionation has become an effective method to gain greater insight into soil behavior and assess organic carbon content. Essentially, this technique involves segregating soil samples according to particle size such as sand, silt and clay and then analyzing their organic carbon content within each fraction. Studies have demonstrated that soils with high clay content typically display higher organic carbon concentration, likely attributable to their increased surface area and cation exchange capacity, enabling retention and stabilization of organic matter. Fractionation has long been employed as a way of investigating organic matter distribution within soils as well as developing effective management practices to promote soil health and sequestration of carbon dioxide emissions [
22].
GIS software has grown increasingly popular as an approach to georeferencing soil sampling locations and producing spatially explicit maps depicting organic carbon content. GIS allows researchers to visualize and analyze soil data, making it easier to spot spatial patterns and trends related to organic carbon levels in various land use types like cropland's, forests, or grasslands - as well as investigating potential effects of land use changes and management practices on carbon dynamics. It has even been employed in studies that aim at mapping and quantifying organic carbon levels within specific land uses such as cropland's forests grasslands etc; creating maps of organic carbon content within various land use types that investigate impacts from land use changes and soil management practices on soil carbon dynamics [
23]. Lastly, the upcoming sections of this paper demonstrate the unique on-site approach in determining organic carbon content in soils.
2. Materials and Methods
Measuring soil organic carbon (SOC) content using the PeCOD “Photocatalytic Chemical Oxygen Demand” analyzer involves some specific adaptations that must be made for each instrument being utilized. Sampling soil samples that accurately represent the characteristics of the study area is an essential step in soil analysis, as their accuracy plays an integral part in producing quality results. As soon as a sampling area is identified, it is ensured that all samples taken represent the larger study area by considering variables like texture, color, vegetation density and topography as well as land use and topography. The sampling area is subdivided according to any variations observed in soil properties; the exact number of sub-areas depends upon both its size and extent of variability present. Sampling points are chosen at pattern within each sub-area for fair representation; alternatively, use systematic sampling if a specific distribution pattern is required.
At each sampling point, an auger is used to take soil samples at various depths (for instance 0-10 cm, 10-20 cm and 20-30 cm) to produce a vertical profile of soil properties. Composite samples are created by combining soil samples collected at each depth at each sampling point into one composite sample that represents the soil properties in their sub-area. All composite samples are identified by providing information like sampling point location, depth, date, and collection time. Furthermore, they are stored in airtight and moisture proof containers to avoid contamination or moisture loss. The sampling process is repeated until representative soil samples from across the entire study area have been obtained.
After collection, these samples are prepared by removing visible roots or stones and performing a sieve analysis in accordance with ASTM C-136-01 standards [
24]. Sieve analysis is an efficient method for estimating particle size distribution of soil. Sets of sieves featuring mesh sizes of 2.0 mm, 250 um, 75 um and 50 um were used, along with weighing balances, ovens, cleaning brushes, containers for collecting the soil passing through the finest sieve, gloves, and safety glasses. The soil samples are prepared by clearing away any large stones or plant material and breaking up any clumps. Each soil sample is weighed down to the nearest milligram and is then heated in the oven to 105 degrees Celsius. The sieves are assembled for use and are carefully cleaned using a cleaning brush, taking steps to ensure they are completely dry before proceeding with use. Furthermore, the sieves are arranged in order of decreasing mesh sizes, beginning with the largest and ending with the smallest, starting with the collection pan at the base. Soil samples are placed onto the top sieve and are shaken vigorously horizontally and vertically for 10-15 minutes until no more soil passes through the finest sieve. Soil retained on each sieve is weighed with precision up to one milligram and is recorded for further analysis. The percentage of soil retained on each sieve is calculated by dividing its weight by its initial weight and multiplying by 100 (Equation 1).
It should be noted that while particle size classification (e.g., sands, silts and clays) plays a part in soil organic carbon content, other factors such as climate, vegetation, soil type and management practices also impact how organic carbon is distributed throughout soil layers and managed [
25]. Soils with higher clay content typically exhibit higher organic carbon contents due to the large surface area and cation exchange capacity of clay particles, which help protect organic matter retention and increase organic matter protection [
26]. Sandy soils tend to have lower organic carbon contents due to their reduced cation exchange capacity, while silt soils fall somewhere in between sandy and clayey in terms of organic carbon content. After the sieve analysis was performed, samples were segregated and assigned an analysis method to undergo. The three (3) main organic carbon analysis methods carried out in this project were the Walkley-Black Method, Loss on Ignition, and the Photocatalytic COD analyzer method. The purpose is to investigate the validity and reliability of the Photocatalytic COD analyzer method compared to current accepted methods.
Firstly, the Loss on Ignition (LOI) method can be used to measure organic carbon levels in soils by measuring mass differences before and after combustion. This process typically entails several steps. At first, the crucible and sample are weighed to establish an initial weight, they are placed into a muffle furnace for exposure to high temperatures for a designated timeframe [
27]. Generally, soil is placed in the furnace at temperatures ranging between 350 – 440 degrees Celsius [
27], but the research team investigated temperatures ranging between 400 and 600 degrees Celsius to explore the different possibilities resulting at higher temperatures. At this stage, organic matter found in the soil sample is burned away through combustion, leaving behind only inorganic matter. When complete, the remaining soil residue and crucible are allowed to cool before being weighed once more to determine its weight; by subtracting that figure from that of initial weight of soil sample and subtracting weight of remaining residue from initial weight of sample; organic carbon content can then be calculated and expressed as a percentage (Equation 2).
This method using mass difference offers an efficient and cost-effective method for estimating soil organic carbon content. However, it should be noted that this approach does not distinguish between types of organic matter or inorganic carbon and may include some inaccuracy in its results. Precise control over combustion temperature and duration is crucial to obtain accurate outcomes with this approach. Although the Loss on Ignition (LOI) method provides an estimate of total organic carbon based on its high ratio to other constituents in organic matter, when applying this method, it is essential to keep certain factors in mind. Structural water loss during heating could result in weight loss due to structural water evaporation; this may misrepresent organic matter content of soil sample. Treating with hydrochloric acid prior to ignition could mitigate this effect; however, the presence of HCl could result in some organic material dissolving into solution. LOI methods are well known for being simple, affordable, and low risk; no harmful chemicals are necessary [
27]. While the LOI method estimates organic carbon content accurately, given its diverse nature, it would take more investigation to fully comprehend how organic matter differs among soil types to ensure accurate estimations.
One of the other current methods investigated in this project is the Walkley Black Method. The Walkley Black Method is a wet oxidation procedure used to determine total organic carbon levels in soil samples [
28]. While considered semi-quantitative due to requiring a correction factor specific to each sample being examined, this approach remains viable in many situations. This method assumes that organic carbon is the main reducing agent in soil organic matter and that proportions of hydrogen and nitrogen directly relate to its carbon content. Oxidation reactions involve using a concentrated solution of sulfuric acid and potassium dichromate (K2Cr2O7) for organic carbon conversion to carbon dioxide (CO2) [
28]. This results in the release of carbon dioxide gas as the product. Reduced dichromate ions are then back-titrated using ferrous sulfate (FeSO4) to determine any excess dichromate, while organic carbon content is calculated by comparing the volume of titrant used during soil sample titration to that used during blank titration - typically with an approximate correction factor of 1.3 being applied as this helps account for incomplete combustion and recovery of organic carbon by this method. The calculation of Organic Carbon Content in Soil Samples is performed by using an equation (Equation 3 and 4) which considers both volumes of titrant used during soil sample titrations as well as those employed during blank titrations, the organic carbon content of soil samples is calculated and utilized to establish their final organic carbon contents [
29].
Abbreviations/Definitions:
%WBC: Organic carbon in the soil sample measured in the reaction
V_Blank: Volume of titrant in blank titration (mL)
V_Sample: Volume of titrant in sample titration (mL)
M_(Fe2+): Concentration of ferrous sulphate
Mcf: Moisture correction factor
W: Weight of the soil sample (g)
For the utilization of the PeCOD, organic carbon in the soils is extracted in liquid form from these samples to be fed directly into photocatalytic COD analyzer for further evaluation. To prepare the soil sample for analysis using the COD analyzer, the process begins by weighing 0.25g of soil and adding 50 mL of deionized water into a 100 mL cup with a sealable lid. The mixture is mixed manually for one minute and let to settle for 30 minutes before transferring to a 50 mL test tube and centrifuge it for 15 minutes. Finally, using a syringe with 45 um filter tip 20mL of this solution is removed and then transferred to another 50mL test tube as this solution will become the sample solution used for further analyses.
For PeCOD sample setup, 15 mL of green range electrolyte is added to a test tube containing 15 mL soil sample and mixed well using a vortex mixer. As an additional step in preparation of the PeCOD samples, a blank sample is prepared by mixing 15 mL milliQ water with 15 mL green range electrolyte in separate test tubes. Next, the PeCOD is calibrated by following the software setup steps and using a 1:1 ratio between calibrant and electrolyte solutions for green range in Port A and deionized water in Port B for calibration of green range electrolytes. To run the PeCOD analysis, the prepared soil sample is placed in Port A and blank solution in Port B. The analysis is started by choosing the desired number of replicates and data sets are collected/downloaded after every run. At the conclusion of each run, both ports are flushed with deionized water in order to ensure adequate cleaning between samples. The PeCOD analyzer measures the amount of oxygen necessary to oxidize organic carbon present in samples. To calculate organic carbon content, the COD value obtained during analysis is used; conversion factors vary according to soil type and can be obtained either through literature sources or calibration curves using known organic carbon standards.
Additionally, soil samples collected for sampling are georeferenced with GIS technology using GPS devices and then processed through GIS software to generate maps that depict organic carbon distribution across their study areas. Interpretation of results obtained is accomplished using spreadsheet software such as Excel. Statistical measures like mean and standard deviation are computed to summarize organic carbon content data, while GIS maps generated earlier allow identification of areas with high or low organic carbon concentration for spatial analysis and interpretation. To ensure the accuracy and reliability of results, it is crucial to follow standard protocols and implement quality control procedures at each step of the process. It is also necessary to consider factors like sample representativeness, COD analyzer calibration and GPS device quality when interpreting results.
3. Results and Discussion
3.1. Sampling Locations
In this section, the results are presented and interpreted to explore their significance in answering this research project’s question. Results are presented clearly and concisely while emphasizing key findings and their significance; furthermore, the research team ensured to compare these with existing literature or previous studies to give a broader context for interpretation; additionally, the team aimed to address any limitations or potential sources of error within the study as well as analyze their practical applications and implications.
Firstly,
Table 1 below summarizes the location, sampling depth, and sampling techniques used for the soils investigated in this paper. Furthermore, as part of results validation and verification measures, the research team checked the validity of the sieve analysis carried out by comparing their results with the results of a sieve analysis carried out at one of the Canadian Council of Independent Laboratories (CCIL) certified laboratories in Lindsay, Ontario [
30].
3.2. Physical Fractionantion
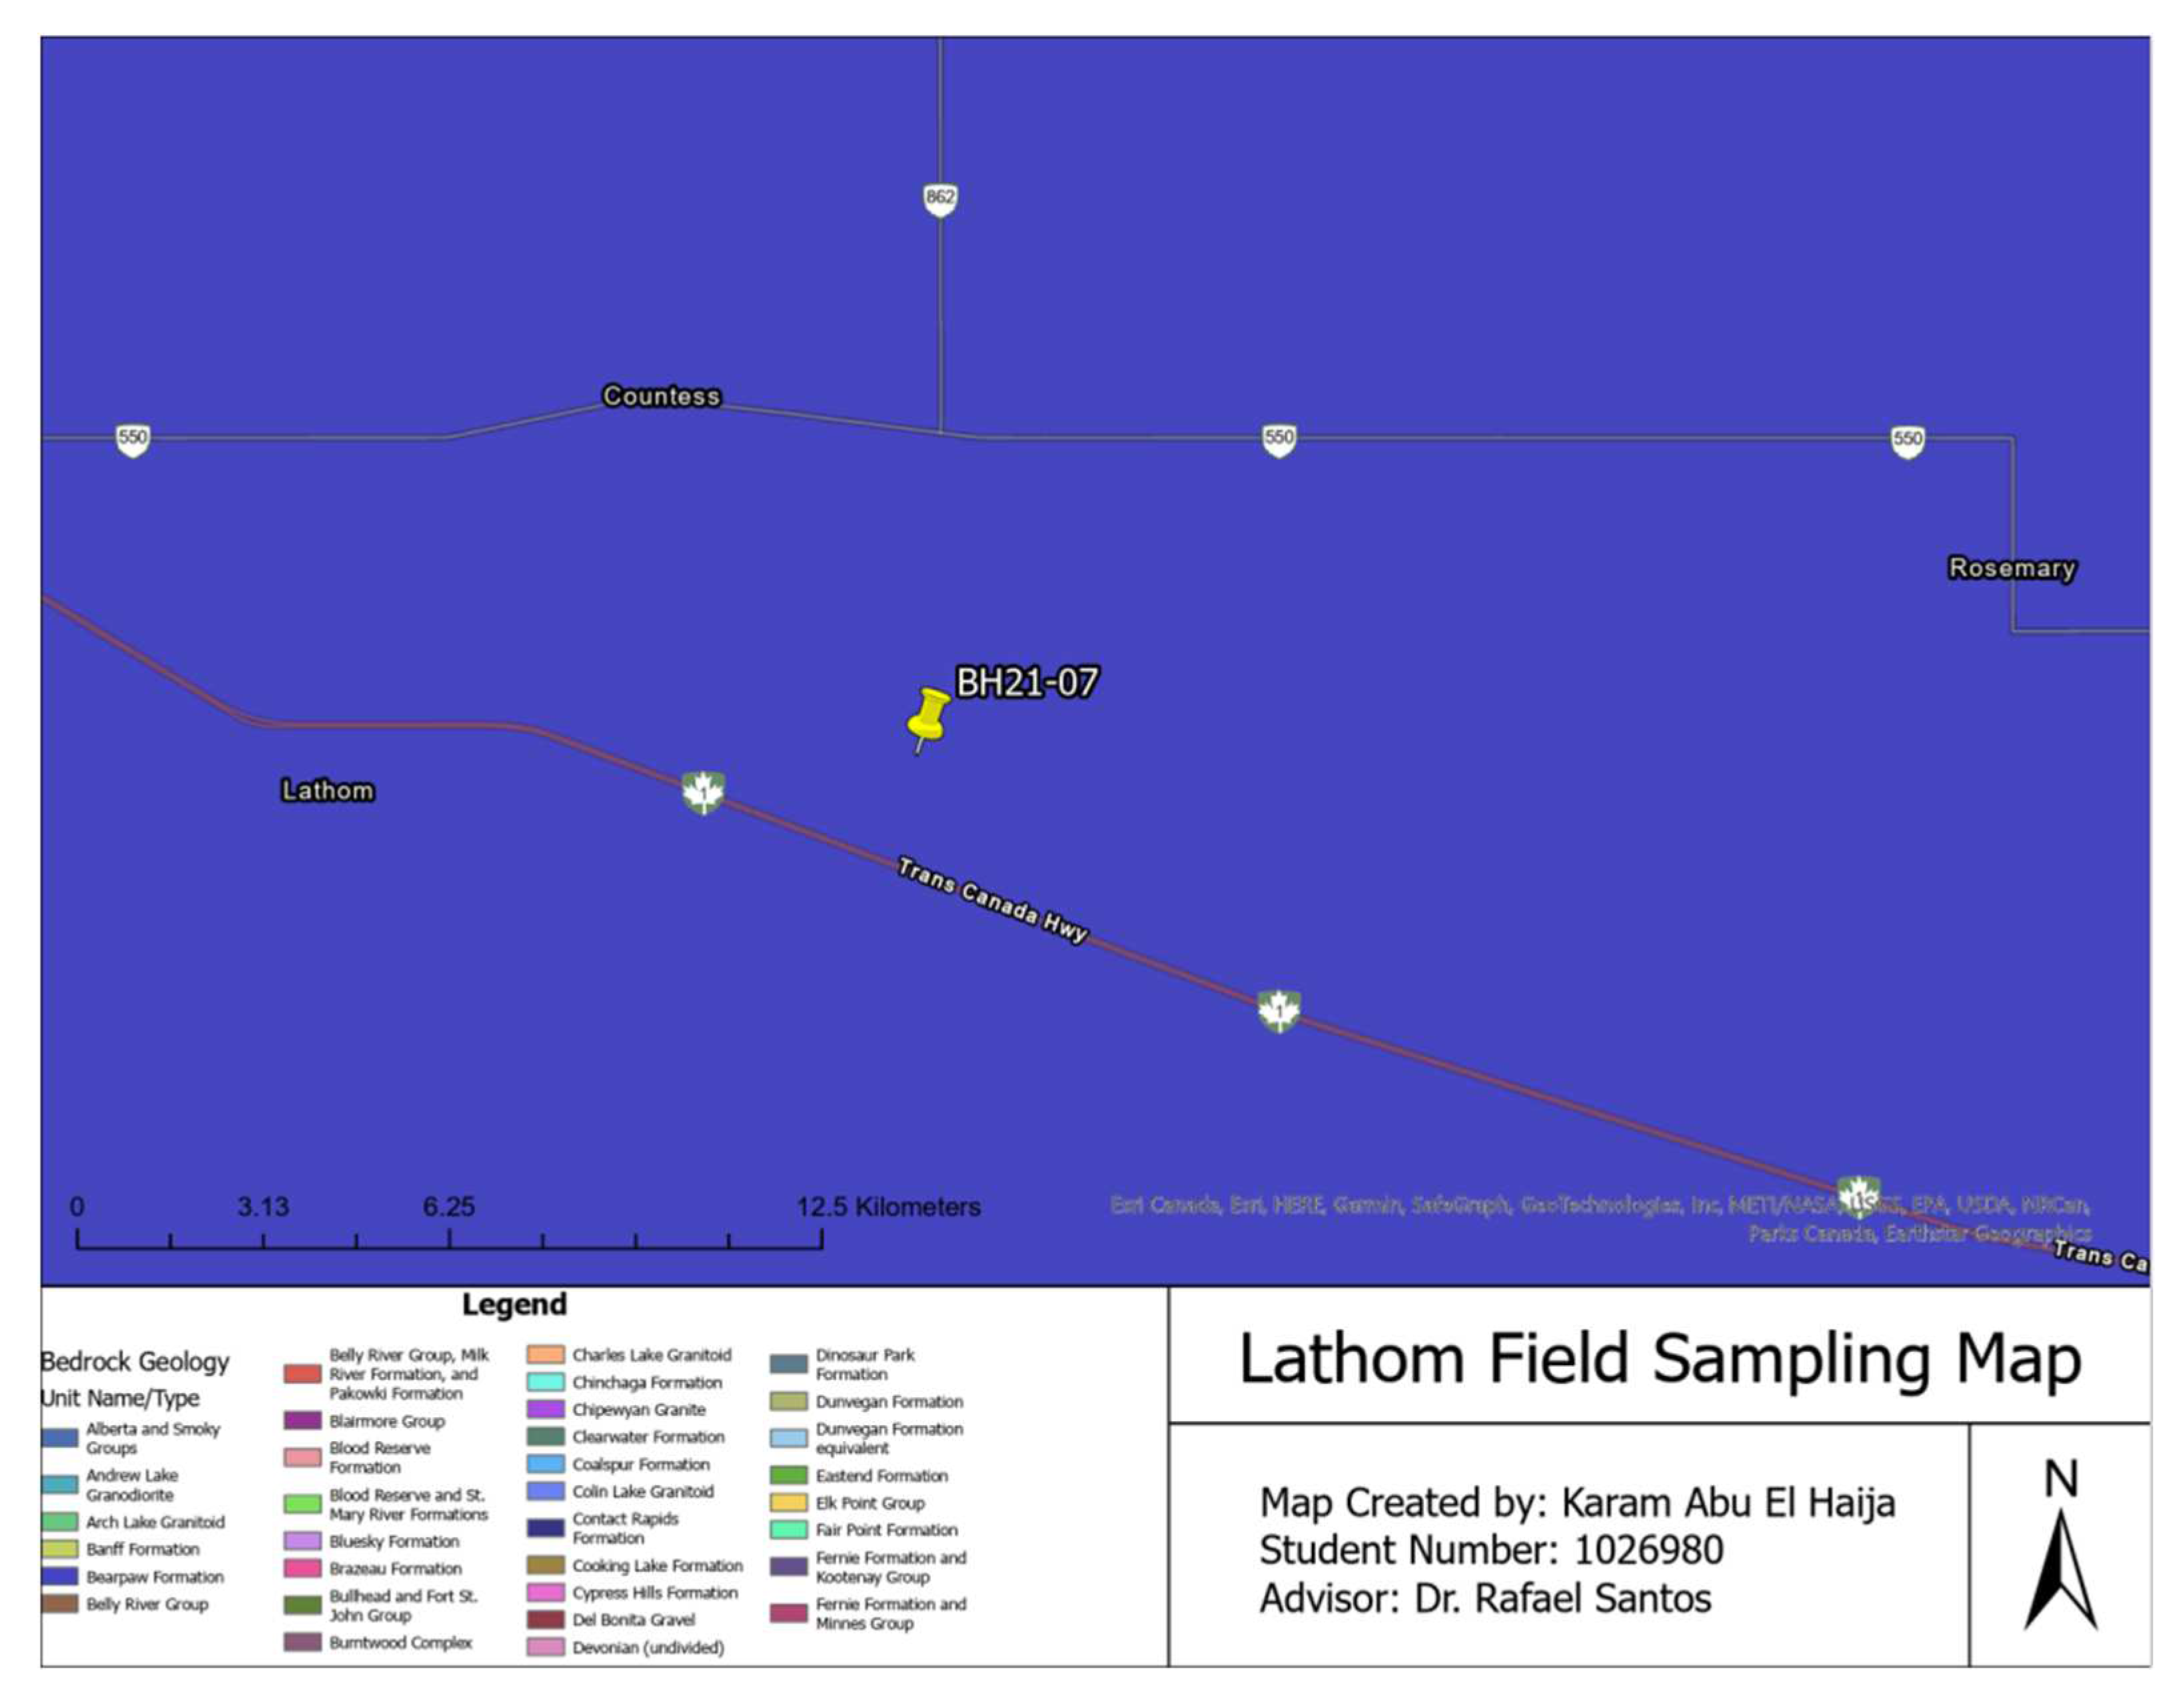
The Lathom, Alberta samples were taken from a solar farm construction site and some of the samples were sent to a third-party certified laboratory to undergo a sieve analysis.
Table 2 and
Table 3 summarize the sieve analysis results carried out by the research team and the certified laboratory.
Moreover,
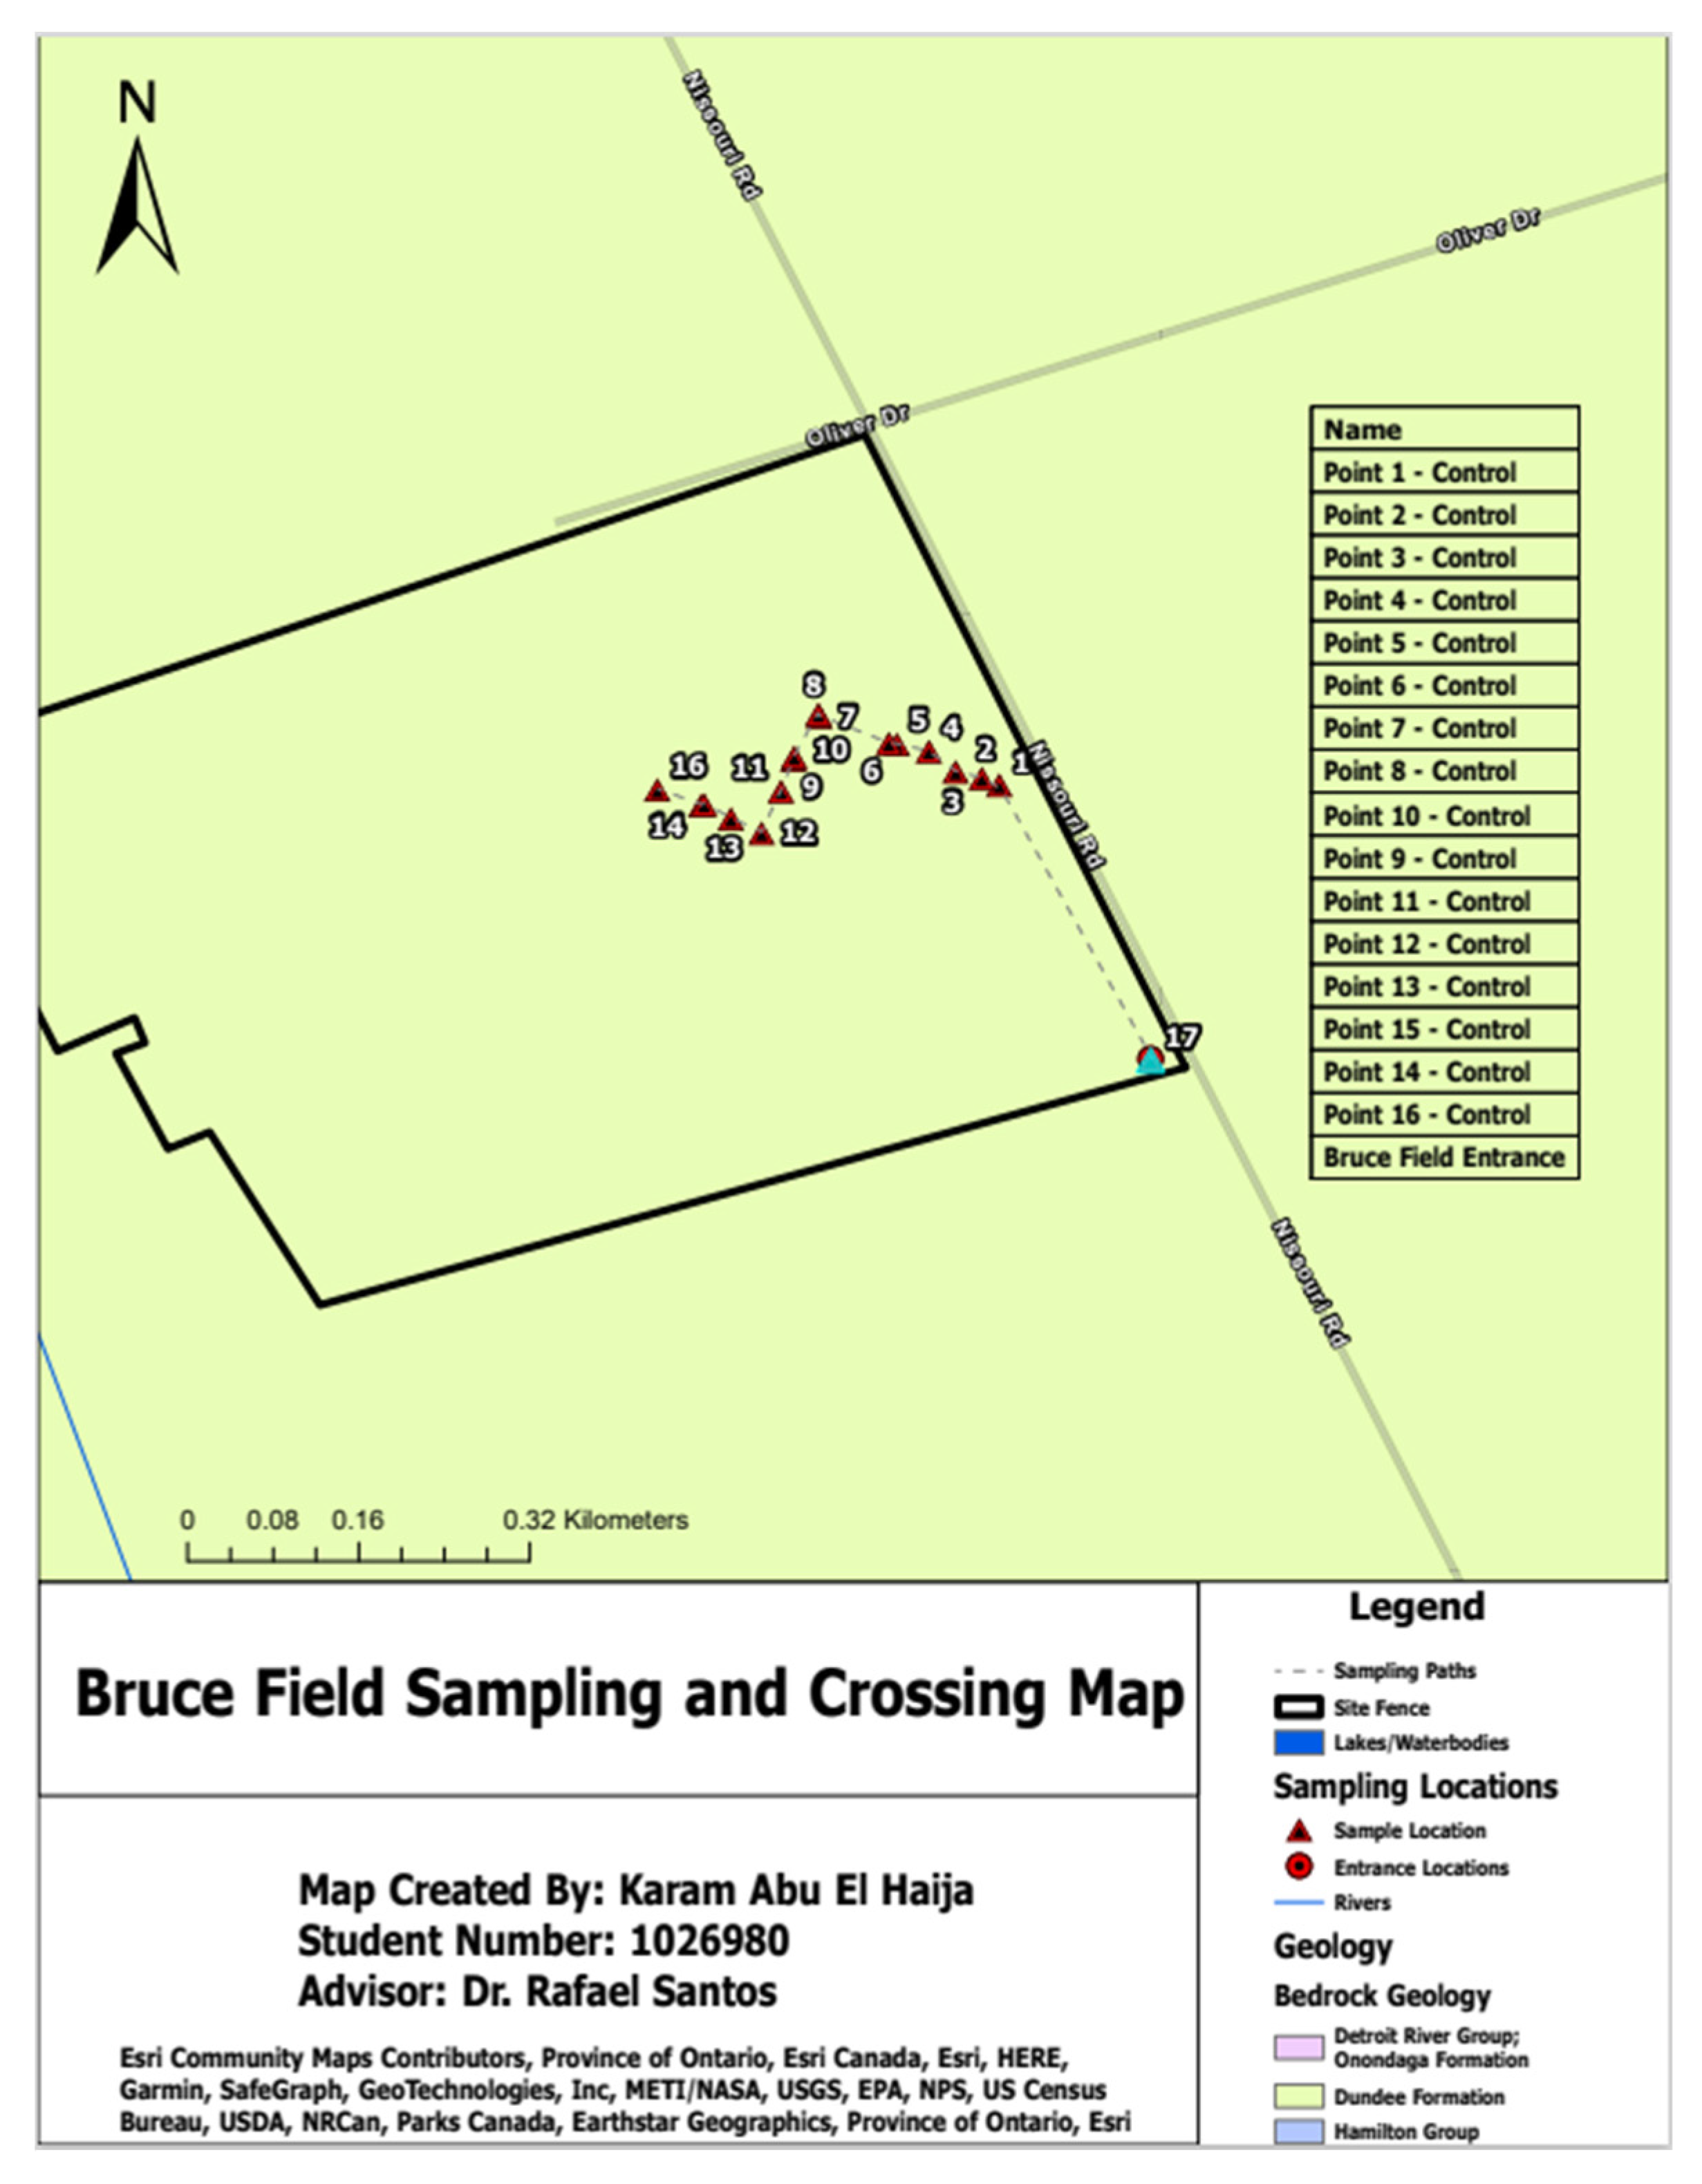
Table 4 below summarize the physical fractionation results of the samples collected from Bruce Field in London, Ontario. It should be noted that field was divided into two (2) zones based on the homogenous characteristics. The first zone is called the control zone and the second zone is called the wollastonite zone as wollastonite mineral was applied to that part of the field.
3.3. Loss on Ignition (LOI) Method
After confirming the validity of the sieve analysis, samples were assigned to the specific SOC determination methods. The first determination method is the loss on ignition method, and
Table 5 and
Table 6 provide an insight into the nature of the SOC content in these samples.
One striking result that can be noted from the above result is its investigation into variations in soil organic carbon (SOC) content depending on soil texture. Finer-grained materials, like clayey soils, showed greater SOC than coarser materials based on previous research which showed clay particles' increased capacity to protect organic matter and increase SOC [
25]. Furthermore, clay particles' high surface area and cation exchange capacity facilitate retention and stabilization of organic matter, ultimately contributing to higher SOC content.
3.4. Walkely-Black Method
On to the second method investigated in this project, the Walkley Black method was performed on the same three (3) samples and the results are summarized in
Table 7 below.
In addition to the previous observation, this study also demonstrated a decreasing trend of organic carbon with increasing soil depth. SOC content decreased as depth increased - an effect consistent with organic matter's accumulation near the soil surface before gradually decomposing with depth due to reduced input of organic material, increased decomposition rates and leaching processes [
31]. This finding highlights the significance of considering depth when assessing and managing SOC content as deeper layers may contain lower carbon stocks.
3.5. PeCOD Analysis
Lastly, the same three (3) samples were introduced to the PeCOD and
Table 8 below presents the COD value of each sample respectively.
The above results also demonstrated a direct relationship between Chemical Oxygen Demand (COD) and Soil Organic Carbon Content (SOC), measured using photocatalytic COD analyzer method used in this study and its results; higher COD values corresponded with greater organic carbon levels in soil samples. This suggests that photocatalytic COD analyzer is an accurate way of estimating SOC in soils - using UV radiation and photocatalyst photocatalysis technology, this technique has proven itself as fast and accurate way of measuring SOC in soils while correlation between COD and SOC dynamics further cement its effectiveness as assessing SOC dynamics in soils. The observed correlation between COD values and SOC dynamics further validates this method's validity and usefulness as tool in assessing SOC dynamics in soil samples. The identified relationships among soil texture, depth, COD content, and SOC content have profound ramifications for understanding SOC distribution and dynamics. Fine-grained soils with higher clay content should be recognized as potential carbon sinks while their decreasing trend suggests maintaining surface organic matter through suitable land management practices [
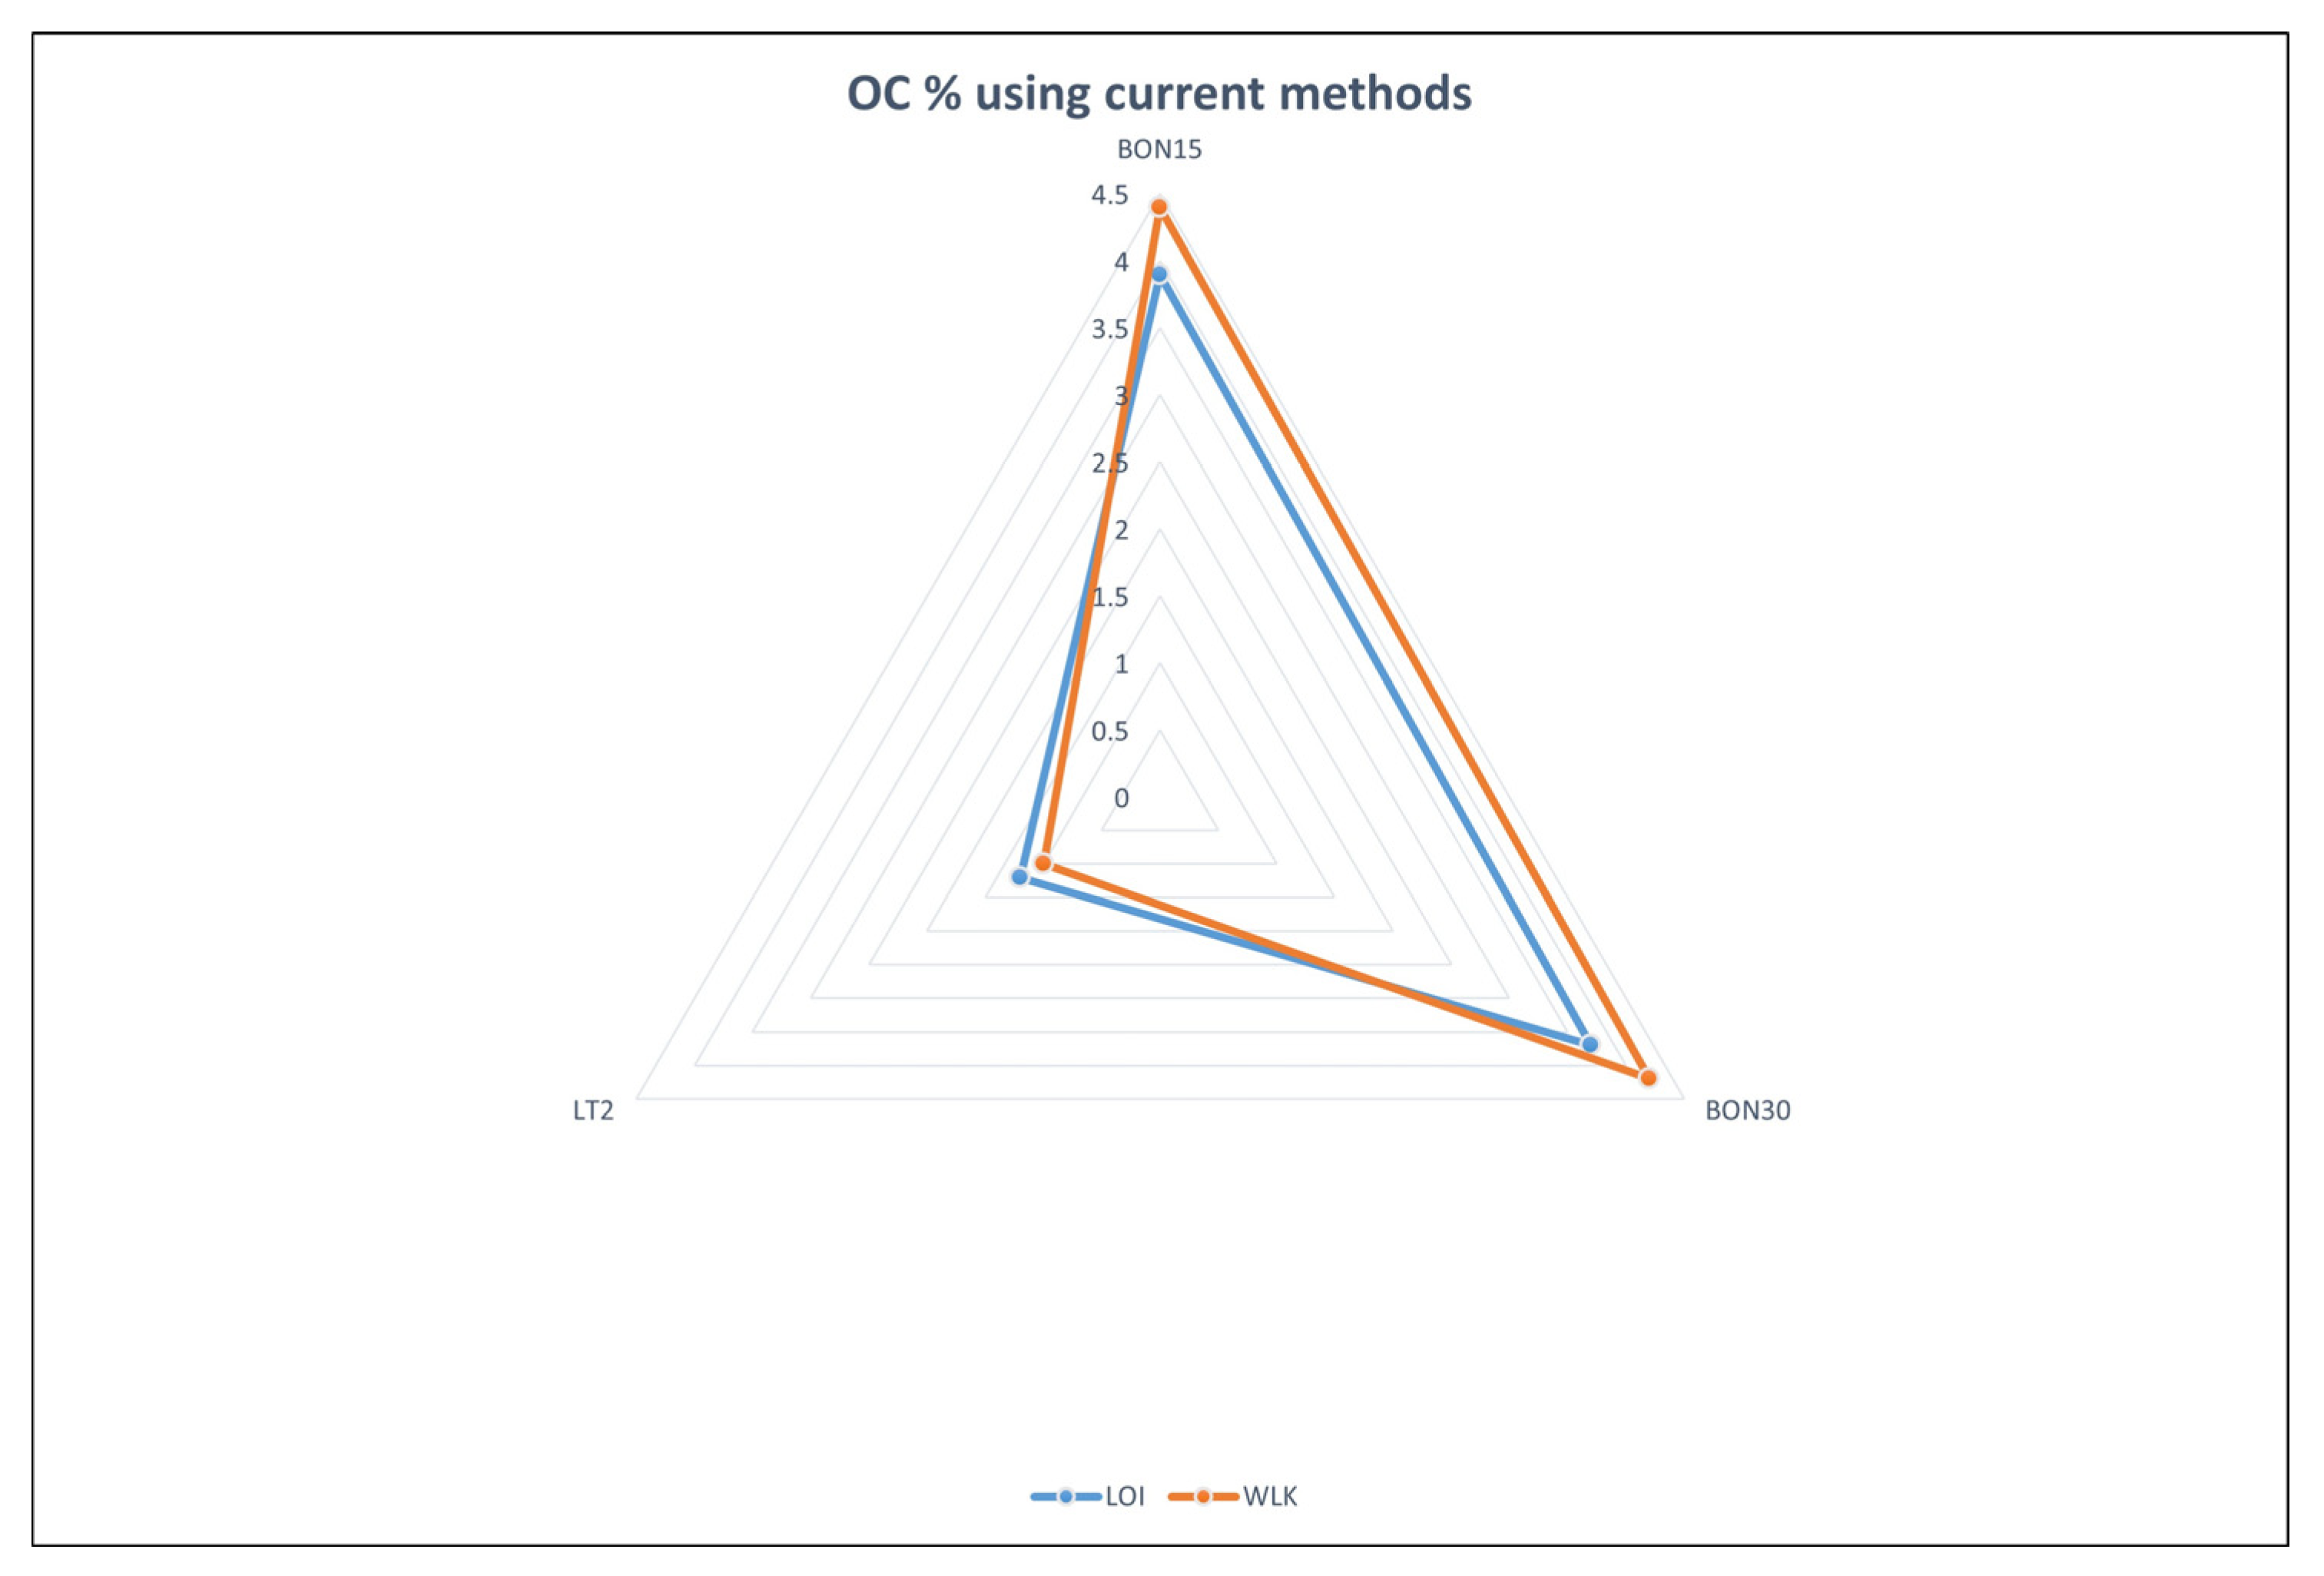
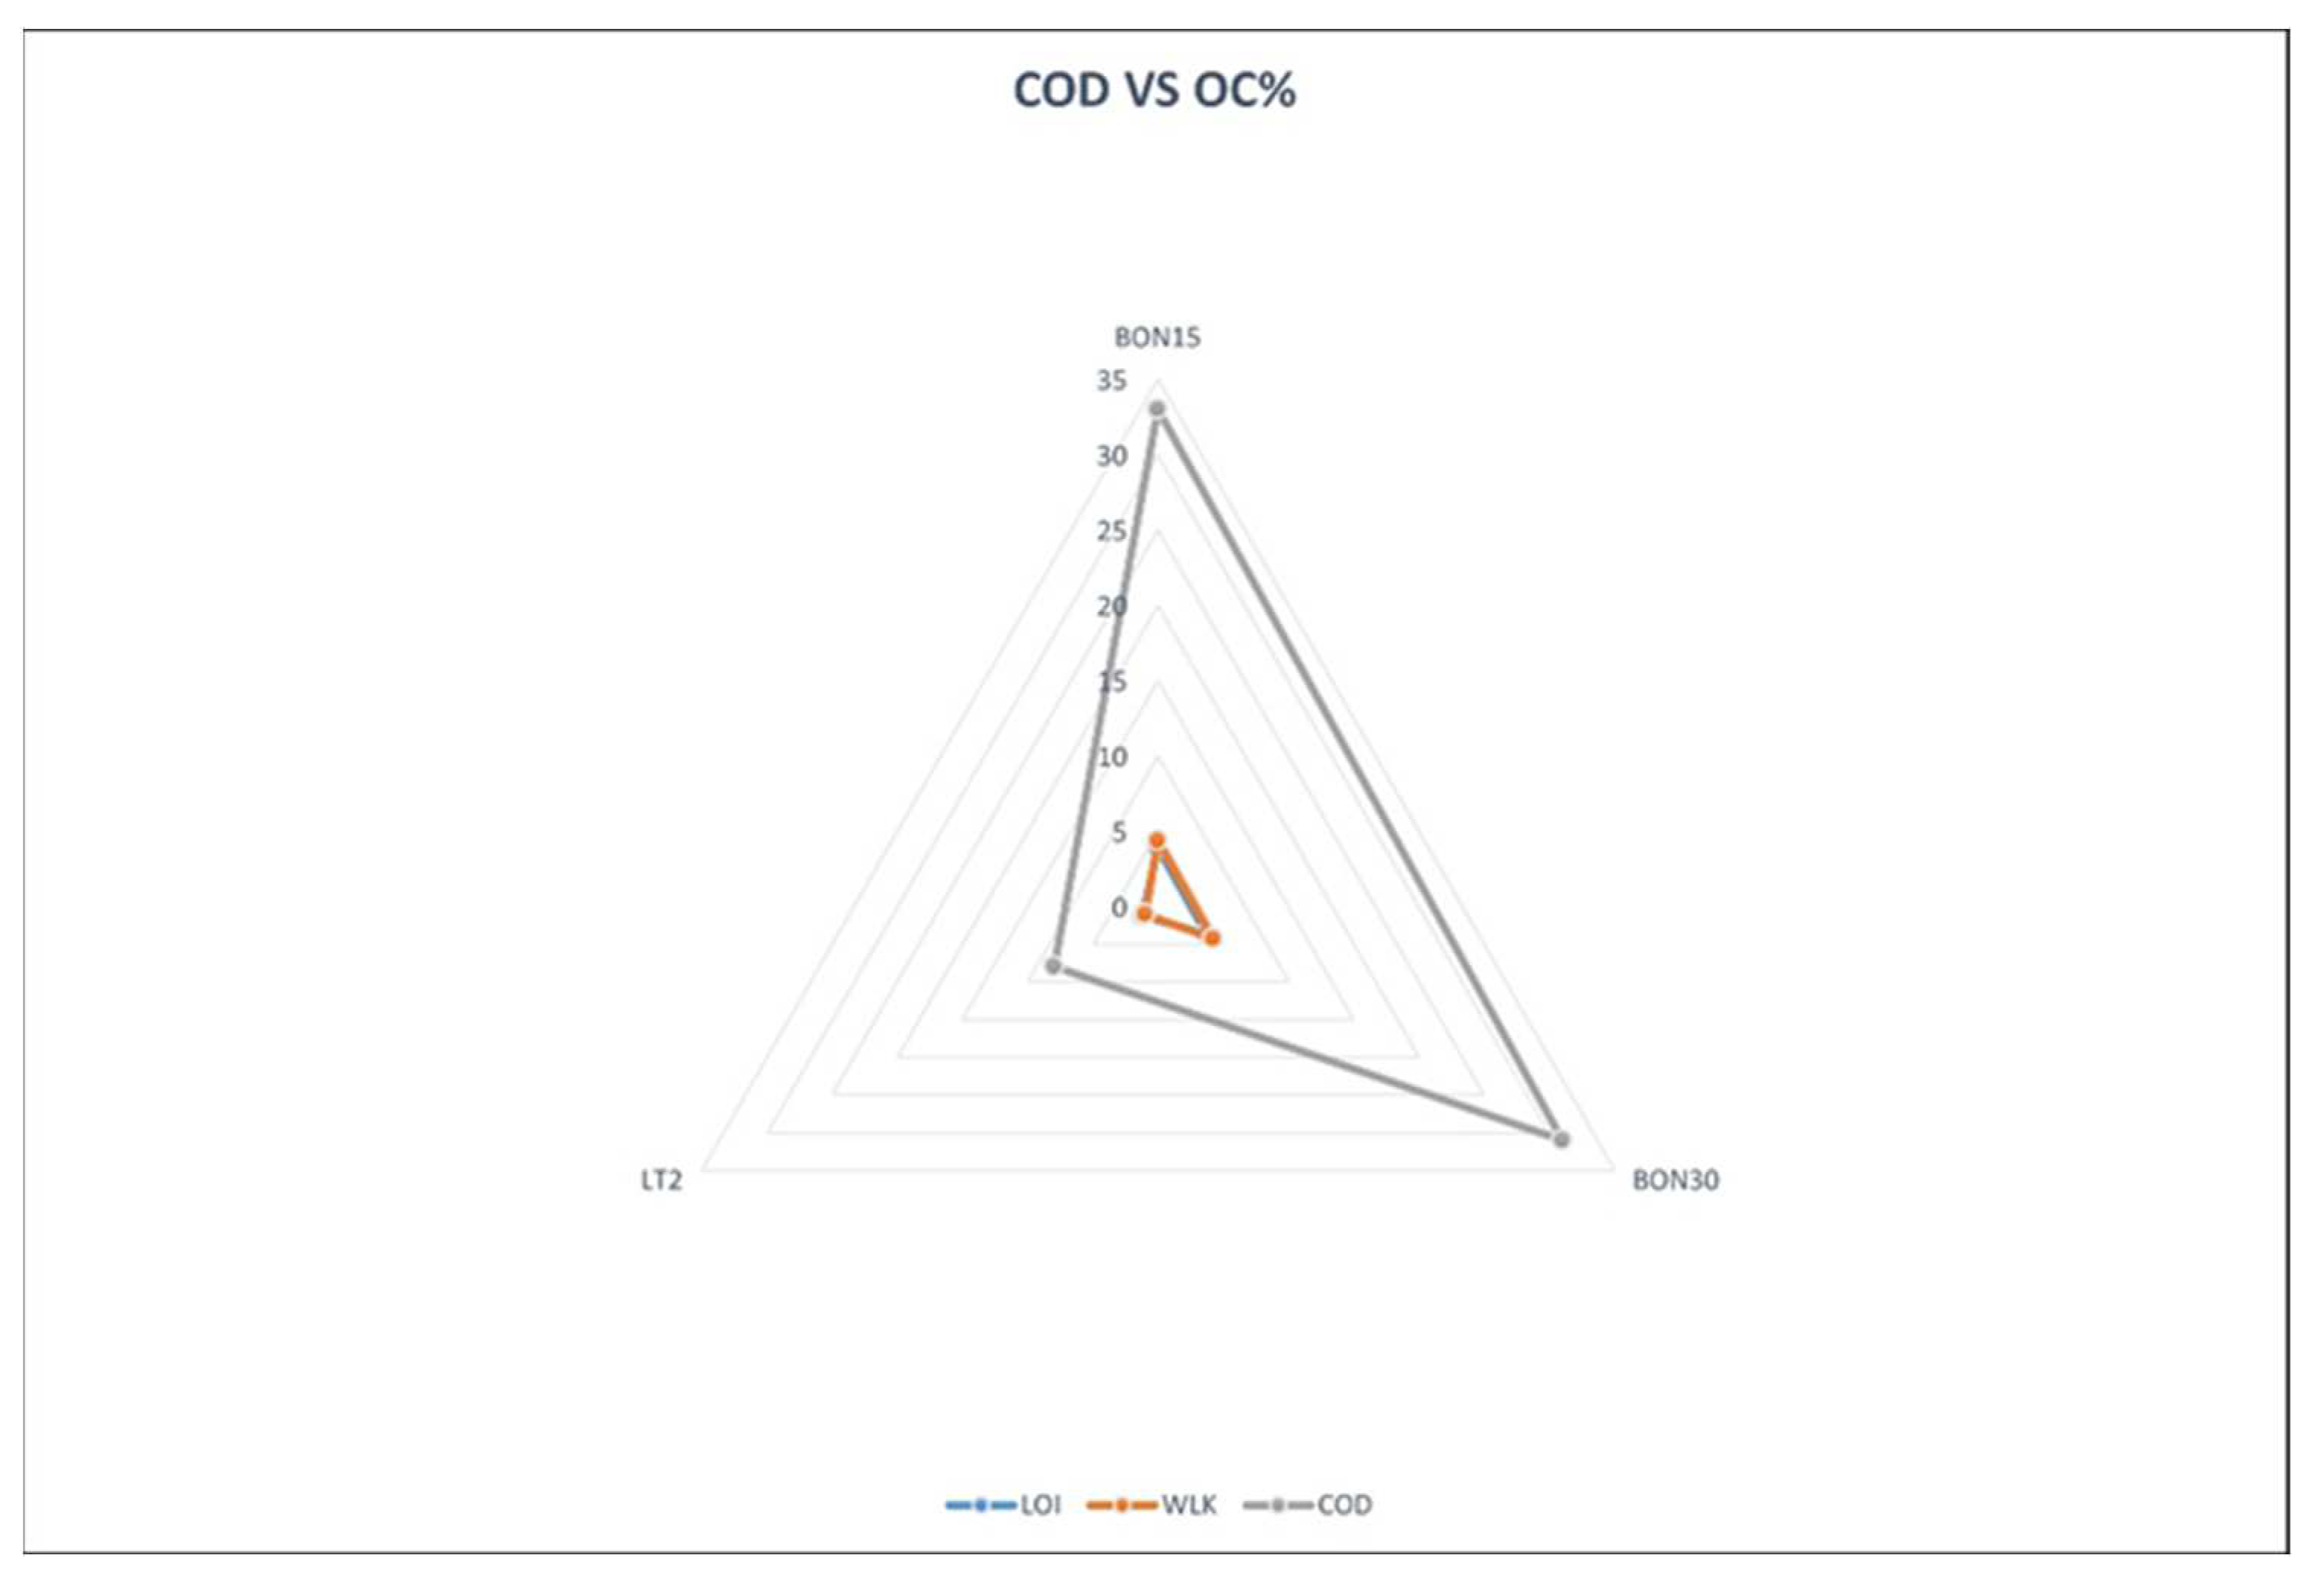
25]. To better visualize the applicability of the PeCOD to determine the organic carbon content in soils,
Figure 1 and
Figure 2 below illustrate the results of each method on a spider chart.
Even as the results provide invaluable insights, it is necessary to recognize certain limitations and sources of error in the study. One such limitation is its spatial scope which could impede generalizability; soil properties differ significantly across regions, climates and land use types requiring caution when extrapolating findings to larger contexts. Furthermore, variations in sampling techniques, laboratory methods and calibration procedures may introduce uncertainties that affect measurements accuracy which must be accounted for as standardization and quality control in subsequent research efforts. The research time identified one other limitation for this technique, which is exclusivity of the analysis. The PeCOD generally analyzes the samples by comparing them to calibration standard sorbitol solution of a concentration of 120 mg/L.
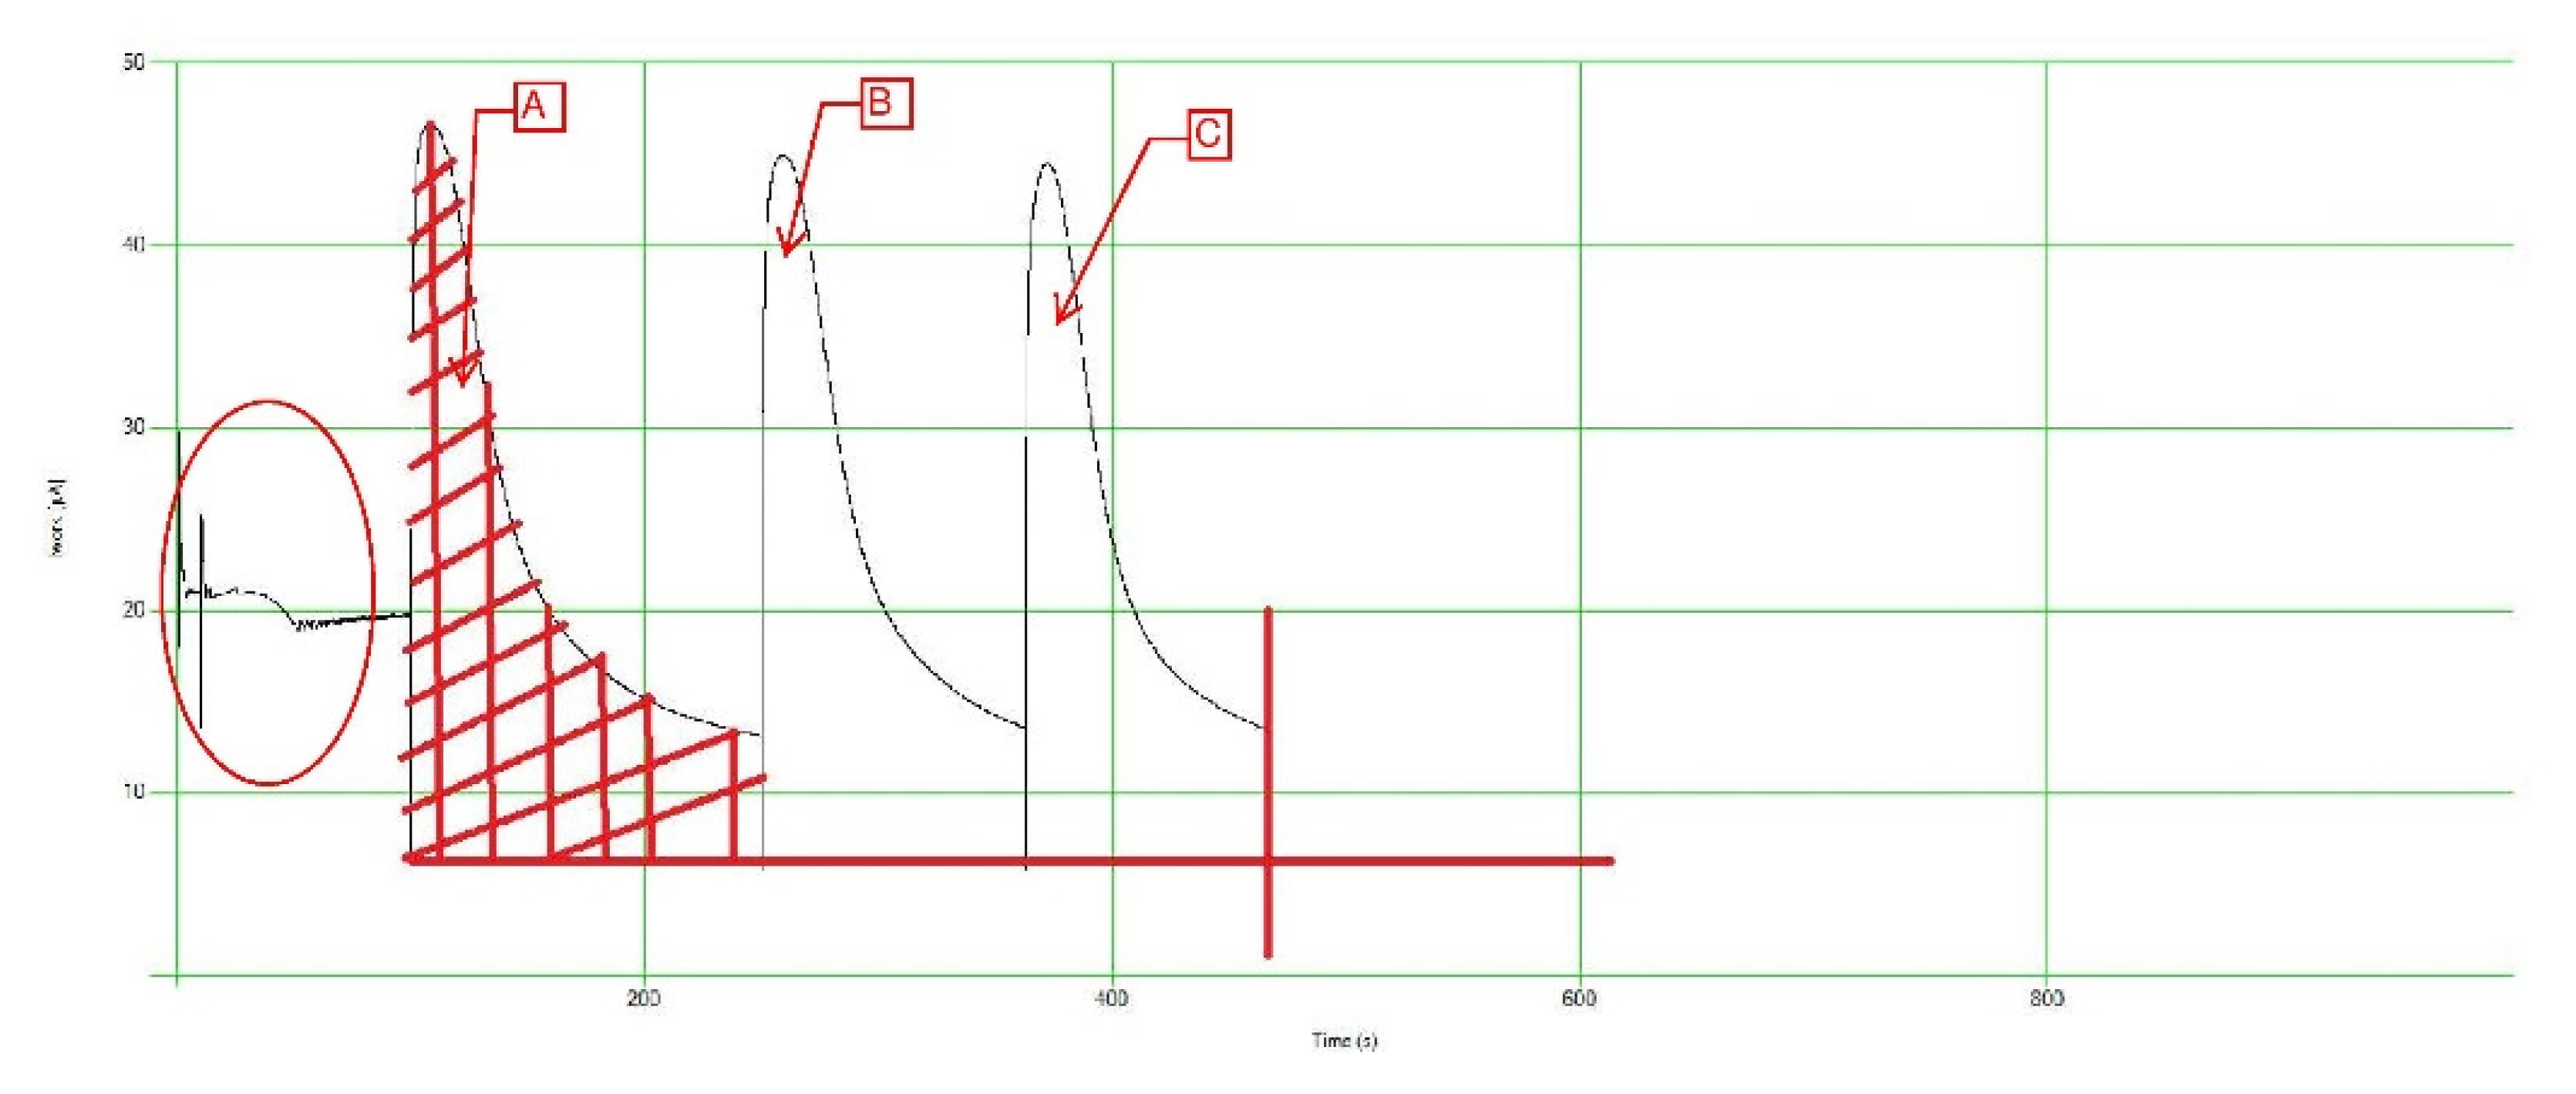
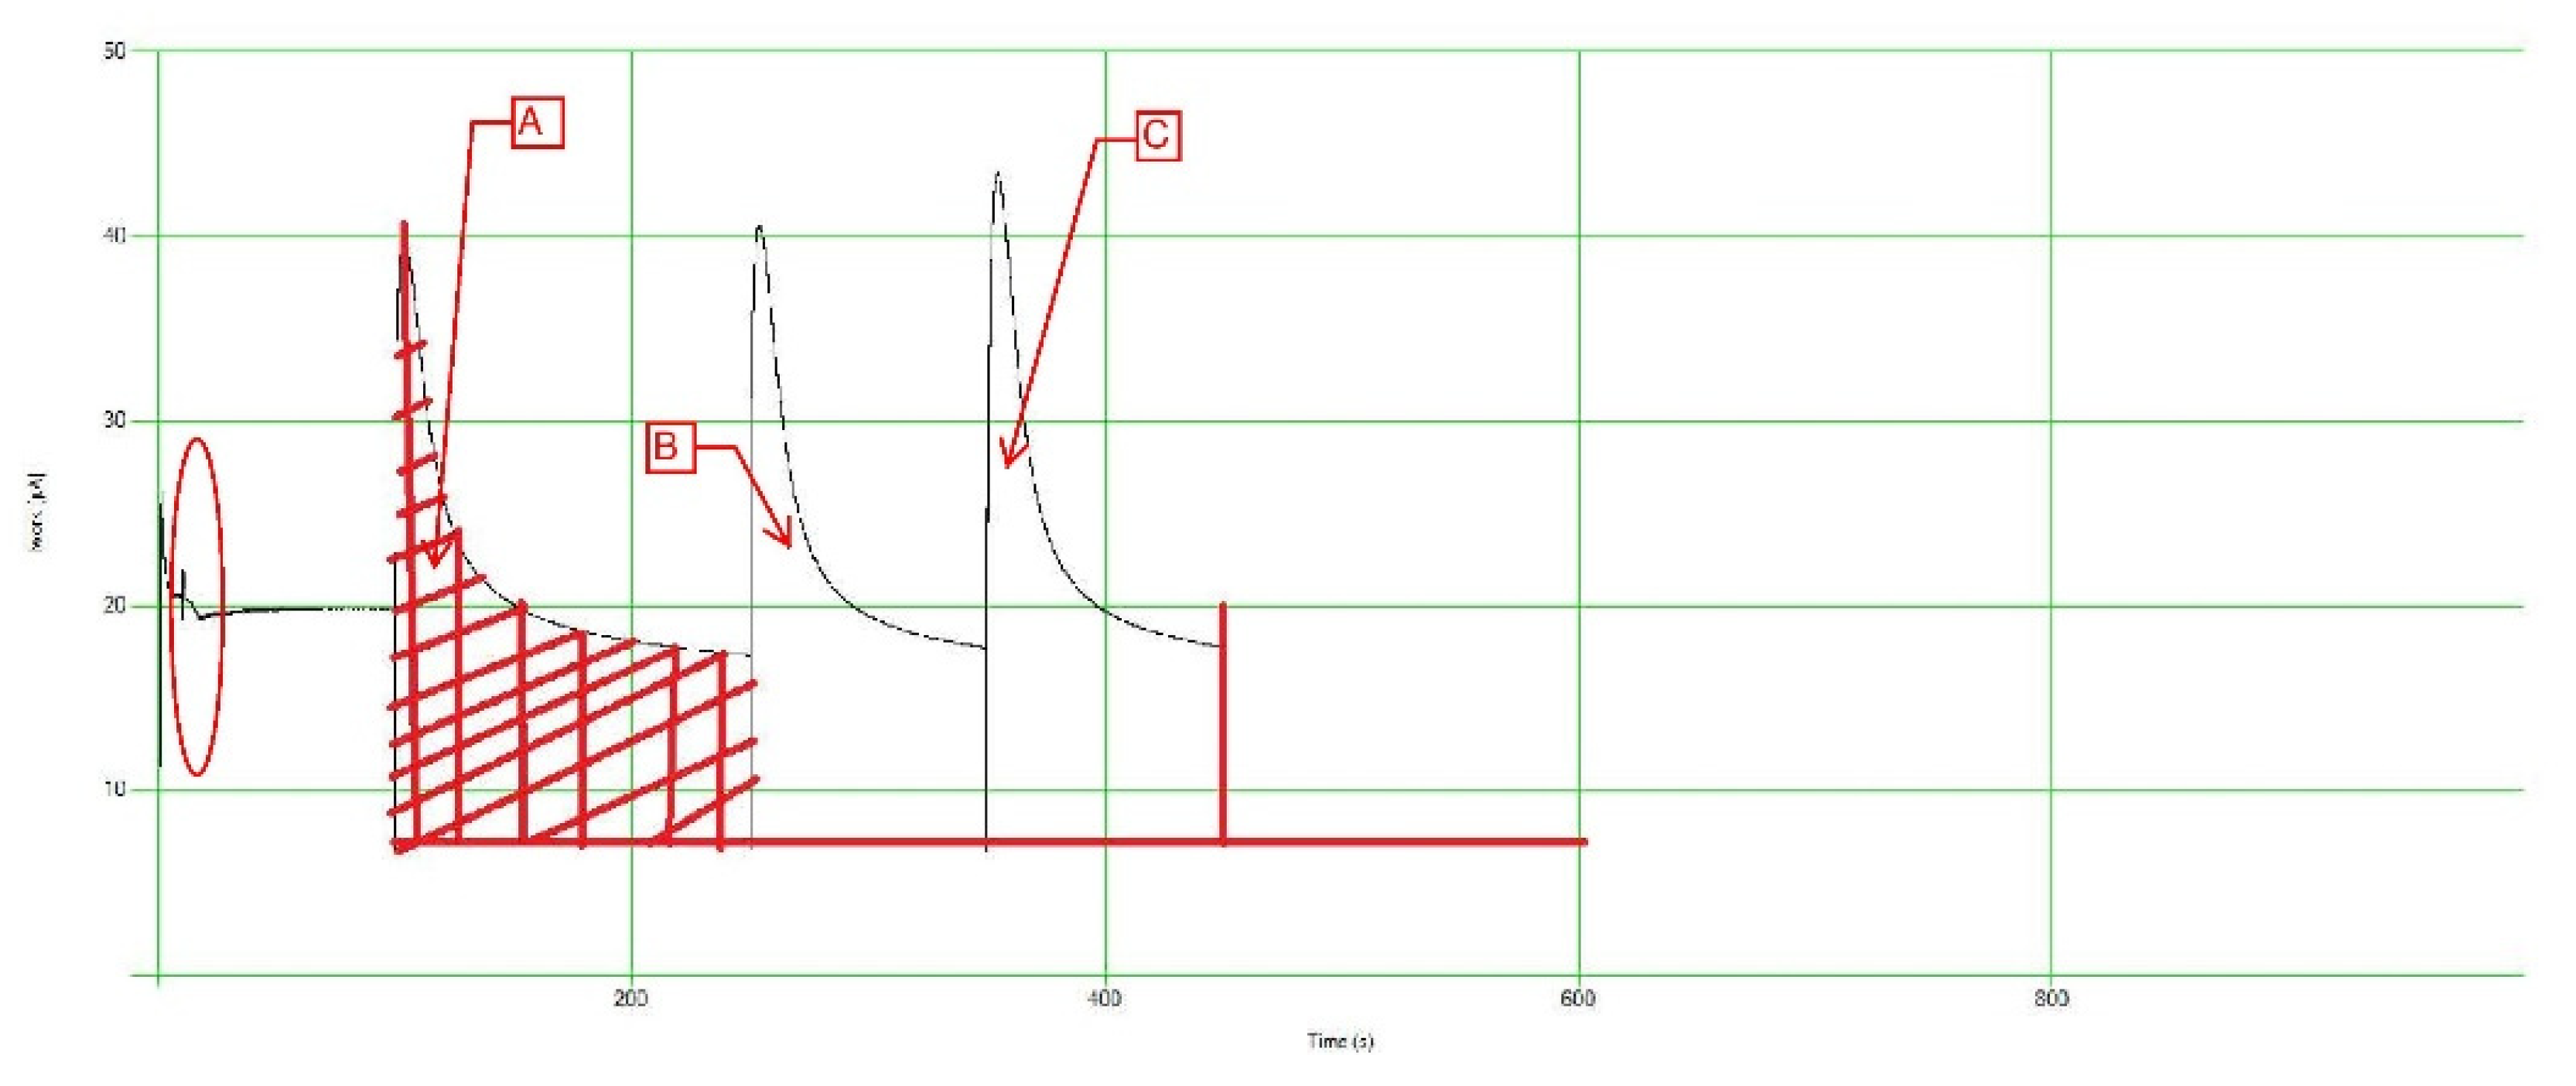
The team took one step further and prepared various standard solutions using different salts and acids, such as Tannic and Humic acids. The standard solutions were created at varying concentrations ranging from 60 mg/L up to 180 mg/L. The main purpose of those solutions is to understand the different interactions and correlations that could occur when using the PeCOD. The team was looking for a link between a certain standard solution and a certain soil type/texture. To understand the standard solutions interactions in the PeCOD, the team investigated the Work V.S Time graph produced by the PeCOD during calibration.
Figure 3,
Figure 4 and
Figure 5 illustrate some of those graphs.
The areas below the curves (A, B, and C) represent the COD value for the calibrant and sample solutions inserted in the PeCOD. Areas A & B represent the calibrant and C represents the sample solution. The team examined the different curves produced by the different standard calibrant solutions to identify the most suitable solutions for the different soil textures/types. Out of the above graphs, it was noted that the Humic Acid solution is most suitable for sandy soils due to the relatively lower SOC content. The team will continue to explore different solutions using different salts/acids to ensure that a reasonable and reliable match is made during the potential field/industry application. The red circle prior to the three (3) curves marks the “normalization” phase of the PeCOD operation procedure. The normalization phase involves the samples being taken into the reaction vessel and exposed to the UV oxidizing power.
3.6. Geographic Information System (GIS)
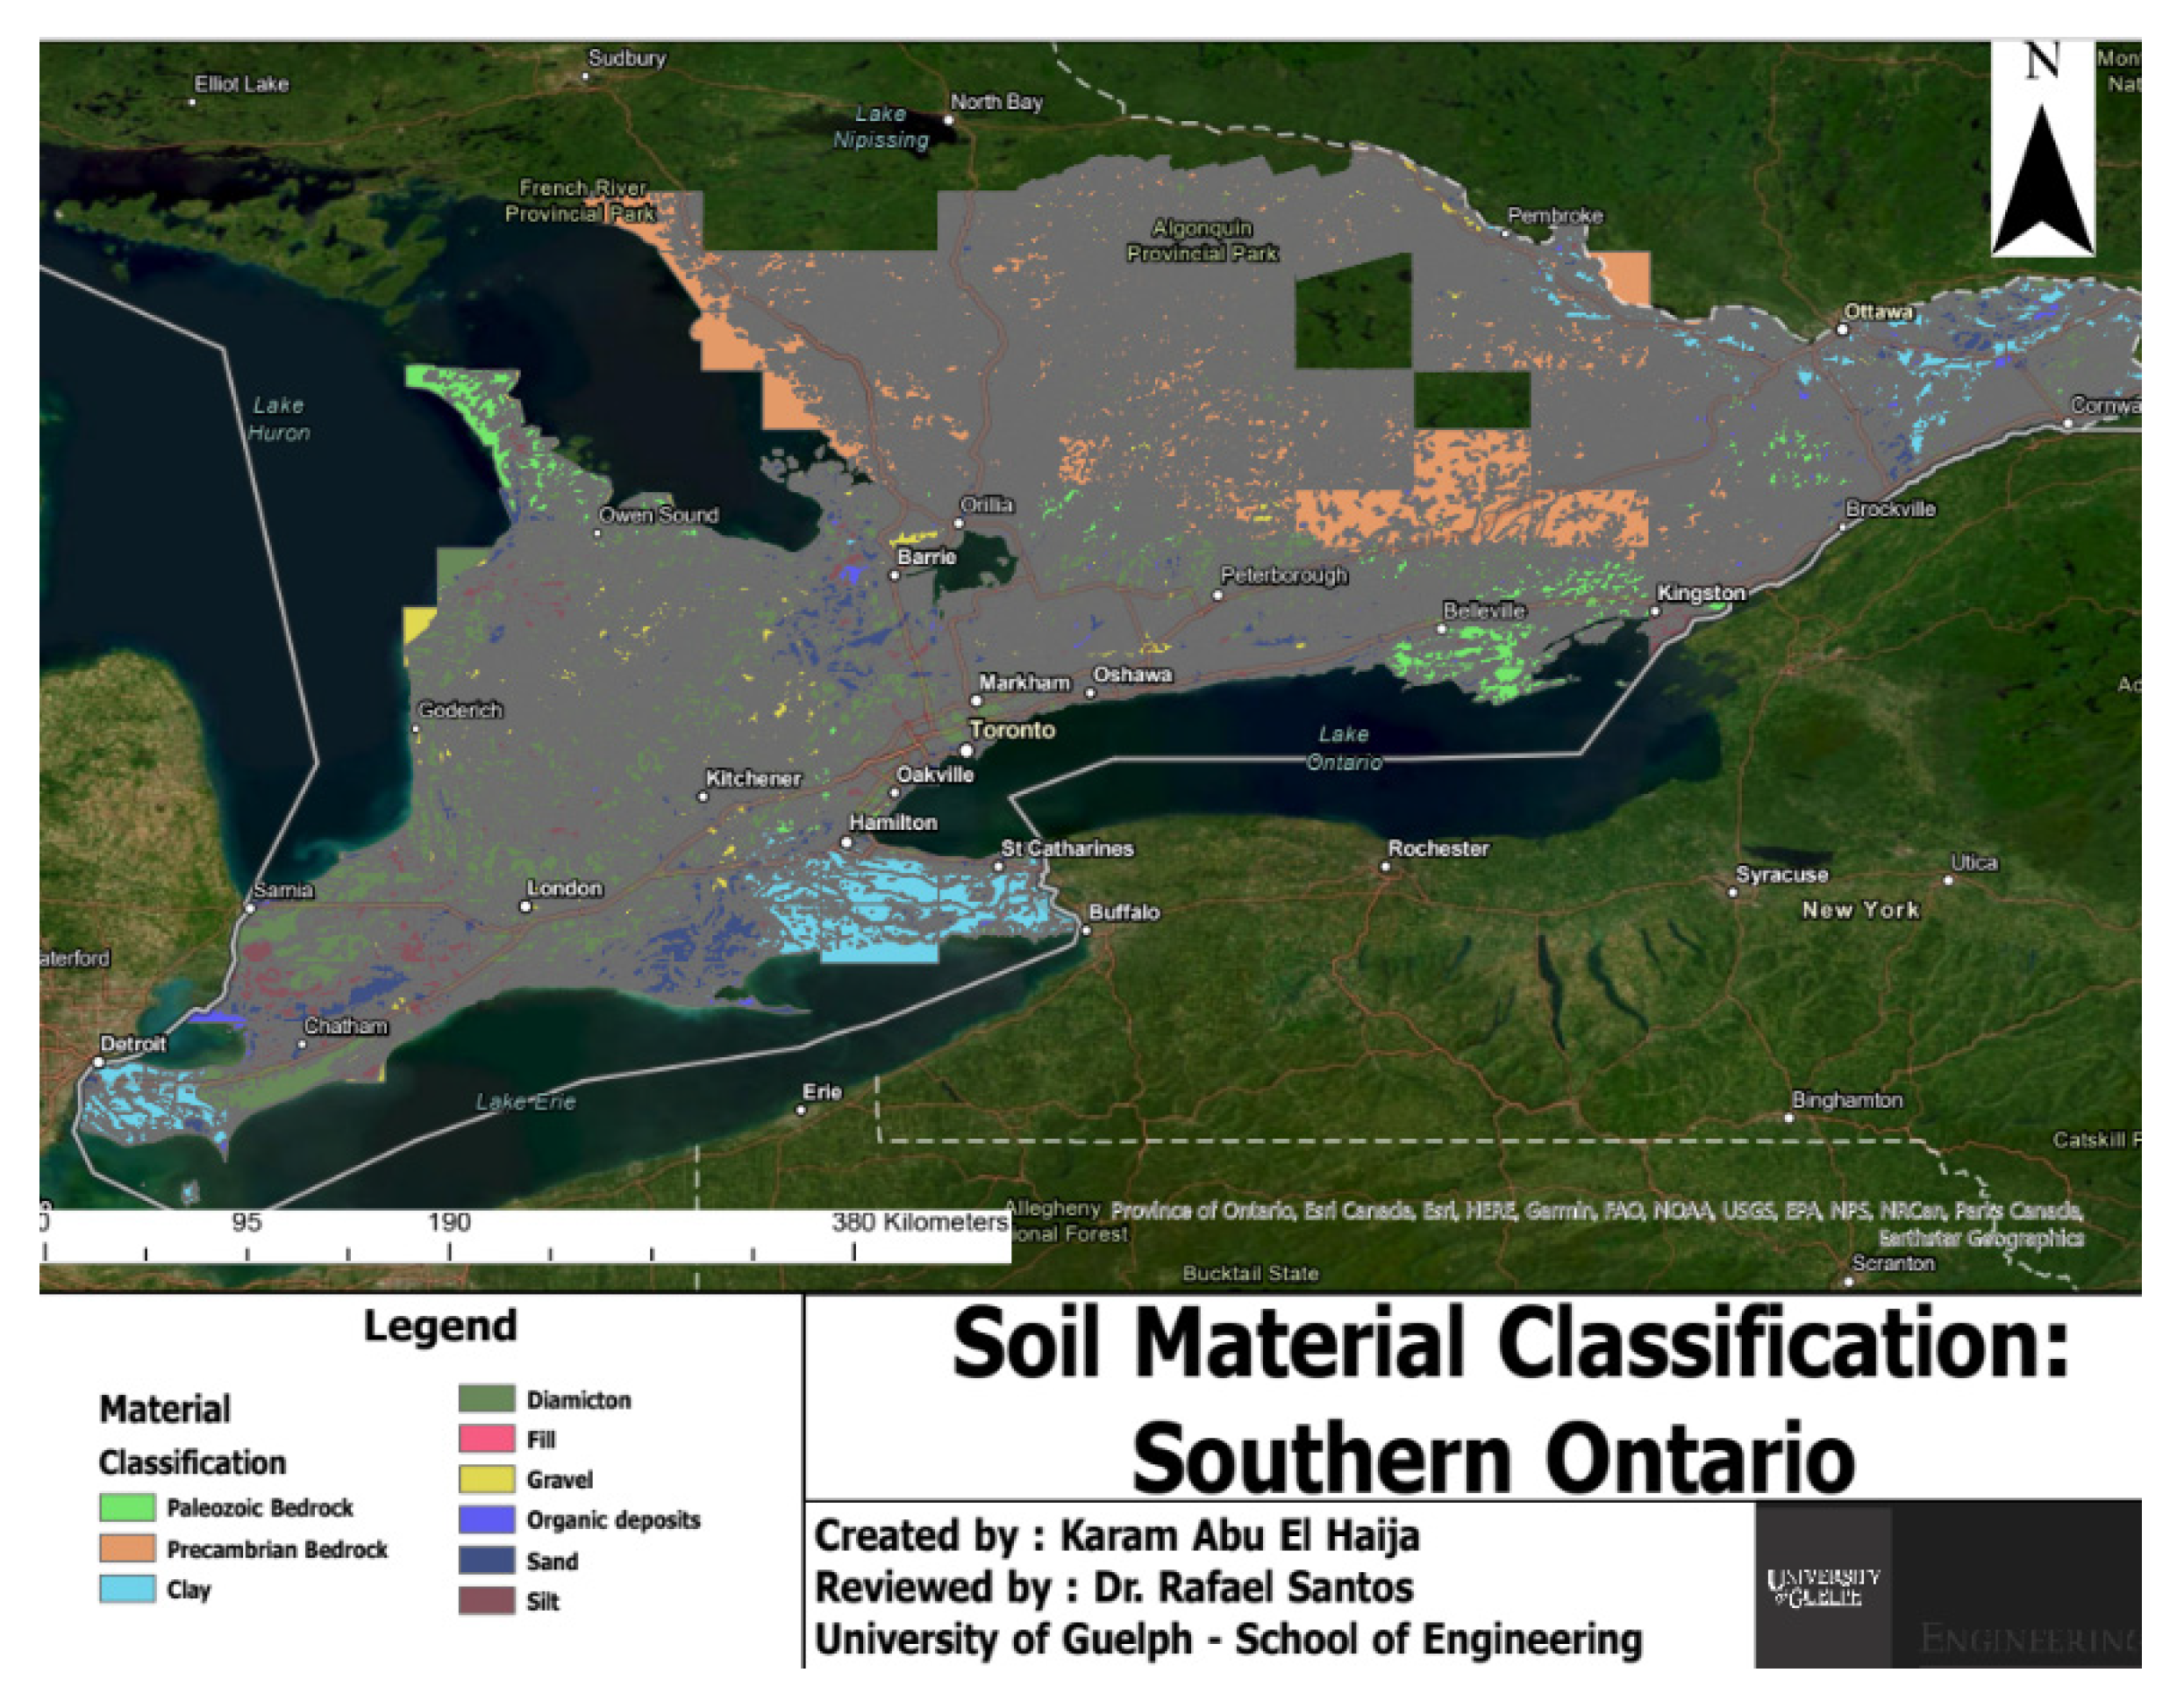
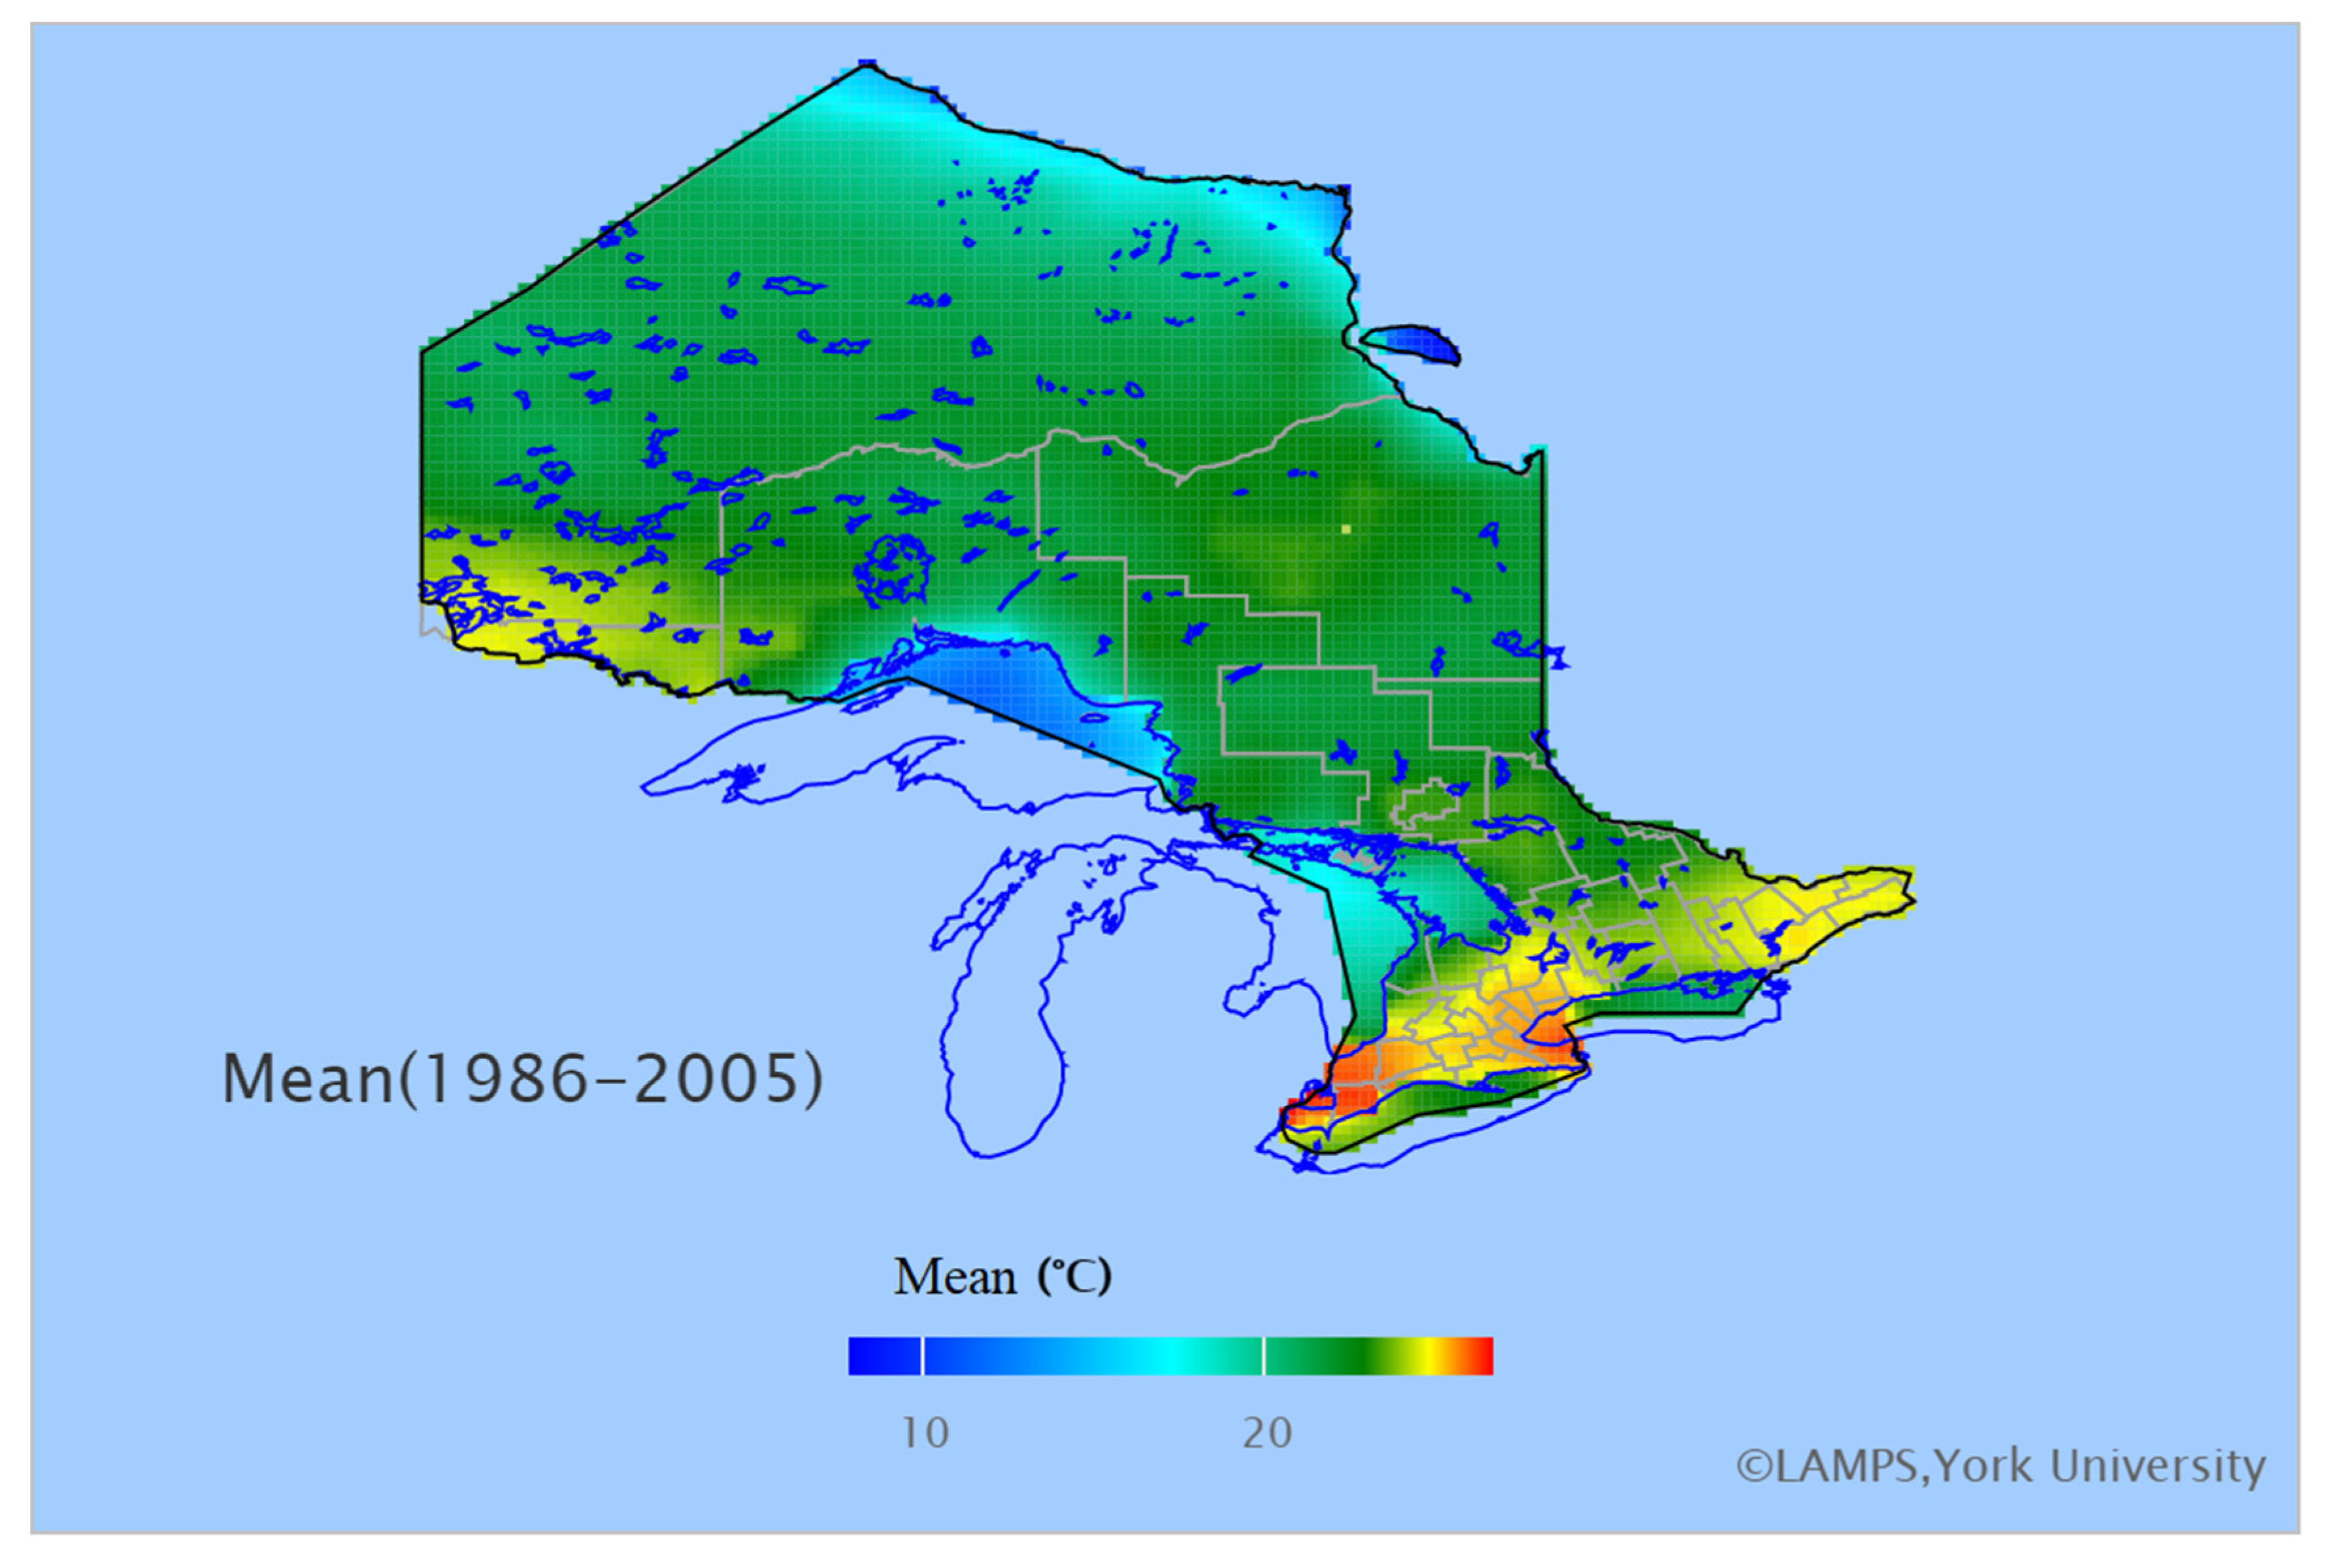
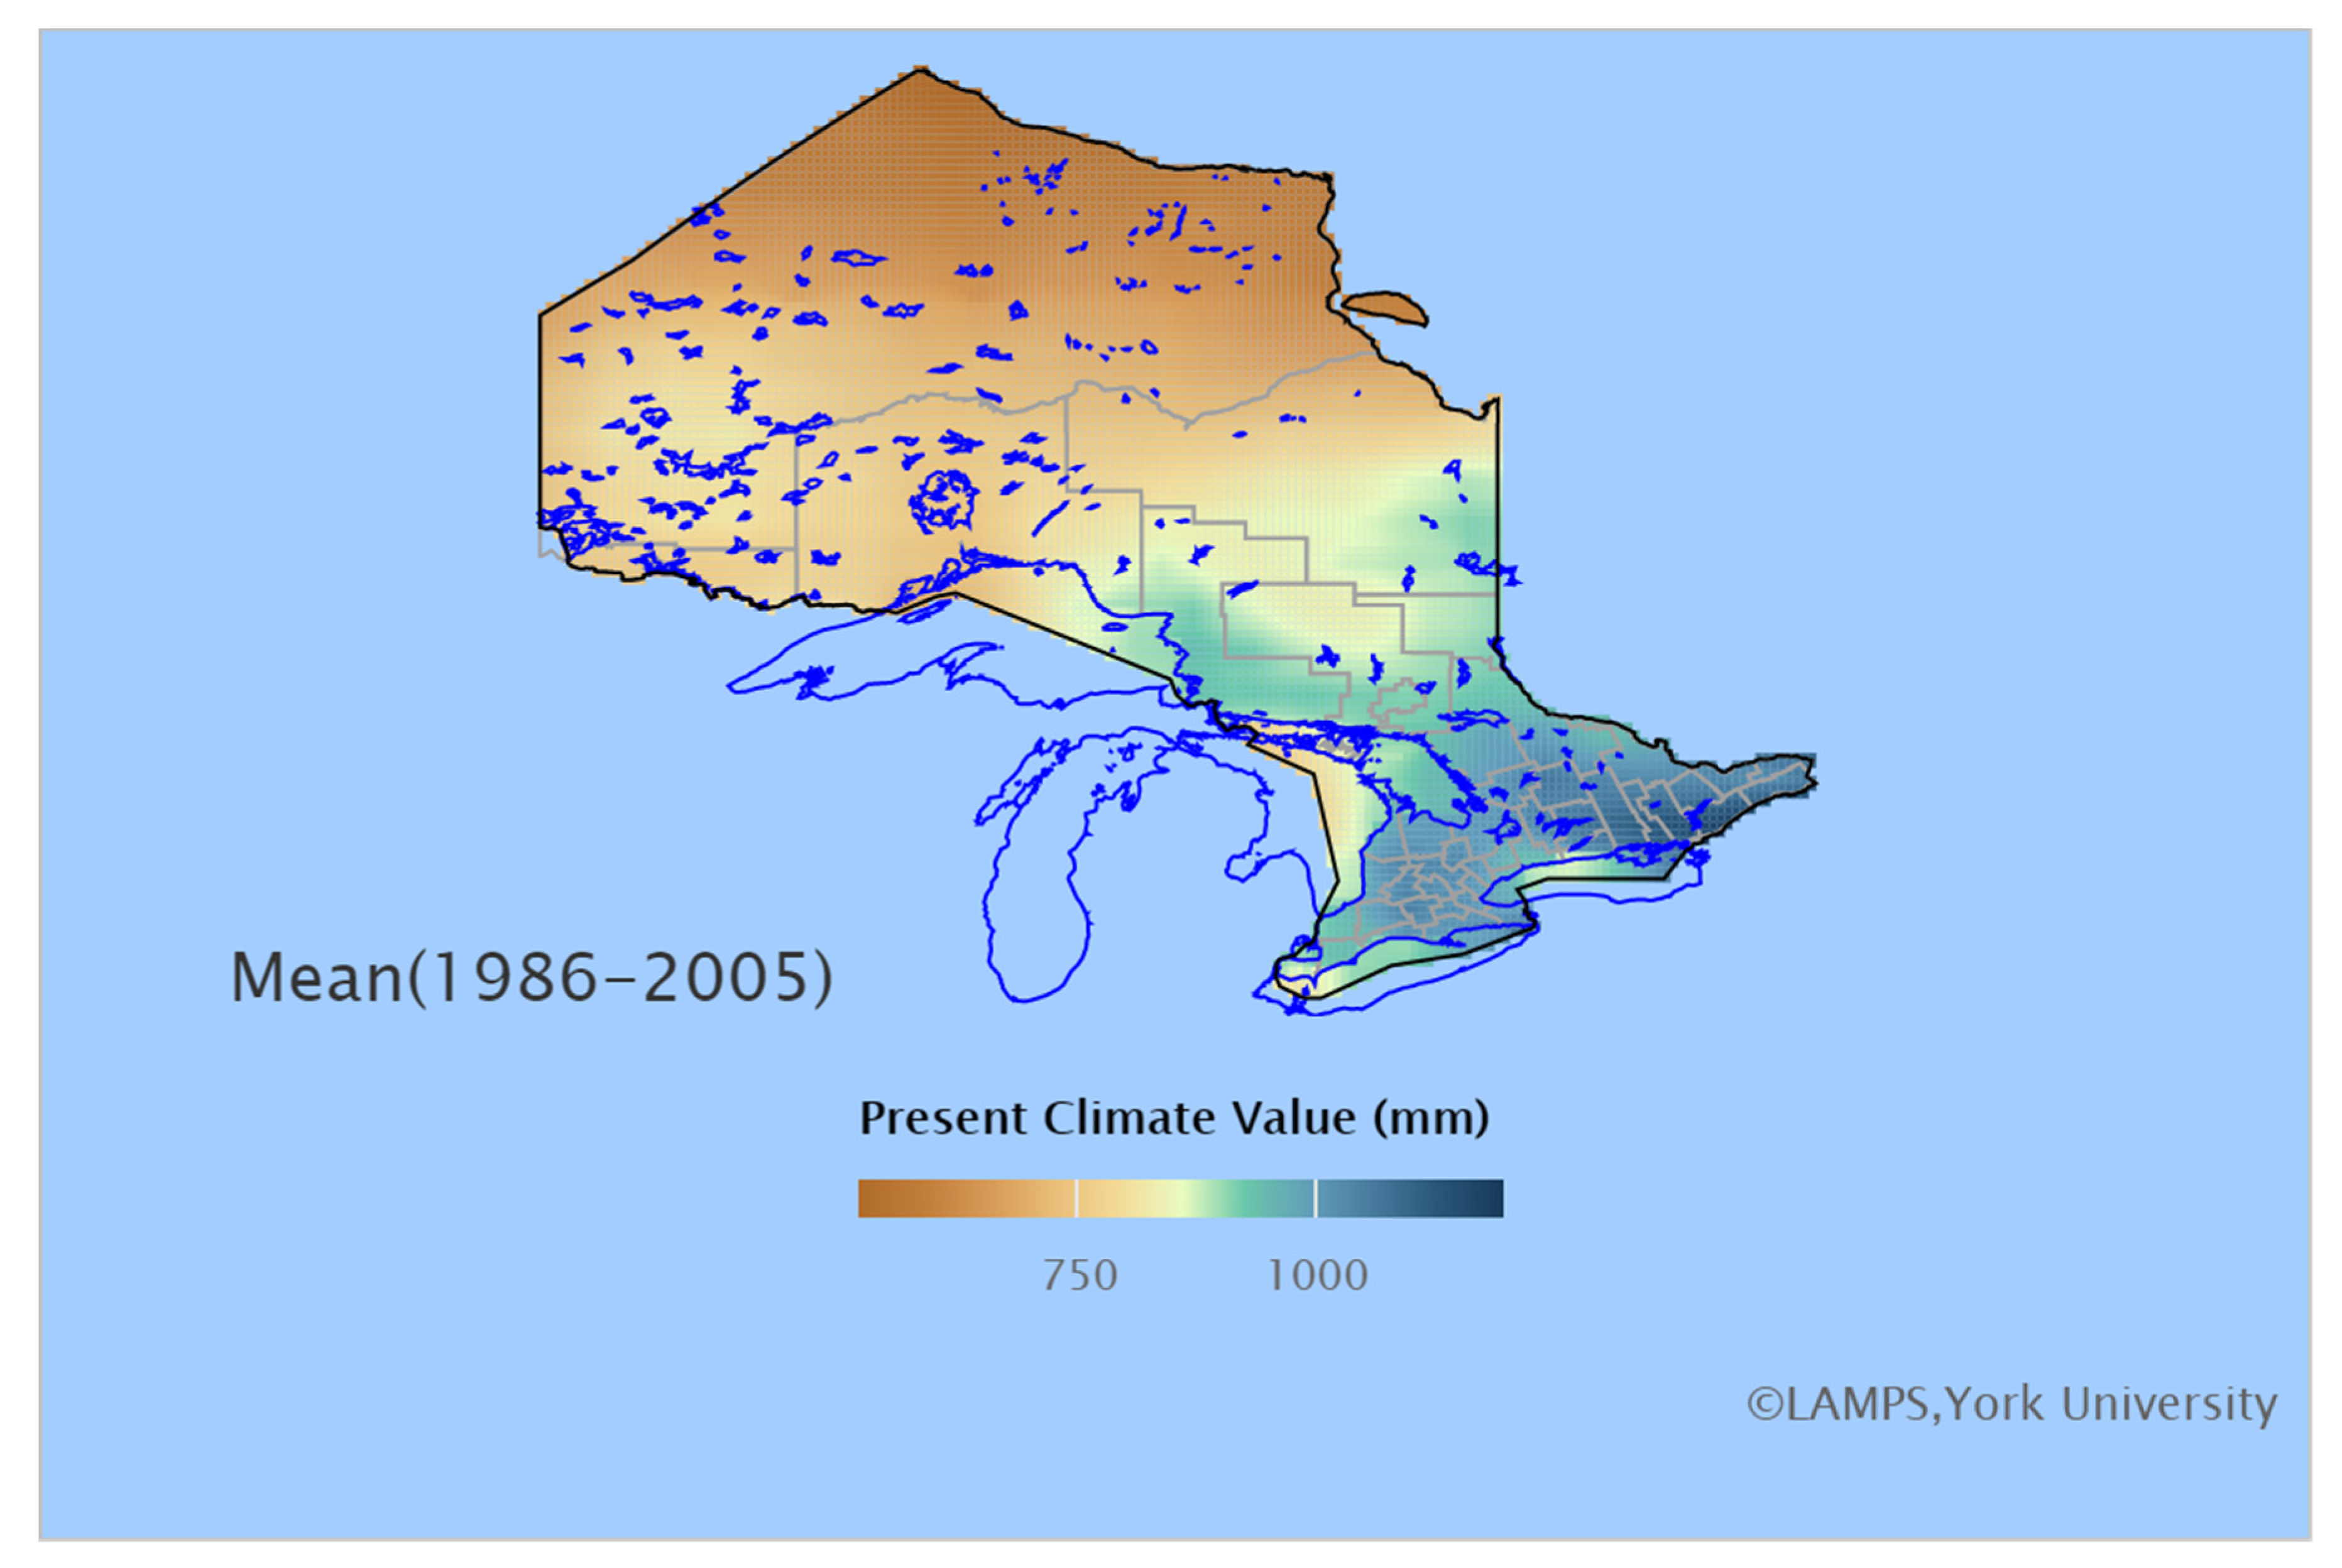
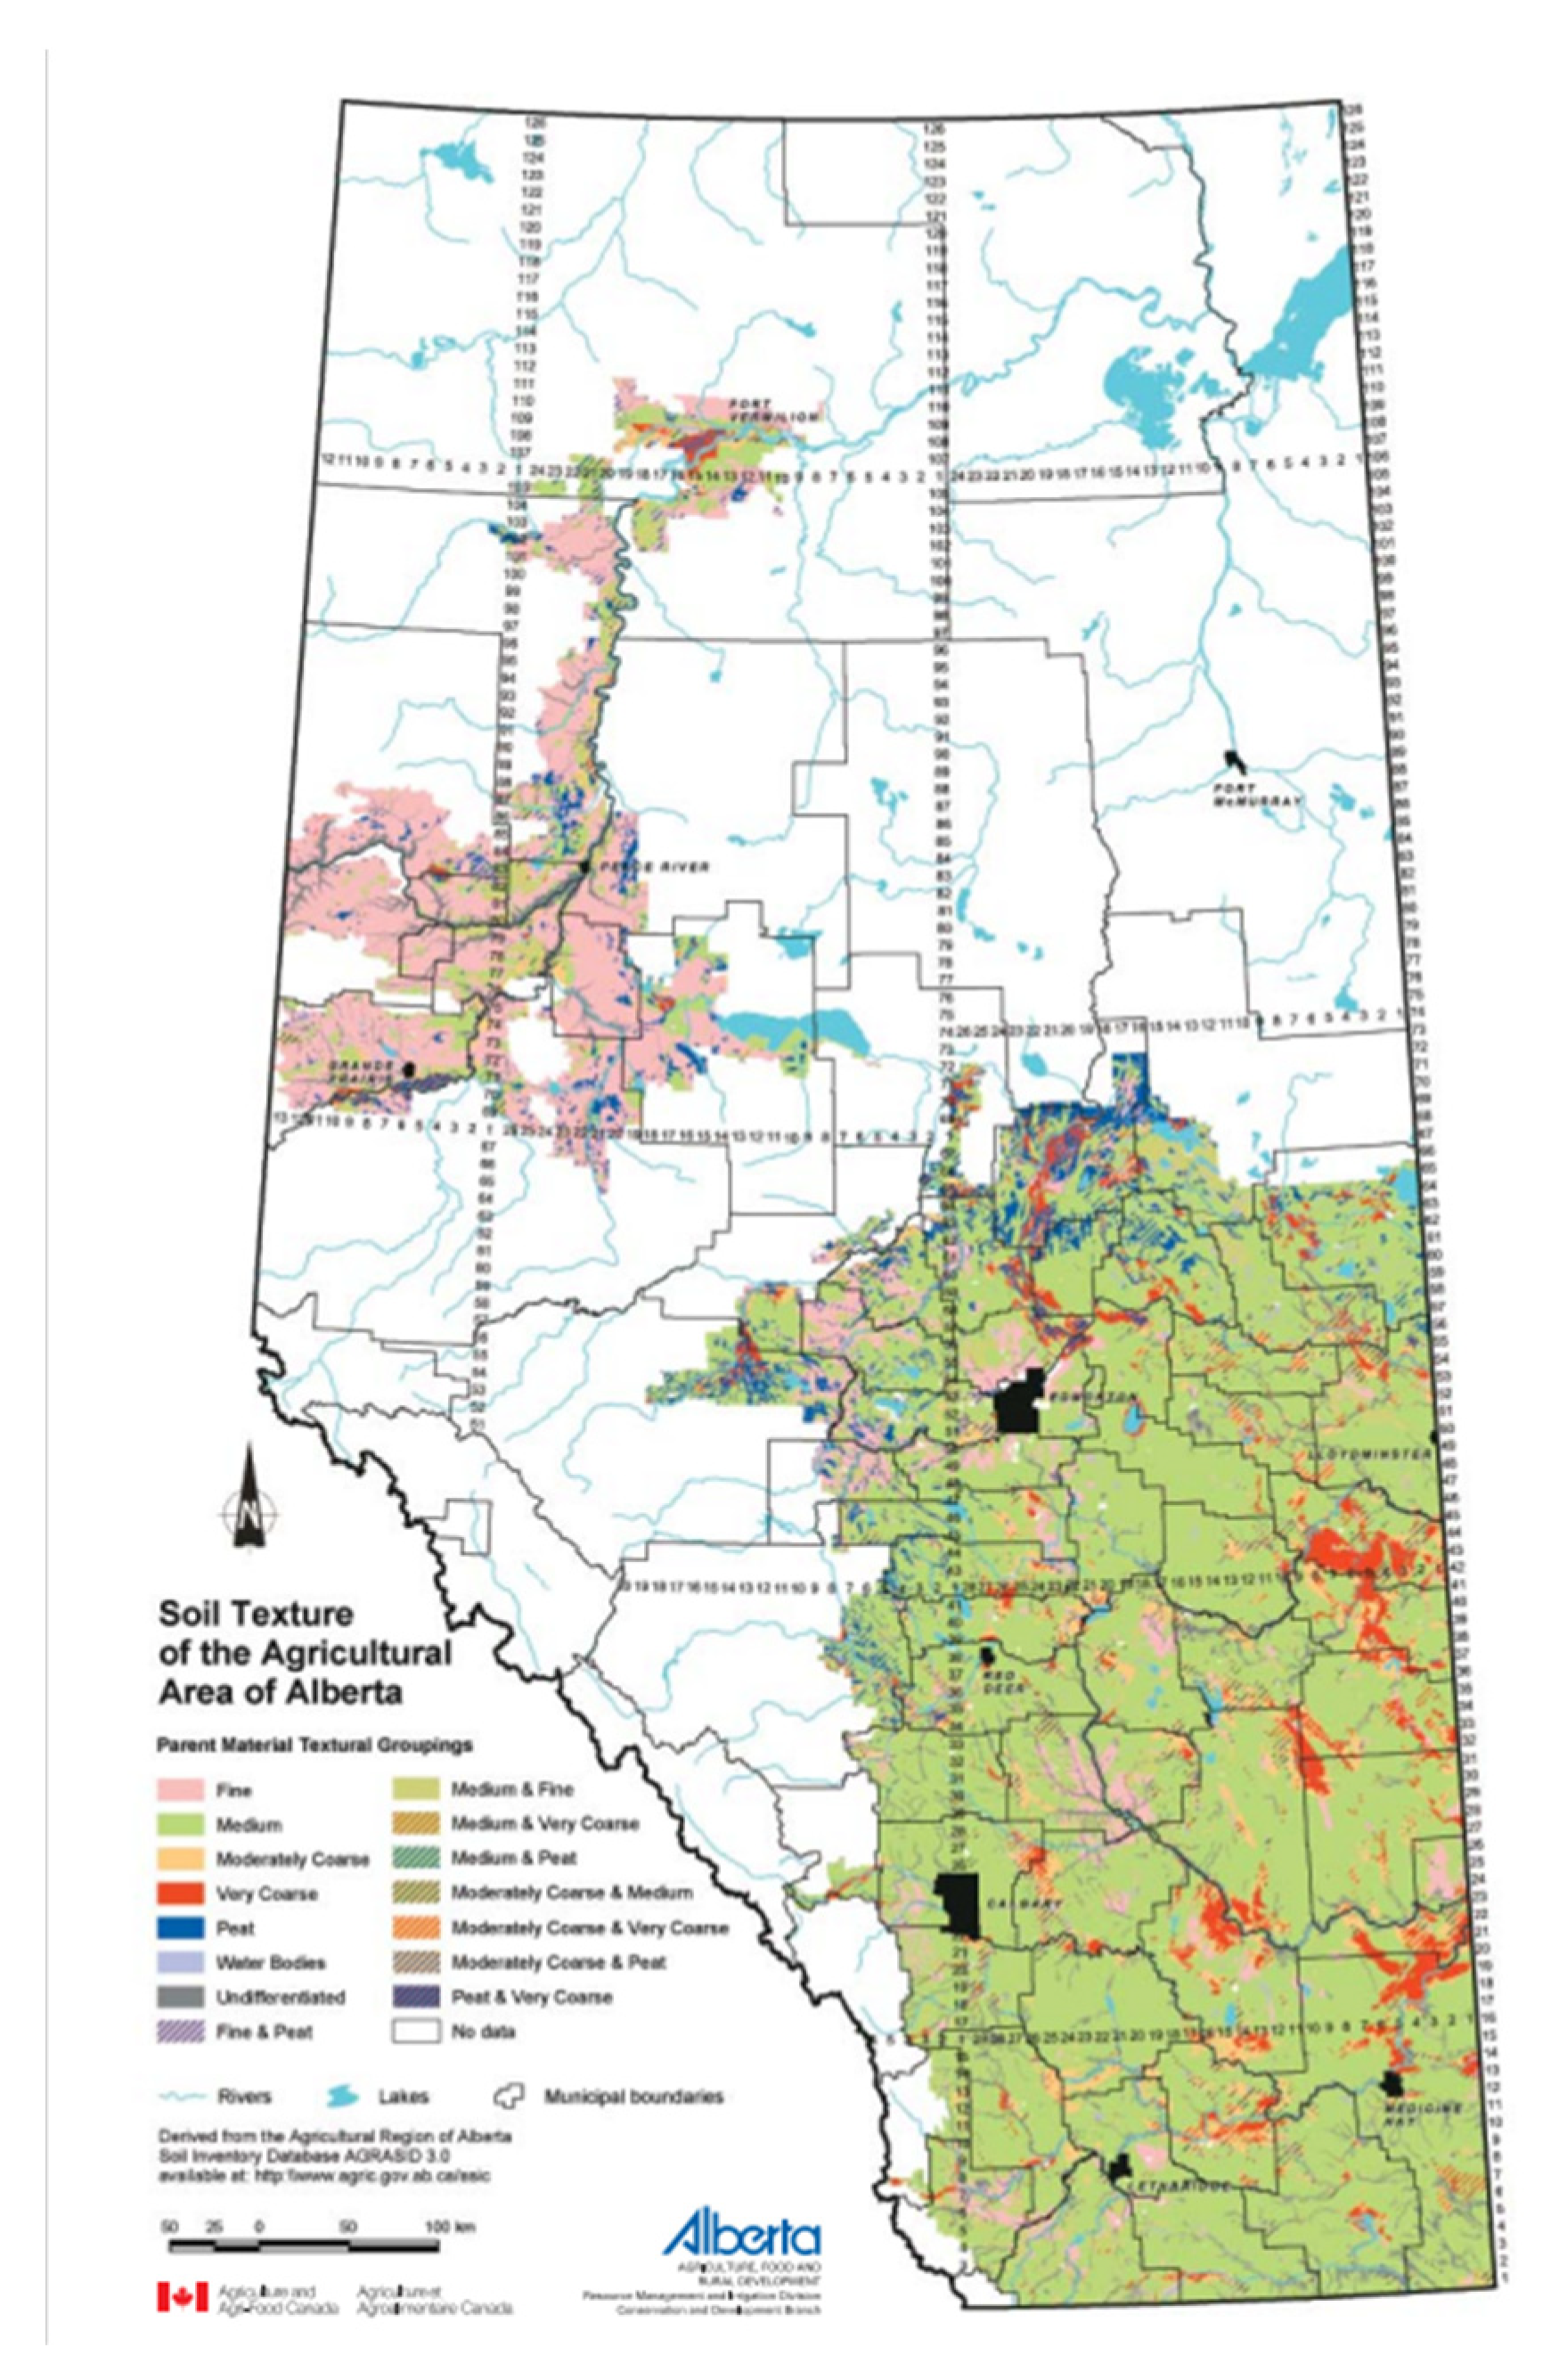
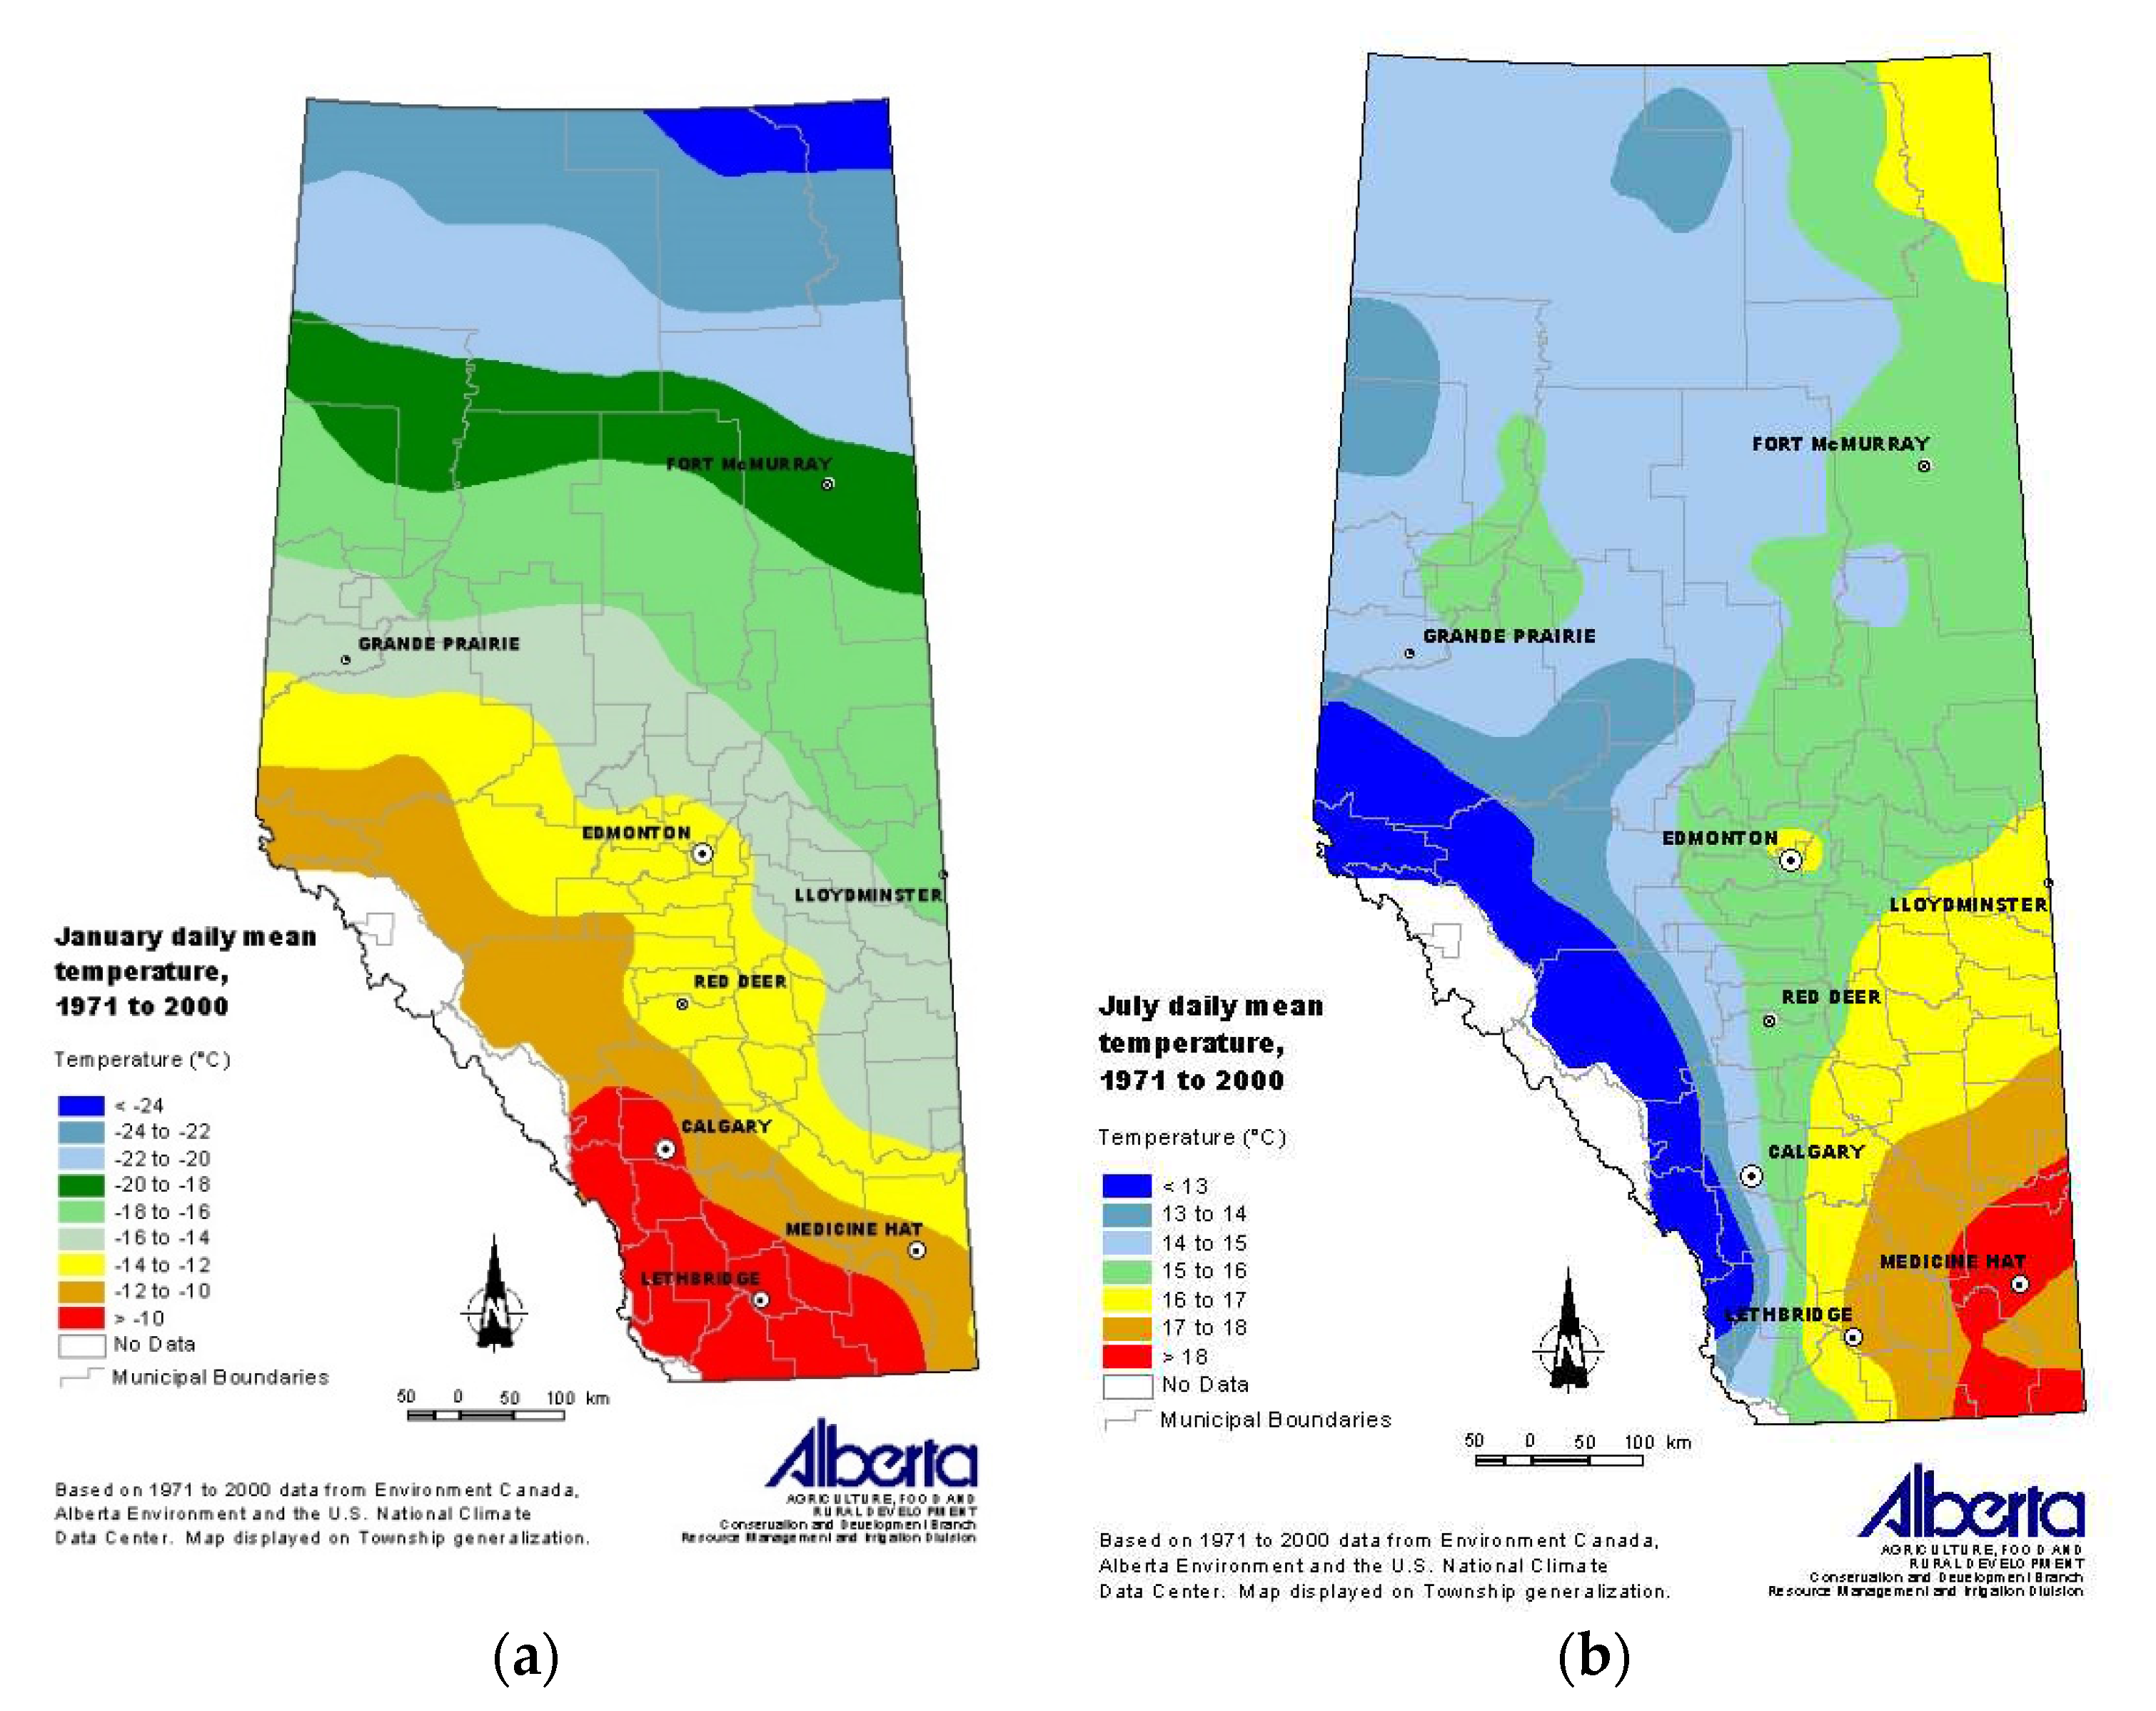
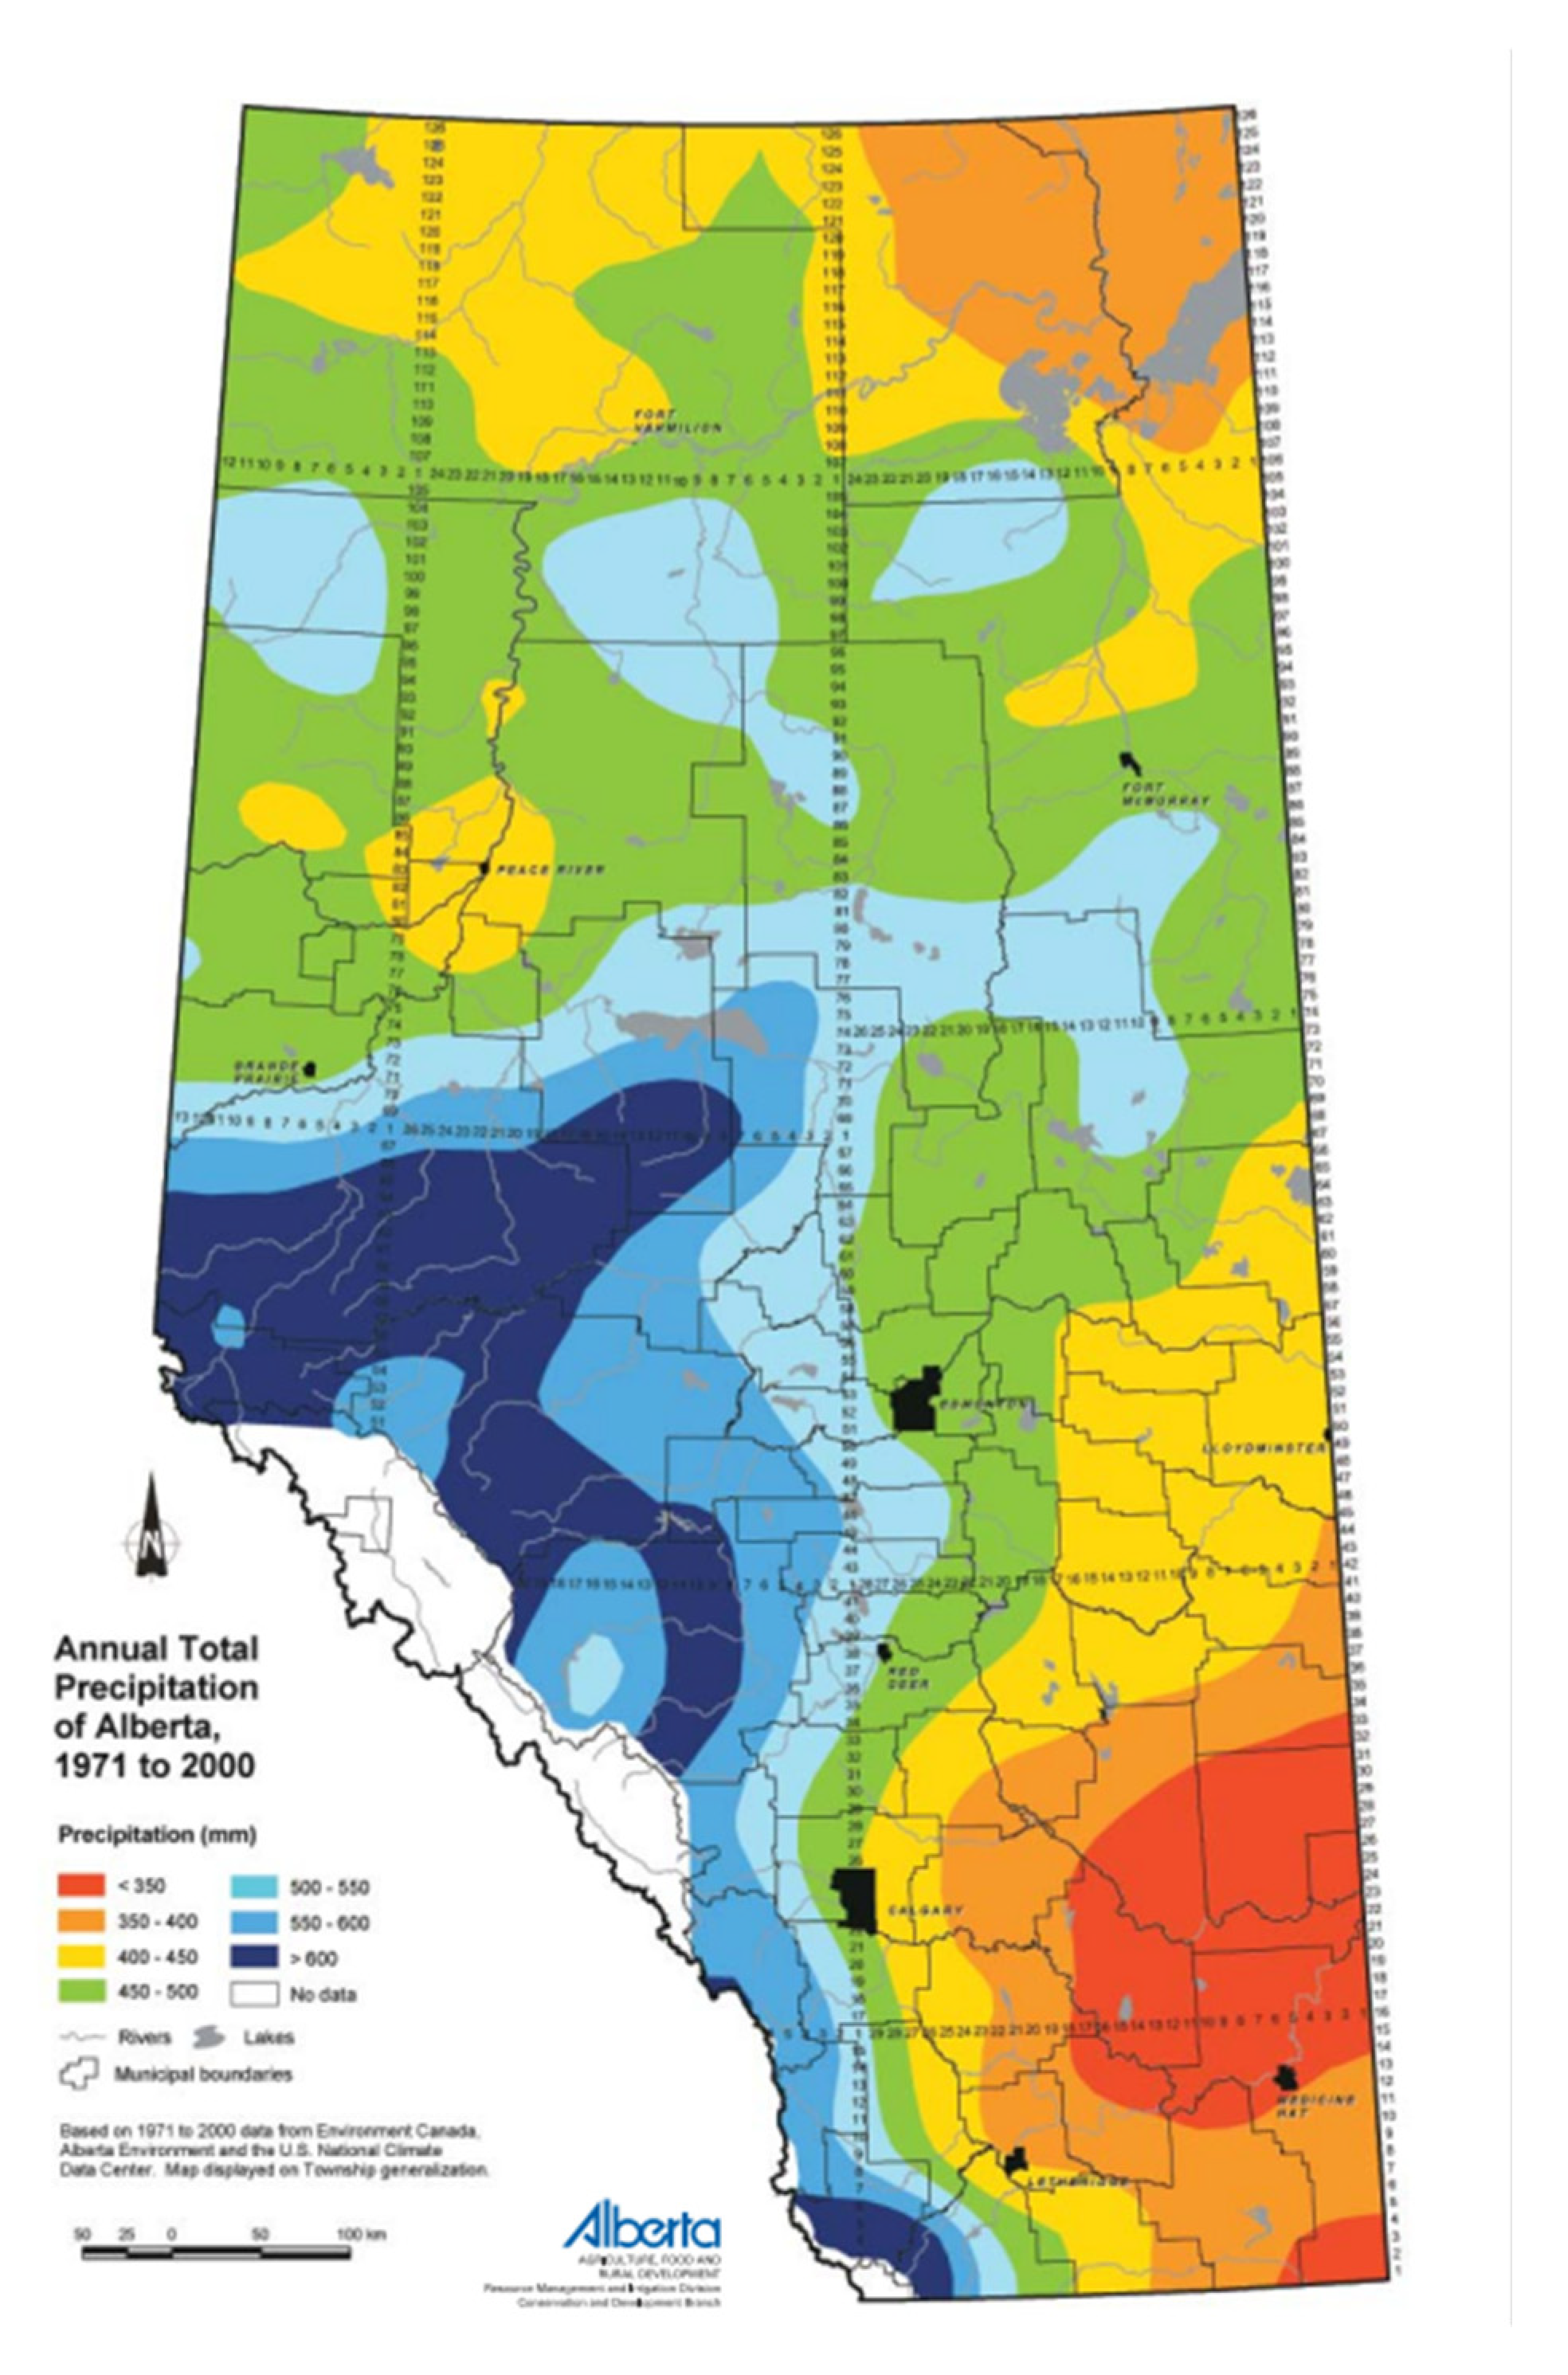
Lastly, GIS technology played an essential role in this study by georeferencing sampling locations and integrating geological and other relevant data for comprehensive soil sample analyses. GIS enabled precise mapping and spatial analysis that provided valuable insight into distribution patterns of soil properties across the study area. Georeferencing involved recording each sampling point's coordinates using a Global Positioning System (GPS) device and then importing them into GIS software for use in creating accurate maps that accurately and vividly depicted their spatial distribution of soil samples. Geological maps, land use maps and elevation data were also included into GIS analysis of this geospatial analysis process.
GIS data integration provided a deeper insight into the connection between soil properties and geological context. GIS maps generated through GIS revealed clear spatial patterns of soil organic carbon (SOC) content relative to geology; fine-grained materials like clayey soils had higher SOC content compared with coarser materials, which is consistent with previous research [
31] [
32]. This finding illustrates the influence of soil texture on SOC distribution as well as supporting our conclusion that soil properties are intrinsically tied with geological features in the study area. In addition to that, GIS data integration can be facilitated to identify hotspot areas characterized by higher SOC content and areas with lower levels. By overlaying SOC distribution maps with land use data, specific land management practices such as agricultural fields or forested areas that contribute to variations in soil carbon sequestration could be pinpointed and thus help guide soil management strategies and target interventions aimed at increasing it.
Figure 6,
Figure 7,
Figure 8,
Figure 9,
Figure 10,
Figure 11,
Figure 12 and
Figure 13 below illustrate the sample GIS maps created for the three (3) analyzed samples explored in this paper.
It should be noted that GIS analysis should not be approached without considering its limitations and possible sources of error, particularly georeferencing accuracy which relies heavily on GPS device precision as well as having access to high-quality base maps as reference materials. Furthermore, variations in sampling density or scale can change representativeness and introduce spatial uncertainties into analysis.
5. Conclusions
In this research project, the ultimate goal was to create an accurate and efficient method for estimating soil organic carbon (SOC) content in agricultural soils using a photocatalytic Chemical Oxygen Demand (PeCOD) analyzer that could be used on-site. The PeCOD showed promising results when used accurately to determine SOC levels from soil samples. The findings from this research can have profound ramifications for sustainable agriculture practices, climate change mitigation efforts and overall soil health management strategies. The PeCOD analyzer, which utilizes photochemical oxidation of organic carbon to estimate SOC content, has proven itself to be an invaluable tool. The direct correlation between COD values and SOC content in soils demonstrates its robustness as a quick and cost-effective means of monitoring soil organic carbon levels. With calibrated software development, PeCOD estimates SOC content with high precision matching traditional TOC methods.
Our research results demonstrated the significance of soil texture and depth as factors affecting SOC distribution. Fine-grained materials like clayey soils exhibited higher SOC contents compared to coarser materials; this support existing literature as it highlights the significance of considering soil texture when designing management practices to optimize carbon sequestration. Additionally, our results demonstrated a decrease in soil organic carbon (SOC) content with increasing soil depth, as predicted in previous research studies. This indicates the significance of managing topsoil carbon through appropriate agricultural practices like no-till agriculture and cover cropping to avoid its loss from deeper layers. GIS technology enabled precise georeferencing of soil sampling locations and spatial analysis of SOC distribution. GIS mapping revealed hotspot areas with high SOC content, providing essential insight for targeted land management strategies to increase carbon sequestration. GIS data integration also made possible an examination of SOC in relation to geological characteristics - emphasizing its importance when studying soil properties.
However, this study does have some drawbacks. The PeCOD method could be affected by variations in soil composition and presence of interfering substances in the extracted solution which could cause some uncertainty to arise in results. Calibration and validation with standard methods is crucial to ensure accurate SOC estimates; GIS could provide valuable insights; however, its preciseness could compromise representativeness of samples as well as scale of analysis depending on quality base map precision and device precision.
Overall, this research has demonstrated the utility of PeCOD analyzer as an efficient and rapid means for estimating SOC content in agricultural soils. Through direct correlation between PeCOD values and SOC levels and GIS technology integration, our understanding of soil carbon dynamics was deepened significantly with respect to texture depth and geological context. Moreover, this study has implications that reach far beyond academia and are applicable for farmers and land managers pursuing climate-smart agriculture practices. By accurately estimating SOC content, farmers can track soil health while sequestering carbon for future use or even claim carbon credits themselves in future years. Furthermore, its findings contribute to larger efforts at fighting climate change while supporting sustainable land use practices. Future research endeavors should focus on validating the PeCOD analyzer's performance across diverse soil types and environmental conditions to increase its applicability in various regions. Furthermore, investigating long-term stability of SOC estimates using the PeCOD method will further demonstrate its usefulness for tracking soil carbon dynamics over extended time frames.
Author Contributions
Conceptualization, K.A. and R.M.S.; methodology, K.A. and R.M.S.; investigation, K.A. and R.M.S.; resources, R.M.S.; writing—original draft preparation, K.A.; writing—review and editing, R.M.S.; supervision, R.M.S. All authors have read and agreed to the published version of the manuscript.
Funding
This research was funded by Mitacs Accelerate, Project number IT31097.
Data Availability Statement
The data presented in this study are available on request from the corresponding author.
Acknowledgments
The authors would like to thank Mantech Inc. for their technical support and Mitacs Canada for their unwavering support and funding.
Conflicts of Interest
The authors declare no conflict of interest.
References
- Agriculture and the Environment. Soil organic matter indicator. (2022). https://agriculture.canada.ca/en/agriculture-and-environment/soil-and-land/soil-organic-matter-indicator. Accessed 2022/04/13.
- Statistics Canada.Table 32-10-0446-01 Farms reporting technologies used on the operation in the year prior to the census. 2017. [CrossRef]
- Ontario Ministry of Agriculture, Food and Rural Affairs. Statistical summary of Ontario agriculture. (2016). http://www.omafra.gov.on.ca/english/stats/agriculture_summary.htm. Accessed 2022/04/13.
- Laamrani, A.; Voroney, P.R.; Berg, A.A.; Gillespie, A.W.; March, M.; Deen, B.; Martin, R.C. Temporal Change of Soil Carbon on a Long-Term Experimental Site with Variable Crop Rotations and Tillage Systems. Agronomy 2020, 10, 840. [Google Scholar] [CrossRef]
- Environment and Climate Change Canada. Pan-Canadian framework on clean growth and climate change: Canada’s plan to address climate change and grow the economy. (2016). https://publications.gc.ca/pub?id=9.828774&sl=0. Accessed 2022/04/13.
- Stockmann, U.; Adams, M.A.; Crawford, J.W.; Field, D.J.; Henakaarchchi, N.; Jenkins, M.; Minasny, B.; McBratney, A.B.; de Courcelles, V.d.R.; Singh, K.; et al. The knowns, known unknowns and unknowns of sequestration of soil organic carbon. Agric. Ecosyst. Environ. 2013, 164, 80–99. [Google Scholar] [CrossRef]
- Uyguner-Demirel, C.; Bekbolet, M. Significance of analytical parameters for the understanding of natural organic matter in relation to photocatalytic oxidation. Chemosphere 2011, 84, 1009–1031. [Google Scholar] [CrossRef] [PubMed]
- Stockmann, U.; Padarian, J.; McBratney, A.; Minasny, B.; de Brogniez, D.; Montanarella, L.; Hong, S.Y.; Rawlins, B.G.; Field, D.J. Global soil organic carbon assessment. Glob. Food Secur. 2015, 6, 9–16. [Google Scholar] [CrossRef]
- Lal, R. Soil health and carbon management. Food Energy Secur. 2016, 5, 212–222. [Google Scholar] [CrossRef]
- Lehmann, J.; Kleber, M. The contentious nature of soil organic matter. Nature 2015, 528, 60–68. [Google Scholar] [CrossRef]
- Chenu, C.; Angers, D.A.; Barré, P.; Derrien, D.; Arrouays, D.; Balesdent, J. Increasing organic stocks in agricultural soils: Knowledge gaps and potential innovations. Soil Tillage Res. 2019, 188, 41–52. [Google Scholar] [CrossRef]
- Wiesmeier, M.; Hübner, R.; Spörlein, P.; Geuß, U.; Hangen, E.; Reischl, A.; Schilling, B., von Lützow, M.; Kögel-Knabner, I.; Carbon sequestration potential of soils in southeast Germany derived from stable soil organic carbon saturation. Global Change Biology 2014, 20, 653-665.
- Kopittke, P.M.; Dalal, R.C.; Hoeschen, C.; Li, C.; Menzies, N.W.; Mueller, C.W. Soil organic matter is stabilized by organo-mineral associations through two key processes: The role of the carbon to nitrogen ratio. Geoderma 2020, 357, 113974. [Google Scholar] [CrossRef]
- Dubber, D.; Gray, N.F. Replacement of chemical oxygen demand (COD) with total organic carbon (TOC) for monitoring wastewater treatment performance to minimize disposal of toxic analytical waste. J. Environ. Sci. Heal. Part A 2010, 45, 1595–1600. [Google Scholar] [CrossRef]
- Dhillon, G.S.; Amichev, B.Y.; de Freitas, R.; Van Rees, K. Accurate and Precise Measurement of Organic Carbon Content in Carbonate-Rich Soils. Commun. Soil Sci. Plant Anal. 2015, 46, 2707–2720. [Google Scholar] [CrossRef]
- Davis, M.R.; Alves, B.J.R.; Karlen, D.L.; Kline, K.L.; Galdos, M.; Abulebdeh, D. ; Review of Soil Organic Carbon Measurement Protocols: A U. S. and Brazil Comparison and Recommendation. Sustainability 2018, 10(1), 53. [Google Scholar]
- Rahman, M.M.; Naidu, R.; Dhal, B.; Swain, C.; Nayak, A.; Tripathi, R.; Shahid, M.; Islam, M.R.; Pathak, H. Current and emerging methodologies for estimating carbon sequestration in agricultural soils: A review. Sci. Total. Environ. 2019, 665, 890–912. [Google Scholar] [CrossRef]
- Smith, P.; Soussana, J.-F.; Angers, D.; Schipper, L.; Chenu, C.; Rasse, D.P.; Batjes, N.H., van Egmond, F.; McNeill, S.; Kuhnert, M.; Arias-Navarro, C.; Olesen, J.E.; Chirinda, N.; Fornara, D.; Wollenberg, E.; Álvaro-Fuentes, J.; Sanz-Cobena, A.; Klumpp, K.; How to measure, report and verify soil carbon change to realize the potential of soil carbon sequestration for atmospheric greenhouse gas removal. Global Change Biology 2020, 26, 219-241.
- Araujo, F.S.M.; Fantucci, H.; Lima, S.H.d.O.; de Abreu, M.C.S.; Santos, R.M. Modeling Canadian farmer’s intention to adopt eco-friendly agricultural inputs and practices. Reg. Environ. Chang. 2022, 22, 1–12. [Google Scholar] [CrossRef]
- Fantucci, H.; Aguirre, M.; Santos, R.M. Wet Air Oxidation Route for the Synthesis of Organomineral Fertilizers from Synergistic Wastes (Pomace and Kimberlite). Ind. Eng. Chem. Res. 2021, 60, 11657–11675. [Google Scholar] [CrossRef]
- Haque, F.; Santos, R.M.; Chiang, Y.W. CO2 sequestration by wollastonite-amended agricultural soils – An Ontario field study. Int. J. Greenh. Gas Control. 2020, 97, 103017. [Google Scholar] [CrossRef]
- Creamer, C.A.; Filley, T.R.; Boutton, T.W. Long-term incubations of size and density separated soil fractions to inform soil organic carbon decay dynamics. Soil Biol. Biochem. 2013, 57, 496–503. [Google Scholar] [CrossRef]
- Goovaerts, P. Geostatistics in soil science: state-of-the-art and perspectives. Geoderma 1999, 89, 1–45. [Google Scholar] [CrossRef]
- ASTM International, Standard Test Method for Sieve Analysis of Fine and Coarse Aggregates 2015, ASTM C136.
- Six, J.; Conant, R.T.; Paul, E.A.; Paustian, K. Stabilization mechanisms of soil organic matter: Implications for C-saturation of soils. Plant Soil 2002, 241, 155–176. [Google Scholar] [CrossRef]
- Schweizer, S.A.; Mueller, C.W.; Höschen, C.; Ivanov, P.; Kögel-Knabner, I. The role of clay content and mineral surface area for soil organic carbon storage in an arable toposequence. Biogeochemistry 2021, 156, 401–420. [Google Scholar] [CrossRef]
- Schumacher, B. A. ; Methods for the Determination of Total Organic Carbon (TOC) in Soil and Sediments. United States Environmental protection Agency. (2002), Retrieved from http://bcodata.whoi.edu/LaurentianGreatLakes_Chemistry/bs116.pdf.
- Walkley, A.; Black, I.A. An examination of the Degtjareff method for determining soil organic matter, and a proposed modification of the chromic acid titration method. Soil Sci. 1934, 37, 29–38. [Google Scholar] [CrossRef]
- Food and Agriculture Organization of the United Nations (FAO)., Standard operating procedure for soil organic carbon. Walkley-Black method: titration and colorimetric method. (2019), Retrieved from http://www.fao.org/publications/card/en/c/CA7471EN/.
- Canadian Council of Independent Laboratories (CCIL). List of Certified Laboratories. (2023). https://www.ccil.com/certification/list-of-certified-laboratories/.
- Jobbagy, E.G.; Jackson, R.B. The Vertical Distribution of Soil Organic Carbon and Its Relation to Climate and Vegetation. Ecol. Appl. 2000, 10, 423–436. [Google Scholar] [CrossRef]
- Smith, P.; Smith, J.; Powlson, D.; McGill, W.; Arah, J.; Chertov, O.; Coleman, K.; Franko, U.; Frolking, S.; Jenkinson, D.; et al. A comparison of the performance of nine soil organic matter models using datasets from seven long-term experiments. Geoderma 1997, 81, 153–225. [Google Scholar] [CrossRef]
- H. Zhu, Z. Deng, X. Chen, and X. Qiu, “Ontario Annual Mean Temperature & Precipitation Maps,” Maps - OCDP’s Documents,2018, documentation. https://lamps.math.yorku.ca/OntarioClImate/DS_CMIP5/LAMPS_YorkU/OCDP/_build/html/maps.html#details (accessed Jul. 7, 2023).
- Alberta Agriculture, Food and Rural Development, Agricultural Land Resource Atlas of Alberta, 2nd Edition. Alberta Agriculture, Food and Rural Development, Resource, Management and Irrigation Division, Conservation and Development Branch, Edmonton, Alberta, 2005, 53 pp., 25 maps.
|
Disclaimer/Publisher’s Note: The statements, opinions and data contained in all publications are solely those of the individual author(s) and contributor(s) and not of MDPI and/or the editor(s). MDPI and/or the editor(s) disclaim responsibility for any injury to people or property resulting from any ideas, methods, instructions or products referred to in the content. |
© 2023 by the authors. Licensee MDPI, Basel, Switzerland. This article is an open access article distributed under the terms and conditions of the Creative Commons Attribution (CC BY) license (http://creativecommons.org/licenses/by/4.0/).
