1. Introduction
Over the last few decades, problems like highly congested traffic and environmental pollution have grown alarmingly. The rapid growth of the automotive industry has resulted in several unfavorable repercussions, the most notable of which are increased costs associated with travel, increased consumption of fuel, a worsening of environmental pollution, increased levels of congestion within the transportation system, and decreased overall efficiency [1, 2]. Carpooling "CP" is a revolutionary transportation option gaining popularity worldwide as an alternative to individual car ownership today. This mode of transportation results in a wide range of potential benefits, some of which are the reduction of greenhouse gas emissions (GHG), the reduction of car ownership rates, the alleviation of parking issues, the enhancement of mobility prospects, and the mitigation of traffic congestion [3-5]. CP is an alternative to individual car ownership that is less environmentally harmful. The idea of CP was first implemented in Europe in the 1940s, after which it spread to other parts of the world, including Australia, North America, and Asia. Its inception occurred in Canada in the middle of the 1990s [
6]. The scope of CP's operations has expanded to include more than twenty essential regions spread across the United States of America and Canada [
7]. According to the data provided by the corporation, in the year 2019, there was a discernible increase in CP's level of popularity across the continent of North America. According to these findings, there were a total of 9,818 registered vehicles that provided services to a considerable user base that was more significant than 378,000 people [
8]. People who drive their cars only sometimes but rely heavily on public transport might choose a CP system, resulting in less traffic congestion and lower demand for private and on-street parking spots [9-13]. Carpooling (CP) was introduced in 26 nations in 2010 to minimize traffic costs and environmental impact. These countries wanted to reduce traffic, energy use, and car emissions by carpooling. This sustainable transportation concept encouraged commuters to share rides, which reduced traffic, energy use, and emissions, making transportation greener and cheaper [14, 15].
CP has been demonstrated in numerous studies to effectively cut greenhouse gas emissions by anywhere from 0.84 to 0.58 metric tonnes, depending on the study area [16, 17]. Zong et al. [
18] found that introducing a designed transferable credit scheme (TCS) successfully reduces traffic congestion and carbon emissions when considering the CP method. After participating in a CP program, anywhere between 15 and 29 percent of people in Canada decided to sell their vehicles. Similarly, when individuals in the United States switched to using CP as their primary form of transportation, around 11–26% gave up ownership of their vehicles [6, 8]. Many essential benefits come with using this method, including lower vehicle maintenance and parking costs and protected financial investments in automobiles. It, in turn, allows consumers to take advantage of these facilities at a reduced cost, making it easier for them to reinvest their money in various other enterprises and projects [19-22].
In addition, CP positively influences various social factors, most notably by offering high-quality and well-balanced transportation options to people who do not possess private vehicles [6, 8, 9, 22, 23]. CP aggressively encourages more environmentally friendly forms of transportation, such as walking, biking, and public transportation, to reduce traffic congestion and enhance parking management. In addition, this strategy helps to improve overall general health by fostering the practice of active commuting and lowering the levels of pollutants in the environment that are caused by the use of private automobiles [
16]. CP programs, on the other hand, are beneficial to both the economy and the environment because of their ability to cut down on pollution considerably. The use of electric vehicles in CP systems not only has the potential to deliver cost savings and increased energy efficiency, but it also helps to reduce emissions of greenhouse gases, which has a good impact on the overall health of the environment, as well as reduces the amount of air pollution [24-29]. The primary objective of the research that was carried out in Beijing, China, was to investigate the patterns of one-way and two-way CP trips. According to the conclusions of the study, a significant factor that plays a role in determining how people choose to travel is the inclination of people who do not own automobiles for excursions that go in both directions [
30]. CP Company Chefenxiang, with headquarters in Hangzhou, offers round-trip services and operates a network of 79 parking facilities to make its operations more efficient [
31]. In their study, Shaheen and Martin [
32] analyzed citizens' views toward the Carpooling (CP) method. They concluded that younger individuals with greater education levels are more likely to accept and implement the CP approach. Over the past few decades, CP has become an increasingly prominent and highly studied topic among urban planners. Both society and the environment have benefited from its widespread adoption in a variety of cities across the globe, which has coincided with good benefits for the former. The increasing interest in CP can be attributed to its ability to reduce the difficulties associated with transportation and to encourage environmentally friendly mobility options that are both beneficial to communities and contribute to the preservation of the environment [
11].
CP services are currently being provided by several significant applications located all over the world. Each of these applications follows a somewhat different set of operational guidelines. For instance, the Waze app for carpooling uses a paradigm called peer-to-peer, the most fundamental principle. The lower the number of passengers, the lower the cost for each passenger under this strategy. On the other hand, the automobile's owner can recoup the fuel cost they used in the carpooling arrangement by the aggregate earnings made from all of the passengers in the arrangement [33, 34].
Indeed, certain apps, like Uber Pool, utilize aggregator models. In this business model, the company may cut the drivers' wages, and the matching process would be made more accessible by using sophisticated algorithms that would connect passengers going in the same direction. Platforms like Getaround, on the other hand, give users the ability to rent out their vehicles to other individuals, enabling them to make financial gains. Customers can pick up rented automobiles from designated parking areas, such as the parking lot outside the owner's office, and return them after the rental term, typically timed to coincide with closing hours. In addition, apps such as Getting-Together take a novel approach by repurposing taxis as minibusses in their transportation network. This technique reduces congestion while lowering the fares that riders must pay. This approach allows numerous passengers traveling in the same general direction to share the same cab, making the Ride more cost-effective and efficient for all parties involved. [35, 36]. In London, the iconic black taxis are built to convey numerous people from one area to another, making it possible to accommodate more than one passenger at a time while on the move. This strategy encourages effective and shared modes of transportation, making it a practical choice for urban travelers who need to get around the city [
37]. A Taxi is a substitute for private vehicles to hire a driver for the duration of the trip, typically used by an individual or small group of passengers, often for a non-shared ride [38, 39].
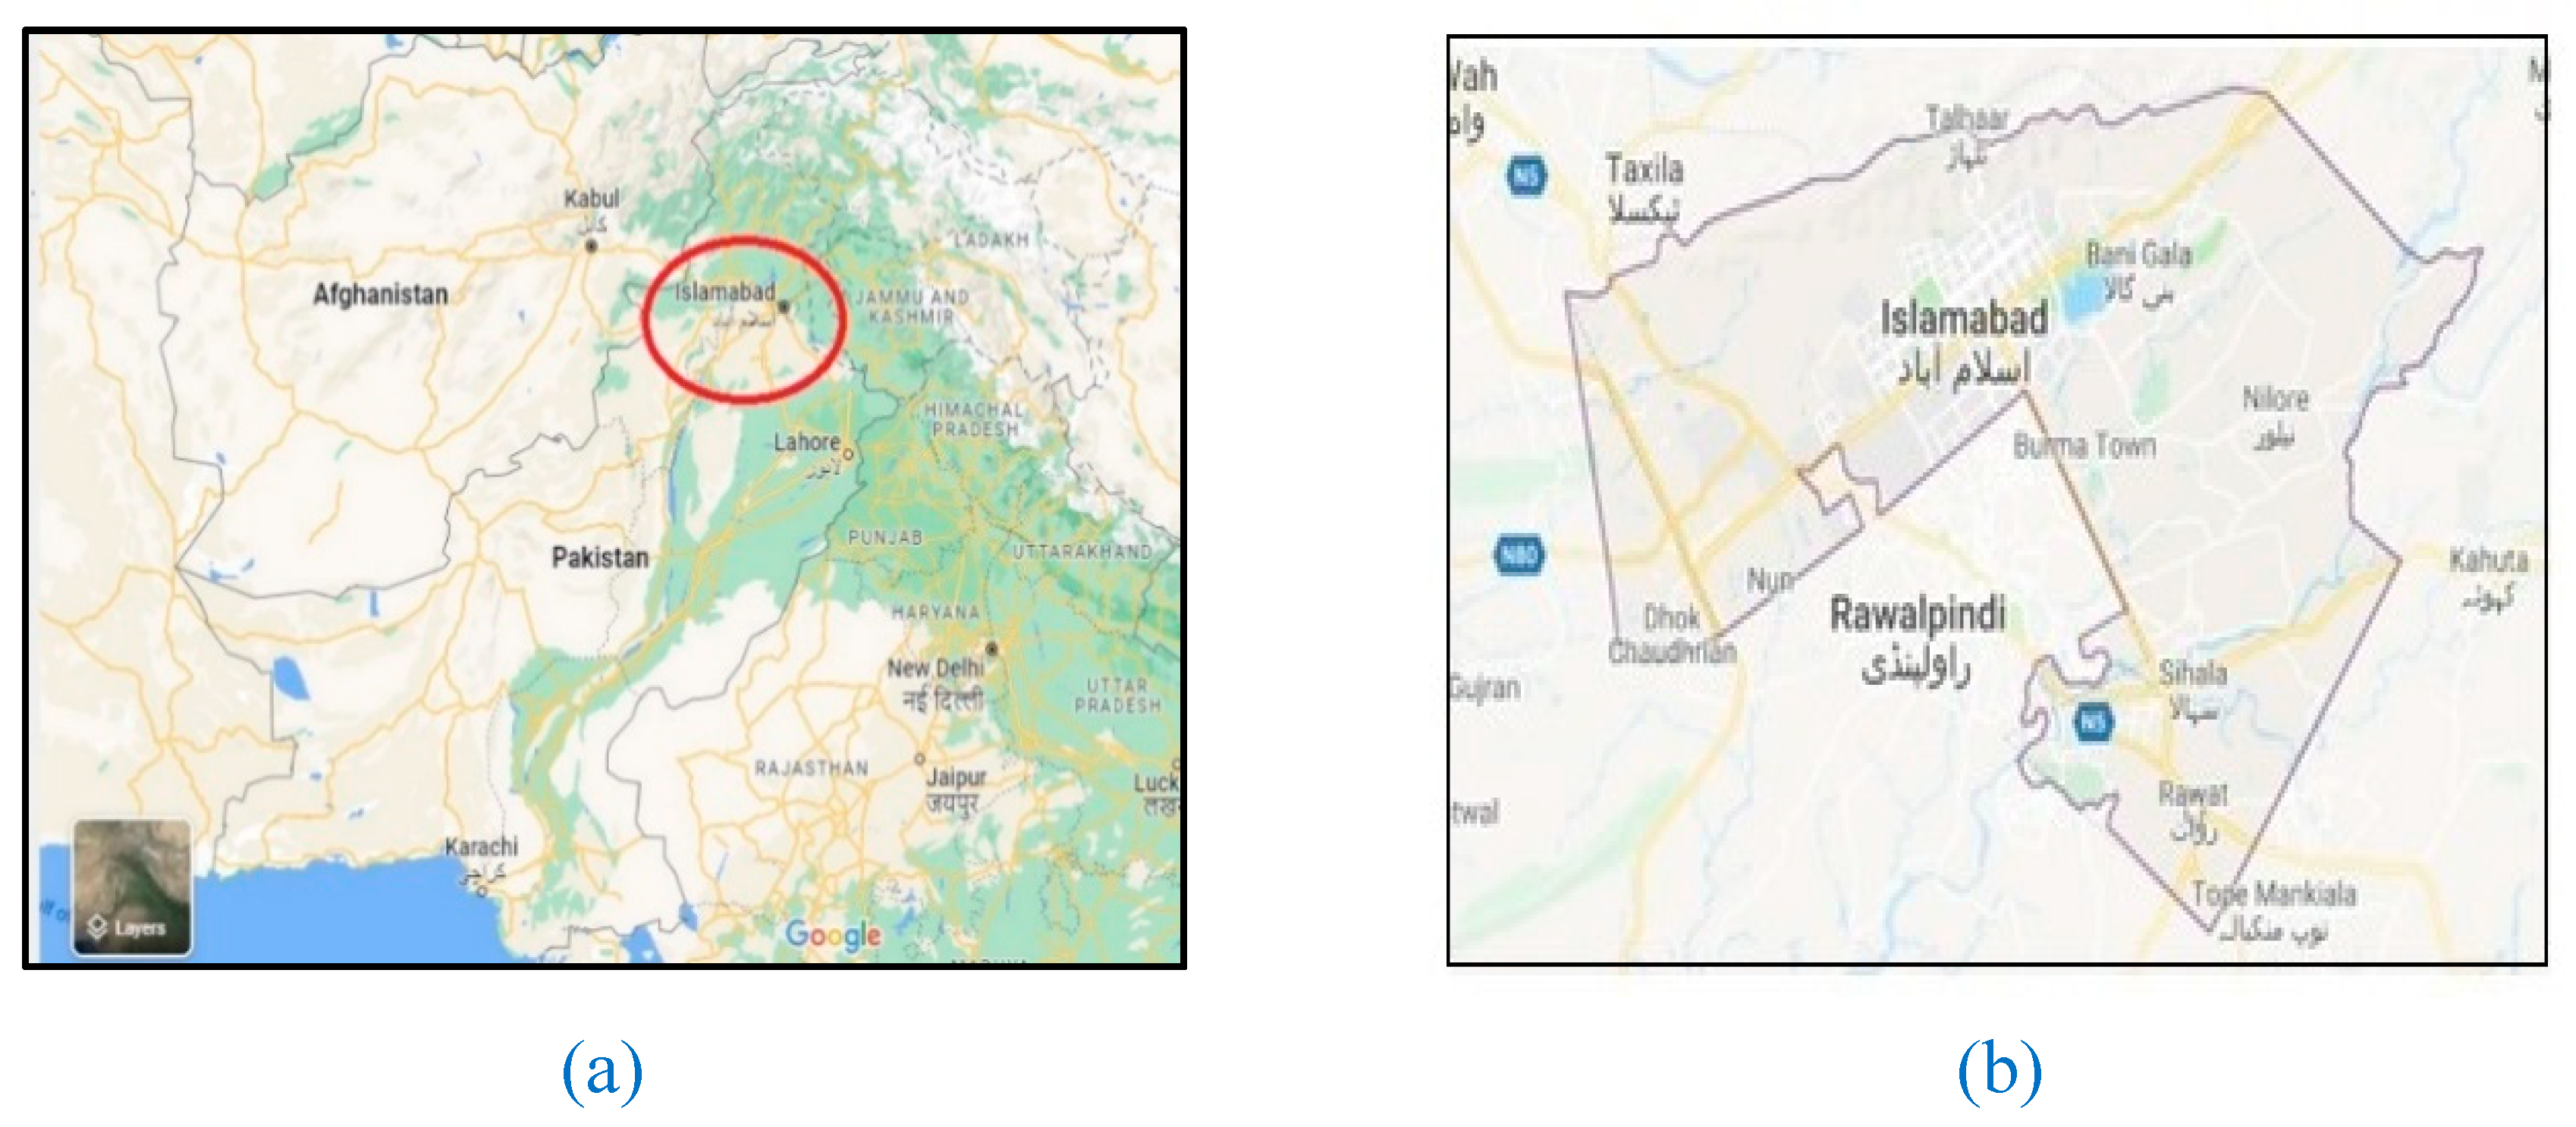
Karachi, Lahore, Rawalpindi, and Islamabad, all major cities in Pakistan, are facing substantial traffic congestion issues due to the rapid development of the urban population and increasing travel demand. A combination of factors causes these challenges. Mobility, air quality, and the overall livability of metropolitan areas are negatively impacted due to the increased number of vehicles on the roads, which, when paired with inadequate transportation infrastructure, has led to severe congestion challenges in many urban centers [
40]. Infrastructure construction takes time as cities try to meet current and future traffic demands to handle the increasing number of vehicles and promote efficient city mobility; infrastructure projects must be carefully planned and implemented [
41]. Residents of the metropolitan area typically travel via private vehicles rather than rely on the insufficient and inefficient public transportation systems currently available [
3]. According to the results of the population census carried out in Pakistan in 2017, the capital city of Pakistan, Islamabad, is exhibiting a remarkable yearly population growth rate of 4.91%. Islamabad is expanding at a quick rate [
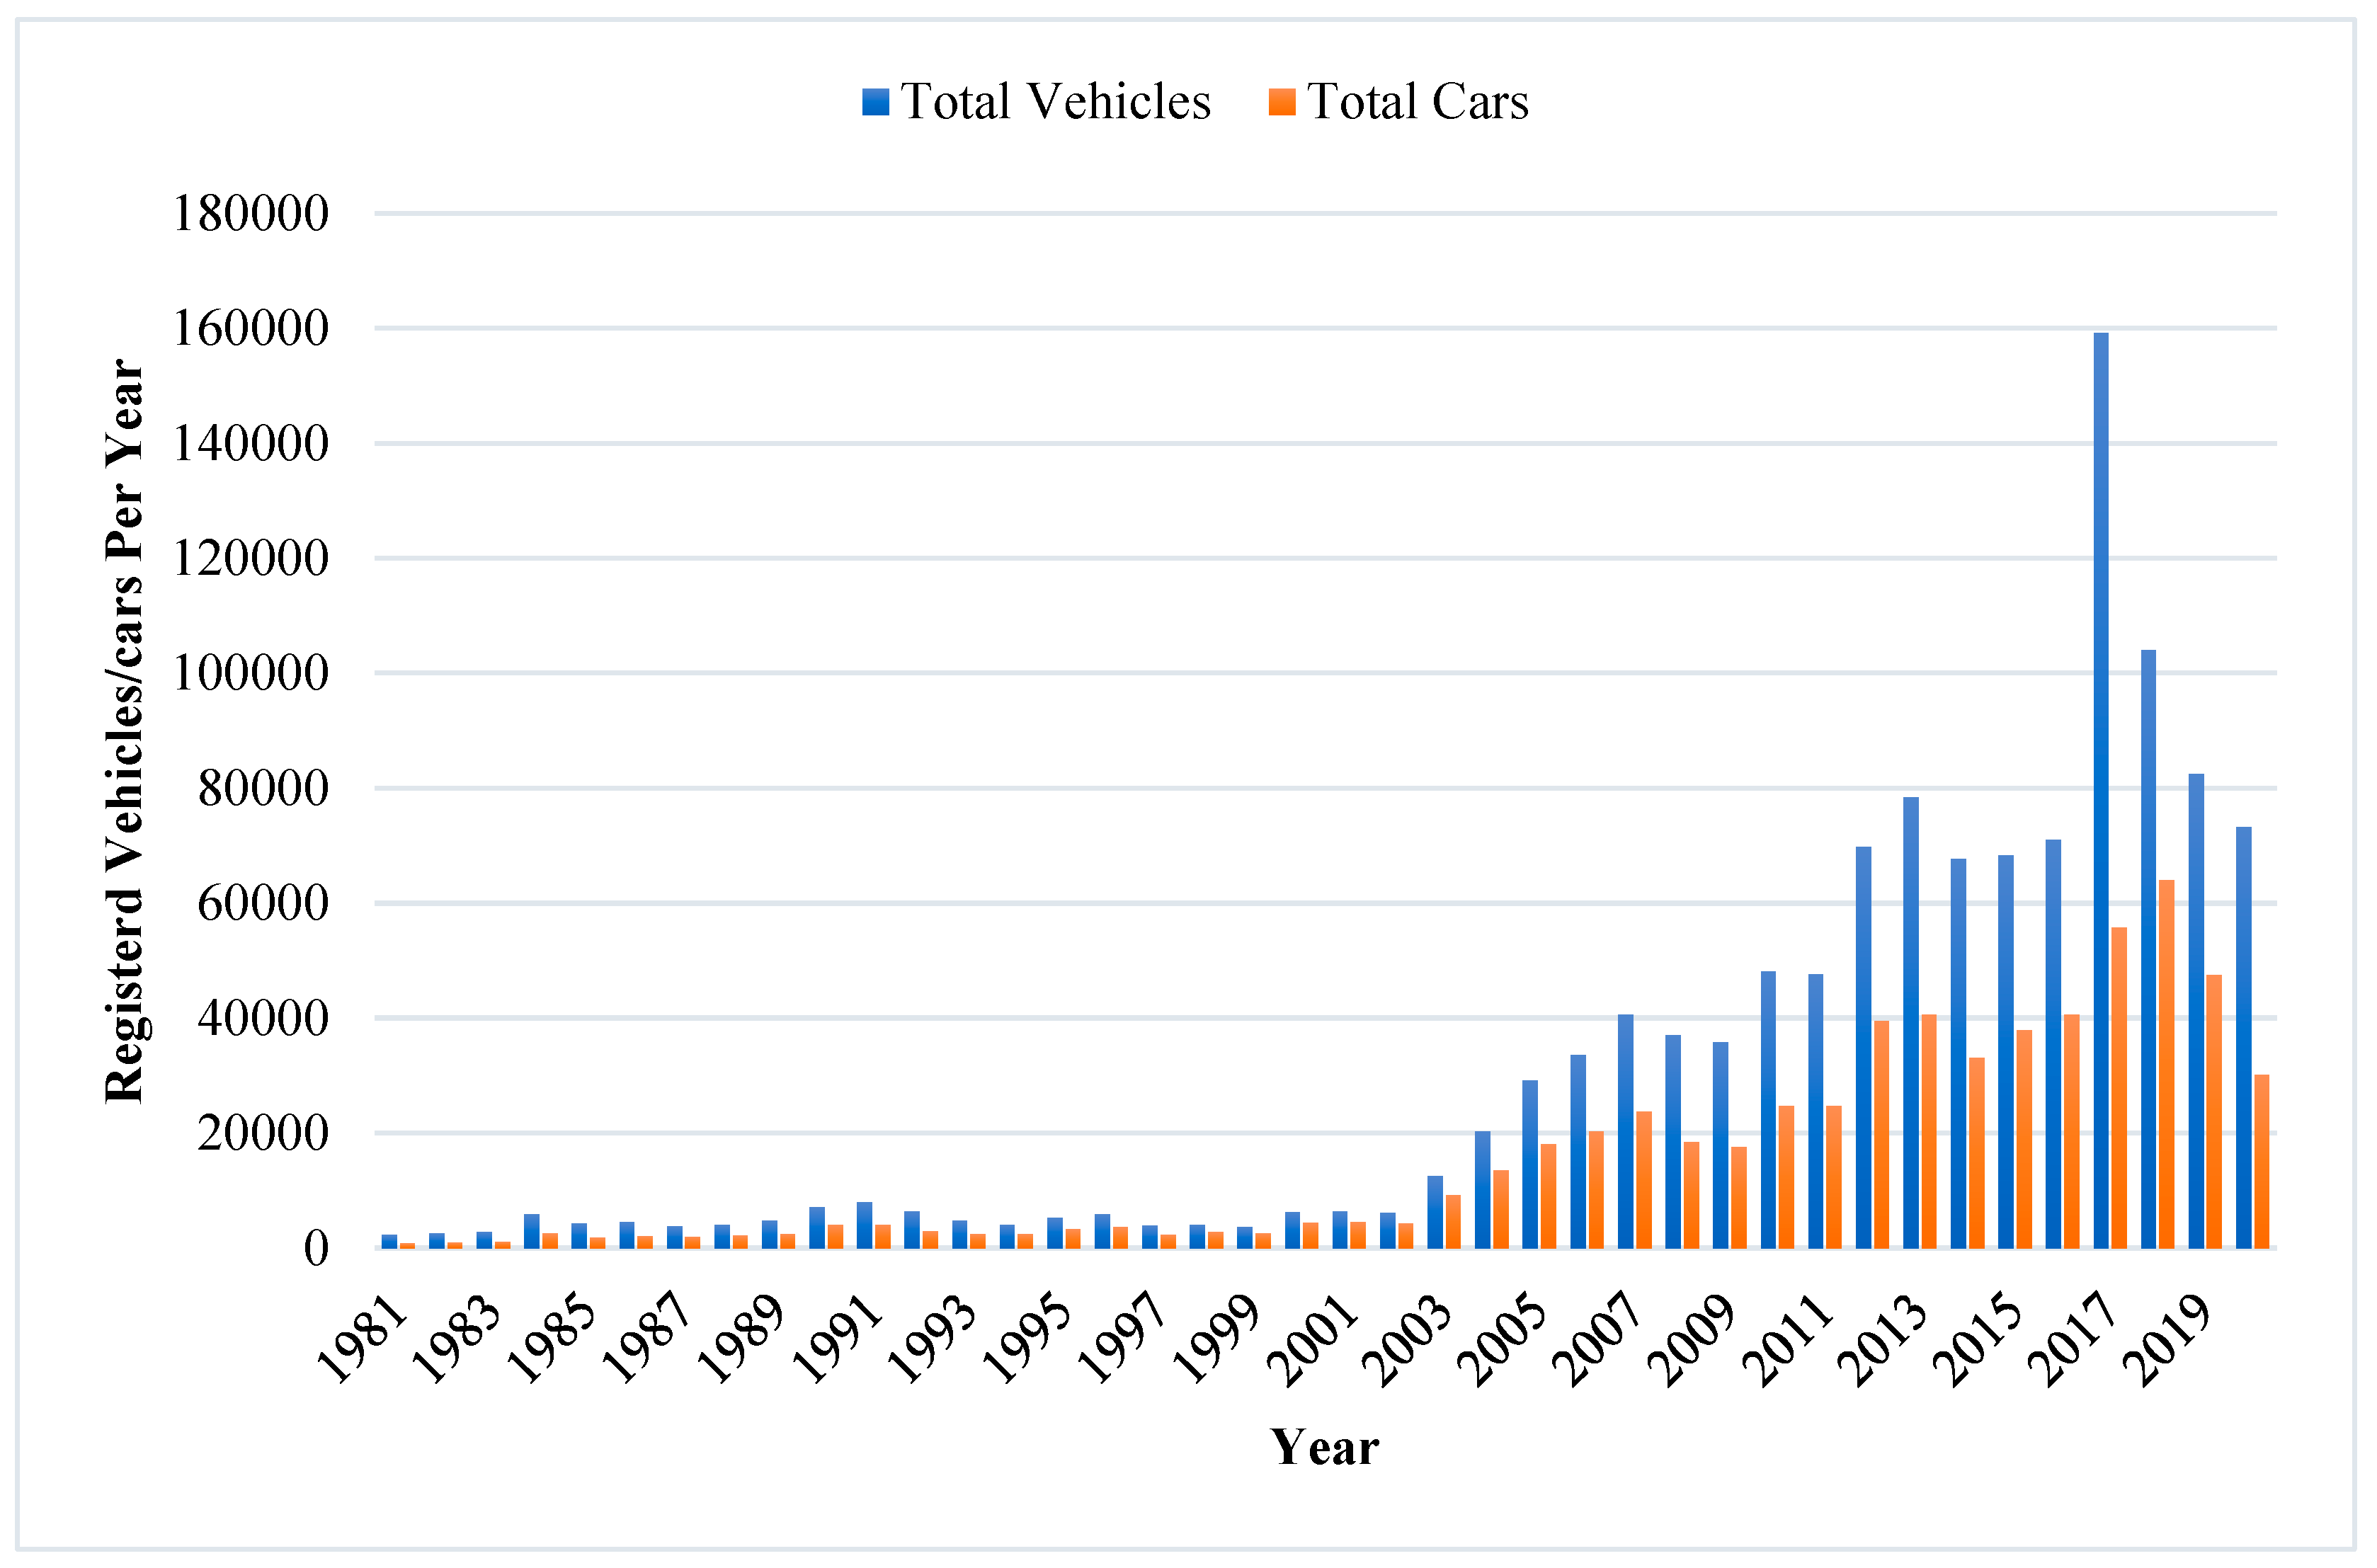
42]. The city of Islamabad is experiencing a booming demand for automobiles due to the city's continuously expanding population. More than 0.9 million automobiles were registered in 2019 to meet this growing demand, as stated in the data compiled by the Excise Office of Islamabad Capital Territory (ICT) [
43]. Due to the ever-increasing number of cars on the road, the nation's capital is currently experiencing extreme levels of both traffic congestion and environmental pollution.
As a direct result, the ever-increasing number of private automobiles operating on the roads has presented a significant obstacle to decision-makers, planners, and other concerned authorities. Because of this issue, the nation sustains economic damage on an annual basis that is measured in the millions of dollars. On the other hand, creating a dynamic and efficient transport infrastructure can stimulate significant economic activity [3, 40]. As a result, developing a solution to alleviate traffic congestion and environmental pollution has become an absolute necessity. In this context, sharing autos with others is a viable strategy for reducing road traffic. It would result in lower fuel consumption and decreased carbon dioxide emissions, providing an environmentally friendly and sustainable solution. Even though this concept has been thoroughly investigated in wealthy nations, it still requires additional focus and investigation in the developing world to adapt to their specific requirements and difficulties [10-13, 16, 17]. Therefore, this idea is based on a peer-to-peer (P2P) model that allows regular trips—the P2P network exchanges traffic information between nodes based on cellular mobiles or modern 5G technologies. The advantage of this system is that the resources can transfer between two nodes without a centralized administrative system. The peer-to-peer transportation modeling concentrates on the carsharing spectrum based on their scalability and robustness for the internet and computer network [44, 45]. Implementing a CP program in Islamabad may be one of the potential solutions to the city's problems with pollution and traffic congestion problems. The success of such a system is majorly dependent on the acceptability by the general public and market demand, which still needs to be analyzed within the framework of the cultural attitude of Pakistanis. University roommates, office roommates, schoolroom roommates, and others familiar with the precise timings and the anticipated route may be encouraged to join monthly CP groups. CP may be the best option to keep a sustainable transport system running in Islamabad, where traffic congestion worsens daily, and most people drive their automobiles.
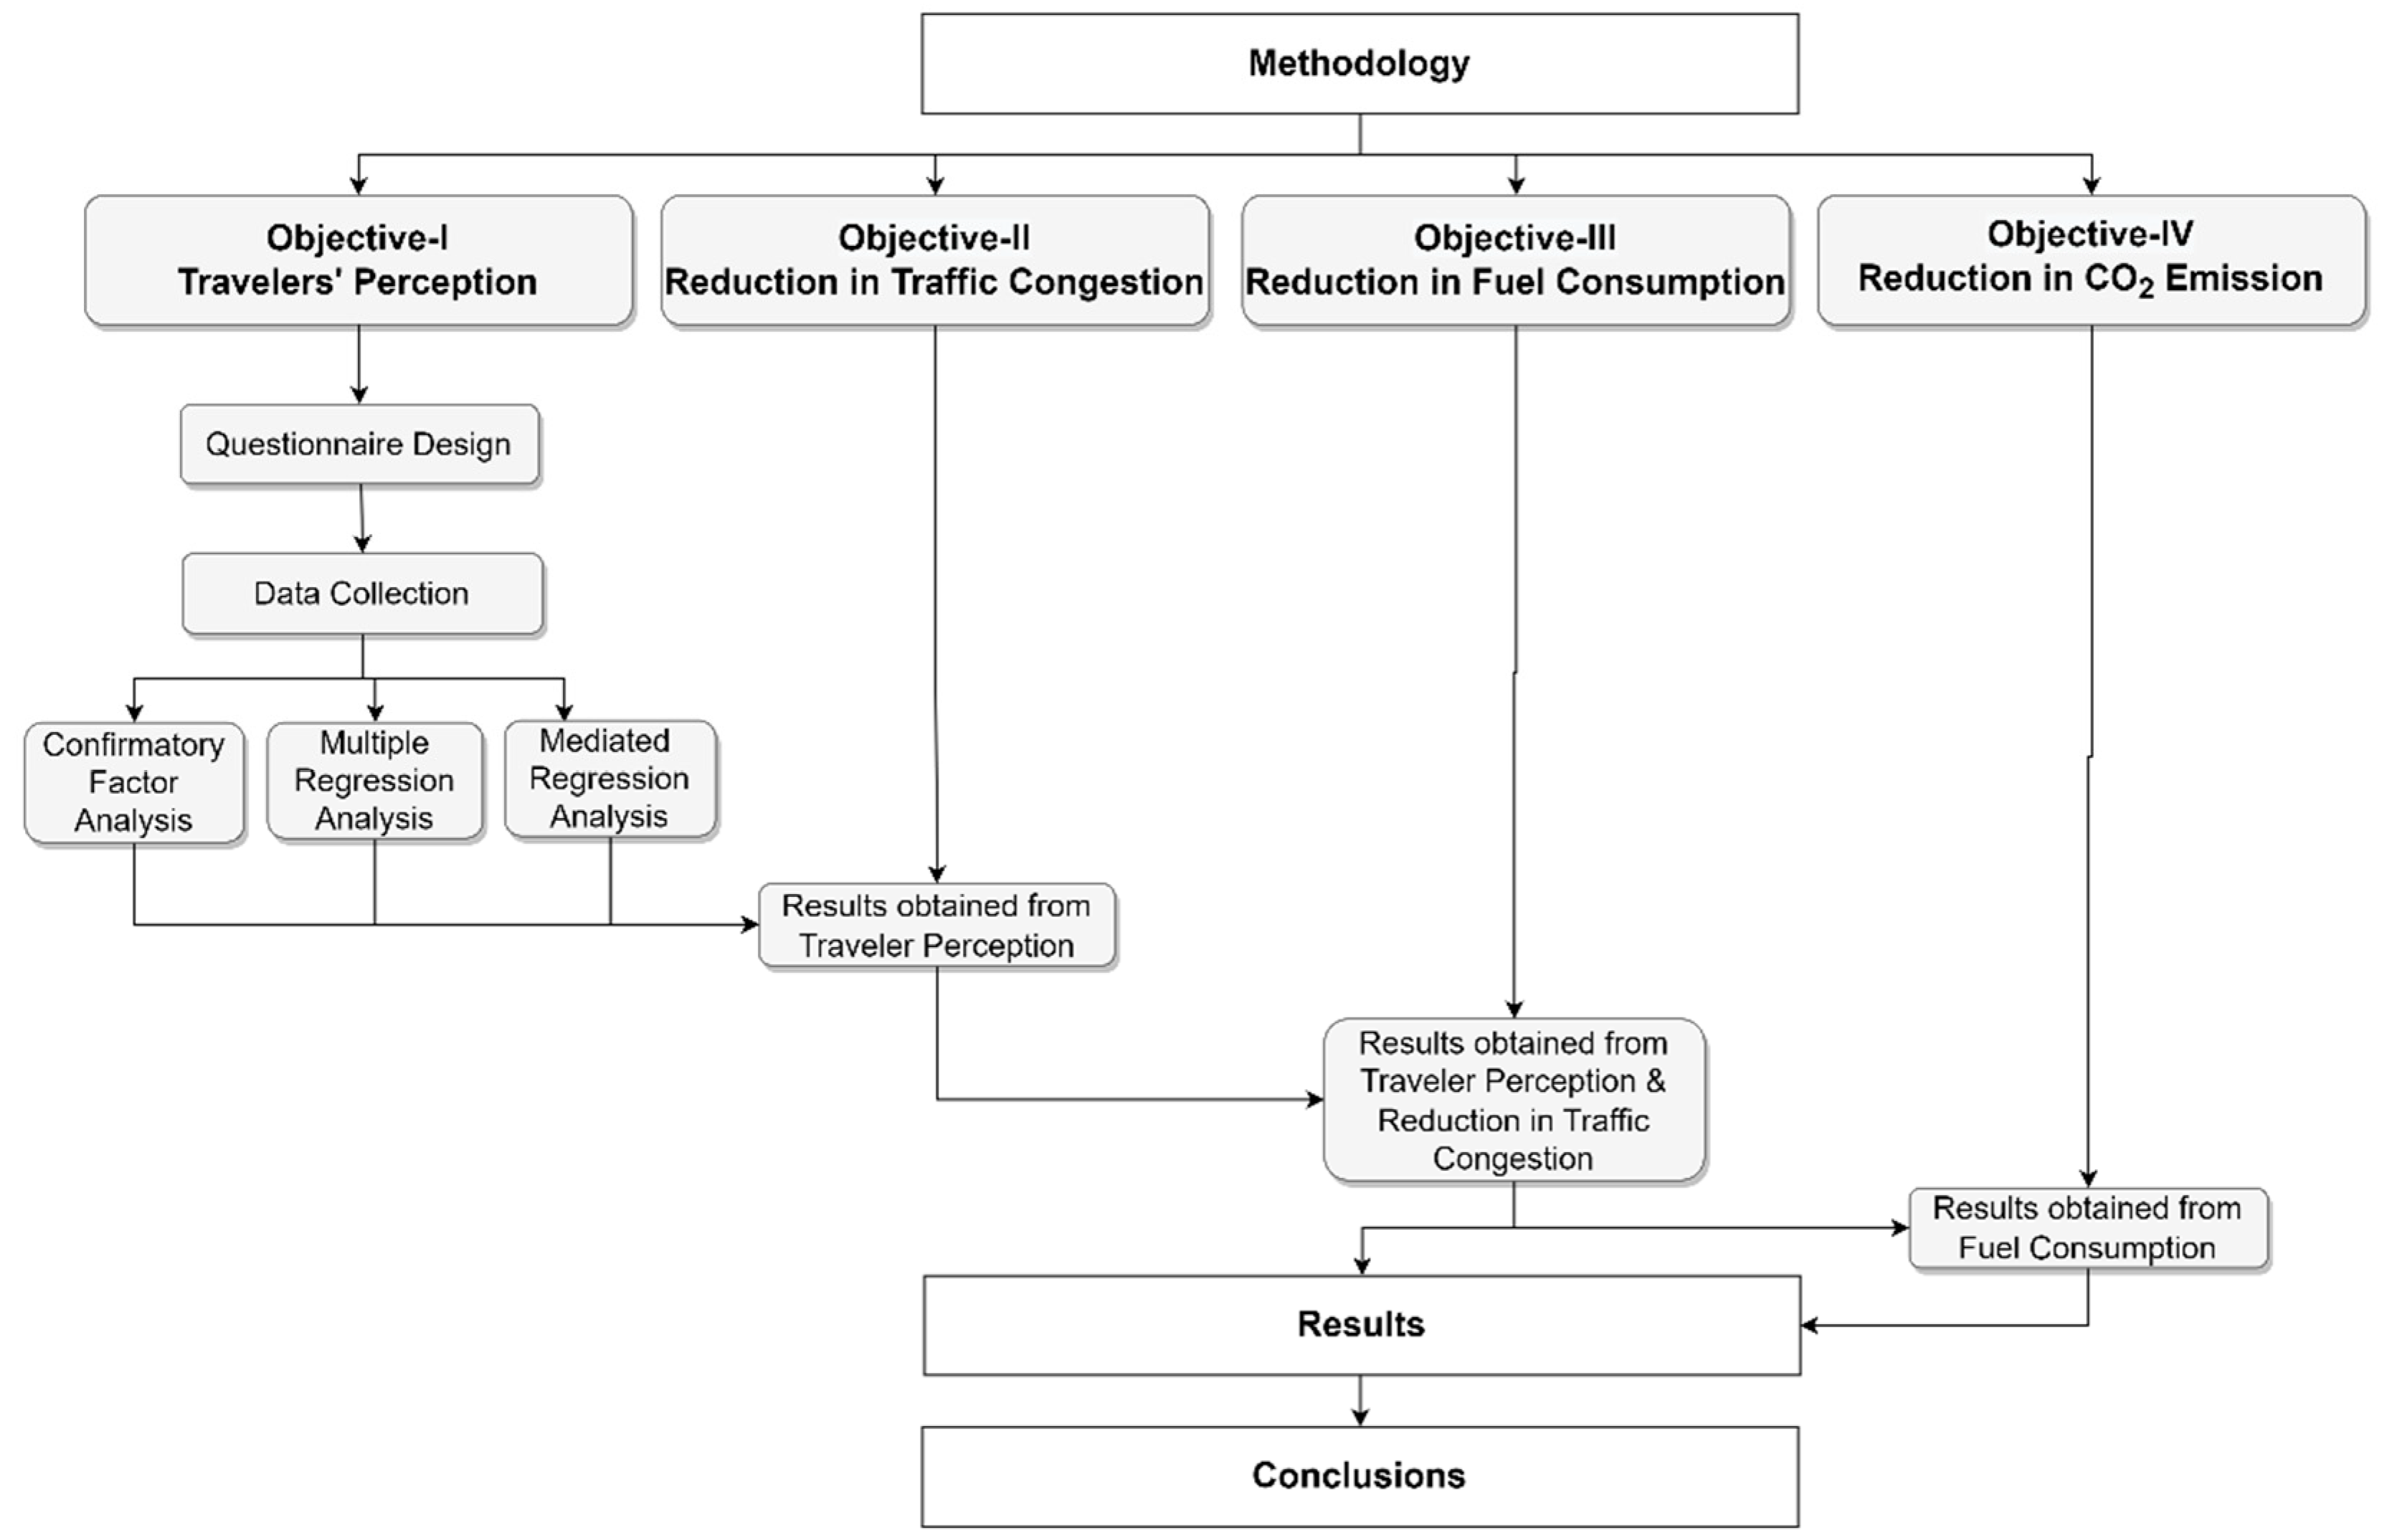
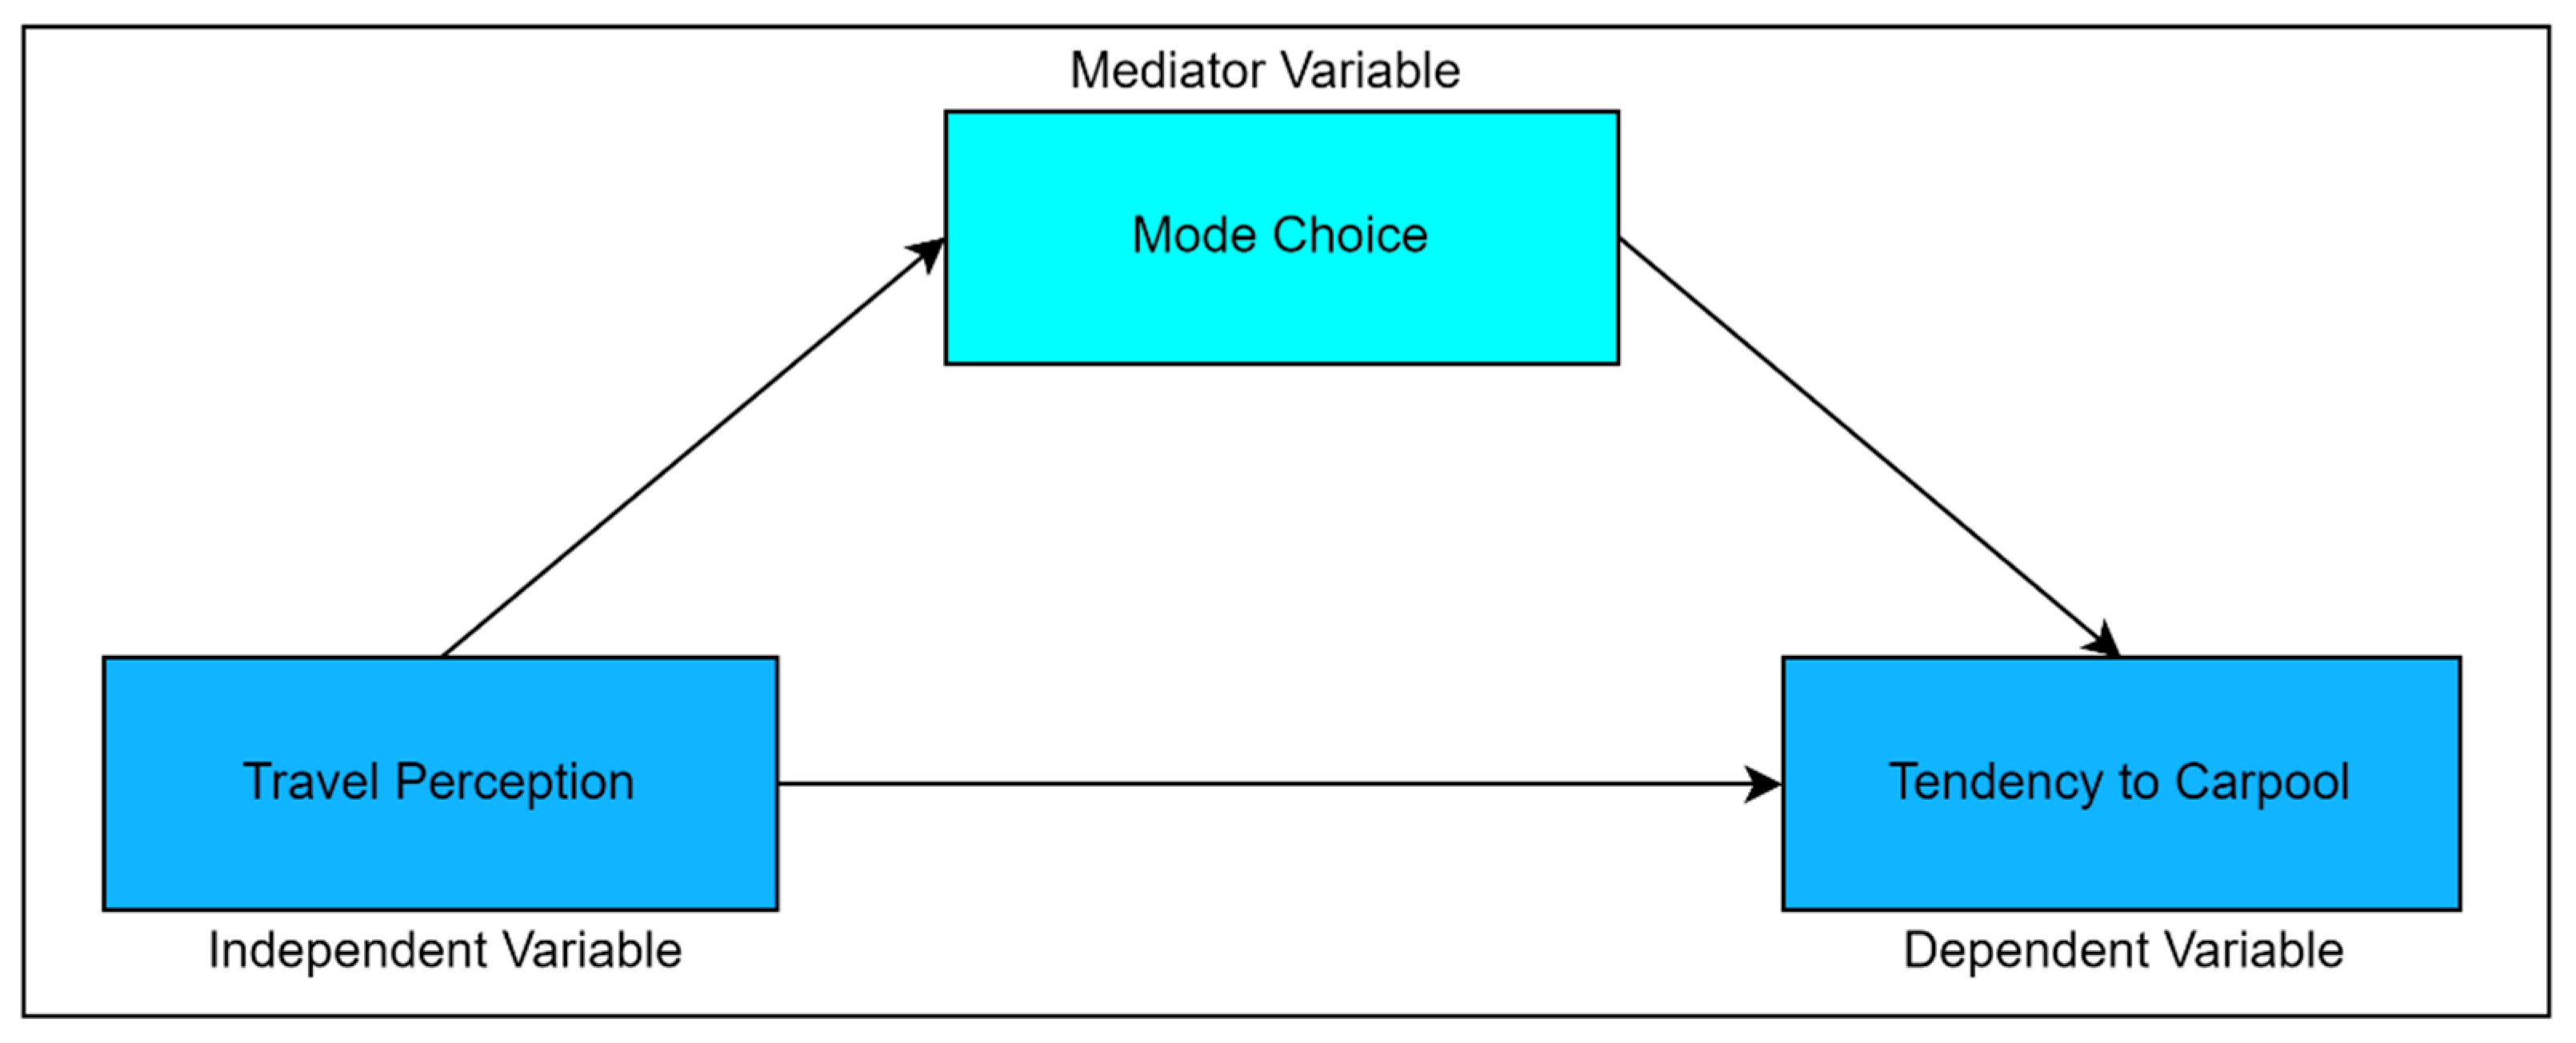
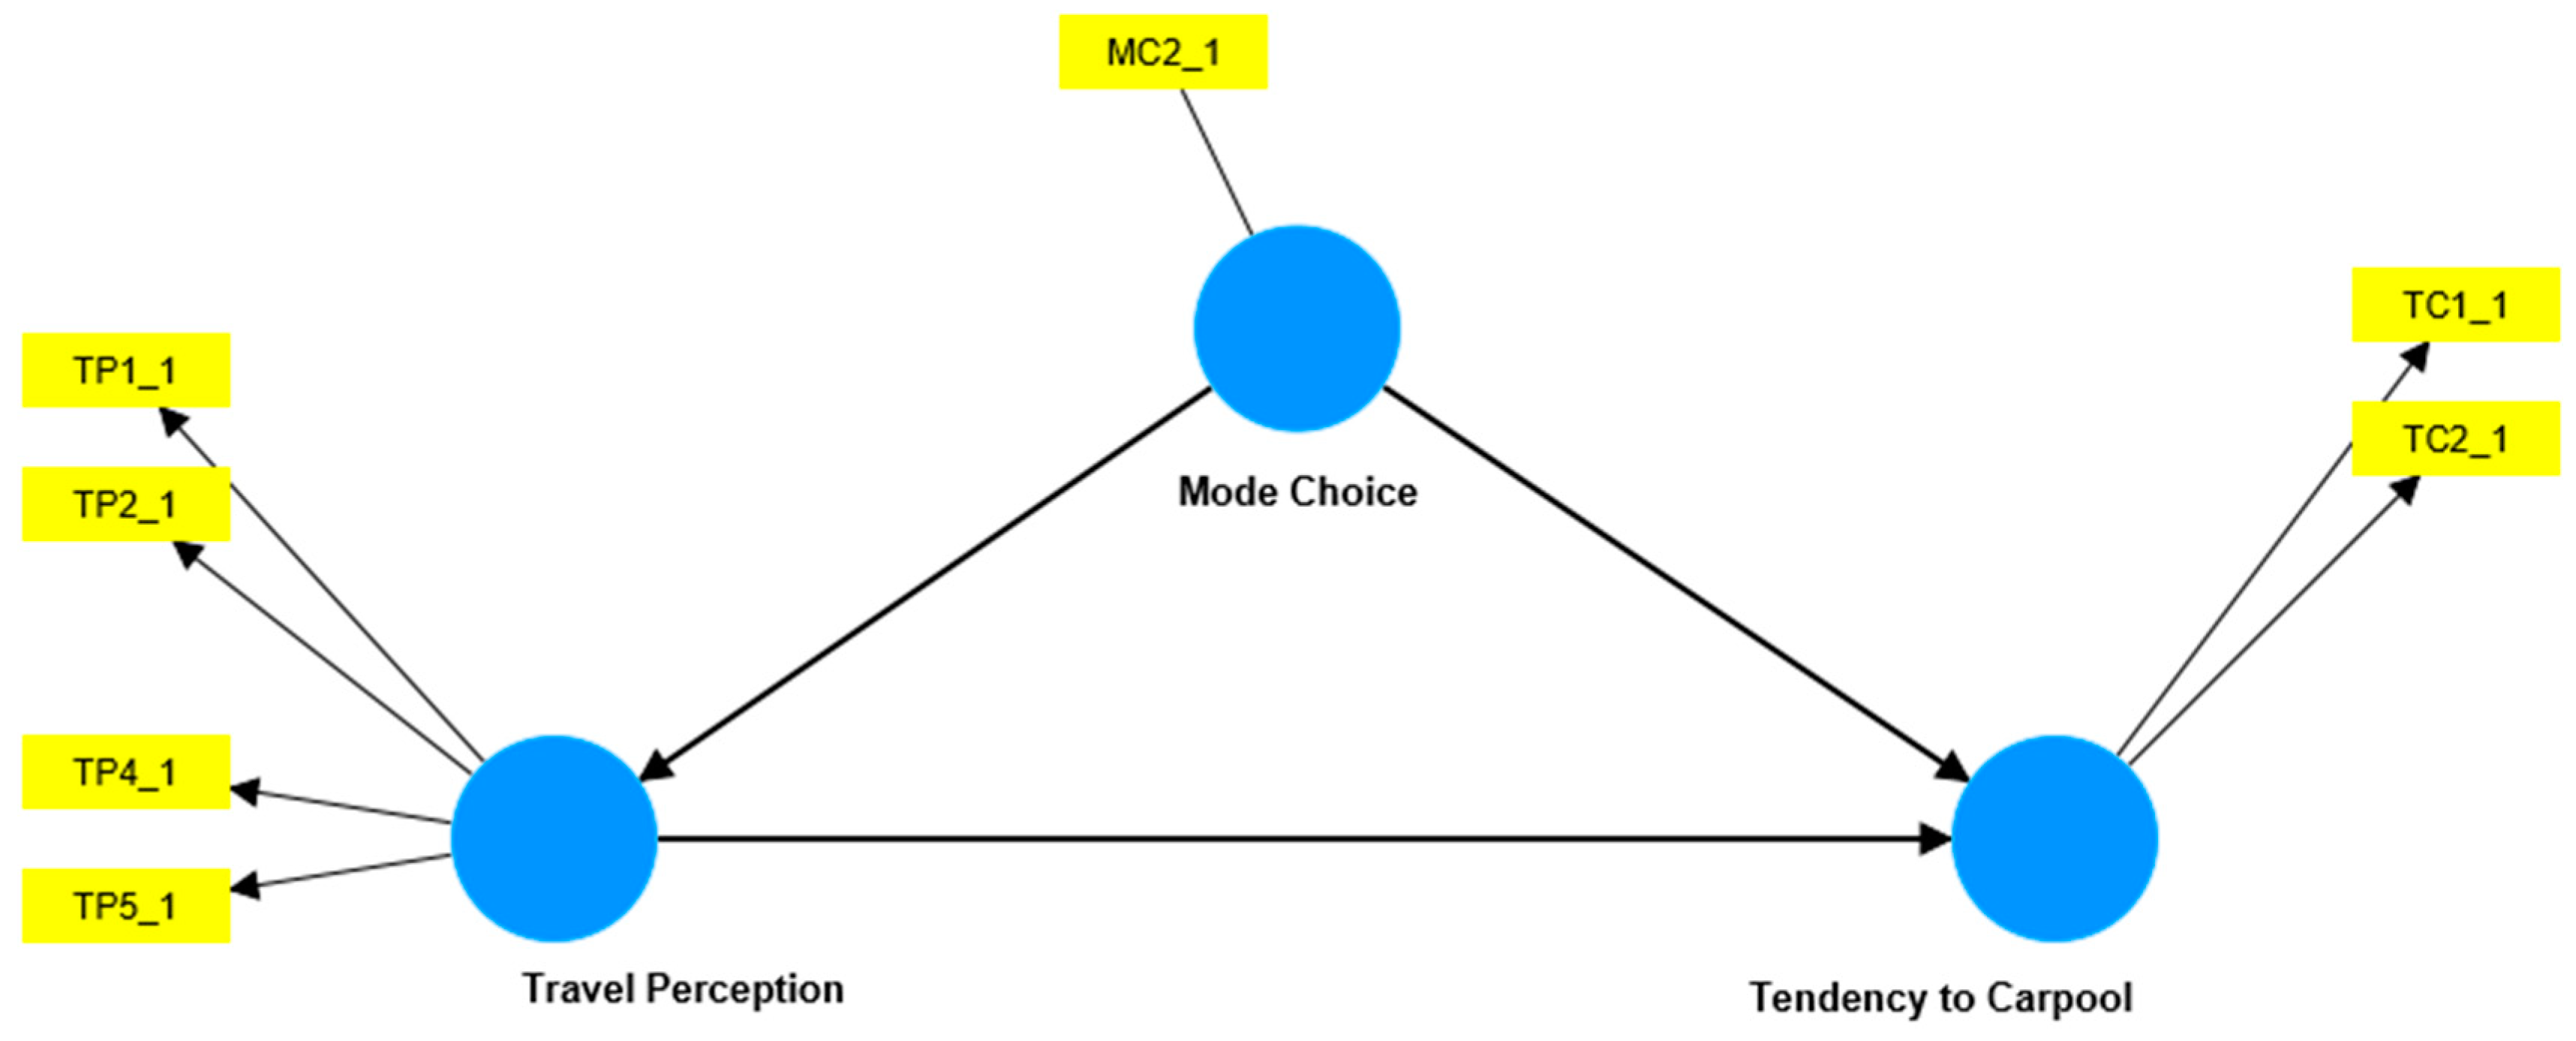
This research aims to determine how travelers feel about CP and the degree to which the general public approves of the practice. In addition, the study aims to assess whether CP influences the time spent in traffic, the amount of gasoline consumed, and the amount of carbon dioxide emissions. A model that has been proposed has been constructed to gain an understanding of the influence that the perceptions of travelers have on their readiness to accept CP as a form of transportation. This model adds mode choice as a mediator, vital in determining the connection between traveler views and their propensity to participate in carpooling. Specifically, this model examines how travelers' beliefs influence their willingness to carpool with other people. Despite this, several models [46, 47] have been developed to influence the degree to which carpooling is adopted as a means of transportation. However, due to the complicated dynamics of carpooling, which include both behavioral factors and technical limits, researchers have also integrated the mediating effect of mode choice to explore its influence on the relationship between traveler perceptions and the desire to carpool. It is because of the complex dynamics of carpooling, which include both behavioral aspects and technical restrictions. Despite these attempts, CP has not been officially promoted or implemented in any part of Pakistan, including Islamabad.
As a consequence of this, the purpose of this research is to investigate the traveler acceptance of CP systems in Islamabad by utilizing a preference survey. The proposed model and the developed hypotheses are evaluated based on confirmatory factor analysis, step-wise and mediated multiple regression. After that, control data of Islamabad is collected to predict the influence on traffic congestion and reduction in fuel consumption and pollution emissions.
3. Results
3.1. Descriptive Analysis
Travel perception is understanding the public's transportation preferences. Thus, trip perception affects carpooling. An online questionnaire-based survey was created. SPSS and Smart PLS were used to analyze the data using the model from the preceding section. Initial validity tests ensured data reliability. CFA and correlation checks followed. Finally, SPSS was used to run a multinomial logit model on carpooling preferences with and without the mediator variable. Cronbach's Alpha, often called CRA, was utilized to determine whether the questionnaire was consistent and reliable. The values of the CRA can range anywhere from 0 to 1, with values closer to 1 indicating more reliability [46, 47]. According to the findings of this investigation, the computed CRA value was recorded as 0.74, indicating that the internal consistency of the questionnaire can be regarded as satisfactory [
67]. It lends credence to the idea that the survey's questions accurately assess the targeted dimensions and that they may be applied to subsequent analyses with a degree of confidence that is at least passable.
Table 1 presents the mean values and standard deviation for model variables:
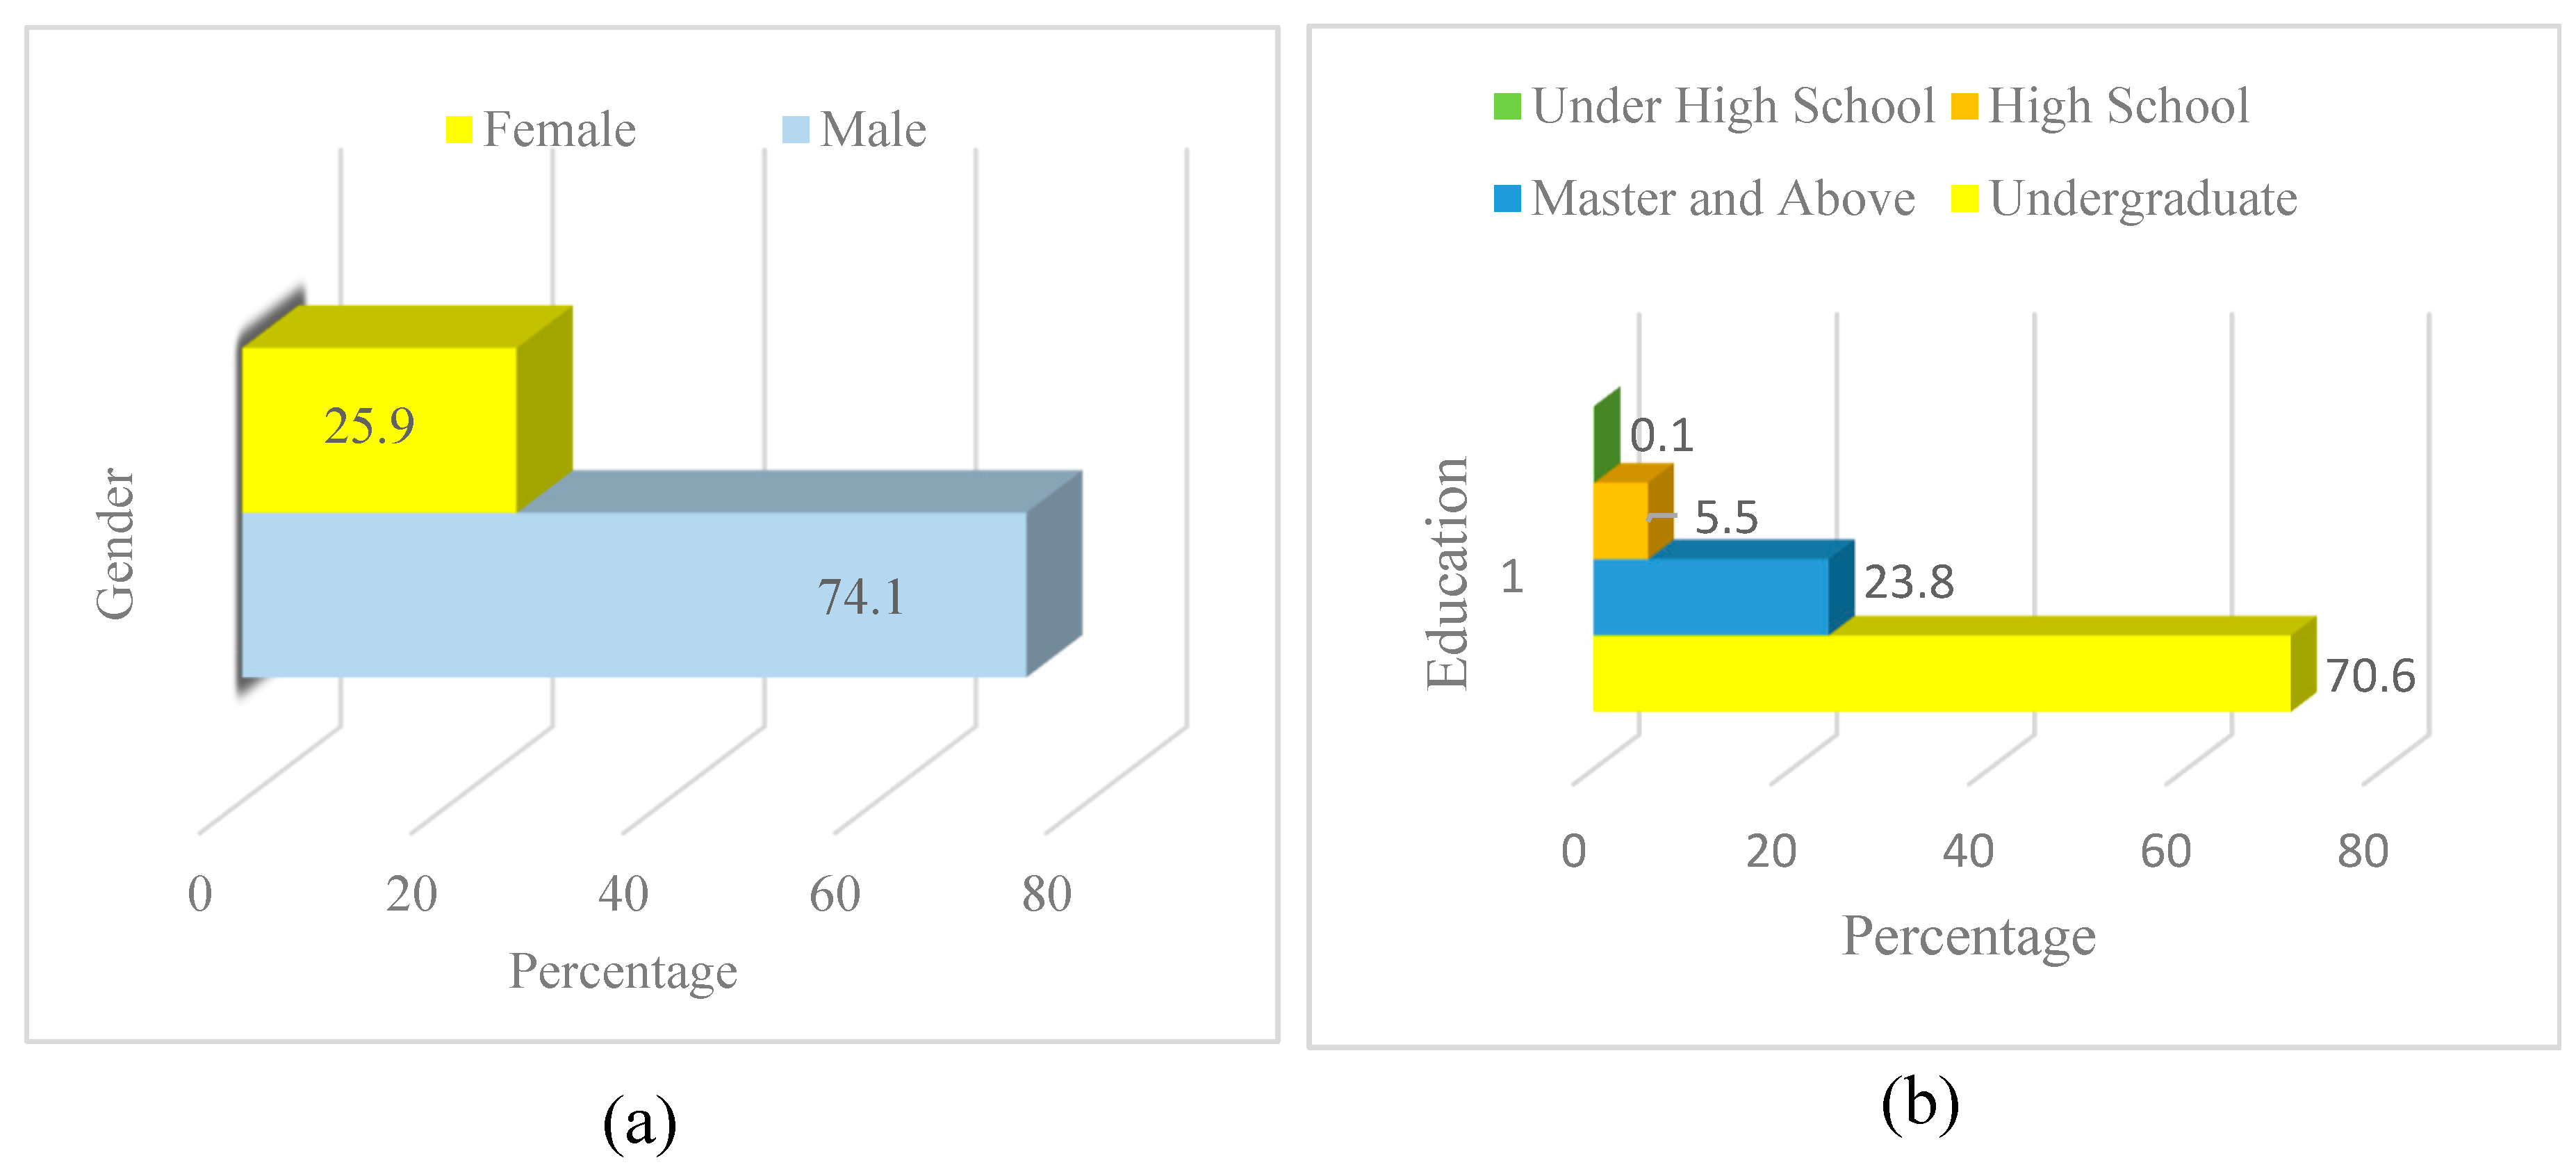
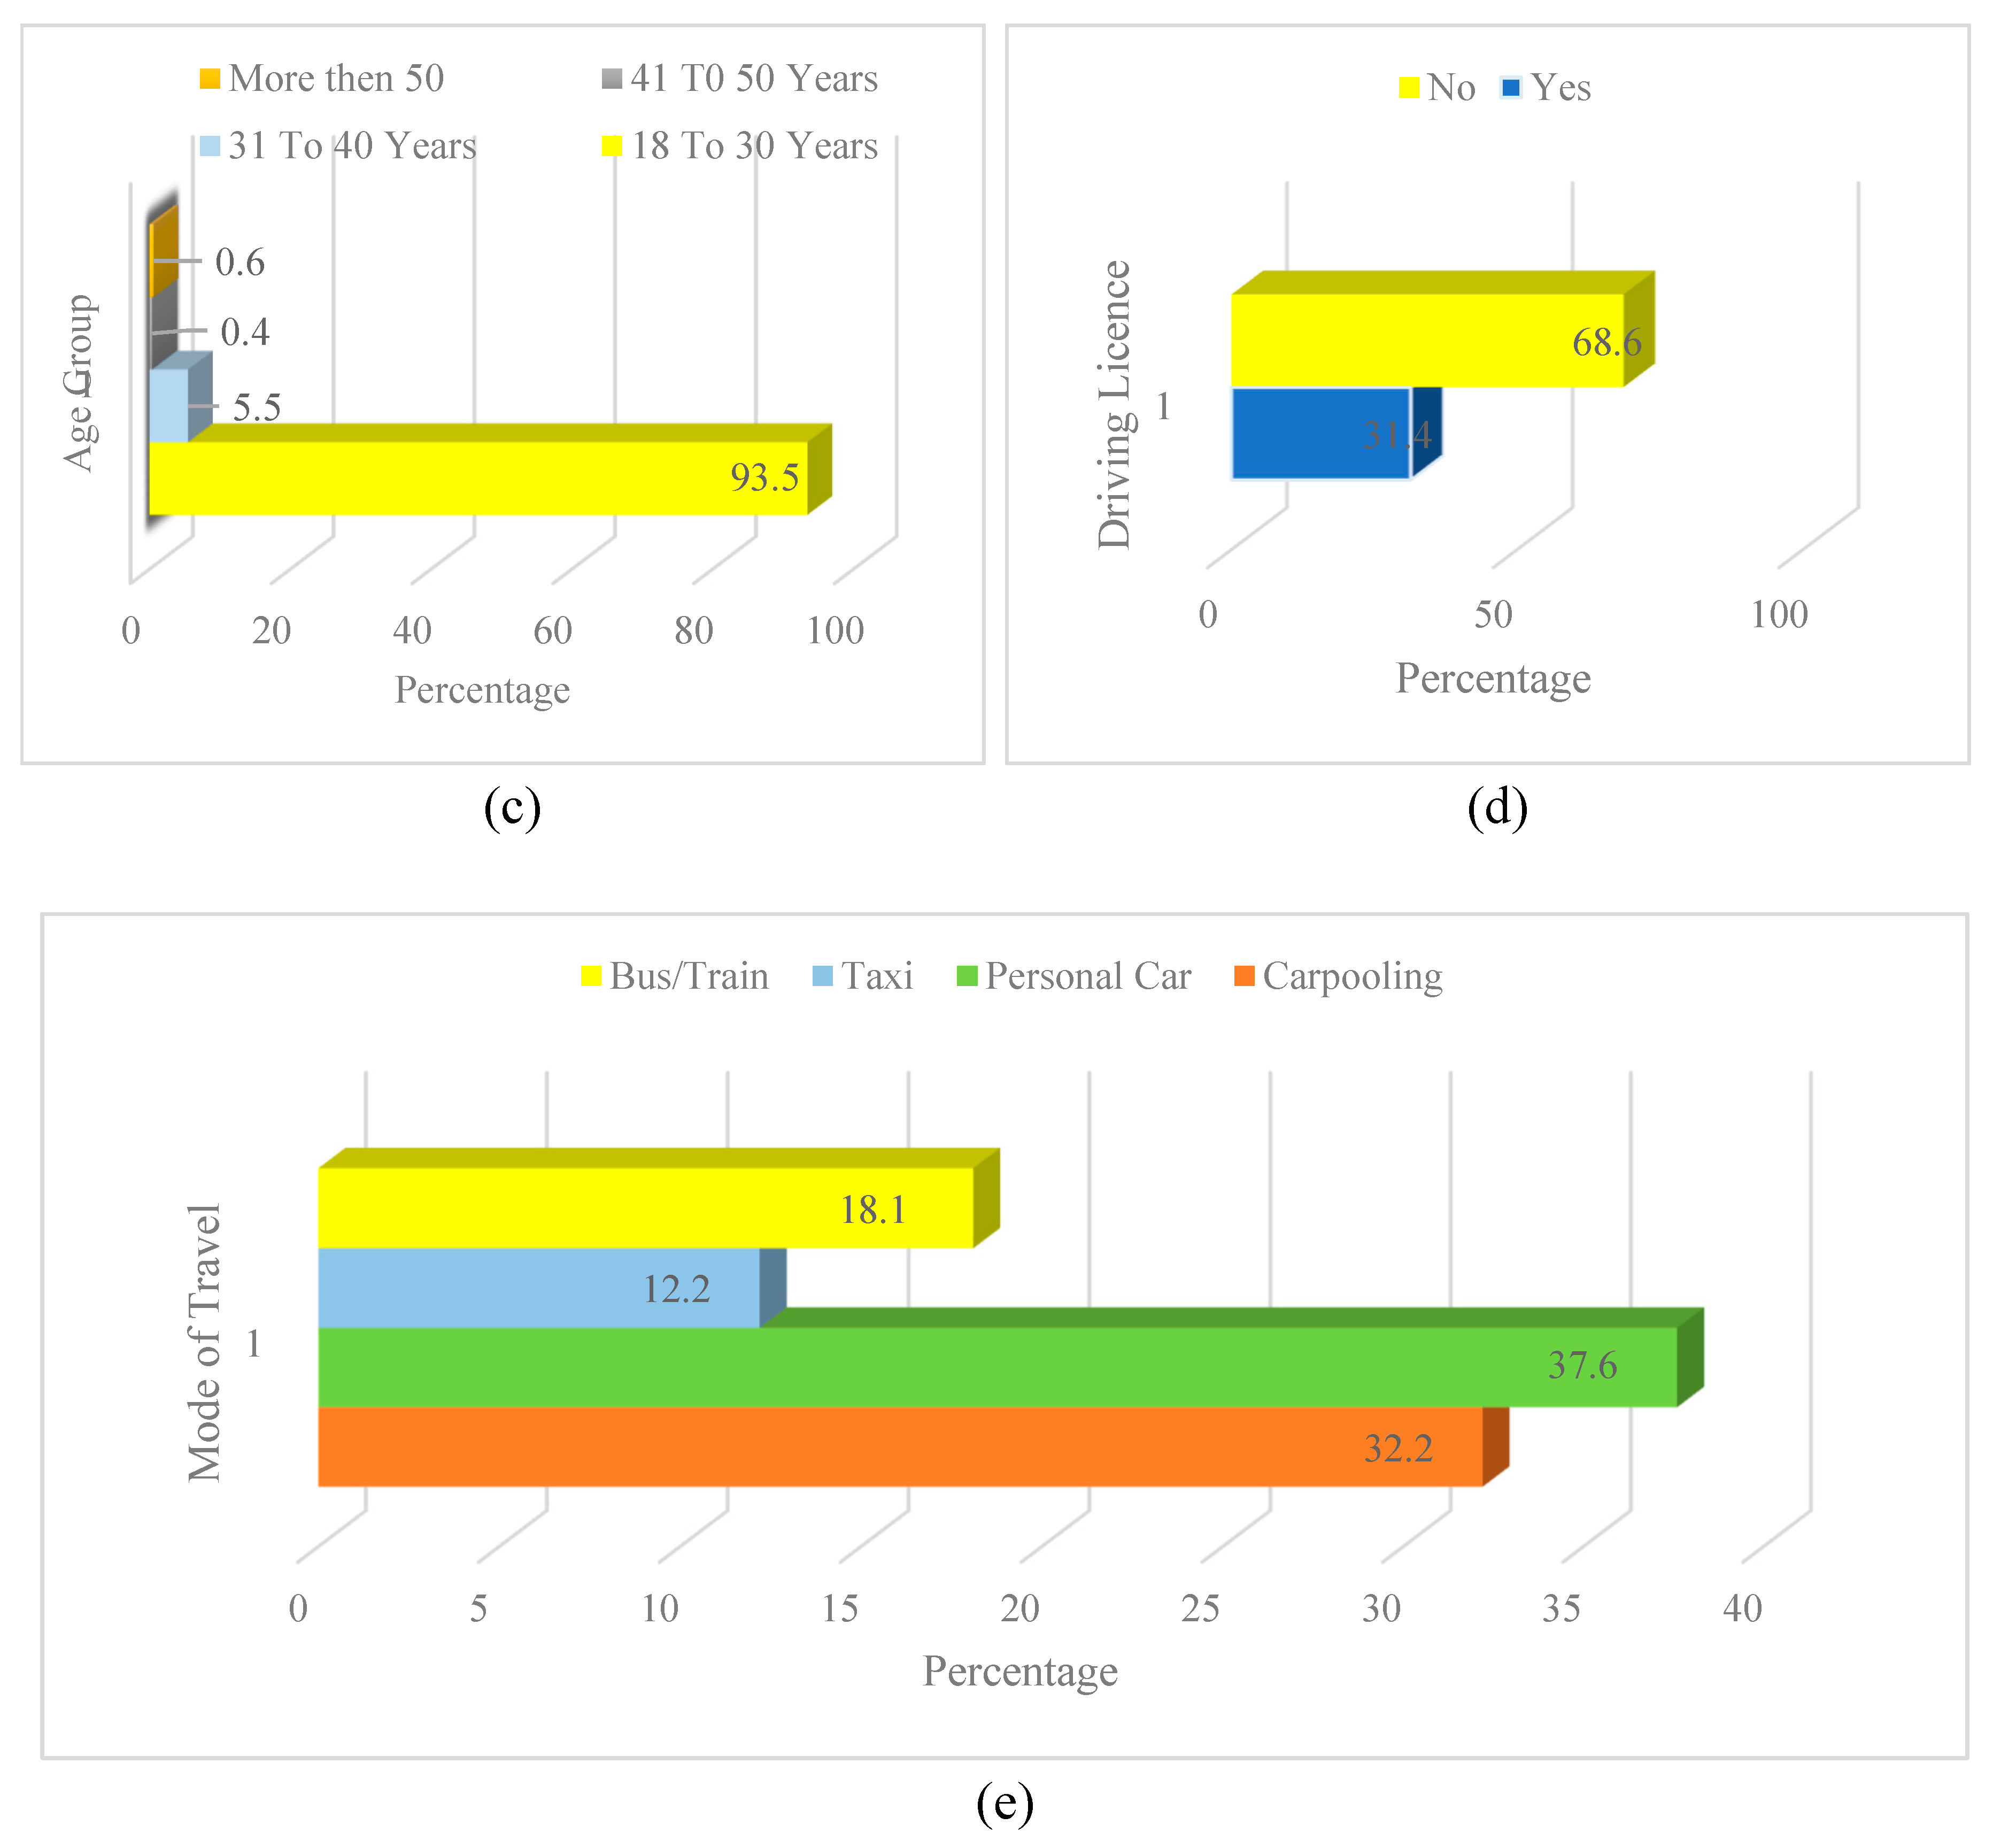
The survey findings are displayed in Figure 5(a), and it can be seen that out of 700 responses, approximately 74.1% of the respondents identified as male, while 25.9% identified as female. Figure 5(b) shows a breakdown of the respondents in terms of their educational backgrounds. It appears that 70.6% of the participants have completed 16 years of school, which usually corresponds to a bachelor's degree, and that 23.8% of the participants have acquired a higher level of education, such as a master's degree or beyond. Regarding the age distribution, Figure 5(c) illustrates that about 93.5% of the respondents are 18 to 30. These demographic numbers are essential for comprehending the features of the study's sample population, as they provide vital insights into the composition of the survey respondents and are provided here for your convenience.
Similarly, the data presented in Figure 5(d) demonstrates that about 31.4% of people have a valid driver's license and can operate a motor vehicle, but 68.6% of people do not hold a valid driver's license. According to the data presented in Figure 5(e), approximately 32.2% of respondents select carpooling (CP) as their favorite form of transportation. There is a connection between these socio-demographic variables and the awareness and perception of the carpool system. According to the results, approximately 68.2% of respondents had some level of familiarity with CP, whereas 31.8% were clueless about this method of transportation. According to the poll findings, around 74.2% of respondents believe that their most favored means of transportation is the carpool system, which is enticing to travelers. In addition, about 79.9% of participants believe that carpooling has the potential to have a significant positive impact on air quality by lowering the number of individual cars that are driven on the roads.
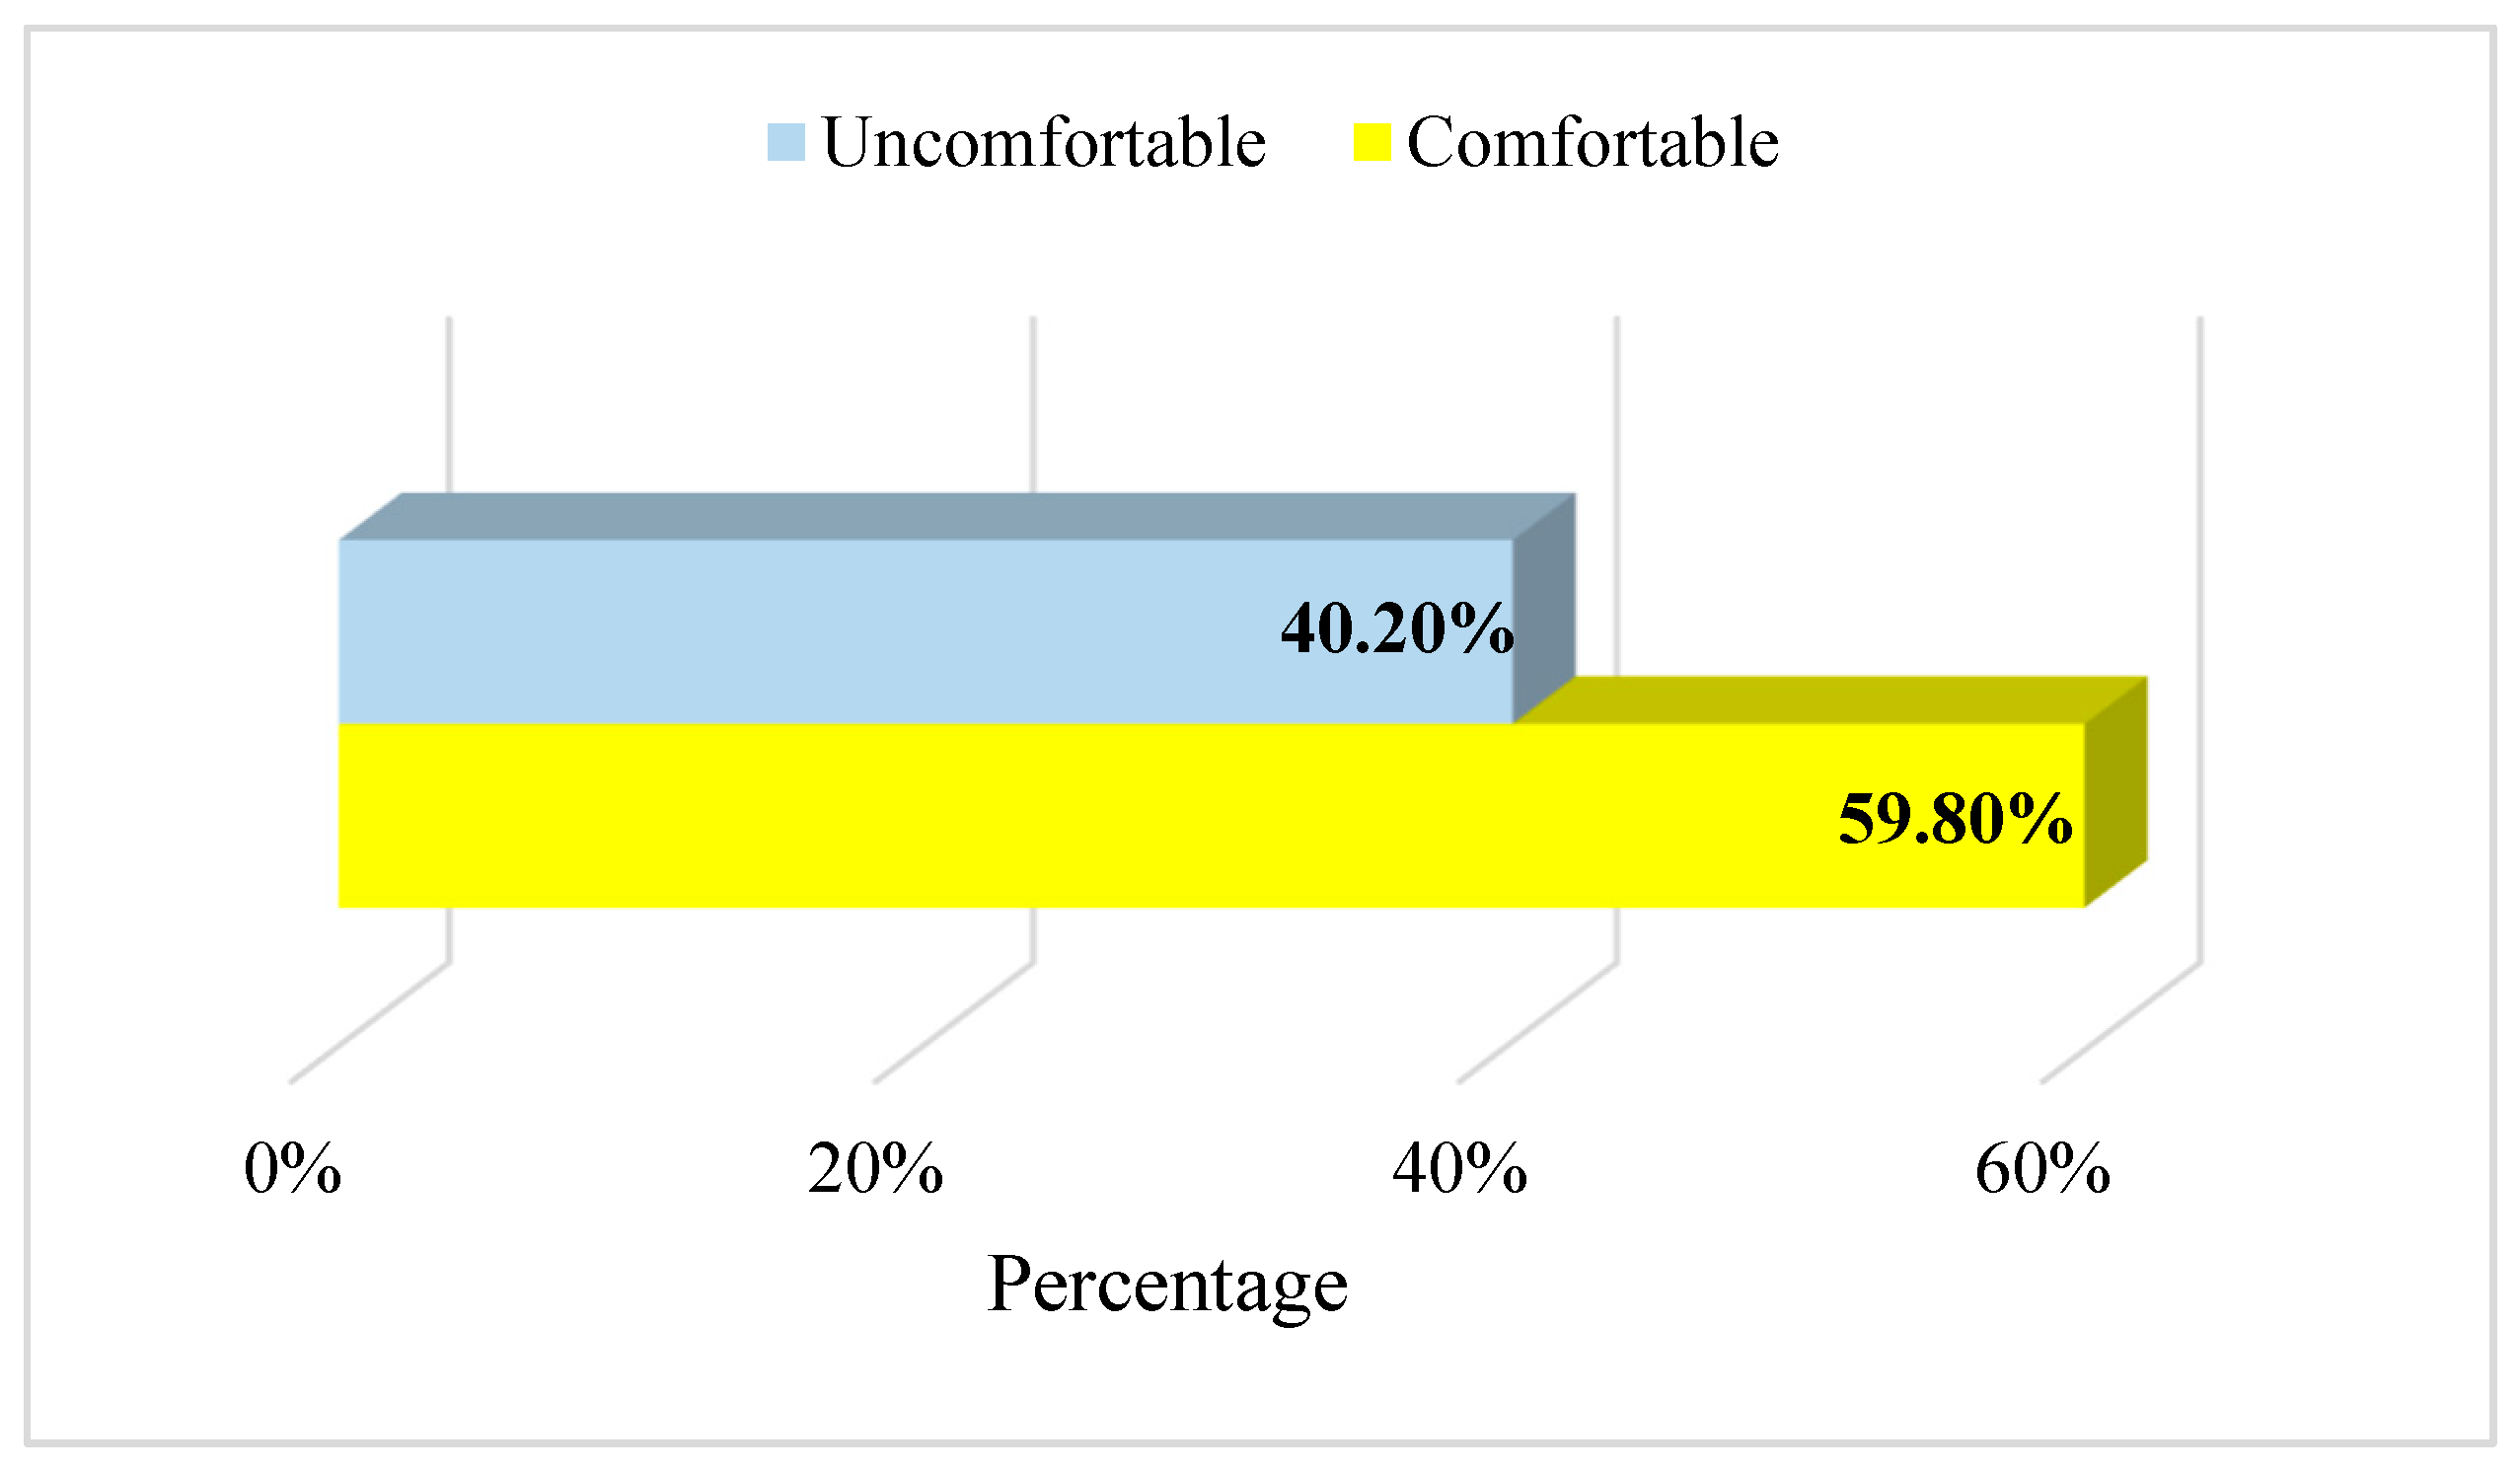
Additionally, 82.8% of the population believes carpooling is a viable solution to the parking issues plaguing metropolitan centers. However, 54 percent of respondents are open to delaying the purchase of a new vehicle if they believe carpooling will properly satisfy their requirements for travel. On the other hand, if the carpool system is adequate to meet the public's transportation needs, 40.2% of respondents are comfortable selling their current cars.
Figure 5.
Carpooling Survey Results conducted in Islamabad, Pakistan, between 2021-2022 (a) Gender; (b) Education; (c) Age; (d) Driving license; (e) Preferred mode of transport.
Figure 5.
Carpooling Survey Results conducted in Islamabad, Pakistan, between 2021-2022 (a) Gender; (b) Education; (c) Age; (d) Driving license; (e) Preferred mode of transport.
According to the questionnaire findings, a sizeable proportion of the participants has a solid understanding of CP systems and carpooling in general. Specifically, 30.3% and 37.9% of respondents know CP. In addition, fifty percent of the respondents believe that sharing a car can improve air quality by lowering the carbon dioxide emissions produced. Carpooling, which reduces the overall number of vehicles on the road, can reduce the demand for parking spots, according to more than half of the people who responded to the survey. Nearly half of those who participated in the survey indicated that they would be willing to postpone the purchase of a new vehicle if carpooling was able to meet the travel demands of their community sufficiently.
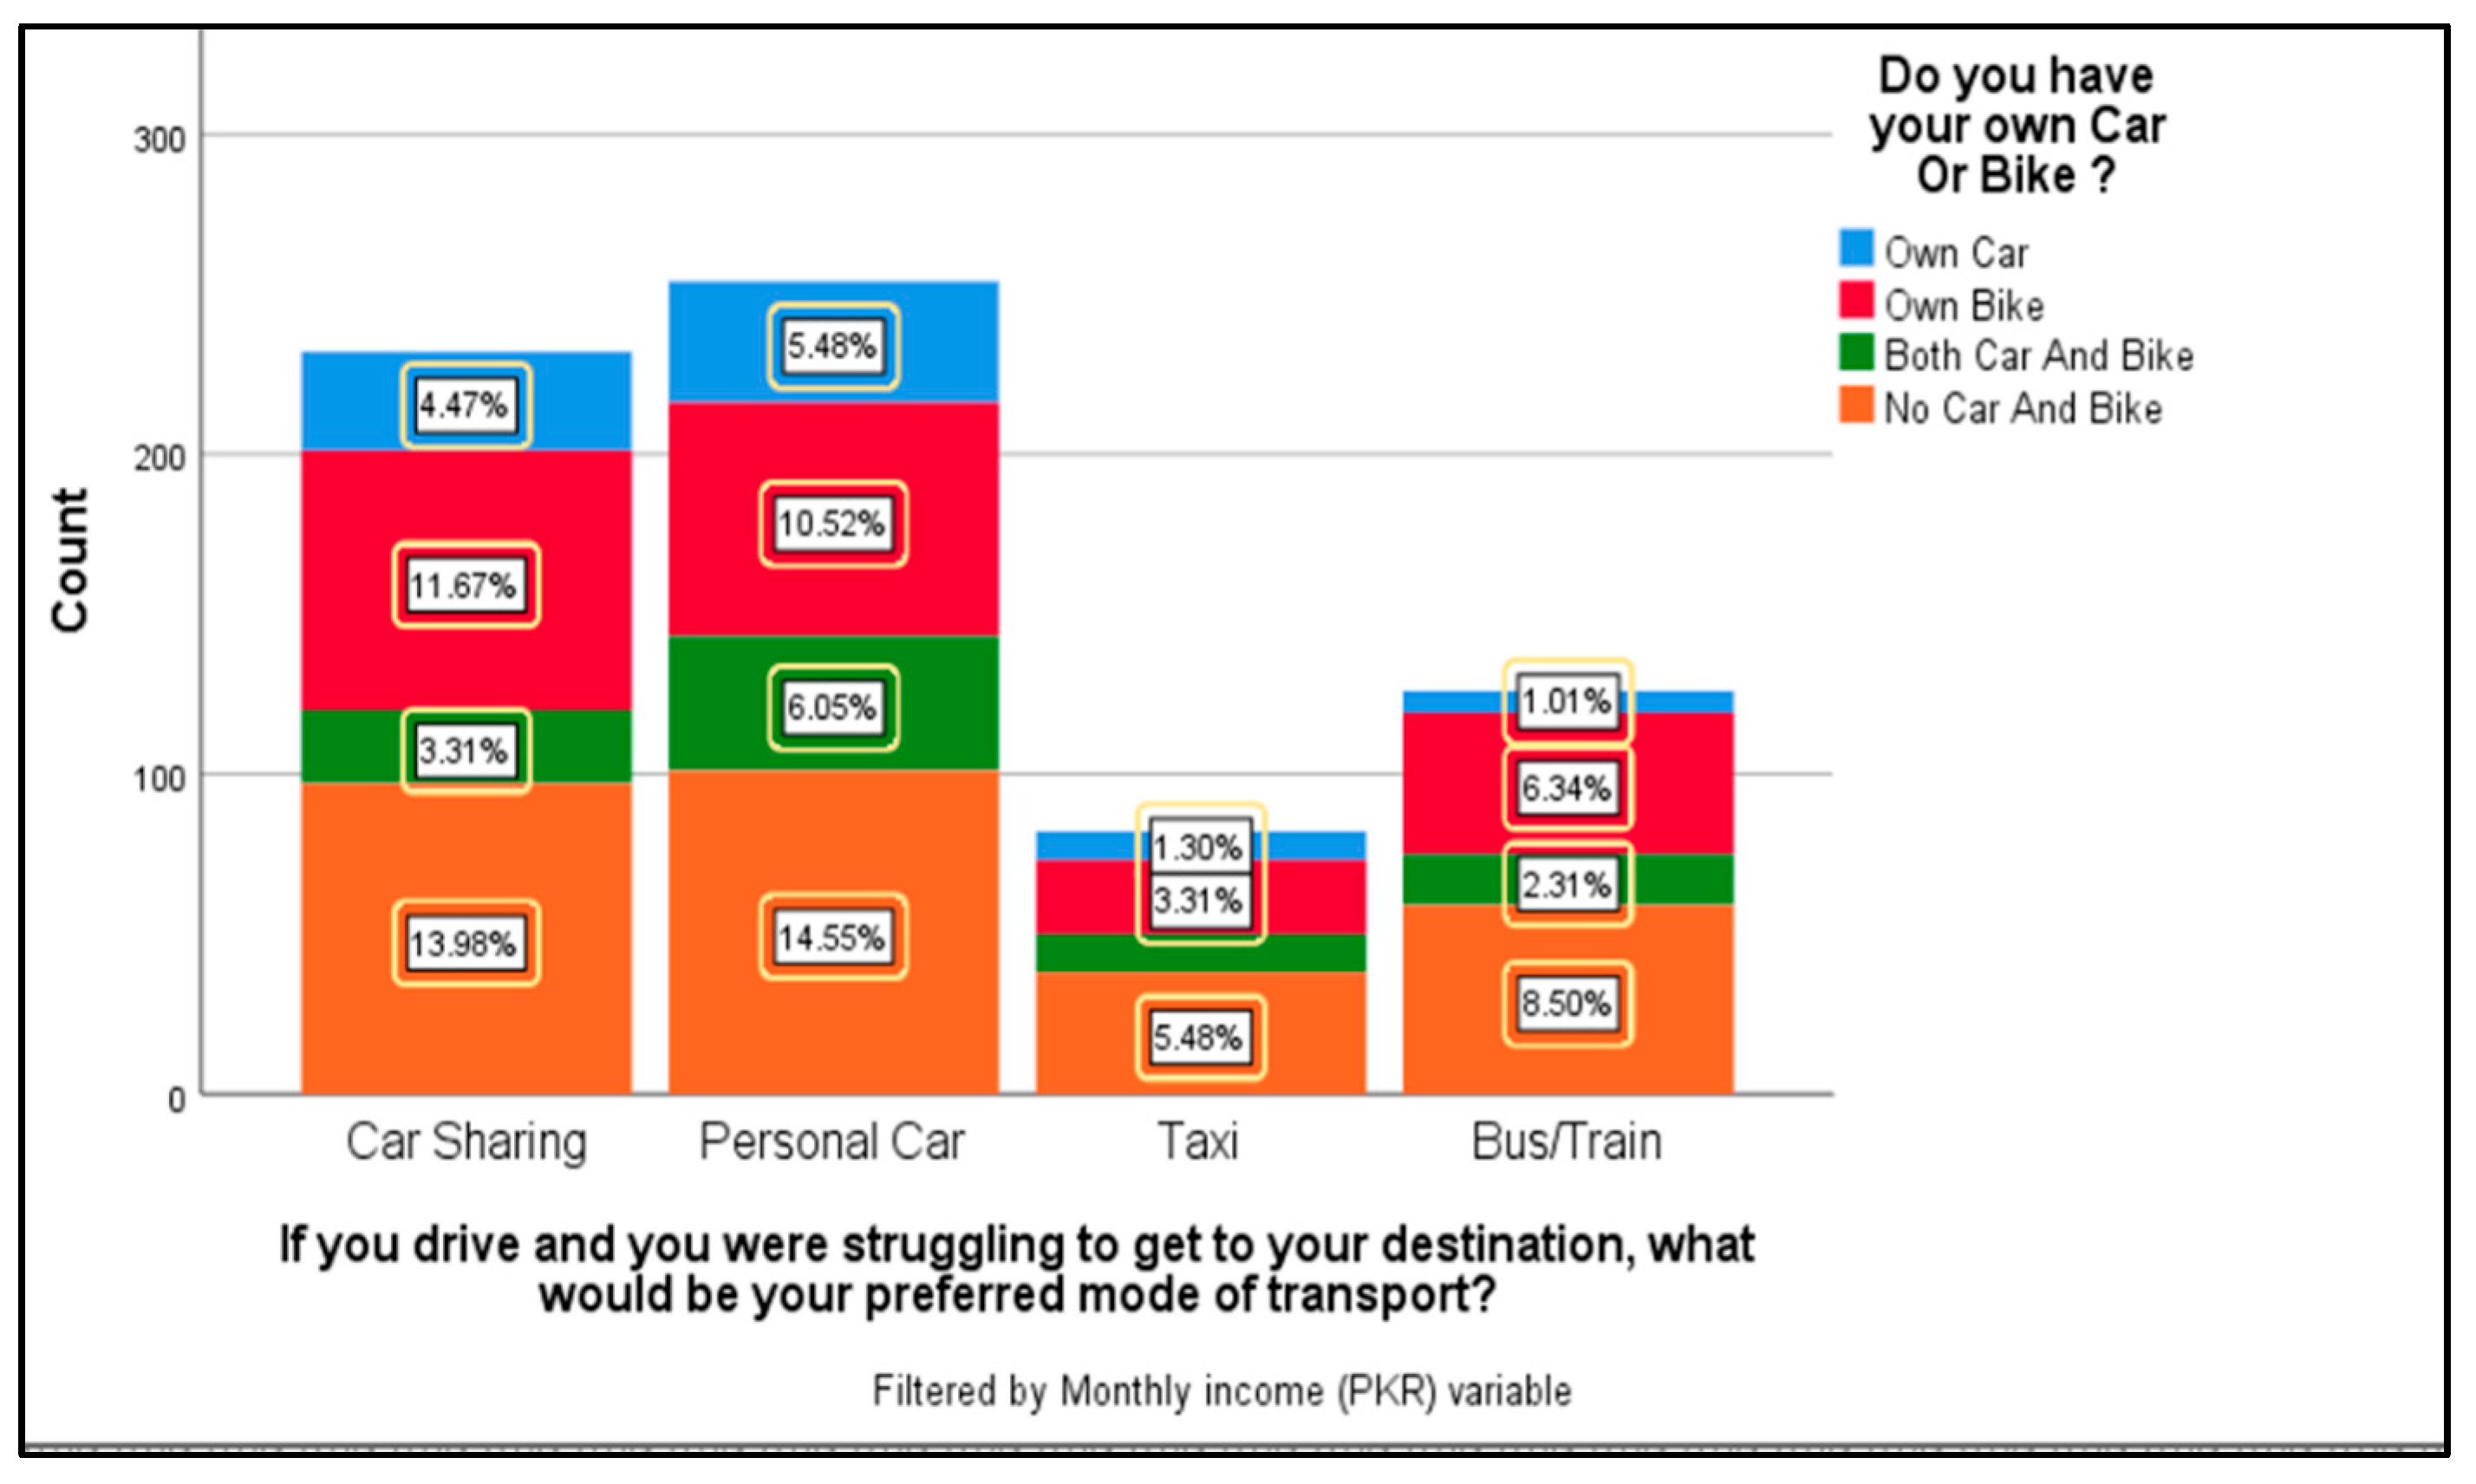
Similarly, roughly forty percent of the participants are open to selling their vehicles if they determine carpooling can efficiently cover their transportation needs. As seen in Figure 6, roughly one-third of the people who participated in the survey responded that they would prefer to carpool even if doing so would make it more difficult for them to reach their destination. On the other hand, approximately 37% of people still favor driving their automobiles as their primary form of transportation. The remaining respondents indicated that their favorite transportation mode was a taxi or a bus.
Figure 6.
Preferred Mode of Transport Survey Results conducted in Islamabad between 2021-2022.
Figure 6.
Preferred Mode of Transport Survey Results conducted in Islamabad between 2021-2022.
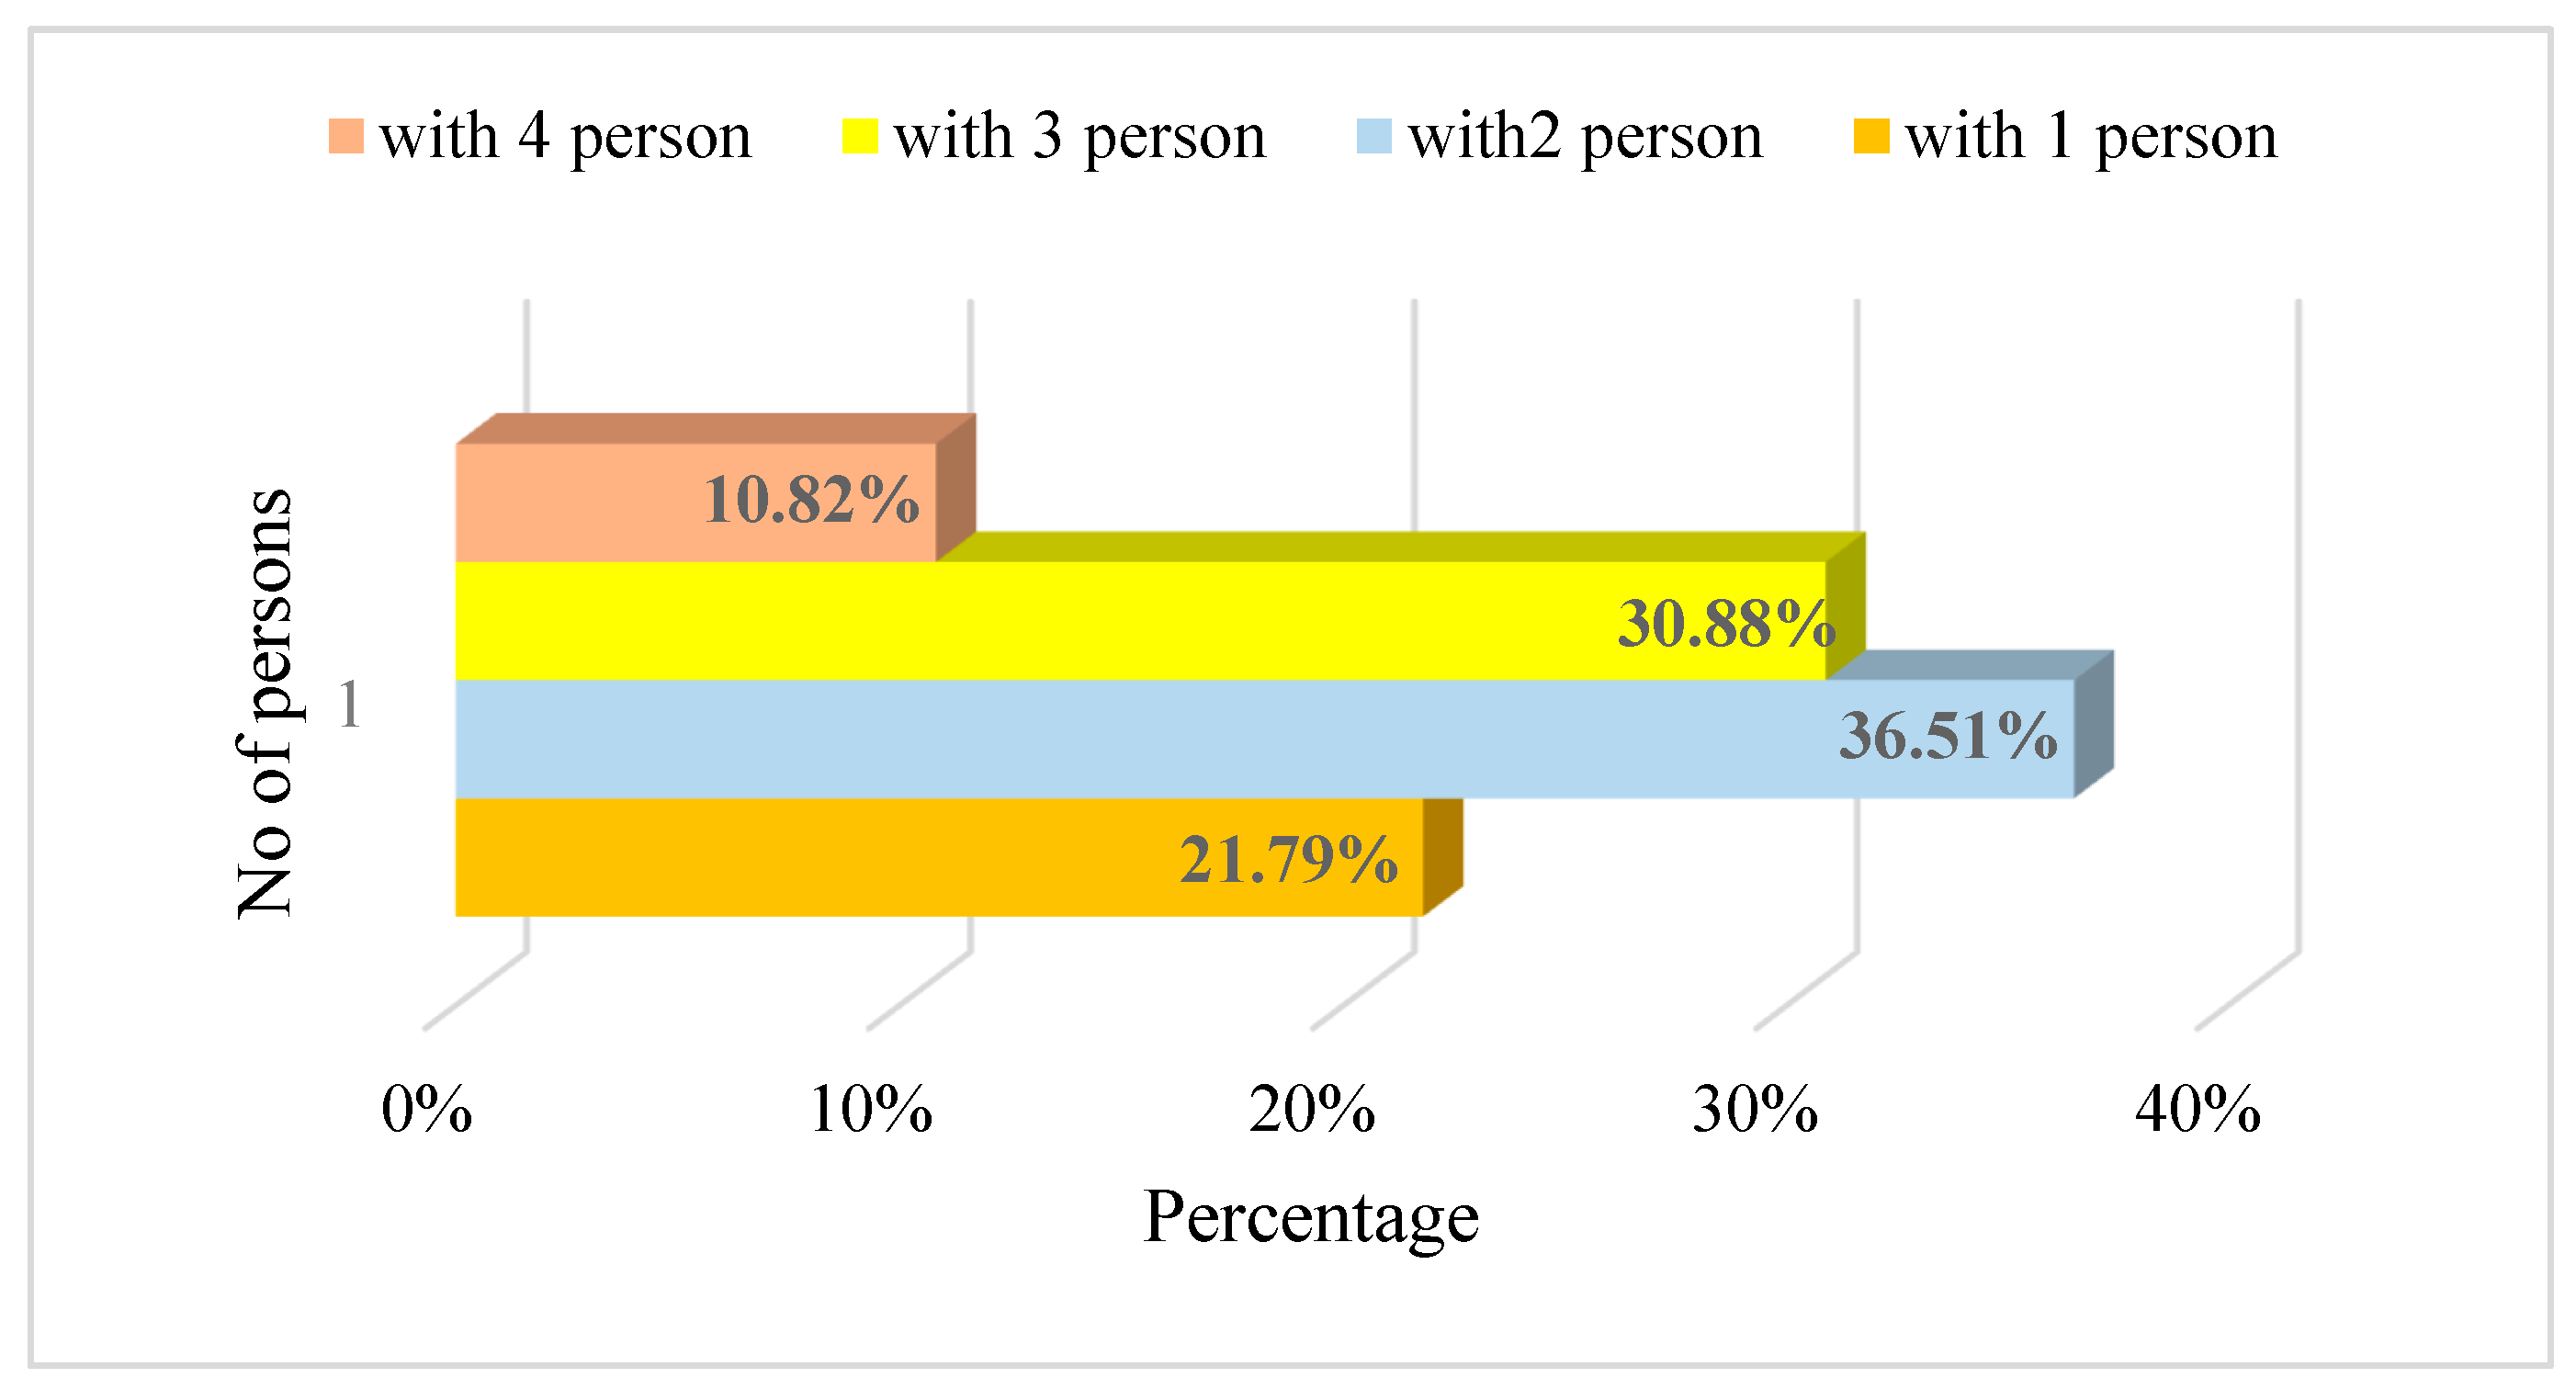
According to Figure 7, it is clear that around 21.79% of the respondents are excited about the possibility of sharing their cars with other people. There are approximately 36.5% of people who are willing to share who prefer sharing their vehicles with two people. In comparison, there are approximately 30.9% who are happy sharing a transport with three people. In addition, approximately 11% of respondents said they would be interested in riding in a vehicle with four or more other persons. In addition, more than half of the respondents are likely to share their journeys with other people regarding motorcycles, which indicates a desire to sit with other passengers to travel together.
Figure 7.
Carpooling number of person Survey results conducted in Islamabad between 2021-2022.
Figure 7.
Carpooling number of person Survey results conducted in Islamabad between 2021-2022.
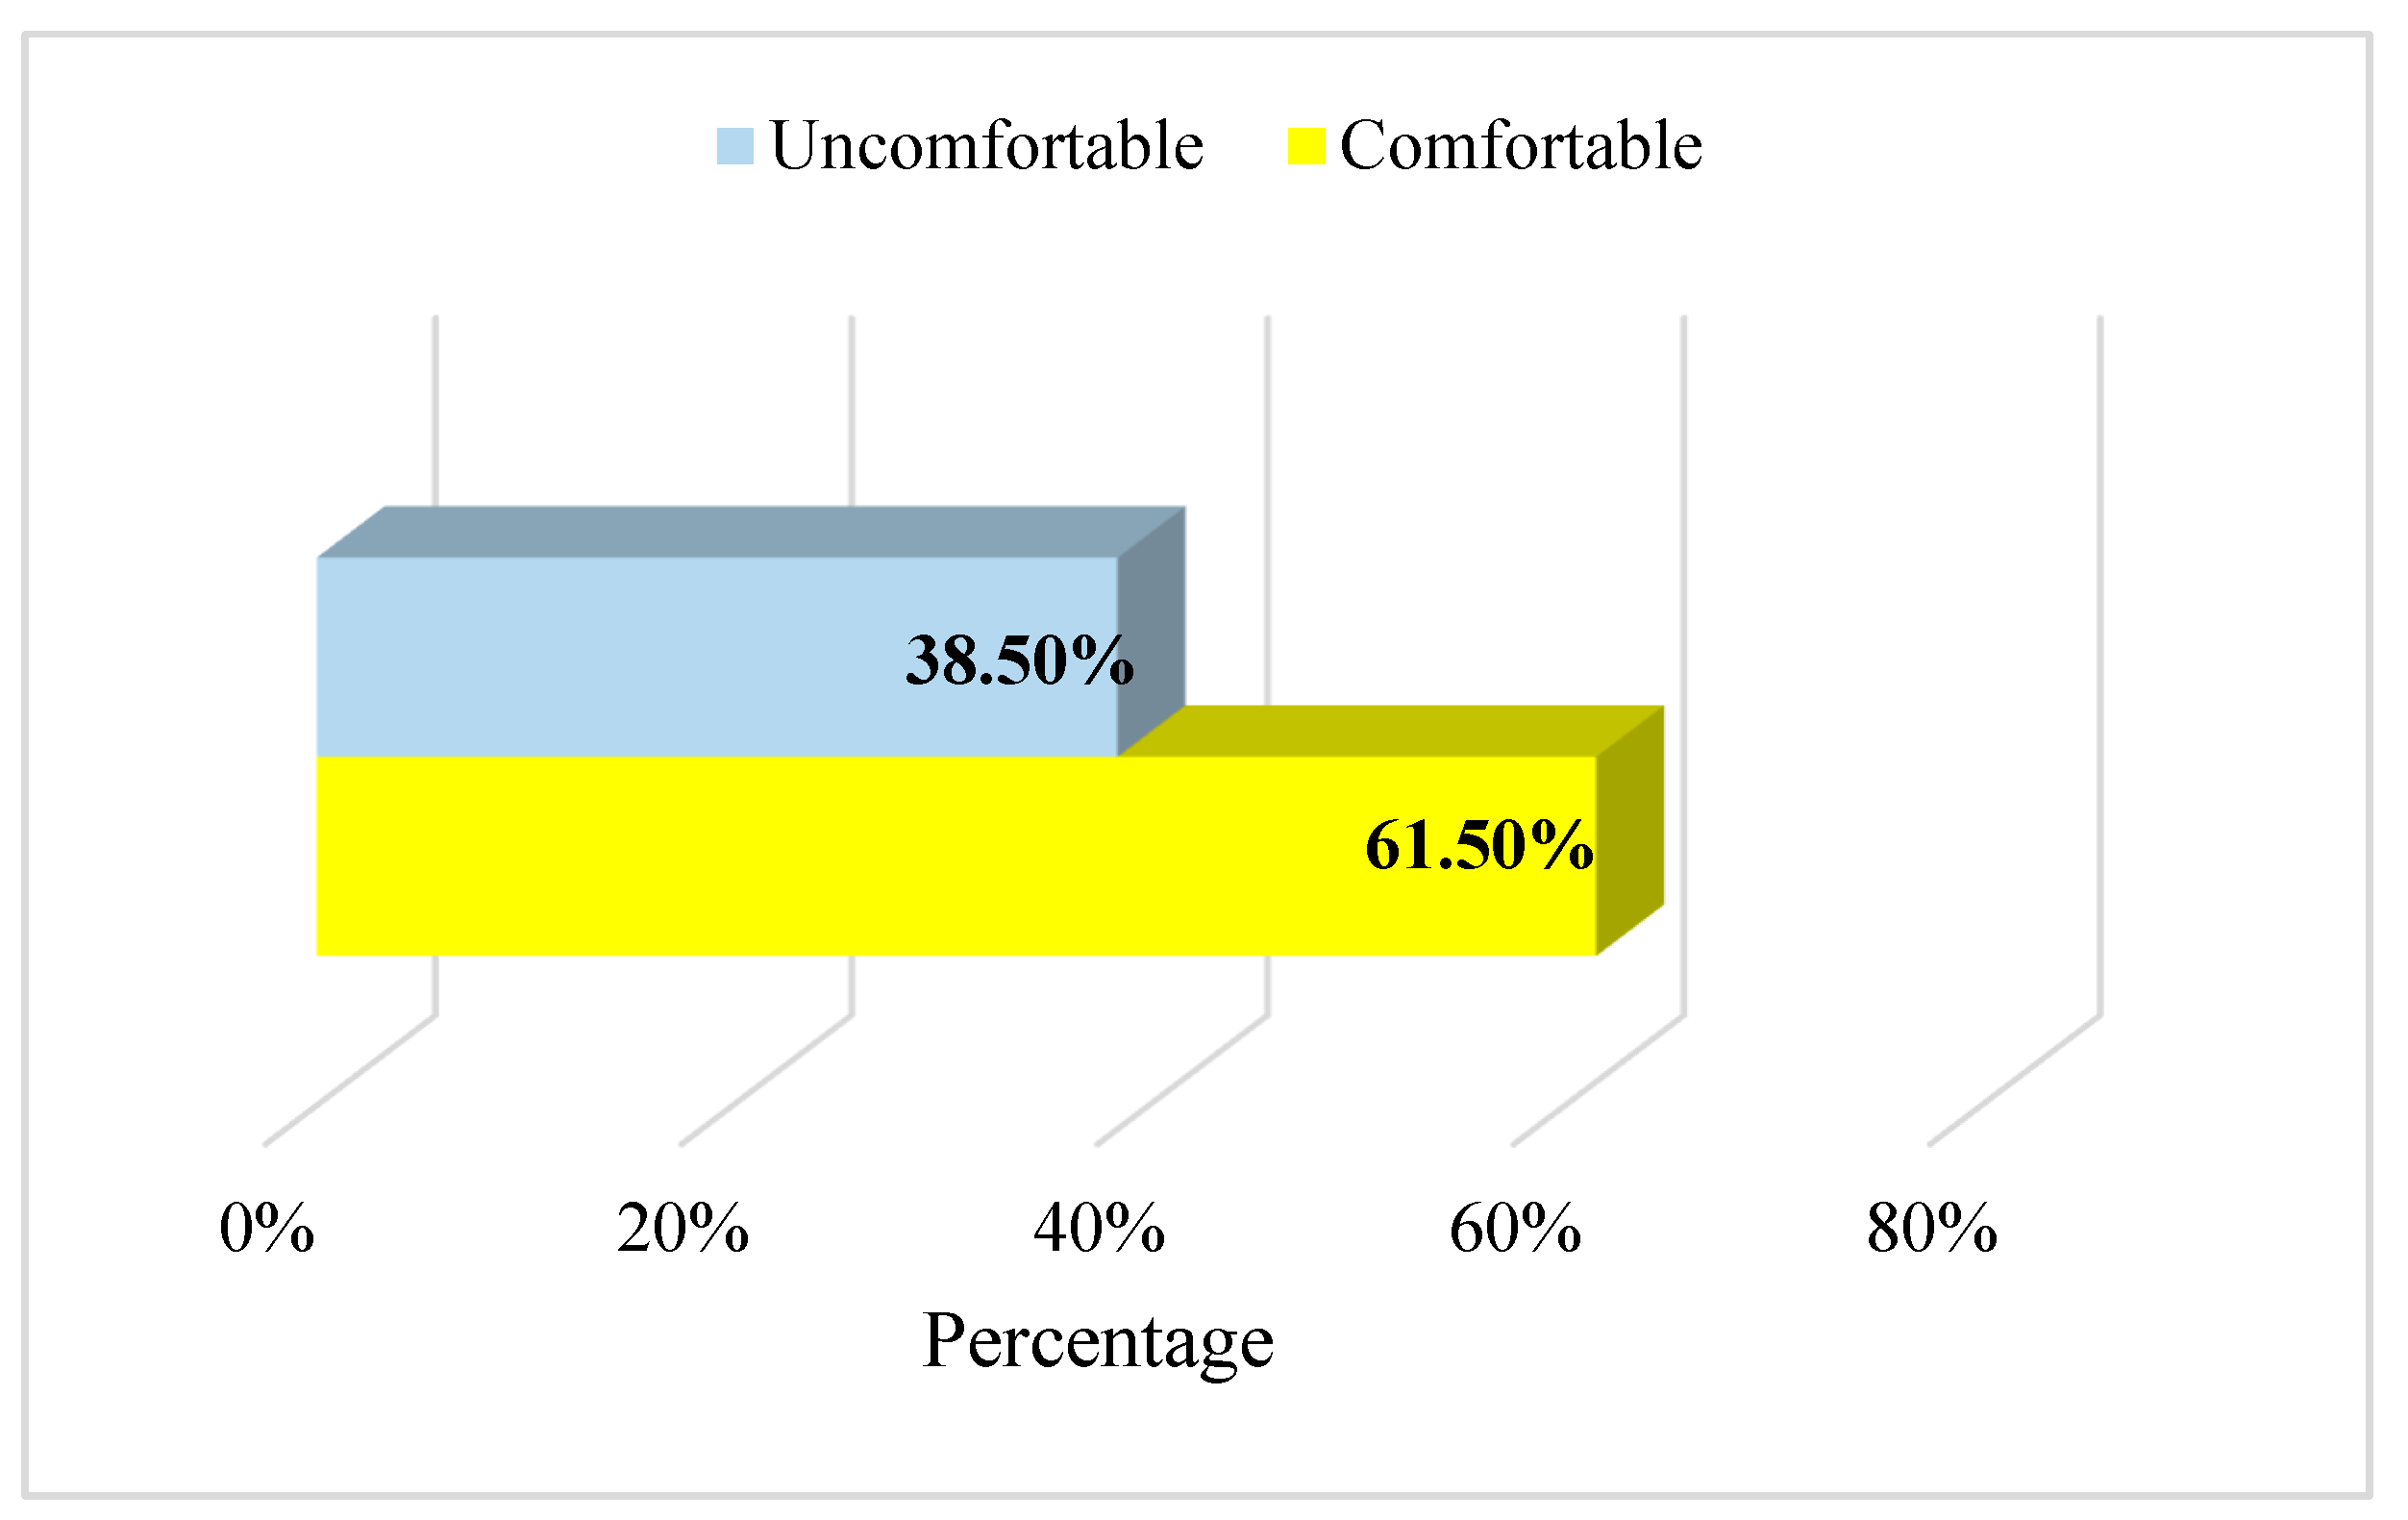
Figure 7 provides more insights, revealing that a substantial portion of the population, specifically more than half, agrees to and intends to select carpooling as their preferred method of travel when High Occupancy Vehicle (HOV) lanes are available. It is shown by the fact that the figure indicates that a significant portion of the population agrees to and intends to opt for carpooling as their preferred mode of travel. HOV lanes, also known as carpool or diamond lanes, are a kind of traffic management aimed to incentivize and encourage ridesharing. Other names for HOV lanes include carpool lanes and diamond lanes. Congestion relief and increasing the carrying capacity of roads and highways to accommodate more people promptly are the critical goals of this initiative. This method has gained popularity, particularly among those who visit the exact location daily, such as people who commute to work or attend school at a university or college. Surprisingly, over 57.8 percent of those surveyed listed carpooling as their top choice when selecting a mode of transportation for their daily commute. These findings prove the widespread acceptance and favorable reception of carpooling as a viable choice for addressing day-to-day transportation demands, mainly when supported by HOV lanes. The accessibility of HOV lanes lends an additional boost to the desirability of carpooling as a method of transportation that is feasible and effective for the daily commute. According to Figure 8, one of the perceived drawbacks of carpooling, particularly in developing countries, is the potential risk to the safety of drivers and passengers. A level of confidence and a readiness to share rides with unknown individuals is indicated by the fact that approximately 61.5% of the respondents felt comfortable offering a ride to a stranger. Figure 9 demonstrates that approximately 59.8% of people are content with their lives and would be prepared to provide a ride to a stranger going from one location to another. This conclusion implies that a sizeable section of the public is receptive to sharing transportation with unfamiliar people, despite the inherent risks connected with carpooling in specific locations or settings.
Figure 8.
Share ride with strangers Survey results conducted in Islamabad between 2021-2022.
Figure 8.
Share ride with strangers Survey results conducted in Islamabad between 2021-2022.
Figure 9.
Receiving Ride from Stranger's survey results conducted in Islamabad between 2021-2022.
Figure 9.
Receiving Ride from Stranger's survey results conducted in Islamabad between 2021-2022.
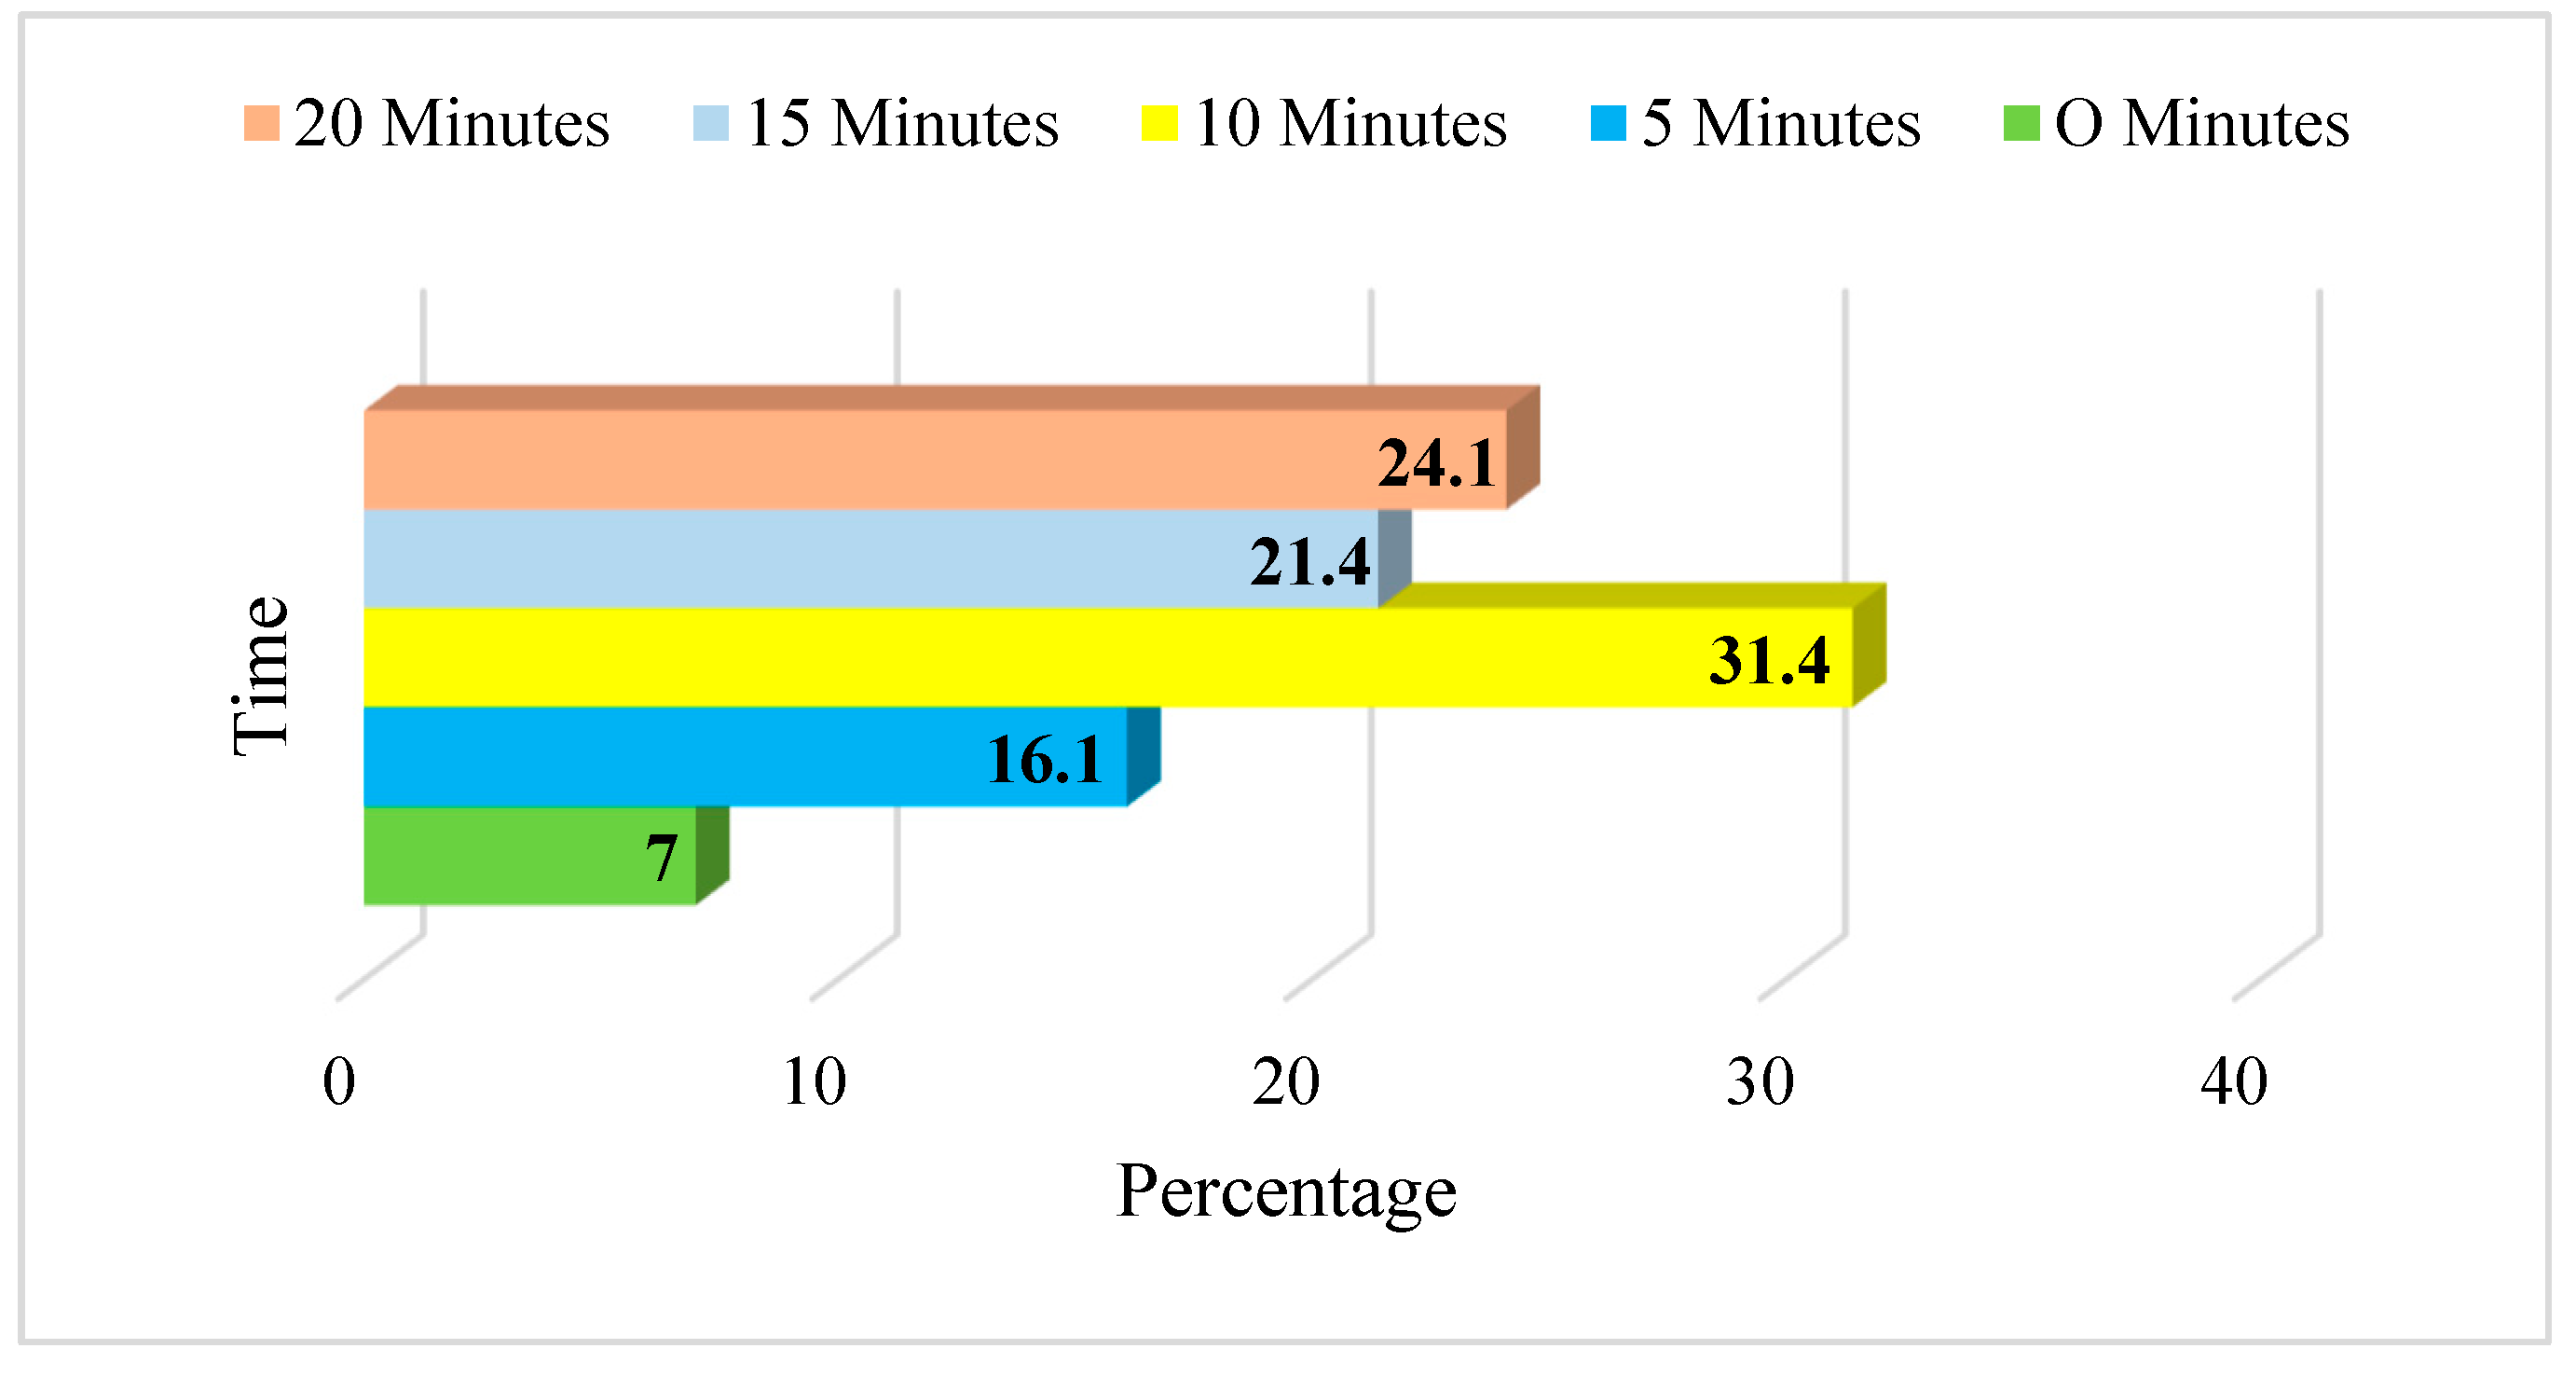
Figure 10 offers insight into the various elements that motivate and encourage riders or drivers to adopt carpooling as their mode of travel by providing a breakdown of these factors. Around 31.4% of those surveyed answered that if there were a 10% reduction in time spent traveling, they would be more likely to carpool. A reduction in journey time of 15 minutes motivates 21.4% of the total respondents, while 24.1% of persons found a reduction in travel time of 20 minutes appealing. In addition, 16.1% of the total respondents claimed that even a reduction of 5 minutes in the time it takes to travel would motivate them to use carpooling for their travels. In addition, a sizeable percentage of respondents, 72.6%, stated that the motivation to select carpooling as a form of transportation comes from people's desire to protect the environment and lower their carbon dioxide emissions. This finding shows the good environmental impact and the need to choose eco-friendly options when it comes to preferences for travel.
Figure 10.
Travel time reduction results of a study conducted in Islamabad between 2021-2022.
Figure 10.
Travel time reduction results of a study conducted in Islamabad between 2021-2022.
24.5% think carpooling reduces travel costs, while 57.9% seek a 50% reduction. Long and short carpools are possible. 39.8% preferred ridesharing 10–20 kilometers, 23.5% less than 10 km, and 17.1% long trips. 64.5% of people wanted to utilize CP for random city travels. Nearly 25% of carpoolers save money. 24.5% agree. 57.9% want to cut travel costs by 50% by carpooling. Carpooling is flexible for short and long trips. 39.8% of respondents chose ridesharing for 10–20 km journeys, while 23.5% preferred less than 10 km. 17.1% of people carpooled for lengthier trips. 64.5% of city residents want to carpool for short journeys.
3.3. Control Variables
In the research, a one-way analysis of variance (ANOVA) was carried out to investigate and control the variation in the propensity to share a ride to work, taking into account various demographic factors. The findings showed a significant gap in the likelihood of different groups, differentiated by gender and educational attainment, participating in carpooling. According to this, gender and educational backgrounds significantly determine whether persons are likely to share a ride in a carpool. On the other hand, the study did not identify any significant differences in the propensity to carpool when the demographic factors of age, employment, and monthly income were considered. It suggests that these factors may not significantly impact the likelihood that individuals will participate in activities that involve carpooling. From
Table 2, the most significant demographic variables are gender and education. It implies that willingness to adopt carpooling varies significantly among gender classes and across people's education levels. The level of education substantially affects the desire to adopt carpooling for daily activities in the city.
3.2. Confirmatory Factor Analysis (CFA)
Confirmatory factor analysis (CFA), a reliable statistical method for assessing the relationship between variables, was applied to analyze the validity measurements of the scales. The results of this examination can be seen in the following paragraph. The number of scale items employed for each variable in the research study was refined with the help of this strategy, which played an important part in doing so.
Figure 11 and
Figure 12 each show the results of the confirmatory factor analysis performed on level 1 and level 2, respectively. After the figures, a detailed analysis of the findings is presented based on the important criteria of the investigation and stated further down.
Table 3 indicates factor loadings and convergent validity of each variable.
Figure 12 and
Table 4 above show that Smart PLS software calculated each item scale's factor loadings. According to the recommendations of several experts in the field of social science [68-70], the acceptance threshold for the factor loadings of each item must be much greater than 0.6 for each item scale. Level 2 of the confirmatory factor analysis is depicted below in
Figure 12. After eliminating scale items that did not meet the specified factor loading threshold of 0.6, the CFA level 2 variable set consists of variables. The improved item scales are displayed in the figure that may be found below:
3.4. Correlations
Correlation analysis shows the relationship between the variables. The results of the correlation analysis are presented in
Table 4.
Table 4 indicates the degree of association between each variable of the study. All these variables have significantly low to moderate degrees of correlation among them. The table also suggests a significant and positive correlation exists between travel perception, mode choice, and tendency to carpool. It provides information on the strength and direction of the relationships between these three variables, which can help understand their patterns and potential interactions.
3.5. Multiple Regression Analysis
Step-wise multiple regression analysis was performed to examine the main effects of the variables in the model. The findings of multiple regression analysis are presented in
Table 6, indicating that travel perception significantly affects the tendency to carpool (β = .274, p < 0.001), which hypothesis supports H1. Similarly, the mode choice also substantially impacts the tendency to carpool (β = .094, p < 0.001), thereby helping hypothesis H2.
3.6. Mediated Regression Analysis
Mediated regression analysis is used to identify that the mediating role mediates the relationship between a dependent variable and an independent variable. Mediated regression analysis was performed to check the mediating effect of mode choice between the relationship between travel perception and the tendency to carpool. The result presented in
Table 6 indicates that the direct effect of paternalistic leadership and project success is significant (β = .2921, p< 0.05). It also shows that travel perception positively relates to mode choice (β = .1920, p< 0.05), supporting hypothesis H3. Similarly, mode choice is positively associated with a tendency to carpool (β = .1246, p< 0.05). Moreover, the direct effect between travel perception and the preference to carpool is greater than the indirect effect between them through a mediator, i.e., mode choice, which is (β=.2682, p<0.05), so partial mediation exists, thereby supporting hypothesis H4.
3.7. Reduction Estimation of Traffic-Related Parameters
The car reduction on the automobile (CR) was determined using equation (2). It is required to have accurate data regarding the typical distance traveled by an individual on a daily, weekly, monthly, and annual basis to come to this conclusion. This information is essential for calculating the number of automobiles needed for personnel, which directly impacts the congestion on the roads, the demand for fuel, and the emissions of harmful gases caused by vehicles. Consequently, equation (3) calculates the typical amount of driving done in a month. Similarly, one may use equation (4) to get the typical distance traveled for a year. The particulars of the equations are presented in
Table 7:
CR stands for the number of fewer cars on the road, TCC for the total number of cars in the city, and PC for the percentage of residents who desire to share their cars with others (based on a survey).
Where AVTM stands for the average number of miles driven by a car over one month, AWD is for the average number of working days in one month, and AVTD stands for the average number of miles driven by a car over one day.
Where AVTY is the average number of miles driven in a car over a year, AVTM is the average number of miles driven in a car over a month.
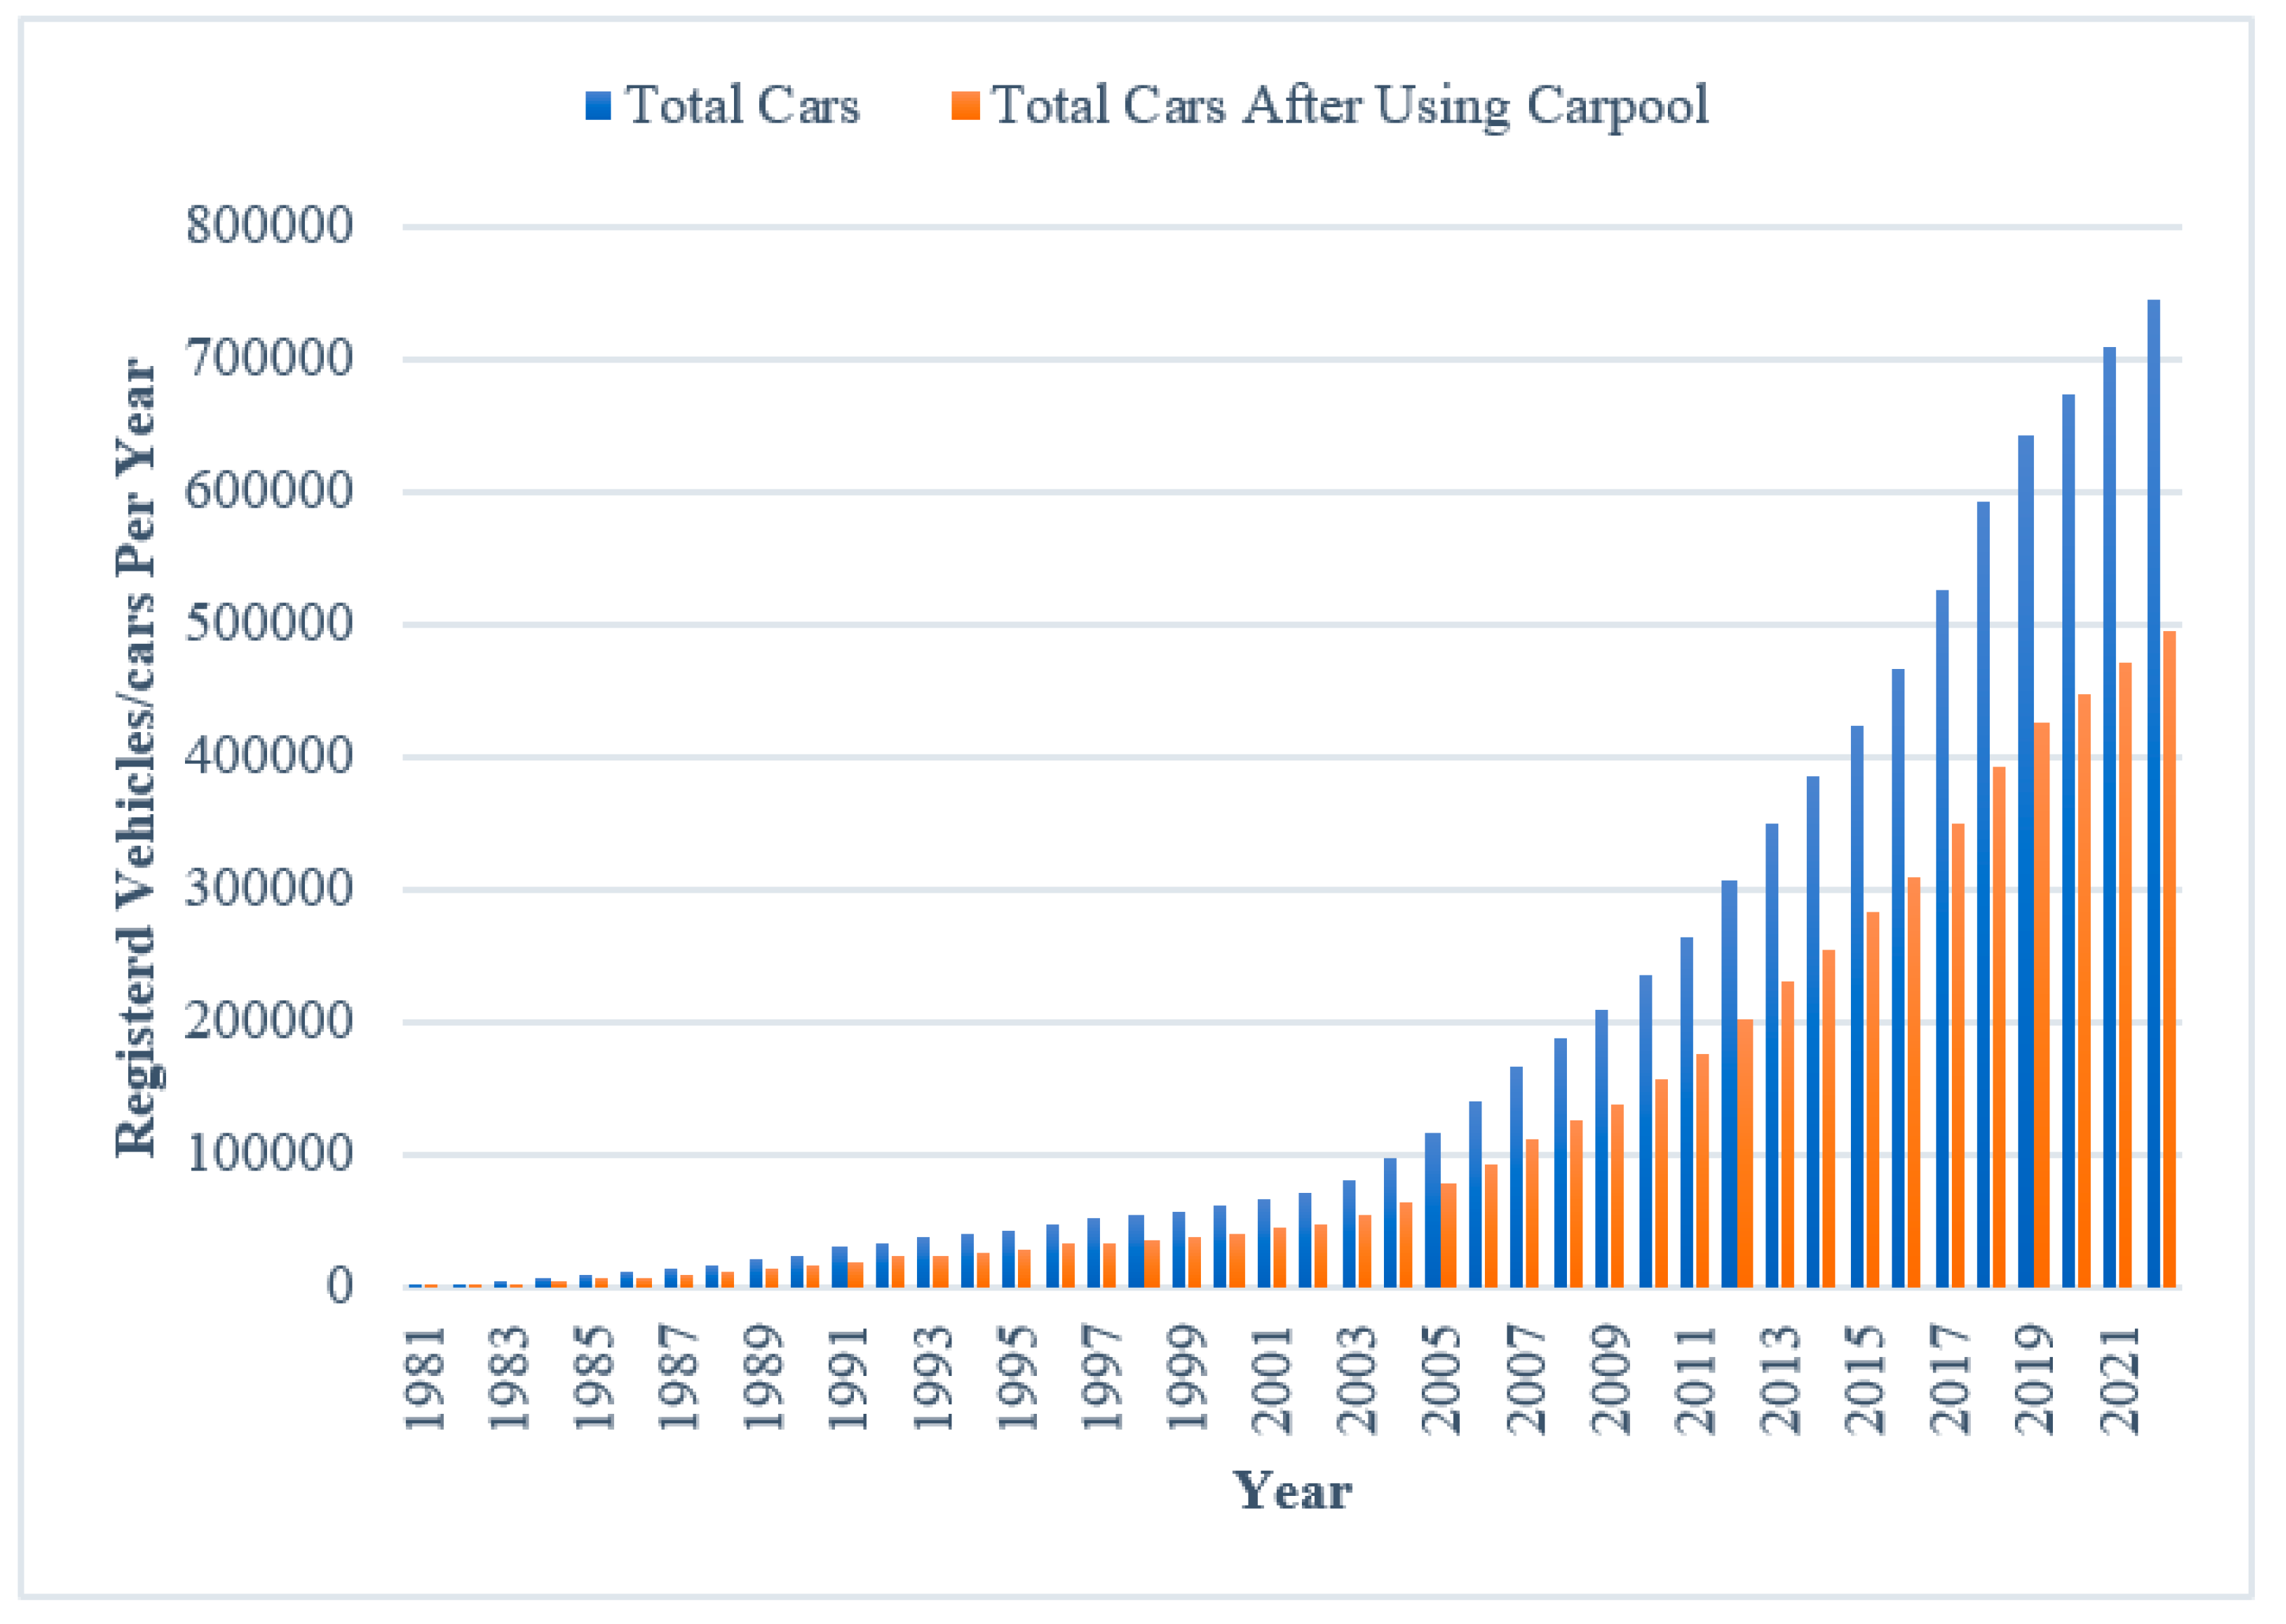
Table 7 displays the predicted values for each year from 2009 to 2020, presenting the annual decrease in the number of cars as computed from equations (2) to (4), and the years included range from 2009 to 2020. Pakistan's annual petroleum consumption was around 159,628,005 barrels in the year 2020, while the country's daily petroleum consumption in December 2020 was 437,337 barrels [
71]. If the operational carpooling (CP) system were to be implemented in Islamabad, it would result in annual savings of 546,810 barrels of fuel, equivalent to approximately 3.42% of Pakistan's total use of petrol. The carpooling (CP) research findings indicate a sizeable drop in the total number of vehicles on the road. It is anticipated that around 0.25 million fewer cars will be on the roads of Islamabad in 2022 due to installing a carpool system there. This estimation is based on traveler perceptions of the system. It demonstrates the CP plan significantly influences roadway congestion and fosters the development of more effective transport methods. The results of this study strongly imply that the implementation of this scheme has resulted in a noticeable drop in the number of vehicles on the road, which has contributed to a transport system that is more environmentally friendly and efficient.
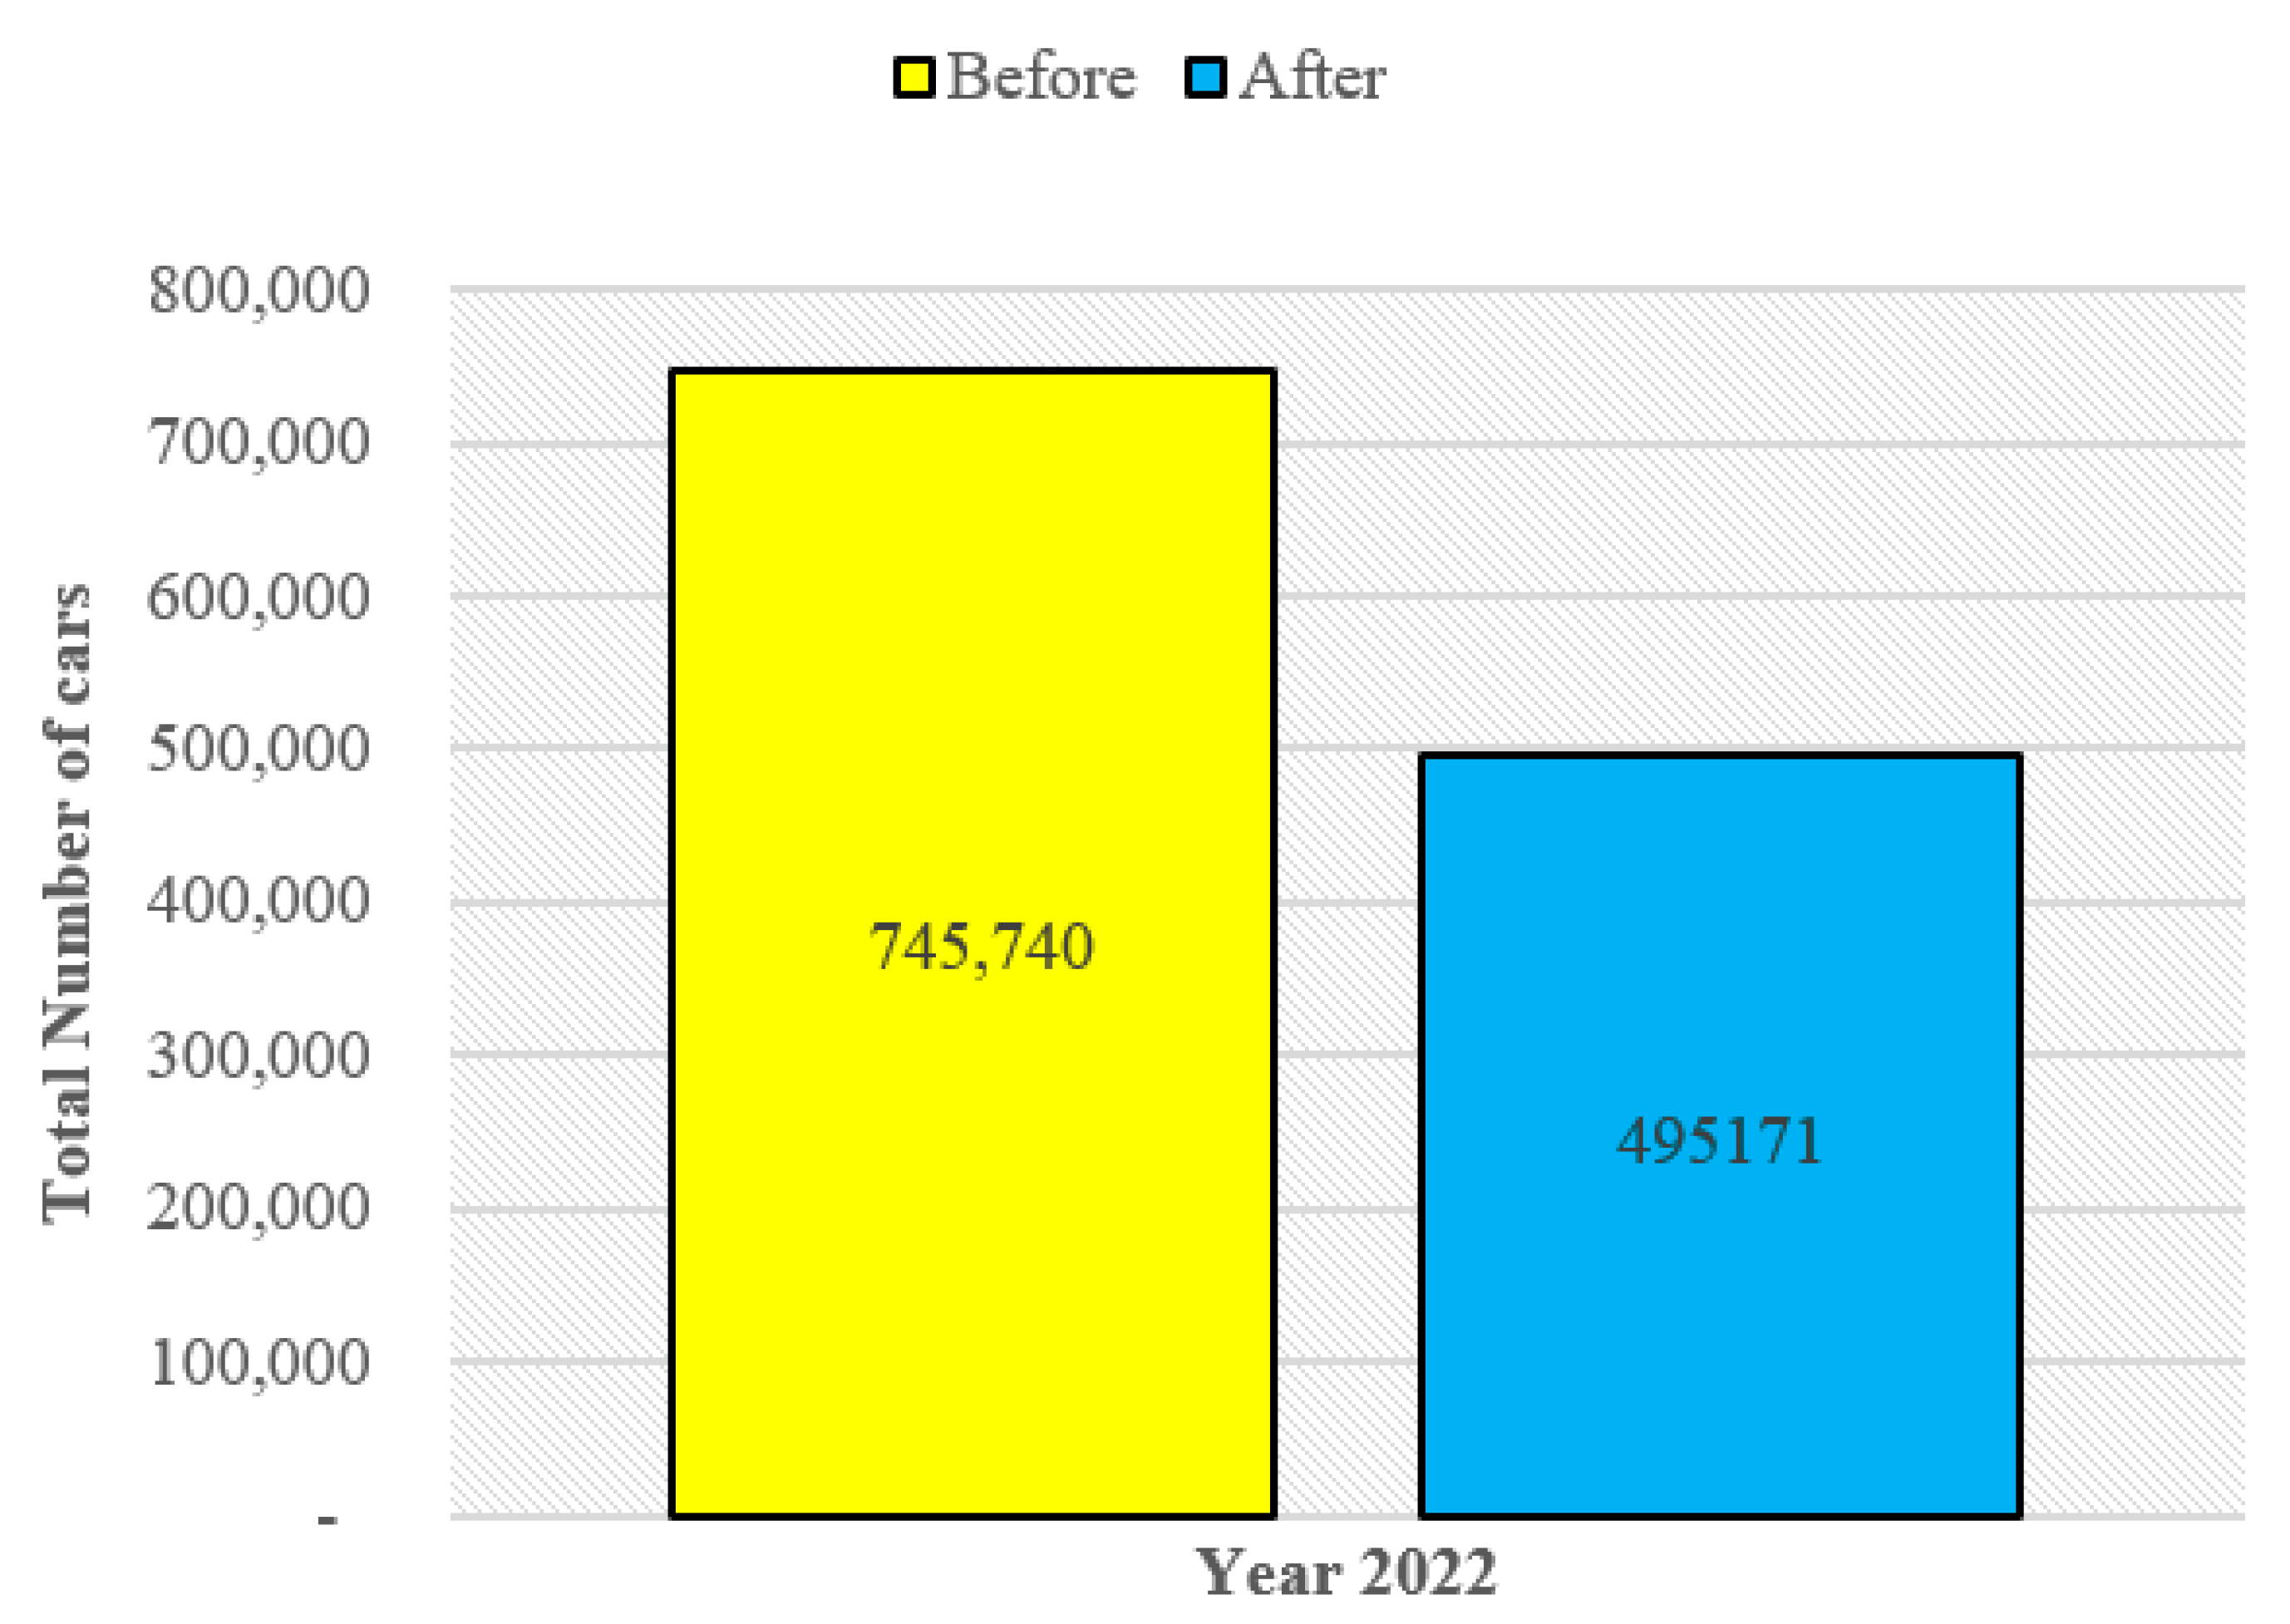
As seen in Table 8, the total number of vehicles registered in Islamabad is roughly 0.745 million, as indicated by
Figure 14, currently available for 2022. However, with the adoption of the carpooling plan, it is predicted that the number of vehicles will reduce to approximately 0.49 million, suggesting a significant difference from the current situation. In layperson's terms, using this carpooling strategy can cut the number of cars on the road by around 34 percent. A reduction of this magnitude in the number of vehicles on the roadways suggests the potential significance that the introduction of carpooling in the nation's capital may play in reducing future traffic congestion. The city will reap significant benefits, including reduced traffic congestion, improved traffic flow, and lessened environmental impact, if more people are encouraged to share rides and participate in carpooling. The anticipated reduction in the number of vehicles draws attention to the promising potential of carpooling as a viable approach to address traffic-related difficulties in Islamabad and to establish a transportation system that is more sustainable and efficient.
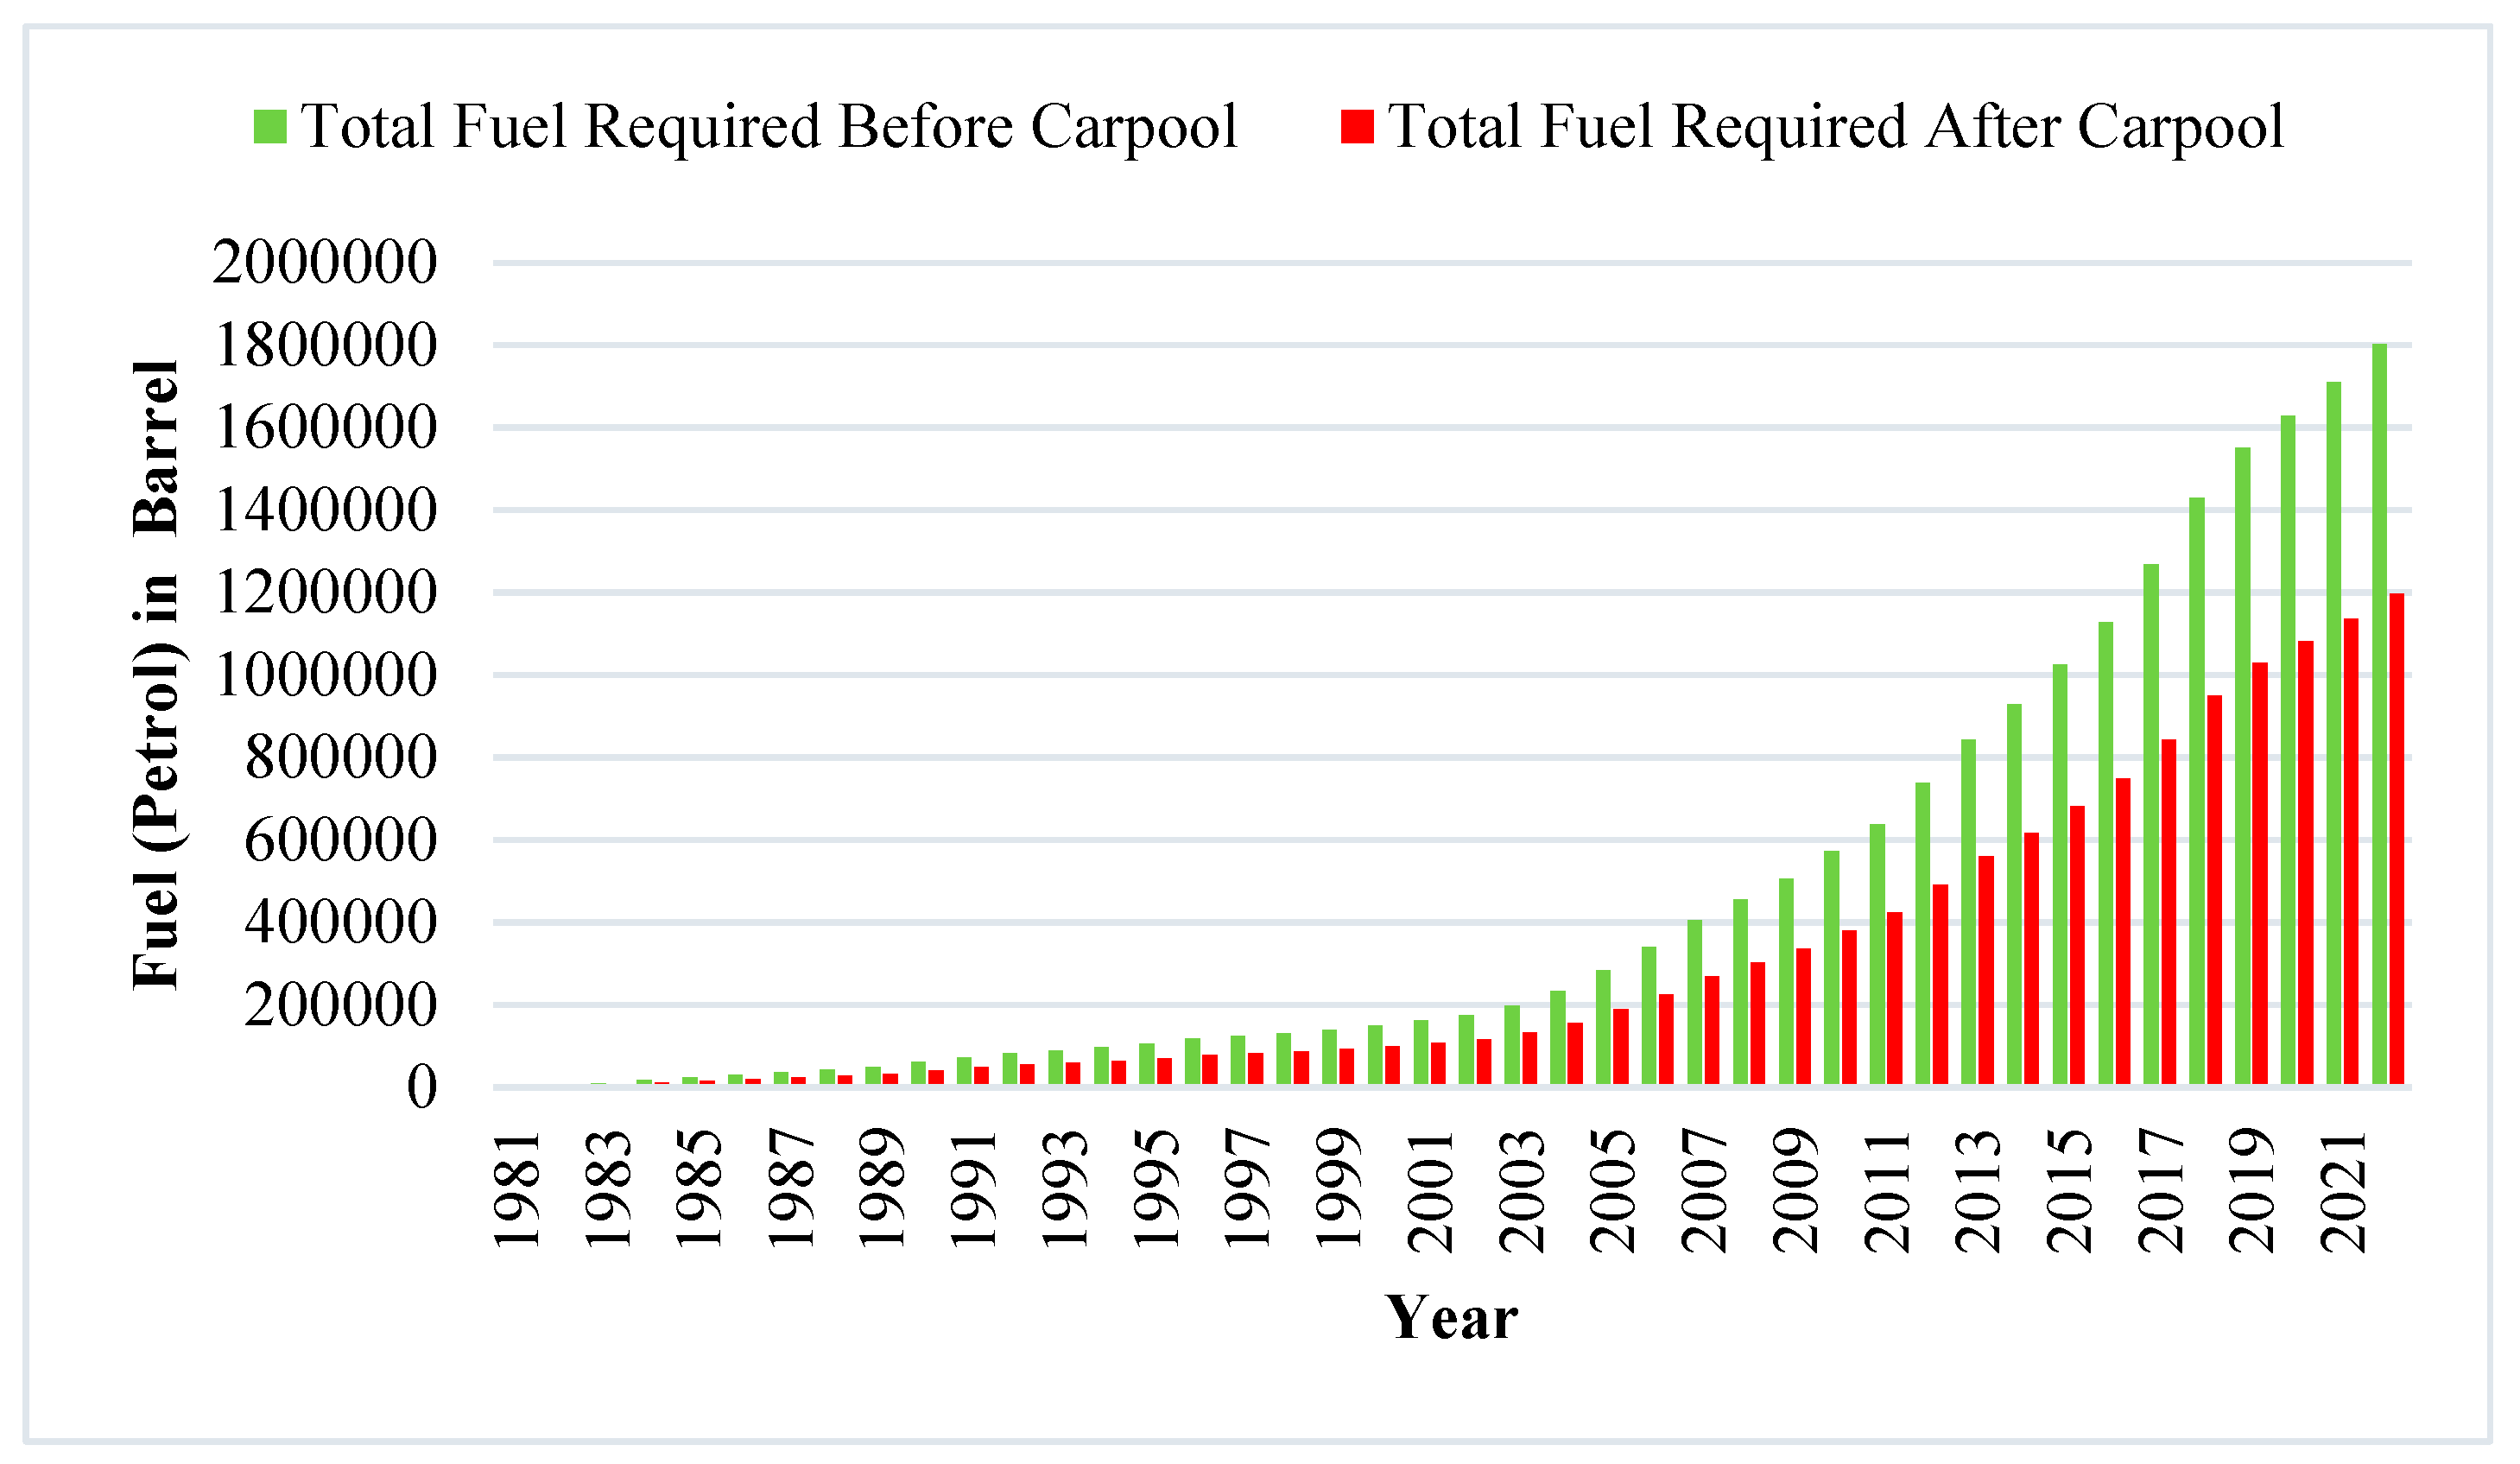
The next target is how CP will reduce fuel demand. This demand was calculated using equation (5):
TPRCRY = petrol required for a total number of cars reduced by CP per year, TCR = a total number of vehicles reduced on the road by CP, and PRY = petrol required for a car per year.
Figure 15 compares the annual petroleum usage before, and after the carpooling (CP) system was put into place for each year. According to the findings, there would need to be 1.63 million fuel barrels to supply all of the cars registered in the country without carpooling. On the other hand, if a carpooling system were implemented, it is predicted that this consumption would drop significantly to 1.08 million barrels, resulting in a significant difference of around 0.55 million barrels. This considerable reduction substantiates the hypothesis that carpooling can reduce the amount of petrol consumed by automobiles by approximately 33.6%. The program has the potential to successfully reduce the consumption of petroleum and contribute to the country's economy. It can be accomplished by encouraging carpooling and shared transportation.
Figure 15's findings highlight the economic and environmental benefits of implementing a carpool system, as it can lead to significant savings on gasoline, reduce petroleum consumption, and promote a more sustainable transportation method for the nation. These benefits can be summarised as "economic" and "environmental," respectively.
The amount of CO
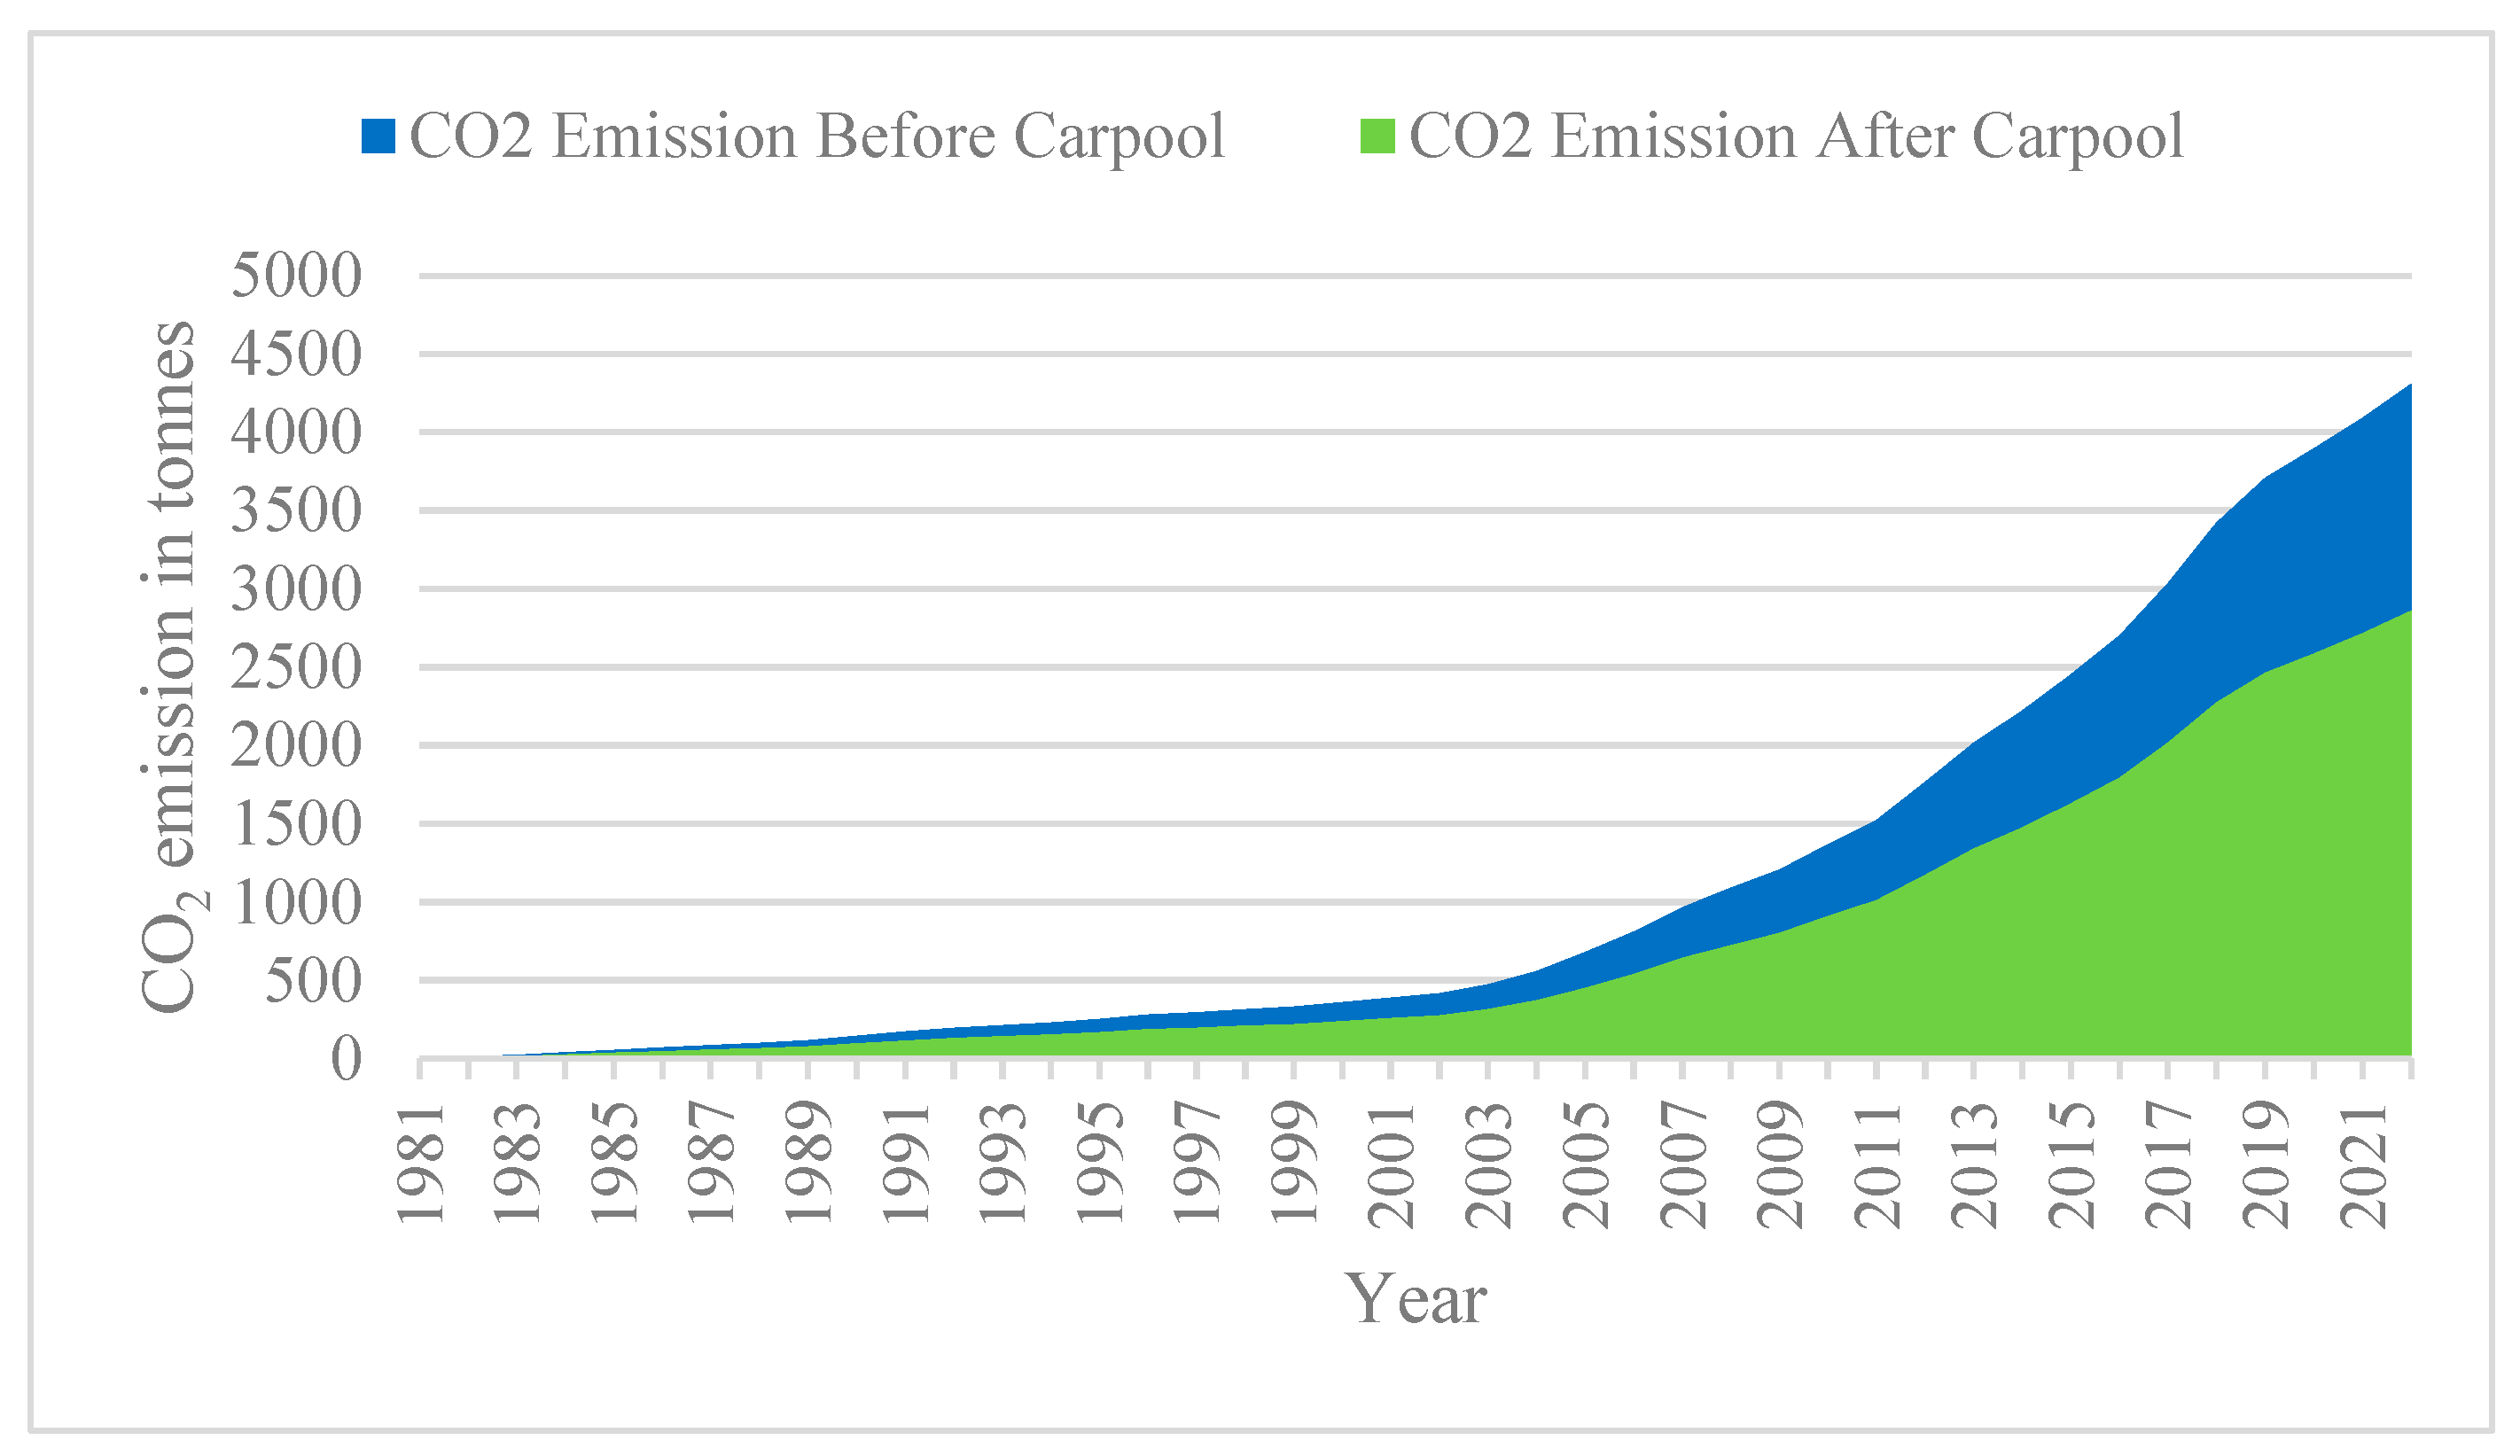
2 that has been reduced in Islamabad both before and after the installation of the CP system is shown in
Figure 16. According to the research that has been conducted, burning one liter of gasoline produces roughly 2392.5 grams of CO
2 [
63]. As a consequence of this, a drop in the amount of fuel that is consumed directly corresponds to a decrease in the amount of CO
2 emissions. The notion and the SPSS statistical analysis software were utilized to forecast the reduction in CO
2 usage.
Figure 16 depicts the CP system's significant influence on CO
2 emissions. The results of fuel emissions reveal an apparent reduction due to the CP system, highlighting its significant impact on CO
2 emissions. The findings indicate, more specifically, that CP can cut carbon dioxide emissions by around 33.6%. It was calculated that all cars registered in Islamabad contribute 3893.3 tonnes of CO
2 to the atmosphere. Notably, the city has no organized carpooling program, which significantly contributes to the negative influence on the environment. However, if the relevant authorities were to implement such a system, the CO
2 emissions would likely fall to 2585.13 metric tonnes, a significant difference of 1308.2 metric tonnes. In the context of Pakistan's overall CO
2 emissions in 2020, which amounted to 274.75 million tonnes, the Transportation sector was responsible for 28% of those emissions [
64]. It can potentially reduce CO
2 emissions by 411,035 tonnes in Islamabad by implementing alternate forms of transportation, such as carpooling. It represents 0.14% of Pakistan's total emissions and is primarily attributable to the implementation inside the Capital City of Islamabad.
Figure 16 shows the reduction of CO
2 before and after the CP system in Islamabad.
The study estimated carpooling's fuel-saving and car-reduction potential using calculated data. Results showed that CP may save 87 million liters of petrol yearly. This fuel-saving benefit would eliminate 0.22 million autos per year, a 33% reduction. The survey also found a promising 37% chance of two-person carpooling. Carpooling with two people reduces automobile traffic even more than other carpooling arrangements.
4. Conclusions
The study was conducted in Islamabad, the capital city of Pakistan undergoing fast urbanization with many people who own their vehicles. This research aimed to investigate the perceptions of travelers and the degree to which the general public approves of carpooling (CP). Further, the study targeted to investigate the potential influence that carpooling may have on the level of traffic congestion, the amount of fuel consumed, and the amount of carbon dioxide emissions in the city. The conclusions drawn from this research are given below:
A proposed model includes mode choice as a mediator on the relationship between traveler perception and tendency to carpool to study the influence of travelers' perceptions on adopting carpooling as a mode of transportation. Based on the confirmatory factor analysis, step-wise and mediated multiple regression analysis, all the hypotheses of this research have been supported.
The findings imply that travelers' mode choice mediates the relationship between travelers' perception and tendency to carpool. Moreover, the outcomes also affirm the impact of demographic variables, including population, gender, and education levels, on the willingness to shift towards carpooling. All these results reflect the motivations and considerations for developing and promoting CP systems, the role of individual behaviors, and their current mode choices in transitioning to a new mode of transportation.
The study also found that carpooling (CP) may eliminate 0.25 million cars, 33.6% of Islamabad's private vehicles. This reduction will save 546,810 barrels of fuel annually, 3.42% of Pakistan's total usage.
The above-mentioned conclusions present insights that can be useful for transport planners, environmentalists, and policymakers. These findings could help the city develop effective carpool systems by recognizing the potential benefits of carpooling in lowering traffic congestion, fuel consumption, and CO2 emissions. Implementing formal and incentivized CP systems may reduce congestion, save energy fuels, and protect the sustainable green environment.
In addition to the carpooling attributes covered in this research, additional large-scale research could also be conducted in the future to investigate the limitations of CP, such as a lack of confidence in both the driver and the passenger, the risk, the need to adapt to another person, the vehicle's functionality, and the likelihood of social incompatibilities. Moreover, in this research, the mediating role of mode choice has been evaluated because of its practical significance in the carpooling scenario. Nevertheless, depending on the extent of collected data, other variables might also be included as a mediator or even moderators in the model to further evaluate the relationship between travel perception and the tendency to carpool.
