1. Introduction
Current predictions state that urbanized living environments will be realized for 70% of the global population by 2050 [
1]. However, the natural aggregate consumption and construction waste production that occur during urbanization have caused considerable damage to land resources and the environment [
2]. Recycling construction waste is an effective means of achieving sustainable development, carbon neutralization, and carbon peaking [
3].
Currently, engineers mainly use construction waste as a recycled aggregate for the production of recycled concrete (RC) [
4,
5,
6]. Tabsh and Abdelfatah [
7] crushed C30 and C50 concrete into recycled aggregates and used the resultant materials to produce RC with C30 and C50 strengths, respectively. When the recycled aggregate was composed of C50 concrete, the compressive and tensile strengths of the resultant RC were equivalent to those of ordinary concrete. However, Zheng et al. [
8] used macro-mechanical experiments to determine that the strength of brick-aggregate concrete was approximately 12% lower than that of ordinary concrete with the same mix proportion. The influence of the brick aggregate on the elastic modulus of the concrete was also significant. That is, for replacement rates of 50% and 100%, the elastic modulus decreased by 54% and 62%, respectively, and the peak strains increased significantly. The resultant model accurately predicted the mechanical behavior of concrete in a tensile state. Further, Rahal [
9] prepared coarse aggregates in the laboratory by crushing the waste concrete from two old buildings in Kuwait and found that, for concrete with a target compressive strength of 20–50 MPa, 100% replacement of the natural aggregate by the recycled aggregate yielded a strength decrease of only 10%. Similarly, Mohammed et al. [
10] used recycled aggregate-containing bricks from different locations to fabricate more than 700 recycled-aggregate concrete cylinder specimens and determined the densities, water absorption, mechanical properties, and durability of the RC specimens. At a 50% recycled aggregate replacement rate, the concrete strength did not change. In contrast, Letelier et al. [
11] studied the incorporation of recycled brick powder instead of cement in recycled-aggregate concrete and found that the strength of recycled-aggregate concrete prepared using recycled brick powder as a replacement for 15% of the cement did not decrease compared with that of natural-aggregate concrete. In addition, Meng et al. [
12] used computed tomography scanning to determine the influence of brick aggregates on the mechanical properties of mixed RC. Their results indicate that the use of brick aggregate produced differences in the internal and apparent properties of the RC, in which higher brick-aggregate contents improved the deformation performance of the RC.
Cement concrete is a heterogeneous quasi-brittle material obtained by mixing, vibrating, and curing coarse and fine aggregates, cement, and water. RC is composed of recycled aggregate that either partially or completely replaces the natural aggregate [
13]. Thus, brick-aggregate RC is a concrete type that includes brick-containing recycled aggregate, of which coarse aggregate has a relatively complex composition. Owing to the lower performance of brick compared with that of old concrete, brick is less commonly used in RC [
14]. Currently, recycled aggregates are commonly sorted before reuse to remove brick components [
15].The need for this sorting can yield a low recycled-aggregate utilization rate.
From a macro-perspective, concrete is generally assumed to be a homogeneous medium, and its strength is determined mainly by the characteristics of its constituent materials, aggregate morphology, and aggregate distribution [
16]. However, to investigate random failure within concrete and the impact of each component material on concrete performance, micro-studies must be performed.
At the micro-level, ordinary concrete is composed of three phases: mortar, aggregate, and the interface transition zone (ITZ). However, owing to the addition of recycled aggregates, RC has a complex composition. Based on the composition of ordinary concrete, it is necessary to consider the transition zone between the old interface, which is covered with old mortar and gravel, and the brick aggregate [
17,
18,
19]. Overall, RC that contains brick and concrete aggregates can be divided into seven phases at the micro-level: natural crushed stone, old gravel inside waste concrete, bricks, new mortar, old mortar on waste concrete surfaces, and new and old ITZs (ITZ1 and ITZ2, respectively). By dividing the concrete microstructure into units, assigning different material properties to each material phase, and numerically simulating the entire failure process, the mechanism by which brick concrete aggregate RC damage occurs can be intuitively described.
In this study, the ABAQUS software package was used to establish a mesoscopic damage model for RC containing brick aggregate, and the influence of changes in the brick content of the recycled aggregate on the RC performance was studied at the meso-scale. The accuracy of the model was verified using the results of macroscopic experiments. The proposed model is expected to provide theoretical support for the use of recycled aggregate with different brick contents in RC production.
2. Experiments
2.1. Materials
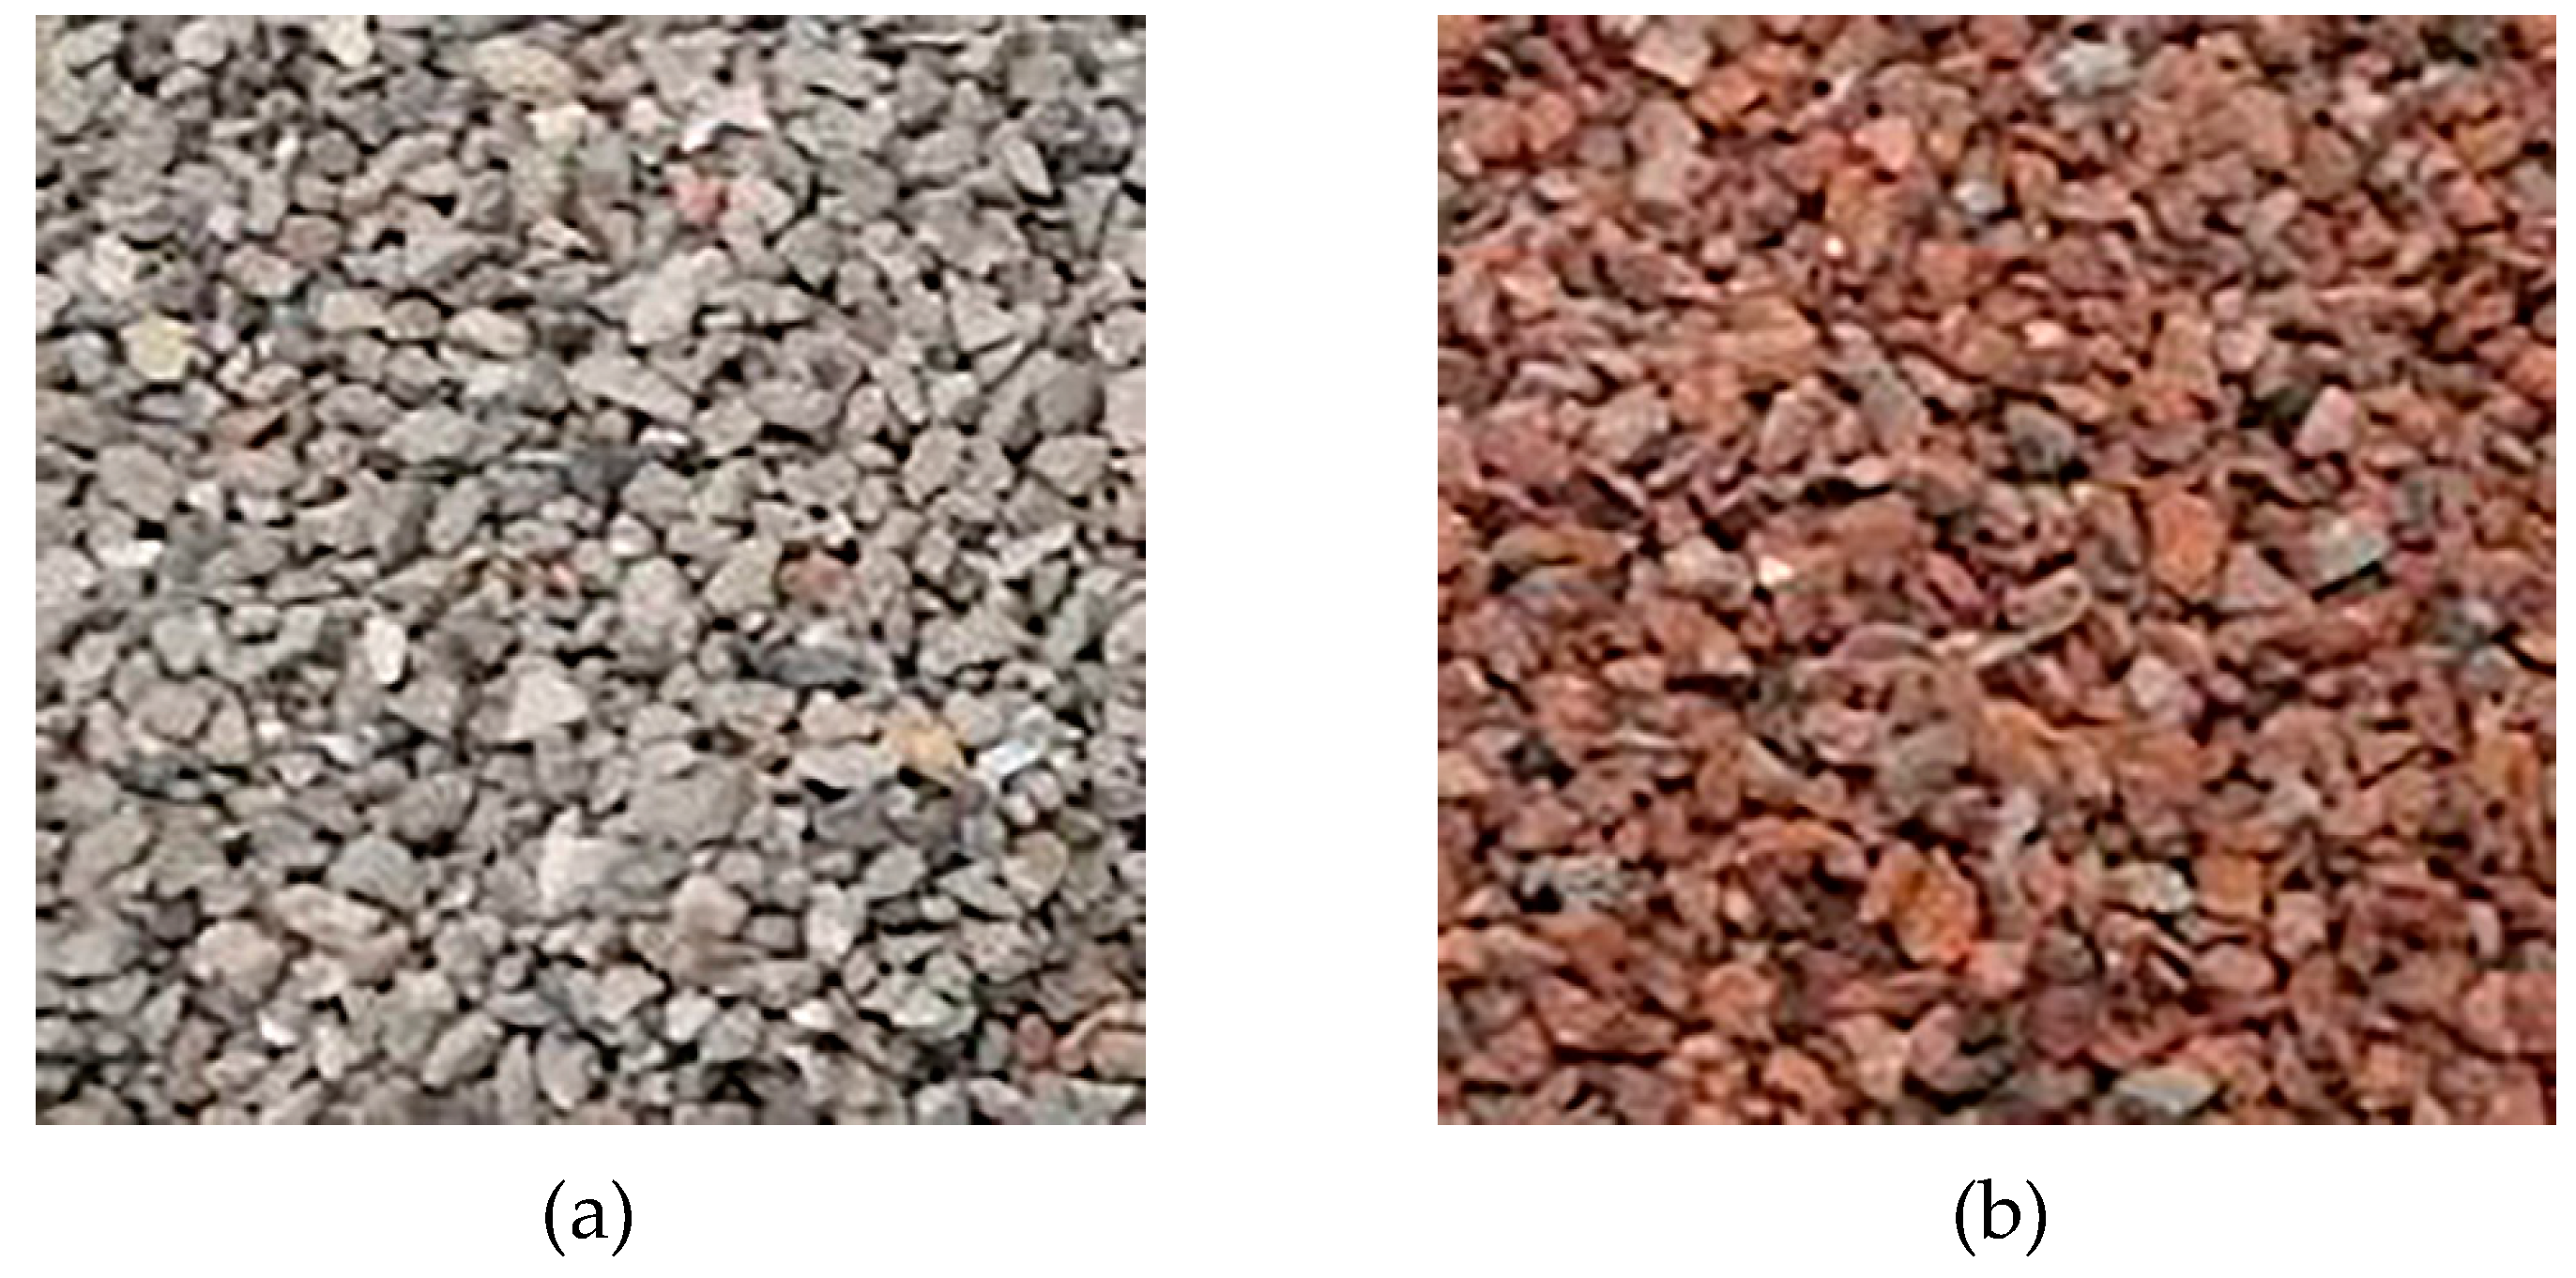
Portland cement (P.O. 42.5) produced by the Benxi Gongyuan Cement Plant was used in this study. Natural sand was used as the fine aggregate, tap water was used as the mixing water, and crushed stone with a 10 mm maximum particle size was used as the coarse natural aggregate. The recycled coarse aggregate was obtained from construction waste dumped by the Shenyang Lixiang Solid Waste Recycling Station. After screening, the coarse recycled aggregate was divided into old concrete and brick, where the brick content was 18.92% (
Figure 1). The technical indicators of the coarse aggregate were measured using the methods described in the "Standard for Technical Requirements and Test Methods of Sand and Crushed Stone (or Gravel) for Ordinary Concrete (JGJ 52-2006)” and are presented in
Table 1. A high-performance polycarboxylic acid was used as the water-reducing agent.
2.2. Test Method
In this study, the evolution law of micro-level RC damage in accordance with its recycled-aggregate brick content was determined using simulation and macroscopic experiments designed to verify the accuracy of the simulation. In the macro-tests, the RC specimens were analyzed under uniaxial compression to obtain their stress–strain curves. The simulation accuracy was verified by comparing the simulated and experimentally obtained stress–strain curves.
For the experiments, specimens were prepared by partially replacing the natural crushed stone with recycled aggregate at a substitution rate of 50%. A broad range of brick contents was used to analyze the effect of the recycled aggregate’s brick content on the performance of the resultant RC, while also considering the brick content discreteness and differences in brick content among different recycled aggregate sources. Overall, four groups were considered, for which the recycled-aggregate brick contents were 0, 10, 20, and 30%. The cement, water, fine aggregate, and water-reducing agent dosages, as well as the total mass of the coarse aggregate, were fixed among all groups. Concrete with a C40 strength grade was prepared. The mix proportions for the various RC specimens are presented in
Table 2.
Cubic specimens with dimensions of 100 mm × 100 mm × 100 mm were fabricated, and uniaxial compressive tests were performed after curing. A 206A-2000kN microcomputer-controlled electro-hydraulic servo universal testing machine (Shenzhen Test Equipment Co., Ltd in China.) was used for the tests. This machine was automatically loaded and achieved uniform loading during the loading process. For the C40 concrete specimens analyzed in the tests, the loading speed was 0.5–0.8 MPa/s. When a specimen was damaged, the machine stopped automatically and output the stress–strain curve.
3. Two-Dimensional Random Aggregate Model for RC
3.1. Random Aggregate Model Based on the Monte Carlo Method
The Monte Carlo method is a statistical sampling method that can randomly distribute discrete objects in a certain space. To reflect the randomness of the aggregate distribution in concrete, pseudo-random numbers can be generated using the Monte Carlo method [
20]. Specifically, the multiplicative congruence method can be used, the recursive formula for which is:
where
represents a sequence of numbers,
is a multiplier,
M is the modulus, mod
M represents the remainder following division by the modulus, and
is a pseudo-random number.
In this study, the multiplicative congruence method was used to generate pseudo-random numbers. For random numbers generated using this method, if the most basic random variables are distributed uniformly in the (0,1) interval, the probability density function
f of random variable
X is given by:
Random variables in the (0,1) interval can be transformed to obtain random variables in other distribution forms. Therefore, random numbers of uniformly distributed random variables in the (0,1) interval can be transformed to obtain random variables that satisfy other distribution forms.
Based on the uniform distribution function, the center coordinates of aggregates in RC can be generated randomly. Most previous studies have considered aggregates to be either circular, elliptical, or regular octahedra [
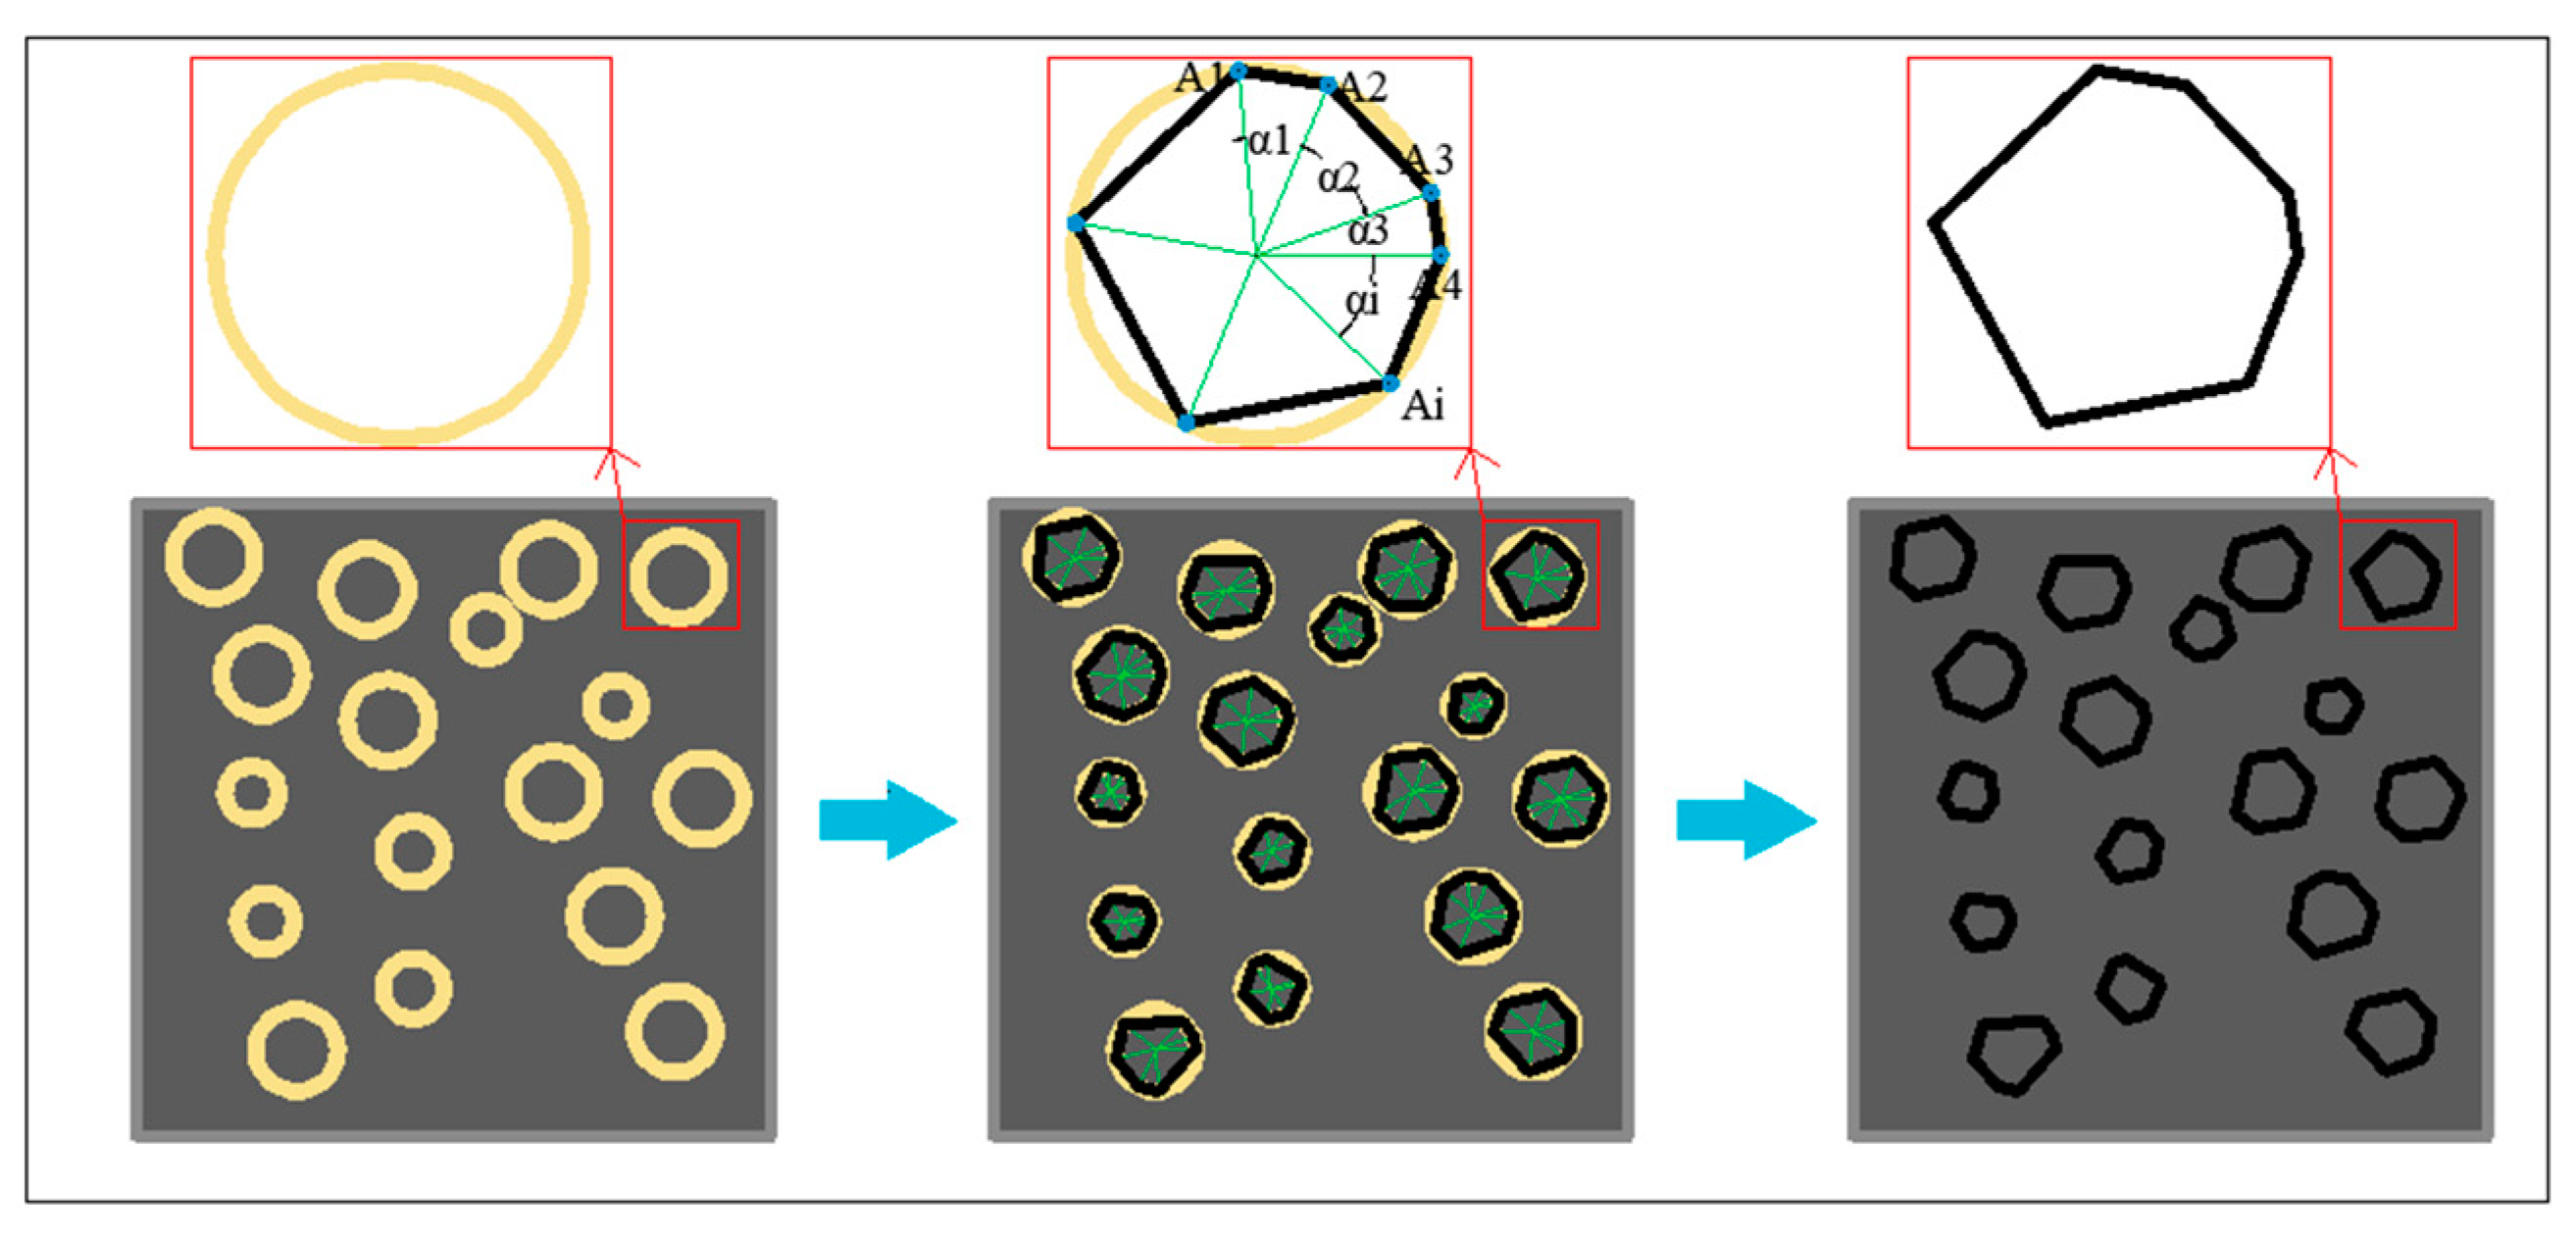
21]. However, within a two-dimensional plane, irregular polyhedra can better simulate the contacts between the aggregate and mortar, as well as the skeleton formation. Notably, an irregular convex polygon cannot define an aggregate shape with fixed parameters. Therefore, the random module in Python was implemented in this study to generate center coordinates for circular aggregates in random circles with radii of 2.5–5 mm. The random circle generation process was controlled by two conditions: (1) the random circles must be fully located within the specimen area and (2) adjacent random circles could not interfere with each other, but must be separated by a certain gap. Five to nine vertices were generated randomly in a counterclockwise direction on each circular aggregate edge. The vertices were connected to generate an irregular convex polygon aggregate.
With regard to aggregate placement, the aggregates were required to be placed within the specimen, with the following equations being satisfied:
where
and
are the circular-aggregate center coordinates;
r is the circular-aggregate radius (2.5–5 mm);
and
are the minimum and maximum values in the specimen
x-direction, respectively; and
and
are the minimum and maximum values in the specimen
y-direction, respectively.
When the aggregate was placed in the specimen area, it was also necessary for the principle of non-interference between adjacent aggregates to be satisfied:
where
is the radius of the aggregate that has been placed,
and
are the center coordinates of the undischarged aggregate circle,
is the radius of the undischarged aggregate, and γ is the influence coefficient set considering the aggregate particle size , ITZ, and mortar layer thickness (set as 1.2 in this study).
After each random circle was generated, five to nine random points
Ai were generated clockwise on its circumference. Each new point was defined by taking the central angle α
i as a parameter, where α
i was formed by a line between the point and the circle center and a line between the previous point and the circle center. To avoid a sharp aggregate, α
i was limited to acute angles. An irregular convex polygonal aggregate with a random circle as the circumscribed circle was formed by connecting the random points clockwise. A schematic of the polygonal aggregate generation process is shown in
Figure 2.
3.2. Aggregate Generation
When generating aggregates, the volume ratio of the aggregate in the concrete was first considered to determine the proportion of the aggregate cross section in a two-dimensional cross section. The coarse aggregate volume
Pk can be expressed as:
where
VNA,
VRA, and
VBR are the natural aggregate, old concrete, and brick volumes, respectively.
The mix design used a cement:water:fine aggregate:natural aggregate:recycled aggregate (old concrete and brick) ratio of 500:190:602:559:559 (kg/m
3). Based on the experiment, the apparent densities of the coarse aggregate were 2667, 2285, and 1996 kg/m
3 for natural coarse aggregate, old concrete, and brick, respectively. The ratios of the coarse aggregates with different brick contents in the final recycled aggregate to the specimen volumes are listed in
Table 3.
Reducing the random distributions of the coarse aggregates in the specimens and changing their skeletal structures yielded discrete strength changes in the specimens, for which the coarse aggregate volume ratios varied less under different brick contents. Therefore, to analyze the impact of the recycled aggregate’s brick content on the performance of the resultant RC, the coarse aggregate volume ratio and skeletal structure were fixed and four different brick contents were considered. The ability to fix these parameters is an advantage of microscopic simulation.
The ratio of the coarse aggregate volume to the test piece volume was examined at different brick contents and the arithmetic mean was obtained ( = 46.0%). The volume proportion of aggregates in concrete ranges from 60 to 75% 22, with coarse aggregates constituting 40–50% 23. Therefore, the coarse aggregate volume calculated in this study corresponded to the concrete volume proportion.
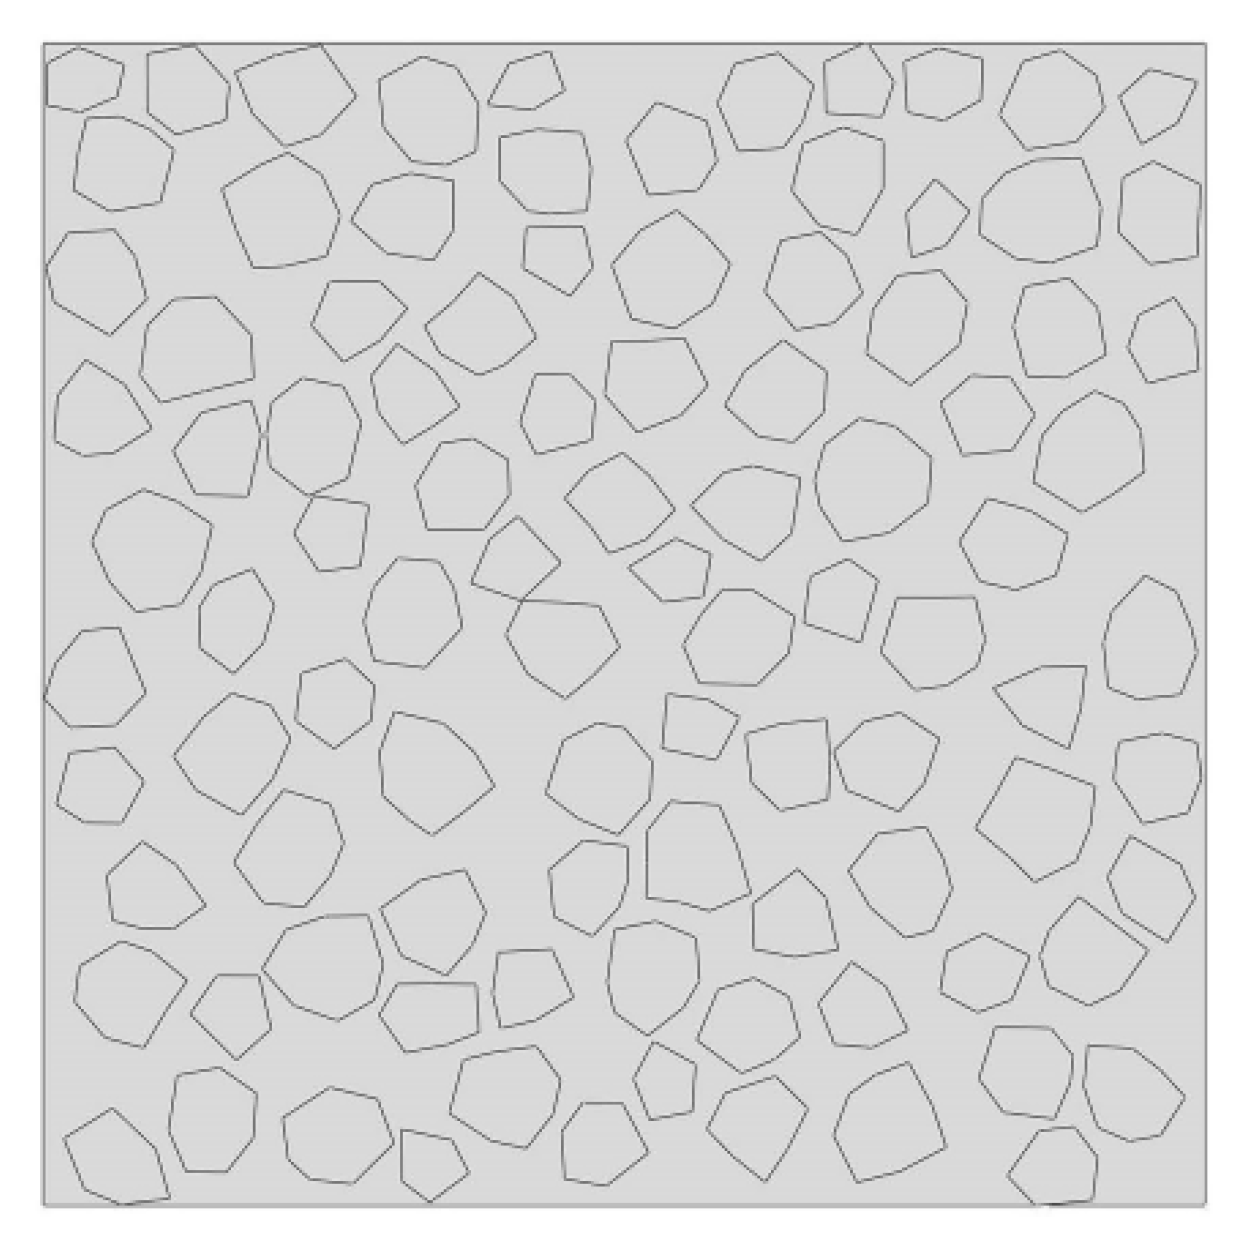
The concrete used in this study had a single particle size of 5–10 mm; therefore, random placement of only 5–10 mm aggregate particles was performed. The cross-sectional specimen dimensions were 100 mm × 100 mm and the aggregate cross section constituted 46% of the specimen area. A total of 96 irregular polygonal aggregates were placed. The resulting model is shown in
Figure 3.
3.3. ITZ Generation
Owing to a significant difference between the elastic moduli of the aggregate and mortar, substantial mortar deformation occurs when external forces are applied to the concrete. However, the aggregate experiences almost no deformation; thus, shear slip occurs between the mortar and aggregate. In concrete, the mortar wraps around the aggregate, and the area where the mortar is in contact with the aggregate is called the ITZ. Numerous experiments have determined that the ITZ of concrete plays an important role in the performance of concrete structures 27. Concrete failure at the micro-level generally begins at the ITZ; thus, analysis of the ITZ is essential for micro-level studies of concrete 27.
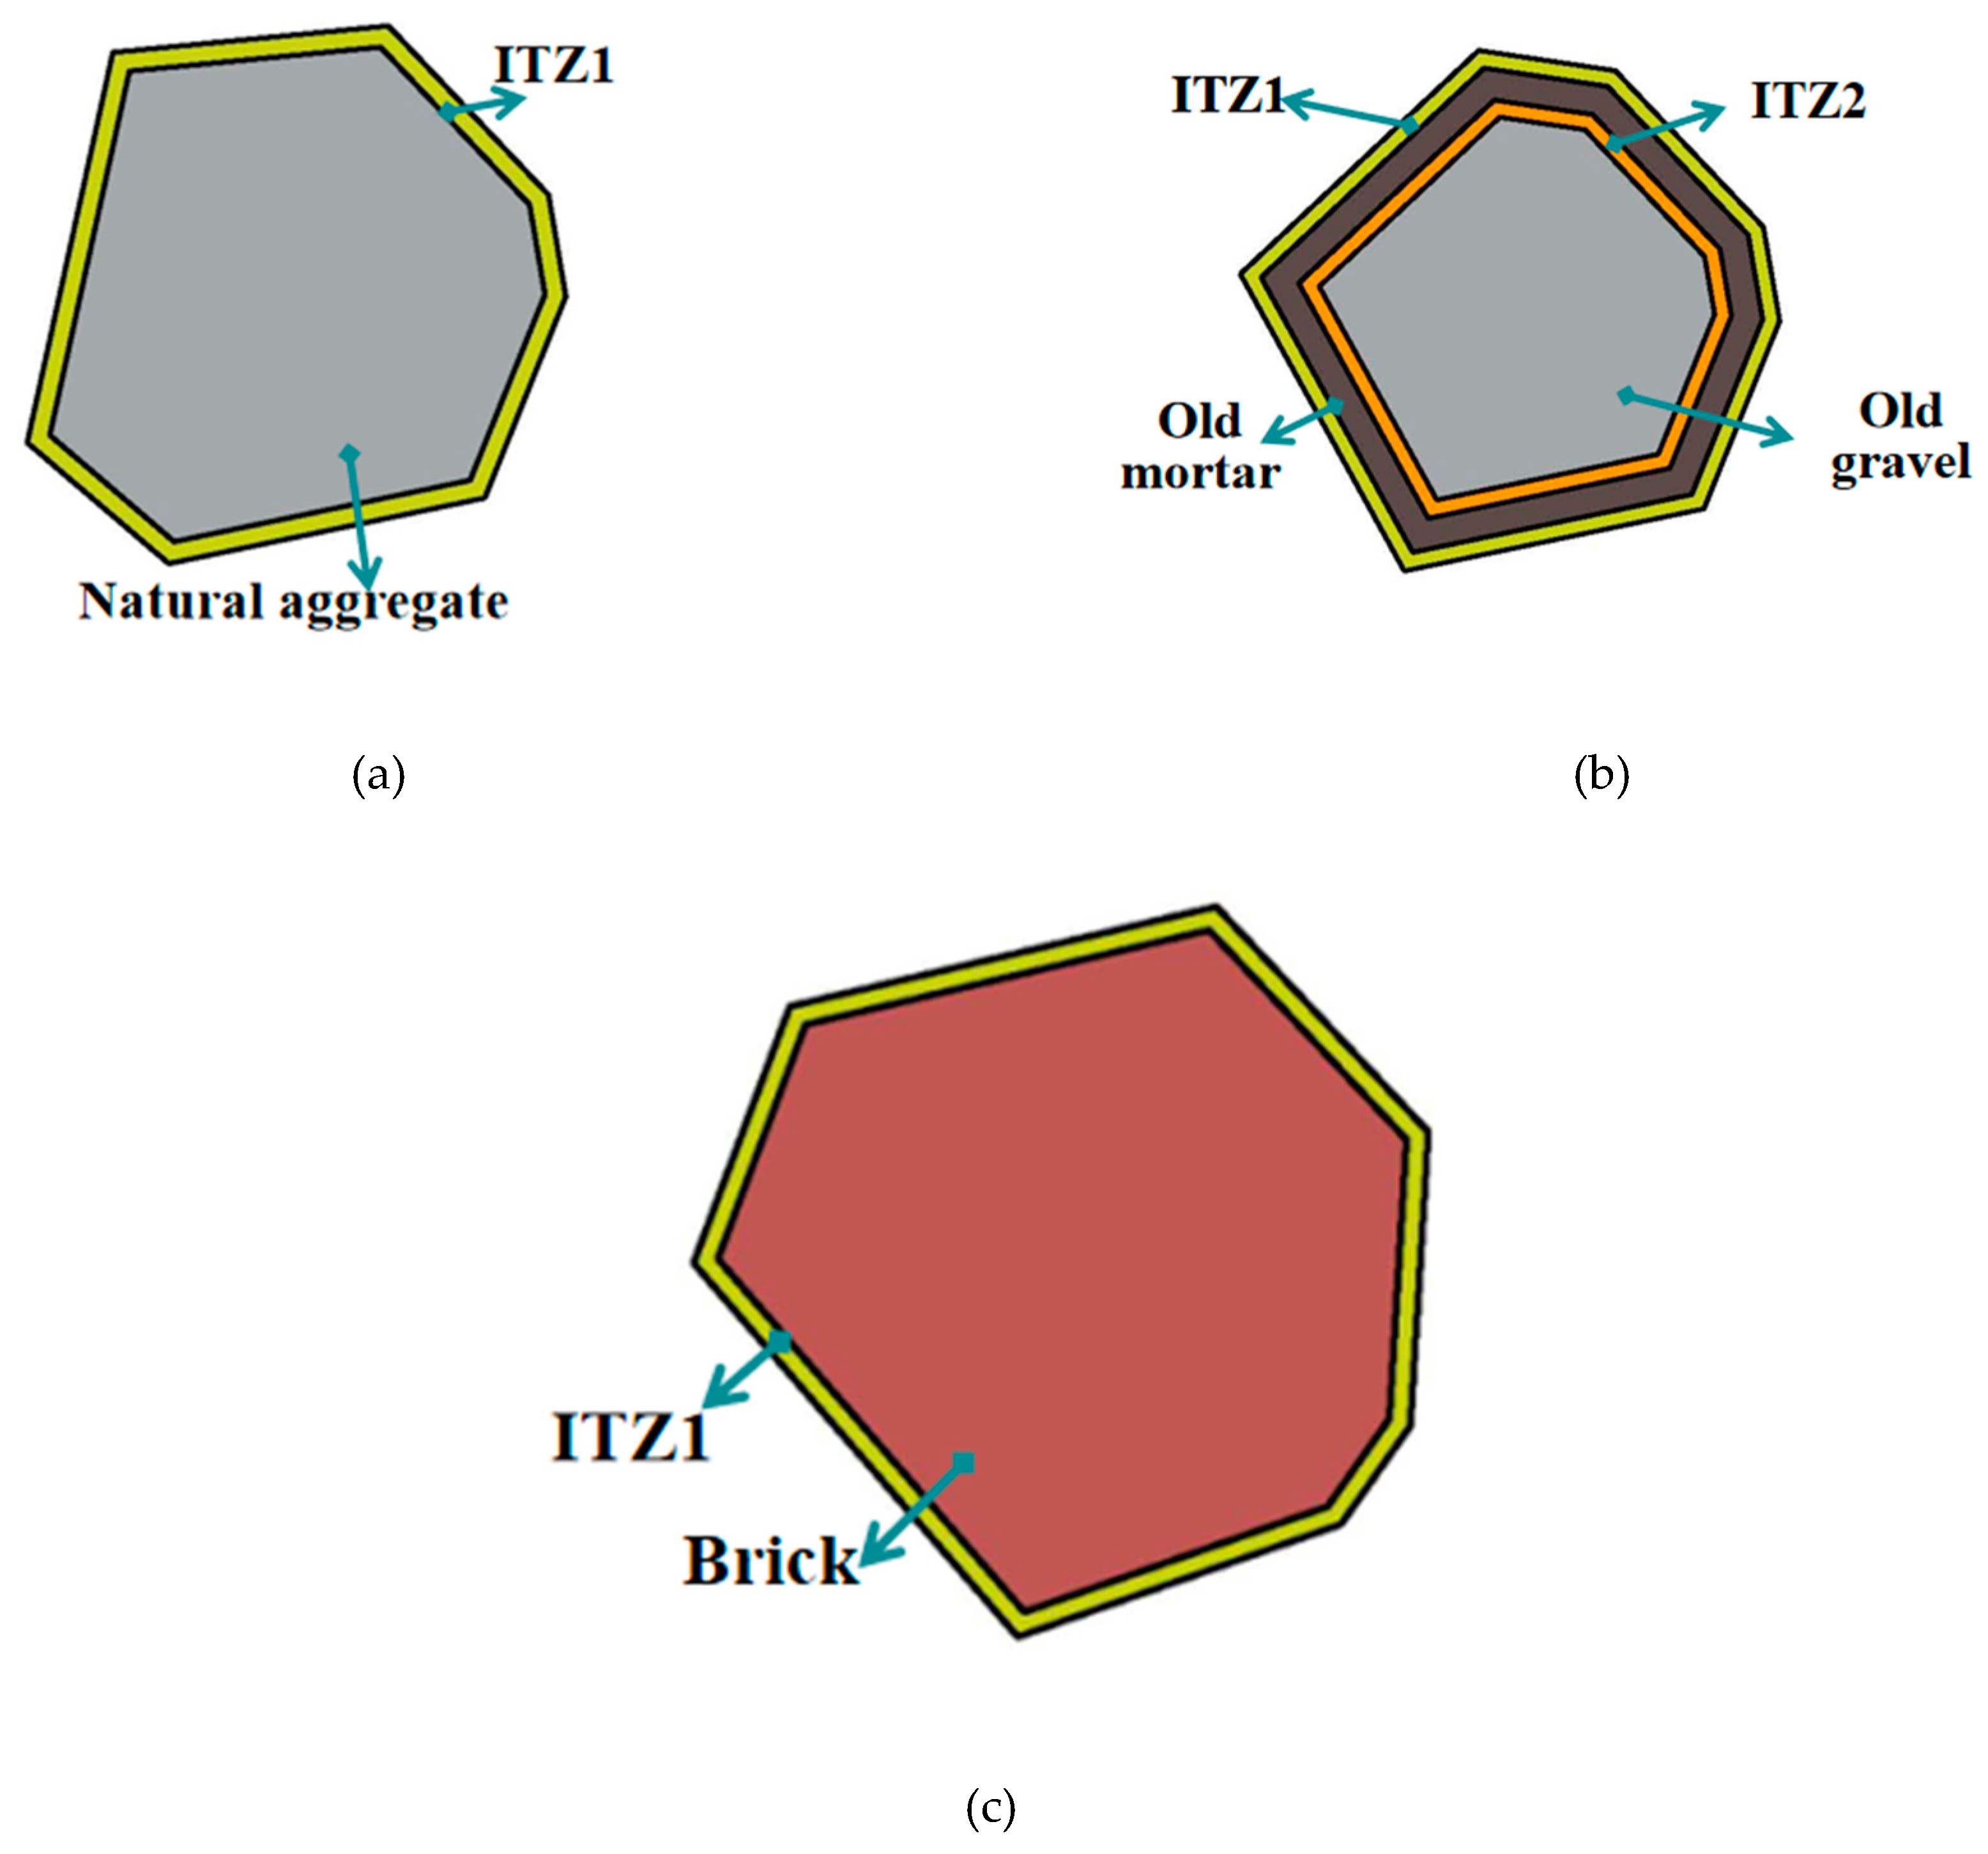
Two types of ITZ were considered in the microscopic concrete model developed herein: the new ITZ (ITZ1) that forms where natural aggregate is wrapped by new mortar, old concrete, and brick and the old ITZ (ITZ2) that is formed by old mortar and gravel in the old concrete. The following assumptions were made: each aggregate was completely wrapped by the mortar and no contact occurred between the aggregates and the recycled aggregate generated from old concrete exhibited randomness after crushing, in which the old gravel was completely or partially wrapped by old mortar. For partially wrapped old gravel, the wrapping state is relatively complex, and the wrapping location and area are highly uncertain 27. Therefore, we assumed that the old mortar completely wrapped the old gravel to form old concrete in this study.
The ITZ is the area in which the mortar and aggregate are in contact. Through microscopic scanning of the concrete interface layer, Poon et al. 27 found that the ITZ thickness in concrete is 40–50 μm. Based on microscopic imaging, Xiao et al. 28 found that the ITZ thickness between the aggregate and mortar is 50–60 μm. Kim and Al-Rub 29 simulated the effects of different ITZ thicknesses (100–800 μm) on the concrete strength and observed no significant impact. Although the concrete damage development process is similar, a thinner ITZ can cause simulation-related problems such as non-convergence and long calculation times.
To improve the calculation efficiency, the ITZ thickness is generally set as 0.5–2 mm 30. In this study, appropriate increases in the ITZ thickness were considered. The ITZ thickness was set as 0.5 mm and that of the old mortar was set as 1 mm. The random aggregate model obtained using this interface layer is shown in
Figure 4.
4. Determination of Constitutive Model Equation and Related Parameters
4.1. Constitutive Model for Concrete Damage
In this study, a concrete damage plasticity (CDP) model, which is mainly used to analyze simulations of concrete structures under simple or complex loads, was selected from the ABAQUS simulation software (SIMULIA, ABAQUS standard manual, version 6.14, The Dassault Syst`emes, Realistic Simulation, Providence, RI, USA). This model facilitates performance-related research on the irreversible damage mechanism of concrete and was selected for uniaxial compression simulations of the concrete specimens. The following assumptions were made in the CDP model: the concrete was continuous, the damage was isotropic, and tensile and compressive damage were the main failure mechanisms in the concrete.
4.2. Determination of Material Parameters
The material parameters defined in the CDP model include the elastic modulus, density, and plastic damage to the concrete. According to the "Code for Design of Concrete Structures" (GB 50010-2010), the plastic parameters of concrete include the expansion angle, eccentricity, the ratio of the initial equivalent biaxial compressive yield stress to the initial unit compressive yield stress (
fb0/
fc0), the ratio of the tensile meridian to the compressive-meridian constant stress (
K), and the viscosity coefficient. The parameter values are listed in
Table 4.
The material properties and values of the various phases in the microscopic damage model were assigned based on the findings of previous studies [
19,
27]. The aggregate phase endowed elasticity, whereas the new- and old-mortar phases, ITZ1, and ITZ2 endowed elastic plasticity. The specific parameter values are listed in
Table 5.
4.3. Model Pre-Processing and Grid Partitioning
Prior to simulation, we implemented the following model settings: (1) a static universal analysis and rigid displacement loading were performed; (2) the total analysis time was 1 s, with a maximum increment of 10000 steps and a minimum increment of 1 × 10⁻⁶ step, a maximum increment step of 0.2, and an initial increment step of 0.1; and (3) a displacement load of 0.15 mm was applied to the top of the specimen and the lower end was fully consolidated.
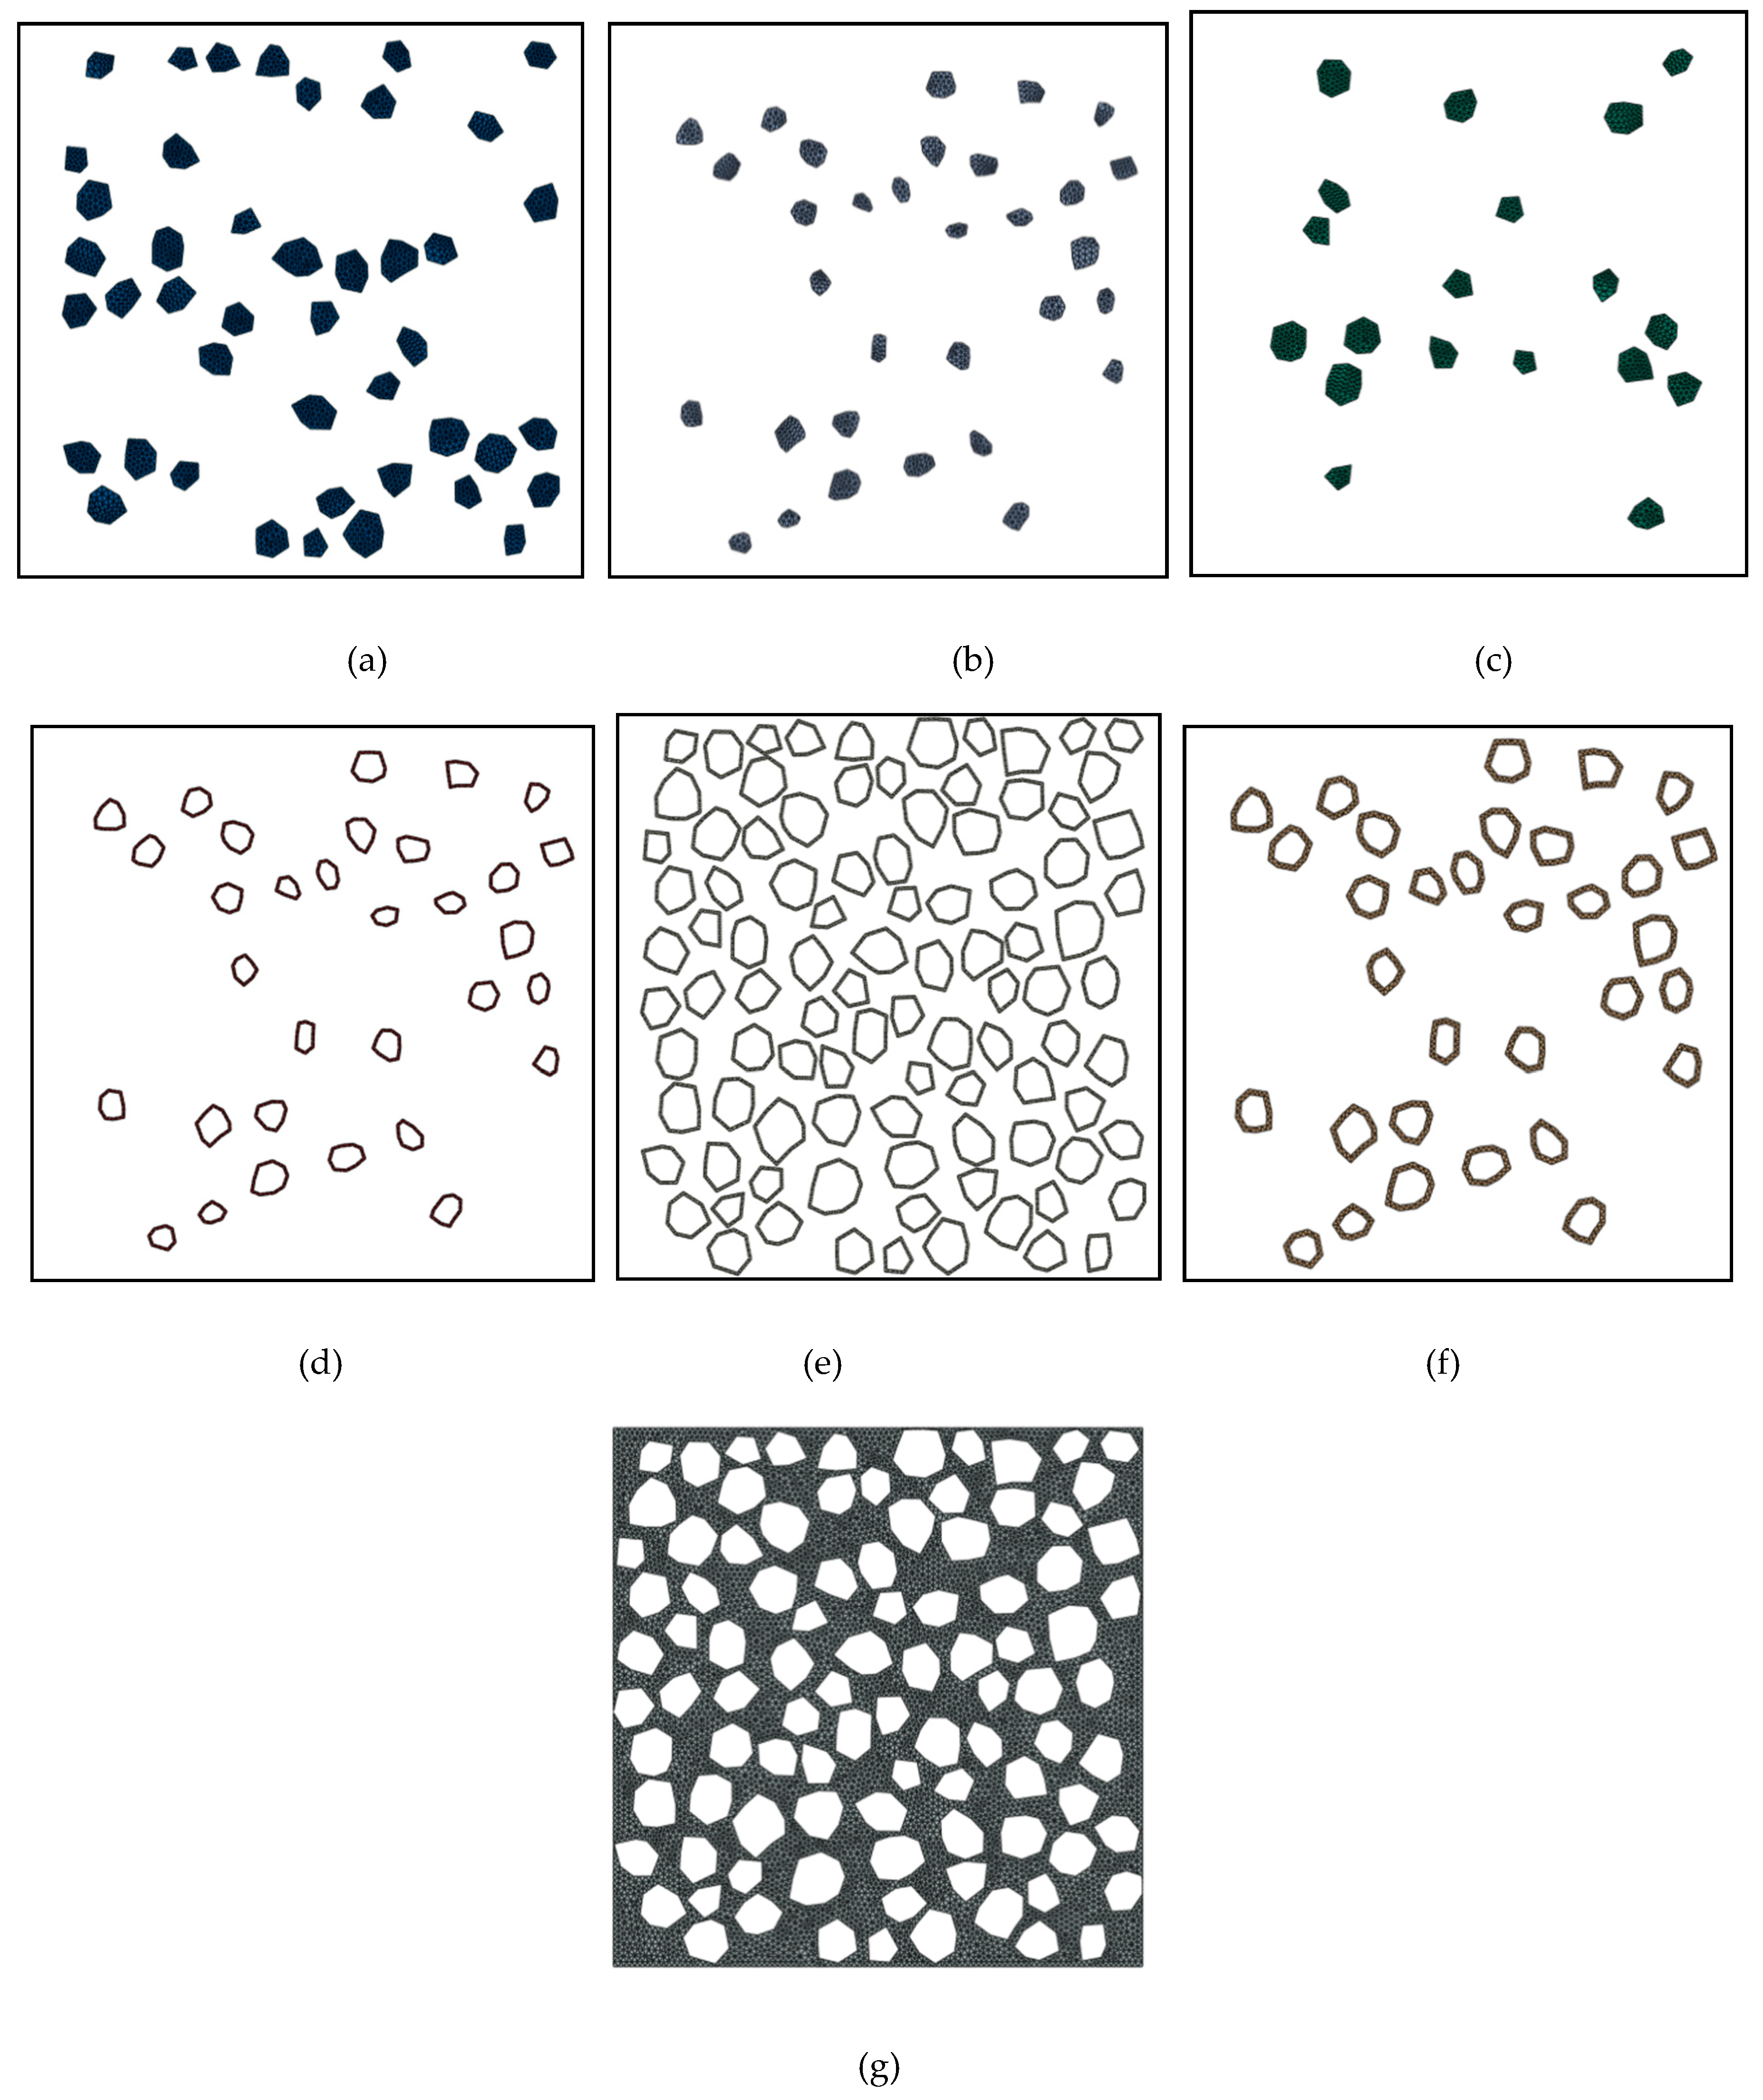
When the random aggregate model was established, finite element analysis was performed on the concrete microstructure using the model mesh. After each phase of the random aggregate model was defined, the global grid size of the mesh module was set to 1 mm. Grid units of different sizes were assigned to each phase. Schematics of the grid division for each phase are shown in
Figure 5 (for 30% brick content).
4.4. Verification of Random Aggregate Model
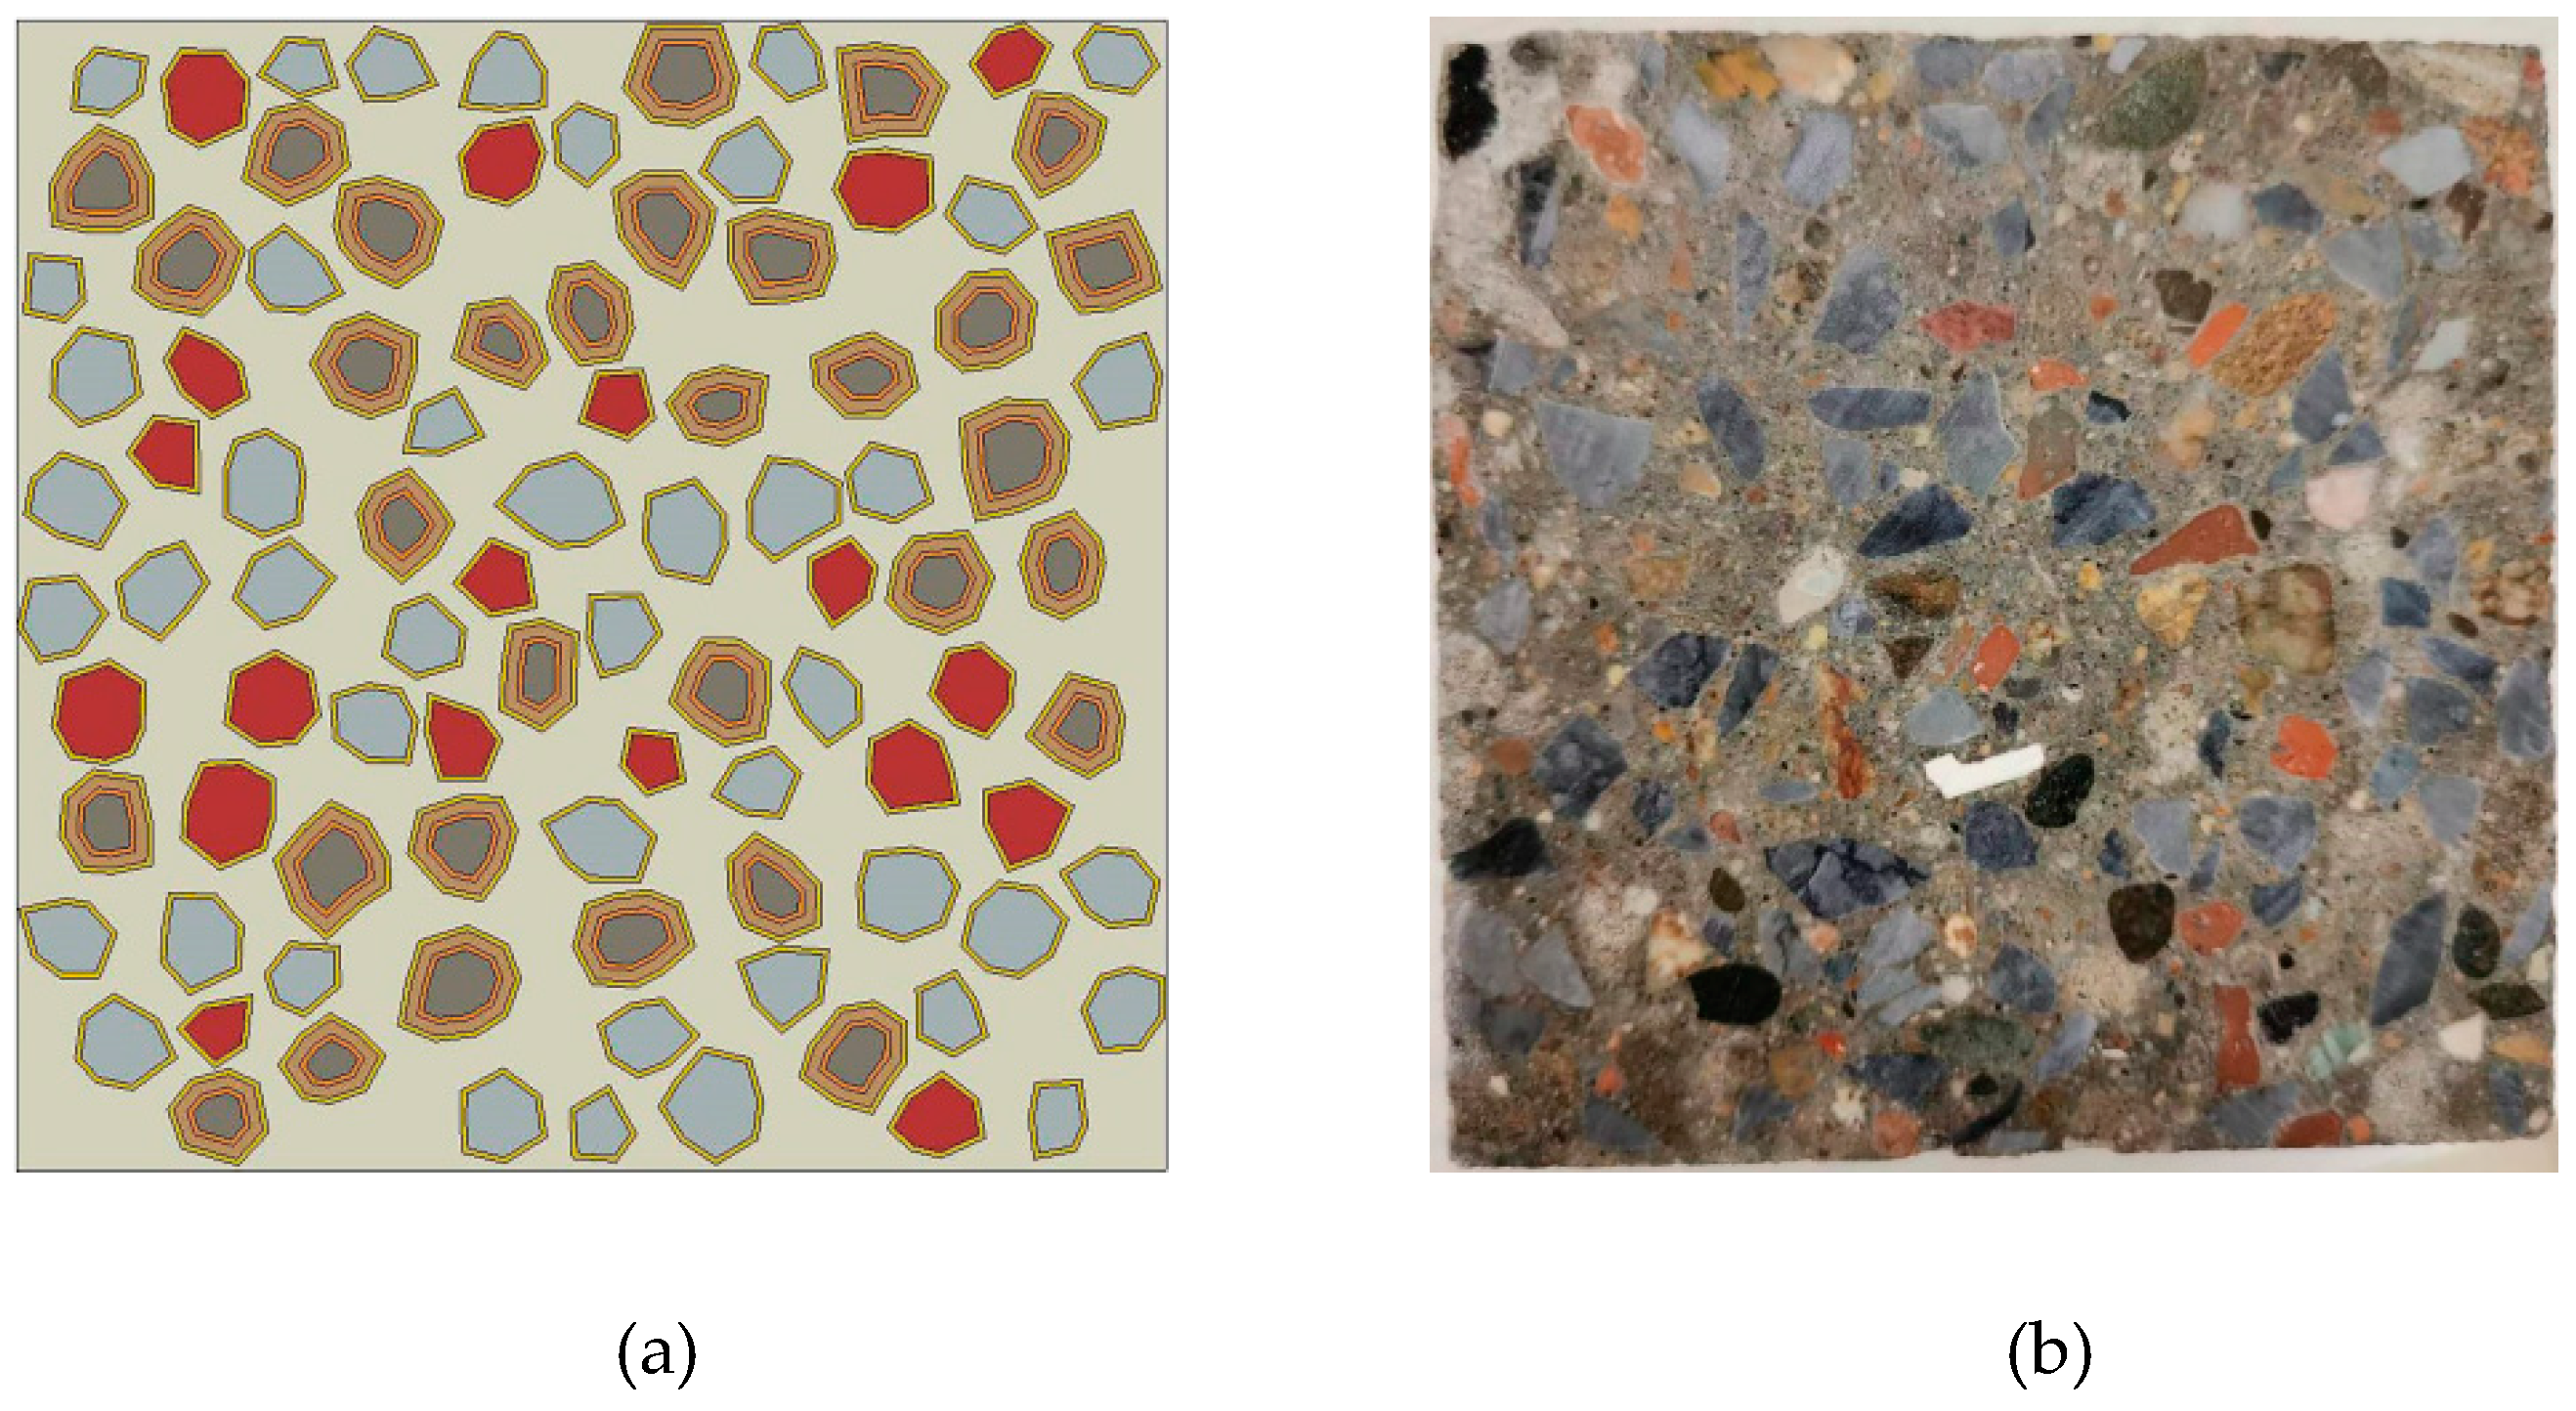
In the established random aggregate model, the volume of the randomly placed aggregate was less than 46%, the recycled-aggregate volume was 50% of the coarse aggregate volume , and the brick content of the recycled aggregate was 30%. Concrete specimens with corresponding coarse aggregate contents were prepared. The cut specimen cross section was compared with that produced by the random aggregate model (
Figure 6). The random aggregate model cross section matched that of the cut specimen in terms of the aggregate distribution. However, there were more needle-shaped aggregates in the cut specimen cross section owing to the randomness of the aggregate placement. The aggregate plane obtained when cutting the specimen could not represent the overall aggregate shape and presented only a random portion of the aggregate cross section. As a result, more needle-shaped aggregates were observed in the specimen cross section. This problem did not occur in the random aggregate model. Overall, the random aggregate model conformed to the actual distribution of the aggregate in the cut specimen cross section in terms of placement.
5. Simulation and Analysis of Micro-Damage in RC
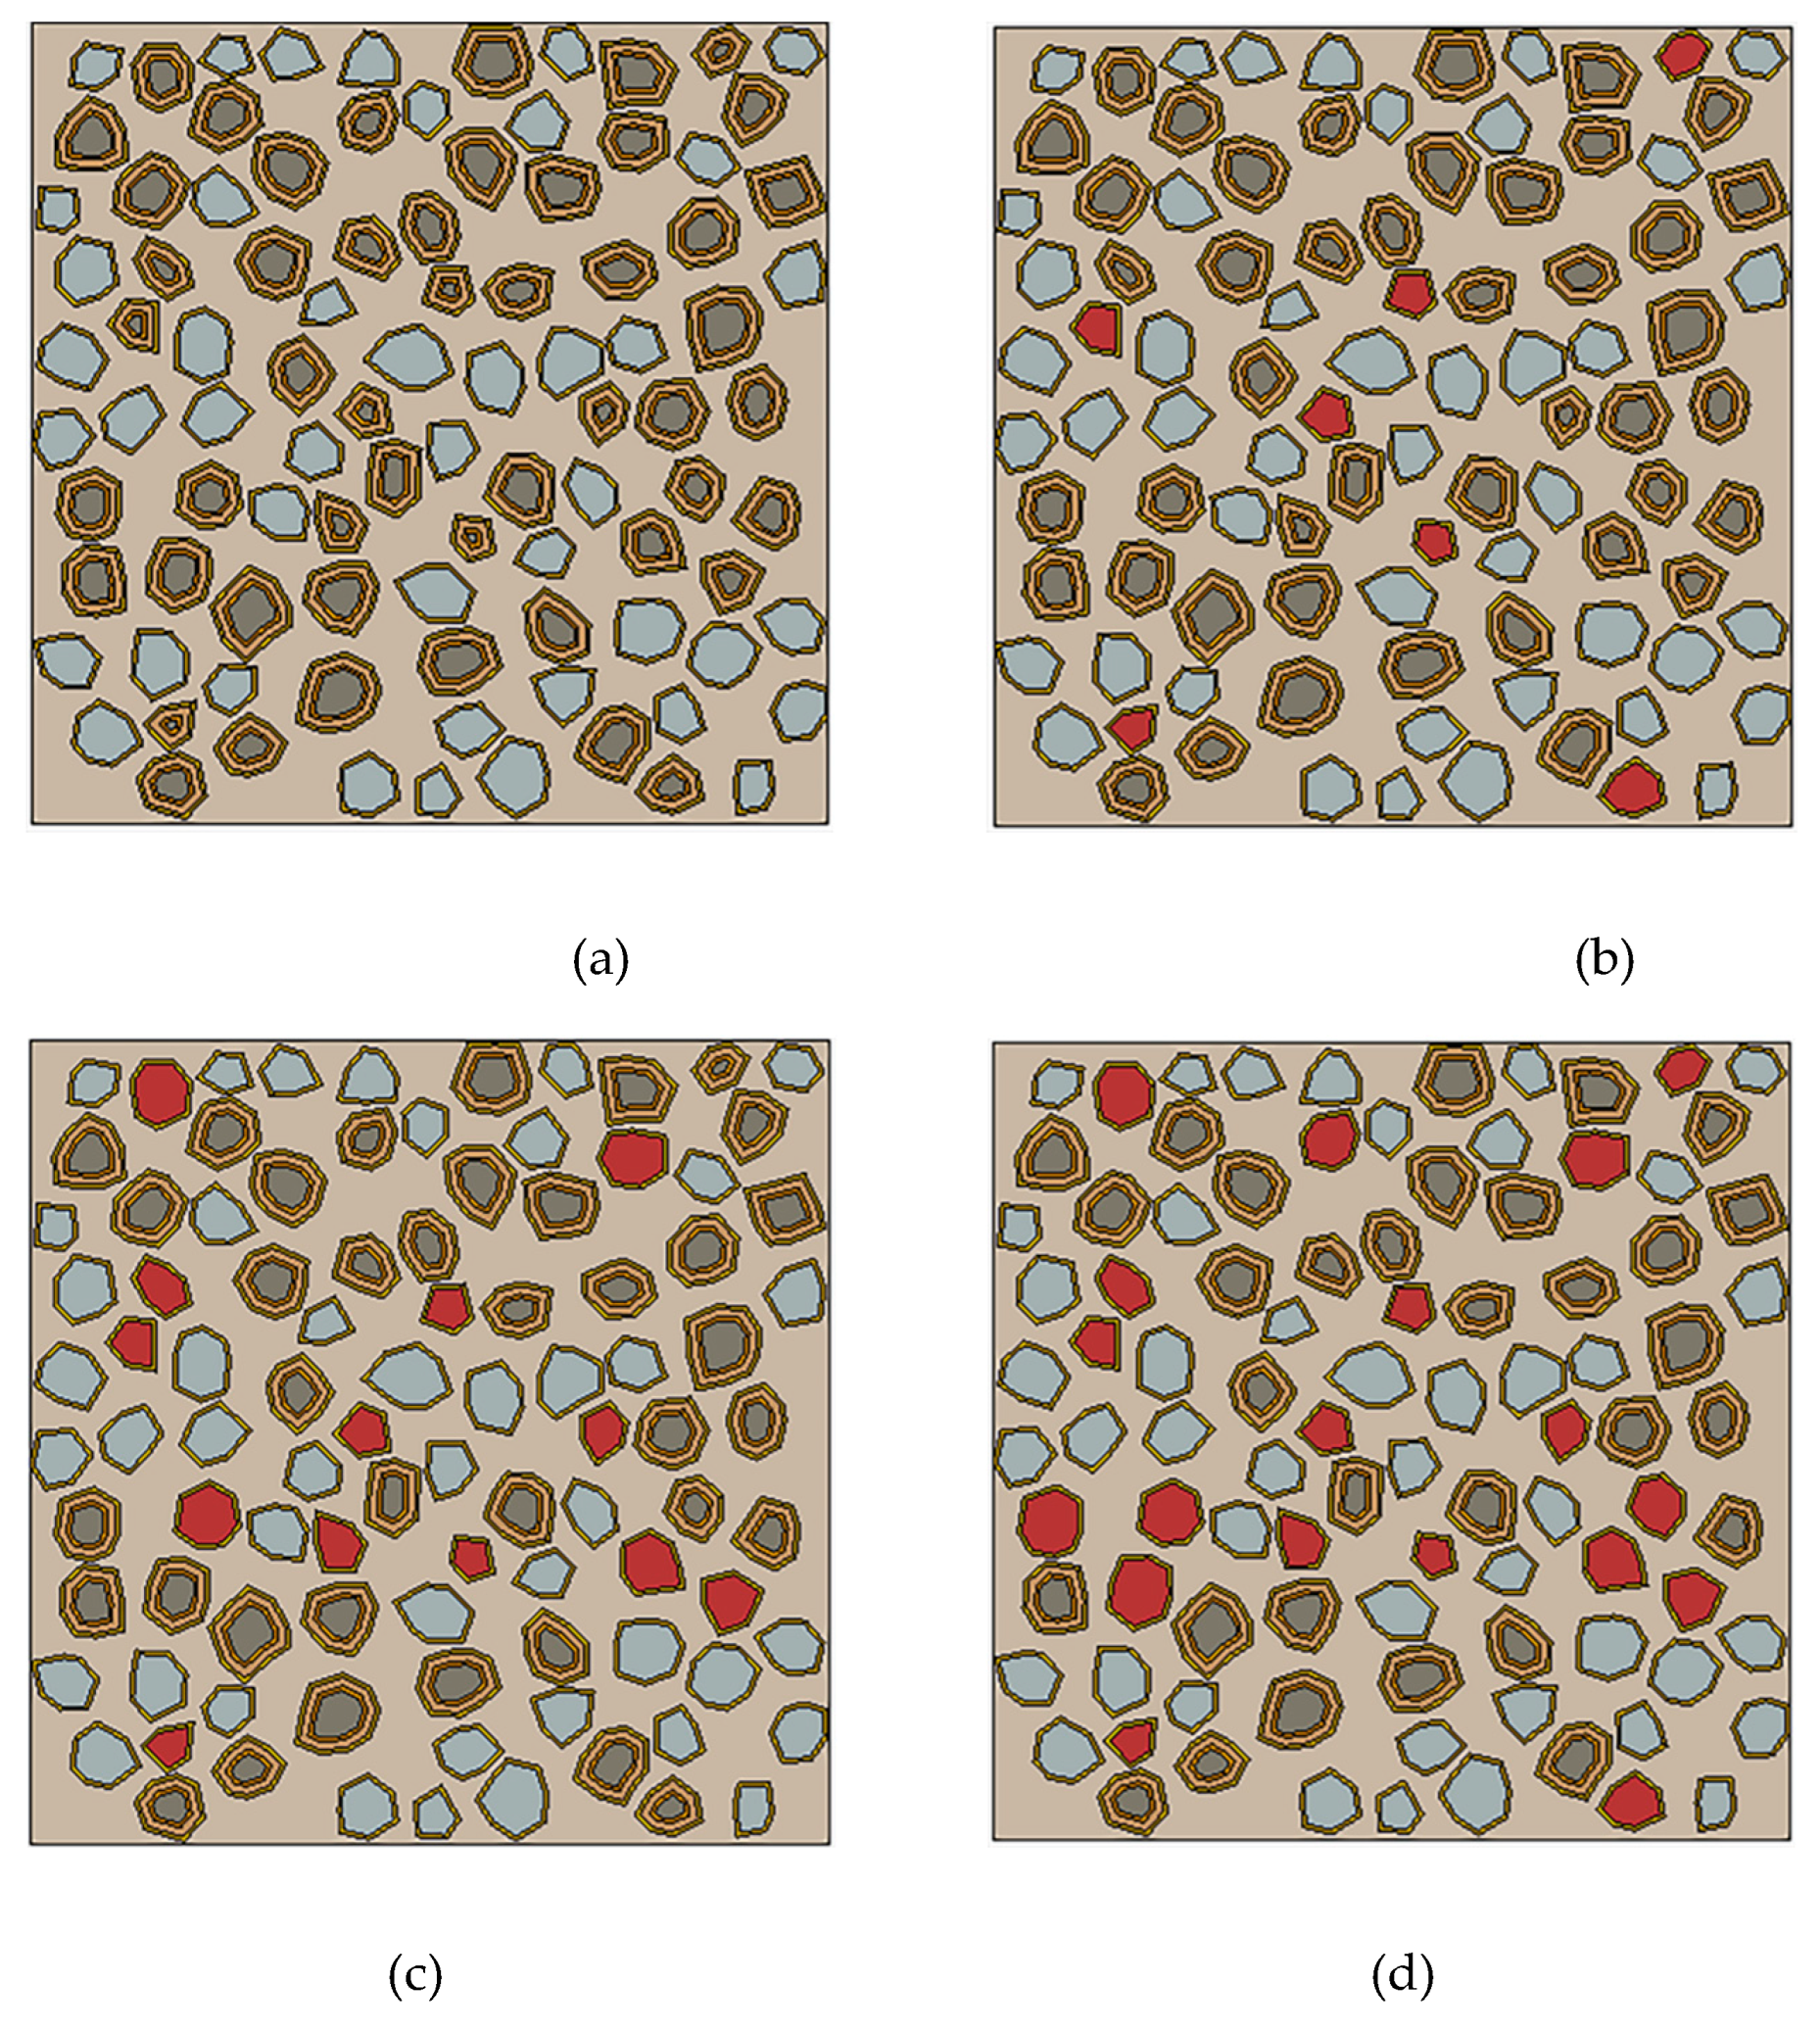
Microscopic damage simulations were performed for RC specimens that contained recycled aggregate brick contents of 0, 10, 20, and 30%, and in which the recycled aggregate comprised 50% of the coarse aggregate. Random aggregate models for the different brick contents are shown in
Figure 7.
5.1. Mesoscopic Damage Development in RC
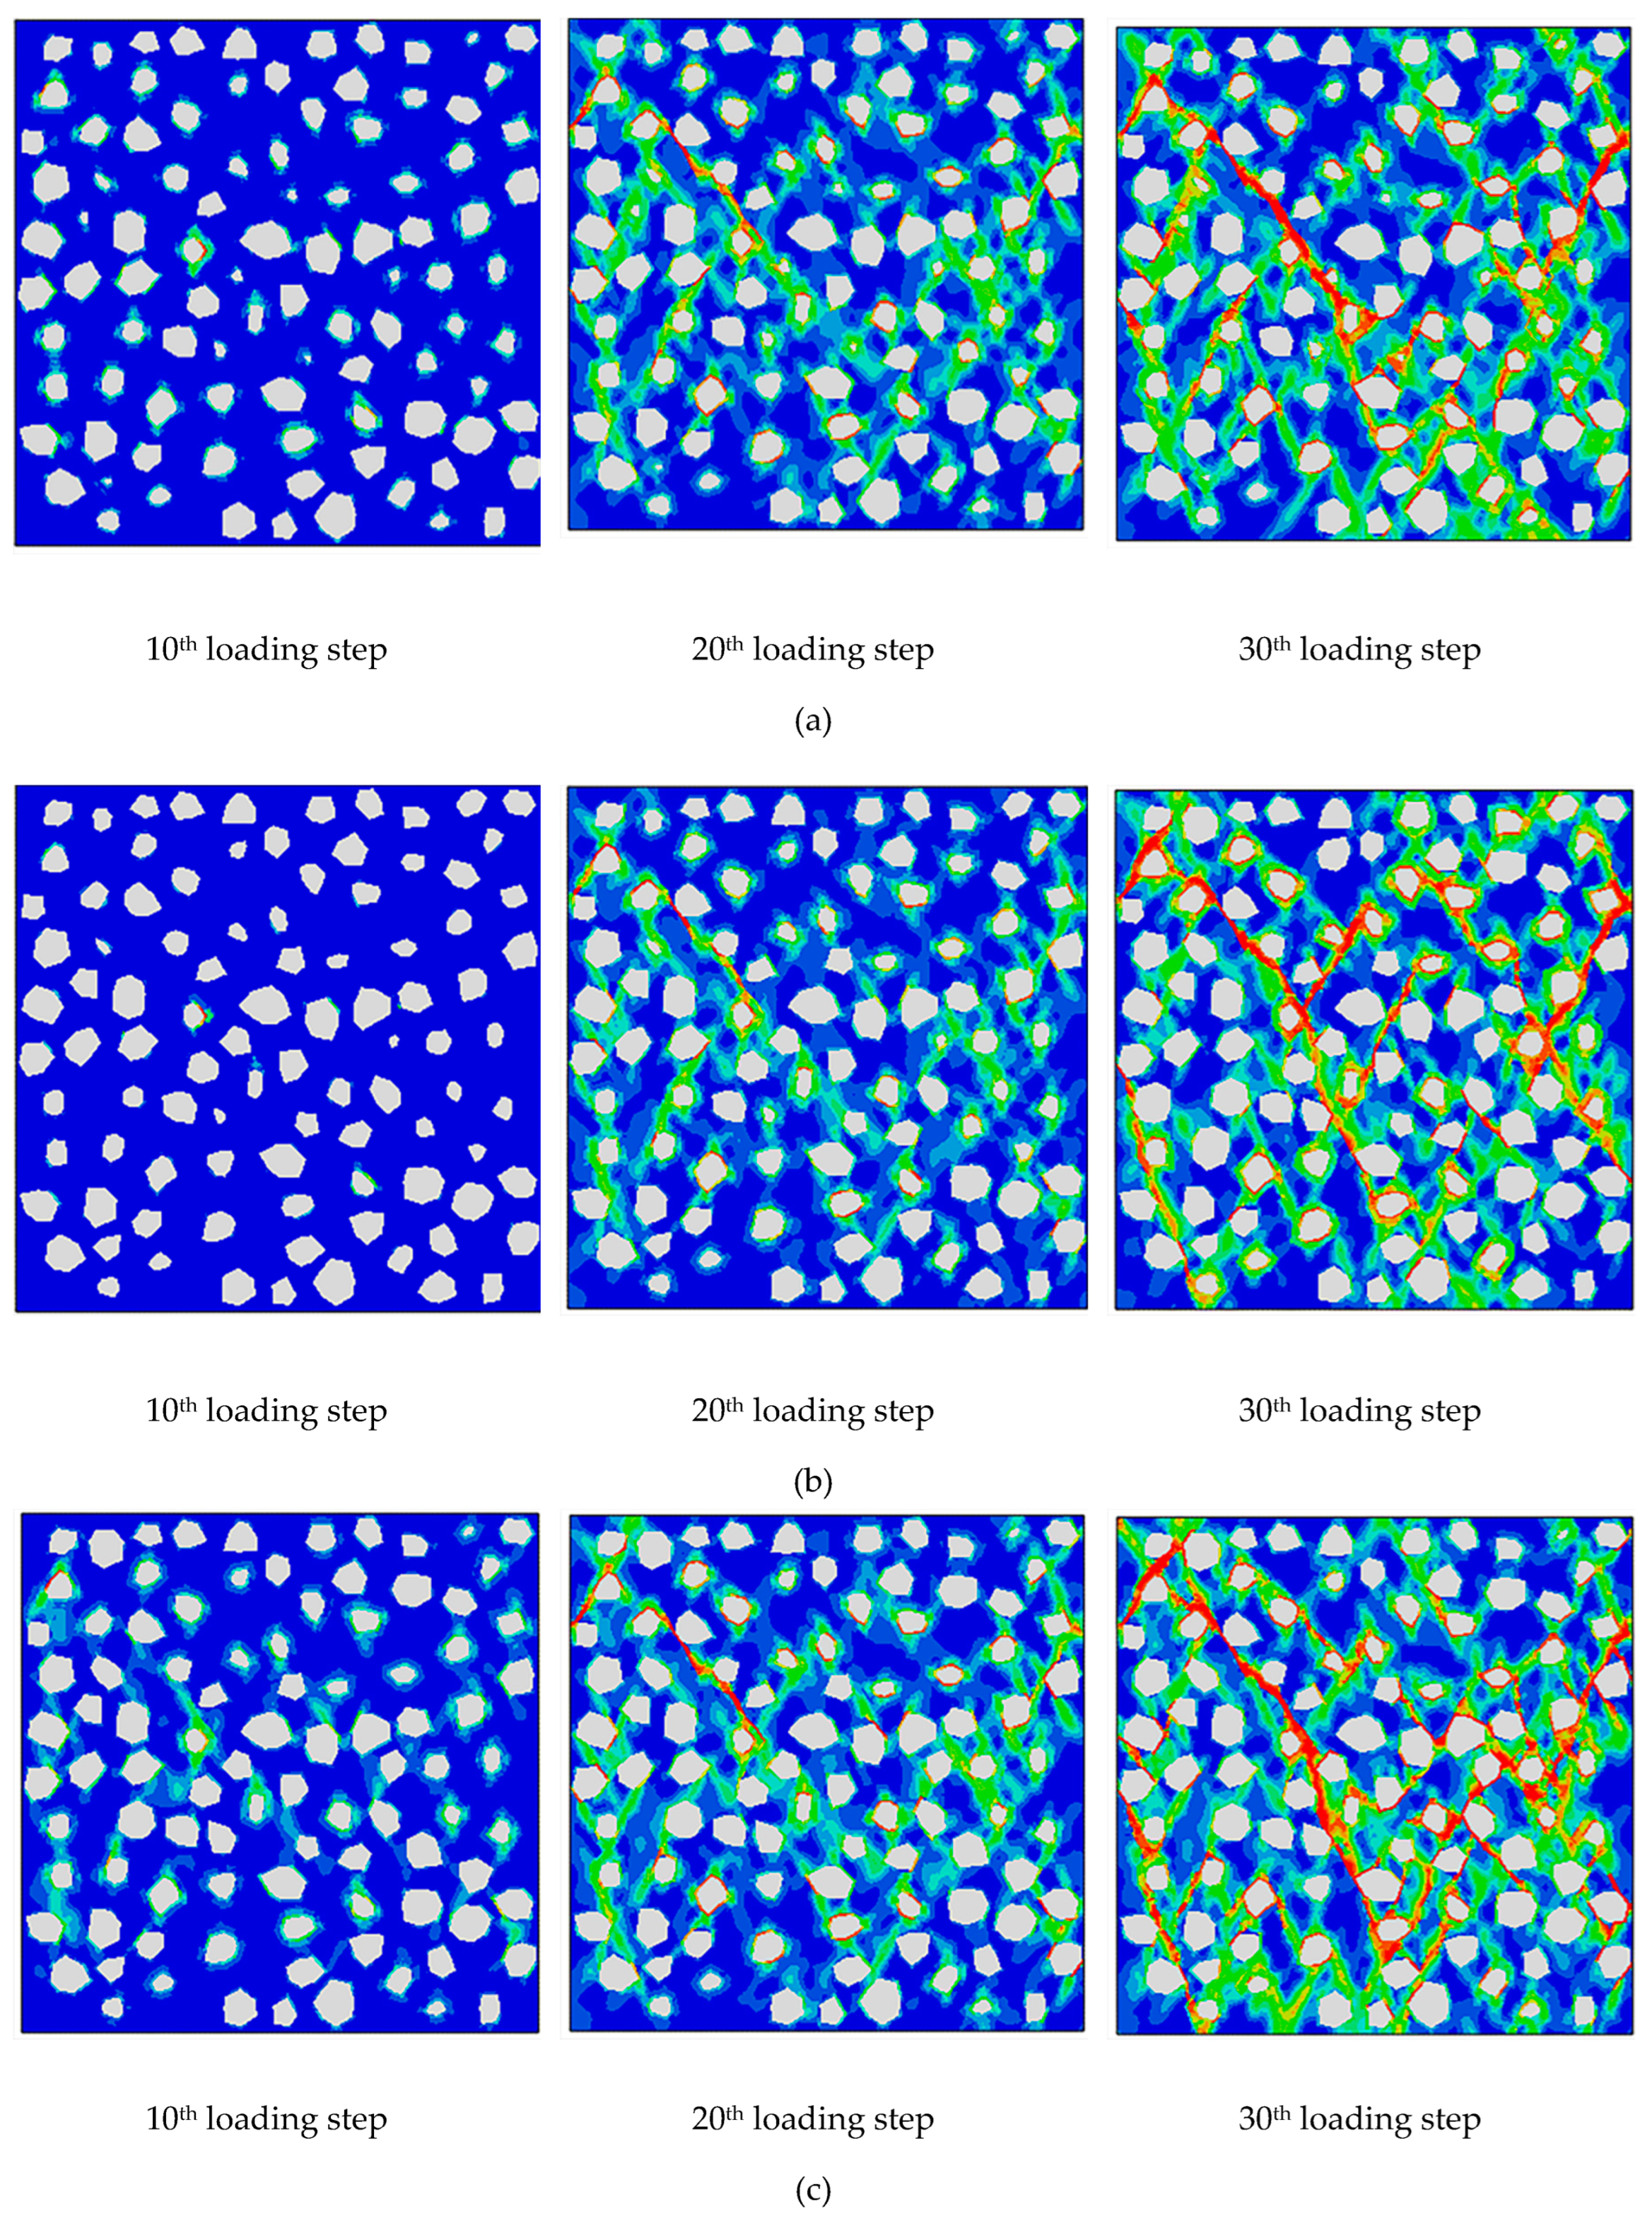
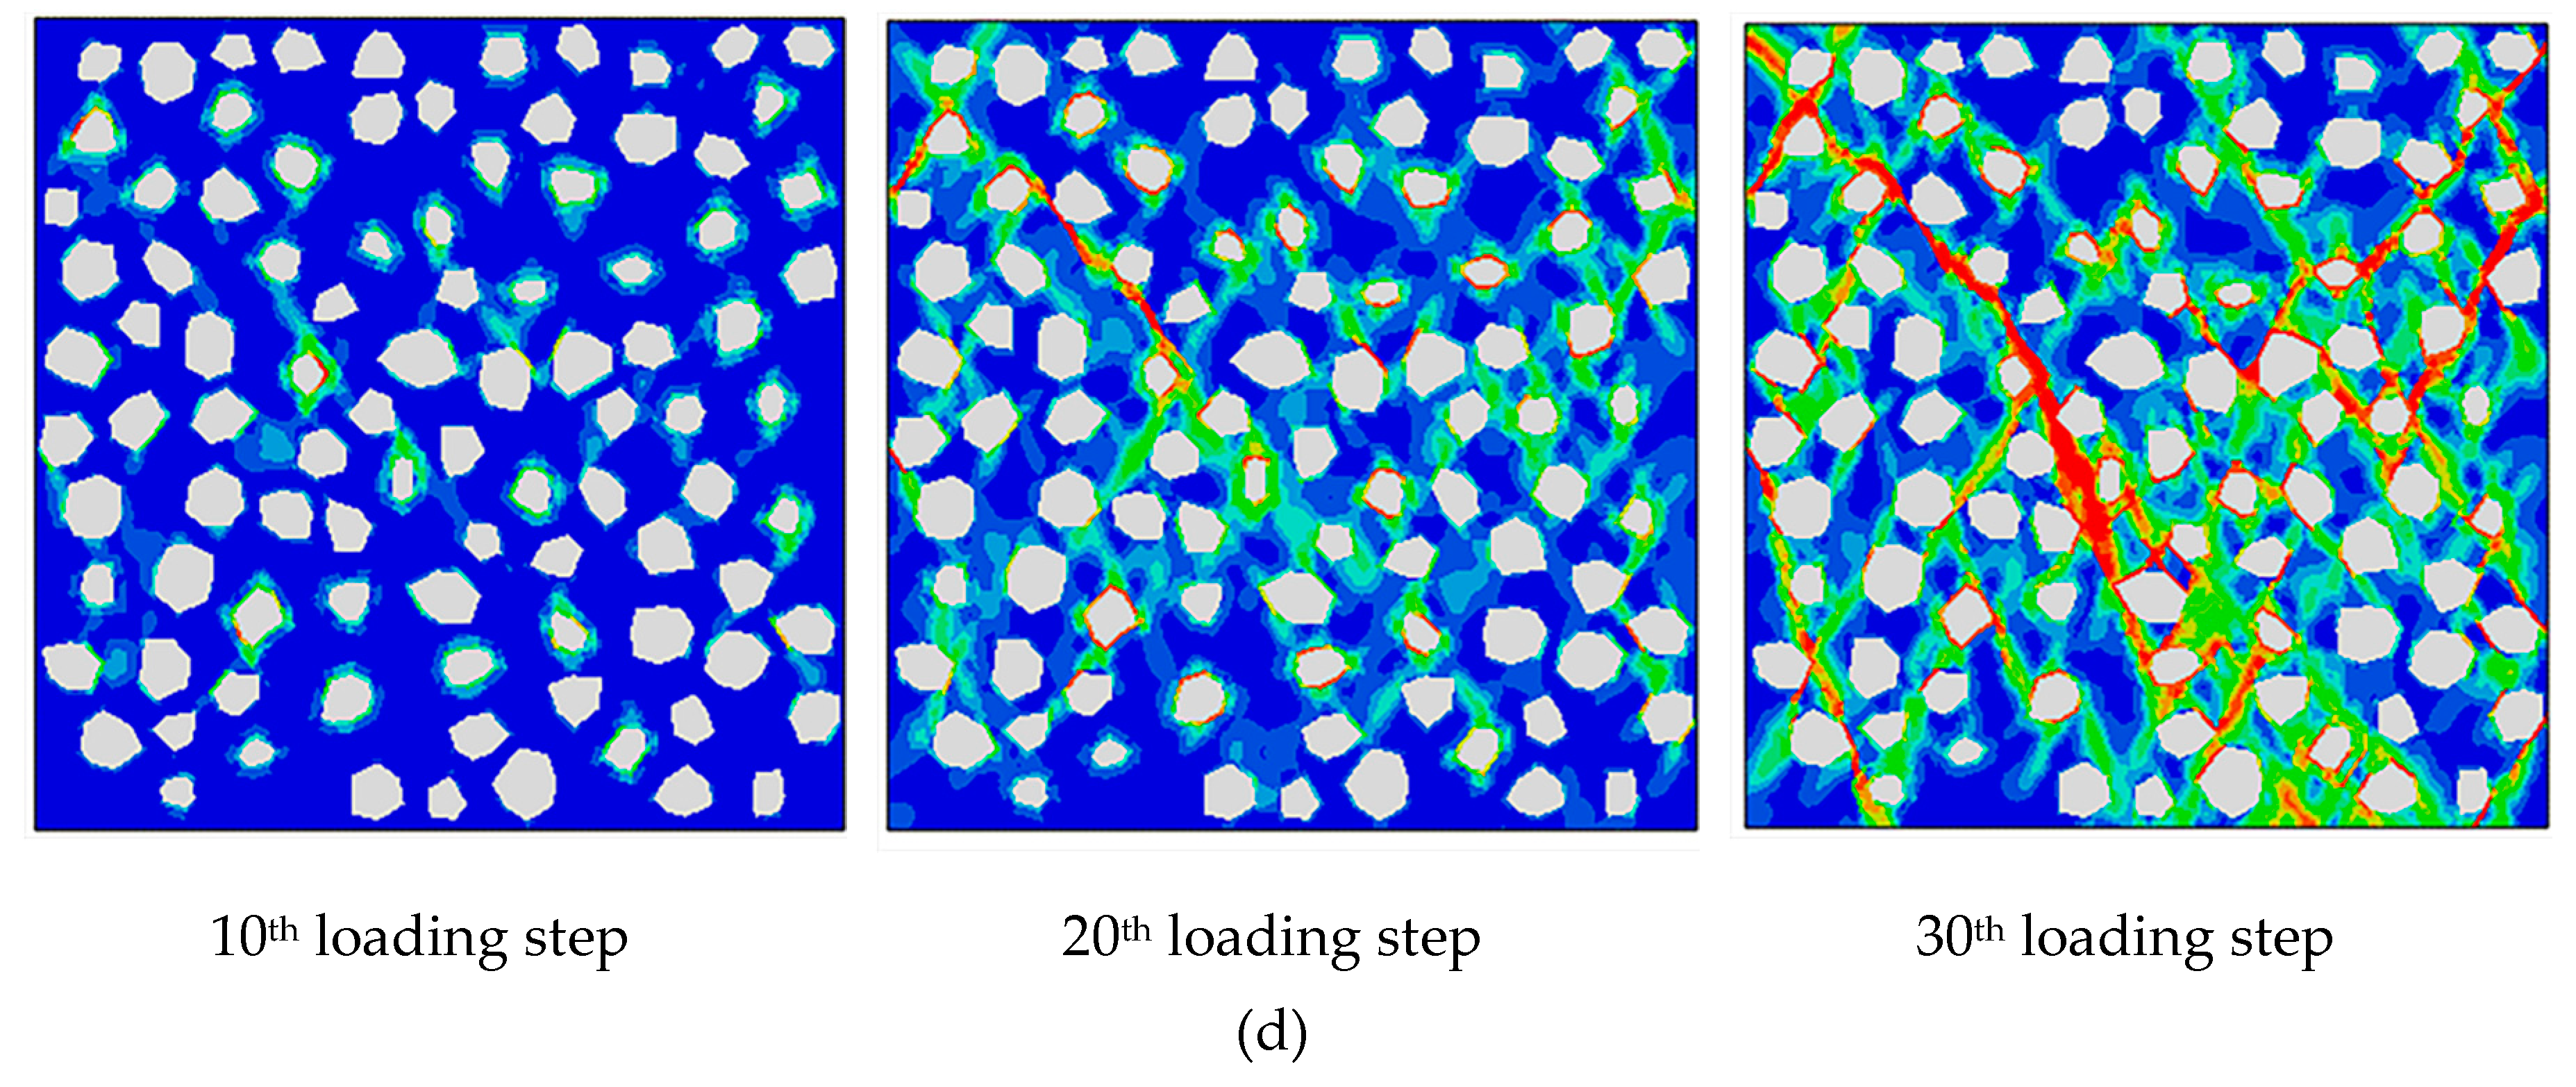
The development of compressive damage in the RC specimens with different brick contents are shown in
Figure 8 with increasing loading step numbers.
Figure 8 indicates that the RC specimens with different brick contents exhibited slight local damage in the initial stage (10
th loading step) at ITZ2. As loading continued to the 20
th step, ITZ1 and the old mortar exhibited successive damage. During the initial stage of damage development, the damage accumulated gradually and connected to form a damage band that developed at a 45° angle below the specimen surface. By the time loading was complete (30
th loading step), a V-shaped damage band had formed inside the concrete. This damage band extended through the cross section, at which point the concrete was completely destroyed.
Comparison of the damage development in the RC specimens with different brick contents indicates that the damage developed faster at brick contents of 20% and 30% under Step 10 loading, yielding more observed local damage units. When loaded to Step 20, few differences were apparent among the damage patterns developed in the different specimens. When loaded to Step 30, higher brick contents were correlated with higher degrees of damage band penetration and larger numbers of small connected damage bands (red in
Figure 8). At 30% brick content, the damage bands widened and extended to the upper surfaces of the specimens. This behavior was owing to the higher brick content, which decreased the strength of the entire concrete skeletal structure. Note that brick has relatively weak resistance to deformation and the internal structure of concrete is prone to deformation; therefore, a large amount of damage accumulated in the concrete with a high brick content.
5.2. Stress Nephograms of RC Specimens with Brick and Concrete Aggregates
The stress nephograms obtained from the model-based analysis were compared with the standard failure morphologies of the physical specimens (
Figure 9, 10% brick content).
Figure 9 shows that the stress concentration zone in the stress nephogram is similar to the shape observed in the failure form of the physical concrete specimen, as both exhibited hourglass-type shrinkage from both ends to the center. This outcome indicates that the unshaded area in
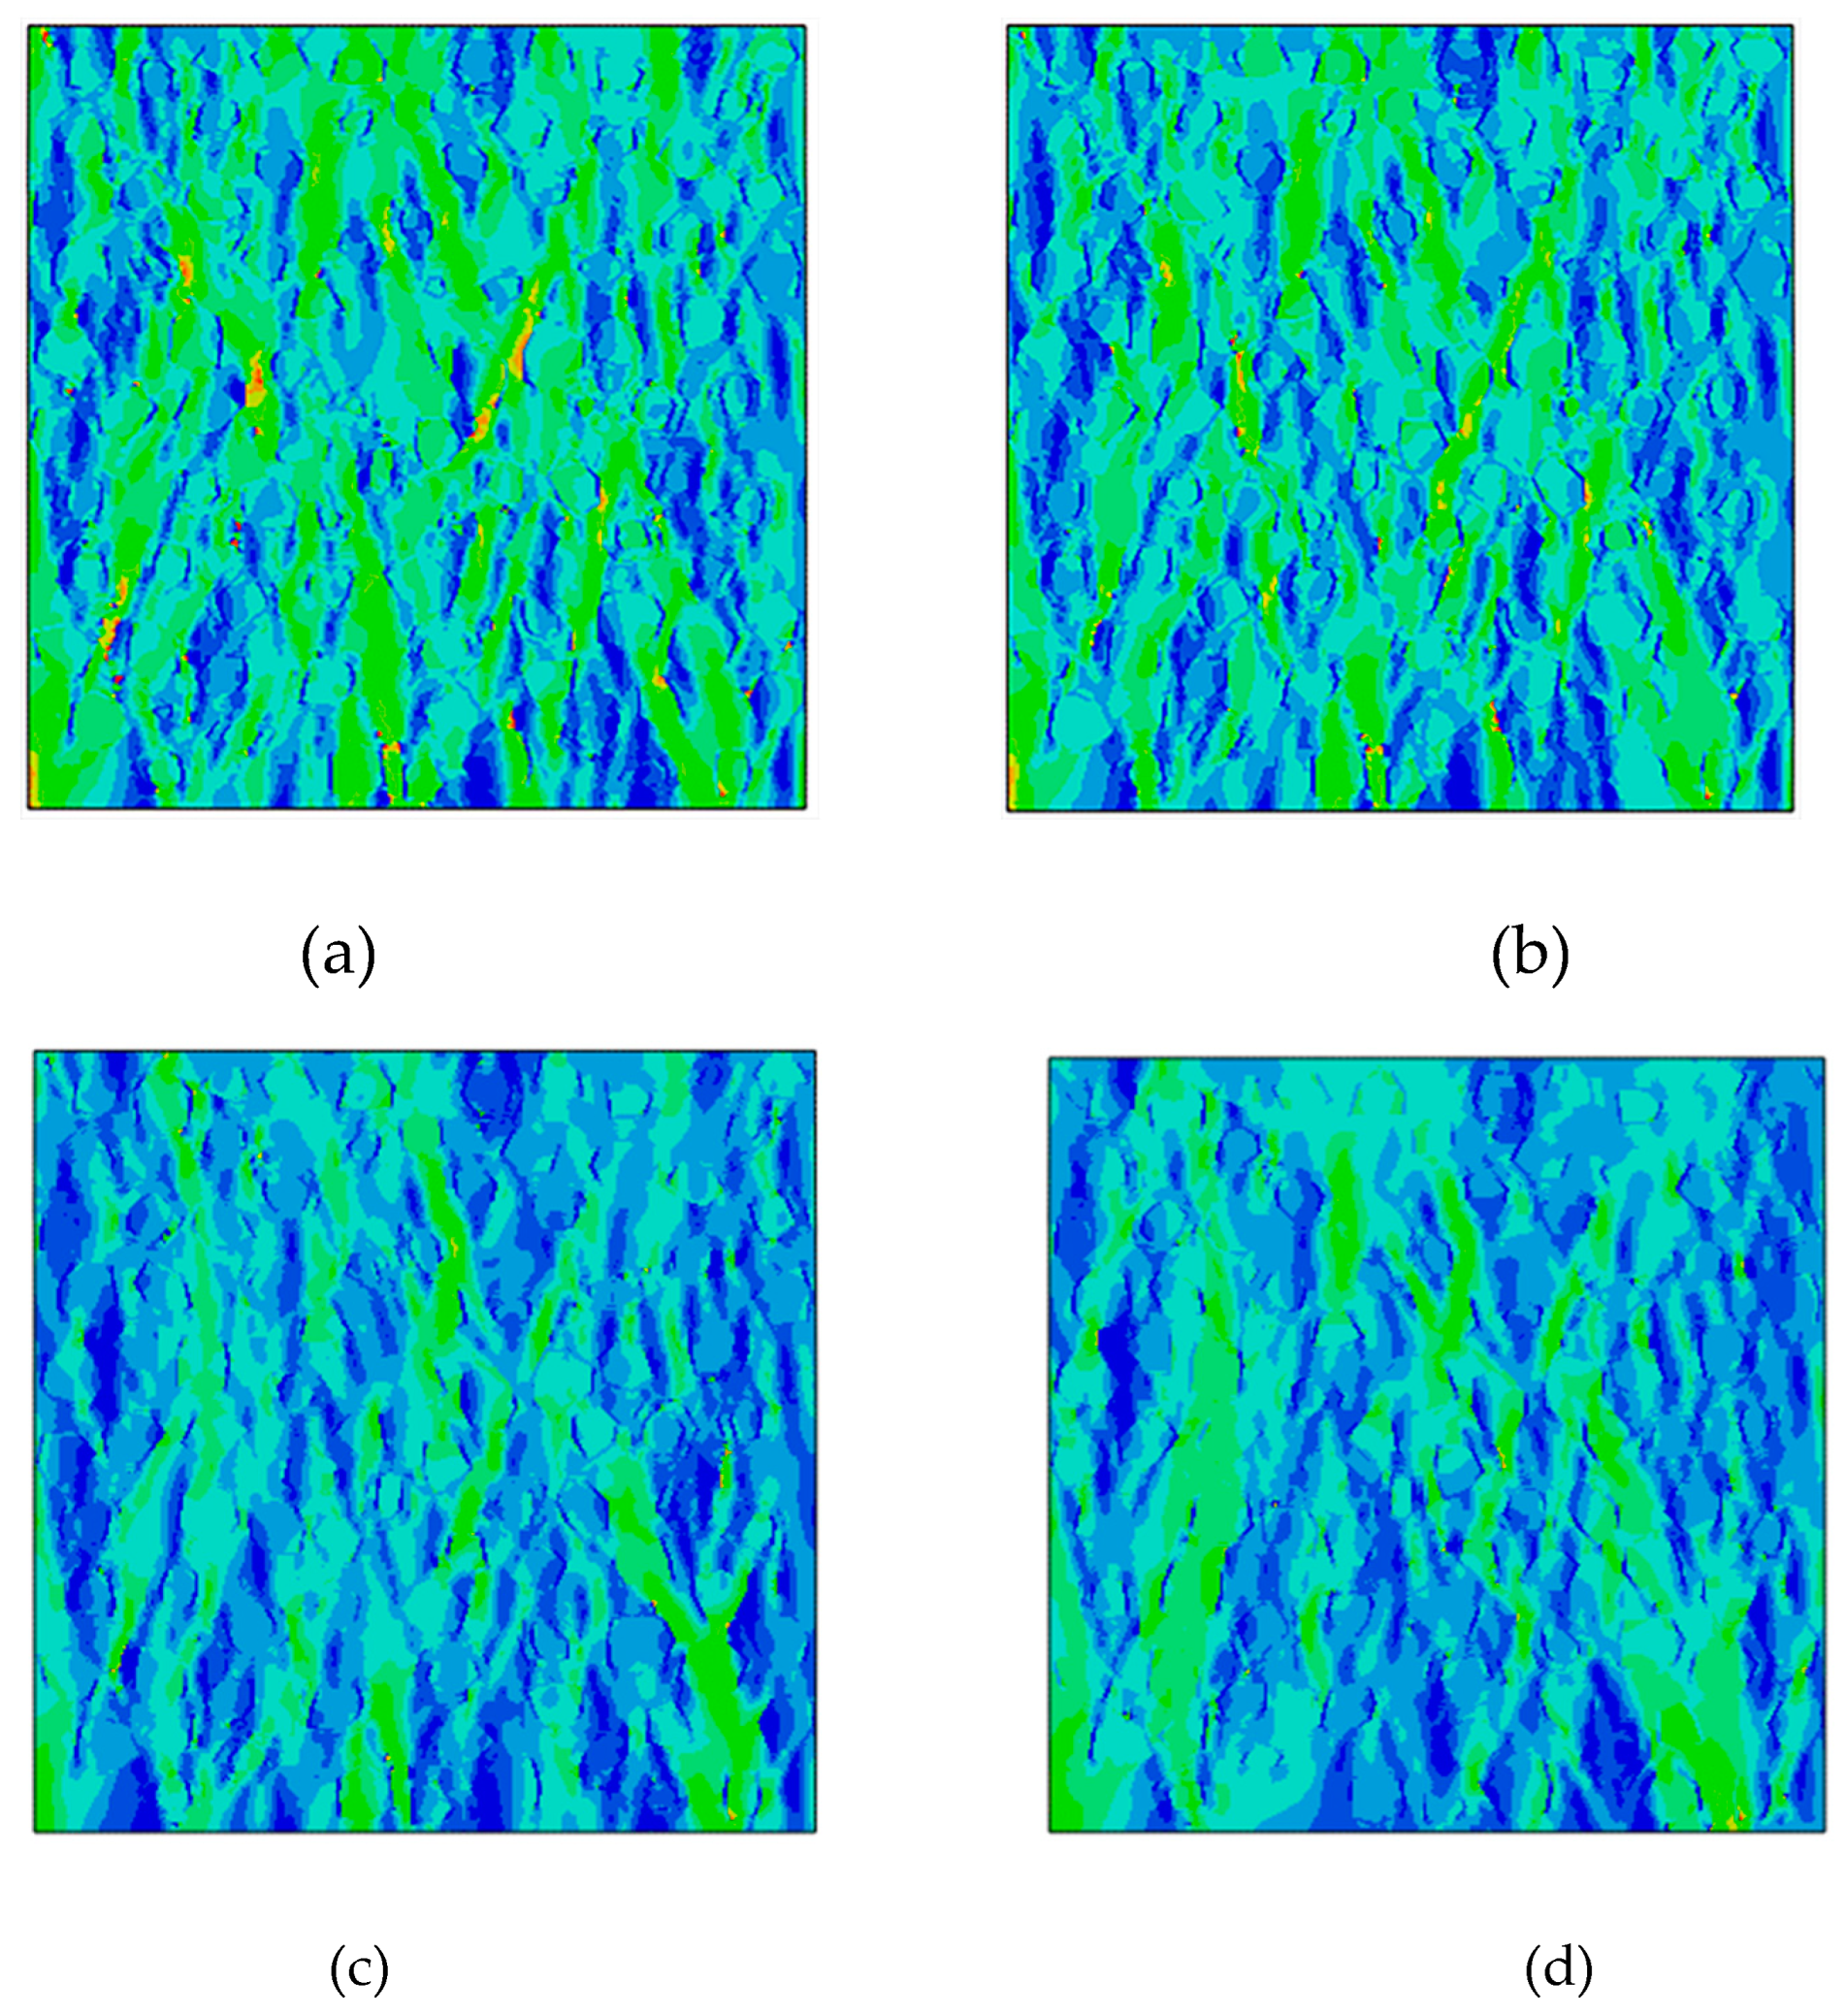
Figure 9 was the stress concentration area. This region was the main load-bearing area in the concrete, which acted as a skeleton that maintained the structural stability of the specimen. Stress nephograms of the RC specimens with different brick contents are shown in
Figure 10.
Based on the stress nephograms of the RC specimens with different brick contents (
Figure 10), the stress concentration bands manifested as hourglass-shaped shrinkage from both ends to the center. With increasing brick content, the area of the stress concentration zone in the stress nephogram decreased significantly. This confirms that, in the microstructure, an increase in brick content reduces the RC skeletal strength, thereby reducing its stress concentration area.
5.3 Model Validation
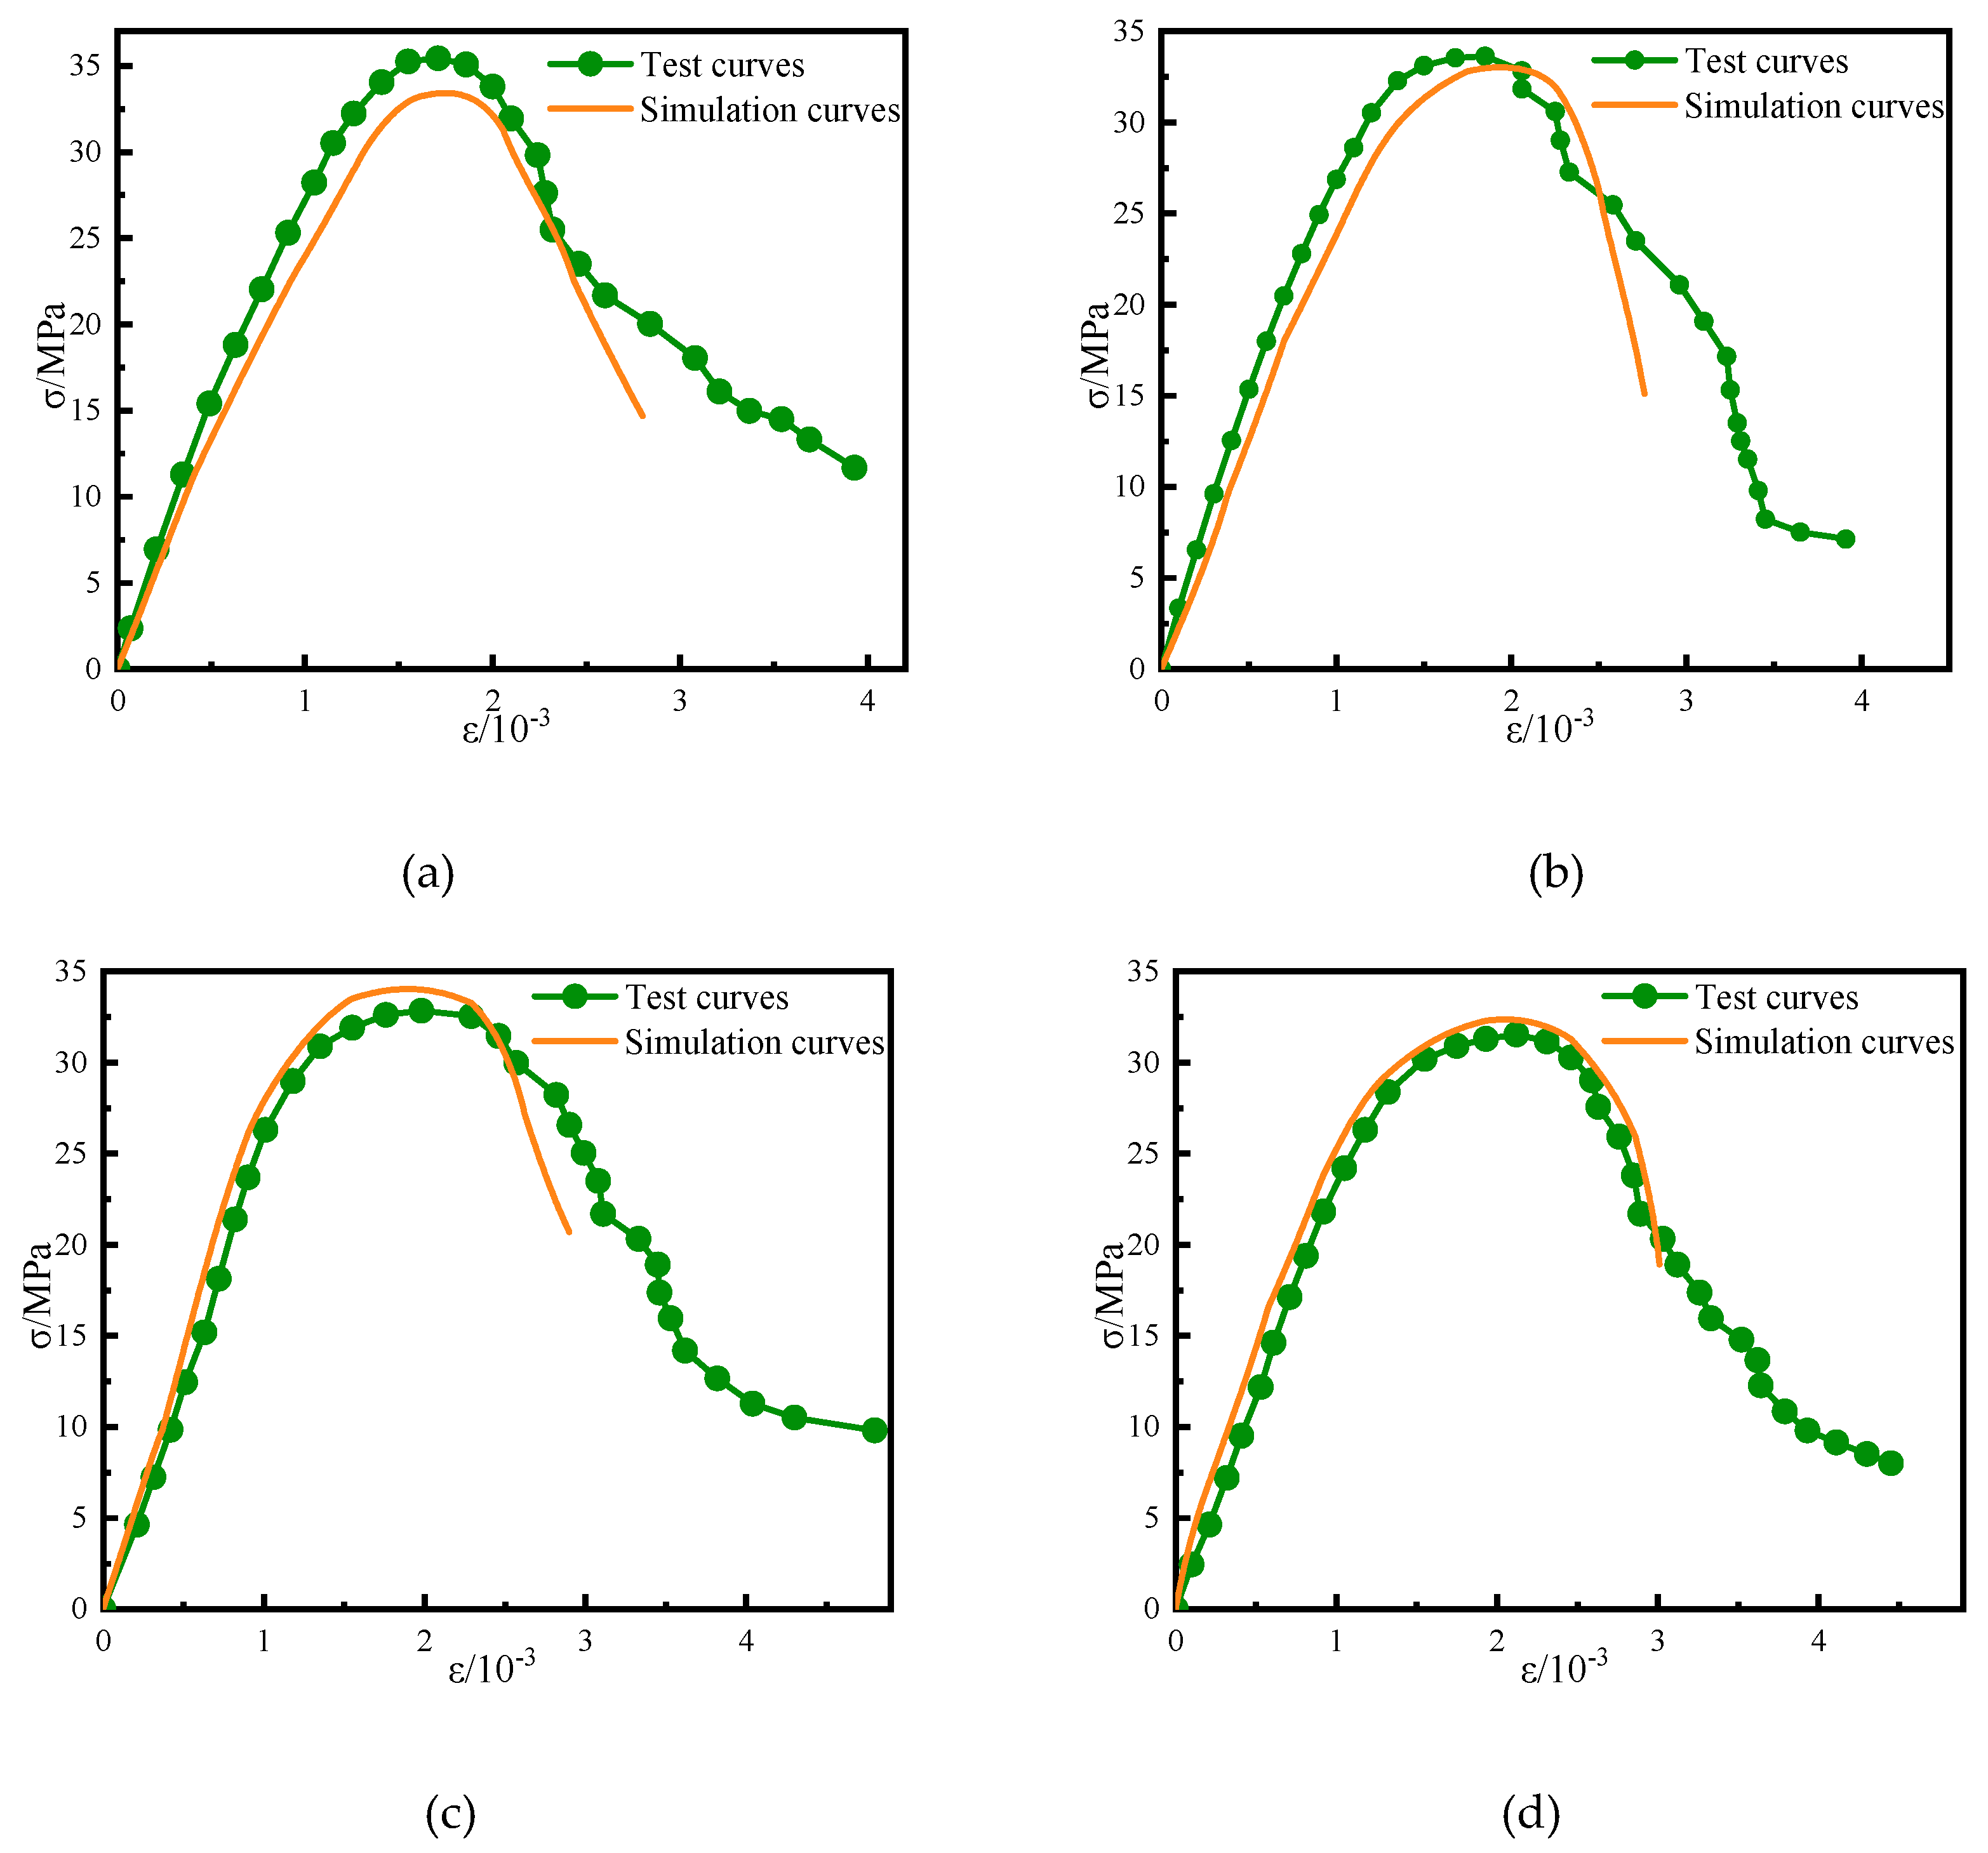
Displacement reaction curves were extracted to obtain the stress–strain curves of the RC specimens with different brick contents. The recycled aggregate obtained from the comparative test comprised 50% of the coarse aggregate, and the stress–strain curves of the recycled aggregates with brick contents of 0, 10%, 20%, and 30% were obtained. The stress–strain curves of the physical and simulated specimens are shown in
Figure 11.
Figure 11 shows that the stress–strain curves for the simulated specimens with different brick contents had the same basic trends as those of the physical specimens, with a high overlap. In the increasing stage, the agreement between the simulated and experimental curves was relatively high. During the decreasing phase, the maximum strain on the simulated curve was less than that on the experimental curve. At low brick contents, the peak experimental stress exceeded the simulated value (
Figure 11a,b), whereas the peak experimental stress was less than the simulated value at higher brick contents (
Figure 11c,d). This is because the initial damage to the concrete specimen increased as a result of the higher brick content. As concrete is a heterogeneous material, the added brick could not be fully simulated, which yielded a higher initial damage to the concrete. As a result, the peak stress values produced by the simulation exceeded those obtained in the macroscopic mechanical tests.
In this study, the uniaxial compression of RC containing aggregate with various brick contents was simulated by a meso-scale model. By assigning the locations of various materials inside the concrete, it can be more intuitive to obtain the changes in the brick content of the RC. In addition, the internal damage evolution law of RC containing brick aggregate can be analyzed.
6. Conclusions
In this study, the damage and stress changes in RC specimens with different brick contents were simulated under uniaxial compression using a random aggregate model based on the Monte Carlo method and using the ABAQUS software package. The following conclusions were drawn.
(1) In a process based on the Monte Carlo method, random aggregates were generated and placed in a two-dimensional plane within a specified area. The resultant random aggregate model was in good agreement with the physical specimen cross section.
(2) For each specimen, the initial damage under compressive stress occurred as a subtle damage band. After additional loading steps, multiple connected damage bands developed inside the specimens. When complete damage was achieved, the specimen interior exhibited a V-shaped damage band. Higher brick contents were correlated with larger damage network areas inside the specimen. The damage began with microcracks, which expanded and penetrated the specimen, producing macroscopic cracks and ultimately inducing complete failure.
(3) The stress nephograms of all specimens exhibited hourglass-type stress concentration areas that contracted from the upper and lower ends to the center. At higher brick contents, the stress concentration area decreased, which was reflected in the physical properties of the specimen as lower skeletal strength and compressive capacity.
(4) The stress–strain curves of the RC specimens with different brick contents obtained from the macroscopic mechanical tests coincided well with those obtained from the simulations. This outcome verifies the reliability of the meso-constitutive model for the RC specimens containing brick aggregate produced in this study.
The two-dimensional model considered in this paper simulated damage changes on a single plane. Owing to the number of parameters considered in this study, which required considerable computing power, three-dimensional simulations were not performed. In future research, with improved computing power, the accuracy of the model can be improved by considering three-dimensional parameters.
Author Contributions
Conceptualization, B.Y.; Data curation, B.Y.; Formal analysis, B.Y. and M.Y.; Funding acquisition, L.Q.; Investigation, B.Y. and M.Y.; Methodology, M.Z.; Project administration, L.Q.; Resources, L.Q. and M.Y.; Software, M.Y. and M.Z.; Supervision, L.Q.; Validation, L.Q. and B.Y.; Writing—original draft, L.Q., B.Y., and M.Z.; Writing—review and editing, L.Q. and M.Z. All authors have read and agreed to the published version of the manuscript.
Funding
This research was supported by the Scientific Research Development Fund Project of Shenyang Urban Construction University (No. XKJ202309).
Data Availability Statement
The original data presented in the study are included in the article. Further inquiries can be directed to the corresponding author.
Acknowledgments
This study was performed at the School of Civil Engineering in Shenyang Urban Construction University, at the Transportation Engineering College in Dalian Maritime University, and at the School of Transportation and Geomatics Engineering in Shenyang Jianzhu University.
Conflicts of Interest
The authors declare no conflicts of interest.
References
- Cantero, B.; Sáez del Bosque, I.F.; Sánchez de Rojas, M.I.; Matías, A.; Medina, C. Durability of concretes bearing construction and demolition waste as cement and coarse aggregate substitutes. Cem. Concr. Compos. 2022, 134, 104722. [Google Scholar] [CrossRef]
- Alexandridou, C.; Angelopoulos, G.N.; Coutelieris, F.A. Mechanical and durability performance of concrete produced with recycled aggregates from Greek construction and demolition waste plants. J. Clean. Prod. 2018, 176, 745–757. [Google Scholar] [CrossRef]
- Liu, Y.; Zhou, J.; Wu, D.; Kang, T.; Liu, A. Bond behavior of recycled fiber recycled concrete with reinforcement after freeze-thaw cycles. Crystals 2021, 11, 1506. [Google Scholar] [CrossRef]
- Zhu, Q.; Chen, J.; He, Y.; Sun, X. Bond stress distribution and bond–slip model of deformed steel bars in iron tailing sand recycled aggregate concrete. Buildings 2023, 13, 1176. [Google Scholar] [CrossRef]
- Ahmed, W.; Lim, C.W. Evaluating fracture parameters of basalt fiber reinforced and pozzolana slurry modified recycled concrete produced from waste. Structures 2023, 50, 1476–1492. [Google Scholar] [CrossRef]
- Chakraborty, S.; Subramaniam, K.V.L. Influences of matrix strength and weak planes on fracture response of recycled aggregate concrete. Theor. App. Fract. Mech. 2023, 124, 103801. [Google Scholar] [CrossRef]
- Tabsh, S.W.; Abdelfatah, A.S. Influence of recycled concrete aggregates on strength properties of concrete. Constr. Build. Mater. 2008, 23, 1163–1167. [Google Scholar] [CrossRef]
- Zheng, C.; Lou, C.; Du, G.; Li, X.; Liu, Z.; Li, L. Mechanical properties of recycled concrete with demolished waste concrete aggregate and clay brick aggregate. Results Phys. 2018, 9, 1317–1322. [Google Scholar] [CrossRef]
- Rahal, K. Mechanical properties of concrete with recycled coarse aggregate. Build. Environ. 2005, 42, 407–415. [Google Scholar] [CrossRef]
- Mohammed, T.U.; Hasnat, A.; Awal, M.A.; Bosunia, S.Z. Recycling of brick aggregate concrete as coarse aggregate. J. Mater. Civ. Eng. 2015, 27. [Google Scholar] [CrossRef]
- Letelier, V.; Ortega, J.M.; Muñoz, P.; Tarela, E.; Moriconi, G. Influence of waste brick powder in the mechanical properties of recycled aggregate concrete. Sustainability 2018, 10, 1037. [Google Scholar] [CrossRef]
- Meng, T.; Wei, H.; Dai, D.; Liao, J.; Ahmed, S. Effect of brick aggregate on failure process of mixed recycled aggregate concrete via X-CT. Constr. Build. Mater. 2022, 327, 126934. [Google Scholar] [CrossRef]
- Xiao, J.; Zhang, H.; Zou, S.; Duan, Z.; Ma, Y. Developing recycled foamed concrete for engineered material arresting system. J. Build. Eng. 2022, 53, 104555. [Google Scholar] [CrossRef]
- He, Z.; Shen, A.; Wu, H.; Wang, W.; Wang, L.; Guo, Y. Properties and mechanisms of brick-concrete recycled aggregate strengthened by compound modification treatment. Constr. Build. Mater. 2022, 315, 125678. [Google Scholar] [CrossRef]
- Hu, K.; Chen, Y.; Naz, F.; Zeng, C.; Cao, S. Separation studies of concrete and brick from construction and demolition waste. Waste Manag. 2019, 85, 396–404. [Google Scholar] [CrossRef]
- Jayasuriya, A.; Adams, M.P.; Bandelt, M.J. Understanding variability in recycled aggregate concrete mechanical properties through numerical simulation and statistical evaluation. Constr. Build. Mater. 2018, 178, 301–312. [Google Scholar] [CrossRef]
- Otsuki, N.; Miyazato, S.; Yodsudjai, W. Influence of recycled aggregate on interfacial transition zone, strength, chloride penetration and carbonation of concrete. J. Mater. Civ. Eng. 2003, 15. [Google Scholar] [CrossRef]
- Xiao, J.; Li, W.; Corr, D.J.; Shah, S.P. Effects of interfacial transition zones on the stress–strain behavior of modeled recycled aggregate concrete. Cem. Concr. Res. 2013, 52, 82–99. [Google Scholar] [CrossRef]
- Liu, Q.; Xiao, J.; Sun, Z. Experimental study on the failure mechanism of recycled concrete. Cem. Concr. Res. 2011, 41, 1050–1057. [Google Scholar] [CrossRef]
- Debieb, F.; Kenai, S. The use of coarse and fine crushed bricks as aggregate in concrete. Constr. Build. Mater. 2006, 22, 886–893. [Google Scholar] [CrossRef]
- Jayasuriya, A.; Adams, M.P.; Bandelt, M.J. Generation and numerical analysis of random aggregate structures in recycled concrete aggregate systems. J. Mater. Civ. Eng. 2020, 32. [Google Scholar] [CrossRef]
- Kosmatka, S.; Kerkhoff, B.; Panarese, W. Design and Control of Concrete Mixtures, 14th ed.; Portland Cement Association: Skokie, IL, USA, 2011. [Google Scholar]
- Wang, Z.M.; Kwan, A.K.H.; Chan, H.C. Mesoscopic study of concrete I: generation of random aggregate structure and finite element mesh. Comput. Struct. 1999, 70, 533–544. [Google Scholar] [CrossRef]
- Ma, H.; Tu, Y.; Yu, H.; Diao, Y.; Han, W.; Zhang, M. Mechanical properties and microstructural characteristics of coral-aggregate-concrete ITZ: Experimental study. J. Build. Eng. 2023, 72, 106647. [Google Scholar] [CrossRef]
- Königsberger, M.; Pichler, B.L.A.; Hellmich, C. Micromechanics of ITZ-Aggregate Interaction in Concrete Part II: Strength Upscaling. J. Am. Ceram. Soc. 2014, 97, 543–551. [Google Scholar] [CrossRef]
- Ding, Y.; Wu, J.Y.; Xu, P.; Zhang, X.; Fan, Y. Treatment Methods for the Quality Improvement of Recycled Concrete Aggregate (RCA) - A Review. Journal of Wuhan University of Technology-Mater. Sci. Ed. 2021, 36, 77–92. [Google Scholar] [CrossRef]
- Poon, C.S.; Shui, Z.H.; Lam, L. Effect of microstructure of ITZ on compressive strength of concrete prepared with recycled aggregates. Constr. Build. Mater. 2004, 18, 461–468. [Google Scholar] [CrossRef]
- Xiao, J.; Li, W.; Sun, Z.; Lange, D.A.; Shah, S.P. Properties of interfacial transition zones in recycled aggregate concrete tested by nanoindentation. Cem. Concr. Compos. 2013, 37, 276–292. [Google Scholar] [CrossRef]
- Kim, S.-M.; Al-Rub, R.K.A. Meso-scale computational modeling of the plastic-damage response of cementitious composites. Cem. Concr. Res. 2011, 41, 339–358. [Google Scholar] [CrossRef]
- Tan, X.; Li, W.; Zhao, M.; Tam, V.W.Y. Numerical discrete-element method investigation on failure process of recycled aggregate concrete. J. Mater. Civ. Eng. 2019, 31. [Google Scholar] [CrossRef]
Figure 1.
Components of the coarse recycled aggregate after sieving and selection: (a) old concrete and (b) brick.
Figure 1.
Components of the coarse recycled aggregate after sieving and selection: (a) old concrete and (b) brick.
Figure 2.
Schematic of irregular polygonal aggregate generation, with random points Ai and central angles αi.
Figure 2.
Schematic of irregular polygonal aggregate generation, with random points Ai and central angles αi.
Figure 3.
Stochastic aggregate model with 96 irregular polygonal aggregates.
Figure 3.
Stochastic aggregate model with 96 irregular polygonal aggregates.
Figure 4.
Random aggregate models with interface layer zones (ITZs): (a) natural aggregate and ITZ1; (b) old gravel wrapped in old mortar with ITZ1 and ITZ2; (c) brick and ITZ1.
Figure 4.
Random aggregate models with interface layer zones (ITZs): (a) natural aggregate and ITZ1; (b) old gravel wrapped in old mortar with ITZ1 and ITZ2; (c) brick and ITZ1.
Figure 5.
Mesh generated for each phase material: (a) natural crushed stone, (b) old gravel, (c) brick, (d) ITZ2, (e) ITZ1, (f) old mortar, and (g) new mortar. .
Figure 5.
Mesh generated for each phase material: (a) natural crushed stone, (b) old gravel, (c) brick, (d) ITZ2, (e) ITZ1, (f) old mortar, and (g) new mortar. .
Figure 6.
Comparison of the (a) random aggregate model and (b) cut specimen cross section.
Figure 6.
Comparison of the (a) random aggregate model and (b) cut specimen cross section.
Figure 7.
Random aggregate models with brick contents of (a) 0, (b) 10, (c) 20, and (d) 30%.
Figure 7.
Random aggregate models with brick contents of (a) 0, (b) 10, (c) 20, and (d) 30%.
Figure 8.
Mesoscopic damage development in compressed RC specimens with brick contents of (a) 0, (b) 10, (c) 20, and (d) 30%.
Figure 8.
Mesoscopic damage development in compressed RC specimens with brick contents of (a) 0, (b) 10, (c) 20, and (d) 30%.
Figure 9.
Example of the comparison of the stress nephogram and standard failure mode of a physical specimen (10% brick content).
Figure 9.
Example of the comparison of the stress nephogram and standard failure mode of a physical specimen (10% brick content).
Figure 10.
Compressive stress nephograms for RC specimens with brick contents of (a) 0, (b) 10, (c) 20, and (d) 30%.
Figure 10.
Compressive stress nephograms for RC specimens with brick contents of (a) 0, (b) 10, (c) 20, and (d) 30%.
Figure 11.
Comparison of stress–strain (σ–ε) curves for simulated and physical specimens with brick contents of (a) 0, (b) 10, (c) 20, and (d) 30%, respectively.
Figure 11.
Comparison of stress–strain (σ–ε) curves for simulated and physical specimens with brick contents of (a) 0, (b) 10, (c) 20, and (d) 30%, respectively.
Table 1.
Coarse aggregate technical specifications.
Table 1.
Coarse aggregate technical specifications.
| Coarse Aggregate Type |
Water Absorption Rate (%) |
Apparent Density (kg·m-3) |
Crushing Index (%) |
| Natural crushed stone |
2.25 |
2.667 |
9.8 |
| Old concrete |
8.53 |
2.312 |
19.8 |
| Brick |
13.58 |
1.996 |
31.2 |
Table 2.
Recycled concrete (RC) mix proportions (kg·m-3).
Table 2.
Recycled concrete (RC) mix proportions (kg·m-3).
| Water Consumption |
Cement |
Fine Aggregate |
Natural Crushed Stone |
Old Concrete |
Brick |
Water Reducing Agent |
| 190 |
500 |
602 |
559 |
559 |
0 |
5 |
| 503.1 |
55.9 |
| 447.2 |
111.8 |
| 391.3 |
167.7 |
Table 3.
Ratios of coarse aggregates with different block contents to the specimen volumes.
Table 3.
Ratios of coarse aggregates with different block contents to the specimen volumes.
| Brick Content of Recycled Aggregate (%) |
Coarse Aggregate: Specimen Volume Ratio |
| 0 |
45.5 |
| 10 |
45.8 |
| 20 |
46.1 |
| 30 |
46.5 |
Table 4.
Plastic damage parameters (fb0/fc0: ratio of the initial equivalent biaxial compressive yield stress to the initial unit compressive yield stress; K: the ratio of the tensile meridian to the compressive-meridian constant stress).
Table 4.
Plastic damage parameters (fb0/fc0: ratio of the initial equivalent biaxial compressive yield stress to the initial unit compressive yield stress; K: the ratio of the tensile meridian to the compressive-meridian constant stress).
| Expansion Angle |
Eccentricity |
fb0/fc0
|
K |
Viscosity Coefficient |
| 30° |
0.1 |
1.16 |
0.6667 |
0.005 |
Table 5.
Material parameters of phases in the microscopic damage model.
Table 5.
Material parameters of phases in the microscopic damage model.
| Type |
Elastic Modulus
E (GPa) |
Poisson’s Ratio
μ
|
Compressive Strength
(MPa) |
Tensile Strength
(MPa) |
Density (kg·m-3) |
| New mortar |
35 |
0.22 |
45 |
2.5 |
2370 |
| Old mortar |
25 |
0.22 |
30 |
2 |
2370 |
| ITZ1 |
28 |
0.22 |
36 |
2 |
2370 |
| ITZ2 |
20 |
0.22 |
24 |
1.6 |
2370 |
| Natural aggregate |
80 |
0.16 |
– |
– |
2667 |
| Old gravel |
50 |
0.16 |
– |
– |
2667 |
| Brick |
13 |
0.20 |
– |
– |
1996 |
|
Disclaimer/Publisher’s Note: The statements, opinions and data contained in all publications are solely those of the individual author(s) and contributor(s) and not of MDPI and/or the editor(s). MDPI and/or the editor(s) disclaim responsibility for any injury to people or property resulting from any ideas, methods, instructions or products referred to in the content. |
© 2023 by the authors. Licensee MDPI, Basel, Switzerland. This article is an open access article distributed under the terms and conditions of the Creative Commons Attribution (CC BY) license (http://creativecommons.org/licenses/by/4.0/).
