Submitted:
31 July 2023
Posted:
02 August 2023
You are already at the latest version
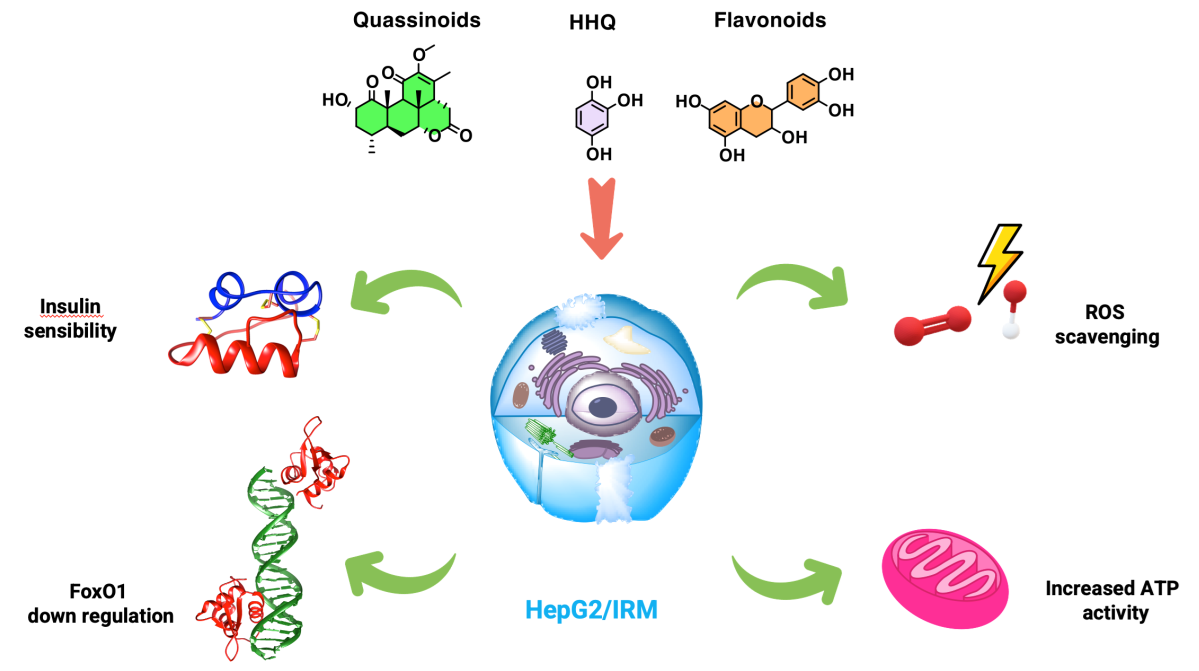
Abstract
Keywords:
1. Introduction
2. Materials and Methods
2.1. Synthesis of Hydroxyhydroquinone (HHQ) (Scheme 1)

2.2. Vegetable material
2.2.1. Extracts of P. crenata
2.2.2. Chromatographic assay of P. crenata
2.2.3. Extracts of R. cuspidata
2.3. Cell culture and cytotoxic assay
2.4. Insulin resistance model (HepG2/IRM) and glucose uptake
2.5. Mitochondria Membrane Potential (MMP) Assay and ROS activity
2.6. Adenosine triphosphate (ATP) activity
2.7. FOX01 expression through Western Blot and Indirect Immunofluorescence Assay
2.8. Statistical Analysis
3. Results and Discussion
3.1. Synthesis of Hydroxyhydroquinone
3.2. P. crenata extract characterization
3.3. R. cuspidata extract characterization
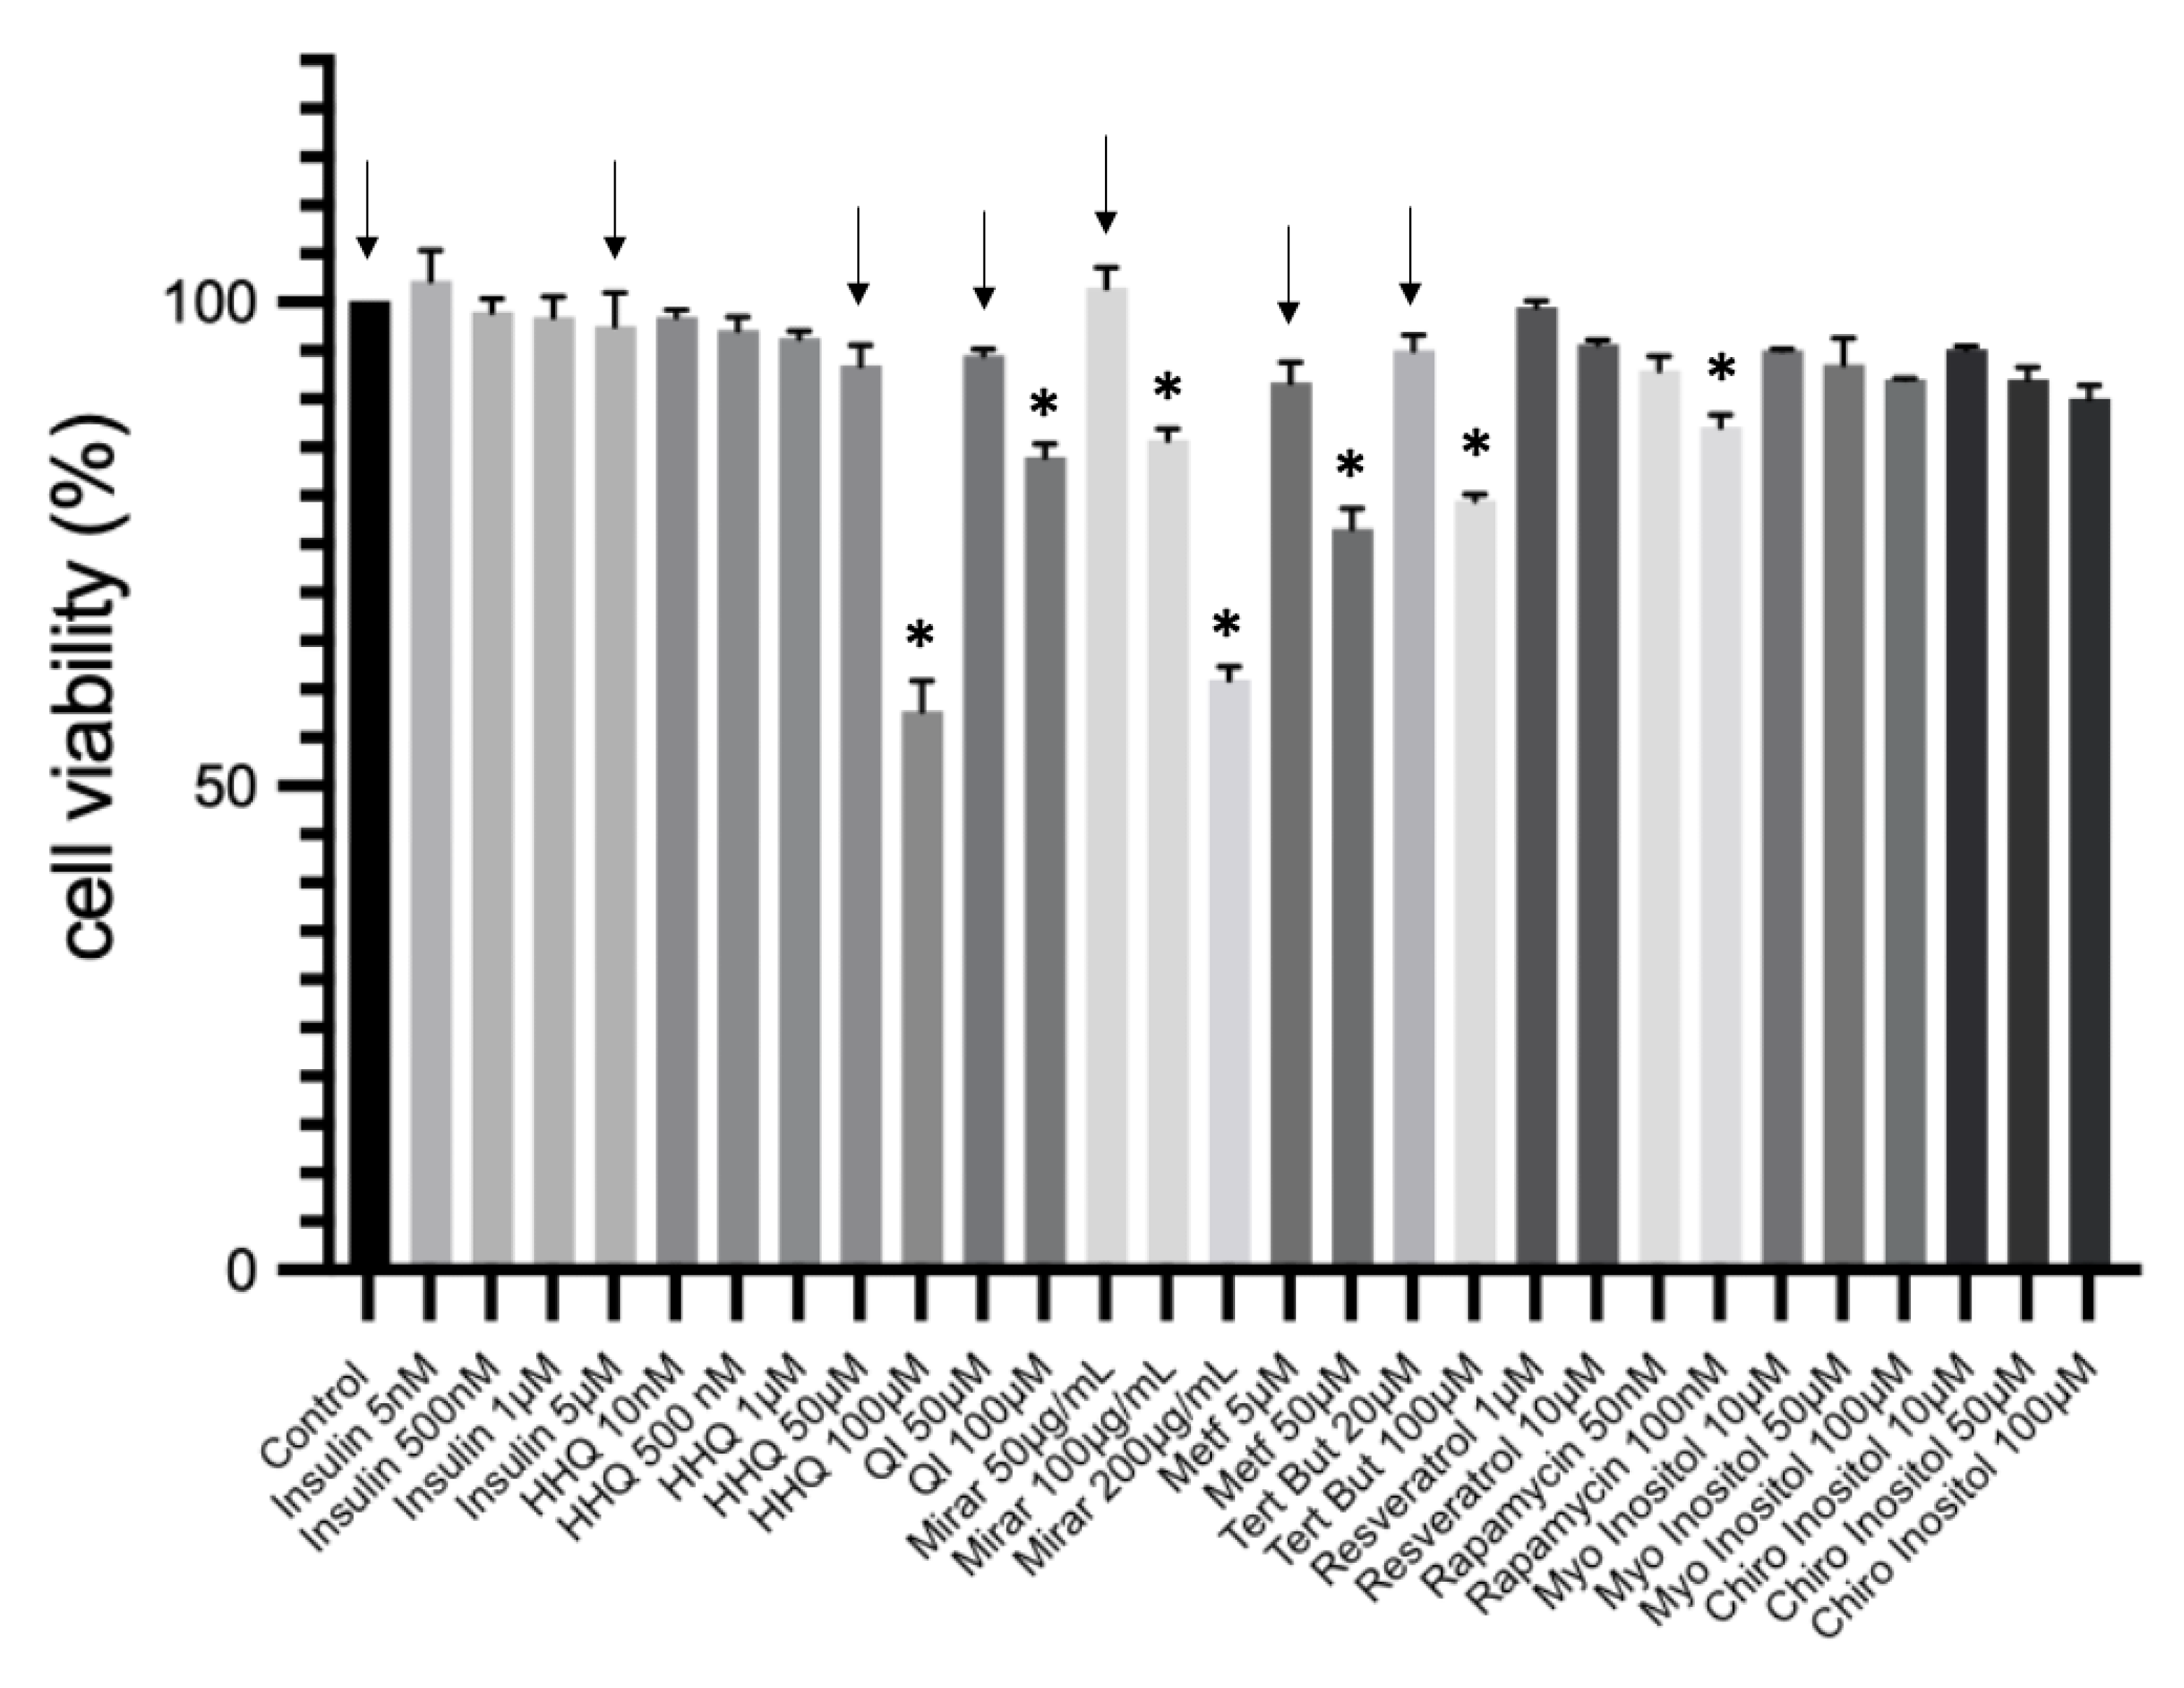
3.4. Cell culture and cytotoxic assay
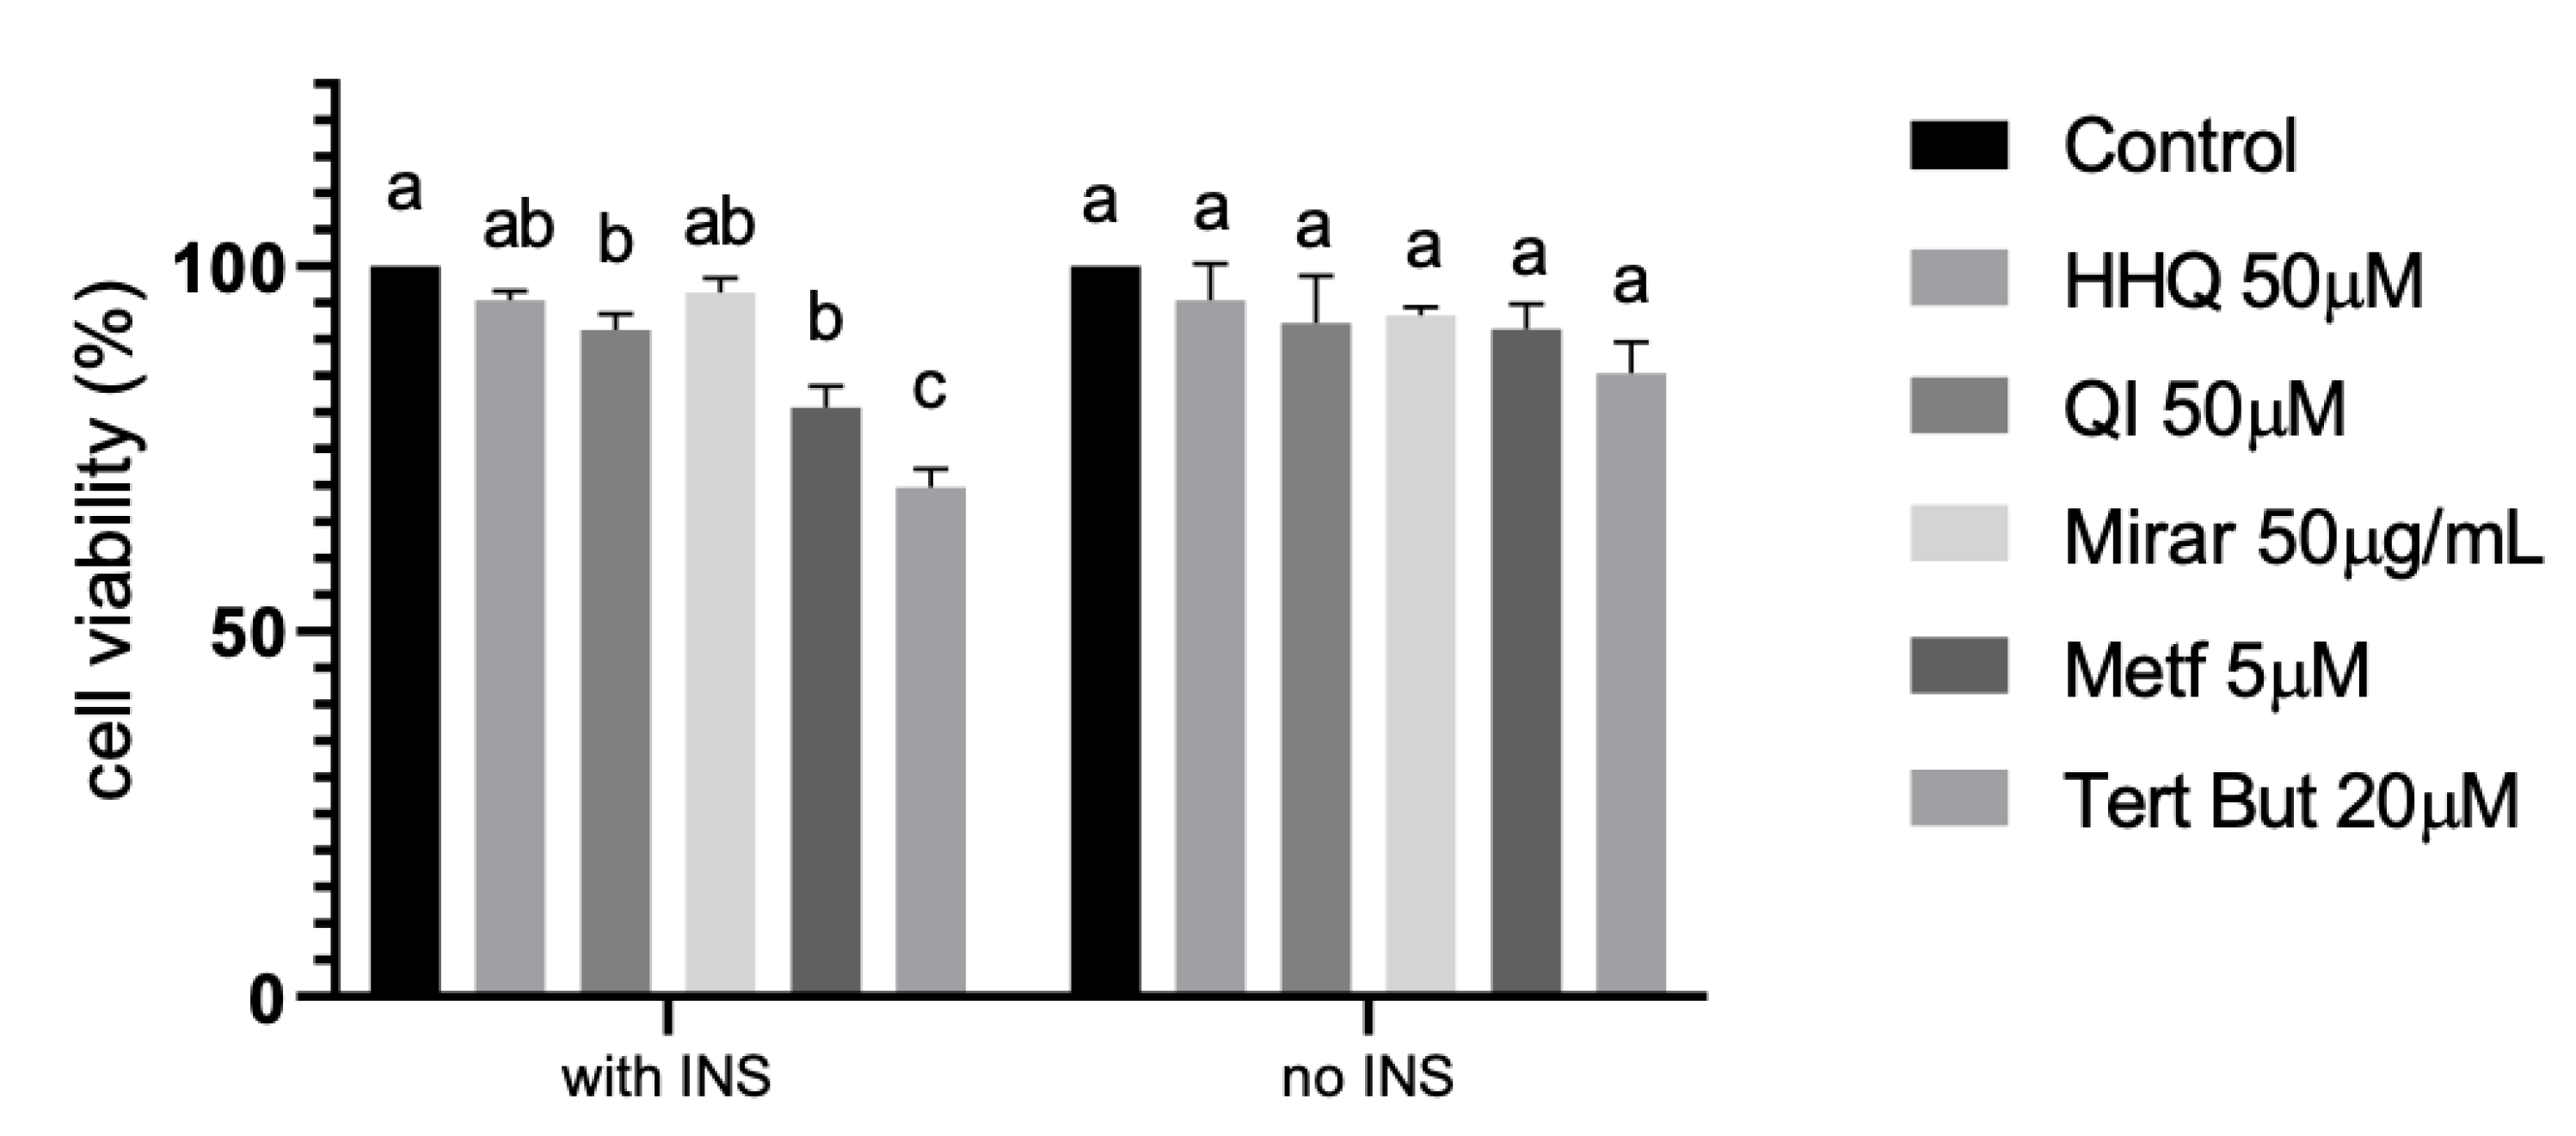
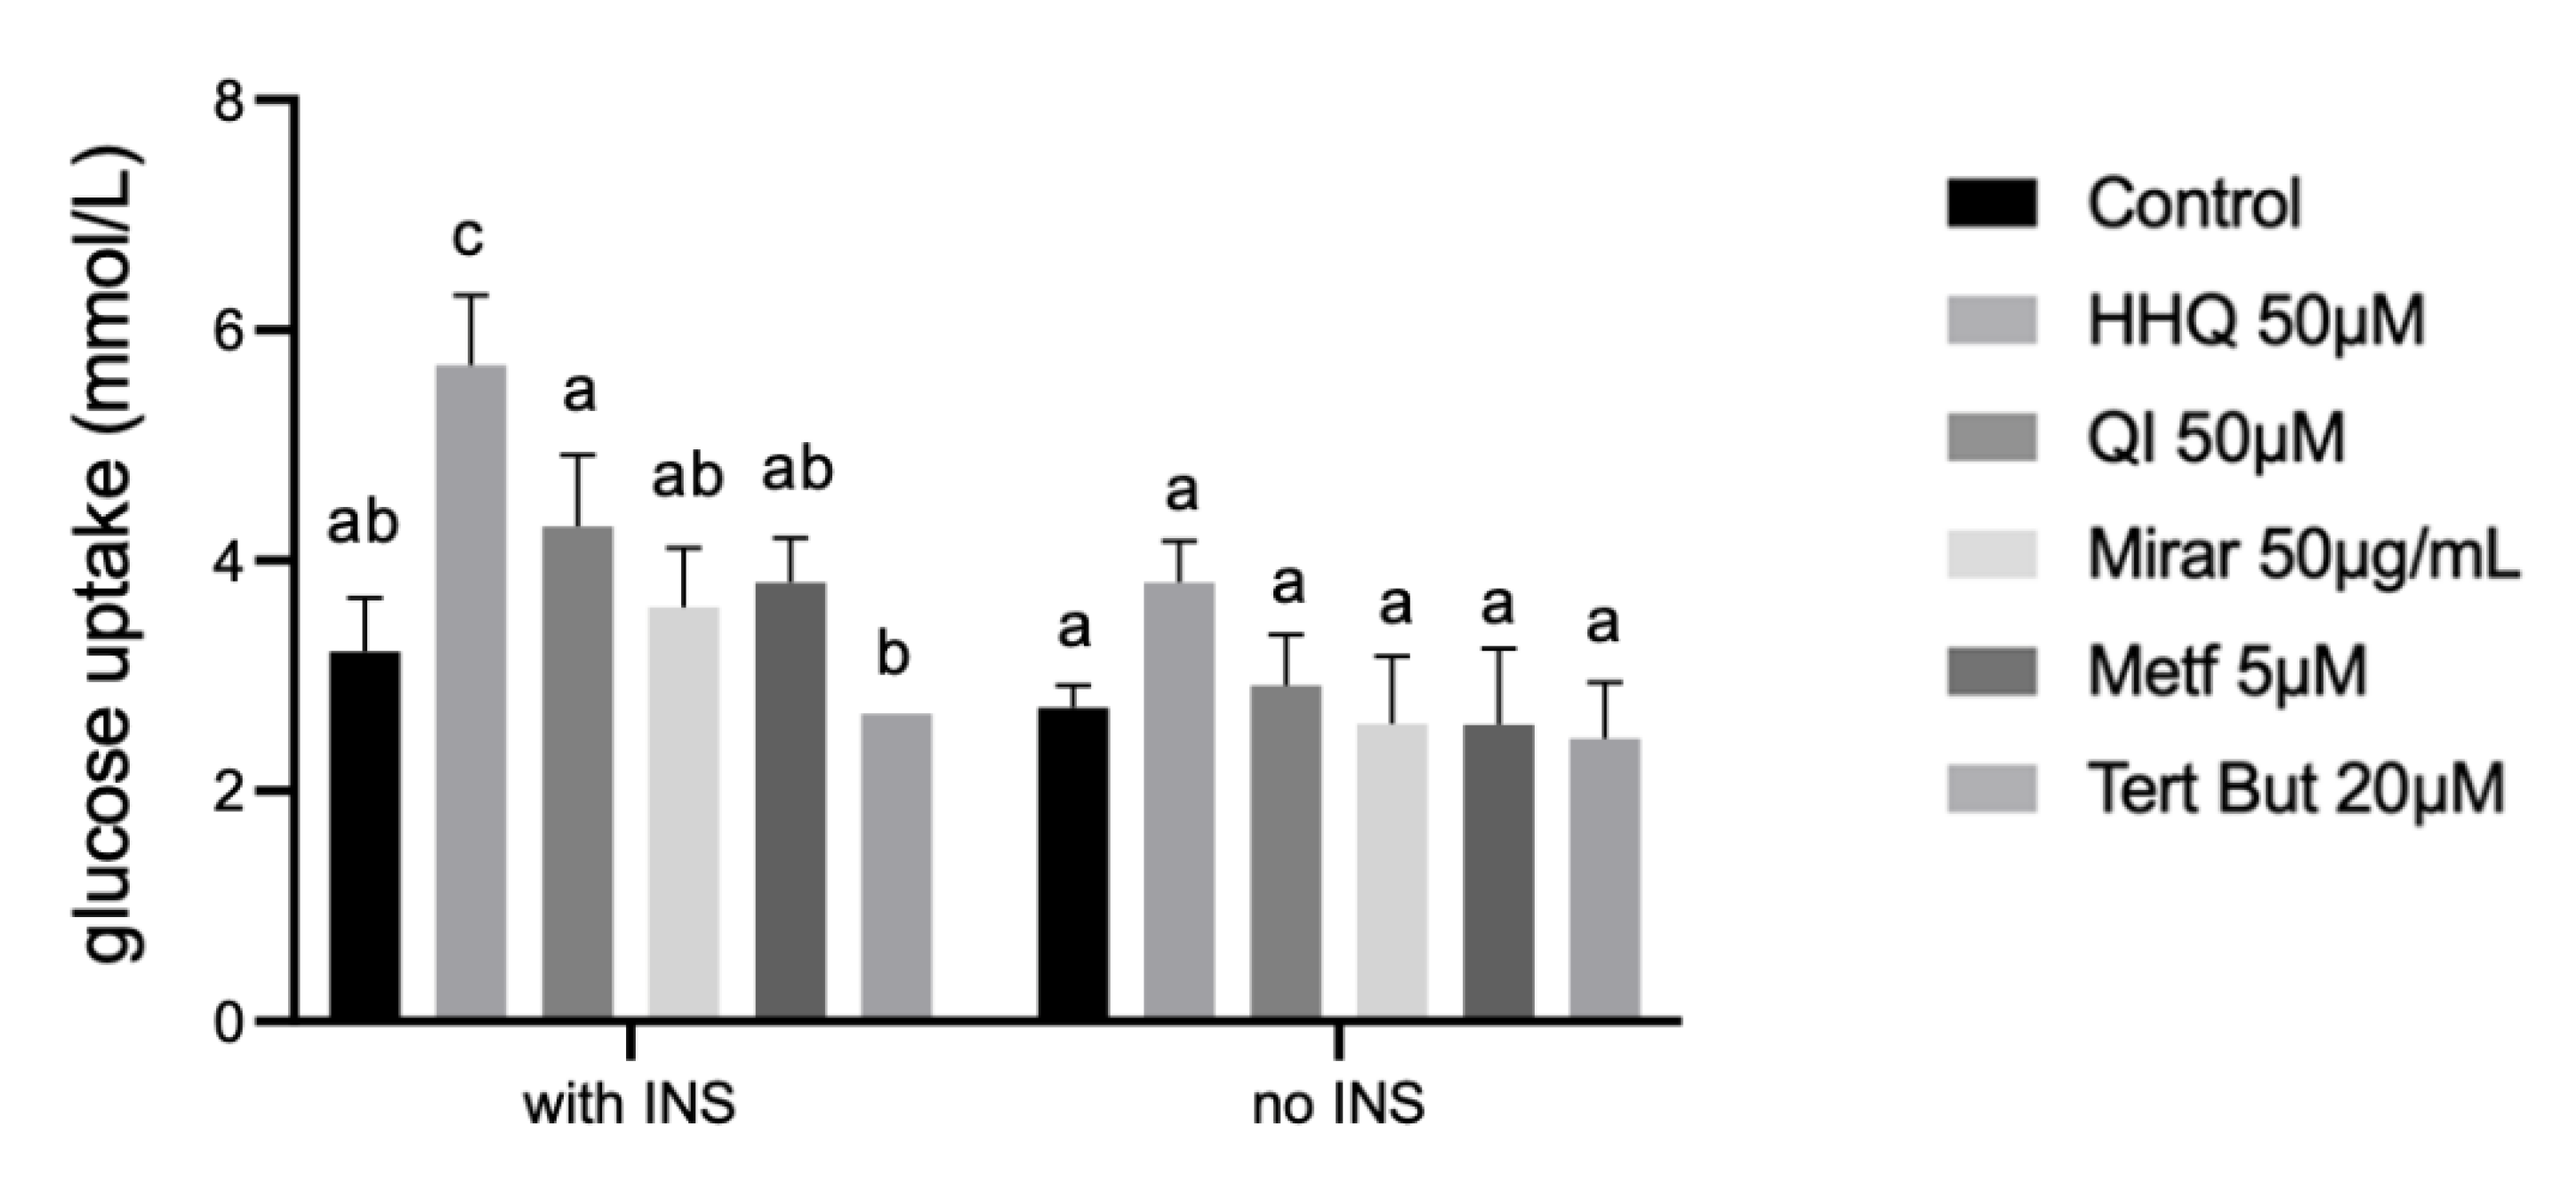
3.5. Insulin resistance model (HepG2/IRM) and glucose uptake
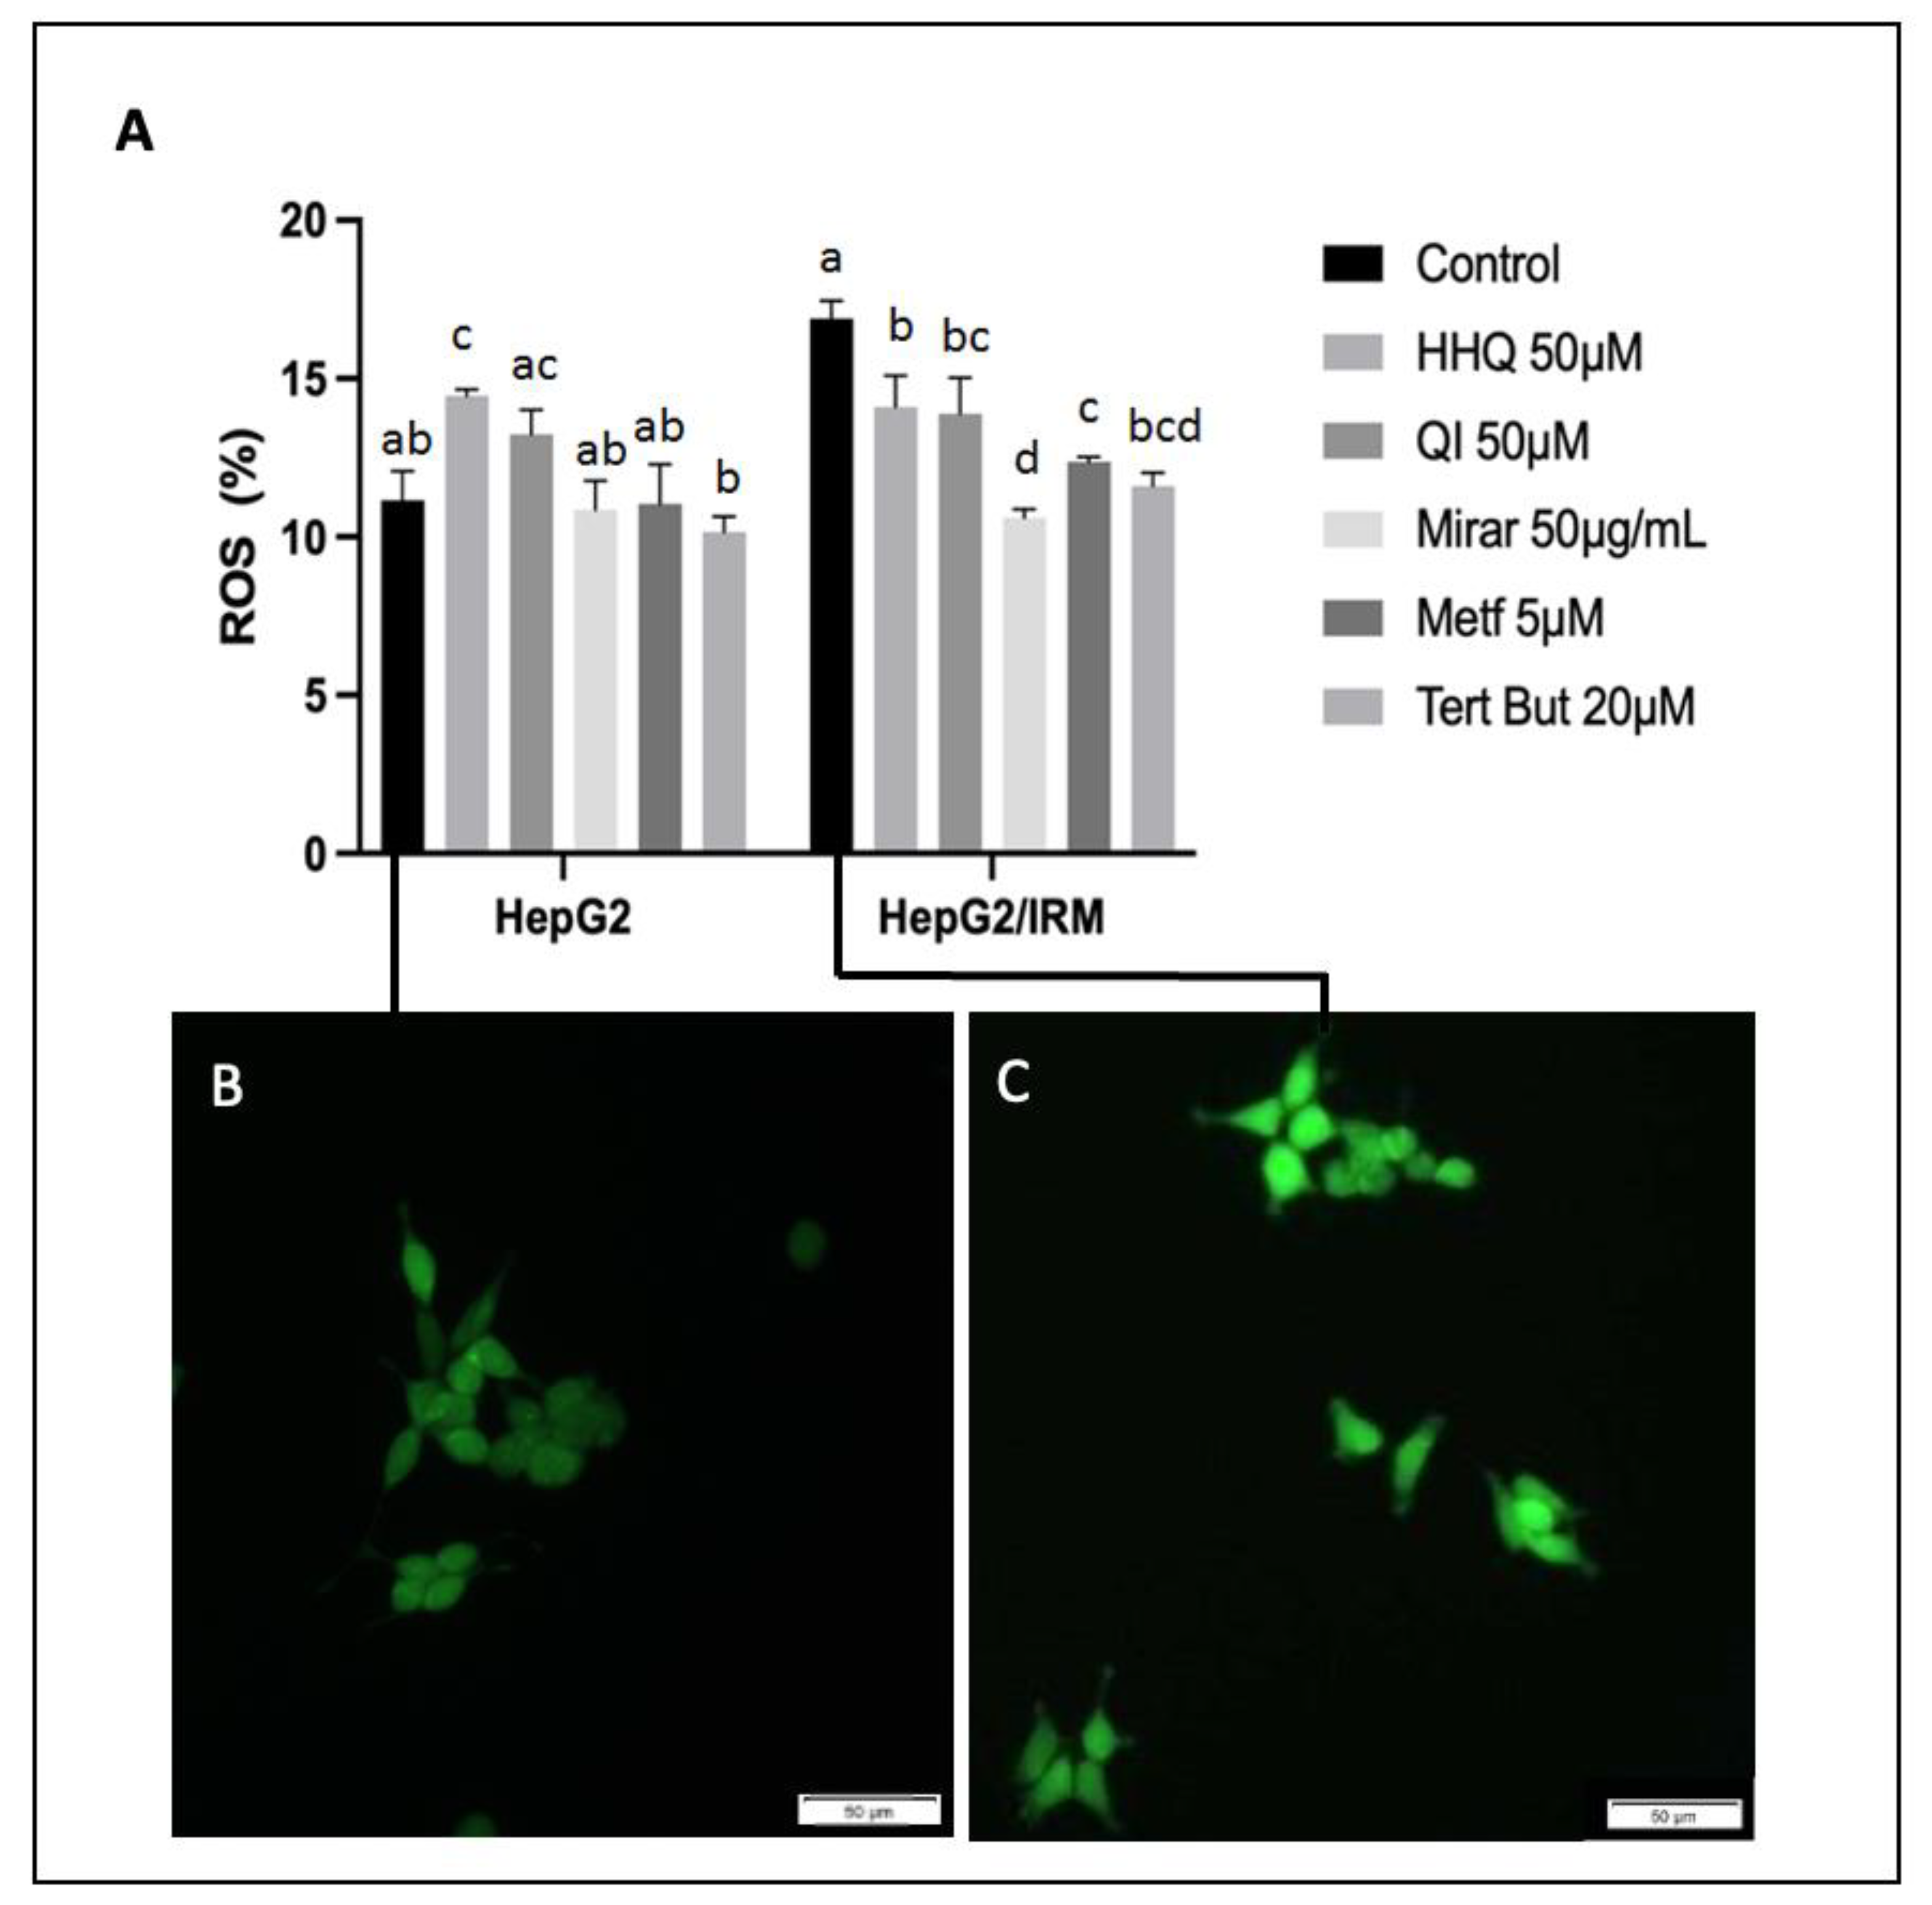
3.6. ROS activity, Mitochondria Membrane Potential Assay and ATP balance
3.7. FOX01 expression through Western Blot and Indirect Immunofluorescence Assay
4. Conclusions
Supplementary Materials
Author Contributions
Funding
Conflicts of Interest
References
- Magnani, N.D.; Marchini, T.; Calabró, V.; Alvarez, S.; Evelson, P. Role of Mitochondria in the Redox Signaling Network and Its Outcomes in High Impact Inflammatory Syndromes. Front Endocrinol (Lausanne). 2020, 11, 568305. [Google Scholar] [CrossRef] [PubMed]
- Holmström, K.; Finkel, T. Cellular mechanisms and physiological consequences of redox-dependent signalling. Nat Rev Mol Cell Biol. 2014, 15, 411–421. [Google Scholar] [CrossRef] [PubMed]
- Cervantes, G.K.; Llanas-Cornejo, D.; Husi, H. CVD and Oxidative Stress. J Clin Med. 2017, 6, 22. [Google Scholar] [CrossRef]
- Daiber, A.; Di Lisa, F.; Oelze, M.; Kröller-Schön, S.; Steven, S.; Schulz, E.; Münzel, T. Crosstalk of mitochondria with NADPH oxidase via reactive oxygen and nitrogen species signalling and its role for vascular function. Br J Pharmacol. 2017, 174, 1670–1689. [Google Scholar] [CrossRef]
- Kim, J.A.; Wei, Y.; Sowers, J.R. Role of mitochondrial dysfunction in insulin resistance. Circ Res. 2008, 102, 401–14. [Google Scholar] [CrossRef]
- Sivitz, W.I.; Yorek, M.A. Mitochondrial dysfunction in diabetes: from molecular mechanisms to functional significance and therapeutic opportunities. Antioxid Redox Signal. 2010, 12, 537–77. [Google Scholar] [CrossRef] [PubMed]
- Teng, W.; Yin, W.; Zhao, L.; Ma, C.; Huang, J.; Ren, F. Resveratrol metabolites ameliorate insulin resistance in HepG2 hepatocytes by modulating IRS-1/AMPK. RSC Adv. 2018, 8, 36034–36042. [Google Scholar] [CrossRef]
- Hussain, T.; Tan, B.; Murtaza, G.; Liu, G.; Rahu, N.; Kalhoro, M.S.; Kalhoro, D.H.; Adebowale, T.O.; Mazhar, M.U.; Rehman, Z.U.; et al. Flavonoids and type 2 diabetes: Evidence of efficacy in clinical and animal studies and delivery strategies to enhance their therapeutic efficacy. Pharmacol Res. 2020, 152, 104629. [Google Scholar] [CrossRef]
- Kargl, C.; Arshad, M.; Salman, F.; Schurman, R.C.; Del Corral, P. 11β-hydroxysteroid dehydrogenase type-II activity is affected by grapefruit juice and intense muscular work. Arch Endocrinol Metab. 2017, 61/6, 556–561. [Google Scholar] [CrossRef]
- Laikowski, M.M.; Santos, P.R.; Souza, D.M.; Minetto, L.; Girondi, N.; Pires, C.; Alano, G.; Roesch-Ely, M.; Tasso, L.; Moura, S. Rourea cuspidata: Chemical composition and hypoglycemic activity. Asian Pac J Trop Biomed. 2017, 7, 712–718. [Google Scholar] [CrossRef]
- Mauro, A.L.Q.S. Study of the hypoglicemic activity of the tea of the wood of Quassia-do-Brasil, Picrasma crenata (Vell. ) Engl. in mice and rats. Vig Sanit Debate. 2015, 3, 116–122. [Google Scholar]
- 12-O-Sullivan, I.; Zhang, W.; Wasserman, D.; Liew, C.W.; Liu, J.; Paik, J.; DePinho, R.A.; Stolz, D.B.; Kahn, C.R.; Schwartz, M.W.; et al. FoxO1 integrates direct and indirect effects of insulin on hepatic glucose production and glucose utilization. Nat Commun. 2015, 6, 7079. [Google Scholar] [CrossRef]
- Zhang, H.; Ge, Z.; Tang, S.; Meng, R.; Bi, Y.; Zhu, D. Erythropoietin ameliorates PA-induced insulin resistance through the IRS/AKT/FOXO1 and GSK-3β signaling pathway, and inhibits the inflammatory response in HepG2 cells. Mol Med Rep. 2017, 16, 2295–2301. [Google Scholar] [CrossRef]
- Humbarger, Scott Thomas, and Millard, Matthew. 2018.United States Patent. US Patent 10,065,977 B2. Sep 4.
- Cardoso, M.L.C.; Kamei, M.S.; Nunes, R.F.; Lazeri, N.S.; Neto, J.R.S.; Novello, C.R.; Bruschi, M.L. Development and Validation of an HPLC Method for Analysis of Picrasma crenata. Journal of Liquid Chromatography & Related Technologies. 2008, 1, 32–72. [Google Scholar] [CrossRef]
- Kheirollahzadeh, F.; Eftekhari, E.; Ghollasi, M.; Behzadi, P. Anti-hyperglycemic effects of Eryngium billardierei F. Delaroche extract on insulin-resistance HepG2 cells in vitro. Mol Bio Rep. 2022, 49, 3401–3411. [Google Scholar] [CrossRef] [PubMed]
- Frozza, C.O.D.S.; Santos, D.A.; Rufatto, L.C.; Minetto, L.; Scariot, F.J.; Echeverrigaray, S.; Pich, C.T.; Moura, S.; Padilha, F.F.; Borsuk, S.; et al. Antitumor activity of Brazilian red propolis fractions against Hep-2 cancer cell line. Biomed Pharmacother. 2017, 91, 951–963. [Google Scholar] [CrossRef]
- Zhao, S.; Kanno, Y.; Li, W.; Sasaki, T.; Zhang, X.; Wang, J.; Cheng, M.; Koike, K.; Nemoto, K.; Li, H. Identification of Picrasidine C as a Subtype-Selective PPARα Agonist. J Nat Prod. 2016, 79, 3127–3133. [Google Scholar] [CrossRef]
- Paim, L.F.N.A.; Santos, P.R.; Toledo, C.A.P.; Minello, L.; Paz, J.R.L.; Souza, V.C.; Salvador, M.; Moura, S. Four almost unexplored species of Brazilian Connarus (Connaraceae): Chemical composition by ESI-QTof-MS/MS-GNPS and a pharmacologic potential. Phytochem Anal. 2022, 33, 286–302. [Google Scholar] [CrossRef] [PubMed]
- Yudhani, R.D.; Sari, Y.; Nugrahaningsih, D.A.A.; Sholikhah, E.N.; Rochmanti, M.; Purba, A.K.R.; Khotimah, H.; Nugrahenny, D.; Mustofa, M. In Vitro Insulin Resistance Model: A Recent Update. Journal of Obesity. 2023, 1–13. [Google Scholar] [CrossRef] [PubMed]
- Azimian, L.; Weerasuriya, N.M.; Munasinghe, R.; Song, S.; Lin, C.Y.; You, L. Investigating the effects of Ceylon cinnamon water extract on HepG2 cells for Type 2 diabetes therapy. Cell Biochem Funct. 2023, 41, 254–267. [Google Scholar] [CrossRef]
- Zhu, X.; Yan, H.; Xia, M.; Chang, X.; Xu, X.; Wang, L.; Sun, X.; Lu, Y.; Bian, H.; Li, X.; et al. Metformin attenuates triglyceride accumulation in HepG2 cells through decreasing stearyl-coenzyme A desaturase 1 expression. Lipids in Health and Disease. 2018, 17, 114. [Google Scholar] [CrossRef] [PubMed]
- Jiang, H.; Ma, Y.; Yan, J.; Liu, J.; Li, L. Geniposide promotes autophagy to inhibit insulin resistance in HepG2 cells via P62/NF-κB/GLUT-4. Molecular Medicine Reports. 2017, 16, 7237–7244. [Google Scholar] [CrossRef] [PubMed]
- Fan, C.; Liang, W.; Wei, M.; Gou, X.; Han, S.; Bai, J. Effects of D-Chiro-Inositol on Glucose Metabolism in db/db Mice and the Associated Underlying Mechanisms. Frontiers in Pharmacology. 2020, 11, 354. [Google Scholar] [CrossRef] [PubMed]
- Zhu, Y.X.; Hu, H.Q.; Zuo, M.L.; Mao, L.; Song, G.L.; Li, T.M.; Dong, L.C.; Yang, Z.B.; Ali Sheikh, M.S. Effect of oxymatrine on liver gluconeogenesis is associated with the regulation of PEPCK and G6Pase expression and AKT phosphorylation. Biomed Rep. 2021, 1, 56. [Google Scholar] [CrossRef] [PubMed]
- Giri, B.; Dey, S.; Das, T.; Sarkar, M.; Banerjee, J.; Dash, S.K. Chronic hyperglycemia mediated physiological alteration and metabolic distortion leads to organ dysfunction, infection, cancer progression and other pathophysiological consequences: An update on glucose toxicity. Biomed Pharmacother. 2018, 107, 306–328. [Google Scholar] [CrossRef] [PubMed]
- Tsai, T.H.; Yu, C.H.; Chang, Y.P.; Lin, Y.T.; Huang, C.J.; Kuo, Y.H.; Tsai, P.J. Protective Effect of Caffeic Acid Derivatives on tert-Butyl Hydroperoxide-Induced Oxidative Hepato-Toxicity and Mitochondrial Dysfunction in HepG2 Cells. Molecules. 2017, 22, 702. [Google Scholar] [CrossRef]
- Park, C.L.; Kim, J.H.; Jeon, J.S.; Lee, J.H.; Zhang, K.; Guo, S.; Lee, D.H.; Gao, E.M.; Son, R.H.; Kim, Y.M.; et al. Protective Effect of Alpinia oxyphylla Fruit against tert-Butyl Hydroperoxide-Induced Toxicity in HepG2 Cells via Nrf2 Activation and Free Radical Scavenging and Its Active Molecules. Antioxidants (Basel). 2022, 11, 1032. [Google Scholar] [CrossRef]
- Hurrle, S.; Hsu, W.H. The etiology of oxidative stress in insulin resistance. Biomed Journal. 2017, 40, 257–262. [Google Scholar] [CrossRef]
- Almeida, C.; Monteiro, C.; Silvestre, S. Inhibitors of 11β-Hydroxysteroid Dehydrogenase Type 1 as Potential Drugs for Type 2 Diabetes Mellitus—A Systematic Review of Clinical and In Vivo Preclinical Studies. Sci. Pharm. 2021, 89, 5. [Google Scholar] [CrossRef]
- Korac, B.; Kalezic, A.; Pekovic-Vaughan, V.; Korac, A.; Jankovic, A. Redox changes in obesity, metabolic syndrome, and diabetes. Redox Biol. 2021, 42, 101887. [Google Scholar] [CrossRef]
- Szendroedi, J.; Phielix, E.; Roden, M. The role of mitochondria in insulin resistance and type 2 diabetes mellitus. Nat Rev Endocrinol. 2011, 8, 92–103. [Google Scholar] [CrossRef] [PubMed]
- Rovira-Llopis, S.; Bañuls, C.; Diaz-Morales, N.; Hernandez-Mijares, A.; Rocha, M.; Victor, V.M. Mitochondrial dynamics in type 2 diabetes: Pathophysiological implications. Redox Biol. 2017, 11, 637–645. [Google Scholar] [CrossRef] [PubMed]
- Elefantova, K.; Lakatos, B.; Kubickova, J.; Sulova, Z.; Breier, A. Detection of the Mitochondrial Membrane Potential by the Cationic Dye JC-1 in L1210 Cells with Massive Overexpression of the Plasma Membrane ABCB1Drug Transporter. Int J Mol Sci. 2018, 19, 1985. [Google Scholar] [CrossRef]
- Zang, M.; Zuccollo, A.; Hou, X.; Nagata, D.; Walsh, K.; Herscovitz, H.; PBrecher, P.; Ruderman, N.B.; Cohen, R.A. AMP-activated Protein Kinase Is Required for the Lipid-lowering Effect of Metformin in Insulin-resistant Human HepG2 Cells. The J Biol Chem. 2004, 279, 47898–47905. [Google Scholar] [CrossRef] [PubMed]
- Dykens, J.A.; Jamieson, J.; Marroquin, L.; Nadanaciva, S.; Billis, P.A.; Will, Y. Biguanide-induced mitochondrial dysfunction yields increased lactate production and cytotoxicity of aerobically-poised HepG2 cells and human hepatocytes in vitro. Toxicol Appl Pharmacol. 2008, 233, 203–210. [Google Scholar] [CrossRef]
- Bielka, W.; Przezak, A. The role of FOXO transcription factors in the development of type 2 diabetes and related potential therapeutic possibilities. Clinical Diabetology. 2021, 10, 290–298. [Google Scholar] [CrossRef]
- Zhang, W.; Patil, S.; Chauhan, B.; Guo, S.; Powell, D.R.; Le, J.; Klotsas, A.; Matika, R.; Xiao, X.; Franks, R.; et al. FoxO1 regulates multiple metabolic pathways in the liver: effects on gluconeogenic, glycolytic, and lipogenic gene expression. J Biol Chem. 2006, 281, 10105–17. [Google Scholar] [CrossRef]
- Zhang, K.; Li, L.; Qi, Y.; Zhu, X.; Gan, B.; DePinho, R.A.; Averitt, T.; Guo, S. Hepatic suppression of Foxo1 and Foxo3 causes hypoglycemia and hyperlipidemia in mice. Endocrinology. 2012, 153, 631–46. [Google Scholar] [CrossRef]
- Puigserver, P.; Rhee, J.; Donovan, J.; Walkey, C.J.; Yoon, J.C.; Oriente, F.; Kitamura, Y.; Altomonte, J.; Dong, H.; Accili, D.; et al. Insulin-regulated hepatic gluconeogenesis through FOXO1–PGC-1α interaction. Nature. 2003, 423, 550–555. [Google Scholar] [CrossRef]
- Brunet, A.; Bonni, A.; Zigmond, M.J.; Lin, M.Z.; Juo, P.; Hu, L.S.; Anderson, M.J.; Arden, K.C.; Blenis, J.; Greenberg, M.E. Akt promotes cell survival by phosphorylating and inhibiting a Forkhead transcription factor. Cell. 1999, 96, 857–68. [Google Scholar] [CrossRef]
- Dou, Z.; Liu, C.; Feng, X.; Xie, Y.; Yue, H.; Dong, J.; Zhao, Z.; Chen, G.; Yang, J. Camel whey protein (CWP) ameliorates liver injury in type 2 diabetes mellitus rats and insulin resistance (IR) in HepG2 cells via activation of the PI3K/Akt signaling pathway. Food Funct. 2022, 13, 255–269. [Google Scholar] [CrossRef] [PubMed]
- Zhang, Y.; Yan, L.S.; Ding, Y.; Cheng, B.C.Y.; Luo, G.; Kong, J.; Liu, T.H.; Zhang, S.F. Edgeworthia gardneri (Wall.) Meisn. Water Extract Ameliorates Palmitate Induced Insulin Resistance by Regulating IRS1/GSK3β/FoxO1 Signaling Pathway in Human HepG2 Hepatocytes. Front. Pharmacol. 2020, 10, 1666. [Google Scholar] [CrossRef] [PubMed]
- Chen, L.; Sun, X.; Xiao, H.; Xu, F.; Yang, Y.; Lin, Z.; Chen, Z.; Quan, S.; Huang, H. PAQR3 regulates phosphorylation of FoxO1 in insulin-resistant HepG2 cells via NF-κB signaling pathway. Exp Cell Res. 2019, 381, 301–310. [Google Scholar] [CrossRef] [PubMed]
- Rong Guo, X.; Li Wang, X.; Chen, Y.; Hong Yuan, Y.; Mei Chen, Y.; Ding, Y.; Fang, J.; Jiao Bian, L.; Sheng Li, D. ANGPTL8/betatrophin alleviates insulin resistance via the Akt-GSK3β or Akt-FoxO1 pathway in HepG2 cells. Exp Cell Res. 2016, 345, 158–67. [Google Scholar] [CrossRef] [PubMed]
- Dong, X.C.; Copps, K.D.; Guo, S.; Li, Y.; Kollipara, R.; DePinho, R.A.; White, M.F. Inactivation of hepatic Foxo1 by insulin signaling is required for adaptive nutrient homeostasis and endocrine growth regulation. Cell Metab. 2008, 8, 65–76. [Google Scholar] [CrossRef]
- Lu, M.; Wan, M.; Leavens, K.F.; Chu, Q.; Monks, B.R.; Fernandez, S.; Ahima, R.S.; Ueki, K.; Kahn, C.R.; Birnbaum, M.J. Insulin regulates liver metabolism in vivo in the absence of hepatic Akt and Foxo1. Nat Med. 2012, 18, 388–95. [Google Scholar] [CrossRef]
- Cheng, Z.; White, M.F. The AKTion in non-canonical insulin signaling. Nat Med. 2012, 18, 351–353. [Google Scholar] [CrossRef]
- Liu, Y.Z.; Peng, W.; Chen, J.K.; Su, W.J.; Yan, W.J.; Wang, Y.X.; Jiang, C.L. FoxO1 is a critical regulator of hepatocyte lipid deposition in chronic stress mice. PeerJ. 2019, 7, 7668. [Google Scholar] [CrossRef]
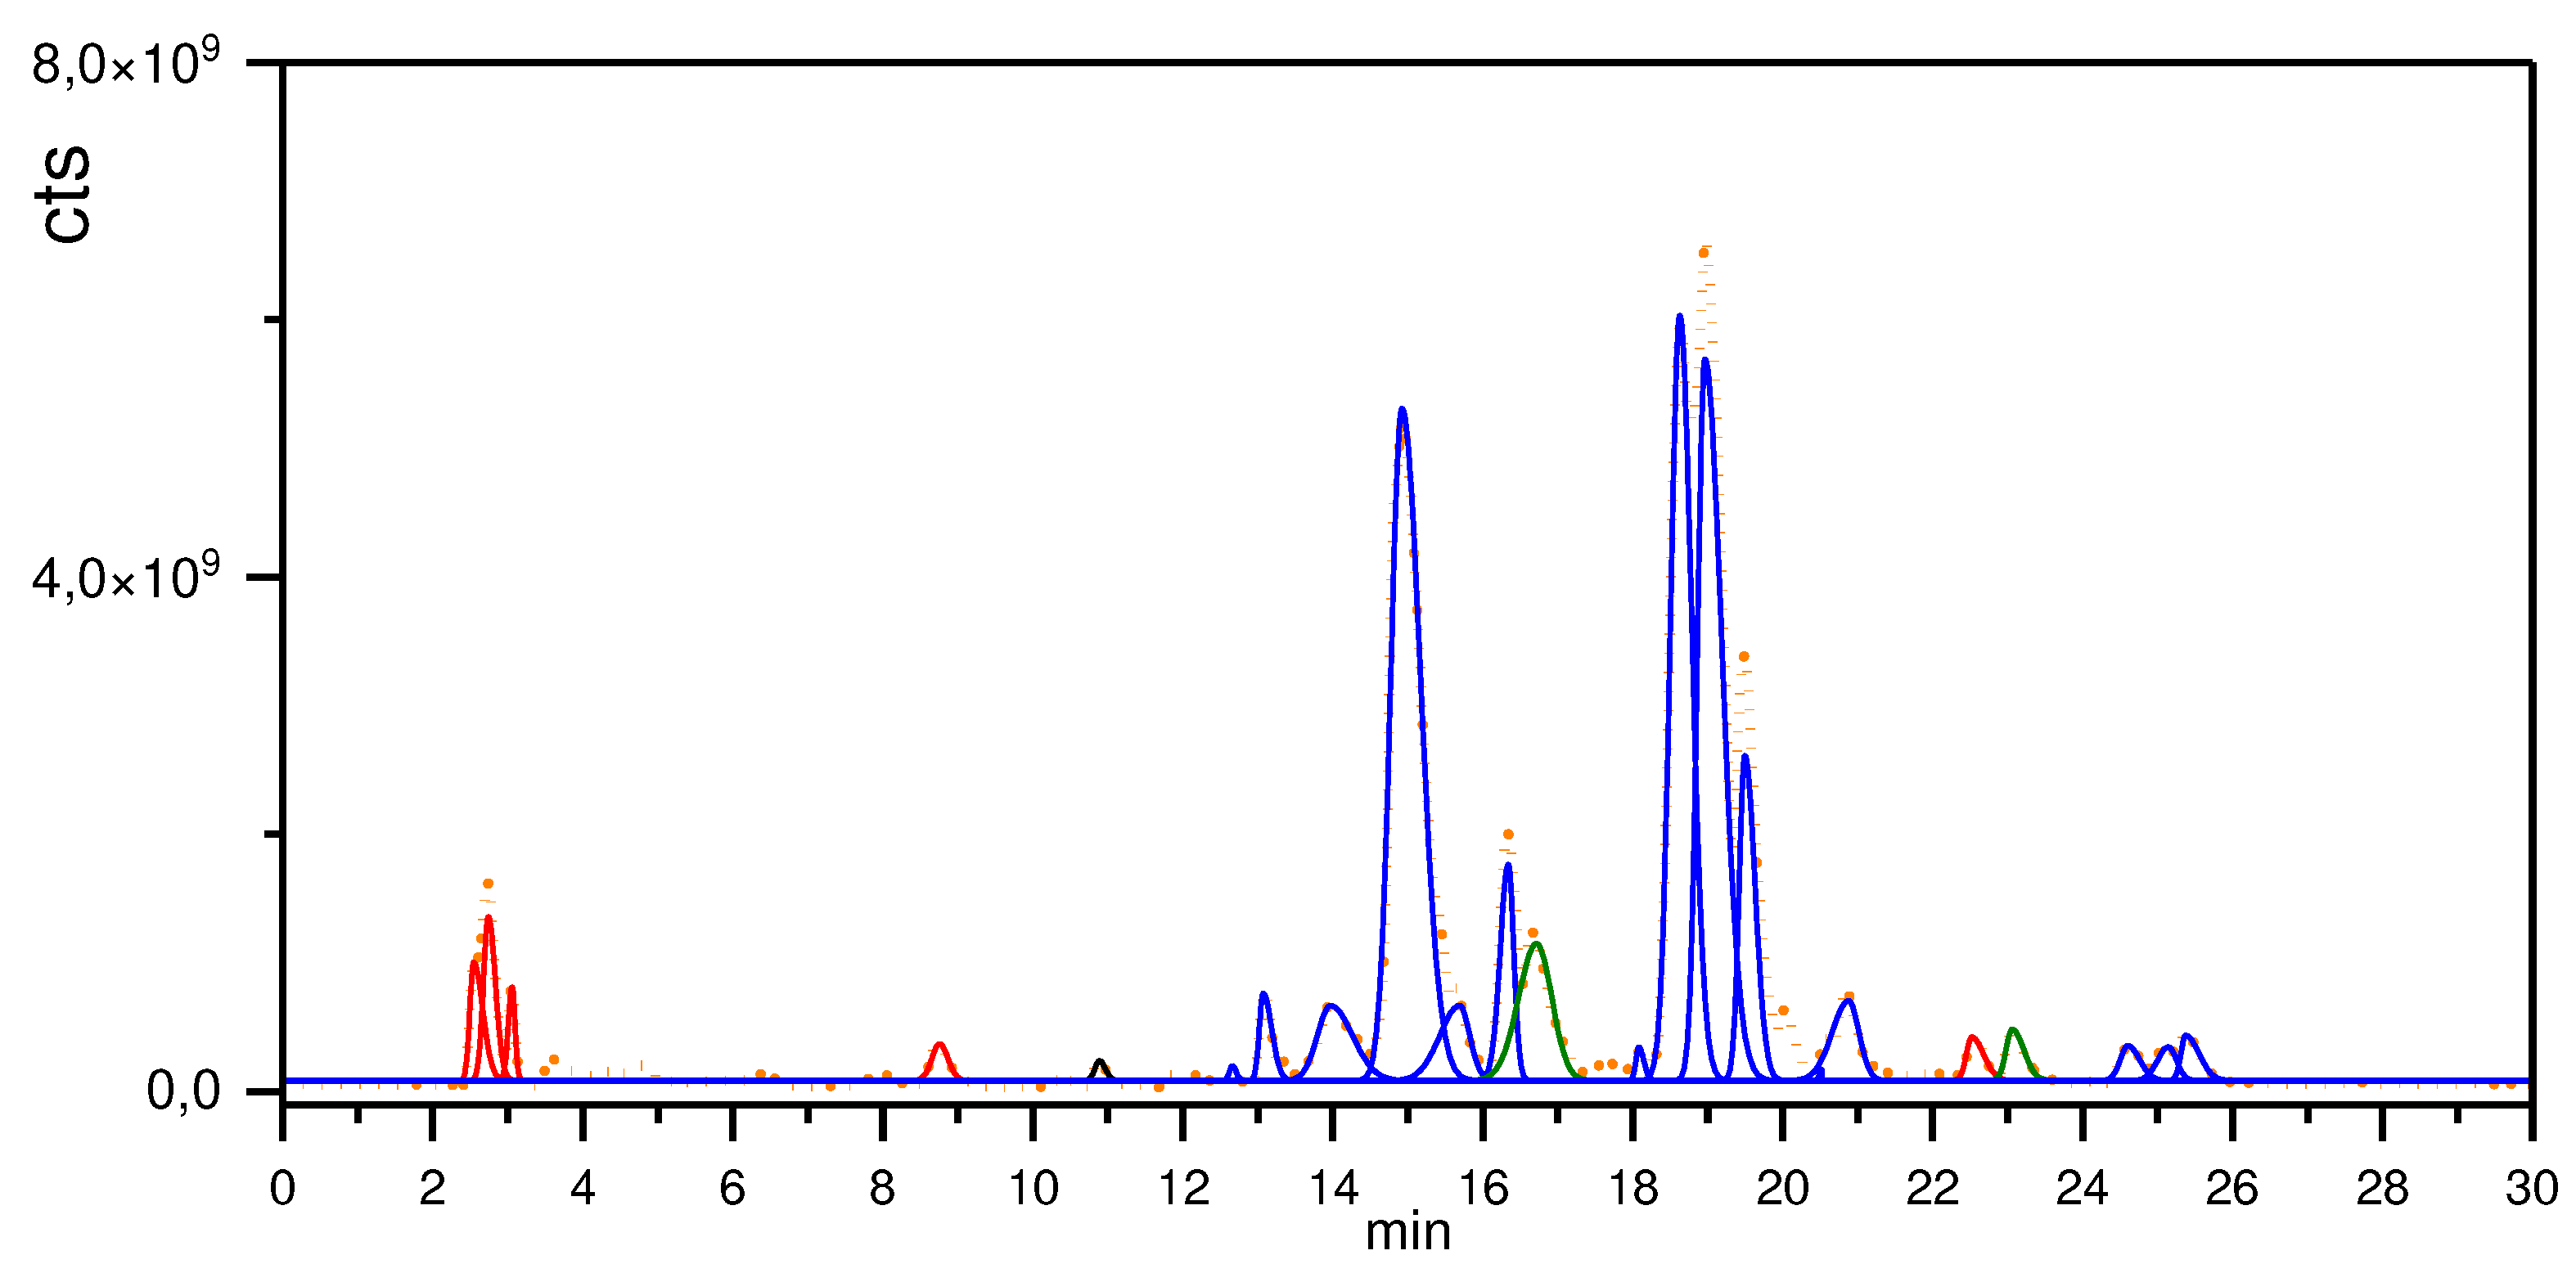
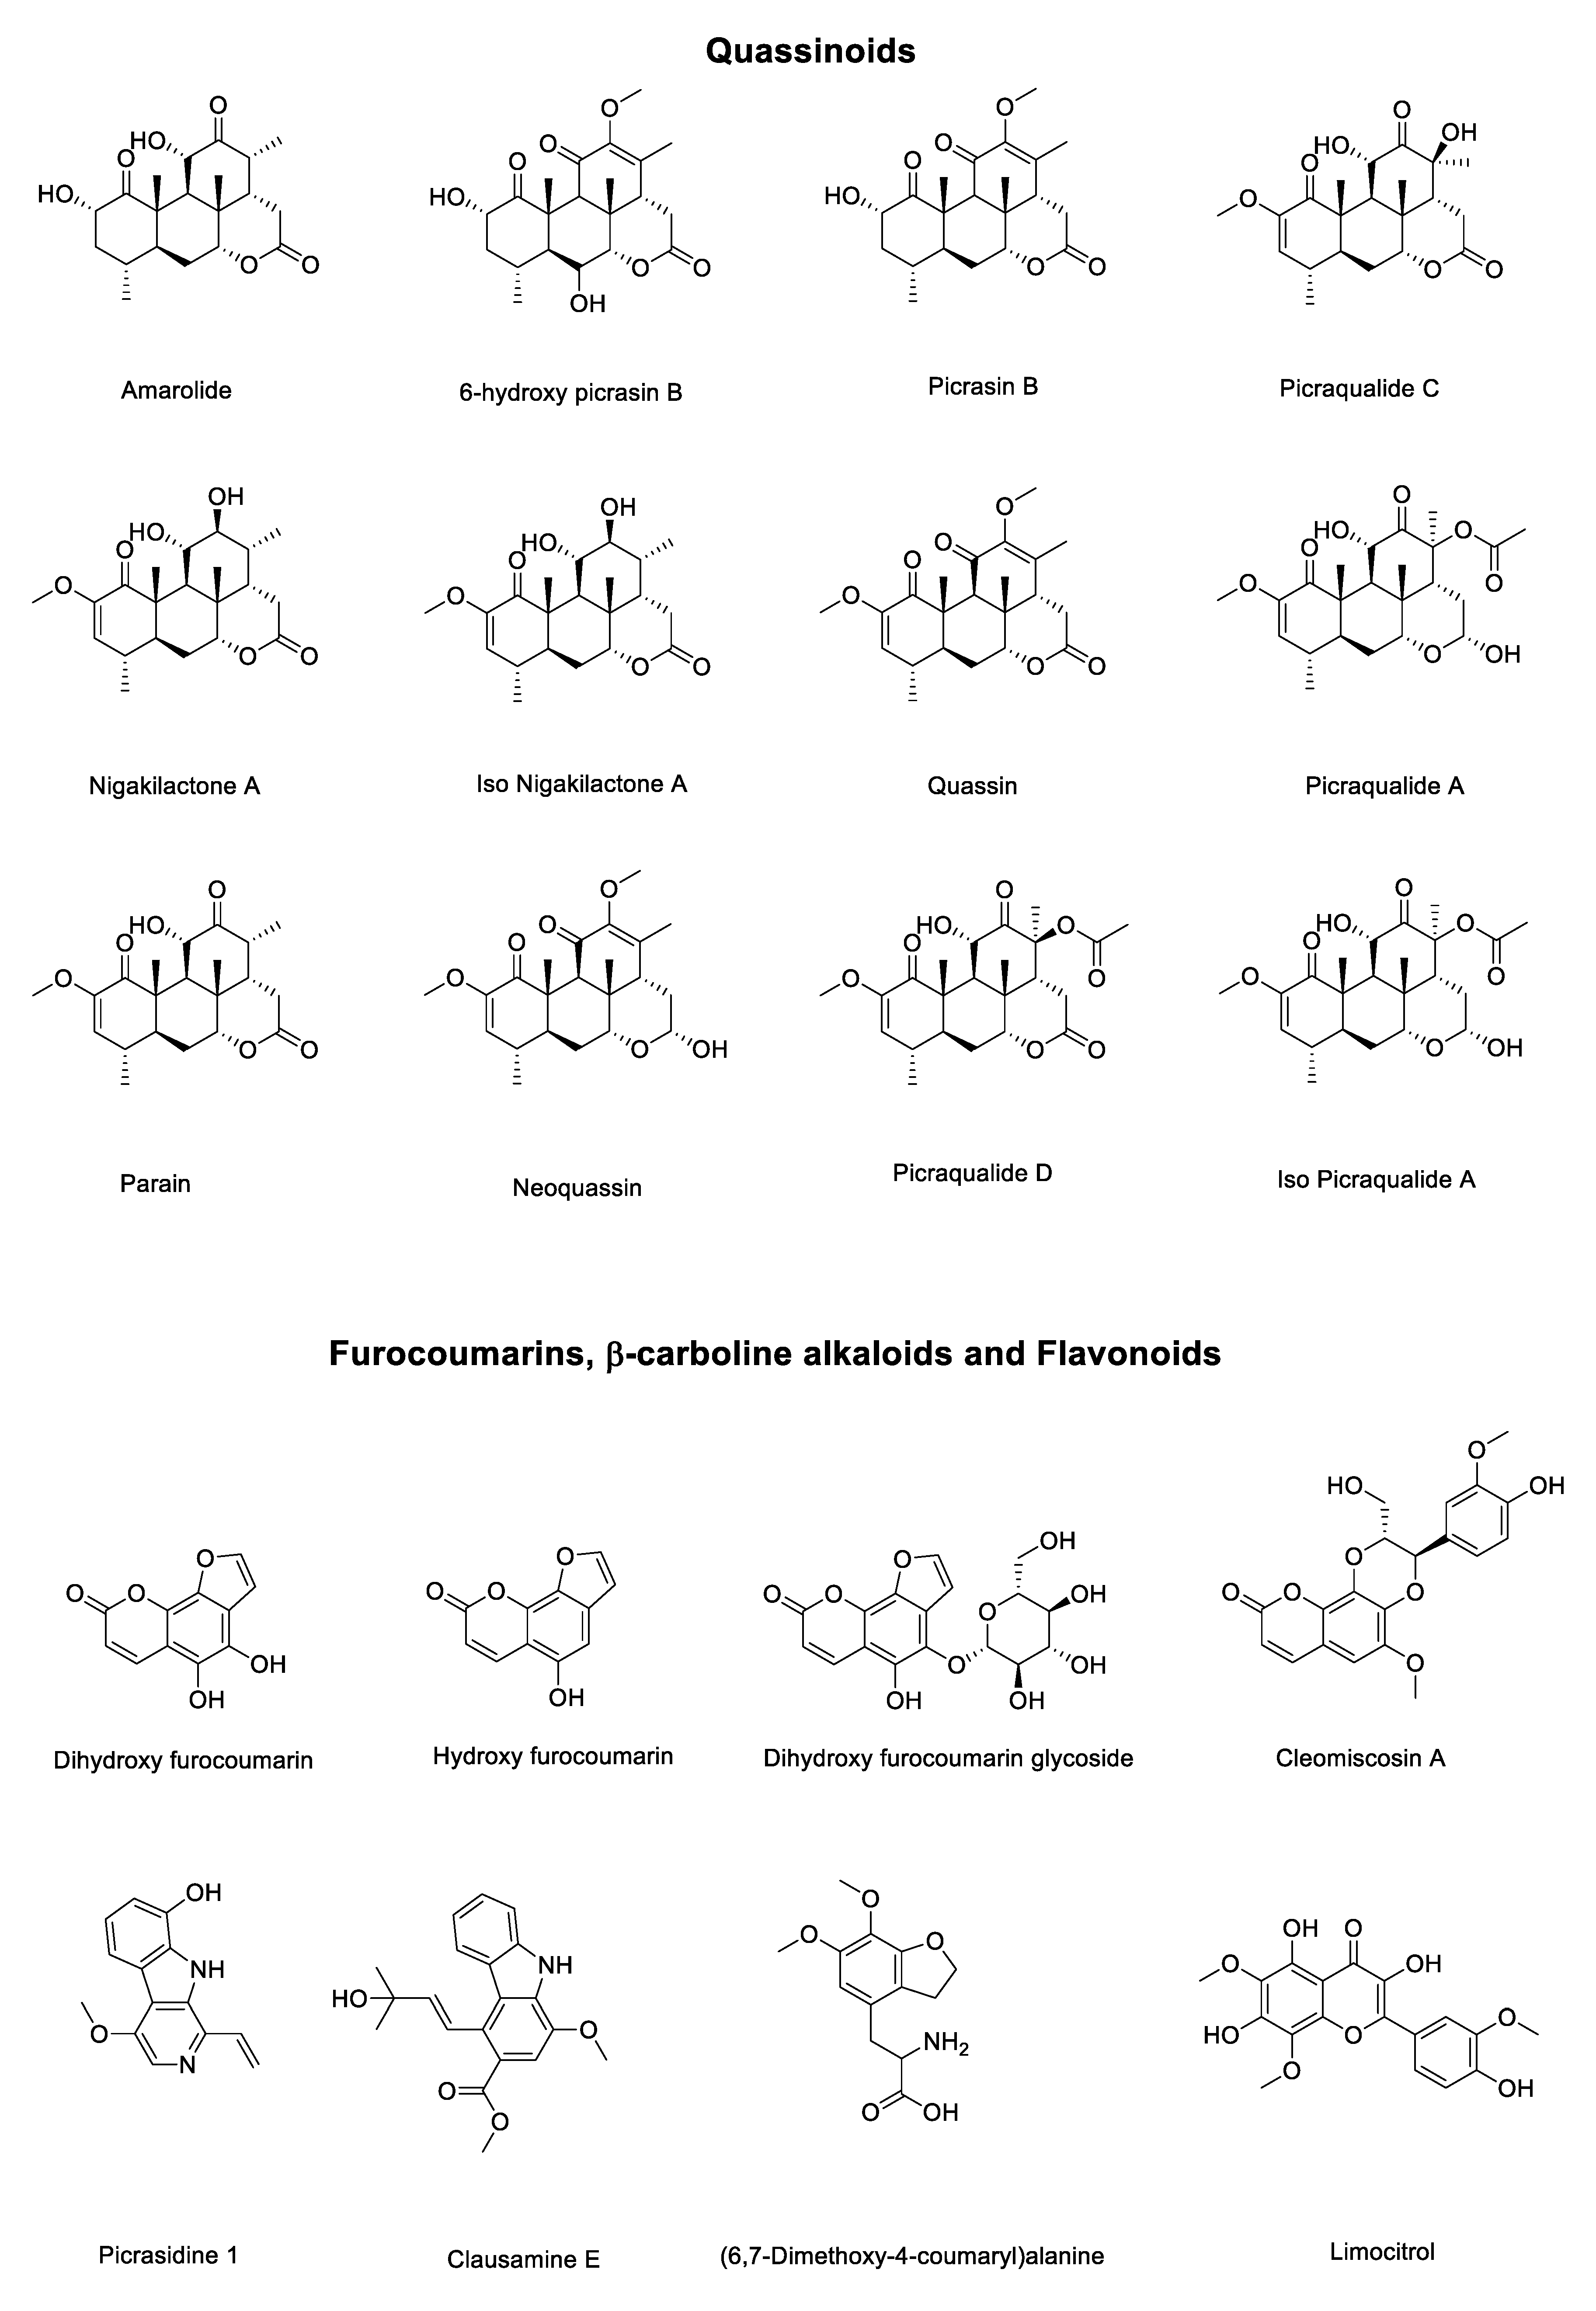
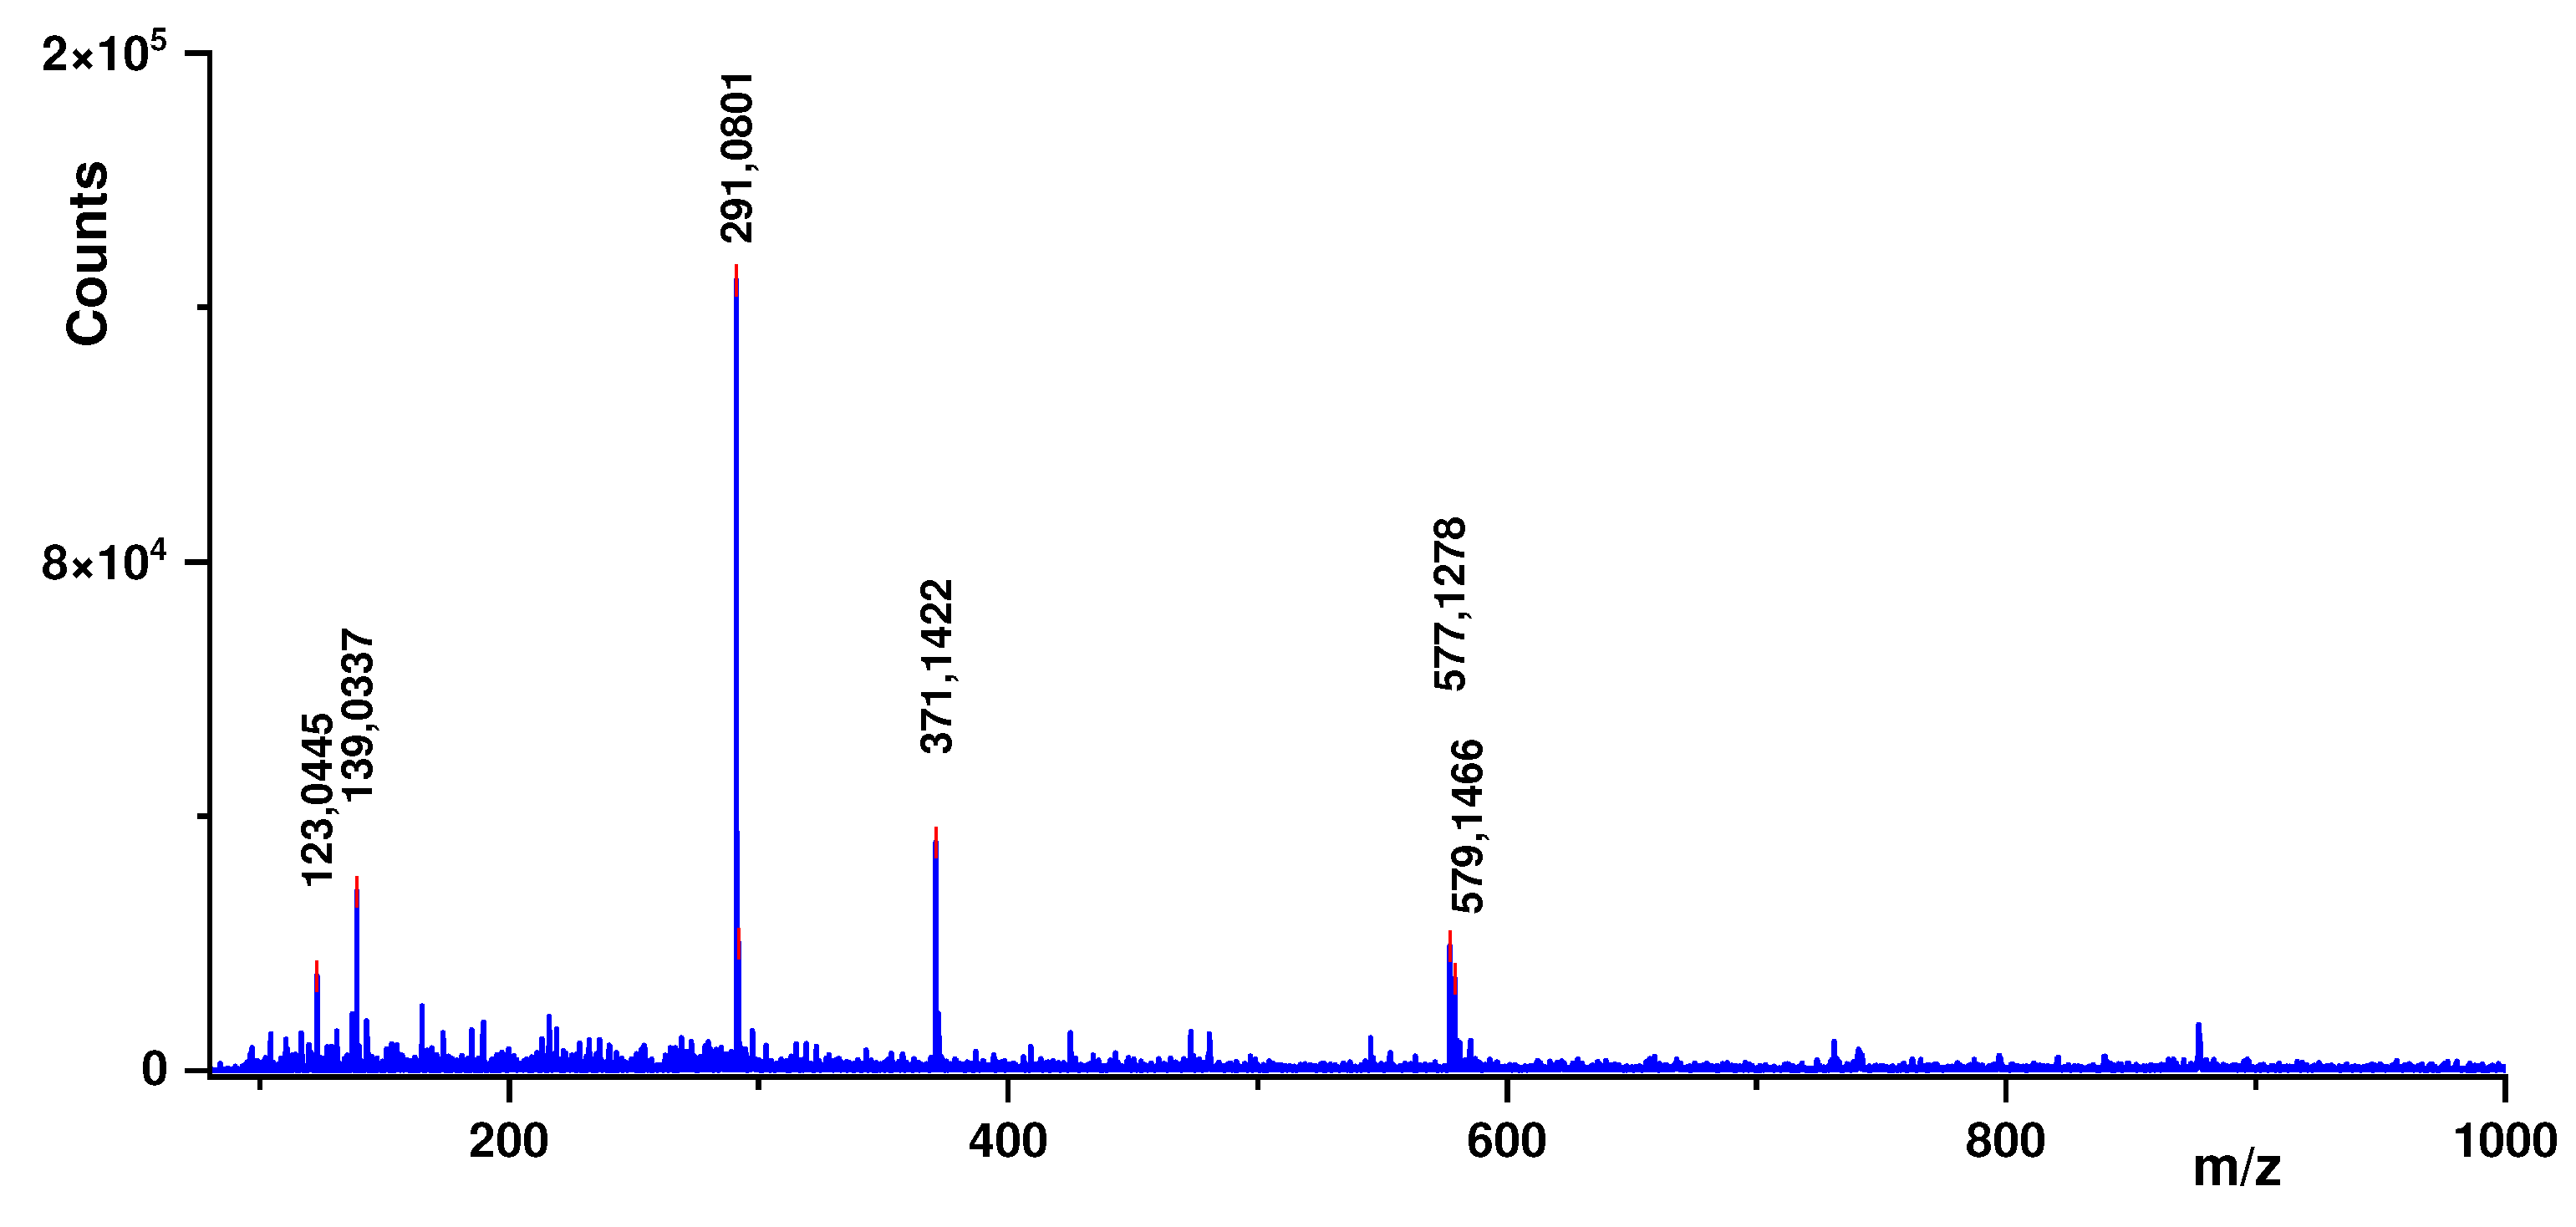

| Peak (min) | Experimental | Theoretical Mass | Error (ppm) | Compound |
|---|---|---|---|---|
| 2.6 | 219.0250 | 219.0288 | 17.35 | Dihydroxy furocoumarin |
| 2.6 | 203.0504 | 203.0339 | 81.27 | Hydroxy furocoumarin |
| 2.7 | 381.0775 | 381.0816 | 10.76 | Dihydroxy furocoumarin glycoside |
| 8.7 | 268.0991 | 268.1179 | 70.12 | (6,7-Dimethoxy-4-coumaryl) alanine |
| 10.9 | 377.0805 | 377.0867 | 16.44 | Limocitrol |
| 13.1 | 365.1899 | 365.1959 | 16.43 | Amarolide |
| 13.8 | 393.1879 | 393.1908 | 7.37 | 6-hydroxy picrasin B |
| 14.9 | 377.1932 | 377.1959 | 7.16 | Picrasin B |
| 15.7 | 393.1878 | 393.1908 | 7.63 | Picraqualide C |
| 16.3 | 435.1976 | 435.2013 | 8.5 | Picraqualide D |
| 16.6 | 241.0935 | 241.0972 | 15.34 | Picrasidine 1 |
| 18.6 | 379.2090 | 379.2115 | 6.59 | Nigakilactone A |
| 19.0 | 379.2090 | 379.2115 | 6.59 | Iso Nigakilactone A |
| 19.5 | 389.1932 | 389.1959 | 6.94 | Quassin |
| 20.0 | 437.2120 | 437.2170 | 11.43 | Picraqualide A |
| 20.9 | 437.2121 | 437.2170 | 11.21 | Iso Picraqualide A |
| 22.5 | 387.1038 | 387.1074 | 9.30 | Cleomiscosin A |
| 23.1 | 340.1597 | 340.1543 | 15.87 | Clausamine E |
| 25.1 | 377.1878 | 377.1959 | 21.47 | Parain |
| 25.4 | 413.1892 | 413.1935 | 10.4 | Neoquassin |
Disclaimer/Publisher’s Note: The statements, opinions and data contained in all publications are solely those of the individual author(s) and contributor(s) and not of MDPI and/or the editor(s). MDPI and/or the editor(s) disclaim responsibility for any injury to people or property resulting from any ideas, methods, instructions or products referred to in the content. |
© 2023 by the authors. Licensee MDPI, Basel, Switzerland. This article is an open access article distributed under the terms and conditions of the Creative Commons Attribution (CC BY) license (http://creativecommons.org/licenses/by/4.0/).


