1. Introduction
Evidence-based targeted anthelmintic treatment programs to control equine helminthic infections are gaining momentum largely in response to reports of widespread anthelmintic resistance in cyathostomins (small strongyles) [1, 2]. Once considered inconsequential to equine health, cyathostomins are now recognized for their pathogenic potential and their ability to develop resistance to many commonly used anthelmintics [3, 4]. Small strongyles infect all age groups of horses although infection intensity is greater in young and in some percentage of adult horses [
5]. Anthelmintic interventions to disrupt the strongyle life cycle remain the mainstay for control of equine strongylosis. Designed to prevent infection with the dreaded large strongyle,
Strongylus vulgaris; more than five decades of suppressive control programs have triggered the unexpected emergence of anthelmintic resistance in cyathostomins [6, 2]. Despite the continued success of past programs in keeping
S. vulgaris out of managed equine herds, the current need to mitigate resistance in small strongyles has led to increased awareness of evidence-based control programs [
7]. The American Association of Equine Practitioners (AAEP) has framed the parasite control guidelines that explain the current scenario of anthelmintic resistance in equine herds and the plans to mitigate it [
8]. The practices of blanket treatment or interval treatment regimens based on egg reappearance in the feces of all animals in a herd have been recognized as the cause of the emergence of drug resistance [
7]. In the US, cyathostomins are documented to be resistant to major classes of drugs on the market. Resistance is widespread to benzimidazoles (fenbendazole, oxibendazole); common in pyrimidines (pyrantel); and indicated for macrolide lactones (ivermectin, moxidectin) [
9]. Benzimidazoles are now considered a failed group of drugs to treat cyathostomosis. For macrolide lactones, the egg reappearance period (ERP), an indicator of efficacy, has been substantially decreased. For example, ERP for moxidectin is down from 16-22 weeks when the drug was introduced to the current low of 10-12 weeks [
8].
The premise, on which many of the evidence-based targeted treatment programs are designed, is the epidemiological fact that small strongyle infections are highly concentrated in certain horses in a herd (15-30%). These small percentage of horses account for approximately 80% of eggs shed in the pasture [8, 10]. As per AAEP guidelines, horses that shed 0-200 eggs per gram of feces (EPG) are categorized as low shedders (50-75% of the herd), 201-500 EPG as moderate (10-20%), and >500 as high shedders (15-30%) [
8]. Targeted treatment of heavy shedders would promote parasite refugia to mitigate resistance, prevent unwarranted anthelmintic exposure in low shedders, and reduce the cost of the anthelmintic program [11, 12]. The success of any evidence-based program depends on the availability of accurate fecal egg count (FEC) tests [
13]. FEC is required to designate horses based on their egg-shedding potential and to monitor for anthelmintic efficacy by the fecal egg count reduction test (FECRT). Strongyle egg count is essentially done in two ways: 1) dilution egg count, and 2) concentration egg count [
14]. The former ‘estimates’ eggs present per gram of feces while the latter concentrates eggs present in one gram of feces and earnestly ‘enumerates’ them. Modified McMaster and Mini-FLOTAC techniques are examples of the former, and Wisconsin floatation test for the latter [13, 15, 16, 8]. No two tests that work on either of the above two principles have similar diagnostic performance [
17]. In fact, no FEC test has been designated as a gold standard to quantify equine strongyle egg counts that generally range from 0 - >2500 EPG in feces [
10]. Numerous modifications and variations exist for many FEC tests to accommodate practical and pragmatic considerations of the end-user. Several factors may impact the accuracy of FEC analysis in horses: individual differences in egg shedding, over-dispersion in feces, sampling, and storage practices. However, the most important is the type of FEC method used [
13]. Dilution techniques tend to overestimate strongyle egg counts [
18]. Regression analysis is generally done to analyze the usefulness of a test for egg counts [19, 20, 21]. In the past, purified strongyle eggs have been used for such studies although on a smaller scale [
18]. However, it is not feasible to procure the necessary numbers of purified eggs for large-scale studies. In this regard, polystyrene beads with specific gravity (1.06spg) similar to the SPG of strongyle eggs (average 1.055; range 1.03-1.10) can be used as a proxy [22, 14]. A gold standard test should be of high sensitivity, high specificity, accurate, precise, and with lower limits of detection [
17]. Deming regression analysis will identify a gold standard test [
23].
The aim of this study was not to promote a gold standard test for evidence-based control programs. Rather, this study compares the performance of the various FEC tests to determine the usefulness of these tests for evidence-based anthelmintic treatment programs. Overall, this study aids with meaningful implementation of AAEP parasite control guidelines.
2. Materials and Methods
2.1. Polystyrene beads
Polystyrene Microspheres [red colored beads, 1.06 specific gravity (SPG), and 45µm diameter] were procured from Phosphorex, Inc., Fall River, MA, as 1.0g dry powder. A stock solution was prepared by dispensing a scoop of polystyrene beads using a lab spatula (0.1in x 0.2 in) in 1mL of distilled water and further diluted in 1.5mL of 10X PBS containing five drops of 0.1% Tween 20 and Sodium azide. A working stock was prepared by titrating and counting beads under the compound microscope so that every 50µl of the working solution contained an estimated 2080±134 beads. Initial assessments confirmed that the beads float in NaCl (1.20 SPG), NaNO3 (1.33 SPG), sugar (1.33 SPG), and ZnSO4 (1.18 SPG) floatation medium.
2.1.1. Validation of bead method: Recovery of beads from the fecal matrix
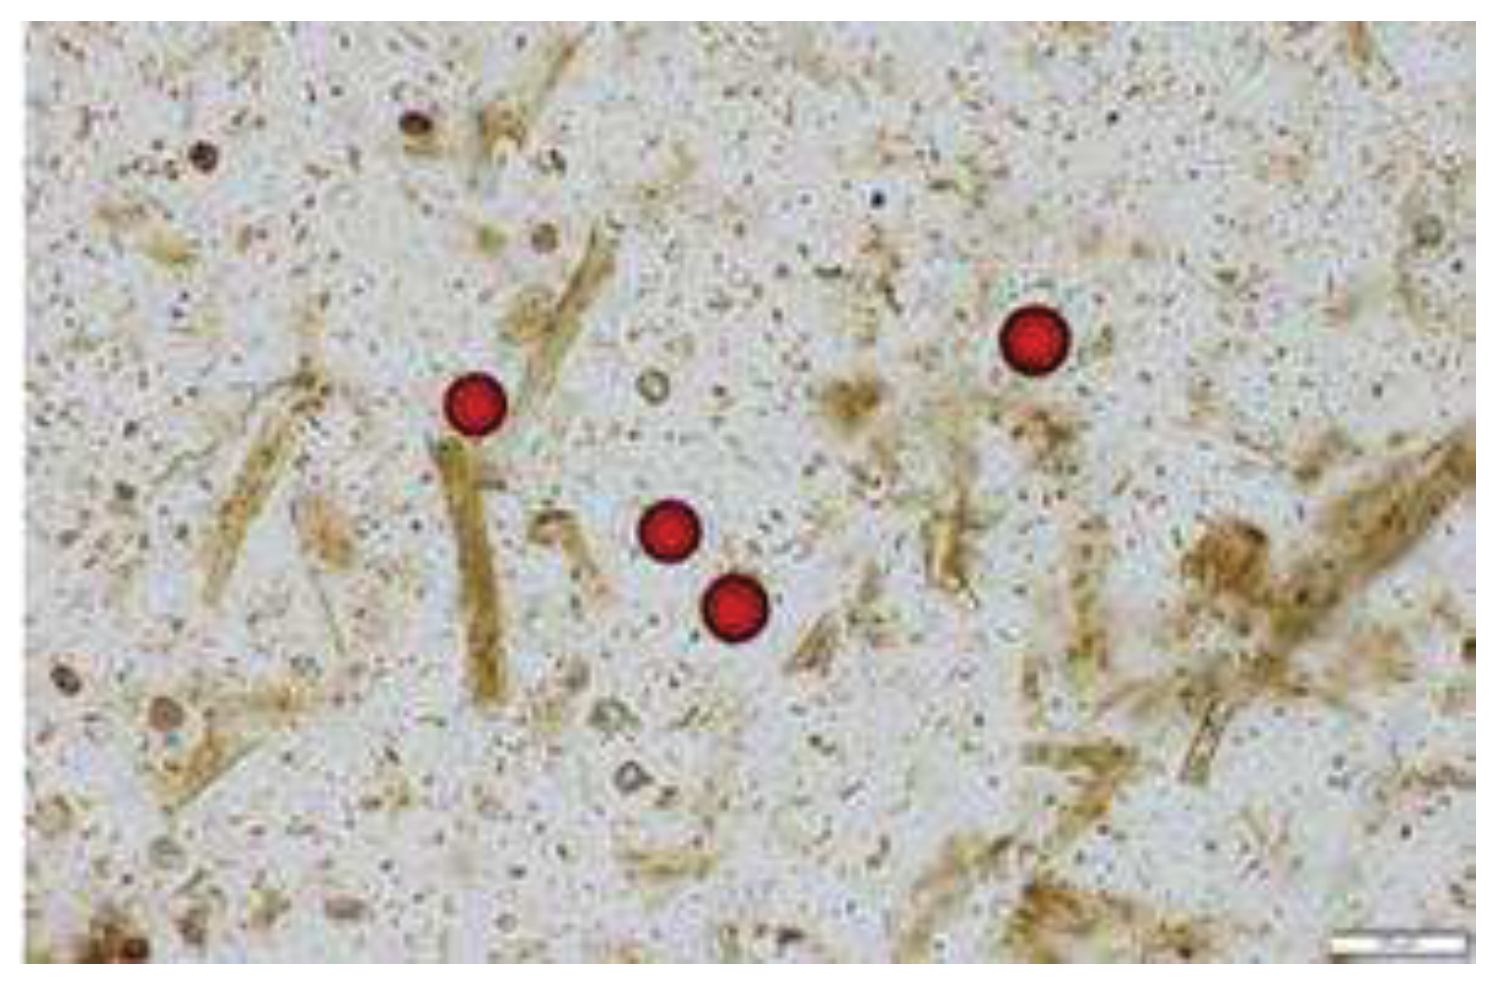
Compatibility for a fecal matrix was tested by spiking polystyrene beads in fecal sediment from 6 different horses (with a known EPG of zero), and their recovery through flotation solutions was analyzed (
Figure 1). For this pilot study, 12.5ul (520±33 beads) of the working stock solution was spiked to sediment obtained from a gram of horse feces. Spiked sediments from each horse placed in two different centrifuge tubes were mixed separately with ZnSO
4 (1.18 SPG) and sugar (1.33 SPG). The beads were retrieved under a coverslip, using the protocol as that of the modified Wisconsin double centrifugation floatation technique (Refer 2.2.3).
2.1.2. Validation of bead method: Standardized bead dilutions by BioSorter
The polystyrene beads were sorted using BioSorter (large object flow cytometer) at the core facility of the Cornell Institute of Biotechnology. Briefly, 0.1g of beads were dispensed in 30ml deionized distilled water containing Tween20 and blended well to avoid clumps. Using the built-in program of the BioSorter, the required number of beads (63, 125, 250, & 500) were collected in vials. As individual beads were sorted as droplets, the desired number of beads were collected as follows: 63 beads in 0.1mL, 125 beads in 0.5mL, 250 beads in 1.0mL, and 500 beads in 2.0mL. Sorted beads remained at 40C until further use. The bead number in three aliquots for each concentration was verified by dispensing the precipitated beads onto a glass slide and counting using a light microscope. The median for bead count was determined.
2.1.3. Validation of bead method: Repeatability assay
This study was designed to analyze if bead standard (125, 500, and 1000 beads) recovery is consistent among replicates and to prove the usefulness of these beads as a proxy for strongyle egg count using various quantitation protocols. Fecal aliquots from a single horse, designated as a low shedder, were spiked with the bead standards, and their recovery was analyzed by fecal quantitation tests (n=12,
Table 1) with each test replicated 12 times. A total of 432 runs (1 animal x 12 fecal replicates x 3 bead standards x 12 methods) were performed to obtain data to analyze statistical significance for repeatability assay.
2.2. Fecal egg count methodologies
Quantitation methodologies are grouped into two broad categories, 1) dilution protocols and 2) concentration protocols. Most of the quantitation tests used by equine practitioners and offered at various diagnostic labs fall under these two broad principles [
14]. Modified McMaster and Mini-FLOTAC are good examples of dilution methodologies, whereas Modified Wisconsin works on the principle of concentration egg counts. Many variants exist for each of these tests as per the choice of flotation medium (ZnSO
4, sugar, NaCl, NaNO
3, etc.) and its specific gravity (usually ranging from 1.18 – 1.35) [24]. For this study, we included three techniques and their four variants mentioned in
Table 1. The techniques and variants were selected based on their popularity in equine clinics and diagnostic labs. More importantly, modified Wisconsin and modified McMaster are mentioned in the AAEP parasite control guidelines as techniques for quantitation [
8]. Mini-FLOTAC is popular in clinical settings [
15]. The combination of three techniques and four variants resulted in a total of 12 different tests to assess their diagnostic performance for counting beads and strongyle eggs in fecal samples.
The technical process is the same for estimating either beads or strongyle eggs, except for spiking the desired number of beads to fecal samples as outlined below.
2.2.1. Modified McMaster technique
Vials containing the desired number of beads were added to two grams of fecal samples in a wax paper cup. The vials were rinsed minimally with tap water using jetwash bottle with a fine stream nozzle to dispense all beads into the wax cup. The completeness of dispensing all beads from a vial to the fecal sample was assessed stereo-microscopically and no remaining beads were observed. Using a serological pipette, 28mL of desired float solution was dispensed in the wax cup and fecal samples with beads were mixed well using a tongue depressor. The content was sieved through a metal strainer and pressed with the tongue depressor to extract as much filtrate as possible. The filtrate was mixed thoroughly and dispensed to fill both chambers of the McMaster counting apparatus using a disposable transfer pipette. The beads or eggs in the chambers were counted under a compound microscope and the estimate in a gram of fecal sample was determined based on an established formula {[Number of beads or eggs x(30mL/.3mL)]/2g} [25].
2.2.2. Mini-FLOTAC technique
This technique is based on a published protocol using the commercially available kit [26]. Briefly, two grams of feces were placed in the Fill-FLOTAC cup to which the desired number of beads were dispensed. Vials were cross-checked stereo-microscopically to confirm dispensing of all beads. The sample was homogenized in 38mL of desired float solution and loaded into both cassettes of Mini-FLOTAC. After 10 minutes the key on the device was rotated to 900 angle and the beads/eggs were counted under a compound microscope. The count from both cassettes was multiplied by a factor of 10 to derive the estimate of beads/eggs per gram of feces.
2.2.3 Modified Wisconsin double centrifugation floatation technique
To one gram of fecal sample in a wax paper cup, the desired number of beads from a vial was dispensed and mixed in 15mL of tap water. Vials were cross-checked to rule out incomplete dispensing. After sieving through a metal strainer the filtrate was dispensed into a 15mL glass tube and centrifuged at 2000 rpm for 10 minutes. The supernatant was poured off and the sediment was homogenized with ~15ml of desired float solution using a wooden applicator stick. The floatation solution was added to the brim of the glass tube to form a slightly positive meniscus before a glass coverslip (22x22mm) was placed onto it. After centrifuging at 2000 rpm for 10 minutes the coverslips were removed and placed on a glass slide. Beads or eggs under the coverslips were counted manually using a compound microscope (100x magnification) and expressed as beads/eggs per gram of feces.
2.3. Regression analysis
Deming regression was performed to identify a test’s suitability to quantify over a plausible range (low to high) of strongyle eggs present in a given fecal sample. Deming regression is a widely accepted method for this purpose [
23] due to the suitability of this method when there is measurement error in both variables of the regression. Fecal aliquots of five different horses designated as low shedders were spiked separately with 63, 125, 250, 500, and 1000 beads and their recovery was analyzed and plotted against the predicted bead count in 2 replicates, and the number of beads recovered was recorded. The choice of the bead standards (63 to1000) reflects the strongyle egg count ranges indicated in AAEP guidelines for designating horses based on their egg shedding potential (0-200 EPG as low; 201-500 EPG as moderate; and >500 EPG as high shedders). The coefficient of determination (R
2) of the linear fit indicates the suitability of that particular test to perform well over the biologically important range of strongyle egg quantitation. Subsequently, a correction factor (CF) was deduced from the Deming regression forced through a 0 intercept for tests that showed a sufficiently high coefficient of determination in the Deming regression (R
2 > 0.95
2.4. Method agreement
Firstly, we verified if fecal strongyle egg count differs between the quantitation methodologies with R2 > 0.95 by analyzing fecal samples from 40 different horses. Secondly, the CF was applied to each raw FEC test result to obtain the corrected FEC test result for each clinical sample. Pearson correlation between each pair of tests was determined. FEC results were then categorized into low, moderate, and high shedders. Contingency analysis was performed to determine the Kappa agreement before and after adjusting with CF.
2.5. Fecal samples
Equine fecal samples were mainly collected from a research herd maintained at the Baker Institute of Cornell University. The herd consists of Thoroughbred horses and are well maintained and remained as experimental animals for protocols approved by the Institutional Animal Care and Use Committee (IACUC) of Cornell University. In a prior study performed over a period of 12 months during 2017-18, we were able to categorize all animals in this herd as either low, moderate, or heavy shedders as per the guidelines of the AAEP (0-200 EPG low; 201-500 EPG moderate; and >500 EPG high shedders). Forty animals from this herd are now designated according to their shedding potential. Fecal samples from a single low shedder were used for repeatability analysis. Five other low shedders were used for regression analysis while other horses were used for the clinical validation study. Equine fecal samples submitted to the Cornell Animal Health Diagnostic Center or procured through Cornell Ambulatory Clinics were also used for clinical validation.
3. Results
3.1. Bead recovery from fecal matrix
Polystyrene beads (520±33 in 12.5ul) spiked into fecal sediments of six different horses were retrieved under coverslips after mixing and floatation in ZnSO
4 (1.18 spg) and sugar (1.33 spg). Spiked beads were detected using light microscopy in 100X magnification (
Figure 1). ZnSO
4 flotation retrieved an average of 452 beads from six horses (range 250-598); whereas sugar floatation retrieved 552 beads (range 528-618). This study indicates no impact of fecal matrix on polystyrene beads however, manual titration to obtain desired concentration of beads was a challenge.
3.2. Verification of bead counts obtained by BioSorter.
To overcome the difficulty of manual titration, polystyrene beads were sorted in desired concentrations (63, 125, 250 & 500) using BioSorter. Number of beads in three aliquots for each concentration was counted and its median was determined as 63, 125, 244 and 495, respectively.
3.3. Repeatability of bead standard recovery
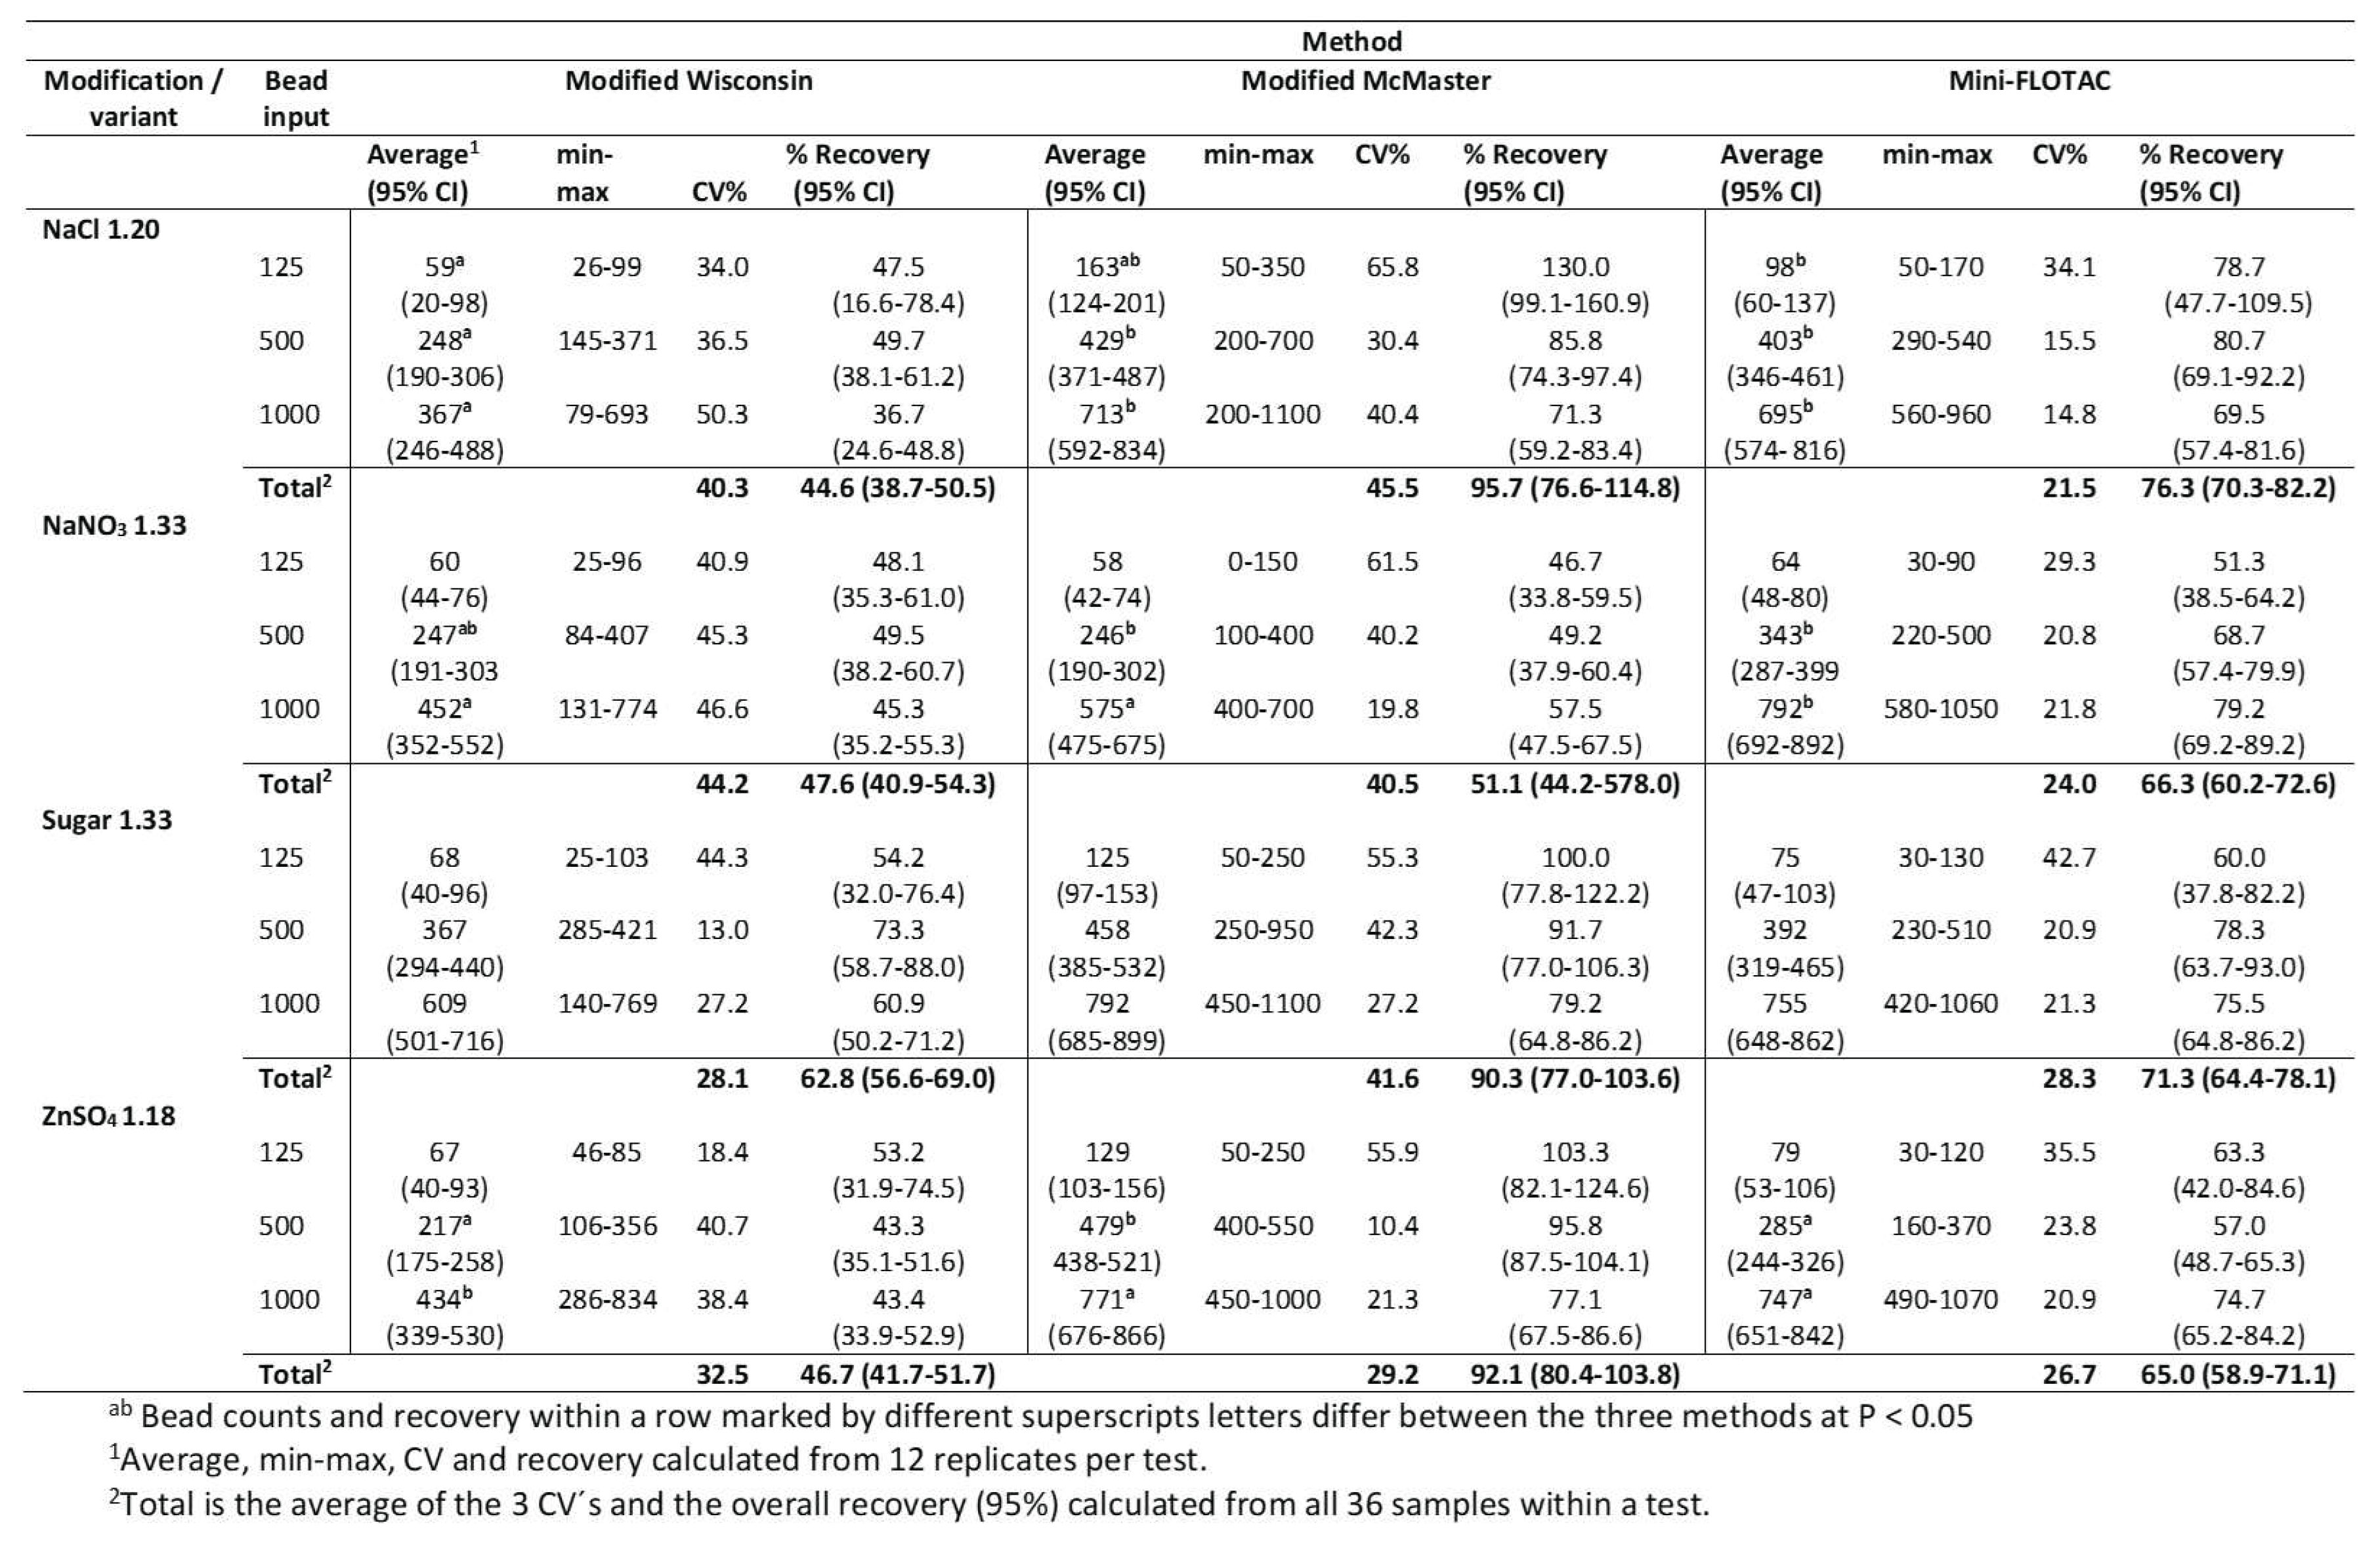
Results of the repeatability assay on 12 replicates for each test for selected bead standards (125, 500, & 1000) are depicted in
Table 2 showing the average number of beads recovered (95% CI), percentage recovery (95% CI), and their coefficient of variation.
The coefficient of variation (CV%) for three bead standards for each test was assessed. The average CV% for modified Wisconsin test variants NaCl 1.20 SPG, NaNO3 1.33 SPG, sugar 1.33 SPG, and ZnSO4 1.18 SPG was 40.25, 44.2, 28.14, and 32.49, respectively. The average CV% for modified McMaster test variants (same order as above) was 45.5, 40.48, 41.59, and 29.19. Similarly, for Mini-FLOTAC the average CV% was 21.45, 23.95, 28.31, and 26.74. Among the 12 tests, Mini-FLOTAC NaCl 1.20 SPG had the lowest CV% of 21.45 indicating its nearness to the mean number of beads recovered for the three bead standards. In general, Mini-FLOTAC-based variants had the lowest CV% whereas McMaster variants had the highest.
Despite its good repeatability, Mini-FLOTAC was unable to estimate 100% of the spiked beads. The average percentage recovery of three bead standards for Mini-FLOTAC method variants was 76.3% for NaCl 1.20 SPG, 66.4% for NaNO3 1.33 SPG, 71.26% for Sugar 1.33 SPG, and 65% for ZnSO4 1.18 SPG. The average percentage recovery of beads for Modified McMaster method variants was 95.7% for NaCl 1.20 SPG, 51.1% for NaNO3 1.33 SPG, 90.3% for Sugar 1.33 SPG, and 92.06% for ZnSO4 1.18 SPG. However, some variants of the Modified McMaster method overestimated the spiked bead standards. For example, a replicate of 125 spiked beads was estimated as 350 by NaCl 1.20 SPG. Similarly, a replicate of 1000 beads was estimated as 1100 by both NaCl 1.20 SPG and Sugar 1.33 SPG. A significant impact of floatation solution in beads recovery (51.1%) was noted for NaNO3 1.33 SPG variant compared to the other three variants of Modified McMaster. The average percentage recovery of beads for Modified Wisconsin method variants was 44.63% for NaCl 1.20 SPG, 47.63% for NaNO3 1.33 SPG, 62.8% for Sugar 1.33 SPG, and 46.63% for ZnSO4 1.18 SPG. In fact, Modified Wisconsin variants fared poorly in terms of beads recovery. However, the sugar 1.33 spg variant performed better in terms of average beads recovery.
3.4. Deming regression analysis
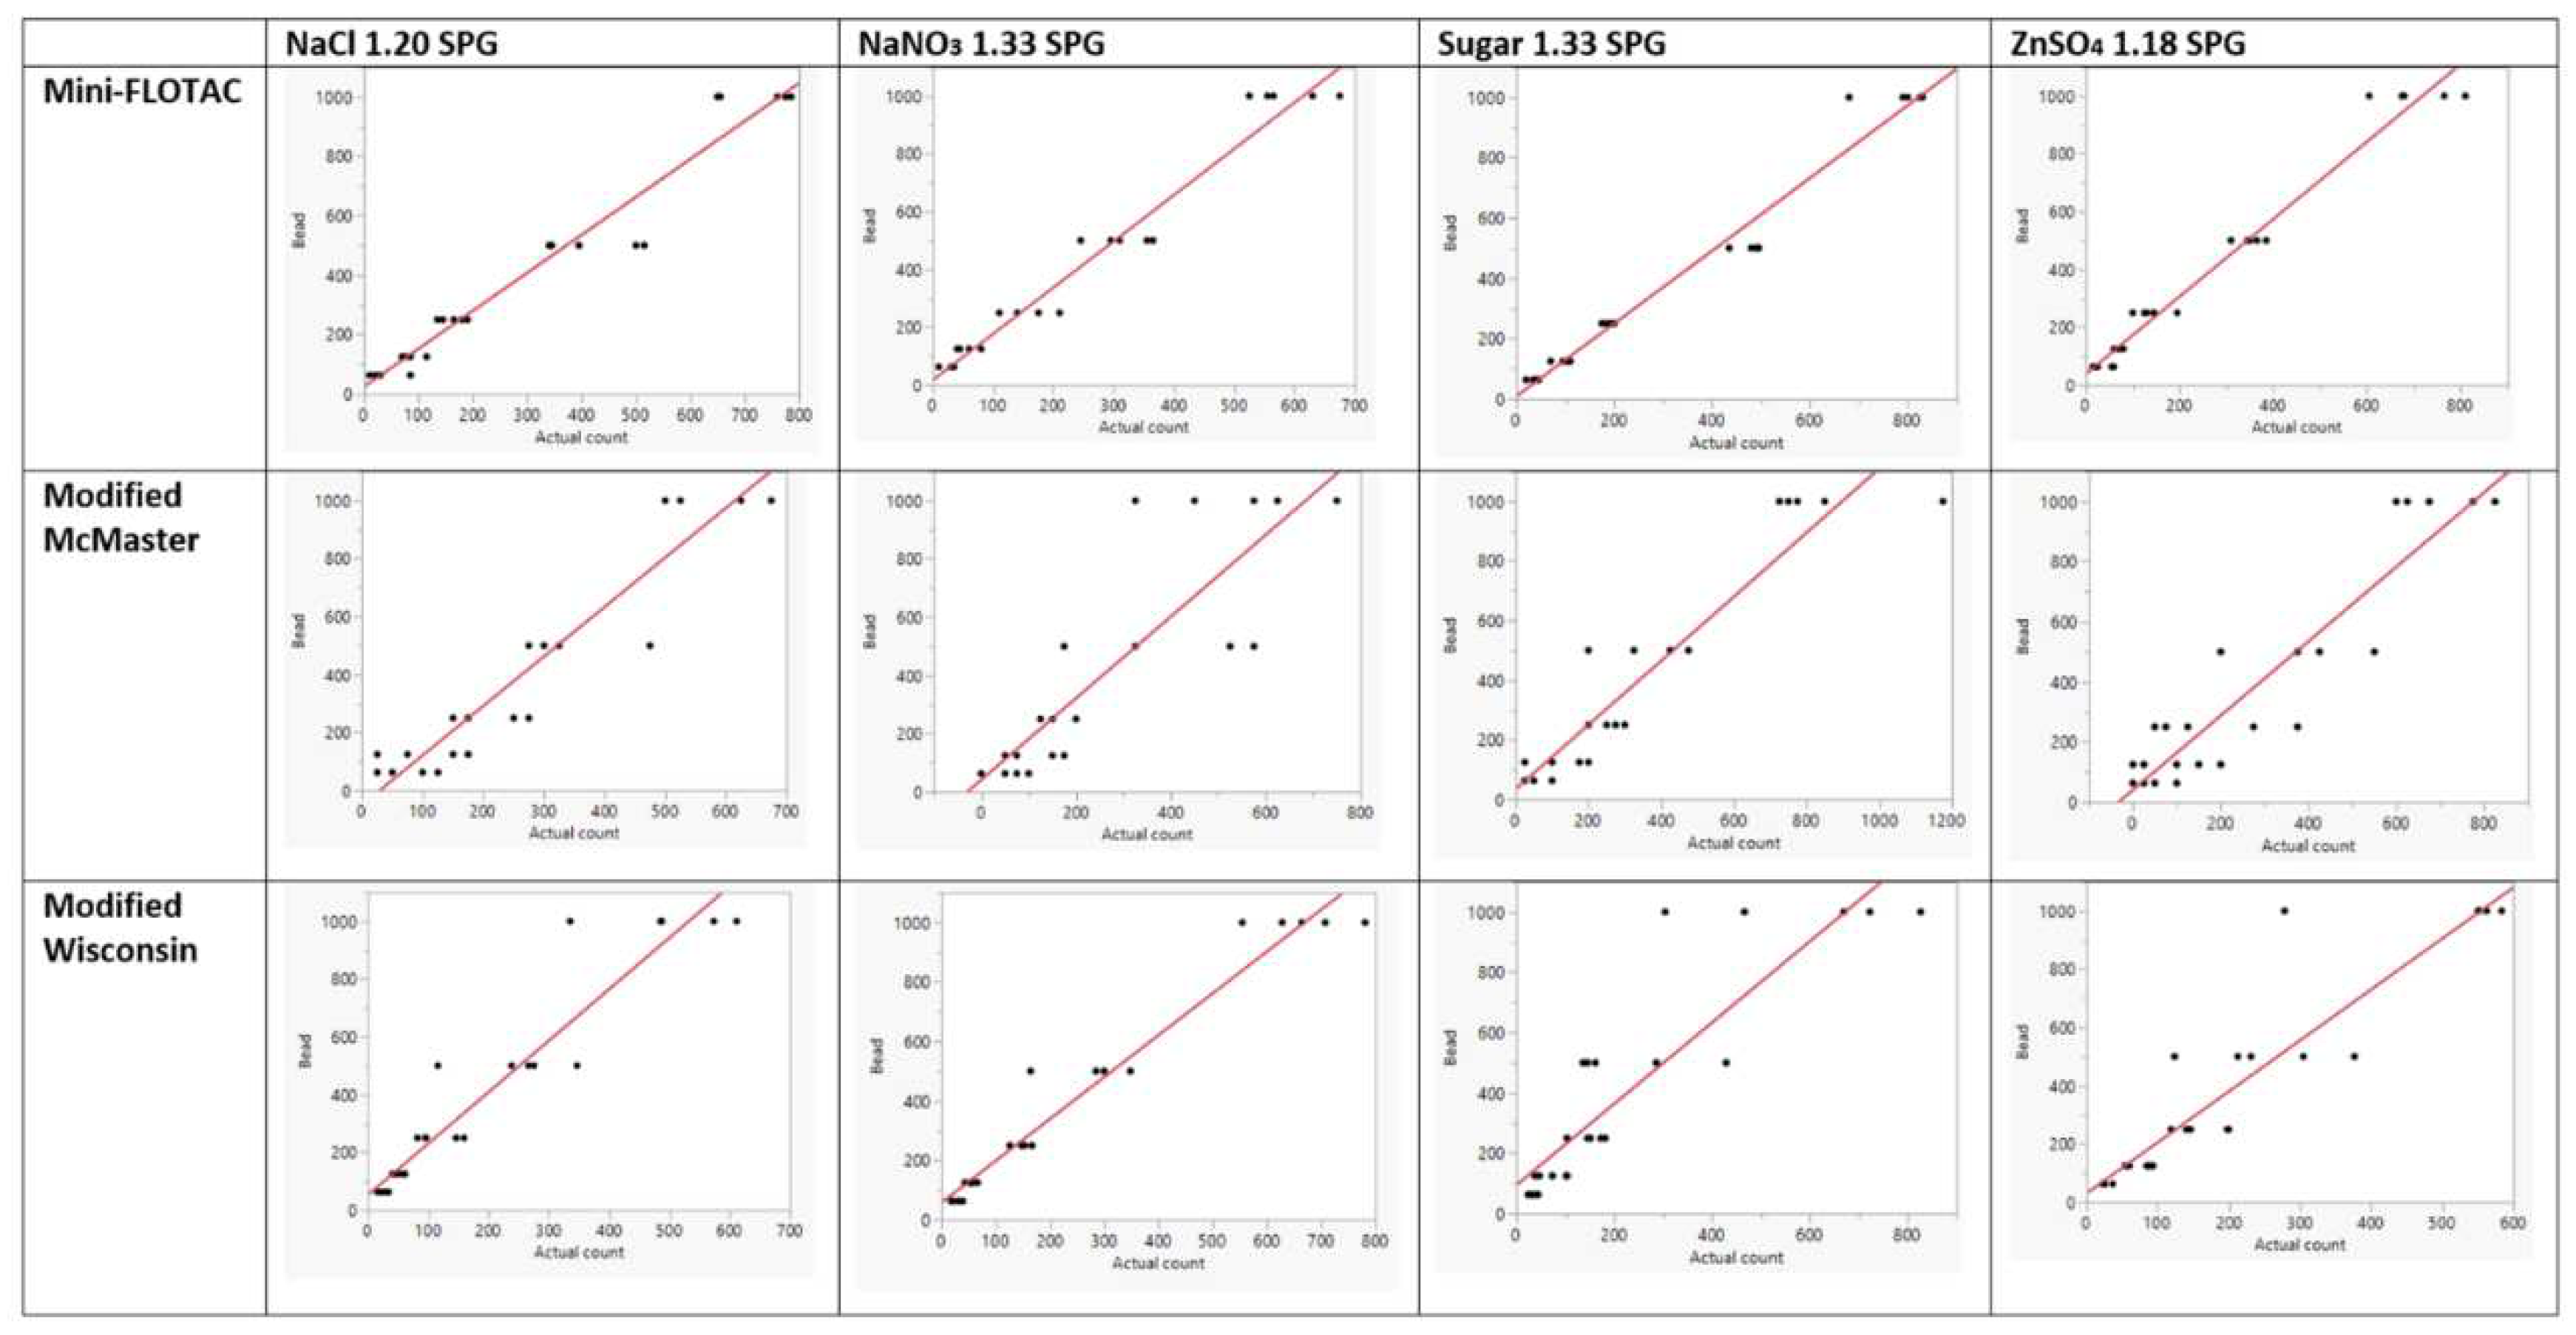
Bivariate analysis and linearity of the regression curve were determined by Deming regression (
Figure 2). The regression curve that passes through ‘zero’ may indicate a perfect slope. None of the test generated a regression curve that passed through zero which was desirable to identify a single correction factor. Therefore, we calculated the regression equation forcing a 0 intercept into the model. None of the methods and their variants had an R
2 of 1, or a slope of 1, however. all variants of Mini-FLOTAC and modified Wisconsin NaNO
3 1.33 SPG bead counts followed a linear fit with R
2 >0.95. In contrast, the bead standard replicates for modified McMaster variants dispersed from the regression curve, causing a lower R
2. Interestingly, for modified Wisconsin variants, bead standard replicate values were tighter for the lower number of spiked beads (63, 125 & 250) but dispersed from the regression curve for higher numbers (500 & 1000). Similarly, Mini-FLOTAC variants (NaCl 1.20 SPG and sugar 1.33 SPG) as well as the modified McMaster variants (sugar 1.33 SPG and ZnSO
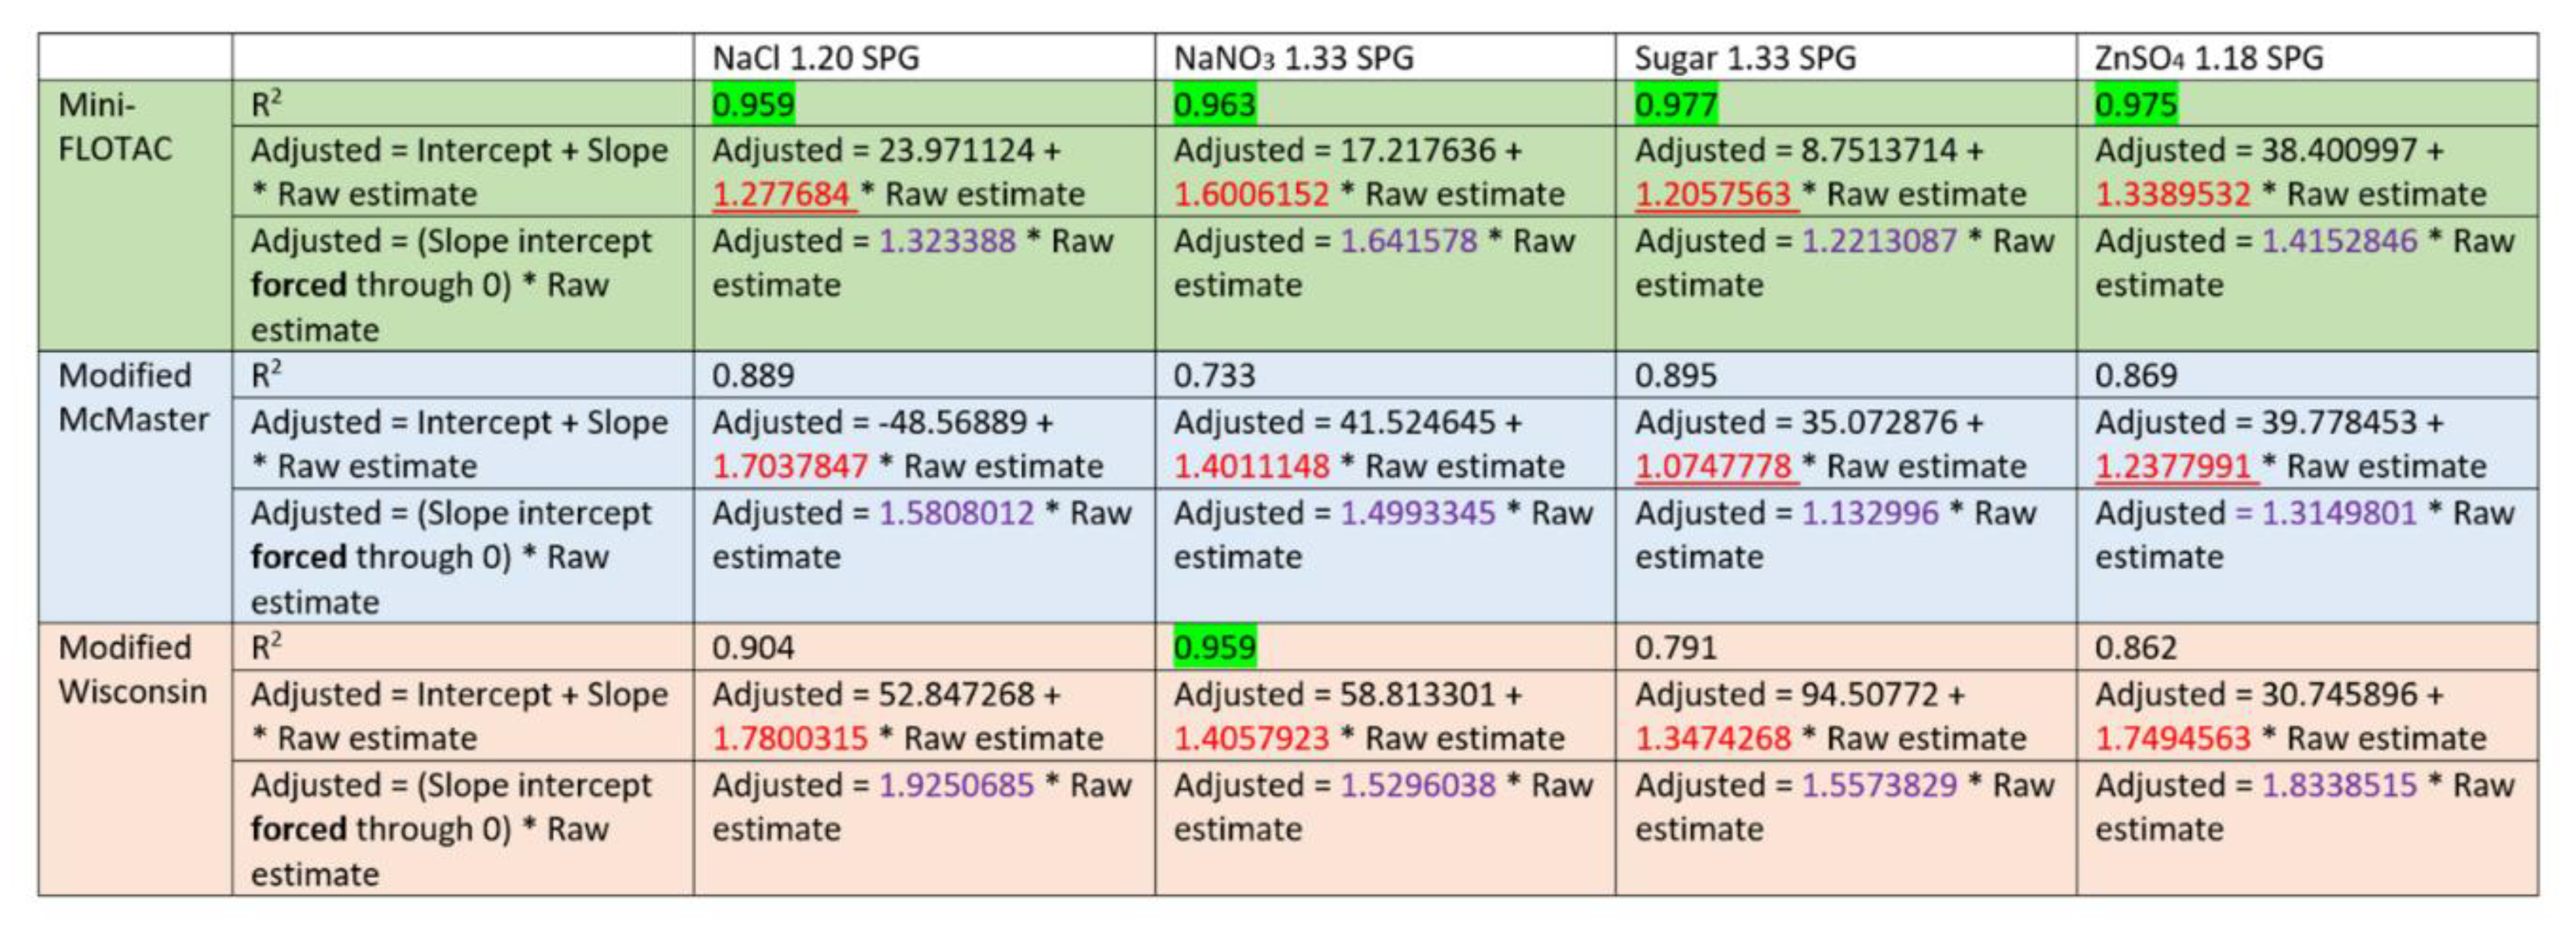
4 1.18 SPG), had slope <1.3 (closer to 1). Among all methods, Mini-FLOTAC sugar 1.33 SPG performed best in the Deming regression based on the highest R
2 (0.977) and slope (1.2057563) that are closer to 1.
R
2 and slope of linear regression were analyzed to determine the goodness-of-fit for each of the 12 tests to estimate the actual number of spiked beads (
Table 3). A value closest to 1 for both parameters (R
2 and slope) indicate good fit. Four tests had a slope < 1.30 [modified McMaster sugar 1.33; Mini-FLOTAC sugar 1.33; modified McMaster ZnSO
4; and Mini-FLOTAC NaCl 1.20]. Five tests had R
2 >0.95 [all variants of Mini-FLOTAC and modified Wisconsin NaNO
3].
3.5. Correlation of best methods in clinical samples.
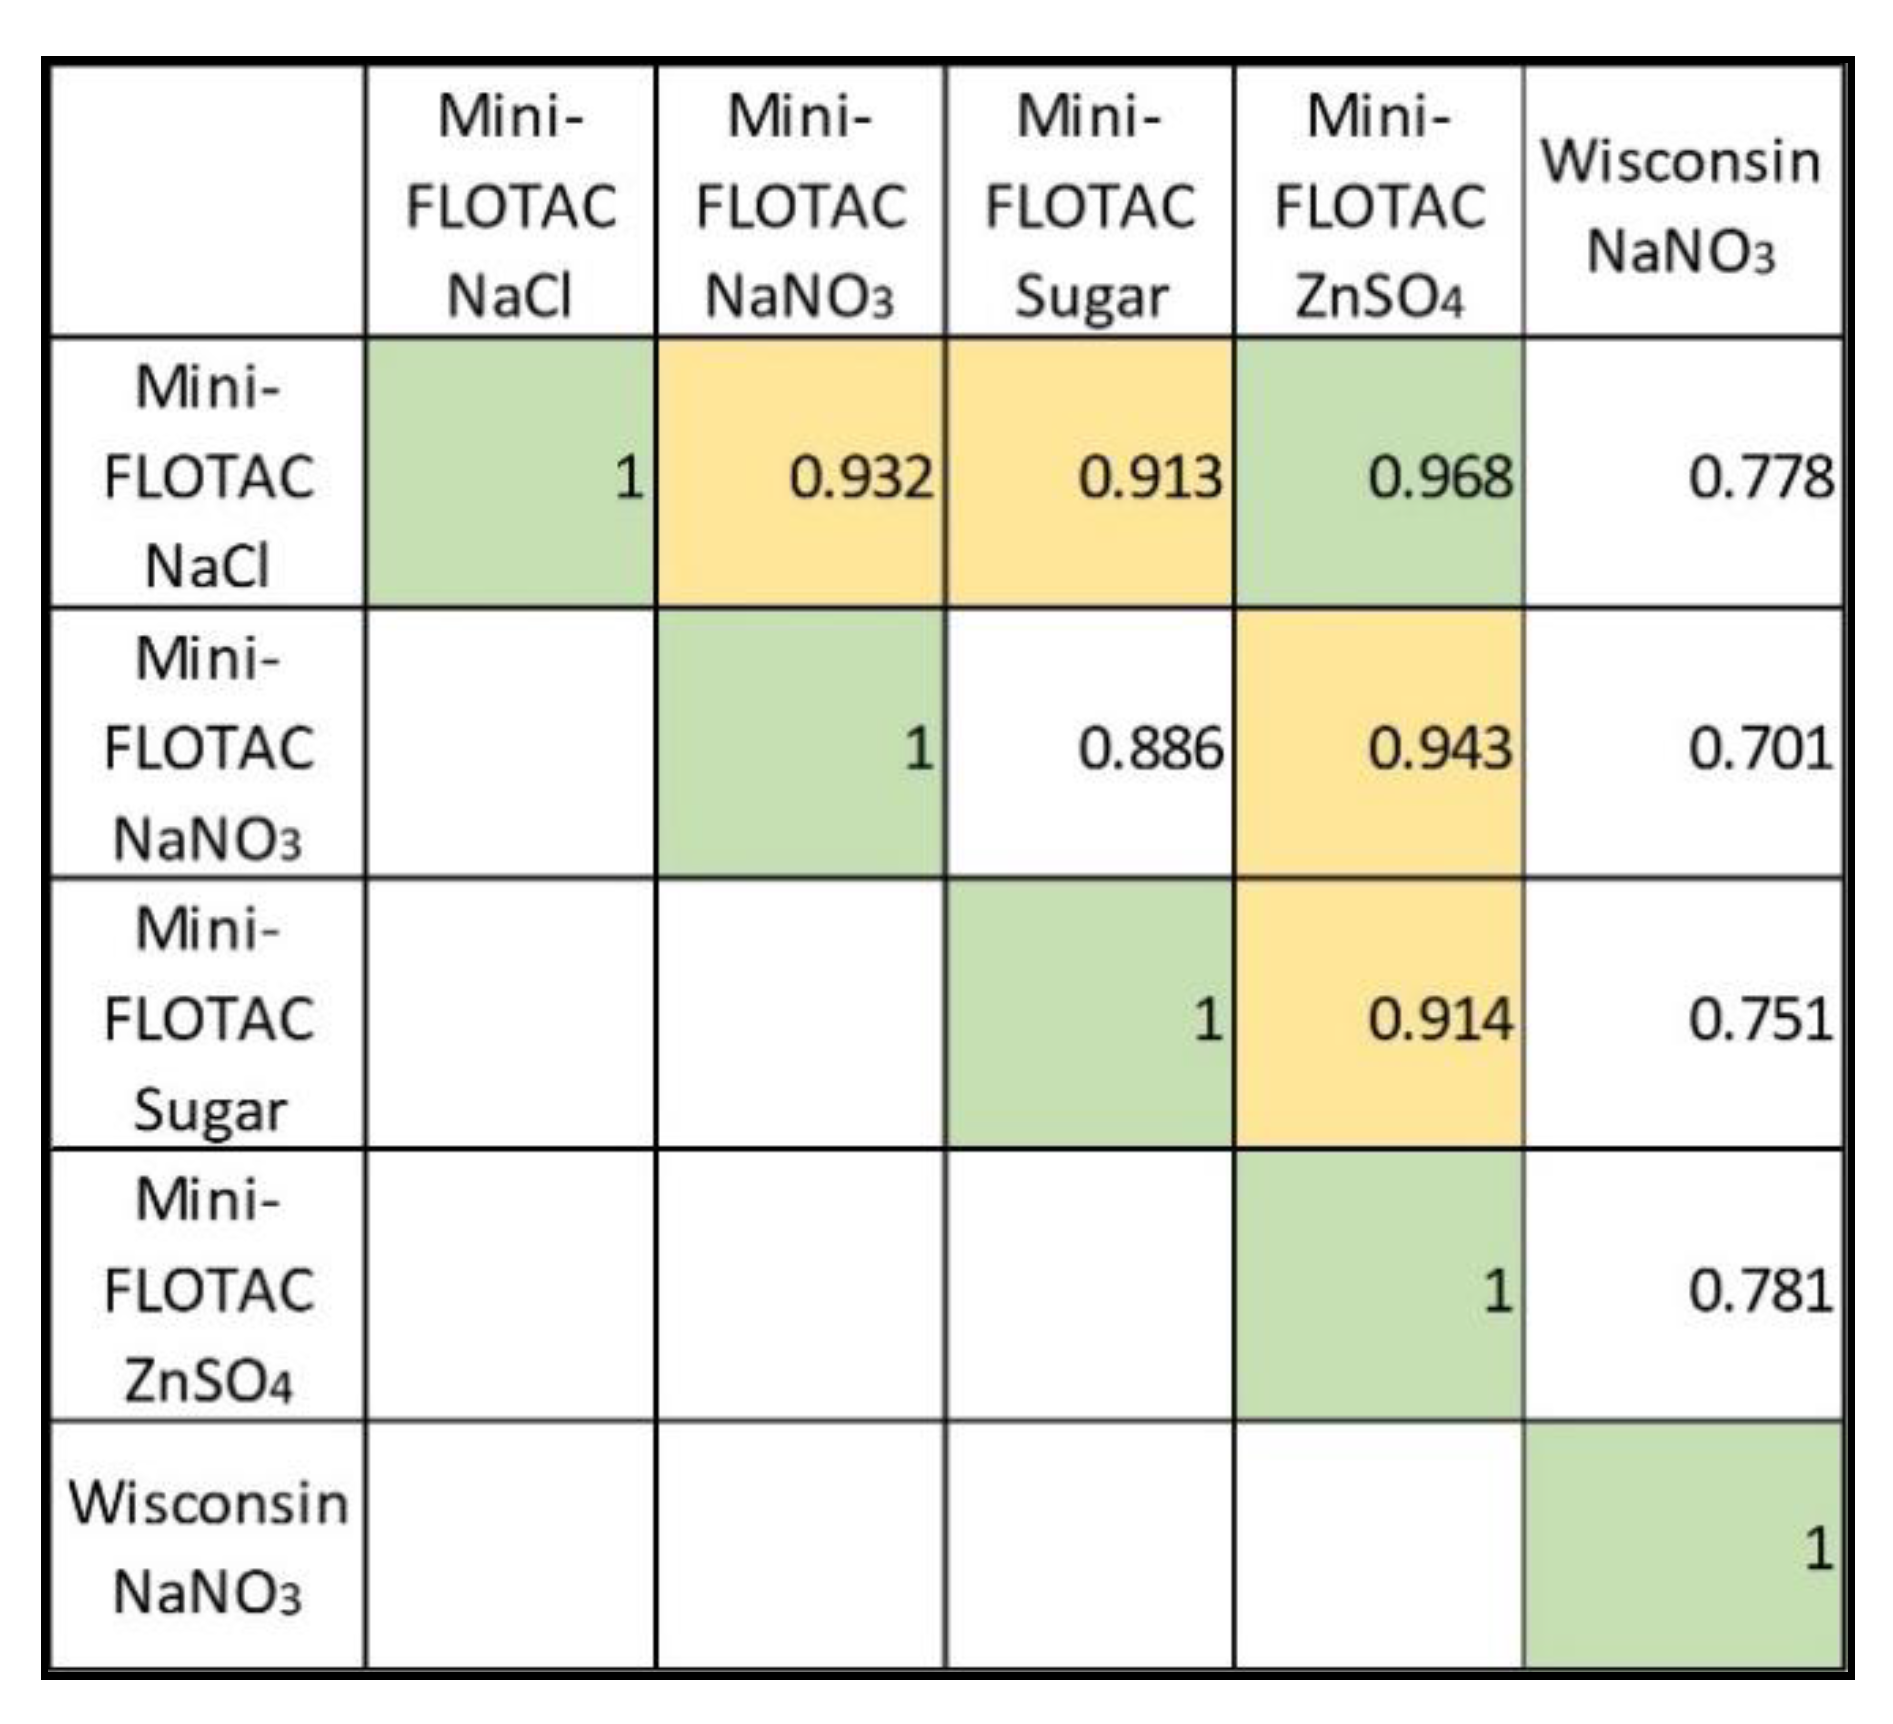
For five method modifications that had high R
2 >0.95, we tested the Pearson correlation using 40 clinical samples (
Table 4). The correlations were generally very high and the ones above 0.90 were highlighted in
Table 4. The Mini-FLOTAC NaCl 1.20 SPG as well as ZnSO
4 1.18 SPG had the highest number of correlations ≥ 0.90 with other methods and variants. Mini-FLOTAC ZnSO
4 had the highest correlation (0.9682) with Mini-FLOTAC NaCl.
3.6. Agreement between methods for classification of shedding category before and after adjustment
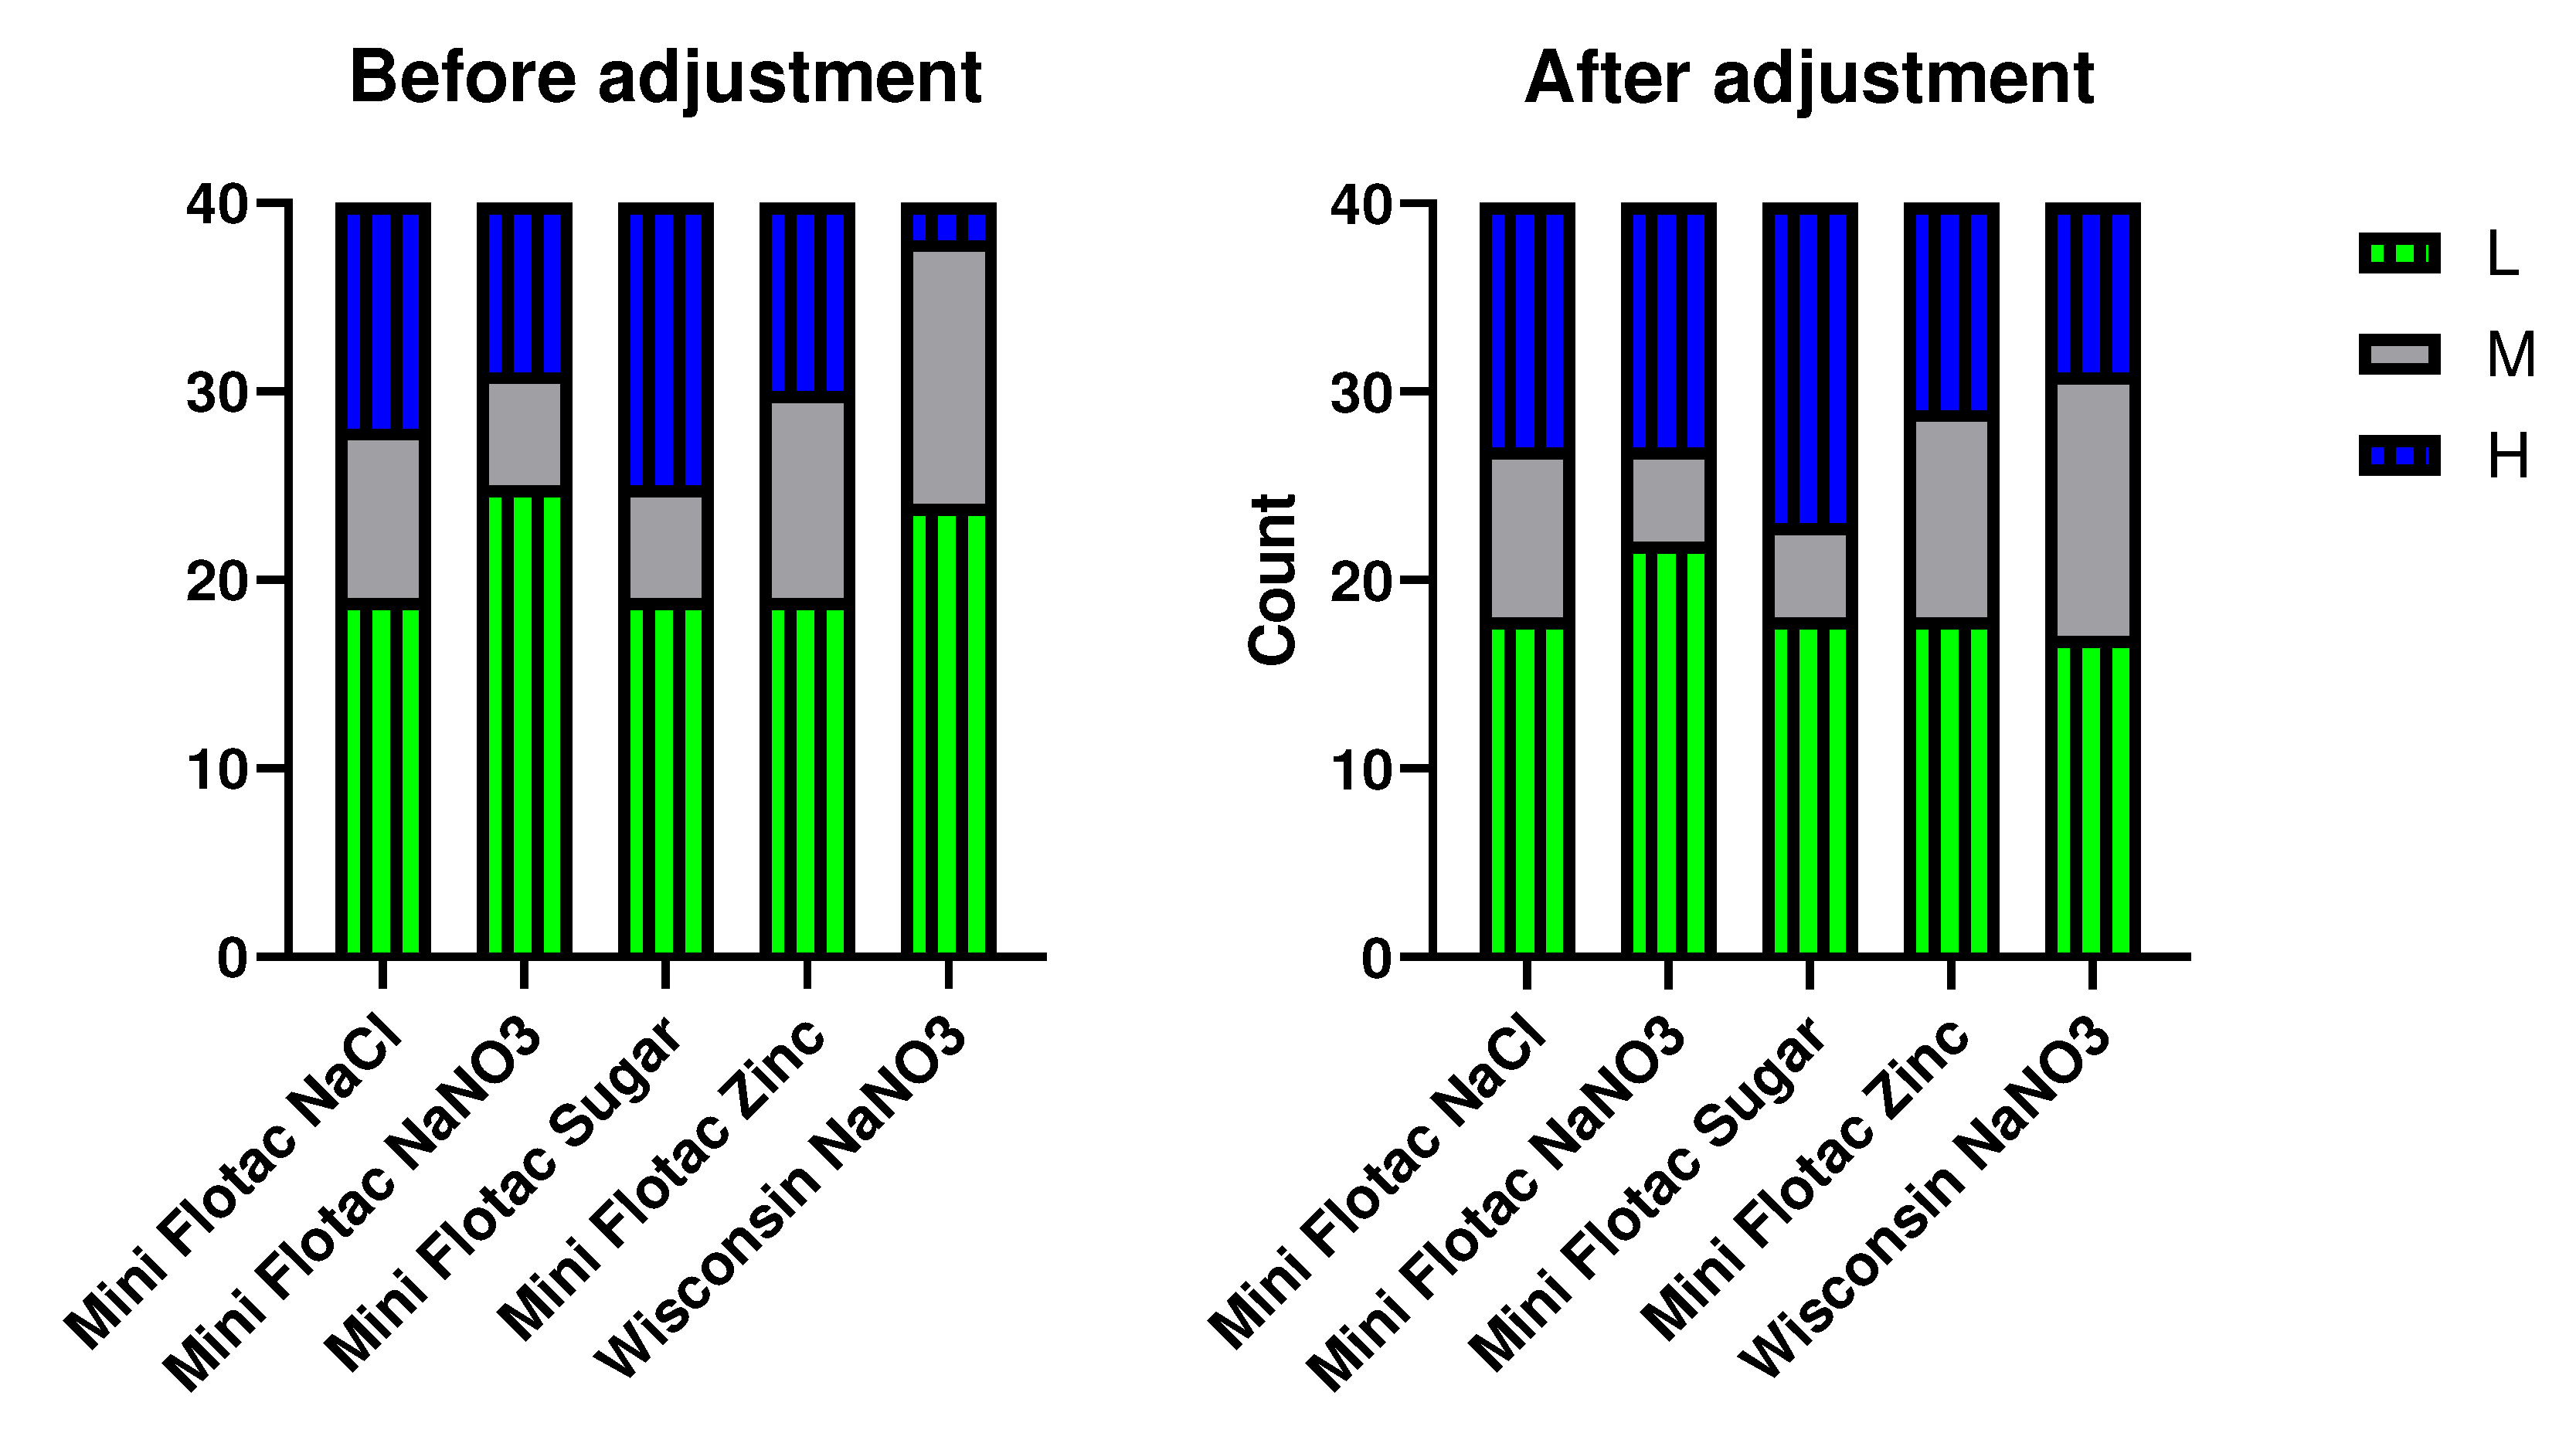
The raw estimates as well as the corrected estimates of EPG from 40 horses were categorized based on strongyle egg shedding categorization (Low = < 200 EPG; Moderate = 201-500 EPG; & Heavy = >500 EPG) based on the cut-offs as per AAEP guidelines. Contingency analysis for EPG categories, low(L), moderate (M), and heavy (H) was performed with raw and adjusted EPG estimates (
Figure 2). The median (range) kappa value across all comparisons was 0.54 (0.16-0.88). The adjustments equalized the categories to some extent though not perfectly to a median (range) kappa of 0.67 (0.51-0.85).
Figure 2.
Agreement of EPG categorization results (Low 0-200; Medium 201-500; Heavy >500) between the 5 selected methods (x-axis) before and after application of CF as determined by kappa analysis. 40 clinical samples indicated in y-axis.
Figure 2.
Agreement of EPG categorization results (Low 0-200; Medium 201-500; Heavy >500) between the 5 selected methods (x-axis) before and after application of CF as determined by kappa analysis. 40 clinical samples indicated in y-axis.
4. Discussion
Polystyrene beads were used as a proxy for strongyle eggs to primarily overcome the difficulty of procuring extracted/purified eggs for such a large-scale study. Initial validation to assess beads’ compatibility with horse fecal matrix and their ability to float in various floatation solutions of differing SPG proved their usefulness for such a study. One major hurdle was aliquoting the desired number of beads via manual titrations. However, bead sorting through the large object flow cytometer (BioSorter) obtained aliquots of appropriate concentrations needed for this study. The efficiency of BioSorter was verified manually by counting the sorted beads from a subset of aliquots that yielded satisfactory results. No residual beads observed stereo-microscopically in the vials after transferring them into fecal samples proved the completeness of the dispensing process.
An initial assay to determine the repeatability of all three FEC methods (modified Wisconsin, modified McMaster, Mini-FLOTAC) and their variants (based on the choice of floatation solution) was performed using three select bead standards (125, 500, and 1000). Accurate recovery of spiked beads and minimal coefficient of variations (CV%) among replicates must indicate the repeatability of the assays. In general, we observed low repeatability for all 12 tests as none had CV% closer to zero or recovered 100% of the spiked beads. Among the three methods, Mini-FLOTAC had a comparatively better CV% (average <28.3) and bead recovery average of >65%. Modified McMaster had a CV% of >40 for all variants except ZnSO4 and an improved % recovery of >90 for all variants except NaNO3. All variants of modified Wisconsin except sugar 1.33 had CV% >32 and average recovery as low as 44.6%. A larger CV% associated with modified Wisconsin and modified McMaster methods may negate the suitability of these techniques for a reliable bead count. The processing steps inherent to these two methods and the choice of floatation solution might have influenced the low and inconsistent recovery of beads. For example, NaNO3 1.33 SPG negatively affected beads recovery using the modified McMaster method but sugar 1.33 SPG positively impacted the modified Wisconsin method. Nevertheless, the Mini-FLOTAC method seems less influenced by the choice of flotation solution and had better repeatability parameters indicating its reliability for bead counts.
The regression curve assessment (linear behavior) of the 12 tests to recover the bead standards proved that no tests were linear as the slopes were not passing through zero (
Figure 2). The four variants of Mini-FLOTAC had some degree of precision in bead recovery, especially the sugar 1.33 variant, in which most replicates congregated closer toward the slope. Barring a few replicates, the rest other underestimated the bead count indicating the low sensitivity of Mini-FLOTAC. For the modified McMaster method, most replicates tend to disperse away from the slope indicating a loss of precision. However, this method seems sensitive, but many replicates overestimated spiked beads indicating a potential threat of false counts. The modified Wisconsin method variants seem precise in counting the lower bead standards whereas the higher tend to disperse away from the slope. All variants of the modified Wisconsin method are of low sensitivity as they underestimated the bead counts.
Regression analysis (coefficient of determination) determined the suitability of each of the 12 tests to recover beads mimicking the plausible range of strongyle EPG referred to in AAEP parasite control guidelines. All variants of Mini-FLOTAC and the NaNO3 1.33 variant of Modified Wisconsin had R2 >0.95 (closer to 1). Other tests had poor R2 values. Mini-FLOTAC sugar 1.33 performed better as the R2 value, and the slope were closer to 1. Although precise, the low sensitivity and less accuracy of Mini-FLOTAC sugar 1.33 may preclude it from designating as the gold standard test. Nonetheless, the correction factor (CF) determined for each test can be applied to the raw estimate to yield an adjusted estimate that should be closer to the expected count.
An accurate FEC test (i.e., estimates correctly) does not need a CF. A FEC test that is not sensitive (i.e., underestimates consistently) but precise (i.e., estimates sharply) need CF. Indeed, CF was intended for tests with high R2 (>0.95) to help standardize EPG counts. We applied CF to EPG from 40 clinical samples, determined by five different method modifications with R2 >0.95. Pearson correlation on the adjusted EPG counts pointed out Mini-FLOTAC method variants (ZnSO4 and NaCl) having the most correlations with others. Although the five method variants correlated positively, the CF adjustments did not equalize the EPG counts (as correlation ≠ 1). Alternatively, we studied the agreement between the five methods based on egg-shedding categories (low, moderate, heavy), as per AAEP guidelines, before and after CF adjustments. Interestingly, the EPG categories equalized to some extent between the five tests after CF adjustments. Equalizing the EPG counts based on AAEP egg shedding categories allows standardization of FEC methods. Further, this will facilitate meaningful approaches for targeted control of strongyle infection and effective management of anthelmintic resistance.
5. Conclusions
The diagnostic performance of FEC methods (modified Wisconsin, modified McMaster, and Mini-FLOTAC) and their variants (based on the choice of floatation solutions: NaCl 1.20 SPG, NaNO3 1.33 SPG, Sugar 1.33 SPG, and ZnSO4 1.18 SPG) differed considerably. Using polystyrene beads as a proxy for strongyle eggs, we proved that no method modifications behaved linearly in detecting bead standards mimicking the plausible range of EPG for horses. Regression analysis pointed out five tests (Mini-FLOTAC NaCl 1.20 SPG, Mini-FLOTAC NaNO3 1.33 SPG, Mini-FLOTAC sugar 1.33 SPG, Mini-FLOTAC ZnSO4 1.18 SPG, and modified Wisconsin NaNO3 1.33 SPG) with R2 and slope closer to 1 as suitable for FEC. Despite their suitability, the raw FEC estimate differed, and a correction factor determined for each test based on regression analysis was applied to standardize methodologies. Furthermore, equalizing the FEC results based on egg-shedding categories (low, moderate, and heavy) outlined in AAEP guidelines helped with standardization efforts. Selecting a suitable test with the application of the correction factor is the key to determining FEC. Adjusted FEC should form the basis for controlling and management of equine strongylosis.
Author Contributions
Conceptualization, M.L., S.M., H.W., and D.B.; methodology, M.L., S.M., H.W., D.M., C.S., J.H., and R.Y.; investigation, M.L., S.M., H.W., D.A., and D.B.; writing—original draft preparation, M.L., and S.M.; writing—M.L., and S.M; supervision, M.L.; funding acquisition, M.L., and D.B. All authors have read and agreed to the published version of the manuscript.
Funding
Funding for this project was provided by the National Center for Veterinary Parasitology (NCVP) – research grant program 2019 (Oklahoma State University Foundation #321805; OSP 91096).
Institutional Review Board Statement
Not applicable.
Informed Consent Statement
Not applicable.
Data Availability Statement
Not applicable.
Acknowledgments
We acknowledge Janice Liotta for her assistance in procuring polystyrene beads.
Conflicts of Interest
The funders had no role in the design of the study; in the collection, analyses, or interpretation of data; in the writing of the manuscript, or in the decision to publish the results.
References
- Matthews, J.B. Anthelmintic resistance in equine nematodes. Int J Parasitol Drugs Drug Resist. 2014, 4, 310–315. [Google Scholar] [CrossRef]
- Kaplan, R.M.K. Anthelmintic resistance in nematodes of horses. Vet Res. 2002, 33, 491–507. [Google Scholar] [CrossRef]
- Bodecek, S.; Jahn, P.; Dobesova, O.; Vavrouchova, E. Equine cyathostomosis: case reports. Veterinarni Medicina. 2010, 55, 187–193. [Google Scholar] [CrossRef]
- Corning, S. Equine cyathostomins: a review of biology, clinical significance and therapy. Parasit & Vectors. 2009, 6, 1–6. [Google Scholar] [CrossRef]
- Milillo, P.; Boeckh, A.; Cobb, R.; Otaranto, D.; Lia, R.P.; Perrucci, S.; Regalbono, A.F.D.; Beraldo, P.; Samson-Himmelstjerna, G.V.; Demeler, J.; Bartolini, R.; Traversa, D. Faecal Cyathostomin Egg Count distribution and efficacy of anthelmintics against cyathostomins in Italy: a matter of geography? Parasit & Vectors. 2009, 7, 1–7. [Google Scholar] [CrossRef]
- Lyons, E.T.; Tolliver, S.C.; Drudge, J.H. Historical perspective of cyathostomes: prevalence, treatment and control programs. Vet Parasitol. 1999, 85, 97–112. [Google Scholar] [CrossRef] [PubMed]
- Reinemeyer, C.R. Controlling Strongyle Parasites of Horses: A Mandate for Change. In Proceedings of the American Association of Equine Practioners (AAEP) conference. 2009, 55, 352–360. [Google Scholar]
- American Association of Equine Practioners. Internal Parasite Control Guidelines – Reviewed and updated 2019. Available online: https://aaep.org/document/internal-parasite-control-guidelines (accessed on 5th July 2023).
- Stratford, C.H.; McGorum, B.C.; Pickles, K.J.; Matthews, J.B. An update on cyathostomins: Anthelmintic resistance and diagnostic tools. Equine Vet J Suppl. 2011, 39, 133–139. [Google Scholar] [CrossRef] [PubMed]
- Relf, V.E.; Morgan, E.R.; Hodgkinson, J.E.; Matthews, J.B. Helminth egg excretion with regard to age, gender and management practices on UK Thoroughbred studs. Parasitology. 2013, 140, 641–652. [Google Scholar] [CrossRef] [PubMed]
- van Wyk, J.A. Refugia - overlooked as perhaps the most potent factor concerning the development of anthelmintic resistance. Onderstepoort J Vet Res. 2001, 68, 55–67. [Google Scholar] [PubMed]
- Lester, H.E.; Bartley, D.J.; Morgan, E.R.; Hodgkinson, J.E.; Stratford, C.H.; Matthews, J.B. A cost comparison of faecal egg count- directed anthelmintic delivery versus interval programme treatments in horses. Vet Rec. 2013, 173, 371. [Google Scholar] [CrossRef] [PubMed]
- Lester, H.E.; Matthews, J.B. Faecal worm egg count analysis for targeting anthelmintic treatment in horses: Points to consider. Equine Vet J. 2014, 46, 139–145. [Google Scholar] [CrossRef] [PubMed]
- Lucio-Forster, A.; Lejeune, M. Diagnostic Parasitology. In Georgis’ Parasitology for Veterinarians, 11th ed.; Bowman, D., Ed.; Elsevier: St. Louis, Missouri, United States, 2021; pp. 349–454. [Google Scholar]
- Barda, B.D.; Rinaldi, L.; Ianniello, D.; Zepherine, H.; Salvo, F.; Sadutshang, T.; Cringoli, G.; Clementi, M.; Albonico, M. Mini-FLOTAC, an Innovative Direct Diagnostic Technique for Intestinal Parasitic Infections: Experience from the Field. Plos Neglected Trop Dis. 2013, 7, e2344. [Google Scholar] [CrossRef] [PubMed]
- Lyons, E.T.; Tolliver, S.C.; Kuzmina, T.A. Investigation of strongyle EPG values in horse mares relative to known age, number positive and level of egg shedding in field studies on 26 farms in Central Kentucky (2010-2011). Parasitol Res. 2012, 110, 2237–2245. [Google Scholar] [CrossRef] [PubMed]
- Nielsen, M.K.; Reinemeyer, C.R. Handbook of equine parasite control, 2nd ed.; Wiley Blackwell: Hoboken, New Jersey, United States, 2018; pp. 113–140. [Google Scholar]
- Egwang, T.G.; Slocombe, J.O.D. Evaluation of the Cornell-Wisconsin Centrifugal Flotation Technique for Recovering Trichostrongylid Eggs from Bovine Feces. Can J comp Med. 1982, 46, 133–137. [Google Scholar] [PubMed]
- Turkson, P.K.; Ahafia, K.K. A comparison of modified McMaster and Brumpt‘s methods in assessment of nematode egg output in an N‘dama cattle herd. Acta Trop. 1994, 57, 341–344. [Google Scholar] [CrossRef] [PubMed]
- Levecke, B.; Behnke, J.M.; Ajjampur, S.S.R.; Albonico, M.; Ame, S.M.; Charlier, J.; Geiger, S.M.; Hoa, N.T.V.; Ngassam, R.I.K.; Kotze, A.C.; McCarthy, J.S.; Montresor, A.; Periago, M.V.; Roy, S.; Tchumente, L.A.T.; Thach, D.T.C.; Vercruysse, J. A Comparison of the Sensitivity and Fecal Egg Counts of the McMaster Egg Counting and Kato-Katz Thick Smear Methods for Soil-Transmitted Helminths. Plos Neglected Trop Dis. 2011, 5, e1201. [Google Scholar] [CrossRef] [PubMed]
- Kochanowski, M.; Dabrowska, J.; Karamon, J.; Cencek, T.; Osinski, Z. Analysis of the accuracy and precision of the McMaster method in detection of the eggs of Toxocara and Trichuris species in dog faeces. Folia Parasitol (Praha). 2013, 60, 264–272. [Google Scholar] [CrossRef] [PubMed]
- David, E.D.; Lindquist, W.D. Determination of the specific gravity of certain helminth eggs using sucrose density gradient centrifugation. J Parasitol. 1982, 68, 916–919. [Google Scholar] [CrossRef]
- Linnet, K. Necessary Sample Size for Method Comparison Studies Based on Regression Analysis. Clin Chem. 1999, 45, 882–894. [Google Scholar] [CrossRef]
|
Disclaimer/Publisher’s Note: The statements, opinions and data contained in all publications are solely those of the individual author(s) and contributor(s) and not of MDPI and/or the editor(s). MDPI and/or the editor(s) disclaim responsibility for any injury to people or property resulting from any ideas, methods, instructions or products referred to in the content. |
© 2023 by the authors. Licensee MDPI, Basel, Switzerland. This article is an open access article distributed under the terms and conditions of the Creative Commons Attribution (CC BY) license (http://creativecommons.org/licenses/by/4.0/).
