1. Introduction
Techniques that are based on obtaining spectral or other “fingerprints” of samples with their subsequent chemometric processing allow to solve various classification and discrimination tasks. Essentially, no particular analyte is determined is these methods; rather, the sample is treated as a whole by pattern recognition techniques. Fingerprinting methods are widely used in solving practical problems: revealing counterfeits, identifying the manufacturer or type of sample, determining freshness of food, recognition of disease by blood serum, etc. [
1,
2,
3].
Optical fingerprinting can rely on intrinsic absorbance of the samples, but more frequently it is performed by mixing the samples with a color-forming reagent [
4,
5,
6]. Similarly, fluorescent fingerprinting methods have been developing towards addition of fluorophores to samples [
7,
8]. A current trend in optical fingerprinting is involving another dimension: considering the time-course of color and fluorescent reactions [
9,
10,
11,
12,
13,
14,
15,
16]. The use of kinetic factor makes the fingerprinting technique more powerful. This approach which we have called “reaction-based fingerprinting” can help in recognizing samples of very close composition, for example, in determining the dose obtained by irradiated foods [
11] or recognizing rennet samples [
12]. The proposed technique belongs to kinetic methods of analysis [
17], which are based on the effect of sample components on the indicator reaction rate. The reasons for this effect may differ (catalysis, binding of the analyte to the metal ion - catalyst, interaction with radical centers of a chain reaction, etc.); the true mechanism is rarely known. It is only important that different components of the sample cause different changes in the color of the indicator system or its fluorescence intensity, which makes it possible to recognize the samples.
A popular class of dyes suitable for developing indicator reactions is carbocyanines that exhibit not only intense absorbance but also near-IR fluorescence. Carbocyanines can be oxidized, which entails changes in their color along with fluorescence fading; both these events can be monitored as a function of time without using full-spectrum instrumentation [
11,
18], which ensures simplicity of the method.
Fats and oils have been successfully recognized by fingerprinting methods based on various techniques: different types of chromatography [
19,
20,
21,
22], electronic nose [
23], IR spectroscopy [
24,
25,
26,
27], UV-vis absorbance spectra [
28] and fluorescence [
19,
24,
29]. Motor oils have been a popular type of samples for developing recognition and discrimination techniques. They can be recognized by their color [
30], by IR spectroscopy [
31] and fluorescence [
32,
33]. Reaction-based fingerprinting methods have not yet been applied to fat-soluble samples, which is due to incompatibility of the aqueous-based indicator reactions with the hydrophobic nature of fats and oils.
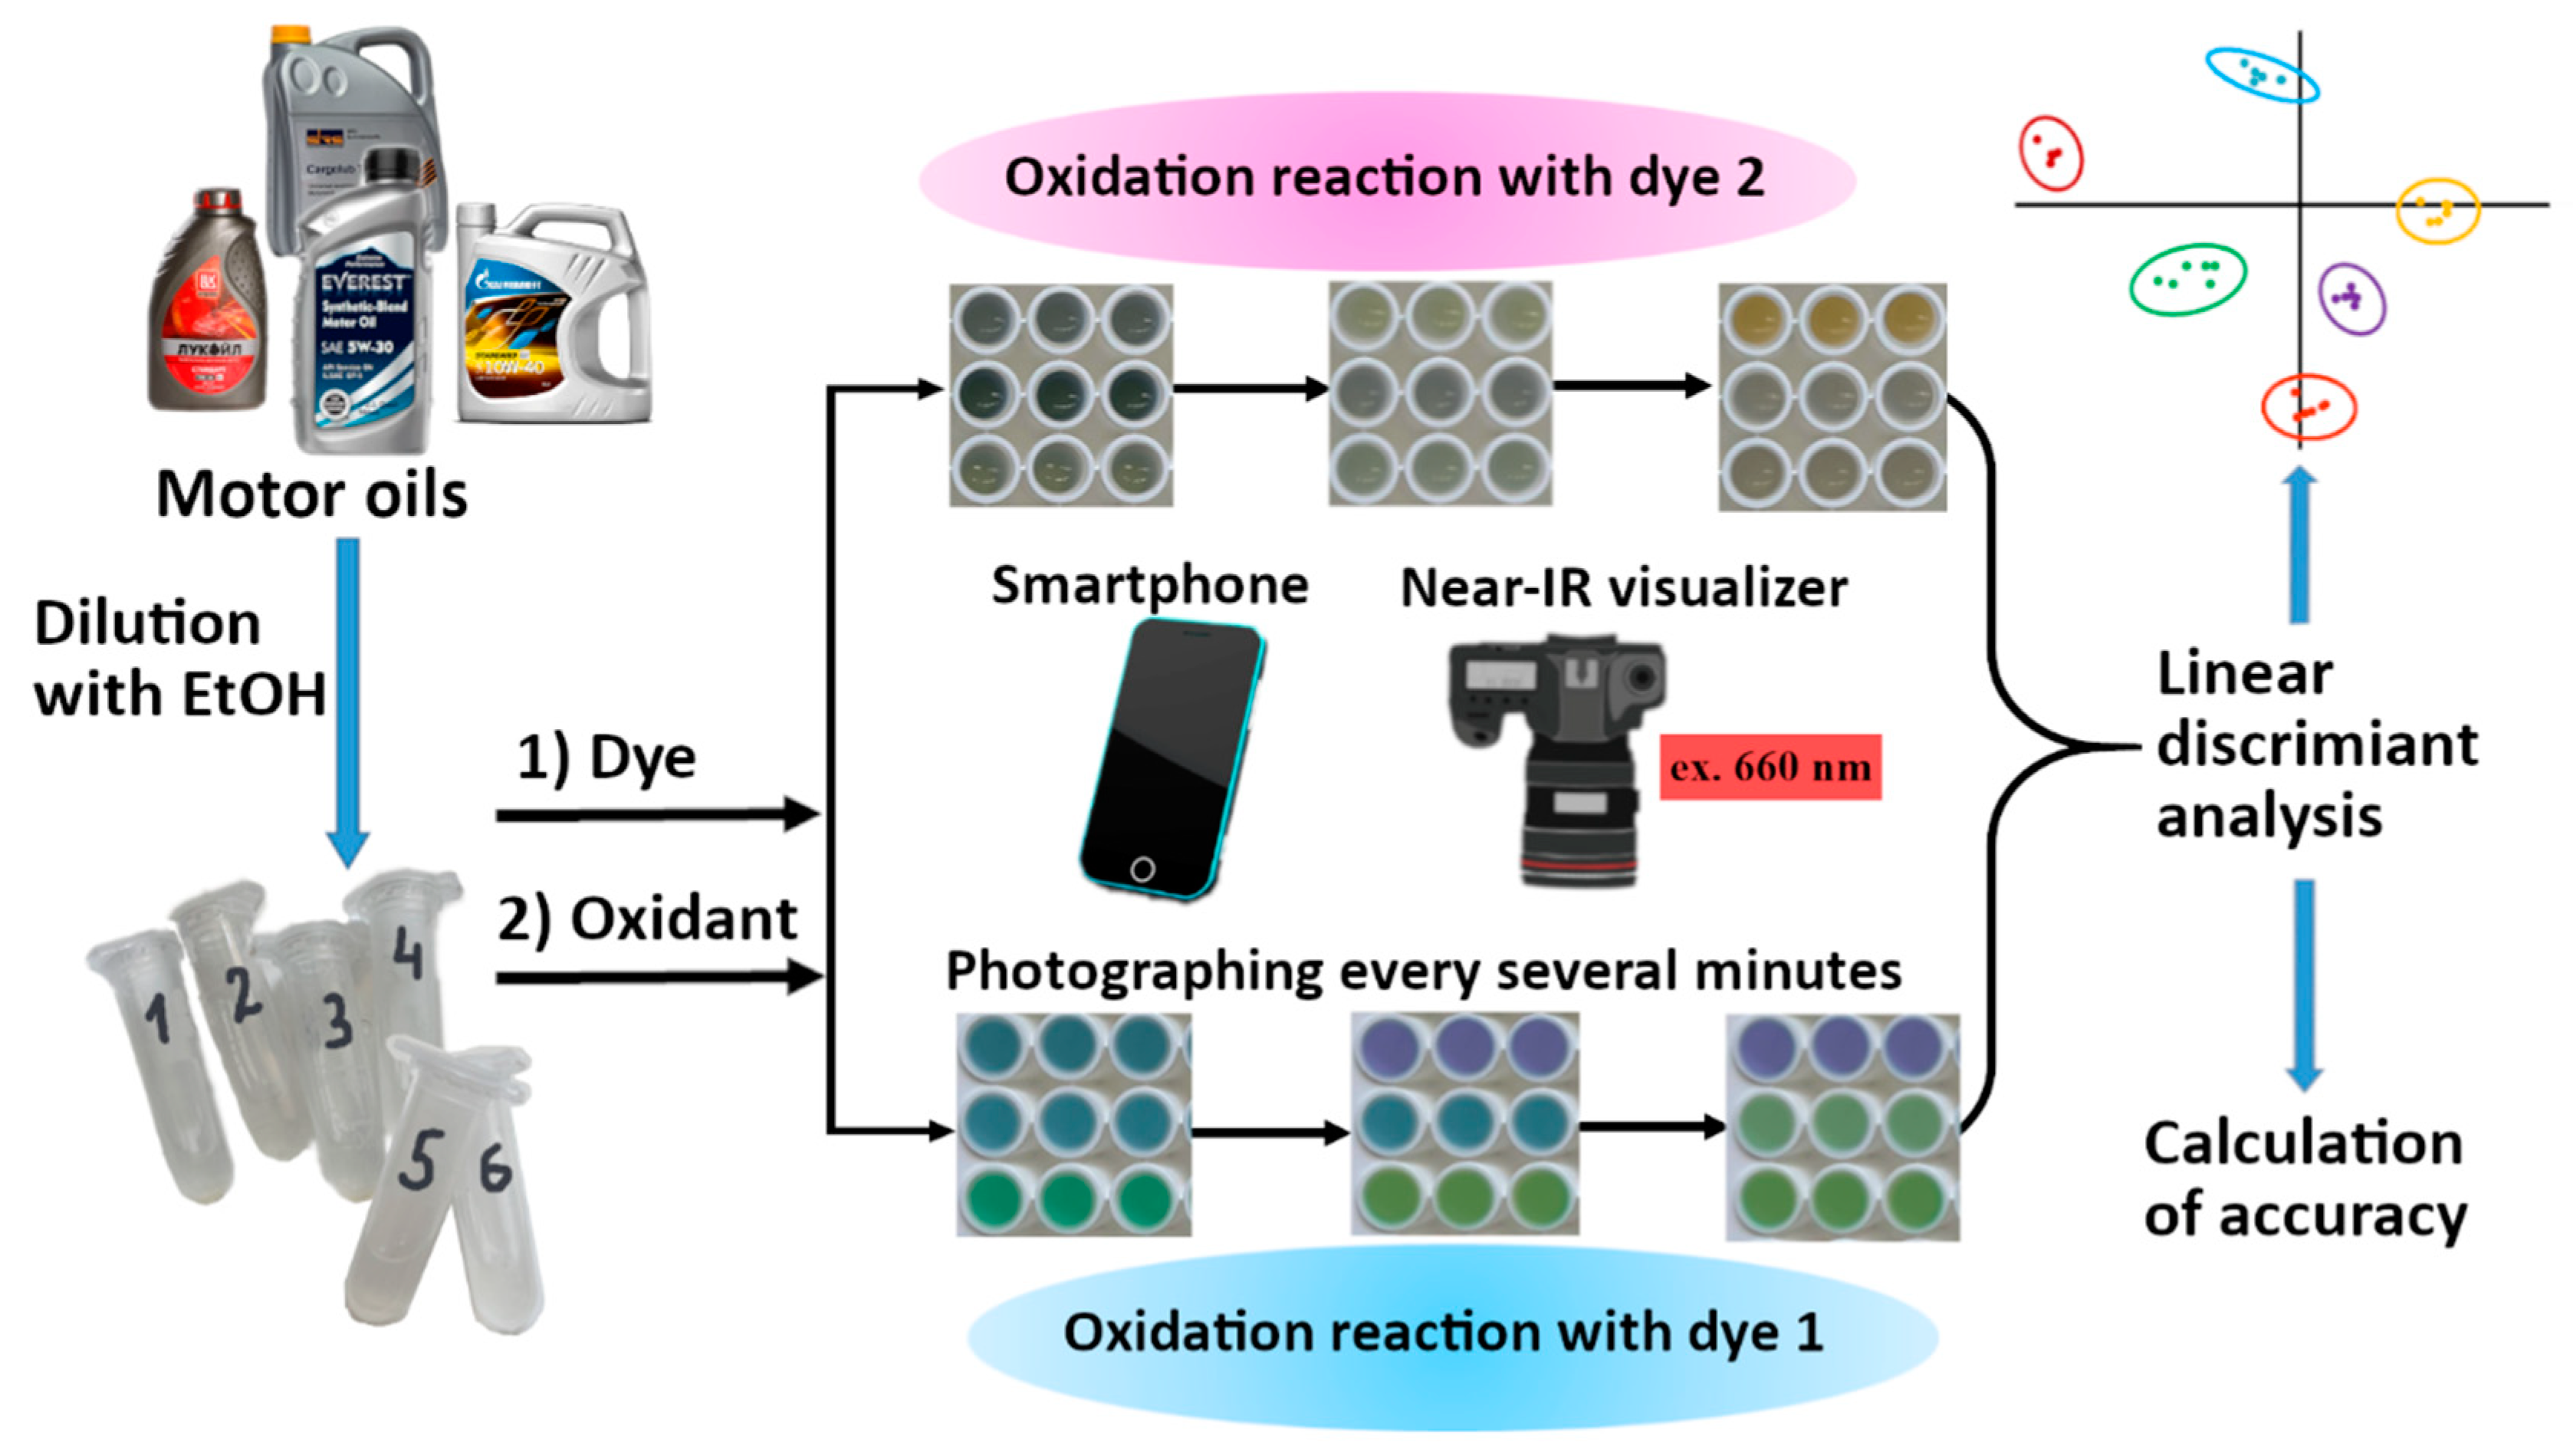
The purpose of the present work was the development of methodology for recognizing oil-soluble samples by reaction-based optical fingerprinting method. The tasks of this study involved the choice of redox indicator reactions occurring in solutions with relatively low water content (in which oil samples do not form a separate phase) and application of these reactions as indicator processes for the discrimination of 6 motor oils of 4 manufacturers. We aimed to develop a technically simple protocol, in particular, we wished to demonstrate the feasibility of using a smartphone camera instead of stationary equipment. One of the tasks was to use non-discriminative indicator reactions for recognition purposes by merging their data. The principle of the proposed method is shown in
Scheme 1.
2. Materials and Methods
2.1. Samples and Reagents
Synthetic motor oils of four manufacturers were provided by a local vendor (
Table 1). Each of the high-end SRS 5W30, 5W40, and 10W40 oils has its cheaper analog (LUK, EVE, and GAZ, respectively). Carbocyanine dye
1 (Cy7-hydrazine, CAS No 2183440-61-9) was purchased from Lumiprobe (Hunt Valley, MD, USA,
https://www.lumiprobe.com/), dye
2 was synthesized by authors according to published strategies (see ESI for the synthetic protocol and spectral data). Ethanol was from Bryntsalov-A (Moscow, Russia), t-butyl hydroperoxide (t-BuOOH) was received from Sigma as 5M solution in
n-decane. Other reagents were obtained from Sigma and used as received.
2.2. Instrumentation
Indicator reactions were conducted in 96-well fluorimetric plates (Nunc F96 MicroWell, white, Thermo Scientific, Waltham, MA, USA, cat. No. 136101, or Sovtech, Novosibirsk, Russia, cat. No. M-018). The reaction mixtures in the wells were photographed by a smartphone camera. The UV-vis spectra were recorded using an SF-102 spectrophotometer (Interfotofizika, Moscow, Russia) in 0.2 cm × 1.0 cm quartz cells (internal volume of 0.5 mL and an optical path length of 1 cm). Fluorescence spectra were obtained using a “Fluorat-02 Panorama” spectrofluorimeter (Lumex, St.-Petersburg, Russia). Near-infrared (NIR) fluorescence of the reaction mixtures was monitored using a home-made NIR visualizer [
18] containing 11 red LEDs (660 nm) with a power of 3 W as a light source (Minifermer, Moscow, Russia) and a Nikon D80 camera with a light filter cutting off visible light up to 700 nm.
2.3. General Procedures
The motor oils were mixed with absolute ethanol in 1:29 (v/v) ratio and stored for a day, after which an insignificant residue was formed which was later discarded. The obtained ethanolic solutions were used as oil samples throughout the study. The 1M solution of HCl in ethanol was prepared by mixing a concentrated aqueous solution of HCl (10 M) with absolute ethanol (1:9, v/v). To prepare aqua regia as oxidant, a 1:15 mixture (v/v) of concentrated aqueous solutions of HCl (10 M) and HNO3 (70%, m/m) was prepared and stored 24 h before use. Copper(2+) solutions were obtained from 1 M CuSO4 aqueous solution by dilution with absolute ethanol. 0.5 M t-BuOOH solutions were prepared from its 5 M soltuion in n-decane by dilution with absolute ethanol.
To conduct the indicator reaction in a 96-well plate, each oil sample was filled in 6 wells (to obtain 6 replicates), and all other reactants were added by pipetting in the sequence shown in
Table 2 (8-channel pipettes were used). The moment of adding of the last reactant was considered as the reaction start. Every several minutes two kinds of images were captured for each plate: (1) a visible photograph to monitor light absorption and reflection; (2) a photograph in NIR region in the home-made visualizer to monitor the fluorescence intensity under the red light excitation.
2.4. Data processing
The photographic images were digitized using the ImageJ 2.0.0-rc-61/1.51n software (Fiji), which yielded the mean intensities corresponding to the central spots of individual wells. RGB splitting was performed to obtain red, green, and blue channel intensities (R, G, B) for the visible light photographs; for NIR fluorescence images, only the overall black-and-white intensity was measured. The intensities (that varied within 0–255) were organized into data tables where columns represented different channels and different reaction times (up to 43 columns for one indicator reaction); the rows of the table represented the 6 oil samples measured 6 times each, which gave 36 rows of data (further a row of the data table will be called an observation).
Table S1 shows an example of a data table.
The data organized in the described way were subjected to linear discriminant analysis (LDA) or k-nearest neighbors algorithm (kNN) using the XLSTAT add-on for Microsoft Excel (Addinsoft, New York, NY, USA). The following conditions for LDA analysis were found to be the most appropriate: within-class covariance matrices were assumed to be equal; the stepwise (backward) model selection was activated with the threshold value of 0.05 to include the variable and 0.10 to leave it out. The conditions of kNN algorithm included the use of Euclidean type of distances and automatic determination of the number of neighbors based on cross-validation (the number of neighbors usually varied between 3–5). A significance level of 5% was used in the study.
LDA and kNN are supervized techniques in which the software is informed about the assignment of the observations to classes (in this study, there are 6 classes corresponding to 6 oils). The accuracy of discrimination of the samples was assessed by using a validation procedure. For validation, the observations are divided into training and validation sets; the validation set is not used in constructing the model. During each LDA run, the software randomly selected 6 observations (out of the total number of 36) as validation set (for example, two observations from 1
st oil, one from 2
nd oil, 0 from the 3
rd oil, etc), and the LDA model was constructed using the remaining 30 observations. According to the model, the software assigned each test observation to one of the 6 classes. As a result of such assignment, a confusion matrix was constructed (
Table S2 in ESI), where the relationship between the true class and predicted class for each observation could be seen. The percent accuracy of discrimination was then calculated as the number of correctly assigned observations to the total number of observations in the validation set. The LDA procedure was performed not less than 5 times for the dataset (for some data, 10 times), and the obtained values of accuracies were averaged to give the mean value of accuracy, that was used to characterize the dataset (an indicator reaction or their combination).
For the kNN algorithm, the validation protocol was similar with the difference that no automatic random selection of a validation set was available in the software; instead, we maually moved one of the six observations of each sample to the validation set. For example, to compose the first validation set, we removed first observation from the 1st sample, second observation from the 2nd sample, etc, and 6th observation from the 6th sample. To compile another validation set, we removed the second observation from the 1st sample, the third from the 2nd sample, etc. The composed validation sets were used each in an independent run of the software to determine the discrimination accuracy.
3. Results and Discussion
3.1. Choice of indicator reactions
Redox-type processes, such as the oxidation of dyes with peroxides or peracids, have proved to be efficient in solving recognition tasks by reaction-based methods [
9,
10,
11,
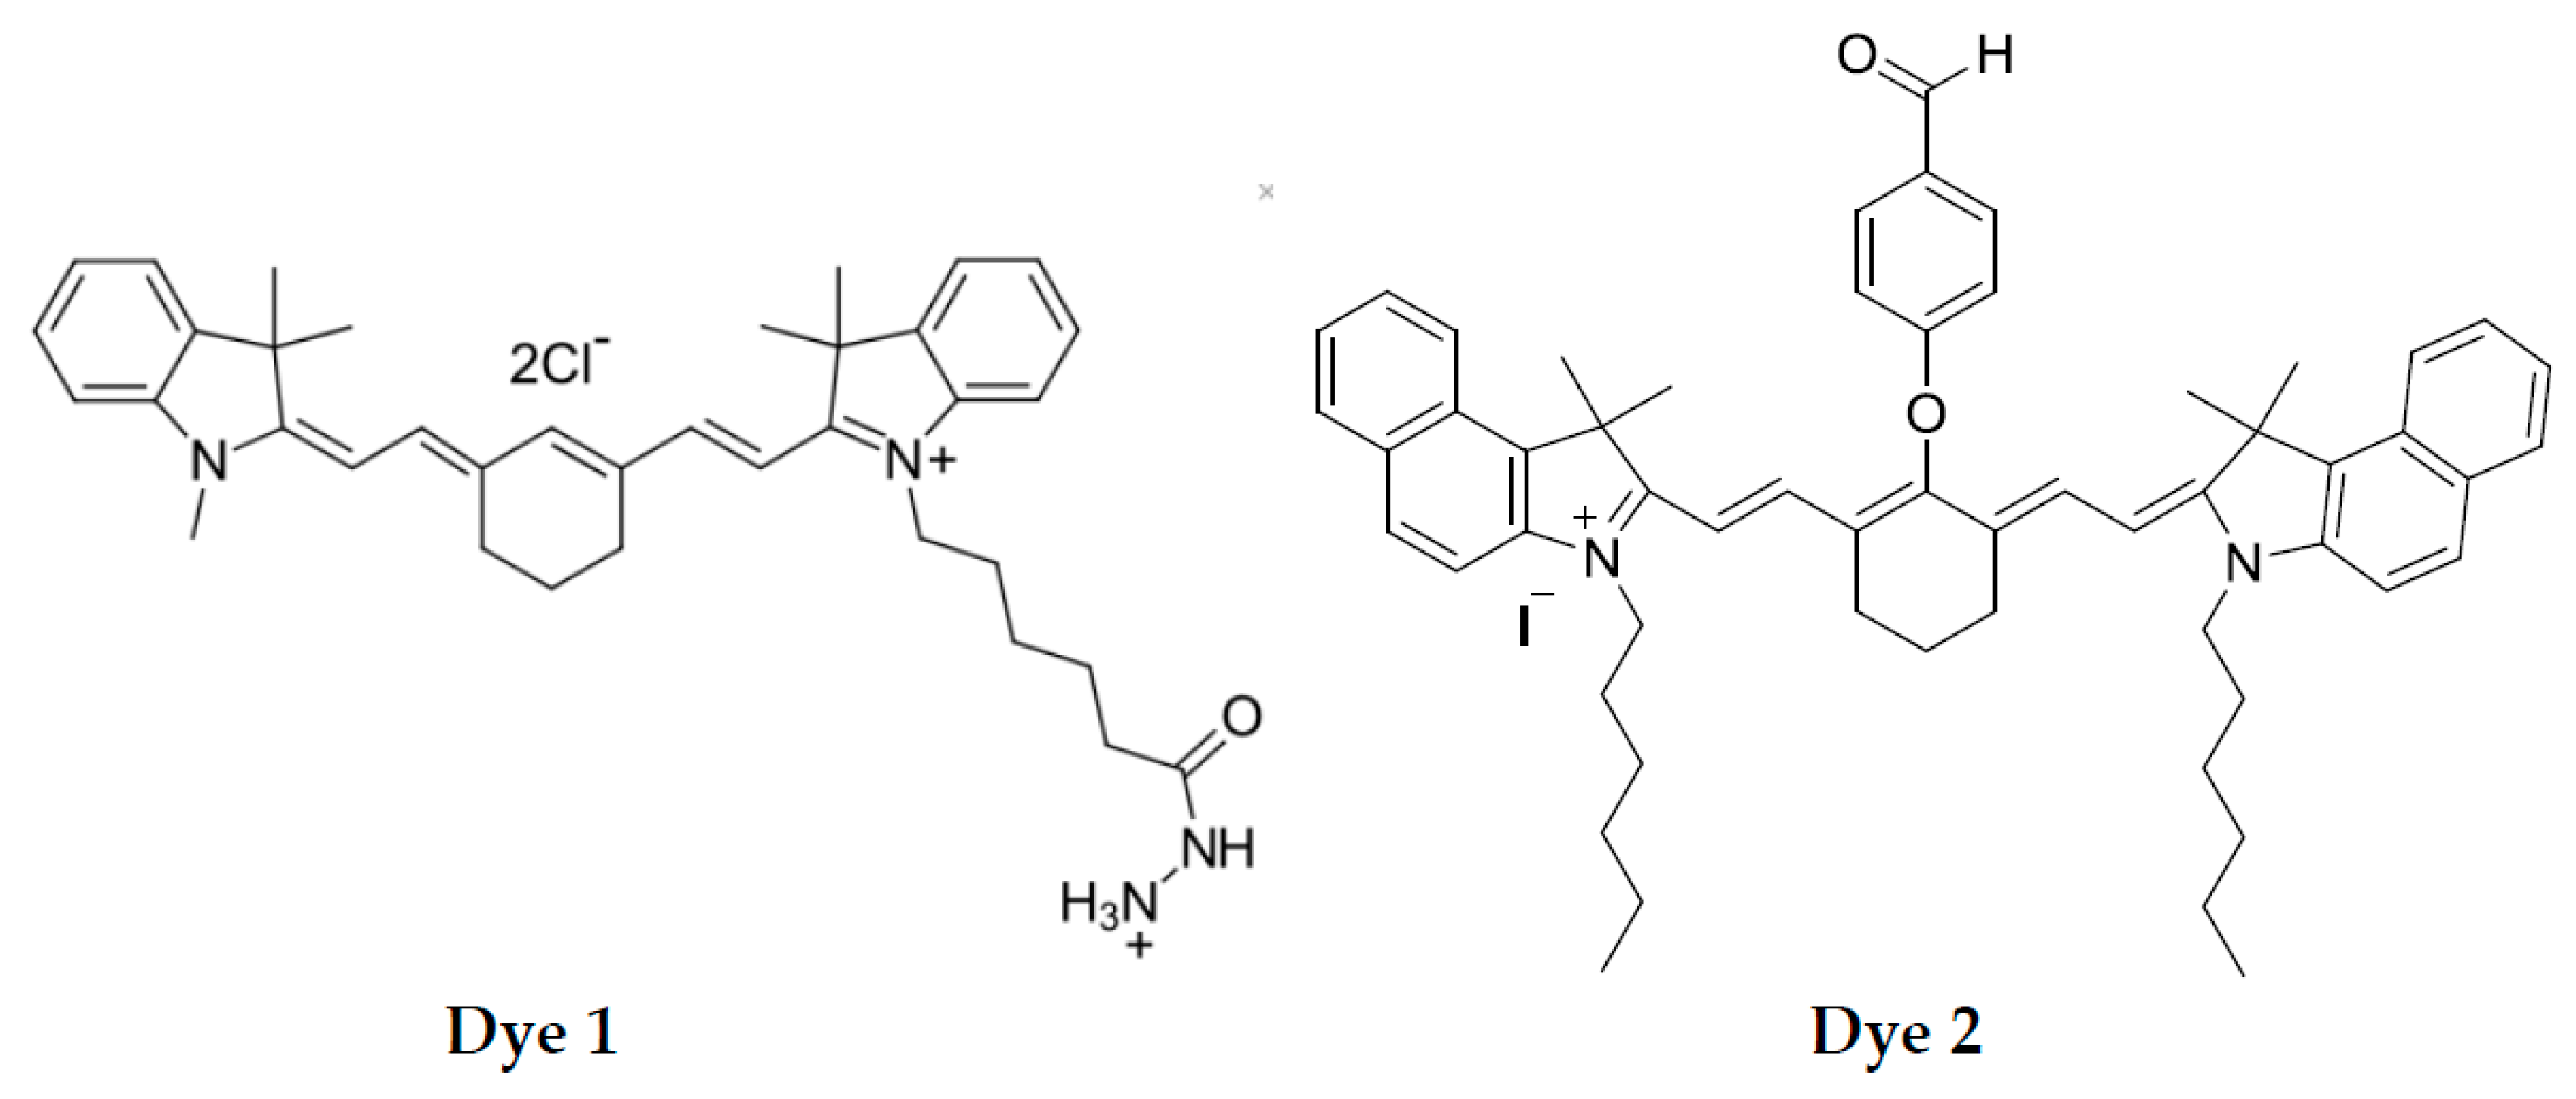
12]. Carbocyanine dyes were successfully used for these purposes, as changes in both their absorbance and fluorescence can be measured. We noticed that carbocyanine dyes with reducing side groups can be oxidized under milder conditions than the dyes without such groups. A possible reason for that is production of active radicals in the oxidation of the side groups; these radicals can further initiate the oxidation of the polymethine chain of the carbocyanine dye entailing its color change and fluorescence fading. The structures of carbocyanine dyes with reducing side groups used in this study are given in
Scheme 1.
The task of developing new indicator processes was to conduct a redox reaction in a medium with a sufficiently low water content, in which the oil components would remain in solution. A number of oxidants were tested for the oxidation of dyes
1 and
2 in ethanol: fat-soluble (tert-butyl hydroperoxide), water-soluble (nitric acid and the mixture of HCl and HNO
3 – aqua regia) and atmospheric oxygen (the list of indicator reactions is given in
Table 2), all reactants were added in the form of ethanolic solutions. For most reactions, water was supplied only with the 1M ethanolic solution of HCl and/or Cu
2+ solution, which brought about less than 0.7 mg of water per a well. More water was introduced with aqueous aqua regia (up to 20 µL/well) and concentrated HCl for the reaction of dye
1 with oxygen (40 µL/well), but it still did not cause phase separation.
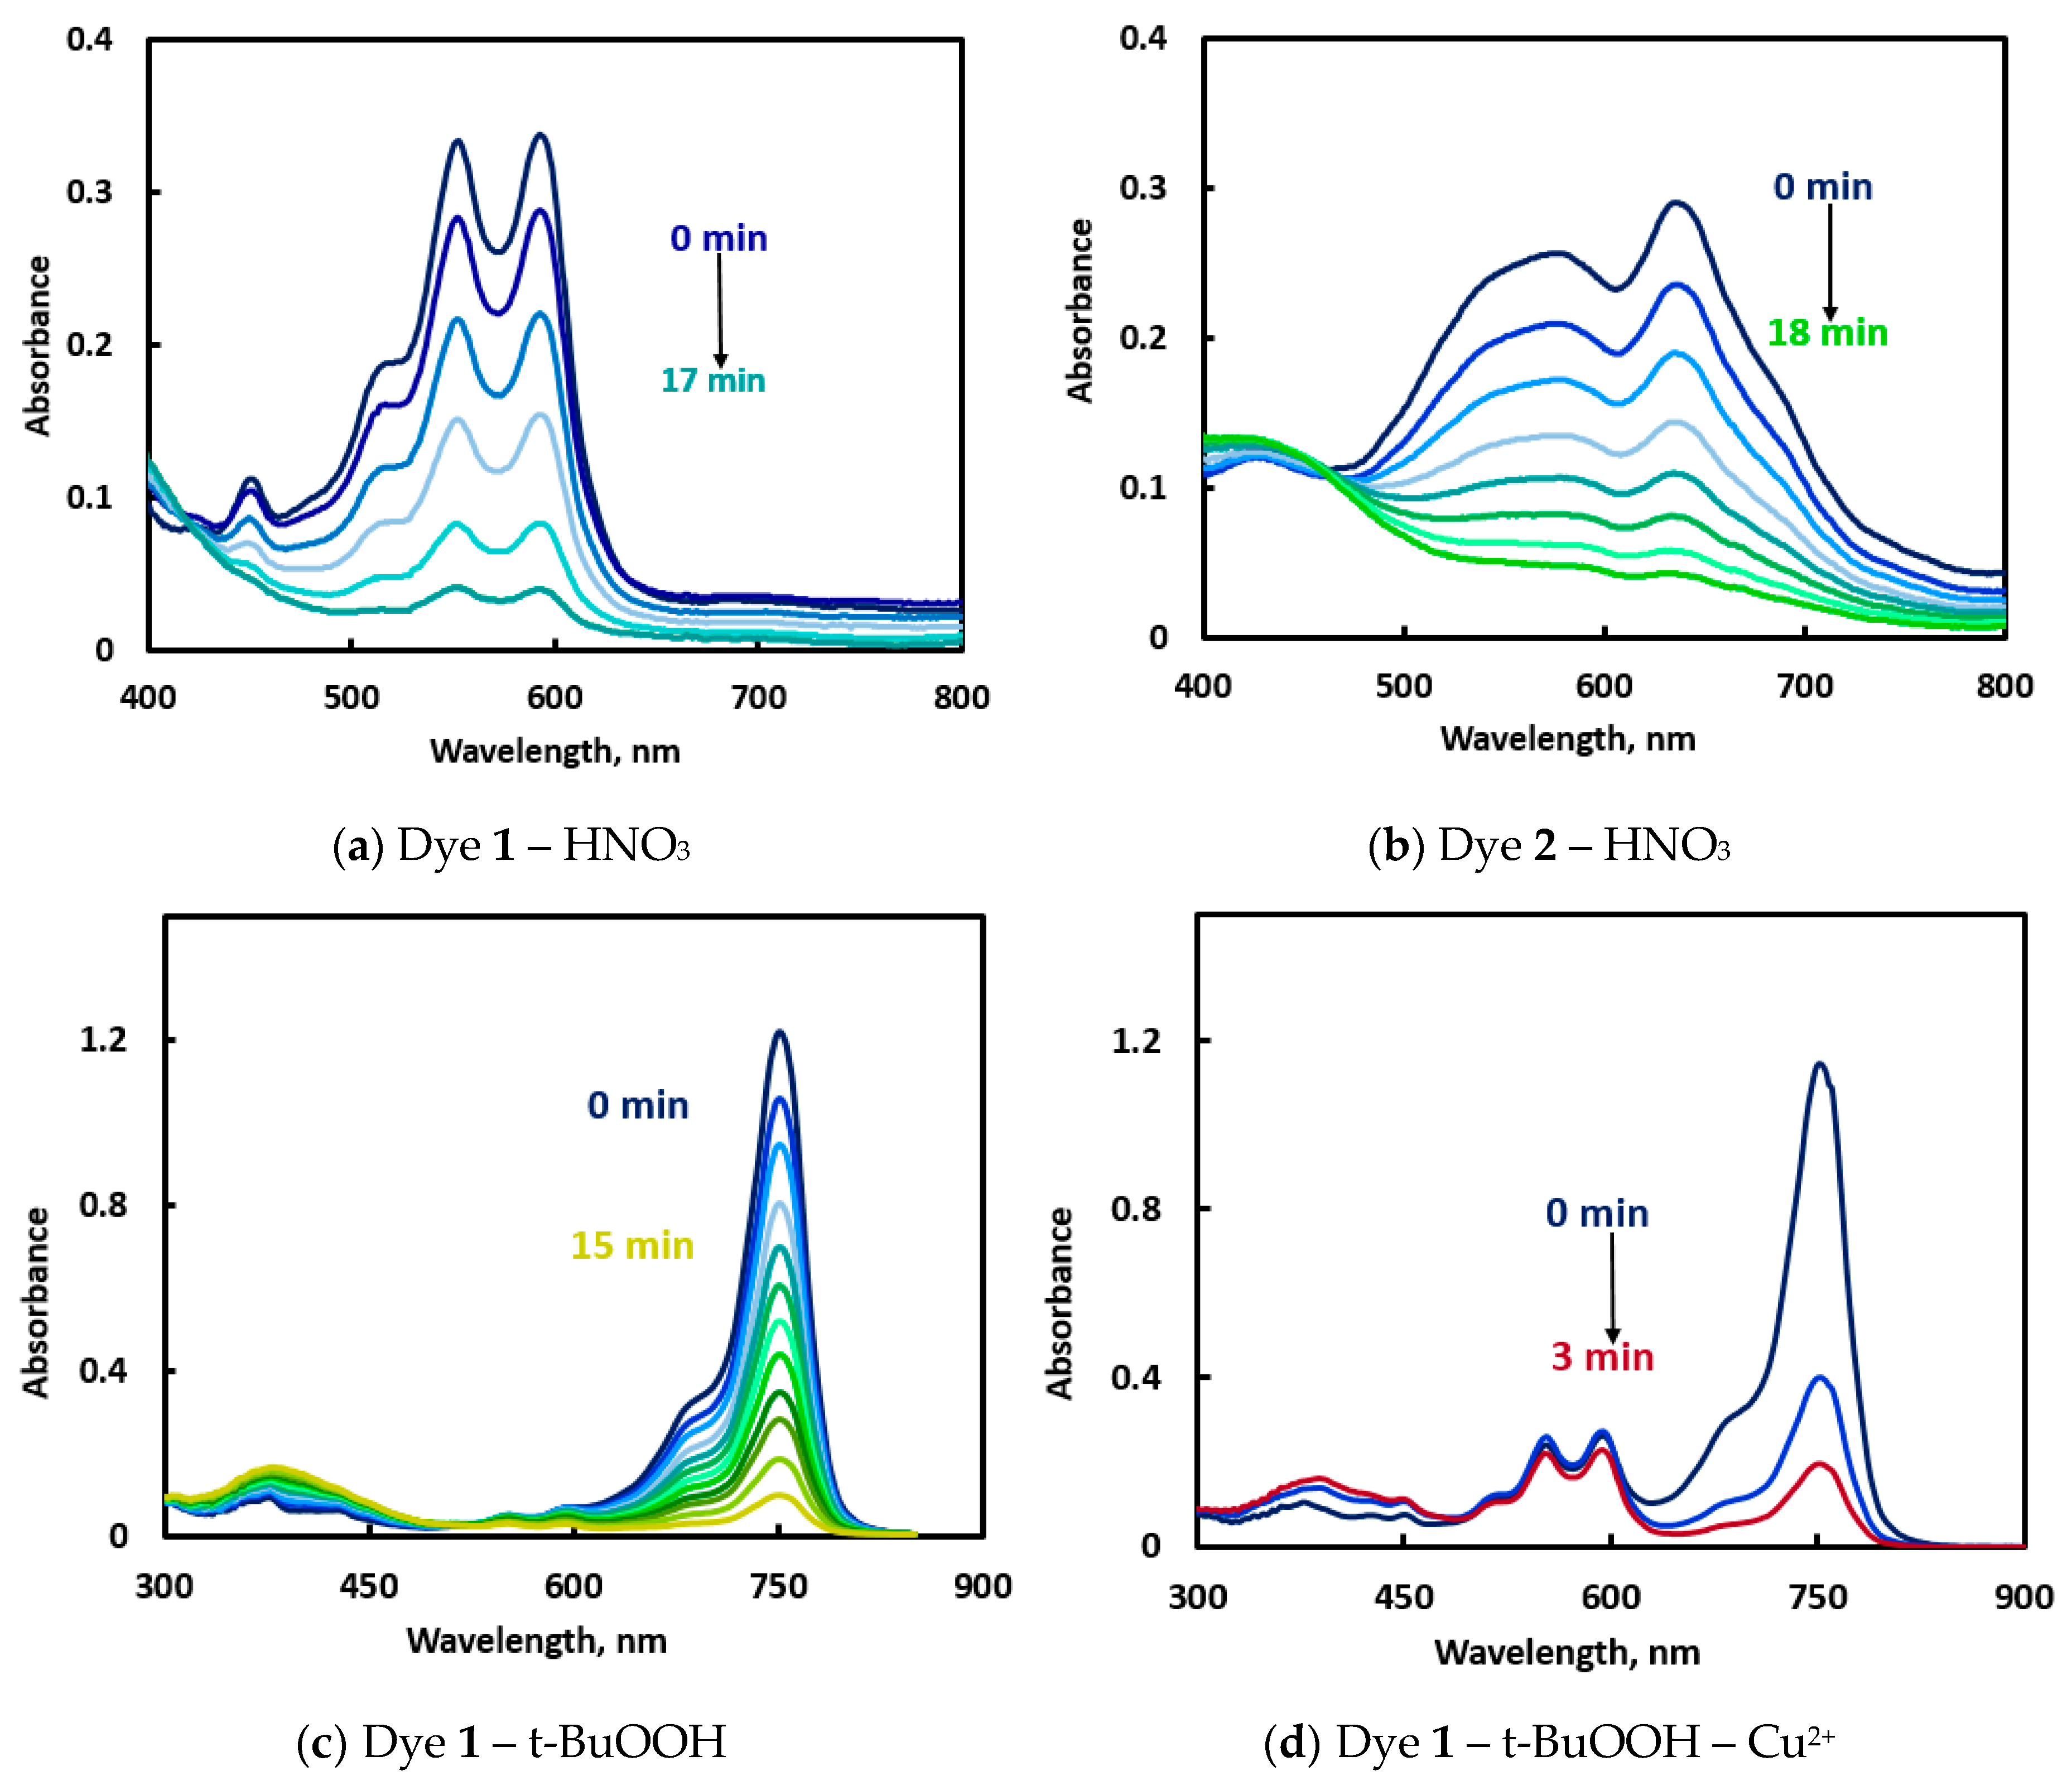
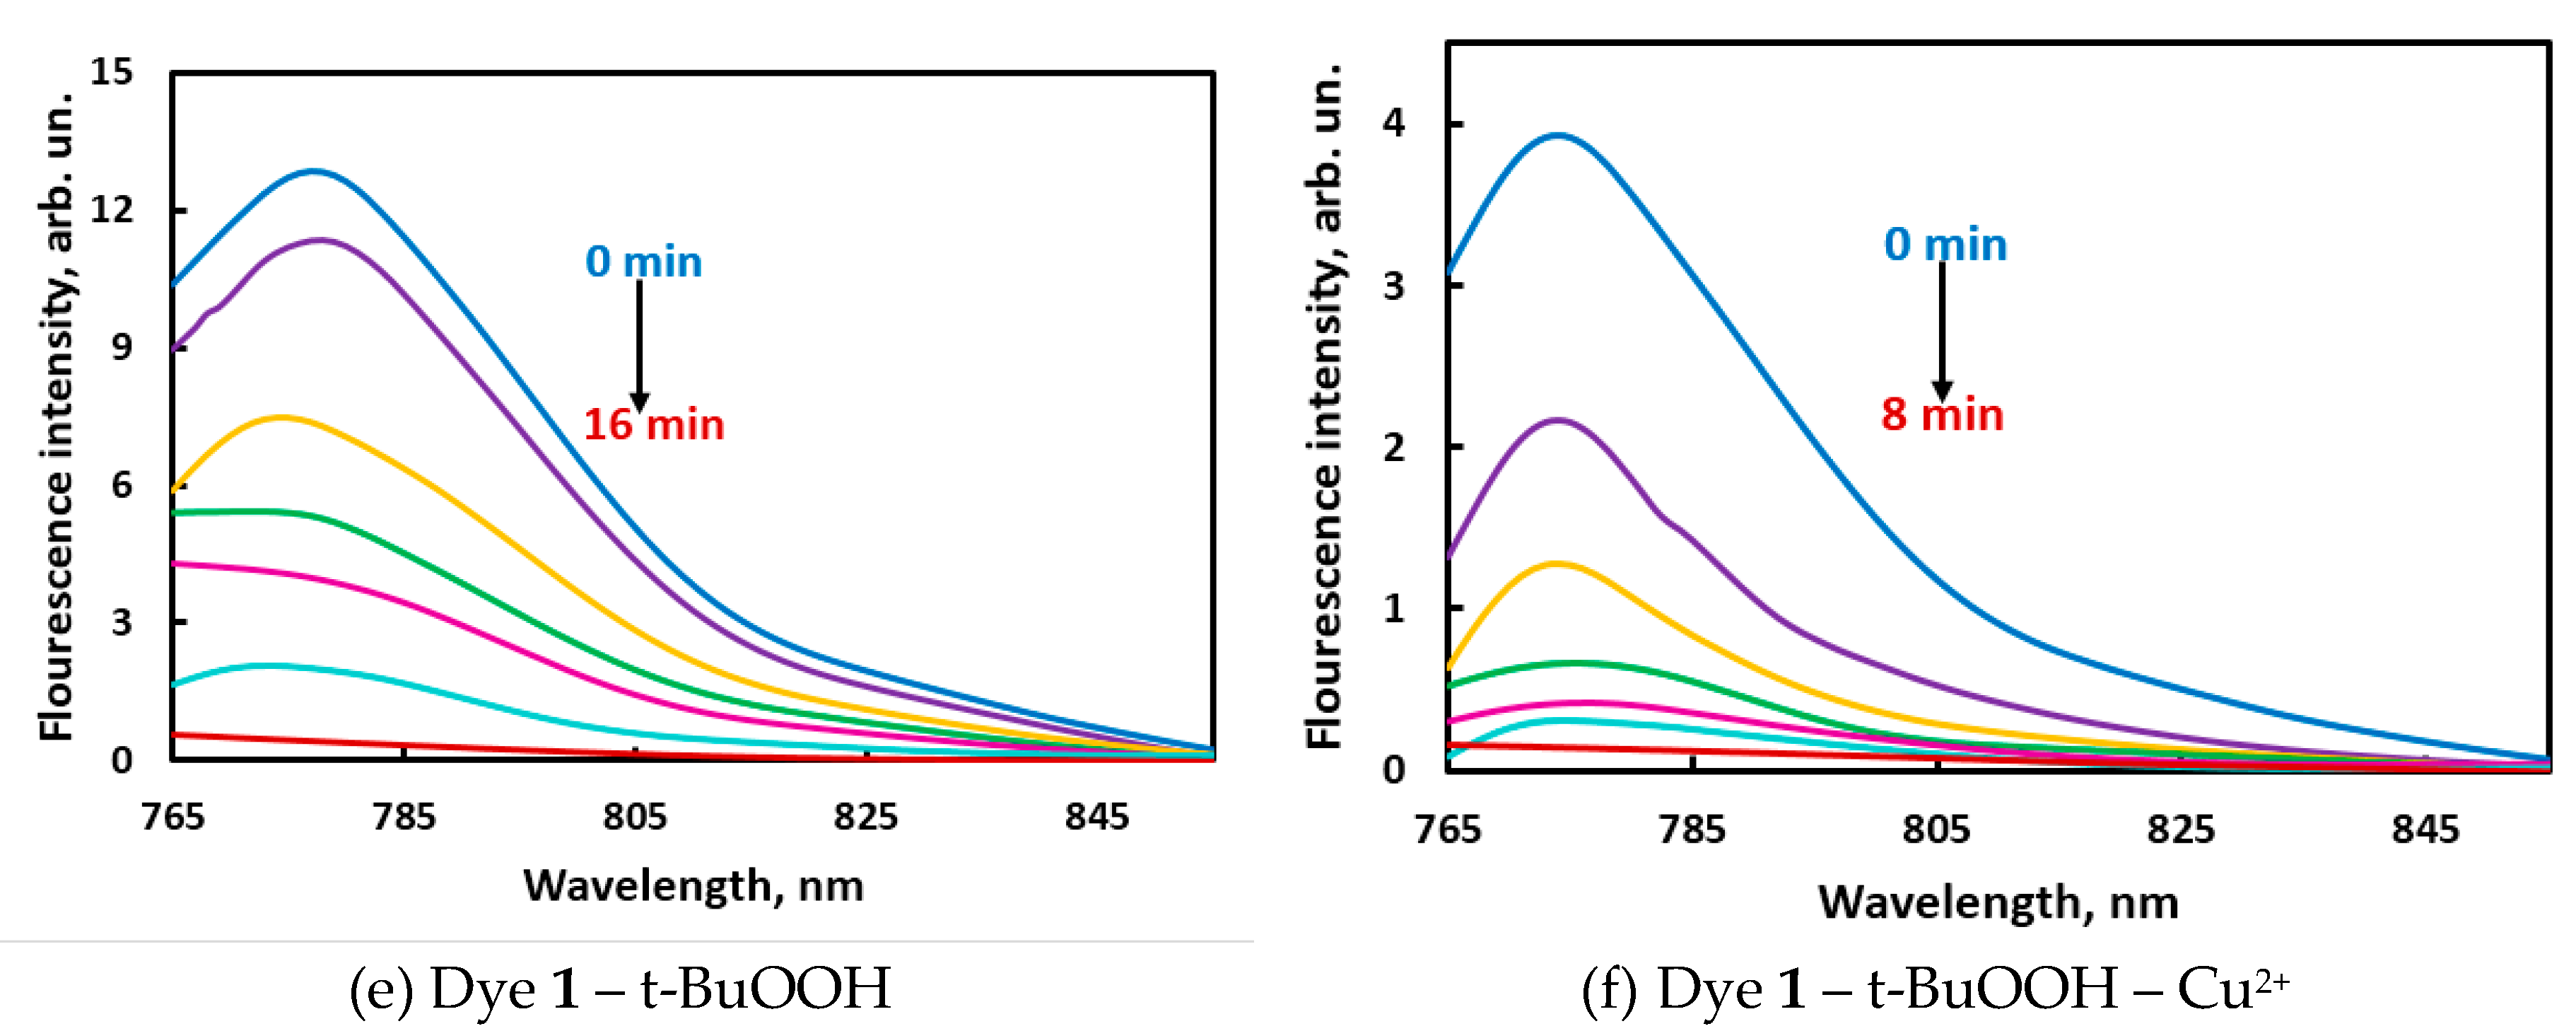
In preliminary experiments, the amounts of reactants were selected so that the reaction rates could be conveniently monitored (measurement time should not exceed 1 hr). To observe the time course of the reactions, the solutions were placed in the quartz cells for the full-spectrum measurements. Both dyes demonstrated spectral changes under the action of oxidizing agents: the main absorption bands became less intense with time and approached zero within 7–40 min (
Figure 1 and
Figure S1 in ESI). Introduction of copper(2+) to the systems with t-BuOOH accelerated the oxidation of dyes (
Figure 1d, f vs.
Figure 1c,e), sometimes along with a spectral shift (
Figure 1c vs.
Figure 1d). NIR fluorescence intensities were only taken into account for the reactions with t-BuOOH (
Figure 1e,f) but not with HNO
3. For practical applications, the time of measurement should be neither too long (to keep the method from becoming time-consuming) nor too short (it should be much longer than the time of adding the last component to all samples in the 96-well plate). The reaction rates observed in the studied systems were supposed to be applicable for conducting the reaction in the presence of motor oils.
In some systems, the time of color change (
Figure 1c,d) differed from the time required for complete fluorescence fading under the same conditions (
Figure 1e,f). This phenomenon can be possibly explained by the formation of different products of partial oxidation, each of which has its own absorbance and fluorescence spectrum and its individual rate of further oxidation. Such complexity of oxidation reactions may help in solving discrimination tasks, if absorbance and fluorescence intensities act as independent variables.
3.2. Indicator reactions in the presence of oil samples
The key feature of the indicator process in reaction-based fingerprinting is its ability to change its rate in the presence of samples. We tested the proposed reactions with the motor oil samples in the 96-well plates according to the protocol given in
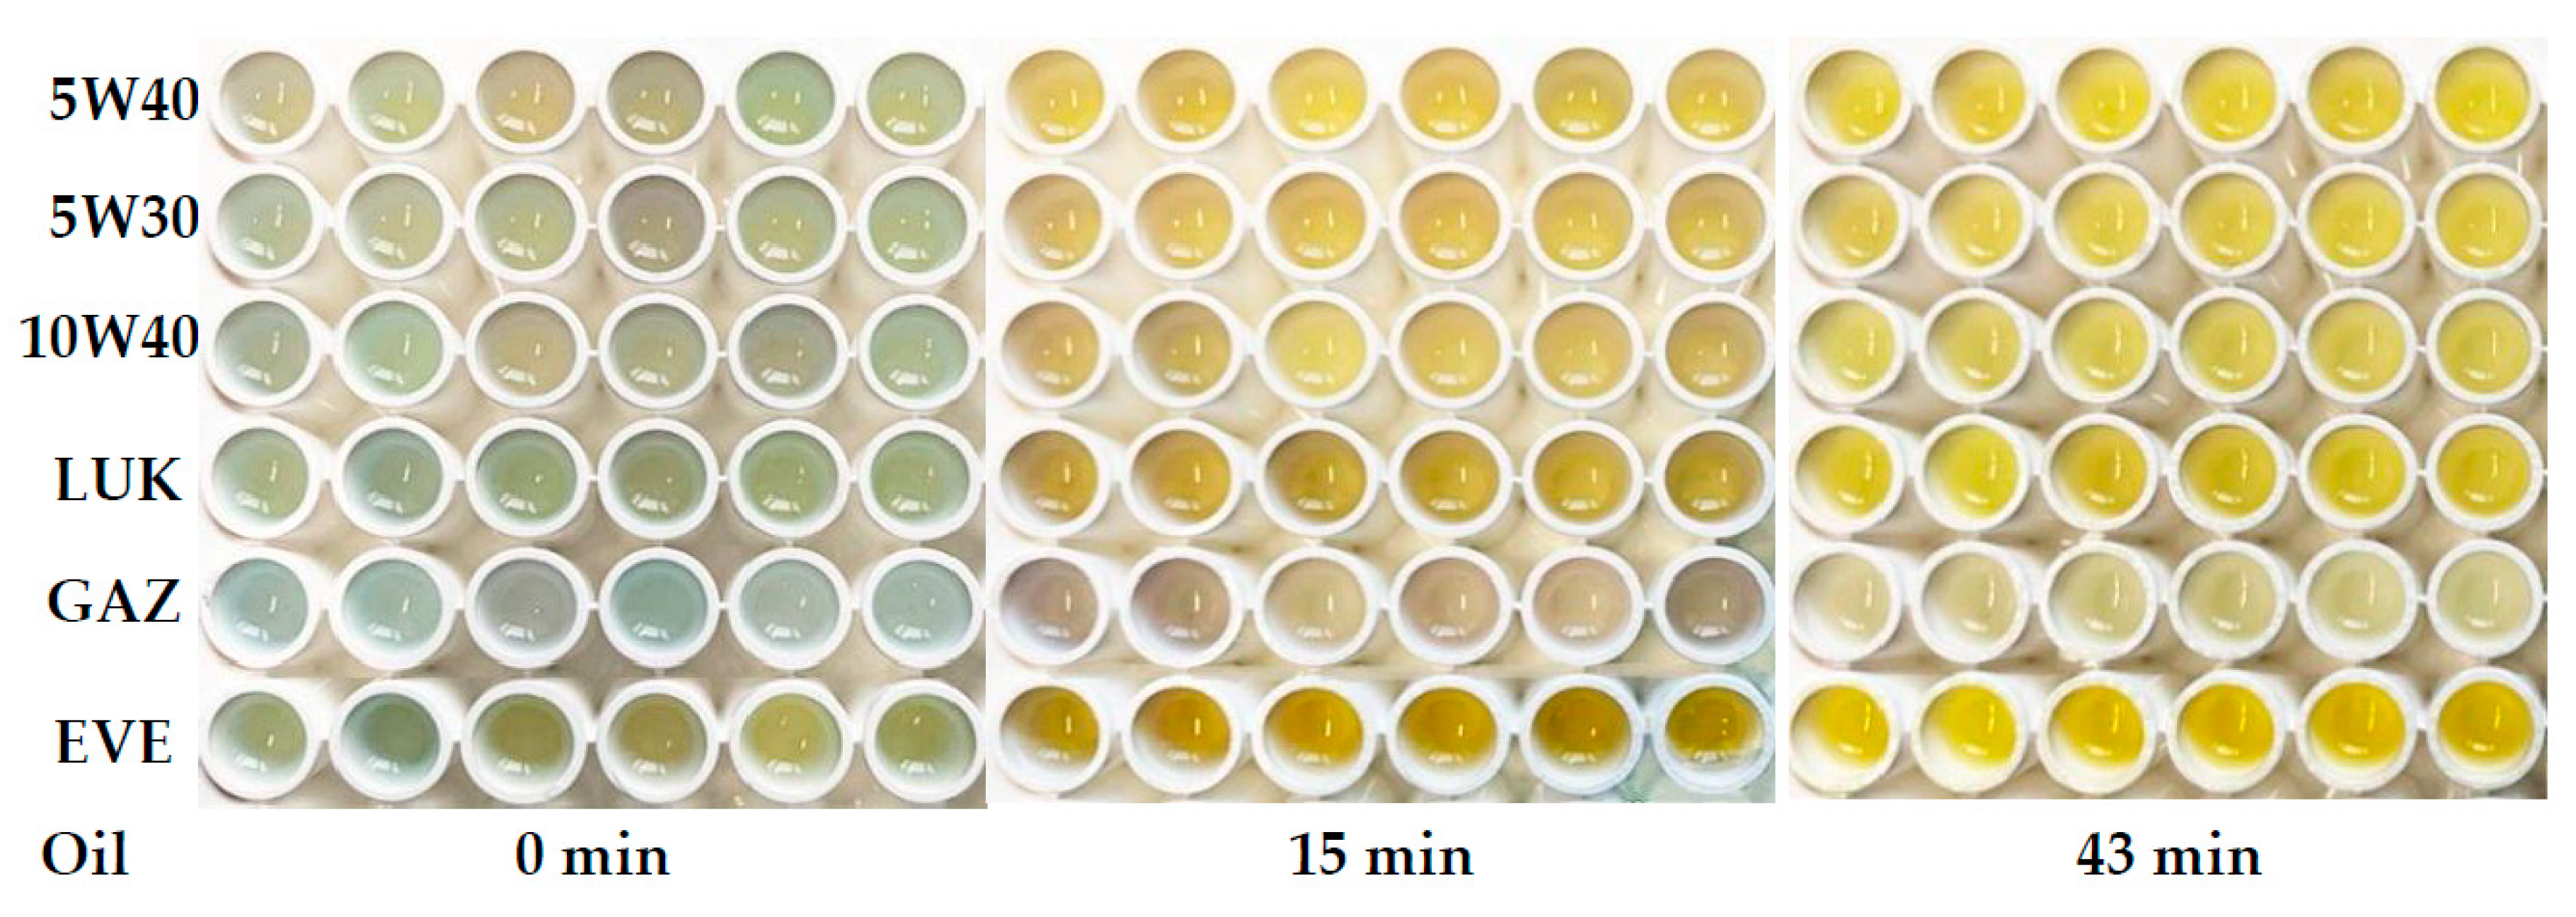
Table 2. Six parallel runs were performed for each sample. Examples of the obtained images are given in
Figure 2 and
Figure S2 in ESI. It can be seen that recognition of samples by eye was difficult, and further chemometrics-assisted processing of the images was necessary.
The photographs of the reaction mixtures in the wells were digitized (an oval part of the image without a glare was selected) and then subjected to RGB splitting. For constructing kinetic curves for each reaction, a channel most promisable in terms of recognition of samples was chosen. For example, for the
dye 1 – HNO3 reaction (
Figure S3 in ESI) the initial (at zero reaction time) RGB intensities differ between samples due to the differences in their natural color; in the reaction course, the R and G channel intensities increase with time, whereas no regular trend in seen for the B channel; however, the latter channel is the most discriminative due to higher repeatability and noticeable differences between samples. At the maximum time, the sample signals vary between 68–124 units (56 units) for channel B, whereas this value varies within 158–174 (16 units) and 144–159 (15 units) for R and G channels, respectively. For these reasons, the B channel was used for processing.
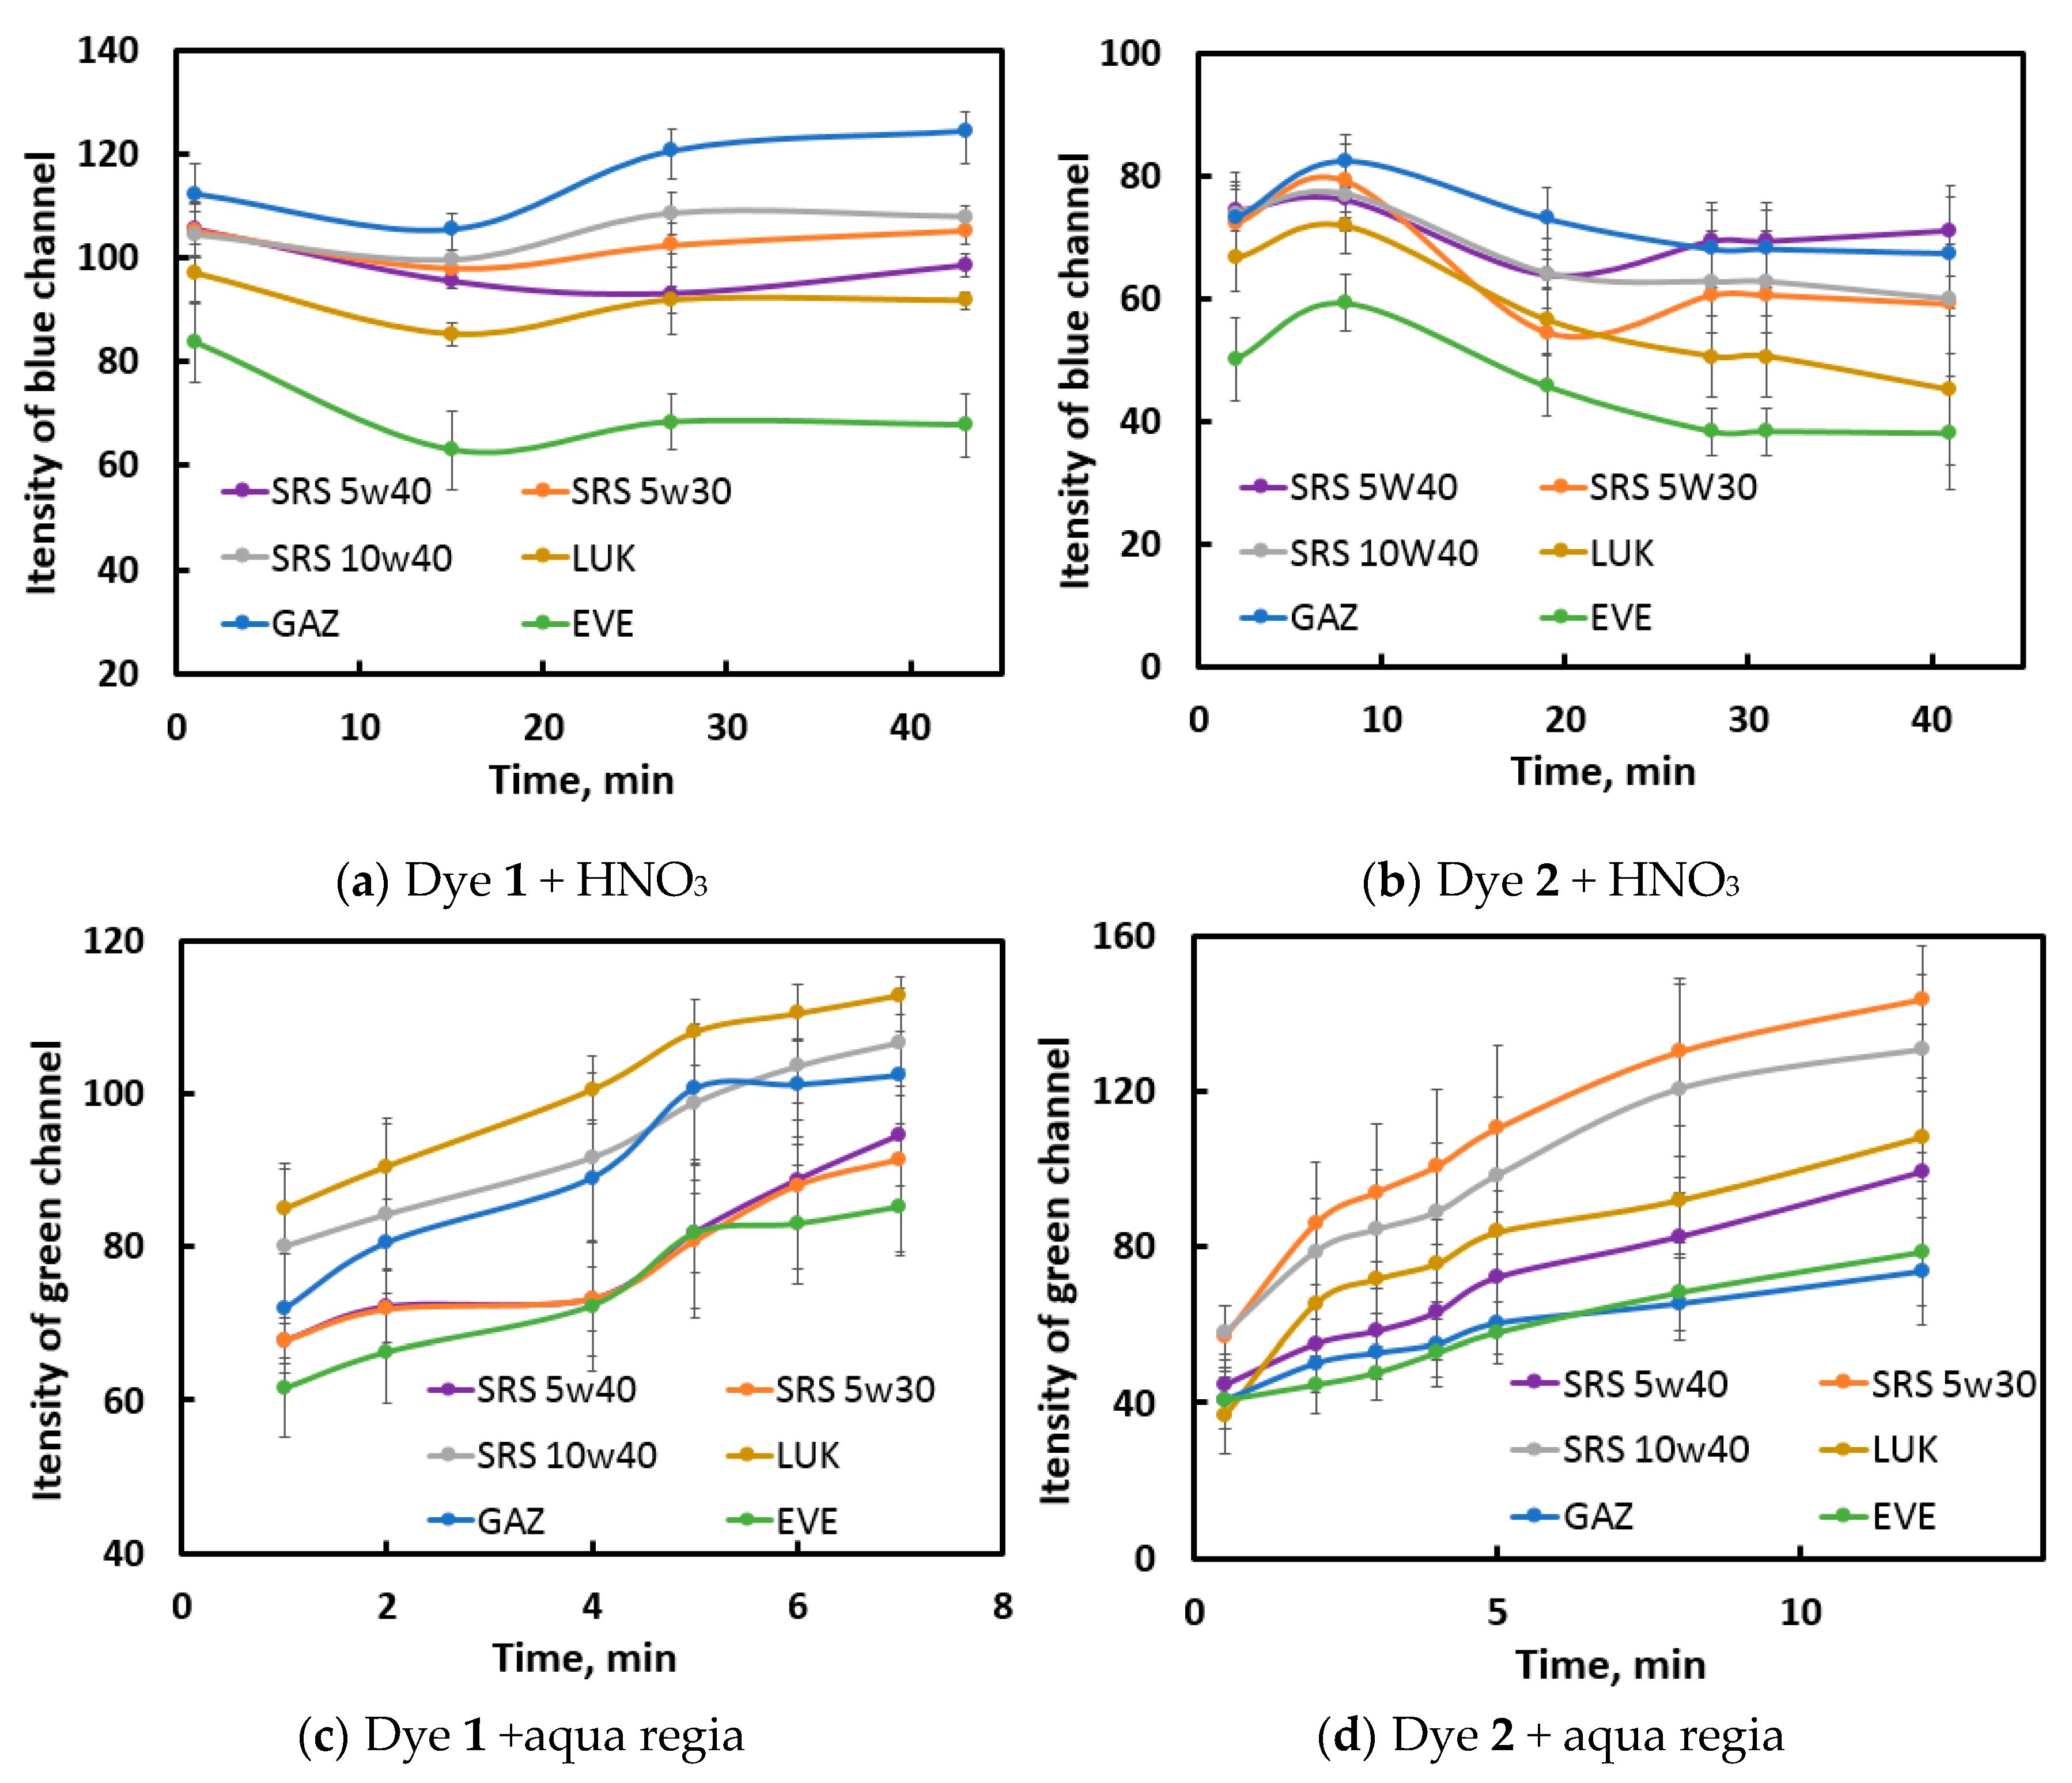
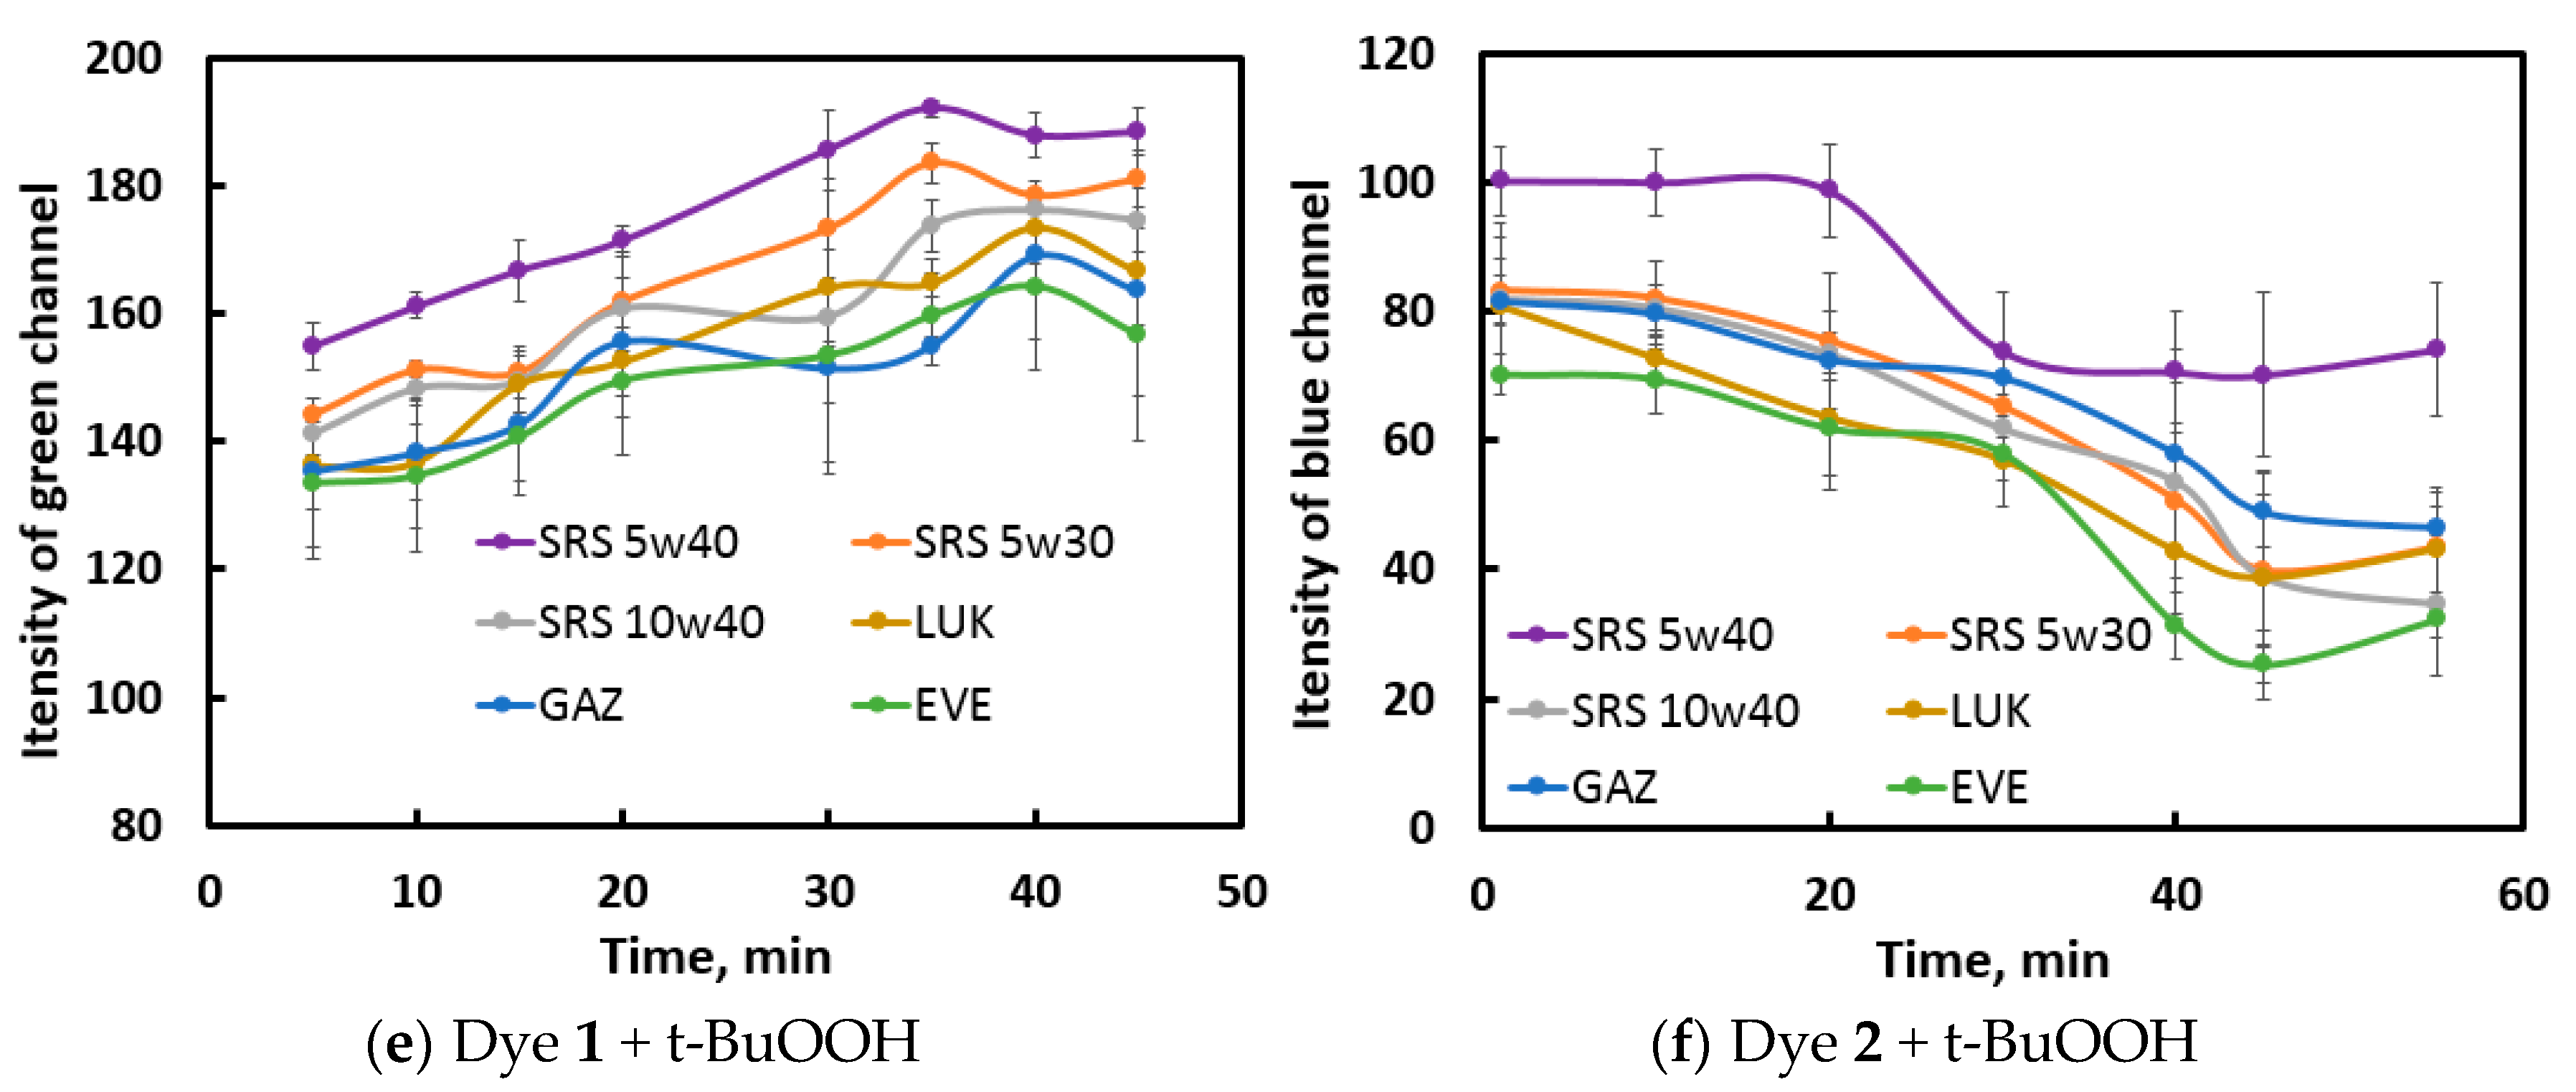
Similar work was performed with the other indicator reactions; the selected channels are shown in
Figure 3. For NIR fluorescence, no selection was necessary, as it is a black-and-white signal. For the selected channels, the results of the 6 replicate measurements were averaged, and the resulting kinetic curves constructed (
Figure 3 for visible photographs and
Figure S4 in the ESI for NIR images).
It can be observed from the obtained curves that oils exert different effects on the kinetic curve shape: EVE and GAZ oils – in the reactions with HNO3 as oxidant; SRS 5W40 and sometimes SRS 5W30 oils – in the reactions with t-BuOOH as oxidant. For the aqua regia reactions, the oils tend to form groups of 2–3 samples. More scrupulous discrimination can be achieved after data processing.
3.3. Discrimination of oils by individual indicator reactions
The data tables for the chemometric data processing included the intensities of all color channels for the 6 parallel observations of 6 samples; the columns of the tables represented different reaction times for an individual indicator reaction. The accuracy of discrimination of oils by LDA and kNN techniques was verified by using validation procedure; percent accuracy was calculated as the ratio of correctly assigned observations to the total number of observations (6) in the validation set, and the results are presented in
Table 3.
For the kNN algorithm, no indicator reaction was found to completely discriminate the 6 oil samples, even when all available color channels were used (and NIR fluorescence data, if any). The best in terms of accuracy was reaction 5 (dye
1 + HNO
3, 90%). Attempts to reduce the amount of kNN-processed data by using only one color channel (as selected under 3.2) yielded the same (for reactions 1 and 3) or lower accuracy (for the rest of reactions), though for the best reaction it remained as high as 87% (
Table 3).
For the LDA-processed data, the two dyes demonstrated a similar trend: catalytic oxidation of a dye with t-BuOOH was the least efficient, and aqua regia as oxidant ensured the results close to those of t-BuOOH; the accuracy improved when passing to t-BuOOH without Cu(2+) and aerial oxidation of dye 1. Most efficient were the reactions with nitric acid as oxidant: all 6 samples were discriminated by reaction 5 (100% accuracy by LDA). The similar reaction, oxidation of dye 2 with HNO3, also showed a high result (93% accuracy by LDA), which was not the case when using kNN processing.
The LDA score plots (
Figure 4) were constructed to visualize the discrimination of the training samples (encircled in ellipses) and validation samples. For example, in graph (b) it can be seen that one of the SRS 5W30 validation points resides close to the SRS 10W40 group and was assigned incorrectly. Other validation points are located close to their correct classes.
It is noteworthy that complete discrimination was only achieved when kinetic curves had been analyzed. If only a single photograph was used, the recognition was poor. For example, processing of the zero-time visible image for the most efficient reaction
dye 1 – HNO3 (for all three color channels) provided an LDA discrimination accuracy of 68% (averaged from 10 consecutive LDA runs). Similarly, for a 2-min photograph of
dye 2 – HNO3 reaction, an accuracy of 40% was obtained. Both values are essentially lower than those provided in
Table 3. Kinetic data improves discrimination because it characterizes the samples in more detail.
Overall, there is at least one system allowing for complete discrimination of all 6 samples (oxidation of dye 1 with HNO3 in combination with processing of all RGB color channels with LDA).
3.4. Discrimination of oils by combining several reactions
As shown above, most of the individual indicator reactions are not sufficiently discriminative (the accuracy is well below 100%,
Table 3). The task was to improve the discrimination accuracy and render this data useful for the recognition purposes. Six reactions providing the lowest accuracy (1, 2, 3, 6, 7, 9) were selected for that purpose. All the results were merged to obtain one data table (179 columns) and processed with kNN and LDA techniques (
Table 4). Besides, smaller reaction sets were also studied: the reactions with the lowest individual accuracies according to kNN (not to exceed 73%,
Table 3) were removed one by one. The results showed that LDA performed best in individual reactions (section 3.3), but it was not the case for the merged data: the accuracy of discrimination was as low as 60% and did not increase with decreasing the number of reactions. On the contrary, the kNN technique not just showed a superior accuracy (87% for the initial dataset), but it also demonstrated a maximum of accuracy (93%) for the shortened dataset of just four reactions (2, 3, 6, and 9). Since we removed the reactions with the lowest accuracy, this operation can be regarded as removing noise, which may improve the results. In addition, kNN is a completely non-parametric approach: no assumptions are made about the shape of the decision boundary. This may comprise an advantage for very complicated datasets. In the case of LDA, we are limited to only linear discrimination functions.
Overall, if there are a number of indicator reactions each of which does not allow to solve the discrimination problem, data merging and selecting appropriate reactions can improve the accuracy (in this example, from 73% for individual reaction 2 to 93% for the set of 4 reactions). It should be mentioned that all the reported accuracy values pertain to single observations whereas all samples are measured in several replicates. If the accuracy of a single observation is 93% and the number of parallel observations for each sample be 6, as accepted in this study, then the accuracy of dose estimation for the whole sample will be equal to 99.4% (see ESI for the formulas).
4. Conclusions
As a result of this study, an innovative optical fingerprinting strategy based on indicator reactions has been further developed. Indicator reactions occurring in an organic solvent with low water content have been shown applicable for the discrimination of fat-soluble samples. Six motor oils of various types and manufacturers were used as model samples; they were recognized with 100% accuracy, which confirms the high discriminatory power of the method. The reactions with nitric acid as oxidant were found to be the most discriminative among the several redox systems studied.
The method is rapid and simple, it relies on a smartphone camera and does not employ any full-spectrum instrumentation. The NIR visualizer is also unnecessary for the most discriminative reactions. Using a smartphone implies that illumination conditions are not strictly observed; the user only tries to capture images in approximately the same light intensity. This approach did not cause any troubles in data processing and confirmed its practicality in this and previous [
11] studies, providing quite satisfactory results.
The proposed strategy has some limitaions, one of which is the necessity to select indicator reactions when switching to a new type of samples. On the other hand, appropriate indicator processes can be found for a wide range of samples of different nature, which means that the strategy is rather versatile. Other advantages of the method include the use of standard software for digitizing and processing the obtained photographs and the feasibility of achieving complete discrimination by using only one indicator reaction with a commercial dye. The data obtained from several other reactions (each of which alone is non-discriminative) can be combined to improve the discrimination accuracy. The strategy has good prospects for the recognition of other oils and fats.
Supplementary Materials
The following supporting information can be downloaded at the website of this paper posted on Preprints.org. Synthesis of dye 2 (protocols and spectral data); Table S1: An example of a data table containing intensities of photograpihic images of samples; Table S2: An example of confusion matrix created by XLSTAT LDA software for evaluating the accuracy of discrimination by validation procedure; Figure S1: Absorbance spectra at different reaction times for the indicator reactions named above the images; Figure S2: Visible images of the reacting system
dye 2 + HNO3 obtained by a smartphone camera; Figure S3: Kinetic curves for the reaction between dye 1 and HNO
3 plotted for three color channels (R, G, B); Figure S4: Kinetic curves of indicator reactions (a) Dye 1 + t-BuOOH, (b) Dye 2 + t-BuOOH + Cu
2+, in the presence of oil samples; Accuracy of assignment of the sample as a whole (6 observations) [
34].
Author Contributions
Conceptualization, Mikhail K. Beklemishev; Funding acquisition, Mikhail K. Beklemishev; Investigation, Arseniy Pypin, Anna Shik, Irina Stepanova and Irina Doroshenko; Methodology, Tatyana Podrugina and Mikhail K. Beklemishev; Supervision, Tatyana Podrugina and Mikhail K. Beklemishev; Writing – original draft, Anna Shik and Irina Doroshenko; Writing – review & editing, Mikhail K. Beklemishev. All authors have read and agreed to the published version of the manuscript.
Funding
This research was supported by the Russian Science Foundation (grant No. 20-13-00330-P).
Institutional Review Board Statement
Not applicable.
Informed Consent Statement
Not applicable.
Data Availability Statement
Acknowledgments
The authors thank Alexander D. Zhdanov for donating the oil samples and Evguenii V. Skorobogatov for his invaluable help with chemometric calculations.
Conflicts of Interest
The authors declare no conflicts of interest. The funders had no role in the design of the study; in the collection, analyses, or interpretation of data; in the writing of the manuscript; or in the decision to publish the results.
References
- Esteki, M.; Shahsavari, Z.; Simal-Gandara, J. Gas Chromatographic Fingerprinting Coupled to Chemometrics for Food Authentication. Food Rev. Intern. 2020, 36, 384–427. [Google Scholar] [CrossRef]
- Liu, X.; Jiang, W.; Su, M.; Sun, Y.; Liu, H.; Nie, L.; Zang, H. Quality evaluation of traditional Chinese medicines based on fingerprinting. J. Sep. Sci. 2020, 43, 6–17. [Google Scholar] [CrossRef]
- Anzardi, M.B.; Arancibia, J.A.; Olivieri, A.C. Processing multi-way chromatographic data for analytical calibration, classification and discrimination: A successful marriage between separation science and chemometrics. Trends Anal. Chem. 2021, 134, 116128. [Google Scholar] [CrossRef]
- Li, Y.-Q.; Feng, L. Progress in Paper-based Colorimetric Sensor Array. Chin. J. Anal. Chem. 2020, 48, 1448–1457. [Google Scholar] [CrossRef]
- Sun, J.; Lu, Y.; He, L.; Pang, J.; Yang, F.; Liu, Y. Colorimetric sensor array based on gold nanoparticles: Design principles and recent advances. Trends Anal. Chem. 2020, 122, 115754. [Google Scholar] [CrossRef]
- Li, Z.; Suslick, K.S. The optoelectronic nose. Acc. Chem. Res. 2020, 54, 950–960. [Google Scholar] [CrossRef] [PubMed]
- Miranda, O.R.; You, C.-C; Phillips, R.; Kim, I.-B.; Ghosh, P.S.; Bunz, U.H.F.; Rotello, V.M. Array-Based Sensing of Proteins Using Conjugated Polymers. J. Am. Chem. Soc. 2007, 129, 9857. [Google Scholar] [CrossRef]
- Rukosueva, E.A.; Dobrolyubov, E.O.; Goryacheva, I.Yu.; Beklemishev, M.K. Discrimination of whiskies using an “add-a-fluorophore” fluorescent fingerprinting strategy. Microchem. J. 2019, 145, 397–405. [Google Scholar] [CrossRef]
- Stepanova, I.A.; Lebedeva, A.N.; Shik, A.V.; Skorobogatov, E.V.; Beklemishev, M.K. Recognition and Determination of Sulfonamides by Near-IR Fluorimetry Using Their Effect on the Rate of the Catalytic Oxidation of a Carbocyanine Dye by Hydrogen Peroxide. J. Analyt. Chem. 2021, 76, 1397–1405. [Google Scholar] [CrossRef]
- Shik, A.V.; Stepanova, I.A.; Doroshenko, I.A.; Podrugina, T.A.; Beklemishev, M.K. Carbocyanine-Based Fluorescent and Colorimetric Sensor Array for the Discrimination of Medicinal Compounds. Chemosensors 2022, 10, 88. [Google Scholar] [CrossRef]
- Shik, A.V.; Skorobogatov, E.V.; Bliznyuk, U.A.; Chernyaev, A.P.; Avdyukhina, V.M.; Borschegovskaya, P.Yu.; Zolotov, S.A.; Baytler, M.O.; Doroshenko, I.A.; Podrugina, T.A.; Beklemishev, M.K. Estimation of doses absorbed by potato tubers under electron beam or X-ray irradiation using an optical fingerprinting strategy. Food Chem. 2023, 414, 135668. [Google Scholar] [CrossRef]
- Shik, A.V.; Stepanova, I.A.; Doroshenko, I.A.; Podrugina, T.A.; Beklemishev, M.K. Carbocyanine-Based Optical Sensor Array for the Discrimination of Proteins and Rennet Samples Using Hypochlorite Oxidation. Sensors 2023, 23, 4299. [Google Scholar] [CrossRef]
- Wang, L.; Hu, Z.; Wu, S.; Pan, J.; Xu, X.; Niu, X. A peroxidase-mimicking Zr-based MOF colorimetric sensing array to quantify and discriminate phosphorylated proteins. Anal. Chim. Acta 2020, 1121, 26–34. [Google Scholar] [CrossRef]
- Liu, L.; Zhang, L.; Liang, Y. A Simple Visual Strategy for Protein Detection Based on Oxidase-Like Activity of Silver Nanoparticles. Food Anal. Methods. 2021, 14, 1852–1859. [Google Scholar] [CrossRef]
- Wang, F.; Na, N.; Ouyang, J. Particle-in-a-frame gold nanomaterials with an interior nanogap-based sensor array for versatile analyte detection. Chem. Commun. 2021, 57, 4520–4523. [Google Scholar] [CrossRef]
- Pargari, M.; Marahel, F.; Goodajdar, B.M. Kinetic Spectrophotometric Method and Neural Network Model Application for the Quantitation of Epinephrine by Starch-capped AgNPs Sensor in Blood and Urine. J. Anal. Chem. 2022, 77, 484–494. [Google Scholar] [CrossRef]
- Crouch, S.R.; Cullen, T.F.; Scheeline, A.; Kirkor, E.S. Kinetic determinations and some kinetic aspects of analytical chemistry. Anal. Chem. 1998, 70, 53R–106R. [Google Scholar]
- Zakharenkova, S.A.; Katkova, E.A.; Doroshenko, I.A.; Kriveleva, A.S.; Lebedeva, A.N.; Vidinchuk, T.A.; Shik, A.V.; Abramchuk, S.S.; Podrugina, T.A.; Beklemishev., M.K. Aggregation-based fluorescence amplification strategy: “turn-on” sensing of aminoglycosides using near-IR carbocyanine dyes and pre-micellar surfactants. Spectr. Acta A 2021, 247, 119109. [Google Scholar] [CrossRef]
- Bayona, J.M.; Domínguez, C.; Albaigés, J. ; Analytical developments for oil spill fingerprinting, Trends Environ. Anal. Chem. 2015, 5, 26–34. [Google Scholar] [CrossRef]
- Fernández-Varela, R.; Andrade, J.M.; Muniategui, S.; Prada, D. Comparing the weathering patterns of six oils using 3-way generalized Procrustes rotation and matrix-augmentation principal components. Anal. Chim. Acta 2010, 683, 84–91. [Google Scholar] [CrossRef]
- Ismail, A.; Toriman, M.E.; Juahir, H.; Kassim, A.M.; Zain, S.M.; Ahmad, W.K.W.; Wong, K.F.; Retnam, A.; Zali, M.A.; Mokhtar, M.; Yusri, M.A. Chemometric techniques in oil classification from oil spill fingerprinting. Mar. Pollut. Bull. 2016, 111, 339–346. [Google Scholar] [CrossRef] [PubMed]
- Bajoub, A. S. Medina-Rodríguez, M. Gómez-Romero, el A. Ajal, M.G. Bagur-González, A. Fernández-Gutiérrez, A. Carrasco-Pancorbo. Assessing the varietal origin of extra-virgin olive oil using liquid chromatography fingerprints of phenolic compound, data fusion and chemometrics. Food Chem. 2017, 215, 245–255. [Google Scholar] [CrossRef] [PubMed]
- Hai, Z.; Wang, J. Electronic nose and data analysis for detection of maize oil adulteration in sesame oil. Sens. Actuat. B 2006, 119, 449–455. [Google Scholar] [CrossRef]
- Li, B.; Wang, H.; Zhao, Q.; Ouyang, J.; Wu, Y. Rapid detection of authenticity and adulteration of walnut oil by FTIR and fluorescence spectroscopy: a comparative study. Food Chem. 2015, 181, 25–30. [Google Scholar] [CrossRef] [PubMed]
- Cebi, N.; Taylan, O.; Abusurrah, M.; Sagdic, O. Detection of Orange Essential Oil, Isopropyl Myristate, and Benzyl Alcohol in Lemon Essential Oil by FTIR Spectroscopy Combined with Chemometrics. Foods 2020, 10, 27. [Google Scholar] [CrossRef] [PubMed]
- Srata, L.; Farres, S.; Fethi, F. Engine oil authentication using near infrared spectroscopy and chemometrics methods. Vibrat. Spectrosc. 2019, 100, 99–106. [Google Scholar] [CrossRef]
- Vempatapu, B.P.; Kumar, J.; Ray, A.; Chhibber, V.K.; Kanaujia, P.K. Determination of biodiesel and used cooking oil in automotive diesel / green diesel fuels through high-performance liquid chromatography. J. Chromatogr. A 2020, 162, 91–12. [Google Scholar] [CrossRef]
- Ganeev, A.A.; Konyushenko, I.O.; Nemets, V.M. Study of the Conditions of Formation of Spectral Absorbption Multidimensional Images of Motor Fuels and Liquid Mineral Technical Oils. J. Anal. Chem. 2016, 71, 1182–1187. [Google Scholar] [CrossRef]
- Sikorska, E.; Khmelinskii, I.; Sikorski, M. Analysis of Olive Oils by Fluorescence Spectroscopy: Methods and Applications. In Olive Oil - Constituents, Quality, Health Properties and Bioconversions; Dimitrios, B., Ed.; InTech, 2012. [Google Scholar] [CrossRef]
- Ahmadi, S.; Mani-Varnosfaderani, A.; Habibi, B. Motor Oil Classification Using Color Histograms and Pattern Recognition Techniques. J AOAC Int. 2018, 101, 1967–1976. [Google Scholar] [CrossRef]
- Bassbasi, M.; Hafd, A.; Platikanov, S.; Tauler, R.; Oussama, A. Study of motor oil adulteration by infrared spectroscopy and chemometrics methods. Fuel 2013, 104, 798–804. [Google Scholar] [CrossRef]
- Meng, F.; Chen, S.; Zhang, Y.; Chen, H.; Guo, P.; Mu, T.; Liu, X. Characterization of motor oil by laser-induced fluorescence. Anal. Lett. 2015, 48, 2090–2095. [Google Scholar] [CrossRef]
- Srata, L.; Farres, S.; Chikri, M.; Addou, S.; Fethi, P. Detection of the Adulteration of Motor Oil by Laser Induced Fluorescence Spectroscopy and Chemometric Techniques. J. Fluoresc. 2023, 33, 713–720. [Google Scholar] [CrossRef] [PubMed]
- Lima, E.; Barroso, A.G.; Sousa, M.A.; Ferreira, O.; Boto, R.E.; Fernandes, J.R.; Almeida, P.; Silvestre, S.M.; Santos, Ad.O.; Reis, L.V. Picolylamine-functionalized benz[e]indole squaraine dyes: Synthetic approach, characterization and in vitro efficacy as potential anticancer phototherapeutic agents. Eur. J. Med. Chem. 2022, 229, 114071. [Google Scholar] [CrossRef] [PubMed]
|
Disclaimer/Publisher’s Note: The statements, opinions and data contained in all publications are solely those of the individual author(s) and contributor(s) and not of MDPI and/or the editor(s). MDPI and/or the editor(s) disclaim responsibility for any injury to people or property resulting from any ideas, methods, instructions or products referred to in the content. |
© 2023 by the authors. Licensee MDPI, Basel, Switzerland. This article is an open access article distributed under the terms and conditions of the Creative Commons Attribution (CC BY) license (http://creativecommons.org/licenses/by/4.0/).
