1. Introduction
The transcription factor Foxp3 is known for its role as a master regulator of regulatory T cell (Treg) function, a dynamic subgroup of CD4+ T lymphocytes that modulate the response of the immune system under physiological and pathological conditions, such as autoimmunity and cancer [
1,
2]. Foxp3 is composed of three major domains: the proline-rich N-terminal domain (1-97 aa), responsible for transcriptional activation and repression; a central domain (98-260 aa) of zinc finger and leucine zipper (LZ), involved in the association with other transcription factors; and the forkhead domain (FKH) C-terminal (337-423 aa), responsible for DNA binding. The FKH domain forms homodimers, which contributes to the nuclear translocation of Foxp3, where it binds to target genes [
3]. Foxp3 is crucial for Treg lineage survival and stability, enabling Treg functionality even in a nutrient-poor and hypoxic environment [
4]. In the tumor microenvironment (TME), Foxp3 activation in Tregs generates an exhausting microenvironment, inducing TGF-β and IL-10 expression or downregulating IL-2 [
3]. Several strategies have sought to deplete Tregs or block their immunosuppressive function to promote antitumor immunity, without achieving significant therapeutic benefits [
5]. Although Tregs were initially identified by their expression of CD25, the expression of this marker is not unique to these cells, as it is now known to be a general marker of T cell activation [
6]. Studies in which CD25
+ was targeted by monoclonal antibodies such as basiliximab [
7,
8], or the use of denileukin diftitox which directs cytocidal activity of the diphtheria toxin to CD25 expressing cells to facilitate killing [
9], did not achieve optimal results, which has been attributed in part to off-target effects by simultaneously reducing effector T cells [
10]. Considering that Foxp3 expression is restricted to Tregs, this is an interesting molecule to specifically target these cells without affecting other immune cell populations. However, the nuclear localization of Foxp3 impairs the use of blocking antibodies. Cell-penetrating peptides (CPPs) are small peptides (20 aa) capable of crossing the cell membrane [
11]. Their capacity to enter the cells and its excellent biodistribution has generated great interest for the development of novel therapeutic strategies. In this way, P60, a CCP capable of binding Foxp3, has been developed to inhibit the immunosuppressive function of Tregs [
12]. P60 showed high affinity for the LZ-FKH domains of Foxp3, preventing Foxp3 nuclear translocation [
13]. P60-mediated inhibition of Treg regulatory function stimulates effector T cells, both
in vitro and
in vivo [
14]. In experimental models of kidney and pancreatic cancer, P60 potentiates the efficacy of cytokine-induced NK cell immunotherapy [
15].
Although Foxp3 expression within the immune system is virtually restricted to Tregs, this transcription factor has also been detected in several types of normal [
16,
17] and tumoral epithelial cells, including breast cancer (BRCA) cells [
18,
19,
20,
21]. FOXP3 mRNA is significantly upregulated in BRCA biopsies compared to adjacent non-neoplastic breast tissue [
22,
23]. Although the role of Foxp3 in regulating immunosuppression is very well known, its actions in tumor cells remain uncertain [
4]. Although there is consensus on the tumor-suppressing role of Foxp3 in the normal mammary gland [
24], its role in the pathogenesis of BRCA remains controversial [
25,
26]. It has been proposed that Foxp3 acts as tumor suppressor in breast tumor cells, inhibiting the expression of protumoral molecules, including HER2 and VEGF, through binding and repression of their promoters [
25,
26]. In experimental models of BRCA, Foxp3-mediated inhibition of MTA1, CXCR4 and CD44 has been implicated in the inhibition of lung metastases [
27]. However, it has also been proposed that tumor cells expressing Foxp3 can activate PD-L1 expression and inhibit CD8+ T cell activity, maintaining an immunosuppressive TME [
28]. We have previously reported that systemic administration of P60 in mice bearing HER2+ or TNBC tumors inhibits the expansion of Tregs and improves the efficacy of therapeutic dendritic cell vaccines (DCs) [
21]. In addition, we have shown that P60 exerts direct antitumor effects, inhibiting tumor growth not only in immune competent mice, but also in animals lacking a functional immune system [
21], suggesting that Foxp3 exerts intrinsic effects in BRCA cells. In fact, our previous results showed that P60 exerts direct inhibitory effects on the viability, proliferation, and secretion of the immunosuppressive interleukin (IL)-10 in Foxp3
+ BRCA cells
in vitro [
21], strengthening the idea that Foxp3 exerts protumoral intrinsic effects in these cells. Here, we intended to further evaluate the effects of Foxp3 on the characteristics that facilitate tumor progression, such as chemoresistance and migration, in human and murine experimental BRCA.
It is important to consider that systemic inhibition of Foxp3 could induce autoimmunity and other immune-mediated side effects [
3,
29]. In addition, the low systemic half-life of peptides makes it necessary repeated and frequent administrations for them to exert therapeutic effects [
21]. P60 expression using gene therapy vectors could address these limitations and increase the local bioavailability of the peptide to be used
in vivo. In this sense, adenoviruses have been shown to constitute excellent tools for gene therapy, eliciting high transduction efficiency, ubiquitous tropism and scalable production systems [
30]. Thus, we generated an adenoviral vector encoding P60 (Ad.P60) and evaluated its effects
in vitro and
in vivo in preclinical BRCA models.
2. Materials and Methods
2.1. Drugs
Dulbeco´s Modified Eagle’s Medium (DMEM; 12800017), Penicillin-Streptomycin and Trypsin-EDTA (0.05%) were obtained from Gibco (Invitrogen, Carlsbad, CA); fetal bovine serum (FBS) from Natocor (Córdoba, Argentina) and cisplatin from Microsules (Buenos Aires, Argentina). OCT medium for frozen sections was obtained from Biopack (Buenos Aires, Argentina). Ketamine was obtained from Holliday (Argentina Poniente, Mexico). Xylazine (Kensol) was obtained from König (Buenos Aires, Argentina).
2.2. Cell Lines
BRCA cell lines were grown in Petri dishes containing DMEM with high glucose and sodium bicarbonate, supplemented with 10% FBS and 1% Penicillin-Streptomycin. Cells were harvested using Trypsin-EDTA (0.05%) in PBS and counted with Trypan-blue. Mouse HER2+ breast carcinoma LM3 cells (BALB/C) were generated and kindly provided by Dr. Elisa Bal de Kier Joffé (Hospital Roffo, Buenos Aires Argentina) [
31] and triple negative (TNBC) EO771 were kindly provided by Dr. Andrea Randi (Departmento de Bioquímica Humana, Facultad de Medicina, Universidad de Buenos Aires). Human Luminal MCF7, TNBC MDA-MB-231 and MDA-MB-468 cell lines were kindly provided by Dr. Natalia Rubinstein (Facultad de Ciencias Exactas y Naturales, Universidad de Buenos Aires). For
in vitro experiments, 50 µM of P60 or P301 peptide were used. Dose selection for cisplatin in all cell lines can be found in
Supplementary Figure S1.
2.3. Foxp3 Expression
LM3 cells were incubated for 24 h with 50 μM of Rapamycin (Cayman Chemical Company, Cat# 53123-88-9), 50 μM of Indomethacin (Montpellier) or 10 ng/ml of TGF-β (Cayman Chemical Company, Cat# 6164552UG). Mice tumor cells were incubated with two concentrations of cisplatin (2 and 20 µM) for 48 h. The cells were harvested with 0.025% trypsin-EDTA, washed with cold PBS and prepared for flow cytometry analysis (see
Supplementary Data).
Human MDA-MB-231 and MDA-MB-468 BRCA cells were seeded on coverslips in 24-well plates and incubated with or without cisplatin (40 and 4 µM respectively) for 48 h. Foxp3 expression was assessed by immunocytochemistry and analyzed by fluorescence microscopy (see
Supplementary Data).
2.4. Synthesis of P60
Therapeutic peptide P60 (RDFQSFRKMWPFFAM) and control peptide P301 (MKMFFDAFPQRRSWF) were synthesized by the solid phase method of Merrifield using the fluorenylmethyloxycarbonyl alternative, as previously described [
14]. The purity of peptides was 90% as assessed by HPLC.
2.5. BrdU cell Proliferation Assay
Cell proliferation was evaluated by incorporation of bromodeoxyuridine/ 5-bromo-2’-deoxyuridine (BrdU; SigmaAldrich, Roche #Cat. 11647229001). Absorbance was determined using a 96-well plate spectrophotometer (Bio-Rad, Model 550) at 490 nm as previously described [
21,
32,
33].
2.6. Cell Viability
Cell viability was evaluated using the 3-(4,5-dimethylthiazol-2-yl)-2,5- diphenyltetrazolium bromide (MTT) assay (Molecular Probes, Invitrogen, Thermo Fisher Scientific) as previously described [
21,
32,
33].
2.7. Clonogenic Assay
LM3 cells were incubated with P60 or P301 (50 μM) for 1 h and then treated with cisplatin for 72 h. The cells were harvested with 0.025 % trypsin-EDTA and seeded in plates of 6 wells at a density of 1000 cells/well. Ten days later, the cells were fixed in methanol for 10 min at -20 °C and stained with Giemsa. The number of colonies containing a minimum of 50 cells (colony forming unit, CFU) were counted using a binocular stereomicroscope and the clonogenic fraction was calculated based on the number of cells seeded relative to the number of clones formed.
2.8. Wound Assay
Cells were incubated in 24-well plates for 24 h with P60 or P301 (50 μM) or with conditioned medium (CM) from cells previously incubated with P60 or P301 for 48 h. Then a wound was made to the wells with cells in confluence with a micropipette tip. The wells were washed with PBS and incubated again with the peptides or CM in complete medium without serum. Finally, the cells were photographed at different times and the wound area was measured in the images with ImageJ software.
2.9. Zymography Assay
Cells were incubated with P60 or P301 (50 μM) alone or in the presence of cisplatin in the case of MDA-MB-231 cells, for 48 h and the gelatinocytic activity of metalloproteinases (MMP) was determined in their culture media by zymography. For this, 3 μl of media were loaded into a gel of 10 % acrylamide with 0.2 % gelatin and run at 120 V. Next, the gels were washed with 50 mM Tris-HCl pH 7.5 in 2.5 % Triton X-100 for 45 min, followed by another wash of 45 min in the same solution with 5 mM CaCl2 and 1 μM ZnCl2. The gels were then incubated for 24 h at 37 °C with a solution of 50 mM Tris-HCl with 10 mM CaCl2, 200 mM NaCl, pH 7,5. Finally, the gels were stained with 0.5% Coomasie Brilliant Blue R-250 and faded with bleaching solution (25% v/v isopropanol- 10% v/v acetic acid). The enzymatic activity, visualized as clear bands against a blue background, was analyzed by densitometry with ImageJ software. The zymographic activity was expressed as a percentage in relation to a standard internal sample saturating at a density of 50 %. Data for different gels were normalized using internal control samples.
2.10. Propidium Iodide Exclusion Assay
60,000 cells were seeded per well in 24-well plates and treated according to the established conditions and incubation times. For sample preparation, independent tubes were used, and supernatants and cells previously detached with 0.025% trypsin-EDTA were collected. The samples were centrifuged for 5 min at 1500 rpm and the supernatant was discarded. For the preparation of the propidium iodide (PI) stock solution, 1 mg of PI was dissolved in 1 ml of distilled water, then the working solution was prepared using 1 µl of the stock solution in 100 µl of PBS. The cells were resuspended with 200 µl of the working solution and immediately analyzed by flow cytometry. Dead cells were identified by emitting fluorescence upon excitation at 488 nm.
2.11. Fluorometric Caspase-3 Activity Test.
Caspase-3 activity on total BRCA cells lysates was evaluated with EnzChek® Caspase-3 Test Kit No. 2 (InvitrogenTM, E-13184) using rhodamine acid amide 110 bis-(NCBZ-L-aspartyl-Lglutamyl-L-valyl-L-aspartic) (Z-DEVD–R110), according to the manufacturer’s instructions. Briefly, the cells were incubated with the P60 peptide and its P301 control with or without cisplatin 5uM. After 48 h, the cells were collected, and total cell lysates were prepared. Next, samples of the cell lysates were seeded into 96-well plates and mixed with a reaction buffer including caspase-3 substrate (25 μM Z-DEVD-R110) and the plates were incubated for 1 h at room temperature protected from light. Caspase-3 activity of cell extracts was determined by a fluorescence microplate reader (Biotek Synergy H1) using excitation/emission wavelengths of 496/520 nm. Sample readings were calculated by subtracting the absorbance of the blank sample. Blank (without extract).
2.12. Adenoviral Vectors
We constructed a non-replicative human adenovirus serotype 5 vectors (AdV) encoding the red fluorescent dTomato reporter gen or the penetrating peptide P60 followed by a sequence internal ribosome entry site (IRES) and the dTomato gen, under the control of the CMV immediate-early promoter, using the ViraPower™ Adenoviral Expression System (Invitrogen, Thermo Fisher Scientific, Waltham, MA, USA) and following the manufacturer’s recommendations as previously described [
34]. Briefly, the heterologous nucleotide sequences, including the dTomato-SV40 polyA (1030 bp) or P60-IRES-SV40 polyA (1680 pb), were amplified by PCR using specific primer oligonucleotides and the pl.dT or pl.P60 plasmids as templates, (synthesized by Macrogen, Seoul, Korea). The PCR amplification products were first cloned into the pGEMT-Easy T vector (Promega, Madison, WI, USA) and then subcloned into the BamHI and HindIII sites of the polylinker from the entry vector pENTR4 (Invitrogen, Thermo Fisher Scientific). Then, in vitro homologous recombination reactions, between the att1 and att2 sites of the entry vectors pENTR4.dTomato or pENT4.P60 and the destination adenoviral vector pAdV-CMV/V5-DEST (Invitrogen, Thermo Fisher Scientific), allowed to obtain the plasmids pAdV-CMVdTomato and pAdV-CMVP60, respectively. These constructs contained the heterologous sequences downstream of CMV promoter and replaced the coding region for the E1 and E3 proteins in the adenovirus genomes. The identity of the pAdV-CMV-dTomato and pAdV-CMVP60 were confirmed by nucleotide sequencing (Macrogen). To obtain the recombinant adenoviral vectors (AdV.dT), the plasmids pAdVCMV-dTomato and pAdV-CMVP60 were digested with the restriction enzyme PacI (which allows exposing the ITRs regions) and transfected into HEK293A cultures. This cell line constitutively expressed the product of the E1 viral gene allowing the formation of the infective viral particles (Ad.dT and Ad.P60). Viral stocks were harvested after the appearance of cytopathic effect and amplified by passages in fresh monolayers. The insertion of the foreign sequences in the recombinant AdVs was confirmed by PCR with specific oligonucleotides using total DNA extracted from infected cells as template. Similarly, the expression of the reporter gene was evidenced by microscopic observation of the red fluorescence emitted in infected cells and exposed to ultraviolet light.
2.13. Animals
Adult female BALB/c and C57Bl/6 (6–8 weeks old) mice were purchased at the vivarium of Facultad de Ciencias Veterinarias, Universidad Nacional de La Plata. C57Bl/6J transgenic Foxp3-GFP mice (B6.Cg-Foxp3tm2Tch/J) were kindly provided by Dr. Eva Acosta, School of Chemistry Sciences, National University of Cordoba. Mice were maintained under controlled conditions of light (12 h light–dark cycles) and temperature (20–25 °C). Mice were fed with standard lab chow and water ad libitum and all efforts were made to minimize distress.
2.14. In Vivo Experimental Breast Cancer Models
BALB/c mice or C57Bl/6 mice were inoculated s.c. into the flank with 2x10⁶ tumor LM3 or EO771 cells, respectively. Tumor size was measured 3 times per week using a caliper. The tumor volume was calculated with the following formula: (width2 x long)/2. When tumors reached 500 mm3 mice were inoculated i.t. with 6,3x10⁷ UFP of Ad.dT or Ad.P60 every 3 days for a total of 3 injections. Mice were monitored daily and when one mouse presented the first signs of distress appeared, the mice were euthanized by cervical dislocation. Then, lungs were dissected and fixed with Bouin’s fixative solution [71% picric acid (saturated), 24% formaldehyde (37–40%), 5% glacial acetic acid], and spontaneous metastases were counted under a binocular stereoscopic microscope.
A group of EO771 tumor-bearing C57Bl/6 mice was euthanized 3 days after Adv inoculation by terminal perfusion under deep anesthesia with Tyrode solution (NaCl 132 mM, CaCl
2 1.8 mM, NaH
2PO
4 0.32 mM, glucose 5.56 mM, NaHCO
3 11.6 mM, and KCl 2.68 mM) followed by 4% PFA. The presence of cells expressing gene reporter dTomato was assessed in tumor sections by fluorescent microscopy (see
Supplementary Data).
A group of EO771 tumor-bearing C57Bl/6J transgenic mice was euthanized 8 days after Adv inoculation and the content of lymphocytes was assessed in spleen and tumor as previously described [
21,
35,
36] (see
Supplementary Data).
All animal experimentation was performed under the guidance of the NIH and was approved by the Institutional Committee for the Care and Use of Laboratory Animals (CICUAL), School of Medicine, University of Buenos Aires; Res. (CD) No. 2071/15.
2.15. Statistical Analysis
Data were plotted and analyzed using GraphPad Prism Version 8.00 software. All data were tested for normality using the Kolmogorov-Smirnov test and the Shapiro-Wilk test before performing parametric statistical tests. Continuous variables were compared using either the Student’s t-test, the one-way analysis of variance test (ANOVA) or the two-way ANOVA. Correlations between continuous variables were assessed using Spearman correlation analysis. Differences between groups were considered significant when p<0.05. All experiments were performed at least twice.
4. Discussion
One of the main mechanisms of tumor evasion is the recruitment of Tregs, which exert suppressive effects on effector T lymphocytes [
45]. The increase in tumor-infiltrating Tregs is associated with a worse prognosis in BRCA patients, making these cells an important therapeutic target [
6,
46]. The infiltration of Foxp3+ Tregs as well as the expression of Foxp3 in breast tumor cells, together with their subcellular localization, were proposed as prognostic markers for BRCA [
18]. While there is consensus on the tumor suppressive role of Foxp3 in the normal mammary gland [
24], its involvement in the pathogenesis of BRCA remains controversial [
25,
26]. Here we aimed to better understand the tumor intrinsic effects of Foxp3 in BRCA cells.
Although the expression of Foxp3 has been reported in many tumor cell types, the regulation of its expression has been barely explored. TGF-β is a potent inducer of Foxp3 expression in Tregs [
47,
48,
49] and has also been reported to control Foxp3 expression in pancreatic carcinoma cells [
50]. We found that stimulation with TGF-β upregulated Foxp3 in BRCA cells. Since TGF-β is produced at high levels in the TME, it is likely that it favors the expression of Foxp3 not only in Tregs, but also in tumor cells. Importantly, while Foxp3 upregulates TGF-β expression in Tregs by repressing its negative regulator [
3], TGF-β also plays a central role in epithelial-mesenchymal transition (EMT) [
51] and it is possible that a positive feedback loop between Foxp3 and TGF-β could facilitate EMT in BRCA. Rapamycin, the inhibitor of the mTOR pathway, is an immunosuppressive agent that has been used to prevent transplant rejection in humans [
52,
53], as it induces the expansion of highly suppressive Tregs [
54,
55]. Similarly, prostaglandin PGE2, which has been postulated to differentiate Tregs, increase Foxp3 expression in resting CD4+CD25+ cells [
56]. The inhibition of the inducible enzyme cyclooxygenase, the major source for PGE2 production, with indomethacin was observed to decrease Foxp3 levels, and thus reduced the levels of antigen induced Tregs [
57]. In our experiments, we observed that these regulatory mechanisms of Foxp3 expression in Tregs are conserved in the BRCA cells, suggesting that the therapeutic interventions intended to inhibit Foxp3 expression in Tregs could also be useful to repress the expression of this transcription factor in BCRA cells.
Cisplatin is a widely used therapeutic agent for the treatment of solid tumors. Despite its observed toxic side effects, [
58] it is commonly used for the treatment of metastatic TNBC tumors that possess a deficient DNA repair system [
59,
60]. Although its systemic toxicity limits its use in oncologic patients, strategies that sensitize tumor cells to its cytotoxic effects could expand the use of this powerful chemotherapeutic drug. Our results show that cisplatin stimulates the expression of Foxp3 in BRCA cells. Considering that chemotherapy can also induce the expression of TGF-β [
61] or the generation of reactive oxygen species [
62], it is possible that these mechanisms participate in the regulation of Foxp3 induced by cisplatin in BRCA cells. Another possibility is that since Foxp3 expressing cells show enhanced resistance to cisplatin, these cells prevail after cisplatin treatment. Since blockade of Foxp3 function sensitized BRCA cells to the cytotoxic and antiproliferative effects of cisplatin, Foxp3 expression may be one of the mechanisms that mediate chemoresistance in these cells.
The ability of tumor cells to invade tissues is critical for tumor progression. We observed that blocking Foxp3 strongly inhibited the migration of BRCA cells and their secretion of active MMPs. These results are supported by the positive correlation between Foxp3 expression and MMP-2 or MMP-9 expression in TNBC biopsies deposited in TCGA BRCA database. Further, it was reported that cisplatin reduced MMP-2 activity in a dose and time-dependent manner in transformed thyroid cells [
63]. We observed that combination of cisplatin with Foxp3 blockade has a significant effect in MMP-2 activity reduction in MDA-MB-231. In conflict with our results, other groups observed that silencing Foxp3 expression in MCF7 luminal BRCA cells, which have high Foxp3 expression, increased their migratory capacity [
27,
64]. Conversely, it was reported that forced overexpression of Foxp3 in cells with low expression of Foxp3 decreased their migratory capacity [
27]. Our results indicate that blockade of Foxp3 failed to affect MCF7 migration but exerted a strong inhibitory effect on the migration of HER2+ LM3 and TNBC MDA-MB-231 cells, suggesting that Foxp3 may elicit differential tumor intrinsic effects depending on the tumor molecular subtype. In addition, it is possible that retaining Foxp3 in the cytoplasm by the inhibition of its nuclear translocation with P60 reveals the effects of Foxp3 sustained interaction with cytoplasmic signaling pathways, unlike what happens when the expression of both nuclear and cytoplasm Foxp3 are erased from the cell via shRNA. In fact, mRNA alterations in the FKH region of Foxp3 in hepatocellular carcinoma influenced its subcellular localization and altered its function [
65]. To accomplish its functions, Foxp3 forms multimeric complex with a myriad of other molecules, which includes 350 proteins [
66]. Thus, retaining Foxp3 in the cytoplasm, rather than impairing its nuclear functions, could result in antitumor effects. The N-terminal region of the protein was associated with the tumor-suppressor activity of Foxp3 [
67,
68]. In this way, P60 interaction with the intermediate Leucine Zipper domain inhibits Foxp3 homodimer formation and immune-suppressor activity, but it does not block other interactions [
12]. Therefore, our results suggest that Foxp3 blockade with P60 not only inhibits Tregs function, but also promotes antitumor activity within BRCA cells.
In order to improve the local availability of P60 in BCRA we developed an Adv encoding this peptide. Advs have been used in BCRA leading to antitumor immunity by the immunization with a nonfunctional HER2 molecule, as well as the local overexpression of the proinflammatory molecule IL-12, or proapoptotic molecules [
69]. Likewise, the intranasal administration of Advs allows high transduction efficiency in lung, and thus it has been proposed to treat lung metastases [
70]. Recently, an Adv encoding for a hypoxia inducible factor (HIF)-3α4 and CD44 decoy protein system that is activated by Notch ligands has demonstrated efficacy in murine models of human TNBC subtype [
71]. Here we observed robust transduction efficiency in BRCA cells both
in vitro and
in vivo. Ad.P60 exerted direct antitumor effects
in vitro and
in vivo that were similar or even greater than those observed when using the P60 peptide [
21]. The stable expression of the peptide may allow increasing the local bioavailability of the peptide in the TME. Our result using conditioning medium from Ad.P60 transduced tumor cells, indicate that Ad.P60 elicits bystander effect by stimulating leukocytes proliferation. This could be due to the release of P60 into the culture medium, or it could be the result of changes in the profile of pro- and anti-inflammatory molecules released by transduced tumor cells In fact, P60 [
21] and pl.P60 inhibited the release of IL-10 in BRCA cells, suggesting that this treatment could change the composition of the TME. In line with these observations, Ad.P60 decreased tumor Treg infiltration. These results agree with our previous data using systemic administration of P60 peptide [
21]. It is important to mention that, unlike other strategies, P60 allows the blockade of Foxp3 without depleting Tregs [
12]. In fact, we observed no changes in the content of Tregs in the spleen. This is an advantageous feature as Tregs depletion has been shown to be counteracted by the conversion of CD4+ T cells to CD4
+CD25
+Foxp3
+ in a homeostatic system, a mechanism that restores immune tolerance [
72]. Taken together, our results suggest that local administration of Ad.P60 could promote a more immunologically active TME. These mechanisms, in addition to the inhibition of the tumor intrinsic effect of Foxp3, could be mediating the antitumor efficacy of Ad.P60, which decreased tumor growth
in vivo in BRCA preclinical models and reduced spontaneous lung metastases. This strategy is much simpler than administering the P60 peptide systemically and features the characteristic versatility of Advs, which allow the incorporation of tumor-specific or inducible promoters to restrict the expression of the therapeutic transgene spatially and temporally.
In conclusion, our results indicate that inhibition of Foxp3, by inhibiting Treg function and promoting antitumor activity in BRCA cells, could facilitate not only the efficacy of immunotherapeutic strategies, but it could also improve the response to chemotherapy in BRCA. The possibility of delivering the P60 peptide using Advs could facilitate these treatments. The combination of multiple strategies could help patients with resistant tumors that lack therapeutic alternatives.
Author Contributions
Conceptualization, M.C., A.J.N.C., J.J.L.S. and F.A.Z. ; methodology, M.C., J.A.P.A., A.J.N.C., J.J.L.S., M.A.M.A, and F.A.Z.; validation, M.C., A.J.N.C. and J.J.L.S; formal analysis, M.C., A.J.N.C., and A.S; investigation, A.J.N.C., M.G.F., J.A.P.A., M.P.K., E.S., CG., N.G., M.A.M.A. and F.A.Z.; resources, M.C., F.A.Z., N.C. and J.J.L.S; writing—original draft preparation, A.J.N.C., A.S. and M.C; writing—review and editing, A.J.N.C., J.J.L.S., A.S., F.A.Z., N.G. and M.C; visualization; A.J.N.C. and M.C; supervision, M.C., A.S., F.A.Z. and J.J.L.S; project administration, M.C., J.J.L.S; funding acquisition, M.C., A.S., F.A.Z., N.G. and J.J.L.S. All authors have read and agreed to the published version of the manuscript.
Figure 1.
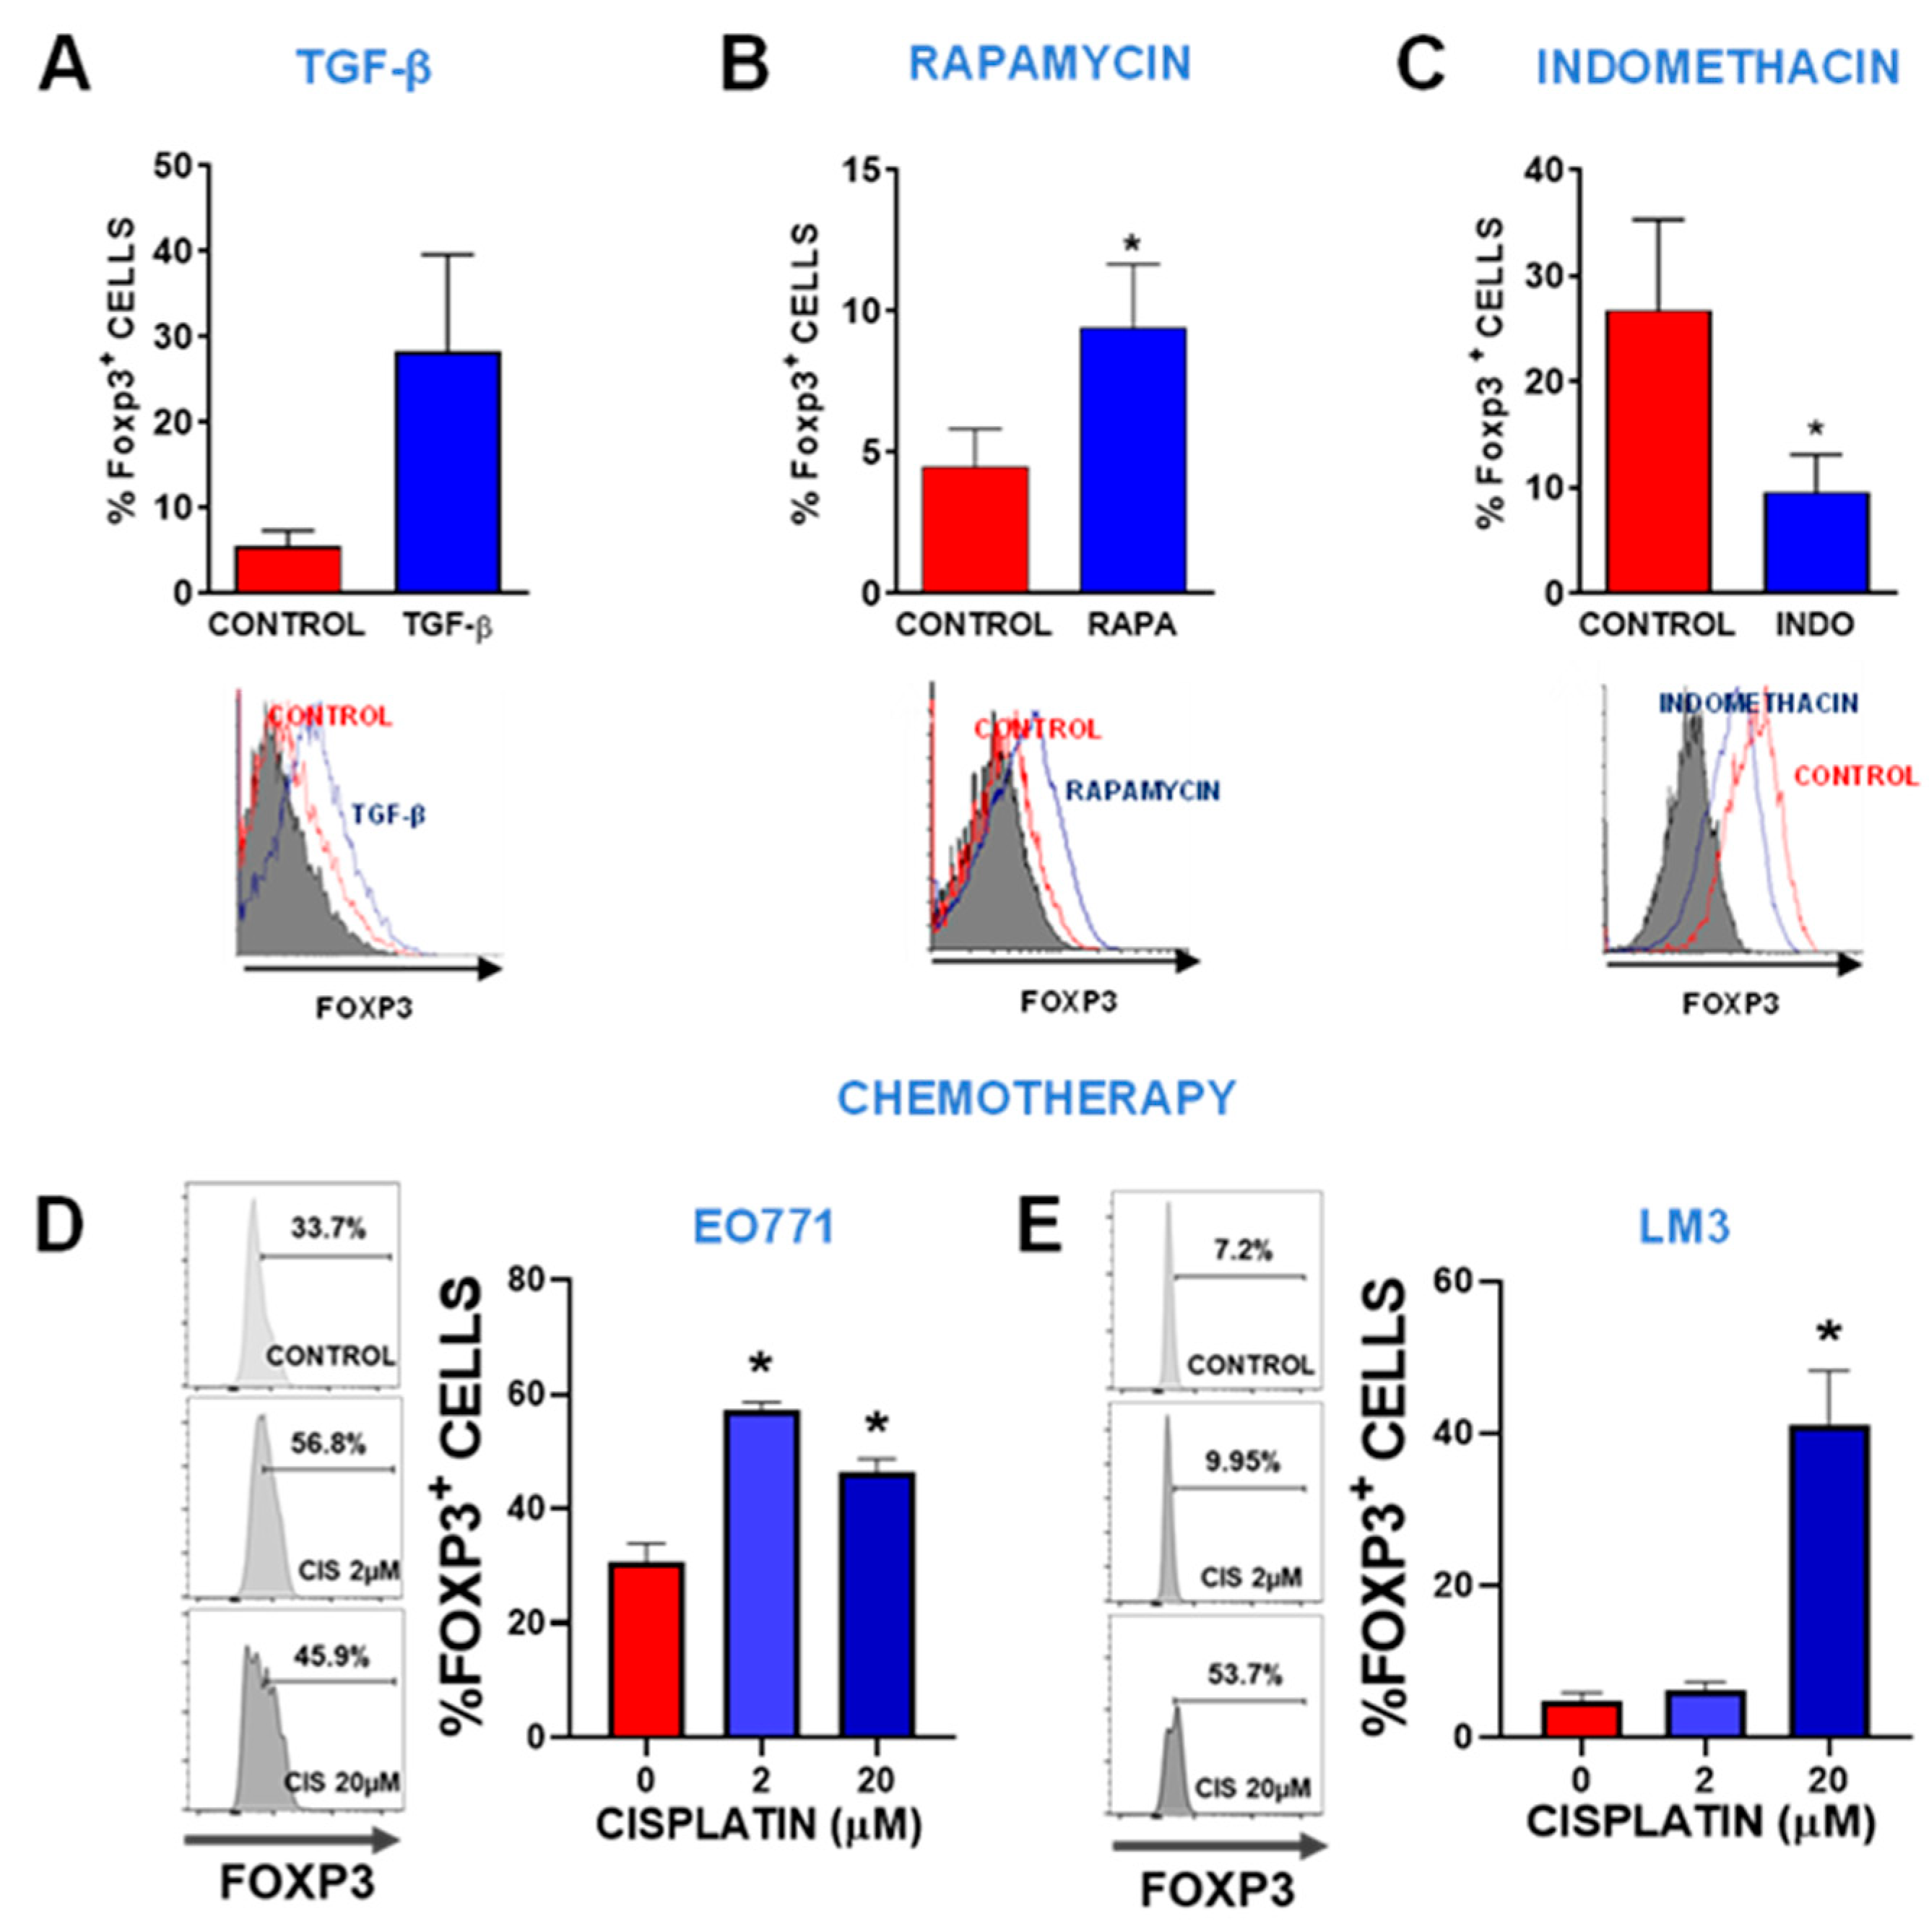
Regulation of Foxp3 expression. Foxp3 expression was assessed by flow cytometry in LM3 cells incubated for 24 h in the presence of 10 ng/ml of recombinant TGF-β (A), 50 μM of the mTOR pathway inhibitor rapamycin (RAPA) (B), and 50 μM of the COX-2 inhibitor indomethacin (INDO) (C). Representative histograms are shown. The histogram of cells incubated with isotype control is shown in gray. *p<0.05 vs control (Student’s t-test). (D) TNBC subtype EO771 breast cancer cells and (E) HER2+ LM3 breast cancer cells were incubated with 2 or 20 μM cisplatin for 48 h and then Foxp3 expression was evaluated by flow cytometry. Representative histograms are shown. *p<0.05, ANOVA.
Figure 2.
Foxp3 tumor intrinsic effects in breast cancer cells: chemoresistance. (A) TNBC EO771 and (C) HER2+ LM3 cells were incubated with peptide P60 or P301 at concentrations 12.5, 25, or 50 μM in presence or absence of 5 μM cisplatin for 72 h. Cell viability was determined by MTT assay. Viability values were expressed as a percentage of control without any treatment. *p<0.05 vs respective control, ˆp<0.05 vs peptide concentrations, 2-way ANOVA. (B) EO771 and (D) LM3 cells were incubated with P301 or P60 (50 μM) in combination with 5 μM cisplatin and viability (by MTT assay) and cell proliferation (by BrdU incorporation) were evaluated 72 h later. *p<0.05 vs P301; ^<0.05 vs respective control without cisplatin, 2-way ANOVA. (E) The activity of caspase 3 was measured in LM3 cells incubated for 48 h with P301 or P60 (50 μM) and cisplatin (5 μM), by fluorescence intensity. (F) LM3 cells were incubated for 48 h with P301 or P60 (50 μM) and cisplatin (5 μM) and the percentage of dead cells was determined by propidium iodide incorporation measured by flow cytometry. Representative histograms are shown and depict the percentage of dead cells. *p<0.05 vs P301; ^<0.05 vs respective control without cisplatin, 2-way ANOVA. (G) The clonogenic capacity of LM3 cells was assessed 72 h after the incubation with P301 or P60 (50 μM) in presence or absence of cisplatin (2 μM), *p<0.05 vs P301; ^<0.05 vs respective control without cisplatin), 2-way ANOVA.
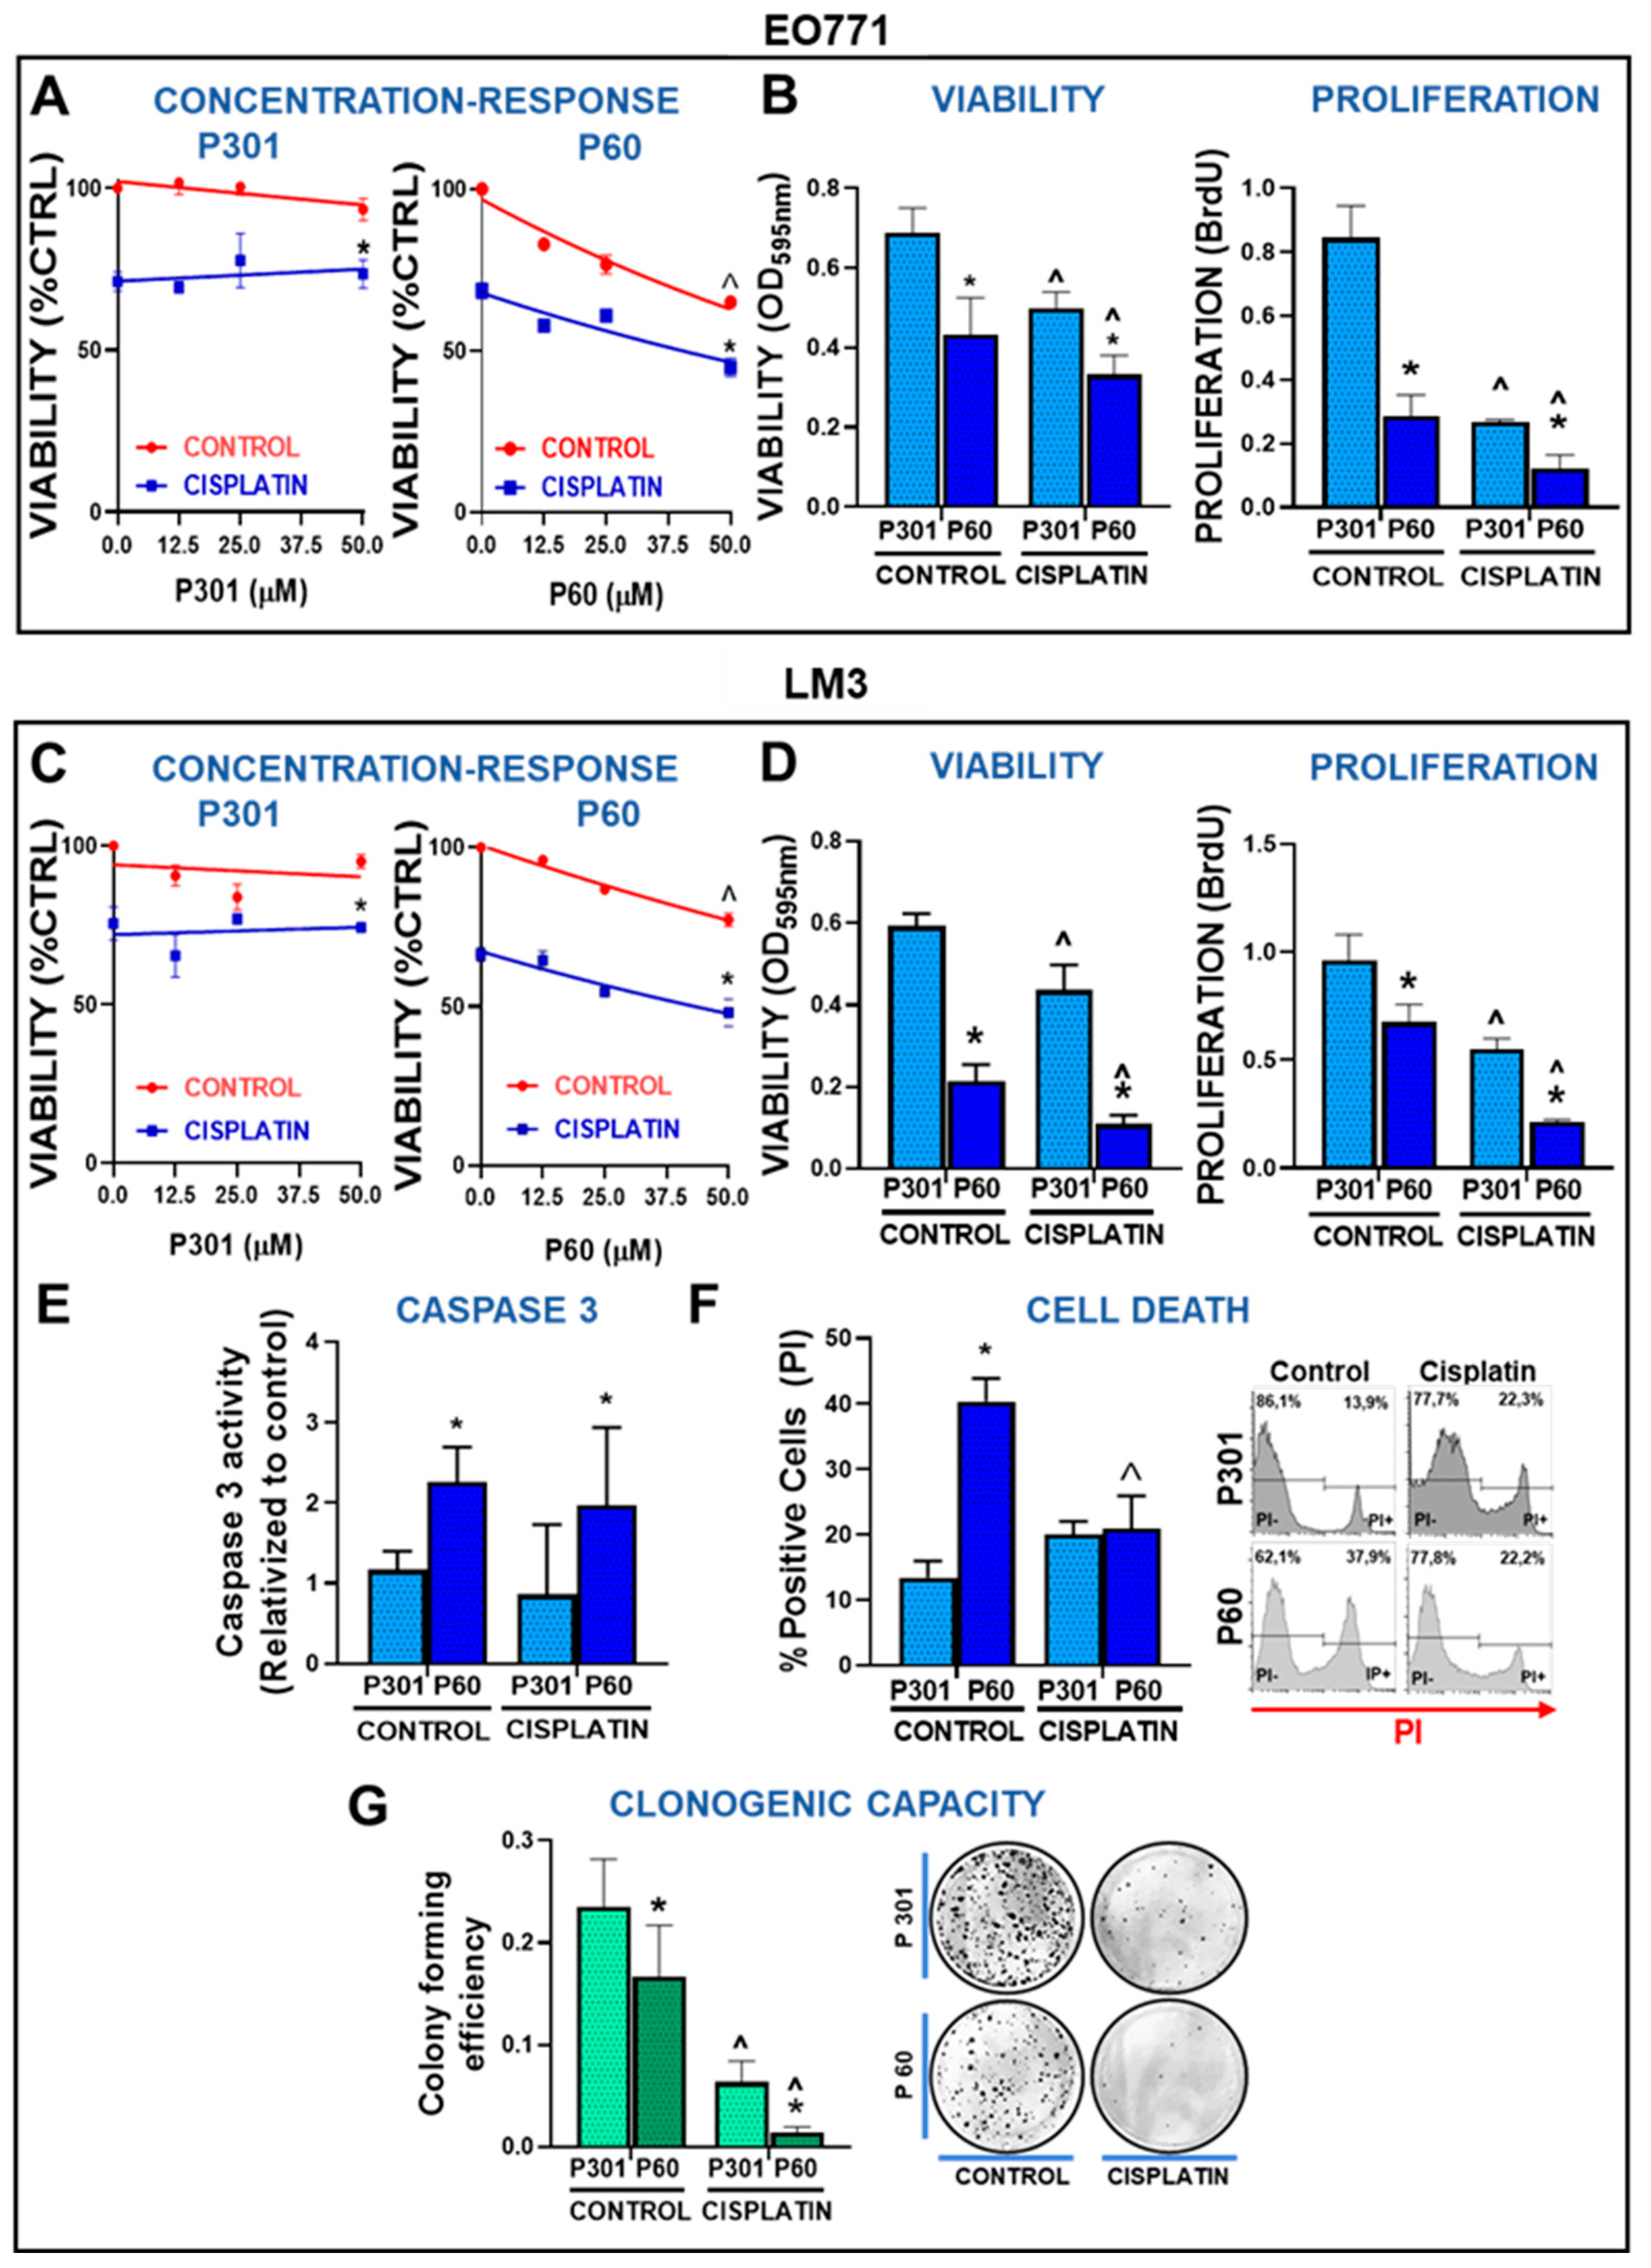
Figure 3.
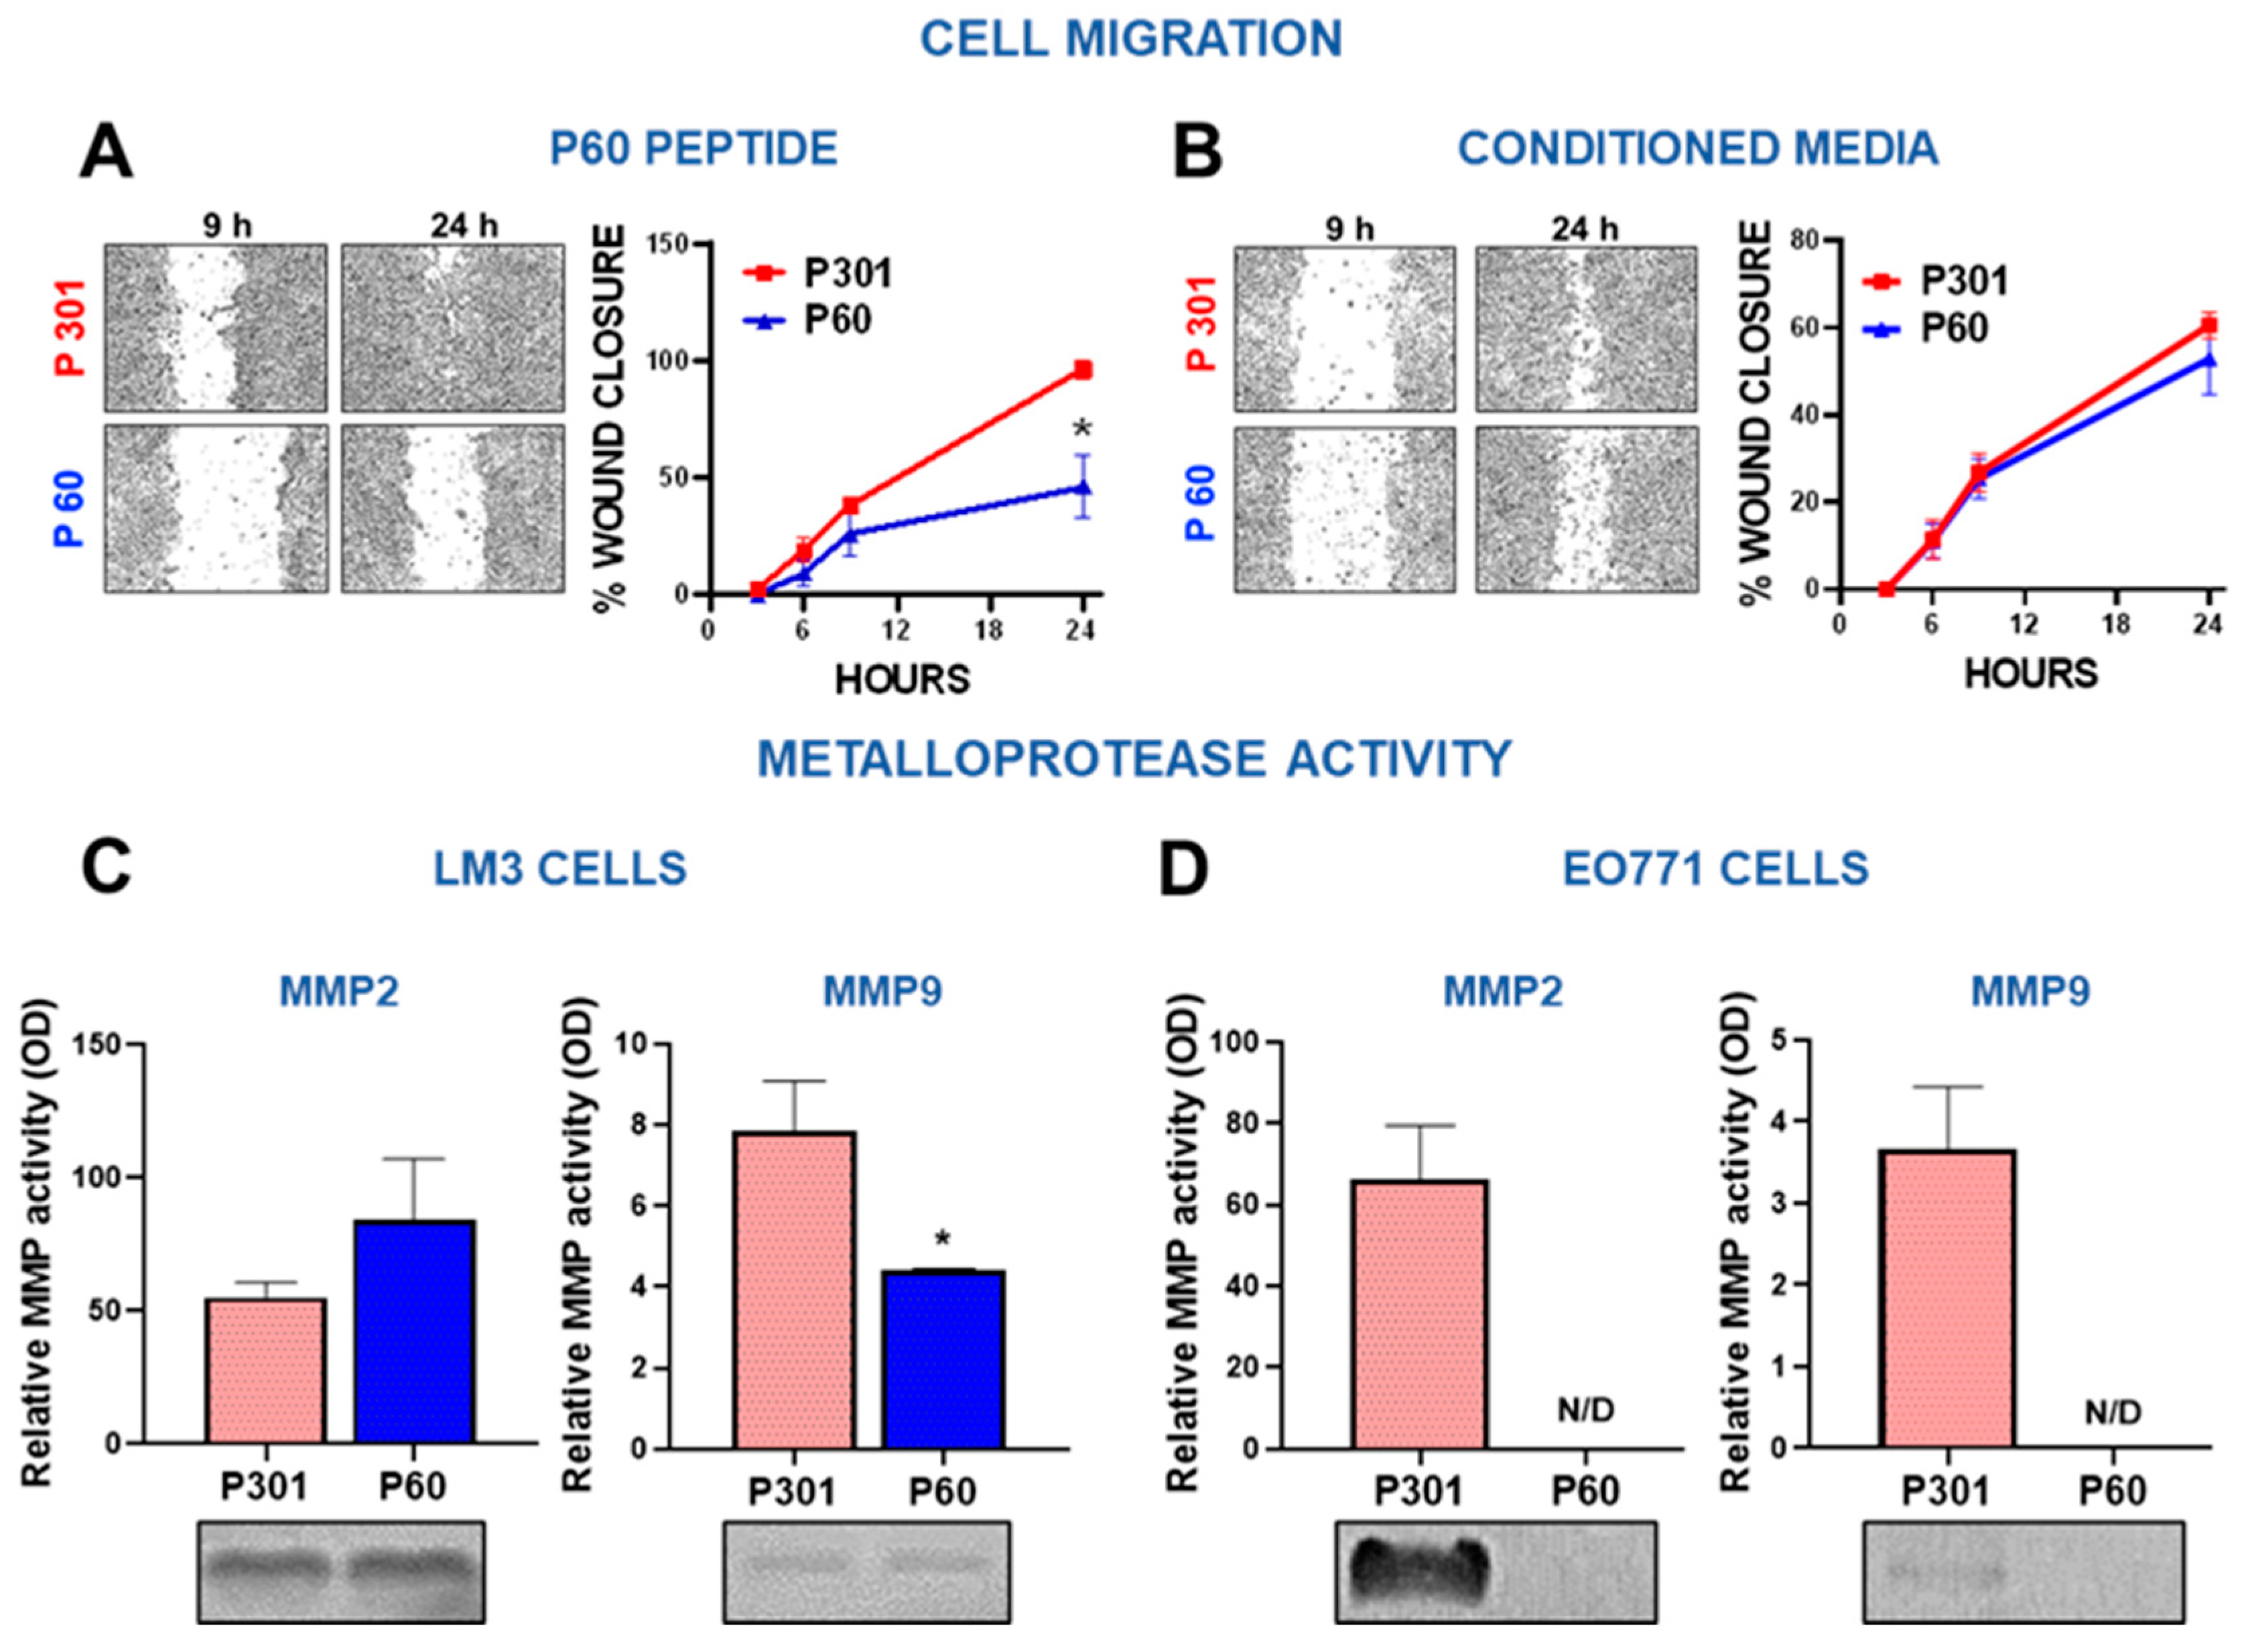
Foxp3 tumor intrinsic effects in breast cancer cells: invasion. (A-B) LM3 breast cancer cells were incubated for 24 h with P301 or P60 (50 μM) (A) or with the conditioned medium of cells previously incubated for 48 h with these peptides (B). The wound assay was performed, and the migratory capacity of the cells was evaluated. Representative microphotographs of the wound at different time points are shown. *p<0.05, non-linear regression analysis. (C-D) The MMP-2 and MMP-9 activity was assessed by zymography in incubation media of EO771 cells (C) and LM3 cells (D) treated with P301 or P60 (50 μM) for 48 h. The gels were stained with Coomassie blue, and the bands analyzed by densitometry with the ImageJ software in triplicate. Zymographic activity was expressed as a percentage relative to a standard internal sample saturating at a density of 50%. Representative bands of each group are shown.
Figure 4.
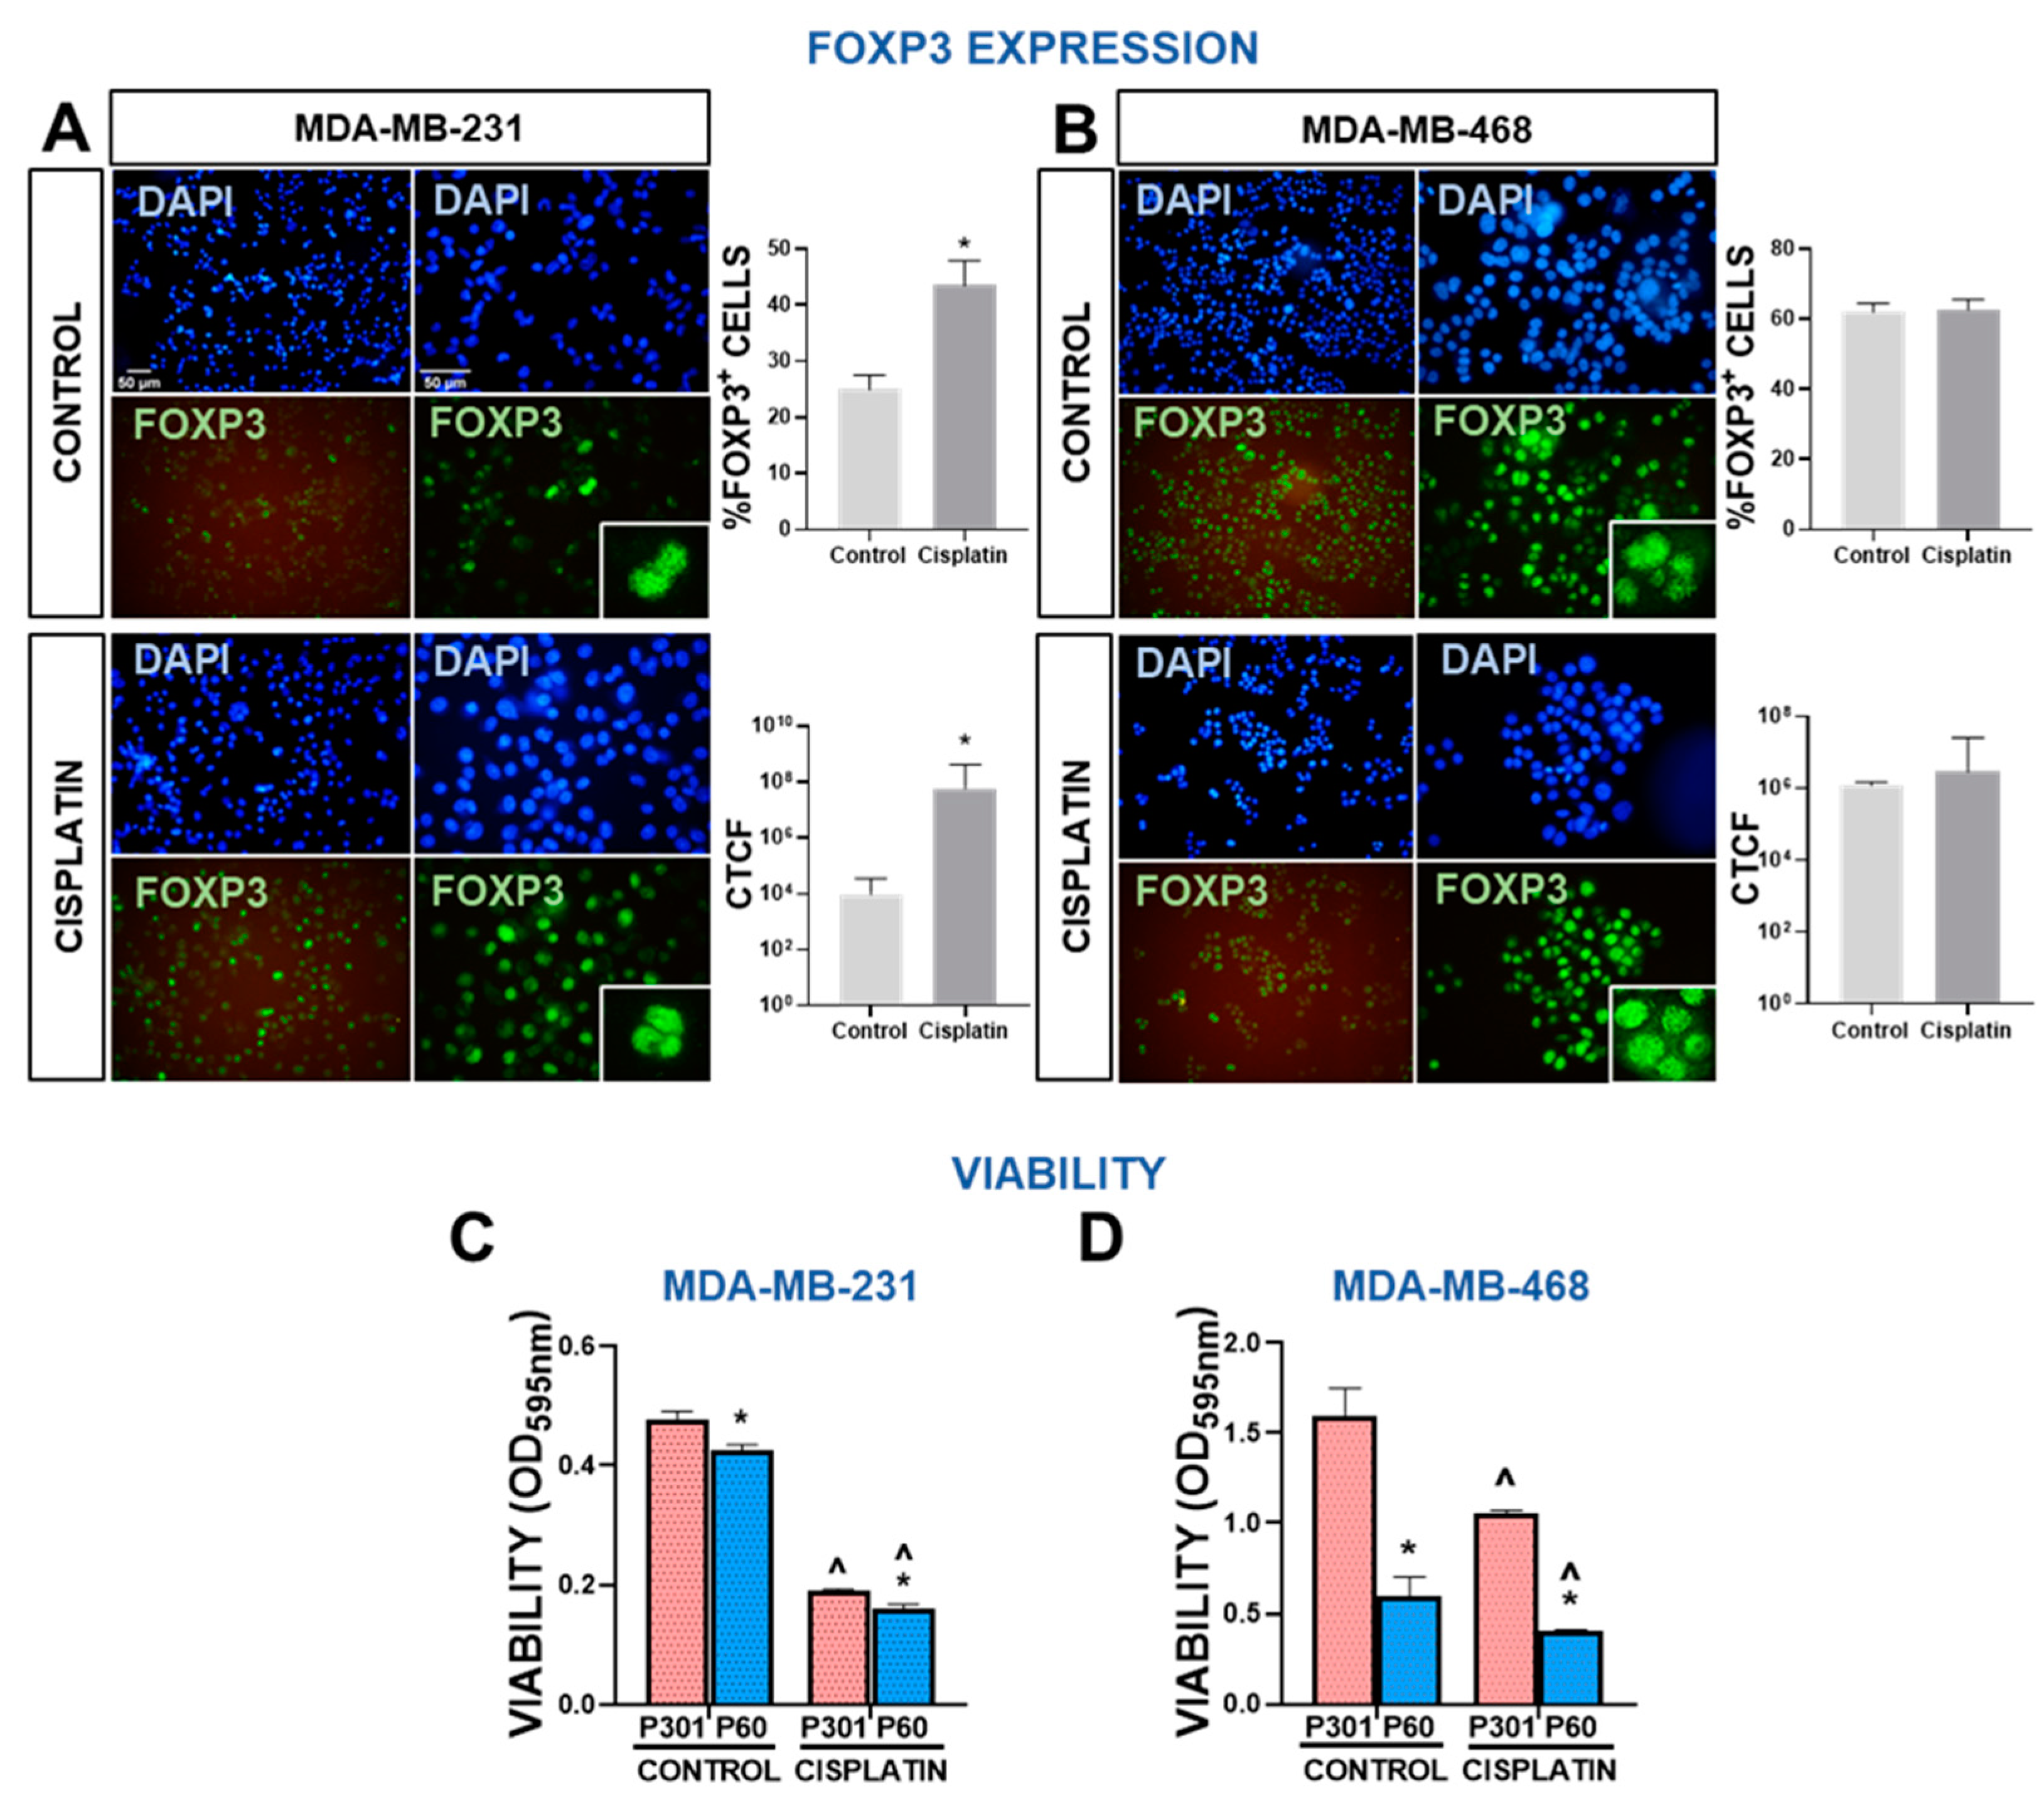
Foxp3 expression and response to chemotherapy in human breast cancer cells. (A-B) Expression of Foxp3 in MDA-MB-231 (A) and MDA-MB-468 cells (B) after incubation with 40 μM and 4 μM cisplatin, respectively was assessed by indirect immunofluorescence. Representative microphotographs show Foxp3 expression (green). Nuclei were counterstained with DAPI (blue). Percentage of cells with high intensity nuclear Foxp3 and intensity of fluorescence, expressed as corrected total cell fluorescence (CTCF), were assessed using ImageJ. *p<0.05 (Student’s t tes’). C-D, Chemosensitivity and viability (by MTT) were evaluated in MDA-MB-231 (C) and MDA-MB-468 cells (D) human TNBC cells incubated for 72 h with P301 or P60 (50 μM) in the presence or absence of cisplatin 5 μM and 2 μM, respectively. *p<0.05 vs P301; ^<0.05 vs respective control without cisplatin, 2-way ANOVA.
Figure 5.
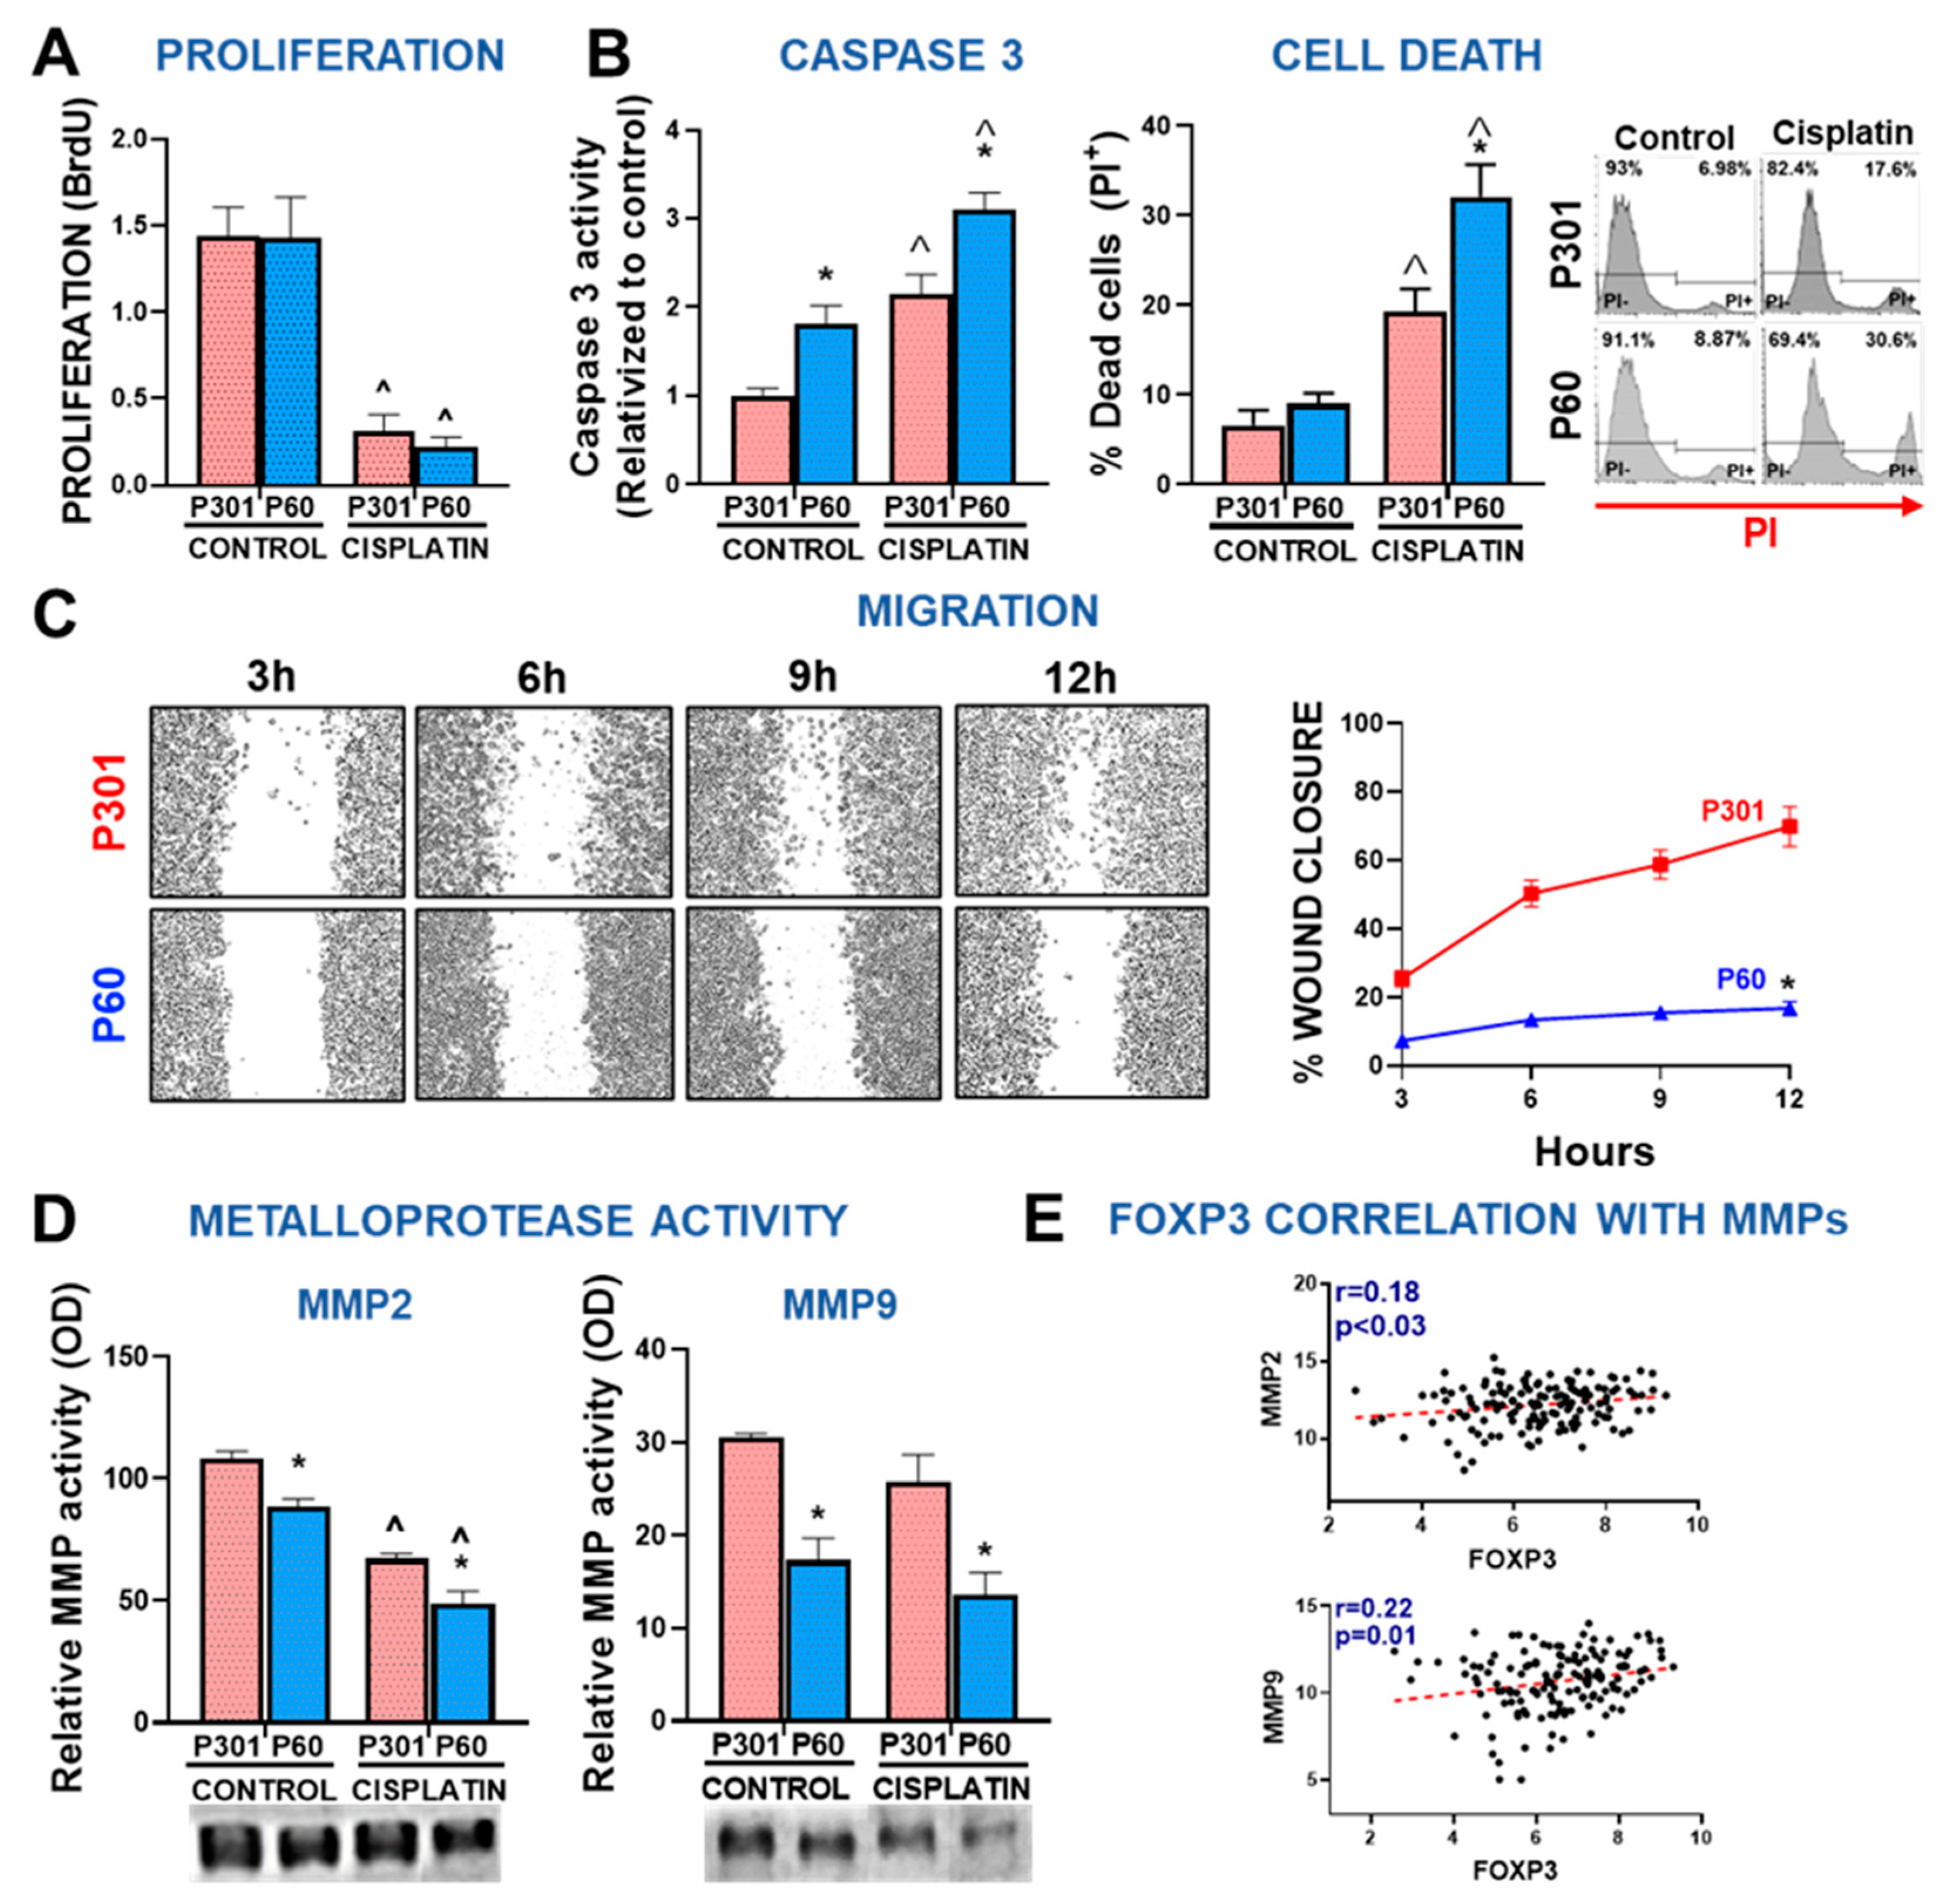
Foxp3 tumor intrinsic effects in human breast cancer cells: chemoresistance and invasion. Proliferation (A), apoptosis (B), migration (C) and secretion of active MMPs (D) were evaluated in MDA-MB-231 cells incubated for 72 h with P301 or P60 (50 μM) in the presence or absence of cisplatin 5 μM. *p<0.05 vs P301; ^<0.05 vs respective control without cisplatin; C, D and F, 2-way ANOVA; E, Non-linear regression analysis. (G) Spearman correlation r values between FOXP3 levels and MMPs mRNA levels from TNBC biopsies from TCGA BRCA database.
Figure 6.
Development and characterization of an adenoviral vector encoding Foxp3 inhibitory peptide P60. (A) LM3 cells were incubated for 24 h with conditioned medium from 4T1 cells transfected with a plasmid encoding P60 (pl.P60) or a control plasmid (pl.dT) for 24 h. Proliferation (left panel) and IL-10 secretion (right panel) were evaluated. *p<0.05 (Student’s t test). (B) Schematic representation of the vector encoding P60 (Ad.P60) or its control (Ad.dT). (C) Murine LM3 and EO771 cells, and human MDA-MB-231 breast cancer cells were transduced with Ad.P60 for 48 h at multiplicity of infection (MOI) of 200. Transduction efficiency was assessed by detection of cells expressing the reporter gene dTomato using fluorescence microscopy. Nuclei were stained with DAPI. (D) Direct effect of Ad.dT and Ad.P60 was evaluated in EO771 cells transduced with the vectors at MOI of 500 in combination with cisplatin (5 μM). After 72 h of transduction viability was assessed by MTT. *p < 0.05 vs control, ˆ<0.05 vs respective control without cisplatin; 2-way ANOVA. (E) Murine splenocytes were incubated in the presence of P301 or P60, or with conditioned medium (CM) from EO771 transduced cells and activated with αCD3 and αCD28 antibodies. T cell proliferation was assessed by BrDU incorporation. *p < 0.05 vs basal control, ˆp<0.05 vs peptide P60 2-way ANOVA.
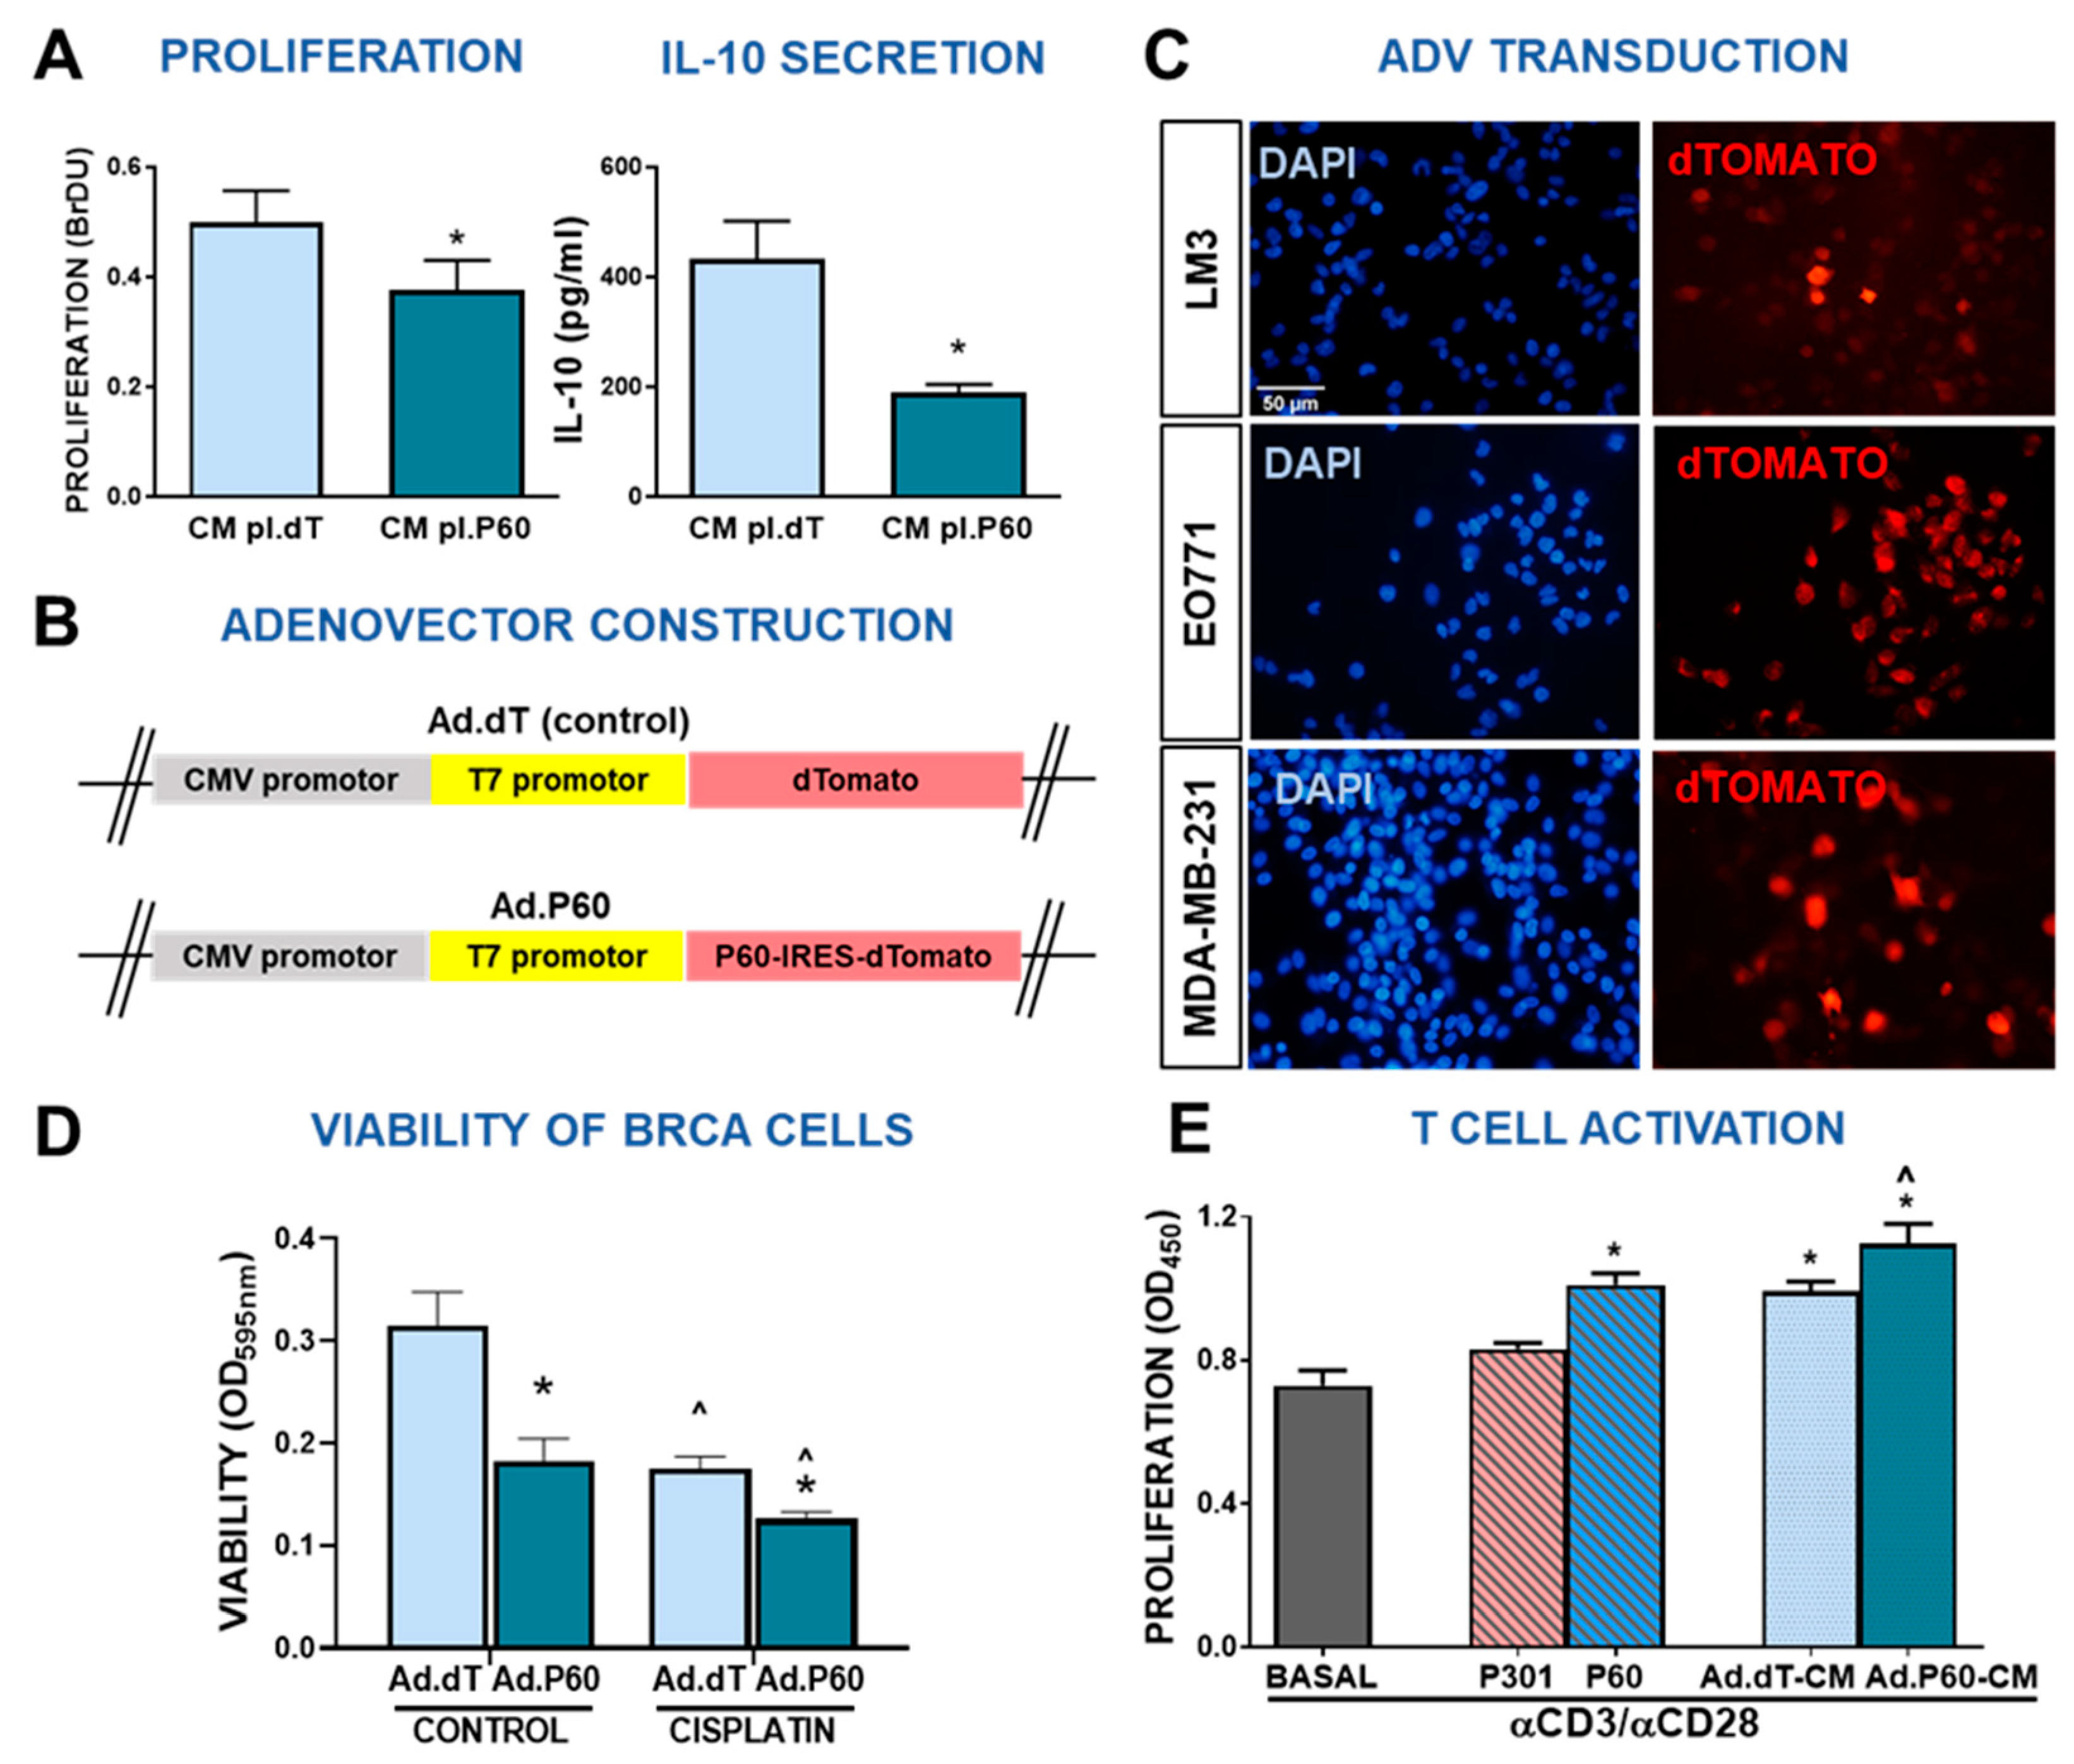
Figure 7.
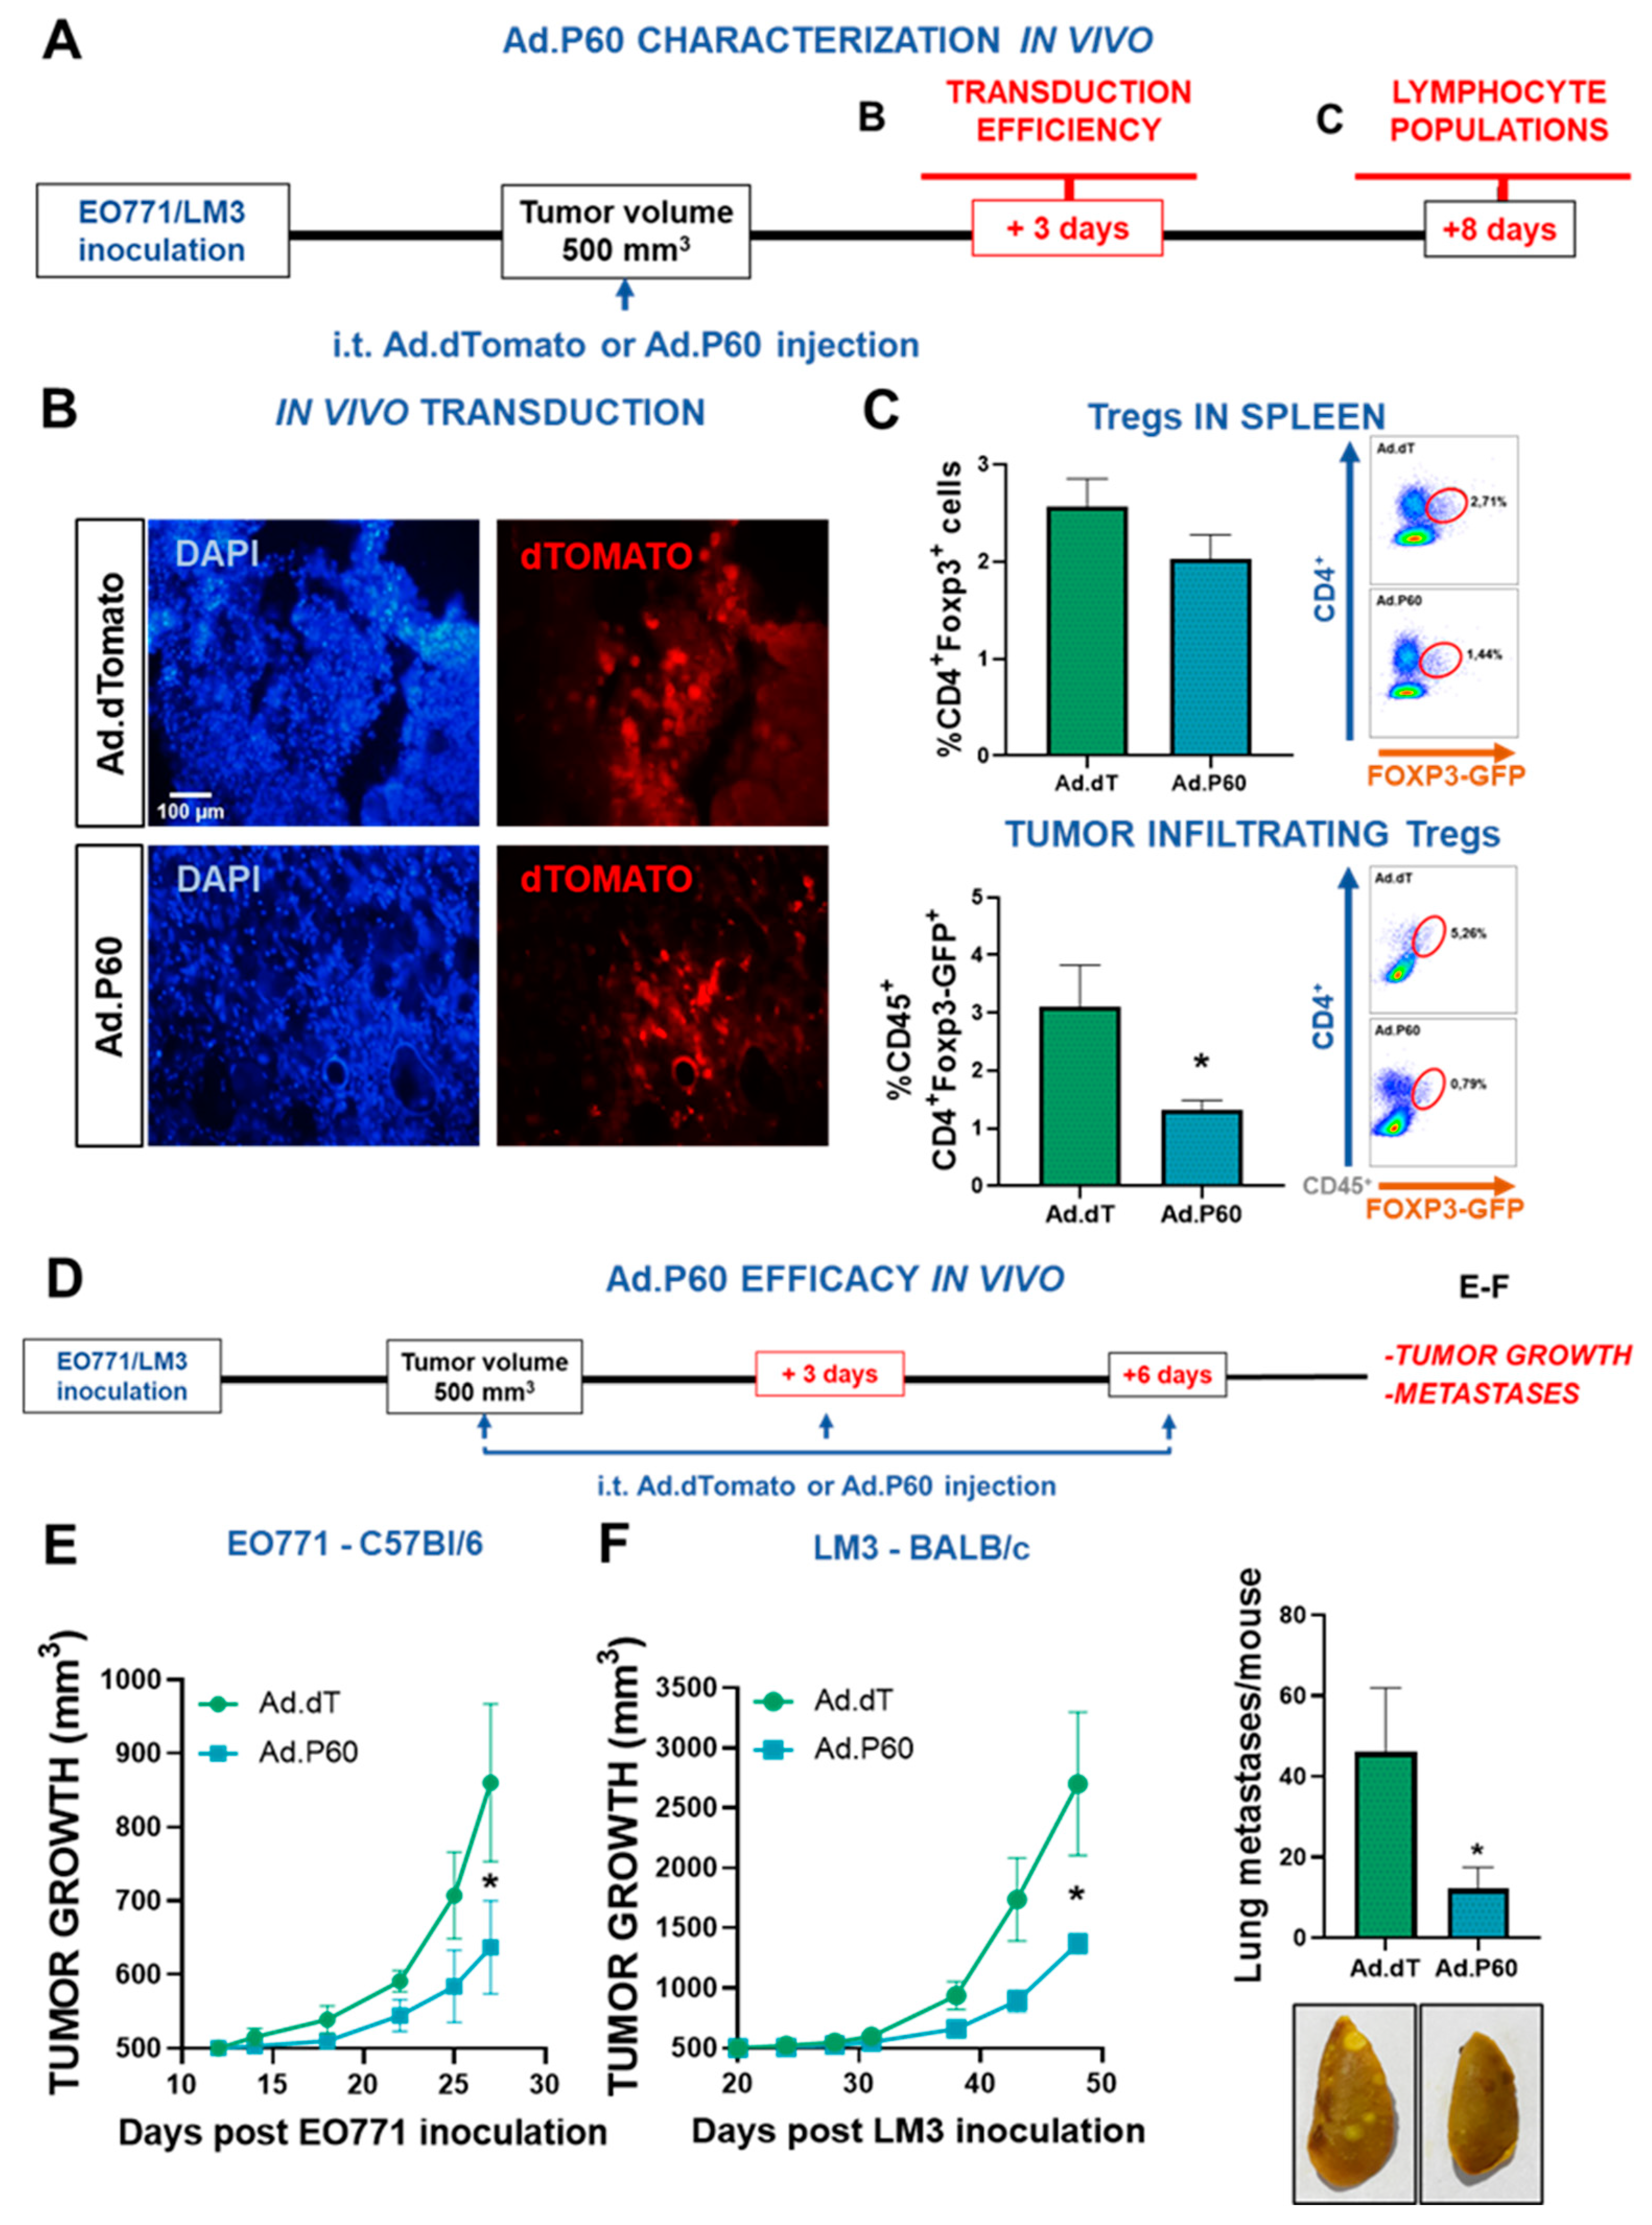
Efficacy of Ad.P60 in experimental breast cancer models. (A) C57Bl/6 mice were administered subcutaneously with 200,000 EO771 cells. When tumor volume reached 500 mm3, mice were treated i.t. by inoculating 6.3x10⁷UFP of Ad.dT or Ad.P60. (B) After 3 days, transduction efficiency was evaluated in tumor cryostat slices by detection of the reporter protein dTomato by fluorescence microscopy. The nucleus of the cells was stained with DAPI. (C) 8 days after inoculation, spleen and tumor-infiltrating Tregs populations were evaluated in C57Bl/6J mice transgenic for Foxp3-GFP. Immune populations were analyzed by flow cytometry, studying the presence of CD4+ Foxp3-GFP+ T cells (Student’s t test; *p<0.05). (D) Tumor growth was evaluated in C57Bl/6 bearing syngeneic EO771 tumors (E) and BALB/c mice bearing LM3 tumors (F) that were treated with 3 intratumor injections of Ad.dT or Ad.P60. *p<0.05. Multiple regression analysis. (F) Total number of spontaneous lung metastases in each mouse bearing LM3 tumors. Representative images of lungs are shown, *p <0.05 (Student’s t test).
