
Submitted:
31 July 2023
Posted:
02 August 2023
You are already at the latest version
Abstract
The purpose of this study was to compare Electromyographic (EMG) with Mechanomyo- 1
graphic (MMG) recordings during isometric conditions, and during a simulated load-lifting task. 2
Twenty-two males (age: 25.5 ± 5.3 years) first performed maximal voluntary contractions (MVC) and 3
submaximal isometric contractions of upper limb muscles at 25%, 50% and 75% MVC. Participants 4
then executed repetitions of a functional activity simulating a load-lifting task above shoulder level, 5
at 25%, 50% and 75% of their maximum activity (based on MVC). The low frequency part of the 6
accelerometer signal (< 5 Hz) was used to segment the 6 phases of the motion. EMG and MMG were 7
both recorded during the entire experimental procedure. Root mean square (RMS) and mean power 8
frequency (MPF) were selected as signal extraction features. During isometric contractions, EMG 9
and MMG exhibited similar repeatability scores. They also shared similar RMS vs force relationship, 10
with RMS increasing to 75% MVC and plateaued to 100%. MPF decreased with increasing force to 11
75% MVC. In dynamic condition, RMSMMG exhibited higher sensitivity to changes in load than 12
RMSEMG. These results confirm the feasibility of MMG measurements to be used during functional 13
activities outside the laboratory. It opens new perspectives for future applications in sports science, 14
ergonomics and human-machine interfaces conception.
Keywords:
Mechanomyography
; Electromyography
; isometric contractions
; dynamic contractions
; load-lifting
1. Introduction
Today, measuring muscle activity in ecological situations is a major issue. It could allow a better understanding of the neuromuscular system and its adaptations with the environment compared to isolated contractions in the laboratory. It may also have significant applications. In sports science, assessing muscle load may enhance performance optimization strategies, injuries prevention monitoring and rehabilitation. In physical ergonomics, muscle evaluation can help reduce work-related musculoskeletal disorders through workplace assessment and reconception [1]. In human-machine interface conception, recording muscle activity in real-time can be useful to control assisting device such as active exoskeletons, cobots and myoelectronic prosthesis.
To effectively measure muscle activity in functional and ecological situations, the method used should be easy to set up and to use, robust in all environments and during prolonged duration acquisitions. Today, the reference method for muscle activity measurement is electromyography (EMG), which measures the electrical activity of muscles. However, it requires skin preparation and a precise sensor placement for reproducible results [2,3], making it hard to use and to set up outside of a laboratory. Moreover, EMG is sensitive to interference and changes in impedance, making it non-robust to the environment and during extended time acquisitions, when sweating occurs for example [4]. Finally, EMG is sensitive to motion artifacts because of the electrodes shift relative to muscle fibers in dynamic muscle actions [5,6]. All together, these limitations make EMG hardly suitable for recording muscle activity in functional and ecological conditions [3].
Other techniques have emerged for recording muscle activity such as mechanomyography (MMG), the mechanical counterpart of EMG, which is the measurement of the low-frequency lateral oscillations of active muscle fibers [7]. MMG reflects three physiological phenomena: (i) the gross lateral movement of the muscle at the start of the contraction, (ii) subsequent vibrations at the muscle’s resonance frequency, and (iii) dimensional changes of active muscles fibers [8]. MMG can be obtained by multiple means: piezoelectric crystals, condenser microphones, displacement lasers, and accelerometers [9]. Yet, accelerometers are often preferred because of their flat frequency range, ease of fixation on the skin, inexpensiveness, lightweight, and their measurement in physical units (). However, accelerometers are highly sensitive to motion artifacts [10]. Thus, without proper filtering or experimental design, the MMG signal could be polluted with motion artifacts, biasing its interpretation. Most studies used a band-pass filter between 5 and 100 Hz to eliminate both motion artifacts and high frequency noise [8]. Recently, advances in MMG signal processing methods have led to more efficient motion artifact filtering in dynamic conditions [11,12]. Being sensitive to motion could also be viewed as a strong argument in favor of accelerometer-based MMG, as the low-frequency part of the signal (motion accelerations) can be used as a segmenting tool [13], making the most out of the overall signal.
MMG appears to have a number of advantages over EMG such as no skin preparation, ease of fixation, less sensitivity to sensor placement [14], making it more convenient. Moreover, it is more robust than EMG thanks to its non-sensitivity to changes in impedance and interference, thus guaranteeing signal quality over long periods of time. They can also be used in a "2 in 1" fashion, for both measuring muscle activity and segmenting postures and motions. All together, these technical aspects make MMG a convenient and suitable alternative to EMG for measuring and segmenting functional activities in controlled environments and ecological situations.
Despite a great number of studies regarding isometric and isokinetic contractions, very little MMG literature characterizes MMG under poly-articular functional activities such as squatting [3,13]. To the best of our knowledge, no MMG studies were found regarding load-lifting tasks, despite being omnipresent in sports, manual work and daily activities. First of all, such research could assess the validity of MMG measurements under these conditions. Moreover, it could provide significant insights about muscle synergies and neuromuscular adaptations in functional situations.
Thus, the objectives of this study are twofold: (i) comparing a new accelerometer-based MMG system to an EMG reference system during isometric contractions and (ii) analyzing a load-lifting task with both MMG and EMG to explore MMG applications during complex dynamic conditions.
2. Materials and Methods
2.1. Participants
Twenty-two active male participants (age: 25.5 ± 5.3 years; height: 1.79 ± 0.07 m; weight: 75.7 ± 11.9 kg) participated in this study. Each participant was right-handed and was not subject to any musculoskeletal disorder in the last six months. Participants provided written informed consent before taking part in this experiment. This study was approved by the Academic Research Ethics Committee (Université Paris-Saclay, 2021-287). Prior to EMG sensor placement, the skin was shaved and sanitized with 70% alcohol soaked wipes.
2.2. Sensors
EMG signal was recorded using sensors (Miniwave, Cometa, Italy) sampled at 2000 Hz and positioned following the SENIAM recommendations [2]. MMG signal was recorded using triaxial accelerometer sensors (Moten Technologies, Puteaux, France) with a 1000 Hz sampling rate. Each sensor was placed on the muscle’s belly following recommendations from the literature [15]. A force sensor was used to measure external force at wrist level with a sampling rate of 2000 Hz (2715-ISO, Sensy, Jumet, Belgium). Sensors were placed only on the dominant arm of each subject.
2.3. Isometric testing procedure
The isometric testing procedure comprised two parts: (i) the measurement of the maximum voluntary contraction (MVC) of the biceps brachii (BB), triceps (TRI), and the deltoid anterior (DEL) muscles, and (ii) the submaximal contractions at 25%, 50% and 75% of MVC for each muscle.
For the MVC measurements, participants had to perform three maximal contractions of 3 seconds onto the force sensor attached to an adjustable metallic structure. Trials were separated by two-minute rest periods. For the BB and the TRI muscle, the participant had the elbow flexed at 90° against the body and the force sensor was placed on the wrist. The force sensor was facing downward for the BB and upward for the TRI. For the DEL muscle, the arm was extended forward parallel to the ground with the force sensor on top of the wrist facing downward. For each muscle, the MVC value was defined as the highest value obtained across the three trials [16].
The participant then had to maintain sub-maximal contractions at 25, 50, and 75% of MVC for 15 seconds, thanks to a visual feedback of force level displayed on a screen. Each sub-maximal contraction was repeated three times, with a 1.5-minute rest period.
2.4. Dynamic testing procedure
The dynamic testing consisted of 10 repetitions of a load lifted above shoulder level with both hands. The different weights of the load were derived from the MVC obtained for the BB muscle in the isometric condition. More precisely, the force obtained during MVC was converted into a mass to lift (25%, 50%, and 75% MVC). Indeed, BB was chosen over TRI and DEL muscles as a reference because it was the strongest muscle of the three and thus allowed to have the largest load differences between intensities. Each repetition started with lifting the charge from the mid-tibia level to above shoulders level and getting back into the initial position (see Figure 1). The participant was asked to maintain a constant speed throughout every repetition. Repetition rate was set at six seconds using a metronome. Prior to the experiment, participants had a training session with an empty bar (2 kg) to practice the movement, technique, and required rate.
2.5. Signal processing
EMG and force signals were collected through the QTM software (Qualisys, Göteborg, Sweden) allowing their synchronization. MMG signal was obtained using another software (Moten Technologies, Puteaux, France). EMG and MMG signals were band-pass filtered between 20-500 Hz [5] and 5-100 Hz [15] respectively.
For the isometric testing procedure, each trial was segmented to select the 33% middle part of the contraction time according to previous studies [7,16,17,18].
The amplitude of EMG and MMG signals were calculated by taking the root mean square (RMS) value of the segmented portion. The RMS values from EMG and MMG for each muscle were normalized from the average RMS values obtained during the three MVC trials [19]. The studied variables are referred to as and . To estimate the signal frequency content, a Fast Fourier Transform was performed over the segmented data and the mean power frequency (MPF) was calculated. The studied variables are referred to as and . Despite the non-stationarity of EMG and MMG signals during isometric and dynamic contractions, Fourier-based methods were shown to be acceptable during moderate velocity actions for estimating their frequency content [20].
and were computed following equations 1 and 2 respectively [21]:
where X, Y and Z represent the 3 axes of the accelerometer.
For the dynamic testing, the accelerometer was first low-pass filtered at 5 Hz to keep only the motion data (MOT), which is composed of low frequency accelerations [10]. We used the MOT signal of the accelerometer located on the BB muscle to compute the sensor’s pitch angle following equation 3:
where X, Y and Z represent the 3 axes of the accelerometer.
was used to segment phases of (1) pulling the load from the mid tibia to hip level (from posture a to b), (2) pulling the load from hip level to shoulder level (from posture b to c), (3) pushing the load above shoulder level (from posture c to d), (4) lowering the load to shoulder level (from posture d to c), (5) lowering the load to hip level (from posture c to b) and (6) lowering the load to the mid tibia level (from posture b to a) see Figure 1 and Figure 2. Like isometric testing, we used the RMS and MPF to calculate signal amplitude and frequency content over the segmented data. EMG and MMG data from dynamic contractions were not normalized since there were no dynamic MVC measurements.
2.6. Statistical analysis
For the isometric testing, repeatability tests of absolute and between intensities and muscles, were conducted based on intraclass correlation coefficients ICC (3, k) over the three trials for each muscle, following methodological recommendations [22]. Repeated-measures analyses of variances (ANOVA) were carried out to study the combined effects of muscles (BB/TRI/DEL) and intensities (25/50/75/100% MVC) on , , , and .
For the dynamic testing, an ICC (3, k) was conducted in order to quantify the repeatability of the MOT data over intensity levels for each muscle. Because EMG and MMG signals were not normalized in dynamic condition, two-way repeated measures ANOVAS () were conducted for , , , and separately for each muscle. We excluded phases 1 and 6 from the analysis because the recruitment of the three upper limb muscles during theses phases was negligible. Post-hoc analyses were conducted using the Bonferroni correction. When an intensity × phase interaction was found, we focused on the paired comparisons only between the concentric and eccentric phases of the motion where each muscle was recruited the most. For the BB muscle, phases 2 and 5 were identified the concentric and eccentric phases respectively (see Figure 1). For TRI and DEL muscles, phases 3 and 4 were identified as concentric and eccentric phases respectively (see Figure 1). Average MMG and EMG RMS amplitudes in relation to % MVC were examined using a linear regression model and Pearson’s correlation test for each muscle and subject. Independent t-tests were performed to compare EMG and MMG corresponding determination coefficients . All statistical analysis was conducted on JASP version 0.17. An alpha of 0.05 was considered significant for all comparisons and correlations. All data are presented as mean ± standard deviation.
3. Results
3.1. Isometric testing
3.1.1. Time domain analysis
The two-way repeated-measures ANOVA revealed a significant effect of intensity level on the normalized force data (, , ). Post hoc analysis showed that all force levels were significantly different from one another. All EMG and MMG isometric testing results are displayed in Table 1.
For both EMG and MMG, all ICC point estimates, lower and upper 95% confidence intervals were greater than 0.9. There was no significant effect of intensity level on ICC ratings. The ANOVA on exhibited a significant effect for muscle (, , ), intensity (, , ) and a significant interaction (, , ). Similarly, the ANOVA on showed a significant effect for muscle (, , ), intensity (, , ), and a significant interaction (, , ). Pairwise comparisons highlighted that, for all muscles, all and values were significantly different from one another, except between 75% and 100% MVC.
3.1.2. Frequency domain analysis
Two-way ANOVA on showed a significant effect of muscle (, , ) and intensity (, , ) on . Post-hoc analysis revealed that at 75% MVC was lower than MPF at other intensities.
The ANOVA on yielded significant effects of muscle (, , ) and intensity (, , ). Post-hoc analysis revealed that at 25% and 50% MVC were larger than 75% and 100% MVC.
3.2. Dynamic testing
3.2.1. Time domain analysis
The ICC results to assess the repeatability of MOT data between intensity levels for each muscle were: 0.96 for the BB, 0.99 for the DEL, and 0.98 for the TRI.
All two-way repeated-measures ANOVA on and revealed a significant effect of intensity, phase and a significant intensity × phase interaction for each muscle (view Table 2).
Intensity levels:
Post-hoc analysis highlighted that for the BB muscle, values were significantly different between intensity levels except between 25% and 50% MVC in phase 5 (eccentric contraction). For the TRI muscle, values were different between intensities except between 50% and 75% MVC in phase 3 (concentric contraction). For the DEL muscle, values were different between all intensities for both concentric and eccentric phases of contraction.
For EMG, RMS values of the BB muscle were different between 25% and 75% MVC for phase 2 and 5 (concentric and eccentric contractions), however there were no RMS differences between 50% and 75% MVC for phase 2 and between 25% and 50% MVC for phase 5. For TRI, RMS values were only different between 25% and 75% MVC for phase 3 (concentric contraction). For DEL, RMS values were different from each other except between 50% and 75% MVC for phase 3 (concentric contraction) (see Figure 3).
Concentric vs eccentric:
For MMG, there was no difference in RMS between concentric and eccentric phases for the BB muscle for all intensity levels. For the TRI and DEL muscles, RMS during the concentric contraction (phase 3) was lower than the eccentric part (phase 4) for 50% and 75% MVC.
For EMG, there was no difference in RMS between concentric and eccentric phases for the BB and TRI muscles for all intensity levels. For the DEL muscle, RMS values during its concentric contraction was greater than the eccentric contraction for all intensity levels ().
EMG and MMG RMS vs % MVC relationship:
For BB and TRI muscles, MMG were significantly greater than EMG ( and respectively). For the DEL muscle, there was no difference between EMG and MMG mean determination coefficients (see Figure 4).
3.2.2. Frequency domain analysis
All two-way repeated-measures ANOVA on and are presented in Table 2).
Intensity levels:
Post-hoc analysis indicated that for MMG, TRI MPF decreased with increasing load. MPF at 75% MVC was significantly lower than 25 and 50% MVC. EMG MPF for the TRI and DEL highlighted similar results where MPF decreased significantly between all intensity levels.
4. Discussion
The aim of this study was to assess the feasibility of MMG measurements in complex dynamic situations by comparing MMG to EMG, which is the reference system to measure muscle activity, during isometric contractions and a load lifting task at different intensities. Twenty-two male participants took part in this study, consisting of sub-maximal isometric contractions at 25%, 50% and 75% MVC of the BB, TRI and DEL muscles. Participants then performed repetitions of a lifting task from the ground and raising it above the shoulders at three relative intensity levels. MMG and EMG signals were acquired for biceps, triceps and deltoid of the dominant arm.
4.1. Isometric testing
4.1.1. Time domain analysis
Overall, MMG repeatability scores obtained in this study can be considered excellent [23] and were higher than results previously related to MMG studies [24,25]. As an example, a relatively recent study obtained ICC score of 0.79 with a microphone MMG [26].
results obtained in this study agree with previous investigations and the most recent MMG review article [27]. In this review, it has been shown that increases with force up to 80% MVC and reaches a plateau or even decreases to 100% MVC in isometric condition. Authors have suggested that an increase in with force is due to the increasing number of active motor units to produce force. However, at higher intensities, an increase in muscle stiffness, which is a function of attached cross-bridges and fusion of motor-units twitches, causes an MMG amplitude plateau or a drop [27]. Similar behavior was shared with EMG, as the amplitude increases to 75% MVC and plateaus at MVC in the current study. EMG results were also in agreement with previous studies and reviews [27,28]. These results suggest that at approximately 75% MVC, the major part of motor units (MU) is recruited [27].
The evolution of MMG and EMG amplitude as a function of force level has been showed to be muscle specific [16] but accounted only for a very small portion of the total variance ( and in the current results for MMG and EMG, respectively).
4.1.2. Frequency domain analysis
decreased from 25% to 75% MVC and increased to the initial value at 100% MVC. This result agrees with previous investigations in step isometric contraction for which authors found a similar decreasing trend from 20% to 80% MVC [29]. decreased from low intensities (25-50% MVC) to high intensities (75%-100% MVC).
For both EMG and MMG, MPF correlates with the motor units firing rate. As MPF decreased with increasing intensity, we can conclude that the increase in force was modulated by the increasing number of active motor units and by the decrease in the global motor units firing rate. Other authors suggested that muscle stiffness and/or intramuscular pressure, with increasing intensity, could impair the firing rate of motor units [30]. This impairment has been shown to stabilize or even decrease the with increasing force in step contractions.
4.2. Dynamic testing
4.2.1. Time domain analysis
Thanks to the repeatability analysis of the MOT data and the ICC scores, it was verified a posteriori that there were no significant kinematic differences between the different-load trials that could lead to misinterpretations of the MMG and EMG signals.
In the current study, we observed a significant effect of intensity, where and increased linearly with load. This result agrees with those obtained in isometric testing and in previous investigations during mono-articular isokinetic condition [7,18,31].
It was found that the of the solicited muscle was greater in the concentric part of the contraction than the eccentric part, although an inverse behavior was found for MMG RMS. Theses results agree with previous findings in isokinetic condition for which authors concluded that muscular tremor was greater during the eccentric part of the contraction [32]. These results are also consistent with those obtained in an unloaded squatting task for which the of the rectus femoris was greater entering (eccentric phase) compared to exiting the squat (concentric phase) [3].
Finally, the main result of this study concern the fact that MMG was more sensitive to changes in load than EMG in dynamic condition. MMG amplitude exhibited systematic greater effect sizes of intensity in ANOVAs and significantly greater correlations with load for the BB and TRI muscles. A similar result has been found during incremental cycling, for which authors exhibited that "MMG amplitude more closely reflects changes in power output" [33].
4.2.2. Frequency domain analysis
In this study, significantly decreased with increasing load for the TRI and DEL muscles. The same MPF vs load relationship was found for MMG but only for the TRI muscle . These results agree with those obtained in isometric condition where MPF at 75% MVC was lower than 25% MVC. Moreover, MPF vs force responses are muscle-specific, as there was no significant increase nor decrease for the BB with both EMG and MMG. this result agrees with previous studies in isokinetic condition [7,18,31].
4.3. Limits
One of the limits of this study is the absence of EMG and MMG normalization in dynamic conditions. Because MMG amplitude is greater in dynamic condition compared to isometric condition [34] we could not have used from MVC values as a reference to normalize signals. Another limit is that in dynamic condition, MMG may be polluted with motion artifacts despite high-pass filtering above 5 Hz [10]. Even if an ulterior verification was done on kinematics between intensity levels, artifacts such as muscular tremor or higher frequency motion harmonics might have altered the MMG signal. In future work, to address these limits, we could improve MMG and EMG signal processing to better filter motion artifacts in dynamic conditions using EMD (Empirical Mode Decomposition) based algorithms, which showed more effective results than band-pass filtering recently[11,12,35].
5. Conclusions
To the best of our knowledge, this study is the first to investigate MMG and EMG during a functional load lifting task at different intensities. This study widens the scope of MMG knowledge in the context of functional activities which have been little studied until now. In this study, we found that EMG and MMG gave similar responses in isometric conditions, as previously shown in the literature. During a dynamic situation corresponding to a load lifting task, MMG amplitude was more sensitive to changes in load than EMG. However in the frequency domain, EMG was more sensitive to changes in load. Altogether these results sustain the feasibility of using MMG measurement in complex functional activities, like load lifting and carrying. Nevertheless, further work is needed in terms of signal processing to improve the reliability of MMG signal during ecological conditions.
Author Contributions
Conceptualization, M.Correa, M.Projetti, I.Siegler and N.Vignais; methodology M.Correa, M.Projetti, I.Siegler and N.Vignais; software M.Correa; validation M.Projetti, I.Siegler and N.Vignais; formal analysis M.Correa, M.Projetti, I.Siegler and N.Vignais; investigation M.Correa, M.Projetti, I.Siegler and N.Vignais; resources M.Projetti, N.Vignais and I.Siegler; data curation M.Correa; writing—original draft preparation M.Correa; writing—review and editing M.Projetti, N.Vignais and I.Siegler; visualization M.Correa, M.Projetti, I.Siegler and N.Vignais; supervision N.Vignais, I.Siegler and M.Projetti; project administration M.Correa, M.Projetti, I.Siegler and N.Vignais; funding acquisition M.Projetti. All authors have read and ageed to the published version of the manuscript.
Funding
This research received no external funding.
Institutional Review Board Statement
The study was conducted in accordance with the Declaration of Helsinki, and approved by the Ethics Committee of Université Paris-Saclay, (2021-287).
Informed Consent Statement
Written informed consent has been obtained from the participants to publish this paper’
Data Availability Statement
The data presented in this study are available on request from the corresponding author. The data are not publicly available due to commercial privacy policy.
Acknowledgments
We would like to thank Dorian Verdel and Jean Jeuvrey for their help in the experimental design.
Conflicts of Interest
The authors declare no conflict of interest.
References
- Gazzoni, M.; Afsharipour, B.; Merletti, R. Surface EMG in Ergonomics and Occupational Medicine. In Surface Electromyography : Physiology, Engineering, and Applications; John Wiley & Sons, Ltd, 2016; pp. 361–391.
- Hermens, H.J.; Freriks, B.; Disselhorst-Klug, C.; Rau, G. Development of recommendations for SEMG sensors and sensor placement procedures. Journal of Electromyography and Kinesiology: Official Journal of the International Society of Electrophysiological Kinesiology 2000, 10, 361–374. [Google Scholar] [CrossRef]
- Woodward, R.B.; Stokes, M.J.; Shefelbine, S.J.; Vaidyanathan, R. Segmenting Mechanomyography Measures of Muscle Activity Phases Using Inertial Data. Scientific Reports 2019, 9, 5569. Bandiera_abtest: a Cc_license_type: cc_by Cg_type: Nature Research Journals Number: 1 Primary_atype: Research Publisher: Nature Publishing Group Subject_term: Biomedical engineering;Electrical and electronic engineering;Fatigue;Mechanical engineering Subject_term_id: biomedical-engineering;electrical-and-electronic-engineering;fatigue;mechanical-engineering. [CrossRef] [PubMed]
- Laferriere, P.; Chan, A.D.C.; Lemaire, E.D. Surface electromyographic signals using a dry electrode. 2010 IEEE International Workshop on Medical Measurements and Applications. IEEE: Ottawa, ON, Canada, 2010; pp. 77–80. [Google Scholar] [CrossRef]
- De Luca, C.J.; Donald Gilmore, L.; Kuznetsov, M.; Roy, S.H. Filtering the surface EMG signal: Movement artifact and baseline noise contamination. Journal of Biomechanics 2010, 43, 1573–1579. [Google Scholar] [CrossRef] [PubMed]
- Farina, D. Interpretation of the surface electromyogram in dynamic contractions. Exercise and sport sciences reviews 2006, 34, 121–127, Publisher: LWW. [Google Scholar] [CrossRef]
- Beck, T.W.; Housh, T.J.; Johnson, G.O.; Weir, J.P.; Cramer, J.T.; Coburn, J.W.; Malek, M.H. Mechanomyographic and electromyographic time and frequency domain responses during submaximal to maximal isokinetic muscle actions of the biceps brachii. European Journal of Applied Physiology 2004, 92, 352–359. [Google Scholar] [CrossRef]
- Ibitoye, M.O.; Hamzaid, N.A.; Zuniga, J.M.; Abdul Wahab, A.K. Mechanomyography and muscle function assessment: a review of current state and prospects. Clinical Biomechanics (Bristol, Avon) 2014, 29, 691–704. [Google Scholar] [CrossRef] [PubMed]
- Islam, M.A.; Sundaraj, K.; Ahmad, R.B.; Ahamed, N.U.; Ali, M.A. Mechanomyography Sensor Development, Related Signal Processing, and Applications: A Systematic Review. IEEE Sensors Journal 2013, 13, 2499–2516, Conference Name: IEEE Sensors Journal. [Google Scholar] [CrossRef]
- Posatskiy, A.O.; Chau, T. The effects of motion artifact on mechanomyography: A comparative study of microphones and accelerometers. Journal of Electromyography and Kinesiology 2012, 22, 320–324. [Google Scholar] [CrossRef] [PubMed]
- Wang, D.; Wu, H.; Xie, C.; Gao, L. Suppression of Motion Artifacts in Multichannel Mechanomyography Using Multivariate Empirical Mode Decomposition. IEEE Sensors Journal 2019, 19, 5732–5739, Conference Name: IEEE Sensors Journal. [Google Scholar] [CrossRef]
- Li, Z.; Gao, L.; Lu, W.; Wang, D.; Cao, H.; Zhang, G. A Novel Noise Suppression and Artifact Removal Method of Mechanomyography Based on RLS, IGWO-VMD, and CEEMDAN. Journal of Sensors 2022, 2022, e4239211, Publisher: Hindawi. [Google Scholar] [CrossRef]
- Yu, J.; Zhang, Y.; Xia, C. Study of gait pattern recognition based on fusion of mechanomyography and attitude angle signal. Journal of Mechanics in Medicine and Biology 2020, 20, 1950085, Publisher: World Scientific Publishing Co.. [Google Scholar] [CrossRef]
- Silva, J.; Heim, W.; Chau, T. A Self-Contained, Mechanomyography-Driven Externally Powered Prosthesis. Archives of Physical Medicine and Rehabilitation 2005, 86, 2066–2070. [Google Scholar] [CrossRef] [PubMed]
- Ibitoye, M.O.; Hamzaid, N.A.; Zuniga, J.M.; Hasnan, N.; Wahab, A.K.A. Mechanomyographic parameter extraction methods: an appraisal for clinical applications. Sensors (Basel, Switzerland) 2014, 14, 22940–22970. [Google Scholar] [CrossRef]
- Ebersole, K.T.; Housh, T.J.; Johnson, G.O.; Evetovich, T.K.; Smith, D.B.; Perry, S.R. MMG and EMG responses of the superficial quadriceps femoris muscles. Journal of Electromyography and Kinesiology 1999, 9, 219–227. [Google Scholar] [CrossRef]
- Evetovich, T.K.; Boyd, J.C.; Drake, S.M.; Eschbach, L.C.; Magal, M.; Soukup, J.T.; Webster, M.J.; Whitehead, M.T.; Weir, J.P. Effect of moderate dehydration on torque, electromyography, and mechanomyography. Muscle & Nerve 2002, 26, 225–231. [Google Scholar] [CrossRef]
- Beck, T.W.; Housh, T.J.; Johnson, G.O.; Weir, J.P.; Cramer, J.T.; Coburn, J.W.; Malek, M.H. Comparison of a piezoelectric contact sensor and an accelerometer for examining mechanomyographic amplitude and mean power frequency versus torque relationships during isokinetic and isometric muscle actions of the biceps brachii. Journal of Electromyography and Kinesiology 2006, 16, 324–335. [Google Scholar] [CrossRef] [PubMed]
- Coburn, J.W.; Housh, T.J.; Weir, J.P.; Malek, M.H.; Cramer, J.T.; Beck, T.W.; Johnson, G.O. Mechanomyographic responses of the vastus medialis to isometric and eccentric muscle actions. Medicine and Science in Sports and Exercise 2004, 36, 1916–1922. [Google Scholar] [CrossRef]
- Beck, T.W.; Housh, T.J.; Johnson, G.O.; Weir, J.P.; Cramer, J.T.; Coburn, J.W.; Malek, M.H. Comparison of Fourier and wavelet transform procedures for examining the mechanomyographic and electromyographic frequency domain responses during fatiguing isokinetic muscle actions of the biceps brachii. Journal of Electromyography and Kinesiology 2005, 15, 190–199. [Google Scholar] [CrossRef] [PubMed]
- Nogueira-Neto, G.; Scheeren, E.; Krueger, E.; Nohama, P.; Button, V.L.S.N. The Influence of Window Length Analysis on the Time and Frequency Domain of Mechanomyographic and Electromyographic Signals of Submaximal Fatiguing Contractions. Open Journal of Biophysics 2013, 03, 178, Number: 03 Publisher: Scientific Research Publishing. [Google Scholar] [CrossRef]
- Shrout, P.E.; Fleiss, J.L. Intraclass Correlations : Uses in Assessing Rater Reliability 1979. p. 9.
- Koo, T.K.; Li, M.Y. A Guideline of Selecting and Reporting Intraclass Correlation Coefficients for Reliability Research. Journal of Chiropractic Medicine 2016, 15, 155–163. [Google Scholar] [CrossRef]
- Akataki, K.; Mita, K.; Itoh, Y. Repeatability study of mechanomyography in submaximal isometric contractions using coefficient of variation and intraclass correlation coefficient. Electromyography and clinical neurophysiology 1999, 39, 161–166. [Google Scholar]
- Herda, T.J.; Ryan, E.D.; Beck, T.W.; Costa, P.B.; DeFreitas, J.M.; Stout, J.R.; Cramer, J.T. Reliability of mechanomyographic amplitude and mean power frequency during isometric step and ramp muscle actions. Journal of Neuroscience Methods 2008, 171, 104–109. [Google Scholar] [CrossRef]
- Meagher, C.; Franco, E.; Turk, R.; Wilson, S.; Steadman, N.; McNicholas, L.; Vaidyanathan, R.; Burridge, J.; Stokes, M. New advances in mechanomyography sensor technology and signal processing: Validity and intrarater reliability of recordings from muscle. Journal of Rehabilitation and Assistive Technologies Engineering 2020, 7, 2055668320916116. [Google Scholar] [CrossRef]
- Talib, I.; Sundaraj, K.; Lam, C.K.; Sundaraj, S. A systematic review of muscle activity assessment of the biceps brachii muscle using mechanomyography. Journal of Musculoskeletal & Neuronal Interactions 2018, 18, 446–462. [Google Scholar]
- Madeleine, P.; Bajaj, P.; Søgaard, K.; Arendt-Nielsen, L. Mechanomyography and electromyography force relationships during concentric, isometric and eccentric contractions. Journal of Electromyography and Kinesiology 2001, 11, 113–121. [Google Scholar] [CrossRef]
- Bilodeau, M.; Arsenault, A.B.; Gravel, D.; Bourbonnais, D. EMG power spectra of elbow extensors during ramp and step isometric contractions. European Journal of Applied Physiology and Occupational Physiology 1991, 63, 24–28. [Google Scholar] [CrossRef] [PubMed]
- Beck, T.W.; Housh, T.J.; Johnson, G.O.; Cramer, J.T.; Weir, J.P.; Coburn, J.W.; Malek, M.H. Does the frequency content of the surface mechanomyographic signal reflect motor unit firing rates? A brief review. Journal of Electromyography and Kinesiology: Official Journal of the International Society of Electrophysiological Kinesiology 2007, 17, 1–13. [Google Scholar] [CrossRef]
- Beck, T.W.; Housh, T.J.; Johnson, G.O.; Weir, J.P.; Cramer, J.T.; Coburn, J.W.; Malek, M.H. Mechanomyographic and electromyographic amplitude and frequency responses during fatiguing isokinetic muscle actions of the biceps brachii. Electromyography and Clinical Neurophysiology 2004, 44, 431–441. [Google Scholar]
- Qi, L.; Wakeling, J.M.; Ferguson-Pell, M. Spectral properties of electromyographic and mechanomyographic signals during dynamic concentric and eccentric contractions of the human biceps brachii muscle. Journal of Electromyography and Kinesiology 2011, 21, 1056–1063. [Google Scholar] [CrossRef]
- Perry, S.R.; Housh, T.J.; Weir, J.P.; Johnson, G.O.; Bull, A.J.; Ebersole, K.T. Mean power frequency and amplitude of the mechanomyographic and electromyographic signals during incremental cycle ergometry. Journal of Electromyography and Kinesiology 2001, 11, 299–305. [Google Scholar] [CrossRef] [PubMed]
- Beck, T.W.; Housh, T.J.; Johnson, G.O.; Weir, J.P.; Cramer, J.T.; Coburn, J.W.; Malek, M.H. Mechanomyographic amplitude and mean power frequency versus torque relationships during isokinetic and isometric muscle actions of the biceps brachii. Journal of Electromyography and Kinesiology 2004, 14, 555–564. [Google Scholar] [CrossRef] [PubMed]
- Zhang, Y.; Xu, P.; Li, P.; Duan, K.; Wen, Y.; Yang, Q.; Zhang, T.; Yao, D. Noise-assisted multivariate empirical mode decomposition for multichannel EMG signals. Biomedical Engineering Online 2017, 16, 107. [Google Scholar] [CrossRef] [PubMed]
Figure 1.
Example of the load lifting task performed during the dynamic testing procedure. One repetition consisted of going from posture (a) to (d) and going back to initial posture. Postures were separated by one second from each other using a metronome. Participants were asked to keep a constant speed throughout every repetition.
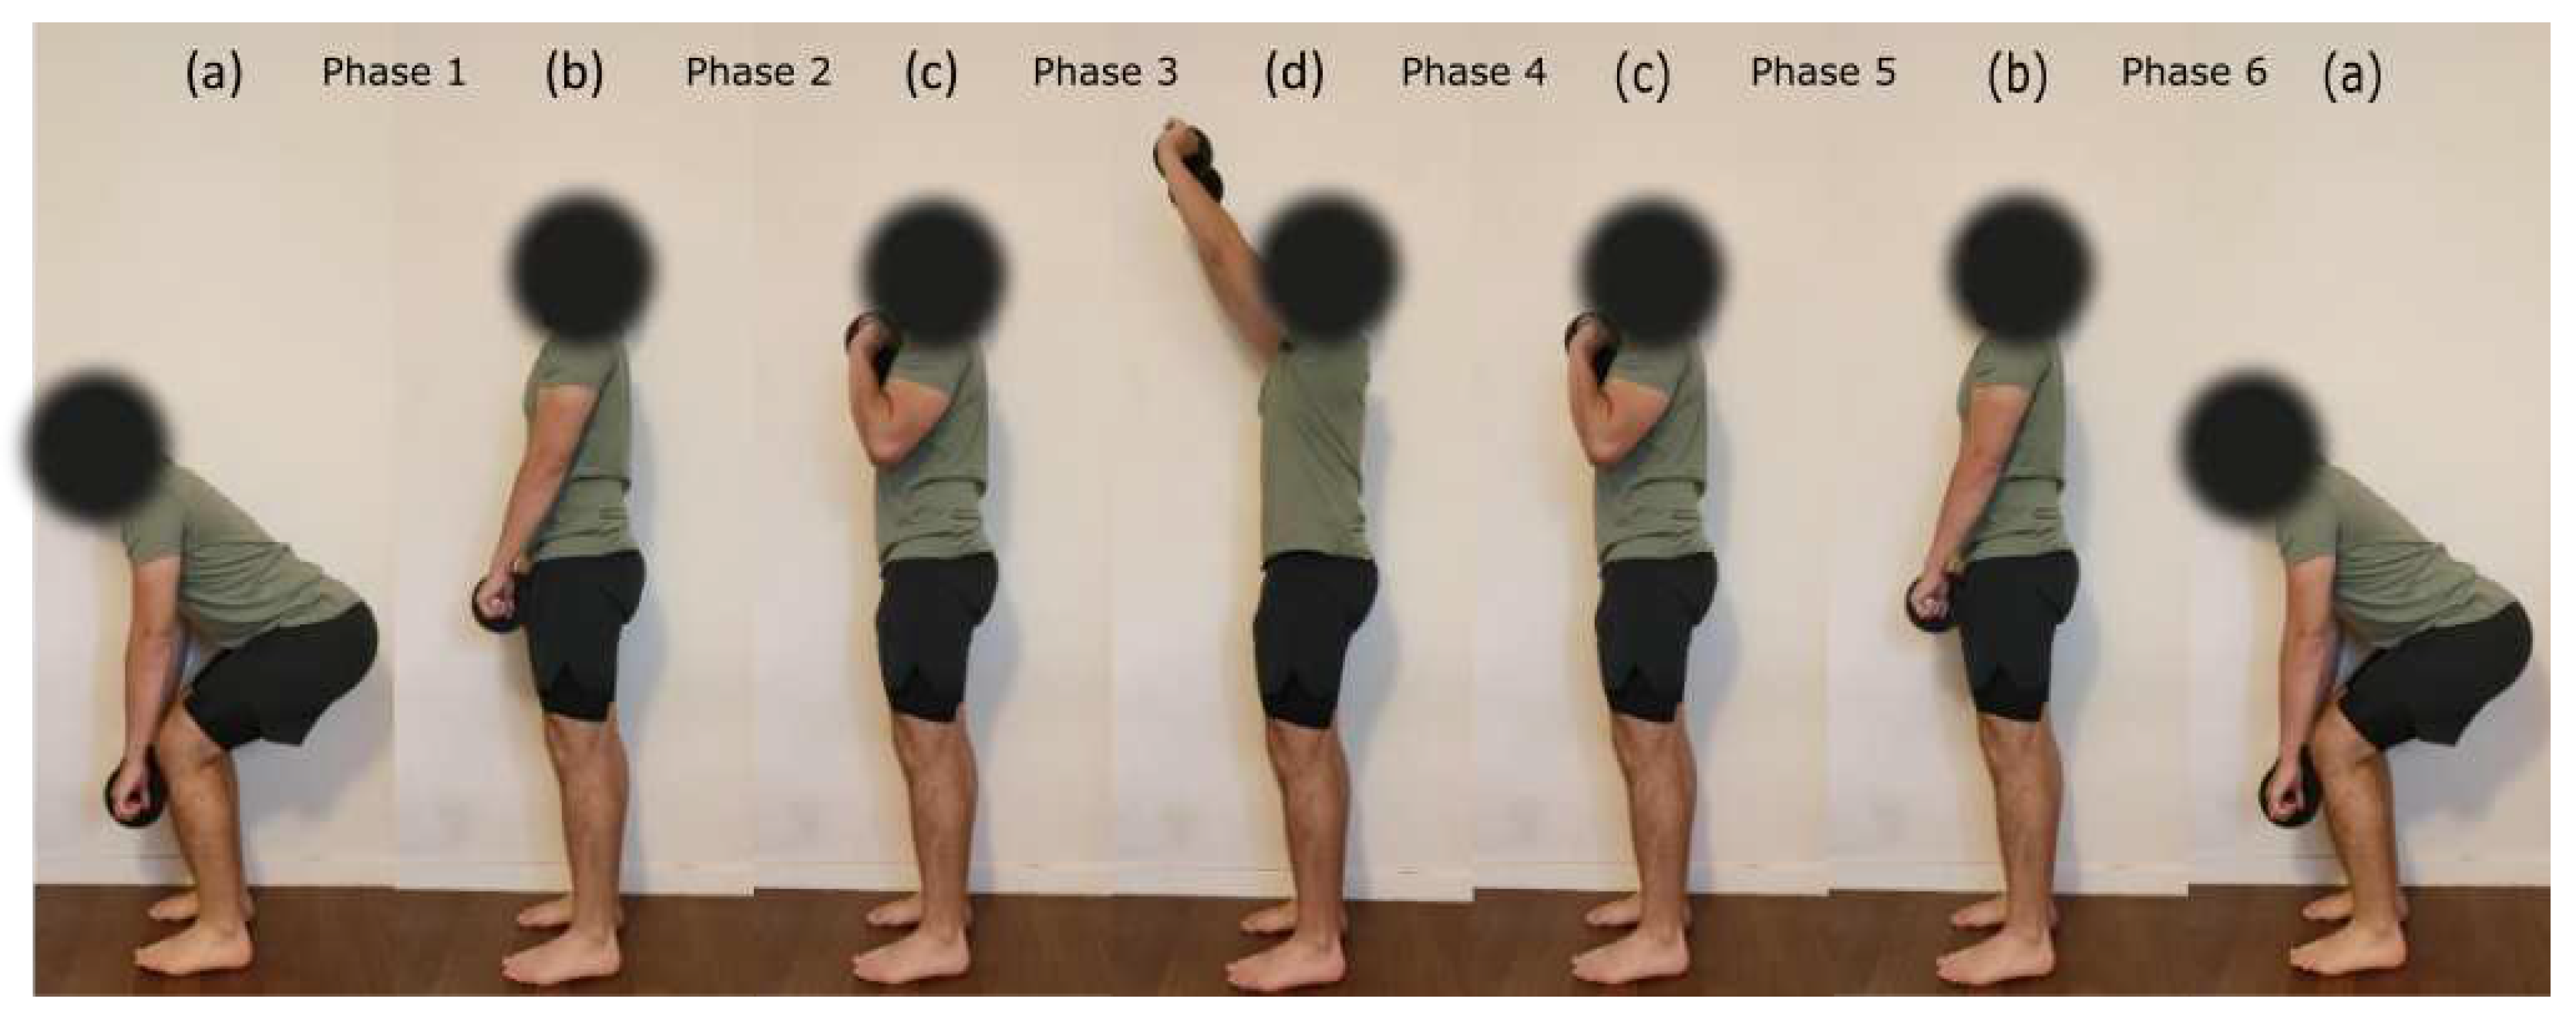
Figure 2.
Example of the low-passed pitch angle of the accelerometer sensor located over the BB muscle (A) with corresponding MMG and EMG 1-second rolling RMS envelopes for the deltoid muscle (B and C respectively) in function of time for one repetition of the load lifting task at 75% MVC (see Figure 1).
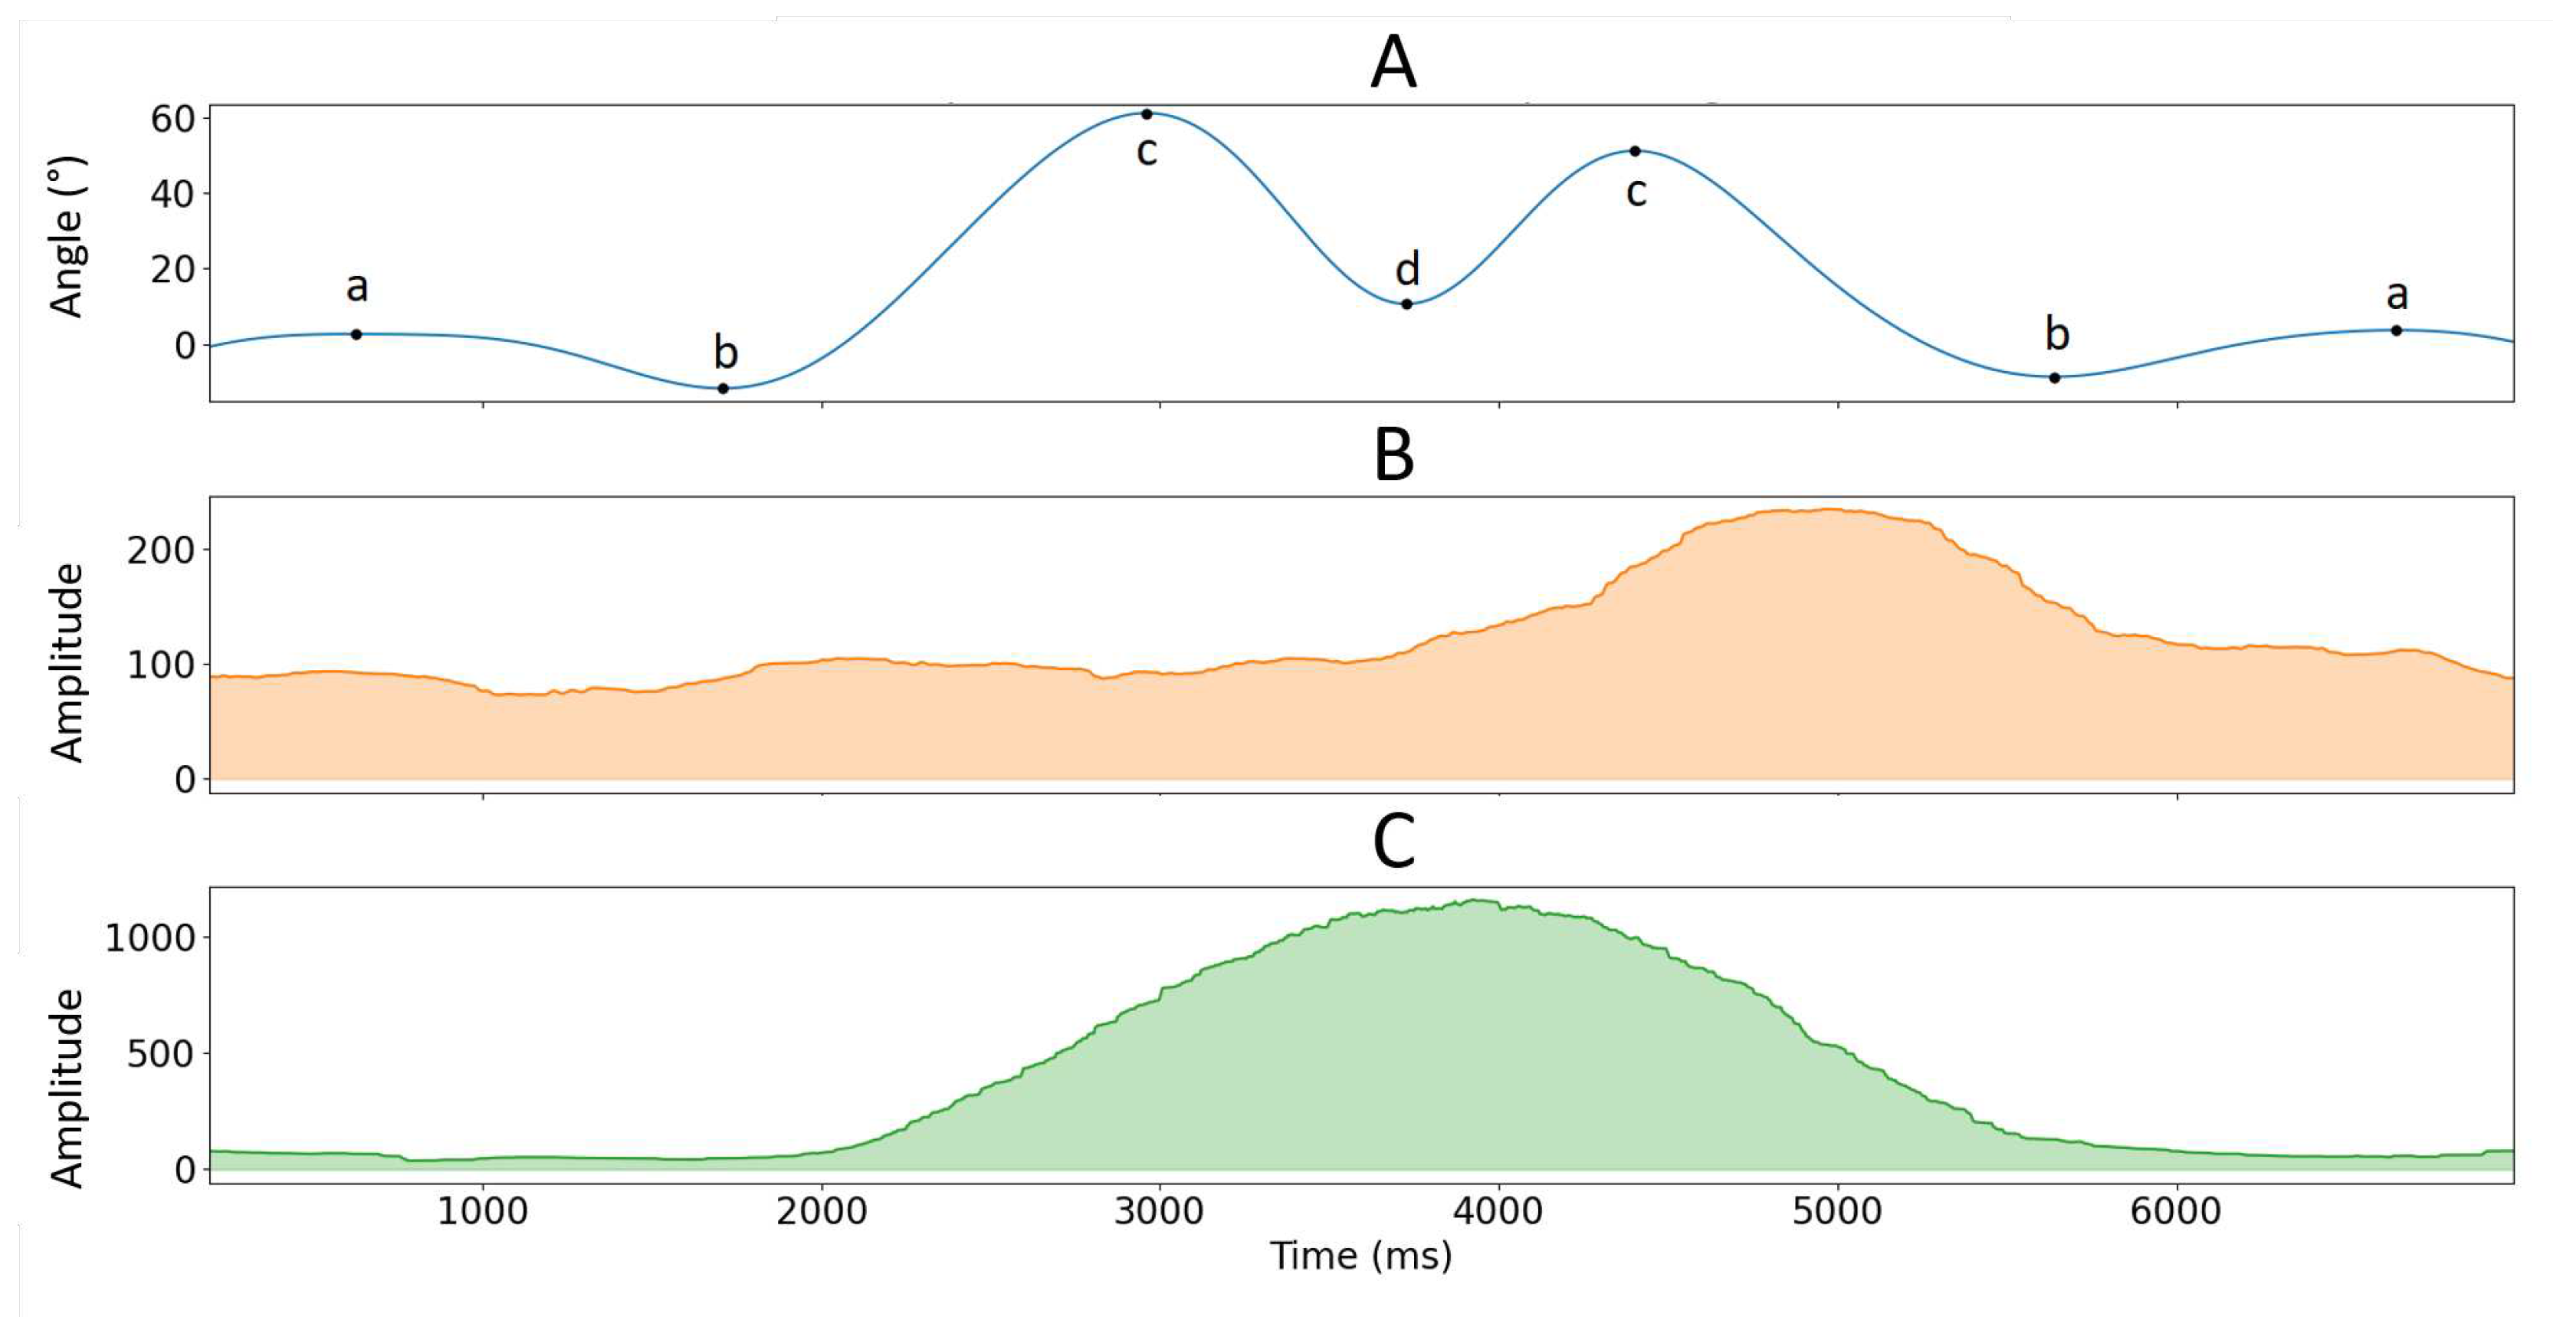
Figure 3.
Absolute and values as a function of phase (between 2 and 5) for each intensity levels and muscles (row graphics).
Figure 3.
Absolute and values as a function of phase (between 2 and 5) for each intensity levels and muscles (row graphics).

Figure 4.
Mean EMG and MMG RMS amplitudes vs % MVC linear relationship for each muscle during the load lifting-task. Y-axis RMS amplitude unit is in mV for EMG and in mg for MMG.
Figure 4.
Mean EMG and MMG RMS amplitudes vs % MVC linear relationship for each muscle during the load lifting-task. Y-axis RMS amplitude unit is in mV for EMG and in mg for MMG.
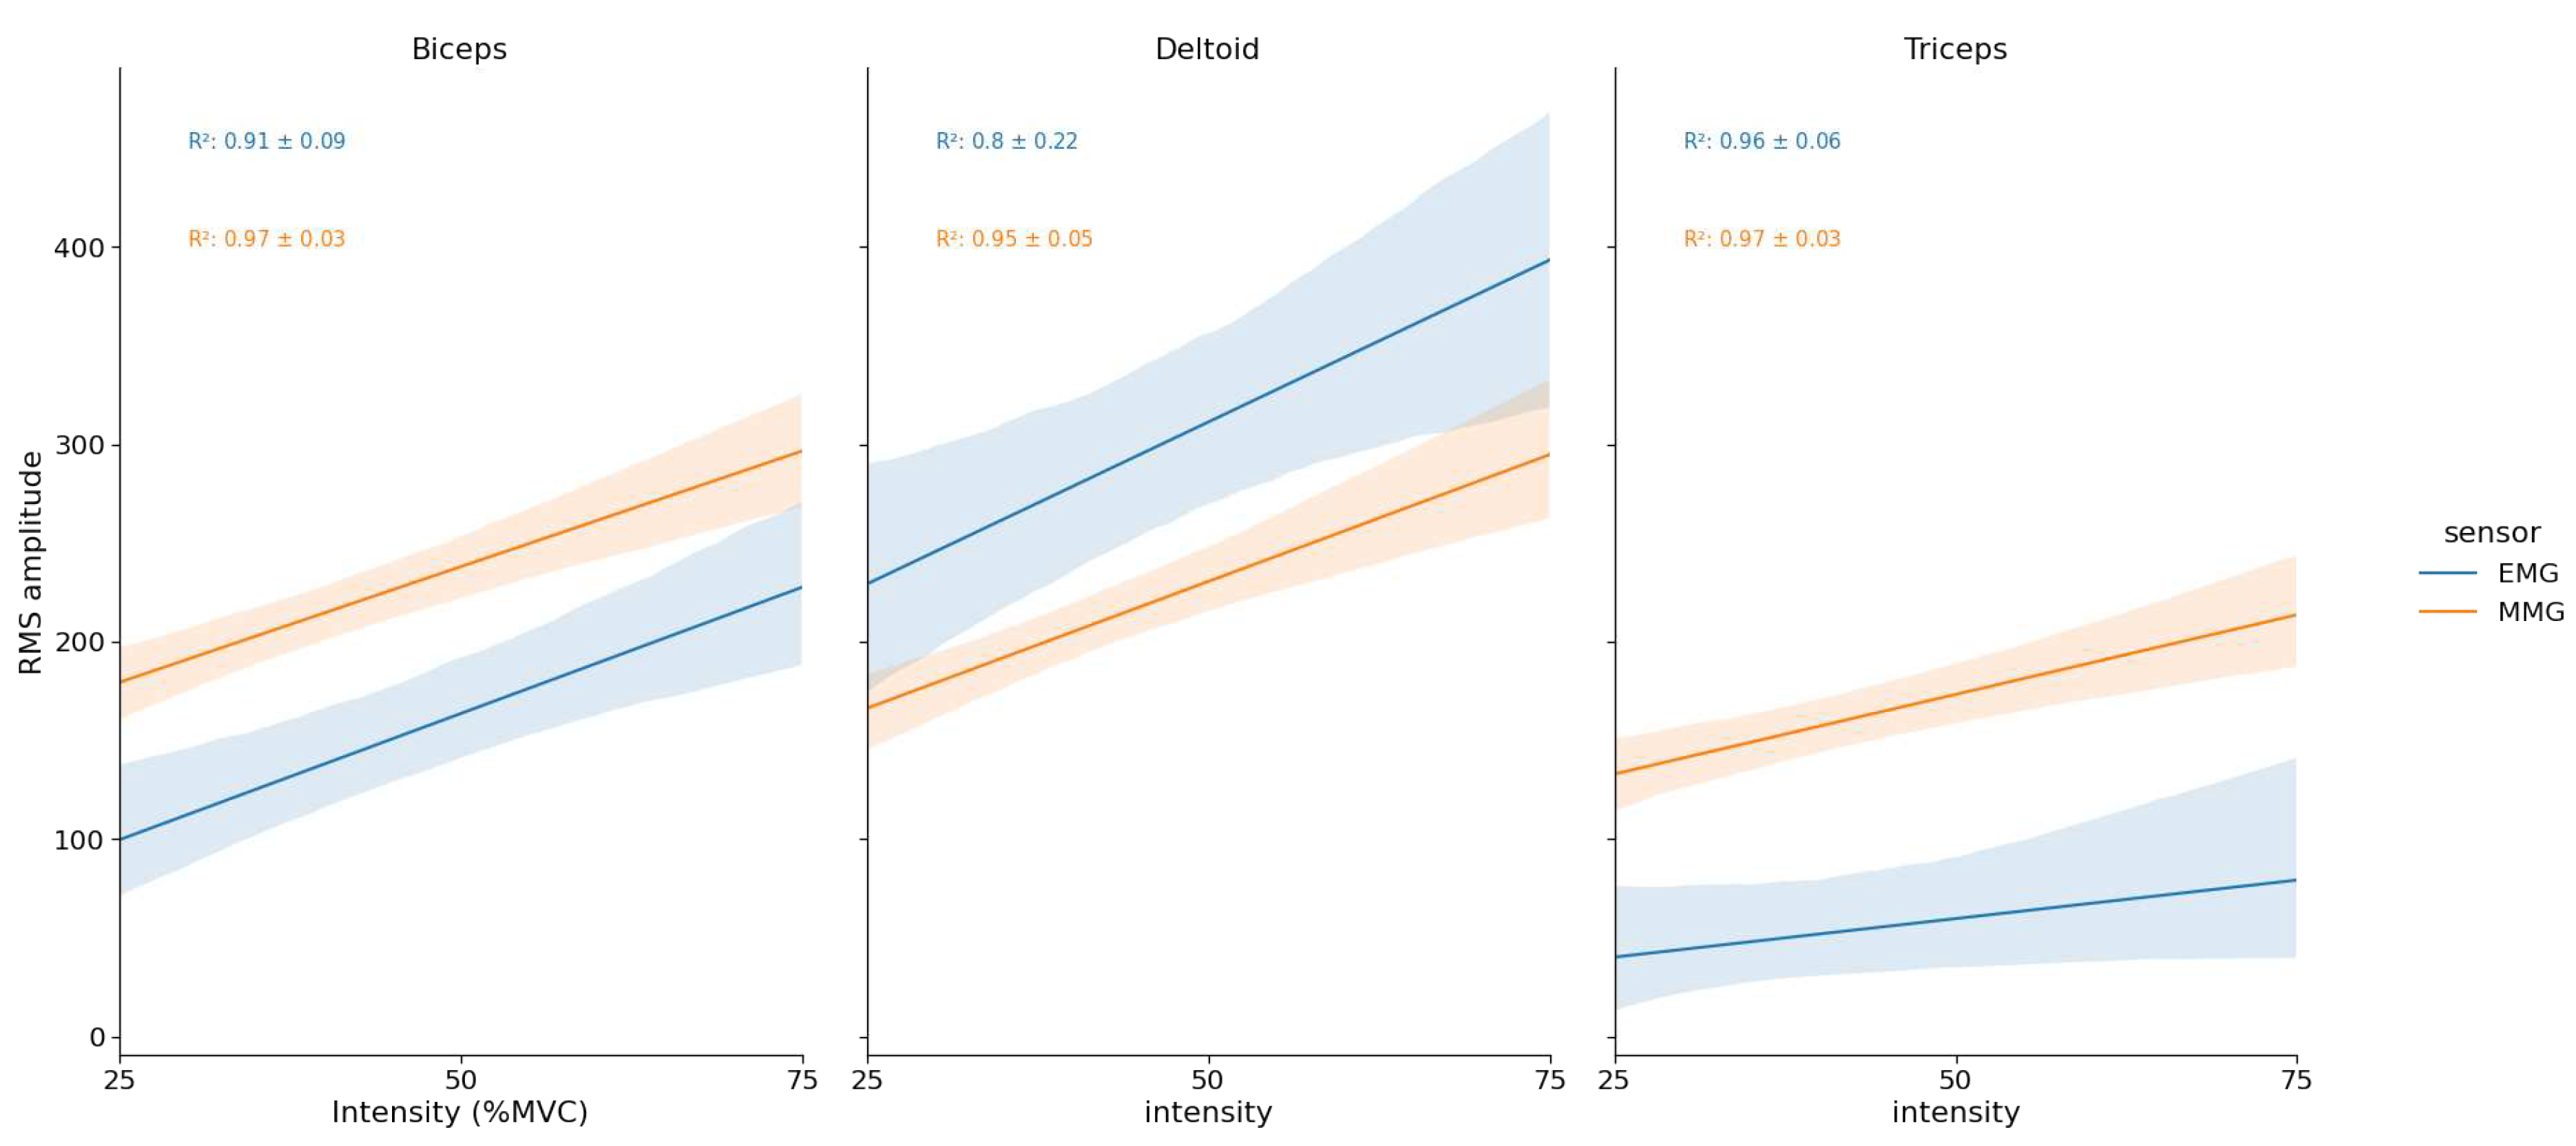

Table 1.
Isometric ICC scores and mean RMS values for each sensor, muscle and intensity level. ICC are displayed as point estimate - lower bound 95% confidence interval.
Table 1.
Isometric ICC scores and mean RMS values for each sensor, muscle and intensity level. ICC are displayed as point estimate - lower bound 95% confidence interval.
| Sensor | Muscle | Feature | intensity (%MVC) | |||
|---|---|---|---|---|---|---|
| 25% | 50% | 75% | 100% | |||
| EMG | BB | ICC | 0.96 - 0.93 | 0.97 - 0.94 | 0.99 - 0.98 | - |
| RMS | 22.1 ± 10.9 #†• | 54.4 ± 23.7 *†• | 80.0 ± 25.5 *# | 90.2 ± 5.3 *# | ||
| TRI | ICC | 0.98 - 0.97 | 0.99 - 0.98 | 0.996 - 0.992 | - | |
| RMS | 15.0 ± 5.6 #†• | 46.8 ± 17.6 *†• | 81.7 ± 25.3 *# | 89.5 ± 7.5 *# | ||
| DEL | ICC | 0.99 - 0.98 | 0.99 - 0.98 | 0.99 - 0.985 | - | |
| RMS | 33.8 ± 10.4 #†• | 64.3 ± 18.5 *†• | 92.2 ± 21.9 *# | 93.6 ± 4.3 *# | ||
| MMG | BB | ICC | 0.97 - 0.94 | 0.96 - 0.93 | 0.97 - 0.95 | - |
| RMS | 19.4 ± 8.6 #†• | 60.8 ± 25.1 *†• | 81.9 ± 24.7 *# | 88.8 ± 6.6 *# | ||
| TRI | ICC | 0.95 - 0.90 | 0.97 - 0.94 | 0.95 - 0.91 | - | |
| RMS | 11.6 ± 5.3 #†• | 45.2 ± 16.7 *†• | 92.5 ± 20.9 *# | 85.8 ± 7.2 *# | ||
| DEL | ICC | 0.98 - 0.97 | 0.98 - 0.96 | 0.97 - 0.94 | - | |
| RMS | 28.3 ± 12.7 #†• | 75.1 ± 20.3 *†• | 100.0 ± 29.4 *# | 88.3 ± 7.6 *# | ||
14.1cm *: significant difference with 25% MVC; # : significant difference with 50% MVC; †: significant difference with 75% MVC; •: significant difference with 100% MVC ().
Table 2.
MMG and EMG RMS amplitudes two-way repeated measures ANOVA results for each muscle from dynamic testing.
Table 2.
MMG and EMG RMS amplitudes two-way repeated measures ANOVA results for each muscle from dynamic testing.
| Sensor | Muscle | Factor | df | F | p | |
|---|---|---|---|---|---|---|
| MMG | BB | Intensity | (2, 36) | 96 | <0.001 | 0.40 |
| Phase | (3, 54) | 36 | <0.001 | 0.29 | ||
| Intensity x Phase | (6, 108) | 5.5 | <0.001 | 0.02 | ||
| TRI | Intensity | (2, 36) | 84 | <0.001 | 0.30 | |
| Phase | (3, 54) | 33 | <0.001 | 0.35 | ||
| Intensity x Phase | (6, 108) | 7.8 | <0.001 | 0.02 | ||
| DEL | Intensity | (2, 36) | 96 | <0.001 | 0.40 | |
| Phase | (3, 54) | 36 | <0.001 | 0.29 | ||
| Intensity x Phase | (6, 108) | 5.5 | <0.001 | 0.02 | ||
| EMG | BB | Intensity | (2, 36) | 37 | <0.001 | 0.16 |
| Phase | (3, 54) | 21 | <0.001 | 0.32 | ||
| Intensity x Phase | (6, 108) | 5.5 | <0.001 | 0.04 | ||
| TRI | Intensity | (2, 36) | 5.2 | 0.01 | 0.05 | |
| Phase | (3, 54) | 3.8 | 0.015 | 0.13 | ||
| Intensity x Phase | (6, 108) | 4.58 | <0.001 | 0.01 | ||
| DEL | Intensity | (2, 36) | 32 | <0.001 | 0.12 | |
| Phase | (3, 54) | 58 | <0.001 | 0.59 | ||
| Intensity x Phase | (6, 108) | 13 | <0.001 | 0.02 |
Table 3.
MMG and EMG MPF two-way repeated measures ANOVA results for each muscle from dynamic testing. Only significant effects are displayed.
Table 3.
MMG and EMG MPF two-way repeated measures ANOVA results for each muscle from dynamic testing. Only significant effects are displayed.
| Sensor | Muscle | Factor | df | F | p | |
|---|---|---|---|---|---|---|
| MMG | BB | Intensity | (2, 36) | - | - | - |
| Phase | (3, 54) | 61 | <0.001 | 0.67 | ||
| Intensity x Phase | (6, 108) | - | - | - | ||
| TRI | Intensity | (2, 36) | 14 | <0.001 | 0.04 | |
| Phase | (3, 54) | 53 | <0.001 | 0.61 | ||
| Intensity x Phase | (6, 108) | 10 | <0.001 | 0.04 | ||
| DEL | Intensity | (2, 36) | - | - | - | |
| Phase | (3, 54) | - | - | - | ||
| Intensity x Phase | (6, 108) | 4 | <0.001 | 0.05 | ||
| EMG | BB | Intensity | (2, 36) | - | - | - |
| Phase | (3, 54) | 9 | <0.001 | 0.24 | ||
| Intensity x Phase | (6, 108) | - | - | - | ||
| TRI | Intensity | (2, 36) | 56 | <0.001 | 0.20 | |
| Phase | (3, 54) | 17 | <0.001 | 0.28 | ||
| Intensity x Phase | (6, 108) | 7 | <0.001 | 0.04 | ||
| DEL | Intensity | (2, 36) | 14 | <0.001 | 0.05 | |
| Phase | (3, 54) | 37 | <0.001 | 0.55 | ||
| Intensity x Phase | (6, 108) | - | - | - |
Disclaimer/Publisher’s Note: The statements, opinions and data contained in all publications are solely those of the individual author(s) and contributor(s) and not of MDPI and/or the editor(s). MDPI and/or the editor(s) disclaim responsibility for any injury to people or property resulting from any ideas, methods, instructions or products referred to in the content. |
© 2023 by the authors. Licensee MDPI, Basel, Switzerland. This article is an open access article distributed under the terms and conditions of the Creative Commons Attribution (CC BY) license (http://creativecommons.org/licenses/by/4.0/).
Copyright: This open access article is published under a Creative Commons CC BY 4.0 license, which permit the free download, distribution, and reuse, provided that the author and preprint are cited in any reuse.


