
Submitted:
01 August 2023
Posted:
02 August 2023
You are already at the latest version
Abstract
Fluorophores with a tetraphenylethylene (TPE) core are attracting increasing interest because of their aggregation-induced emission (AIE) behaviour, which makes them particularly suitable when dispersed in thin-layer films. We propose the synthesis and use of a novel TPE fluorophore (hereafter called TPE-BPAN) decorated with two dimethylamino push groups and a 4-biphenylacetonitrile pull moiety. In tetrahydrofuran solutions, TPE-BPAN showed a broad absorption spectrum, and an intense emission is observed when a non-solvent as water is added in amounts of 70% and above. We selected and synthetized five different polymer matrices for TPE-BPAN with decreasing polarity: a) poly(methylmetacrylate) homopolymer (PMMA); b), c), and d) three copolymers of methyl methacrylate and cyclohexyl methacrylate at different compositions (P(MMA-co-CHMA) 75:25, 50:50, 25:75 mol%); e) poly(cyclohexyl methacrylate) homopolymer (PCHMA). The presence of a less polar comonomer as cyclohexyl methacrylate appeared to enhance the emission behaviour of TPE-BPAN, which displayed the highest quantum yield (QY) in P(MMA-co-CHMA) 75:25 in all the range of concentration studied from 0.4 wt.% to 2.0 wt.%. Further reduction in polarity lowered QY to the values of PMMA films; also, lower adhesion to the glass and a marked fragility of the films were observed. Referring to the P(MMA-co-CHMA) 75:25 films, QY values decreased from over 40% at 0.4 wt.% to about 30% at 2.0 wt.%, which is still helpful for energy harvesting applications such as luminescent solar concentrators (LSC). LSC performances were not significantly affected by the matrix's lower polarity and resulted in around one-third of the state-of-the-art due to the lower QY of TPE-BPAN. The theoretical investigation on density functional theory (DFT) clarified the origin of the observed AIE and the role played by the environment in modulating the photophysical behaviour.
Keywords:
Poly(methyl methacrylate)
; Poly(cyclohexyl methacrylate)
; Tetraphenylethylene (TPE)
; Aggregation-induced emission
; Density functional theory investigations
; Luminescent solar concentrator
1. Introduction
Photovoltaic (PV) energy harvesting is not always cost-effective due to efficiency losses of the panels when not directly illuminated and facing south [1]. Various technologies were developed to enhance photovoltaic energy harvesting or to reduce its cost. Organic fluorophores are generally used for energy harvesting applications, e.g. in Luminescent Solar Concentrators (LSCs), in which they are embedded in a transparent polymeric matrix. When hit by radiation, both indoor and outdoor, fluorophores can absorb photons and exploit a fluorescence emission [2]. An ideal fluorophore should have a broad absorption spectrum and a high photoluminescence quantum yield (QY) to harvest and emit the highest number of photons. Moreover, a small overlap between the absorption and the emission spectra is preferred to limit self-absorption effects, and the fluorescence quenching phenomenon must be reduced to avoid efficiency losses. For instance, aggregation-caused quenching (ACQ) is one of these phenomena [3], common in the condensed phase for organic fluorophores. A particular class of fluorophores exhibits the opposite behaviour: aggregation-induced emission (AIE) or aggregation-caused enhanced emission (AIEE) [4]. When packed, these molecules undergo different mechanisms resulting in a relevant suppression of the non-radiative relaxation paths and leading to the observed bright solid-state fluorescence. A typical AIEgen is tetraphenylethylene (TPE) [5,6], for which a restriction of intramolecular motions responsible for the non-radiative decay going from solution to aggregate phases is often considered as the case of the observed AIE/AIEE. TPE is easily functionalised with donor and acceptor moieties to modulate their photophysical properties, and various TPE derivatives were studied in previous works [7,8,9,10] for LSC applications. Applied in the solid state, the fluorophores in the photovoltaics should boost the QY, thus AIEgens represent the ideal emitters in LSCs. For example, a series of AIE fluorophores (bearing nitril and aromatic moieties) have already been synthesized earlier to meet the requirements of large Stokes shifts and high QY in LSCs [11]. In this paper, we report the synthesis and characterization of a new TPE derivative bearing two dimethylamino push groups and a 4-biphenyl acetonitrile pull group (hereafter TPE-BPAN) as schematically depicted in Figure 1.
The two donors and the acceptor moieties induce a shift of the emission maximum to longer wavelengths with respect to the native TPE, in agreement with the literature[12]. The enhancement of emission upon aggregation both in solution and solid state has been rationalized on the basis of the results of DFT calculations. In addition to these computational studies, characterization of optical behaviour both in solution and in a polymeric matrix was performed. A glassy polymeric surround prevents the rotational motion of fluorophore molecules, as occurs in the solid state [13]. For TPE-BPAN we chose poly(methyl methacrylate) (PMMA) as the host material, which is widely used in optical applications due to its high transparency and internal transmittance [14,15]. In order to enhance polymer-fluorophore compatibility, PCHMA has already been used by our group in other publications [16,17,18,19]. PCHMA increased the compatibility of the fluorophore, but its lower polarity compromised the time stability of the films. Therefore, we aim to determine the trade-off between fluorophore performances and polarity by preparing copolymers at different CHMA contents (25, 50, 75 mol %). QY was measured to determine the best polymer matrix for TPE-BPAN and its feasibility in LSCs application [20]. Finally, LSC performances are evaluated in terms of photonic (both external ηext and internal ηint) and device (ηdev) efficiencies.
2. Materials and Methods
All the experimental details are available in the Supporting Information section.
3. Results and Discussion
3.1. TPE-BPAN in solution
First, the TPE-BPAN was synthesized through a McMurry reaction between bis-(dimethylamino)benzophenone and bromobenzophenone in the presence of TiCl4 and zinc powder, forming the TPE core [21]. The product was then converted by formylation with dimethylformamide (DMF) into a TPE-CHO derivative, to which 4-biphenyl acetonitrile was added, yielding TPE-BPAN by a Knoevenagel-type condensation.
The absorption spectra of TPE-BPAN in tetrahydrofuran (THF) solution were then recorded at increasing concentrations of TPE-BPAN spanning the range of 10-6-10-5 M, as shown in Figure S1. All spectra are characterized by two broad and intense absorption bands, at 339 nm and 444 nm, respectively, and with their maxima unaffected by concentration. Regarding emission properties, TPE-BPAN is not fluorescent in pure THF solution (Figure 2).
Conversely, a well-defined fluorescence peak appears at 639 nm by adding more than 60% of water, solvent in which TPE-BPAN is insoluble, thus suggesting the AIE character of the molecule [22]. Interestingly, the resulting Stokes shift is around 200 nm, which is remarkably promising for LSC applications [23,24]. Aggregated TPE-BPAN particles from 10/90 vol.% THF/H2O mixture were also characterized by dynamic light scattering (DLS) measurements and found to have an average diameter of 206 ± 2 nm (see Figure S2).
TPE-BPAN also displayed good thermal stability since the main weight loss in thermogravimetric analysis (TGA) occurred over 300 °C (Figure S3).
To better understand the nature of the emissive species and the electronic origin of the observed AIE phenomena, DFT calculations were performed to characterize this system in solution and aggregated phases. Computational details are extensively reported as Supporting Information together with the description of the benchmark calculations that were performed to setup adequate models and level of theory.
Let us first focus on the photophysical properties of isolated TPE-BPAN in solution. The computed absorption and emission energies associated to the lowest energy intense transition in gas phase, THF and water at the TD-DFT level are reported in Table 1.
As more extensively reported in Supporting Information (Table S2, Figure S30 and corresponding discussion), independently of the level of theory tested, the computed absorption spectra are characterized by two bands in qualitative agreement with the experimental observations. If all range-separated approaches tested (Table S1) significantly overestimate the lowest energy transition, the description provided by the global hybrid PBE0 method [25,26] appears as the closest to the experimental value predicting an intense absorption in THF at 2.28 eV (Table 1).
This lowest energy band’s energy is practically unaffected by the change of solvent polarity (i.e., in going from THF to water). We should recall here that these calculations were performed including solvent as a continuum polarizable (through the PCM model) [27] and that the calculation performed in water cannot be directly compared to the experimental results obtained for the THF-water mixtures where TPE-BPAN is experimentally leading to aggregates. The treatment of these latter will be addressed in the following paragraph.
The lowest energy band stems from a single electronic transition from the ground (S0) and the first excited state (S1). This transition has a dominant HOMO to LUMO character, and the analysis of the natural transition orbitals (NTO) [28] associated to this excitation (reported in Figure 3) clearly illustrates its intramolecular Charge Transfer (CT) nature. The CT is indeed occurring from the donor dimethylamino groups (hereafter labelled as A1/A2, refer to Figure 1 for labelling) to the phenyl of the TPE core linked with to acceptor unit, with a marked directional Donor to Acceptor character, which breaks the symmetry of the TPE core. Thus, any structural modification modulating the conjugation of these peripheral groups is expected to strongly affect the transition energy.
A quantification of the hole-electron separation at the ES can be provided by the DCT index [29,30] which measures the distance between the barycenters of the computed hole and the electron charge distributions. For the CT transition a very large charge transfer length is computed with an associated DCT of 7.46 Å. The barycenters of the hole and electron charge distributions are also illustrated in Figure 3 (b).
Due to the relevant Donor to Acceptor CT character of this transition, a significant relaxation is expected to occur at the excited state leading to a sizeable Stokes shift. Indeed, and in very good agreement with the experiment, a difference of roughly 0.7 eV is computed between absorption and emission energies computed in THF solution. As it can be noted from Table 1, this Stokes shift is also not strongly dependent on the polarity of the environment. From a structural point of view, relaxation at the excited state, as expected, mainly involves a planarization of the substituents around the central TPE core, enhancing their electronic coupling. This effect can be qualitatively inferred from Figure 4 where the ground and first excited state-optimized structures of TPE-BPAN have been superposed. Overall, the most relevant changes are related to the planarization of the peripheral phenyl carrying the A1 and A2 donor groups and of the biphenyl group present in the acceptor substituent.
A more quantitative analysis of the relaxation process is provided in SI (Table S3) for the interested reader.
Focusing now on the intensity predicted for the emission, we can note that a sizable fluorescence would be expected in THF from the data reported in Table 1, in clear disagreement with the faint emission experimentally recorded in pure THF solution. As previously reported for TPE derivatives [18], this discrepancy is related to the neglection of non-radiative decay channels mediated by the vibrational degrees of freedom that have been proven to be particularly effective for TPE and TPE derivatives. To indirectly assess their relevance, an analysis of the computed Huang-Rhys (HR) factors [31] was thus performed. HR factors are obtained by comparing relaxed molecular geometries and normal modes at the ground and excited states. Larger HR factors imply the high efficiency of the non-radiative channels associated with molecular vibrations.
In a previous work [18], we have already used this analysis to assess the relative importance of non-radiative decay channels in native TPE and in a TPE derivative (TPE-MRh) whose only difference with respect to TPE-BPAN is the presence of a different acceptor (i.e. methyl-rhodanine). We can thus qualitatively compare the HR factors computed here for TPE-BPAN to those reported in our previous work computed at a similar level of theory to estimate the efficiency of non-radiative vibrational channels.
The three largest HR factors computed for TPE-BPAN (Figure S32) are all associated with low frequencies, namely to the 3rd, 4th and 5th normal modes, with frequencies computed at 14, 20 and 24 cm-1, respectively. These HR factors (12.8, 6.9 and 3.2, respectively) are smaller than those computed for TPE (whose emission is totally quenched by non-radiative decay) but comparable to those computed for TPE-MRh.
The analysis of these three normal modes shows that they all involve a structural reorganization corresponding to the rotation of donor and acceptor peripheral groups as schematically depicted in Figure 5. Nonetheless, and as already pointed out for TPE-MRh these normal modes are less coupled than for native TPE and, thus, a less pronounced structural reorganization and a less efficient activation of the non-radiative channels is expected with respect to unsubstituted TPE. We can thus conclude that, analogously to TPE-MRh, also in the case of TPE-BPAN, non-radiative decay is responsible for the observed faint fluorescence in THF solution and mixtures where this molecule is soluble, although this non-radiative pathway is unable to completely suppress emission in solution as in the case of unsubstituted TPE.
3.2. TPE-BPAN crystalline aggregates
The XRD pattern experimentally recorded (Figure S3) is consistent with the formation of polycrystalline particles of TPE-BPAN in water/THF mixtures containing 70% (or more) of water. The three most thermodynamically stable polymorphs (hereafter labelled as Pol_1, Pol_2 and Pol_3), predicted following the computational procedure detailed in Supporting Information, are showing the characteristic peaks experimentally observed in the XRD pattern, in particular those reported at 4.002°, 6.599°, 8.099°, 13.806° and 16.220° (Figures S3, S33) can thus be considered as a realistic estimate of the most largely occurring polymorphs present in the particles aggregating from water/THF mixtures. More information on their structural properties can be found in Table S4.
In order to compute the solid-state absorption and emission energies of each of these polymorphs, the Ewald embedding procedure, previously developed and applied by some of us for the calculation of organic crystalline phases, was applied (refer to supporting information for details) [32,33,34,35,36]. Computed absorption and emission properties are summarized in Table 2, together with relevant experimental data.
In agreement with the experimental observations, absorption and emission energies are only marginally shifted going from THF solution to crystalline phases. The nature of all these transitions is not changing from solution, still corresponding essentially to a HOMO-LUMO transition with relevant implication of the donor and acceptor groups, although the analysis of the DCT index computed for the polymorphs shows a sizable reduction of the CT extent (of roughly 1.5 Å in average). Experimentally, a redshift of roughly 0.1 eV is observed both for absorption and emission, while computationally a 0.1 eV blueshift is computed for absorption, and a negligible shift in emission is computed for the most stable polymorph, which is acceptable agreement considering the accuracy expected from TD-DFT calculations. More interestingly, considering the computed oscillator strengths, one can note that a sizable fluorescence is expected for all polymorphs, with computed oscillator strengths ranging from 0.154 to 0.255 a.u. and that these computed intensities are comparable to those computed in THF solutions.
The observed gain in fluorescence upon aggregation must thus be due to the deactivation of the non-radiative de-excitation channels effective in solution due to the presence of relevant intermolecular interactions induced by the crystalline packing of the different polymorphs. These intermolecular interactions must hinder the vibrational motions mainly involving the torsion of the donor and acceptor moieties with respect to the central TPE core that were previously identified from the analysis of the HR factors computed in solution as the most relevant n non-radiative de-excitation channels.
To detect intermolecular interactions in the crystalline environment, the Interaction Region Indicator (IRI) analysis [37], as implemented in the Multiwfn package [38], was thus applied as reported in Figure 6. Several interactions can be highlighted. For instance, in Pol_2 C-H···π· interactions exist between the A1 and the P2 groups (purple circle), which restrict the rotation of the P2 part. The A2 group is involved in C-H···N and C-H···H van der Waals interactions with nitrile and the phenyl linker (yellow circle), which restrict the vibrational degrees of freedom of both the nitrile and the phenyl involved. Finally, in Pol_3 system, the intermolecular C-H···π interactions appear between A1, A2 and P1, P2 (purple circle) group.
Further analyses allow to point out that, especially in Pol_3, relevant intermolecular packing pattern between the donor and acceptor groups of adjacent molecules can significantly restrict their freedom, the facto de-activating the non-radiative channels and leading to the observed enhancement in emission upon aggregation.
The structural constraint induced by the crystal packing is also indirectly probed by comparing the structural relaxation upon excitation occurring in solution and in the different polymorphs. Table S5 monitors this variation by analysing the most relevant dihedrals. Of note, the relaxation involving the coupling of the acceptor and donor unit with the central core of the molecule is always smaller in the crystalline phases, thus confirming the constraints imposed by the crystal packings. On the other hand, the relaxation of the donor unit and particularly that of the P1-P2 biphenyl moiety is predicted to be larger in the crystalline phases but is not expected to provide significant non-radiative decay channels since these groups are not massively involved in the vibrational frequencies emerging as relevant for de-excitation from the HR factors analysis.
3.2. TPE-BPAN in polymeric thin films
TPE-BPAN was next investigated in polymeric thin films. These were prepared by means of the solvent casting technique on a 50x50x3 mm3 glass with high optical purity acting as a waveguide. The polymer selected was initially poly(methyl methacrylate) (PMMA), which has been widely used in LSC systems. Subsequently, TPE-BPAN was investigated in other polymer matrices, such as poly(cyclohexyl methacrylate) (PCHMA), to assess its performance in matrices of different polarity. It had already been observed that a less polar polymer such as PCHMA could lead to higher QY [16], however, the high fragility of PCHMA in contact with glass compromises its long-term use.
We then synthesized five different polymeric matrices by free radical polymerization (FRP), i.e., the two homopolymers poly(methyl methacrylate (PMMA) and poly(cyclohexyl methacrylate (PCHMA), and three copolymers obtained from the polymerization of methyl methacrylate and cyclohexyl methacrylate at different compositions (P(MMA-co-CHMA), 75:25, 50:50, 25:75 mol.%). All polymerizations were conducted in toluene, using 1 wt.% AIBN as initiator and adding monomers in the desired composition. The polymerizations required from 24 to 72 hours to achieve complete conversion, verified with 1H NMR spectroscopy (Figures S8 to S12). The obtained polymers were characterized in terms of molecular weight and polydispersity index (PDI) by gel permeation chromatography (GPC). Despite variations in the polarity of the co-monomers and in the composition of the reaction mixtures, no substantial differences were observed between the five polymers synthesized, with weight average molecular weight (Mw) ranging from 35’000 to 95’000 and PDI of 1.5-2.8 (Figures S13, S14). Differential scanning calorimetry (DSC) measurements showed a drop in the glass transition temperatures (Tg) with increasing CHMA content, with no noticeable relationship with the average molecular weight (Figure S15). Notably, copolymers Tg agrees with the Fox equation (R2 = 0.983).
The polarity of the matrices was verified by determination of the static contact angle, resulting in 70° ± 2 for PMMA, 91° ± 2 for P(MMA-co-CHMA) 50:50, and 99° ± 2 for PCHMA (Figure S16).
As shown in Figure 7 (a), the first peak at 338-340 nm showed no change in position for all thin films compared to the analysis in THF solution. Notably, the second peak, which was centered at 444 nm in THF, is slightly shifted to 434-439 nm in polymeric thin-film, apart from an evident variation to 427 nm in the PCHMA homopolymer matrix. As discussed above, the electronic transition responsible for the lowest energy band is actually a CT from the donor to the acceptor. By inspection of the computed data reported in Table 1, one can notice that while no difference can be remarked moving from water to THF further moving to a fully non-polar environment (gas-phase), a shift to higher energy is predicted. This agrees with a solvatochromic effect induced by the presence of the remarkably less polar matrix as PCHMA [39].
TPE-BPAN emissions peaks are all included in the 570-600 nm range (Figure 7 (b)), i.e. in a range where the external quantum efficiency of the Si-PV cell is maximum. As can be seen from Figure 4, referring to the 0.4 wt.% concentration, the wavelength at the emission maximum does not show any relevant shift as the CHMA content in the polymeric matrix increases, except for the 100% PCHMA sample, where a blue shift is observed from 575 to 571 nm. More evident differences are recognized at the 2.0% concentration. In fact, although a red shift caused by self-absorption was expected as the fluorophore concentration increased, a red shift of 15 nm was observed in the matrices with a high CHMA content. The lower polar character of the PCHMA matrix is probably responsible for these different shift effects. It is to be noted that a blue shift of the emission peak with increasing CHMA content leads to a reduction of the Stokes shift, which may result in a more pronounced self-absorption effect.
The trends in terms of QY of the thin films at different monomer compositions and fluorophore concentrations are shown in Figure 8 (a). As can be seen, the presence of CHMA in the copolymer appeared to have a positive effect in enhancing the fluorophore's emission. In particular, TPE-BPAN displayed a higher PLQY at all concentrations studied when dispersed in P(MMA-co-CHMA) 75:25. Above 25% CHMA content, a decrease in PLQY was observed until values almost identical to those of TPE-BPAN/PMMA films, also possibly caused by the increased self-absorption due to the Stokes shift reduction. Also confirmed in this work is the result reported in our previous work [18], where a similar ACQ phenomenon was observed in polymer films, and the behavior was addressed to the formation of less emissive amorphous aggregates. The presence of such aggregates, increasing in size with concentration from 0.4 to 2.0 wt.%, was observed by epifluorescent microscopy (Figure S17).
Since films of P(MMA-co-CHMA) 75:25 and PMMA showed good integrity and adhesion to the glass substrate, they were investigated as matrices in LSC applications, and the main results were determined according to the recently published laboratory protocols.[40,41] Figures (b) and (c) compare the internal (ηint) and external (ηext) photonic efficiencies of LSC made from these two matrices. As was the case for the quantum yield, the copolymer-based film results in a higher ηint, even though this gap tends to zero with increasing TPE-BPAN concentration. This could be due to a lack of homogeneity in highly concentrated films, where fluorophore aggregates could act as scattering centers [42]. Conversely, ηext, appears primarily unaffected by the change in matrix polarity since it goes from 2% to about 3% in both cases. These values are considerably lower than those obtained with Lumogen F Red 305 (state-of-the-art fluorophore for LSC applications) in PMMA thin films, whose efficiencies never fell below 5% in the range of concentrations analyzed. However, the result is not surprising, as the quantum yields of Lumogen F Red 305 in PMMA always exceed 70% from 0.4 to 2 wt.% of fluorophore content.
As a final step, LSCs were coupled to monocrystalline silicon photovoltaic cells to measure the electrical device efficiency ηdev, which is a significant parameter for the characterization of LSC [43]. Again, results do not differ greatly with 25% of cyclohexyl methacrylate content in the polymer. The percentage of incident solar power converted into electricity always remained between 0.2 and 0.3%, while it ranged from 0.5% (0.4 wt.%) to 1.0% (2.0 wt.%) in the case of Lumogen F Red 305. Thus, matrix polarity and fluorophore concentration variations do not seem to substantially influence the performance of LSC devices.
5. Conclusions
A novel AIE fluorophore, TPE-BPAN, was synthesized by functionalizing TPE with two dimethylamino donor groups and a 4-biphenyl acetonitrile acceptor moiety. Its thermal stability has been found to be up to 300 °C. In THF solution, two absorption peaks are observed (339, 444 nm), but no emission is detected. A bright fluorescence centered at 639 nm is visible with the addition of water from 70% onwards, thus demonstrating its AIE behaviour. The theoretical calculations demonstrate that the observed enhancement of the emission in aggregate phases can mainly be ascribed to the suppression of non-radiative decay channels that are active in the solution but are ineffective in the crystalline phases due to the constraints imposed by the crystal packings to the movement of donor and acceptor units involved in the absorption and emission processes. This agrees with the behaviour observed for TPE and for other TPE derivatives, and it is due to several different intermolecular interactions at work in the condensed phases that significantly constrain the torsion of phenyls substituents in the solid state, suppressing non-radiative decay and enhancing the radiative emission process.
The same type of mechanism is active when TPE-BPAN is embedded in a polymeric matrix, where AIE-like emission also occurs. Five polymeric matrices obtained by combining methyl methacrylate as a more polar monomer and cyclohexyl methacrylate as a less polar monomer have been proposed. Poly(methyl methacrylate-co-cyclohexyl methacrylate) 75:25 mol.% turns out to be the best polymeric environment for TPE-BPAN, since thin-film integrity and glass adhesion are preserved, and quantum yield values are the highest. LSC characterizations prove that the gain in quantum yield does not significantly enhance the photon concentration effect or the electrical production.
Supplementary Materials
The following supporting information can be downloaded at the website of this paper posted on Preprints.org.
Author Contributions
Conceptualization, An.P., J.H. and F.P.; investigation, F.V., C.M., Q.W. and Al.P.; data curation, Al.P., Q.W., F.V. and C.M.; writing—original draft preparation, Al.P. and Q.W.; writing—review and editing, An.P., C.A. and I.C.; supervision, An.P., C.A. and I.C. All authors have read and agreed to the published version of the manuscript.
Funding
QW acknowledges funding by China Scholarship Council, grant/award number: 202006890004. This research is also supported by the Ministry of University and Research (MUR) as part of the PON 2014-2020 “Research and Innovation” resources – Green/Innovation Action – DM MUR 1061/2022.
Data Availability Statement
Not applicable. No data have been created.
Acknowledgments
Dr. Michele Turelli (PSL University) is gratefully acknowledged for fruitful discussions and support. Ms. Agnese Polo is kindly acknowledged for her contribution to the synthesis of TPE-BPAN.
Conflicts of Interest
The authors declare no conflict of interest.
References
- Laveyne, J.I.; Bozalakov, D.; Van Eetvelde, G.; Vandevelde, L. Impact of Solar Panel Orientation on the Integration of Solar Energy in Low-Voltage Distribution Grids. Int. J. Photoenergy 2020, 2020. [Google Scholar] [CrossRef]
- Richards, B.S.; Howard, I.A. Luminescent Solar Concentrators for Building Integrated Photovoltaics: Opportunities and Challenges. Energy Environ. Sci. 2023. [Google Scholar] [CrossRef]
- Tong, H.; Hong, Y.; Dong, Y.; Ren, Y.; Haussie, M.; Lam, J.W.Y.; Wong, K.S.; Tang, B.Z. Color-Tunable, Aggregation-Induced Emission of a Butterfly-Shaped Molecule Comprising a Pyran Skeleton and Two Cholesteryl Wings. J. Phys. Chem. B 2007, 111, 2000–2007. [Google Scholar] [CrossRef]
- Pucci, A. Luminescent Solar Concentrators Based on Aggregation Induced Emission. Isr. J. Chem. 2018, 58, 837–844. [Google Scholar] [CrossRef]
- Hu, R.; Qin, A.; Tang, B.Z. AIE Polymers: Synthesis and Applications. Prog. Polym. Sci. 2020, 100, 101176. [Google Scholar] [CrossRef]
- Tong, H.; Hong, Y.; Dong, Y.; Häußler, M.; Lam, J.W.Y.; Li, Z.; Guo, Z.; Guo, Z.; Tang, B.Z. Fluorescent “Light-up” Bioprobes Based on Tetraphenylethylene Derivatives with Aggregation-Induced Emission Characteristics. Chem. Commun. 2006, 3705–3707. [Google Scholar] [CrossRef]
- Geervliet, T.A.; Gavrila, I.; Iasilli, G.; Picchioni, F.; Pucci, A. Luminescent Solar Concentrators Based on Renewable Polyester Matrices. Chem. - An Asian J. 2019, 14, 877–883. [Google Scholar] [CrossRef]
- Guidugli, N.; Mori, R.; Bellina, F.; Tang, B.Z.; Pucci, A. Aggregation-Induced Emission: New Emerging Fluorophores for Environmental Sensing. Princ. Appl. Aggregation-Induced Emiss. 2018, 335–349. [CrossRef]
- Zhang, B.; Banal, J.L.; Jones, D.J.; Tang, B.Z.; Ghiggino, K.P.; Wong, W.W.H. Aggregation-Induced Emission-Mediated Spectral Downconversion in Luminescent Solar Concentrators. Mater. Chem. Front. 2018, 2, 615–619. [Google Scholar] [CrossRef]
- Lyu, G.; Kendall, J.; Meazzini, I.; Preis, E.; Bayseç, S.; Scherf, U.; Clément, S.; Evans, R.C. Luminescent Solar Concentrators Based on Energy Transfer from an Aggregation-Induced Emitter Conjugated Polymer. ACS Appl. Polym. Mater. 2019, 1, 3039–3047. [Google Scholar] [CrossRef]
- Li, Y.; Li, Z.; Wang, Y.; Compaan, A.; Ren, T.; Dong, W.J. Increasing the Power Output of a CdTe Solar Cell via Luminescent down Shifting Molecules with Intramolecular Charge Transfer and Aggregation-Induced Emission Characteristics. Energy Environ. Sci. 2013, 6, 2907–2911. [Google Scholar] [CrossRef]
- Li, Y.; Ren, T.; Dong, W.-J. Tuning Photophysical Properties of Triphenylamine and Aromatic Cyano Conjugate-Based Wavelength-Shifting Compounds by Manipulating Intramolecular Charge Transfer Strength. J. Photochem. Photobiol. A Chem. 2013, 251, 1–9. [Google Scholar] [CrossRef]
- Pucci, A. AIE Polymer Films for Optical Sensing and Energy Harvesting. In Handbook of Aggregation-Induced Emission; Wiley, 2022; pp. 57–78.
- Della Latta, E.; Sabatini, F.; Micheletti, C.; Carlotti, M.; Martini, F.; Nardelli, F.; Battisti, A.; Degano, I.; Geppi, M.; Pucci, A.; et al. Performant Flexible Luminescent Solar Concentrators of Phenylpolysiloxanes Crosslinked with Perylene Bisimide Fluorophores. Polym. Chem. 2023, 14, 1602–1612. [Google Scholar] [CrossRef]
- Kastelijn, M.J.; Bastiaansen, C.W.M.; Debije, M.G. Influence of Waveguide Material on Light Emission in Luminescent Solar Concentrators. Opt. Mater. (Amst). 2009, 31, 1720–1722. [Google Scholar] [CrossRef]
- Ostos, F.J.; Iasilli, G.; Carlotti, M.; Pucci, A. High-Performance Luminescent Solar Concentrators. Polymers (Basel). 2020, 12. [Google Scholar] [CrossRef] [PubMed]
- Bartolini, M.; Micheletti, C.; Picchi, A.; Coppola, C.; Sinicropi, A.; Di Donato, M.; Foggi, P.; Mordini, A.; Reginato, G.; Pucci, A.; et al. Orange/Red Benzo[1,2- B :4,5- b ′]Dithiophene 1,1,5,5-Tetraoxide-Based Emitters for Luminescent Solar Concentrators: Effect of Structures on Fluorescence Properties and Device Performances. ACS Appl. Energy Mater. 2023, 6, 4862–4880. [Google Scholar] [CrossRef]
- Micheletti, C.; Wang, Q.; Ventura, F.; Turelli, M.; Ciofini, I.; Adamo, C.; Pucci, A. Red-emitting Tetraphenylethylene Derivative with Aggregation-induced Enhanced Emission for Luminescent Solar Concentrators: A Combined Experimental and Density Functional Theory Study. Aggregate 2022, 3, 1–10. [Google Scholar] [CrossRef]
- Papucci, C.; Charaf, R.; Coppola, C.; Sinicropi, A.; Di Donato, M.; Taddei, M.; Foggi, P.; Battisti, A.; De Jong, B.; Zani, L.; et al. Luminescent Solar Concentrators with Outstanding Optical Properties by Employment of D-A-D Quinoxaline Fluorophores. J. Mater. Chem. C 2021, 9, 15608–15621. [Google Scholar] [CrossRef]
- Tummeltshammer, C.; Taylor, A.; Kenyon, A.J.; Papakonstantinou, I. Losses in Luminescent Solar Concentrators Unveiled. Sol. Energy Mater. Sol. Cells 2016, 144, 40–47. [Google Scholar] [CrossRef]
- Wang, E.; Zhao, E.; Hong, Y.; Lam, J.W.Y.; Tang, B.Z. A Highly Selective AIE Fluorogen for Lipid Droplet Imaging in Live Cells and Green Algae. J. Mater. Chem. B 2014, 2, 2013–2019. [Google Scholar] [CrossRef]
- Mori, R.; Iasilli, G.; Lessi, M.; Muñoz-García, A.B.; Pavone, M.; Bellina, F.; Pucci, A. Luminescent Solar Concentrators Based on PMMA Films Obtained from a Red-Emitting ATRP Initiator. Polym. Chem. 2018, 9, 1168–1177. [Google Scholar] [CrossRef]
- Papakonstantinou, I.; Portnoi, M.; Debije, M.G. The Hidden Potential of Luminescent Solar Concentrators. Adv. Energy Mater. 2021, 11, 1–13. [Google Scholar] [CrossRef]
- Li, J.; Zhao, H.; Zhao, X.; Gong, X. Boosting Efficiency of Luminescent Solar Concentrators Using Ultra-Bright Carbon Dots with Large Stokes Shift. Nanoscale Horizons 2022, 8, 83–94. [Google Scholar] [CrossRef] [PubMed]
- Ernzerhof, M.; Scuseria, G.E. Assessment of the Perdew–Burke–Ernzerhof Exchange-Correlation Functional. J. Chem. Phys. 1999, 110, 5029–5036. [Google Scholar] [CrossRef]
- Adamo, C.; Barone, V. Toward Reliable Density Functional Methods without Adjustable Parameters: The PBE0 Model. J. Chem. Phys. 1999, 110, 6158–6170. [Google Scholar] [CrossRef]
- Tomasi, J.; Mennucci, B.; Cammi, R. Quantum Mechanical Continuum Solvation Models. Chem. Rev. 2005, 105, 2999–3094. [Google Scholar] [CrossRef] [PubMed]
- Martin, R.L. Natural Transition Orbitals. J. Chem. Phys. 2003, 118, 4775–4777. [Google Scholar] [CrossRef]
- Adamo, C.; Le Bahers, T.; Savarese, M.; Wilbraham, L.; García, G.; Fukuda, R.; Ehara, M.; Rega, N.; Ciofini, I. Exploring Excited States Using Time Dependent Density Functional Theory and Density-Based Indexes. Coord. Chem. Rev. 2015, 304–305, 166–178. [Google Scholar] [CrossRef]
- Le Bahers, T.; Adamo, C.; Ciofini, I. A Qualitative Index of Spatial Extent in Charge-Transfer Excitations. J. Chem. Theory Comput. 2011, 7, 2498–2506. [Google Scholar] [CrossRef]
- Kun, A.H. ; Rhys Theory of Light Absorption and Non-Radiative Transitions in F -Centres. Proc. R. Soc. London. Ser. A. Math. Phys. Sci. 1950, 204, 406–423. [Google Scholar] [CrossRef]
- Klintenberg, M.; Derenzo, S.E.; Weber, M.J. Accurate Crystal Fields for Embedded Cluster Calculations. Comput. Phys. Commun. 2000, 131, 120–128. [Google Scholar] [CrossRef]
- Wilbraham, L.; Adamo, C.; Labat, F.; Ciofini, I. Electrostatic Embedding To Model the Impact of Environment on Photophysical Properties of Molecular Crystals: A Self-Consistent Charge Adjustment Procedure. J. Chem. Theory Comput. 2016, 12, 3316–3324. [Google Scholar] [CrossRef] [PubMed]
- Derenzo, S.E.; Klintenberg, M.K.; Weber, M.J. Determining Point Charge Arrays That Produce Accurate Ionic Crystal Fields for Atomic Cluster Calculations. J. Chem. Phys. 2000, 112, 2074–2081. [Google Scholar] [CrossRef]
- Wilbraham, L.; Louis, M.; Alberga, D.; Brosseau, A.; Guillot, R.; Ito, F.; Labat, F.; Métivier, R.; Allain, C.; Ciofini, I. Revealing the Origins of Mechanically Induced Fluorescence Changes in Organic Molecular Crystals. Adv. Mater. 2018, 30, 1800817. [Google Scholar] [CrossRef] [PubMed]
- Presti, D.; Wilbraham, L.; Targa, C.; Labat, F.; Pedone, A.; Menziani, M.C.; Ciofini, I.; Adamo, C. Understanding Aggregation-Induced Emission in Molecular Crystals: Insights from Theory. J. Phys. Chem. C 2017, 121, 5747–5752. [Google Scholar] [CrossRef]
- Lu, T.; Chen, Q. Interaction Region Indicator: A Simple Real Space Function Clearly Revealing Both Chemical Bonds and Weak Interactions**. Chemistry–Methods 2021, 1, 231–239. [Google Scholar] [CrossRef]
- Lu, T.; Chen, F. Multiwfn: A Multifunctional Wavefunction Analyzer. J. Comput. Chem. 2012, 33, 580–592. [Google Scholar] [CrossRef]
- Butty, E.; Suppan, P. Solvatochromic Effects in Mixed Polymers. Polym. Photochem. 1984, 5, 171–177. [Google Scholar] [CrossRef]
- Yang, C.; Atwater, H.A.; Baldo, M.A.; Baran, D.; Barile, C.J.; Barr, M.C.; Bates, M.; Bawendi, M.G.; Bergren, M.R.; Borhan, B.; et al. Consensus Statement: Standardized Reporting of Power-Producing Luminescent Solar Concentrator Performance. Joule 2022, 6, 8–15. [Google Scholar] [CrossRef]
- Debije, M.G.; Evans, R.C.; Griffini, G. Laboratory Protocols for Measuring and Reporting the Performance of Luminescent Solar Concentrators. Energy Environ. Sci. 2021, 14, 293–301. [Google Scholar] [CrossRef]
- Micheletti, C.; Dini, V.A.; Carlotti, M.; Fuso, F.; Genovese, D.; Zaccheroni, N.; Gualandi, C.; Pucci, A. Blending or Bonding? Mechanochromism of an Aggregachromic Mechanophore in a Thermoplastic Elastomer. ACS Appl. Polym. Mater. 2023, 5, 1545–1555. [Google Scholar] [CrossRef]
- Yang, C.; Liu, D.; Lunt, R.R. How to Accurately Report Transparent Luminescent Solar Concentrators. Joule 2019, 3, 2871–2876. [Google Scholar] [CrossRef]
Figure 1.
Schematic structure of TPE-BPAN highlighting the donor (green) and acceptor (red) substituent groups introduced in the TPE core.
Figure 1.
Schematic structure of TPE-BPAN highlighting the donor (green) and acceptor (red) substituent groups introduced in the TPE core.
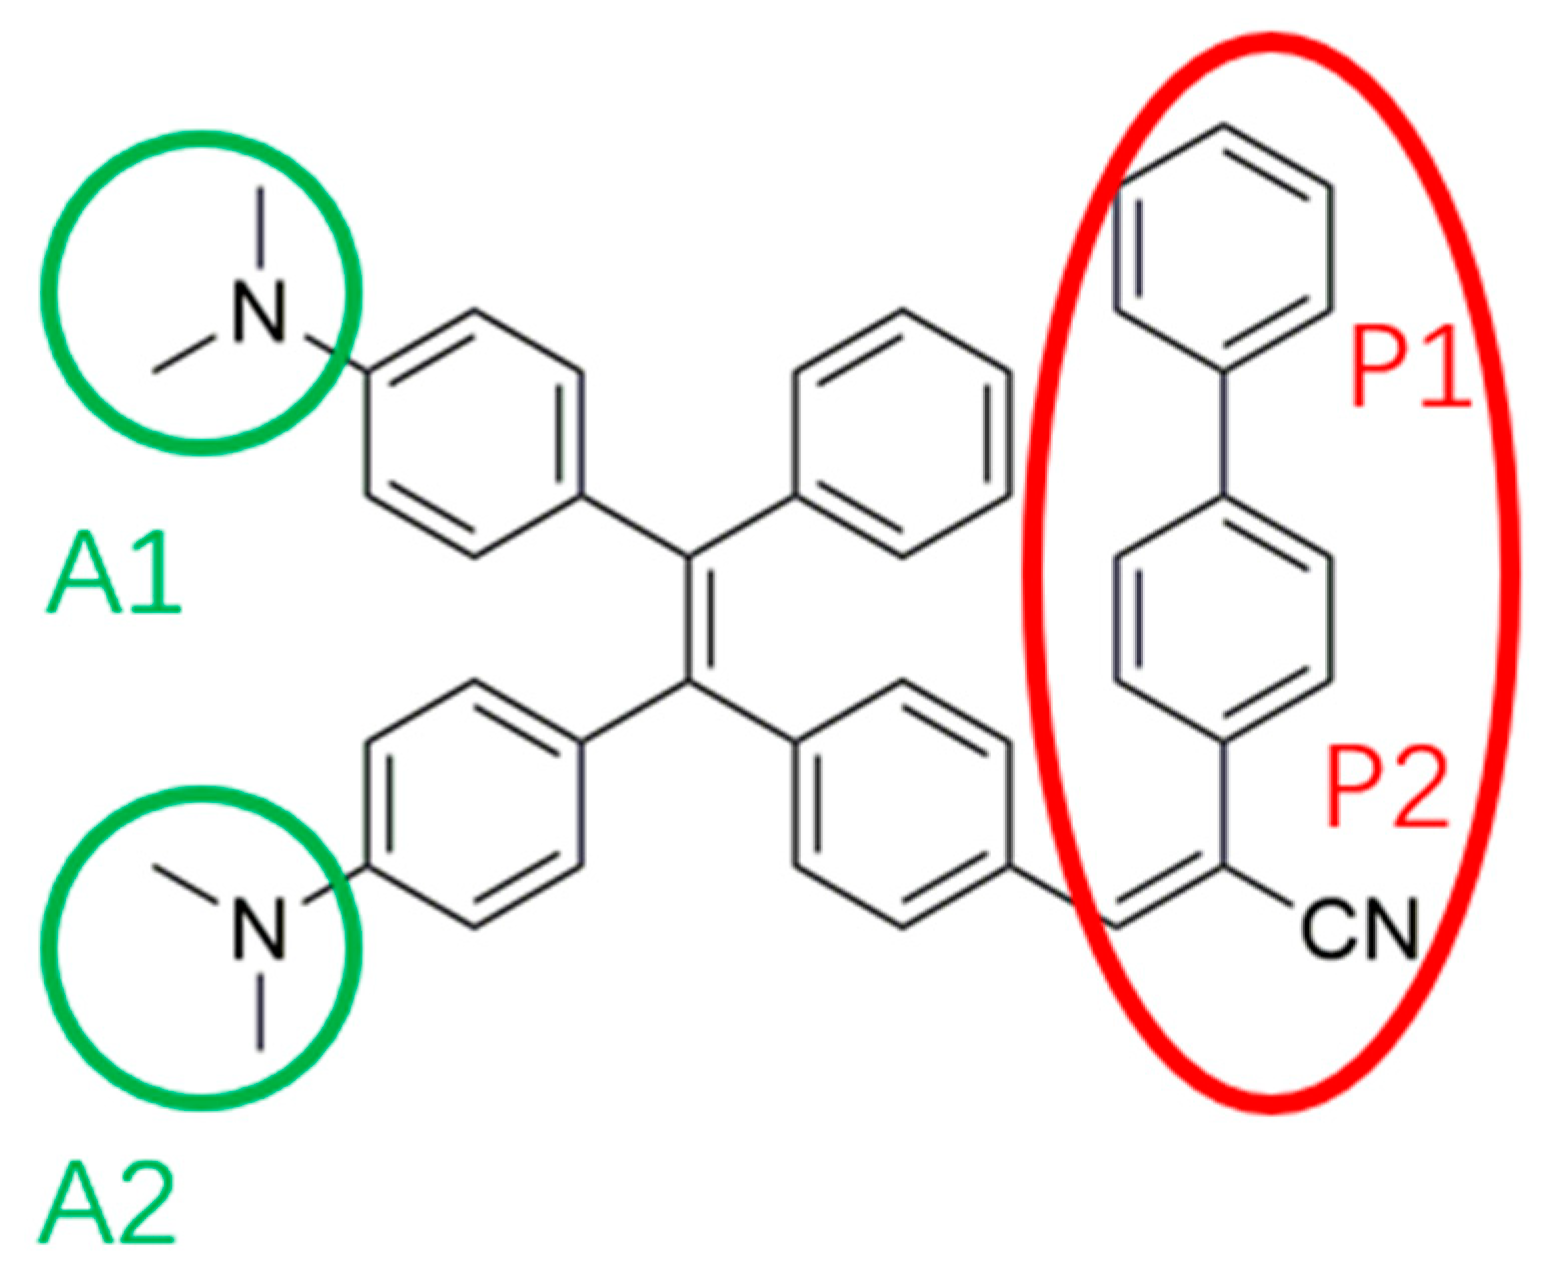
Figure 2.
(a) Emission spectra of TPE-BPAN dissolved in THF/H2O mixtures at different compositions; (b) Picture showing solutions of TPE-BPAN in various THF/H2O mixtures under UV irradiation (366 nm).
Figure 2.
(a) Emission spectra of TPE-BPAN dissolved in THF/H2O mixtures at different compositions; (b) Picture showing solutions of TPE-BPAN in various THF/H2O mixtures under UV irradiation (366 nm).
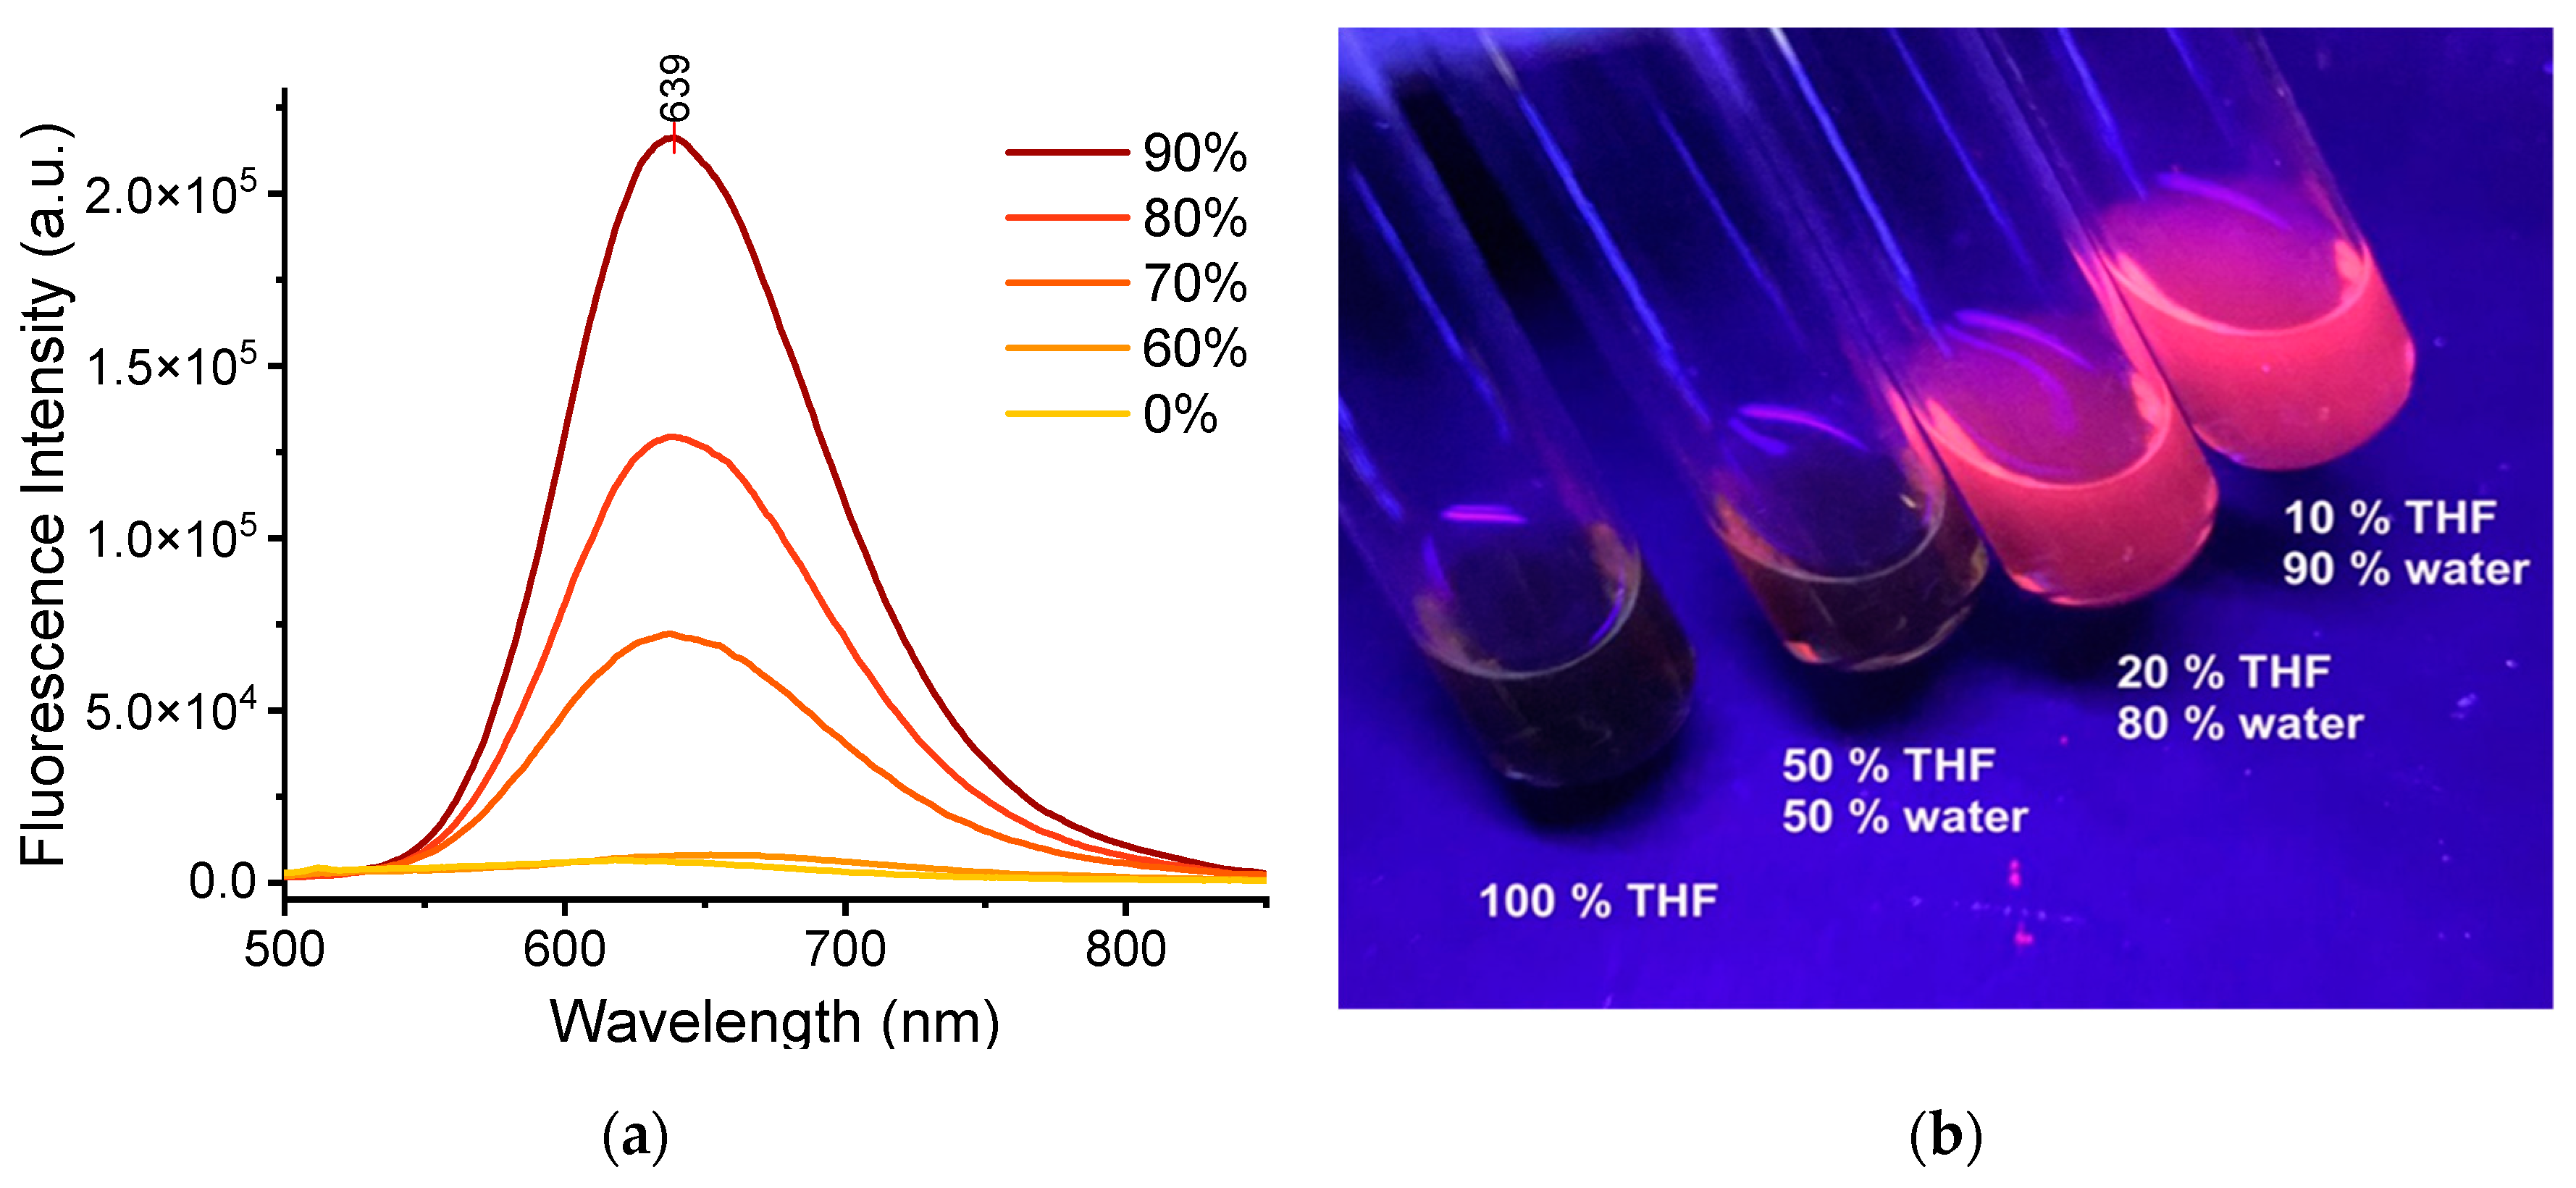
Figure 6.
Interaction Region Indicator analysis computed for TPE_BPAN in the Pol_2 and Pol_3 phases. Refer to text for further explanation.
Figure 6.
Interaction Region Indicator analysis computed for TPE_BPAN in the Pol_2 and Pol_3 phases. Refer to text for further explanation.
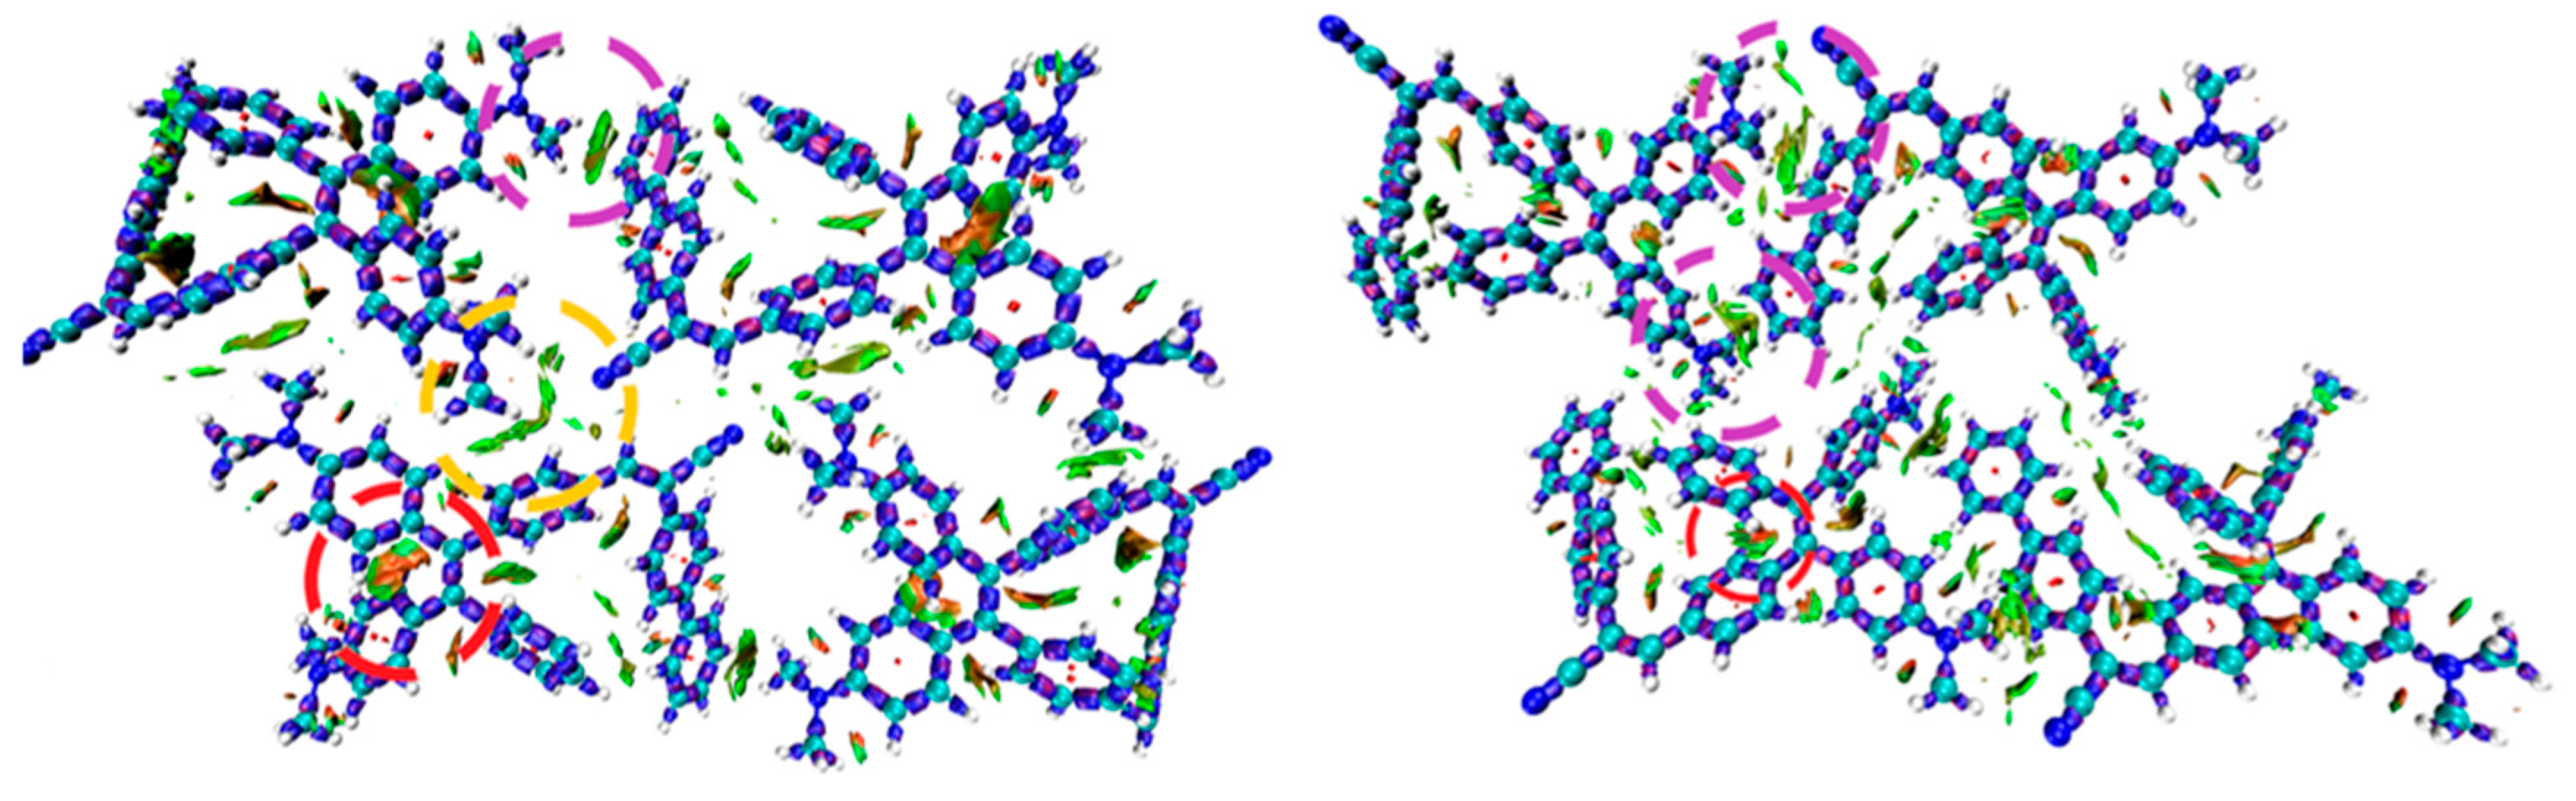
Figure 7.
(a) Absorption spectra of TPE-BPAN in the five polymeric matrices under study at 2.0 wt.% concentration. Peak positions are marked with red vertical dashes. (b) Emission spectra of TPE-BPAN in the five polymeric matrices under study in the concentration of 0.4 wt.% (dashed), 2.0 wt.% (solid). Peak positions are shown with red vertical dashes.
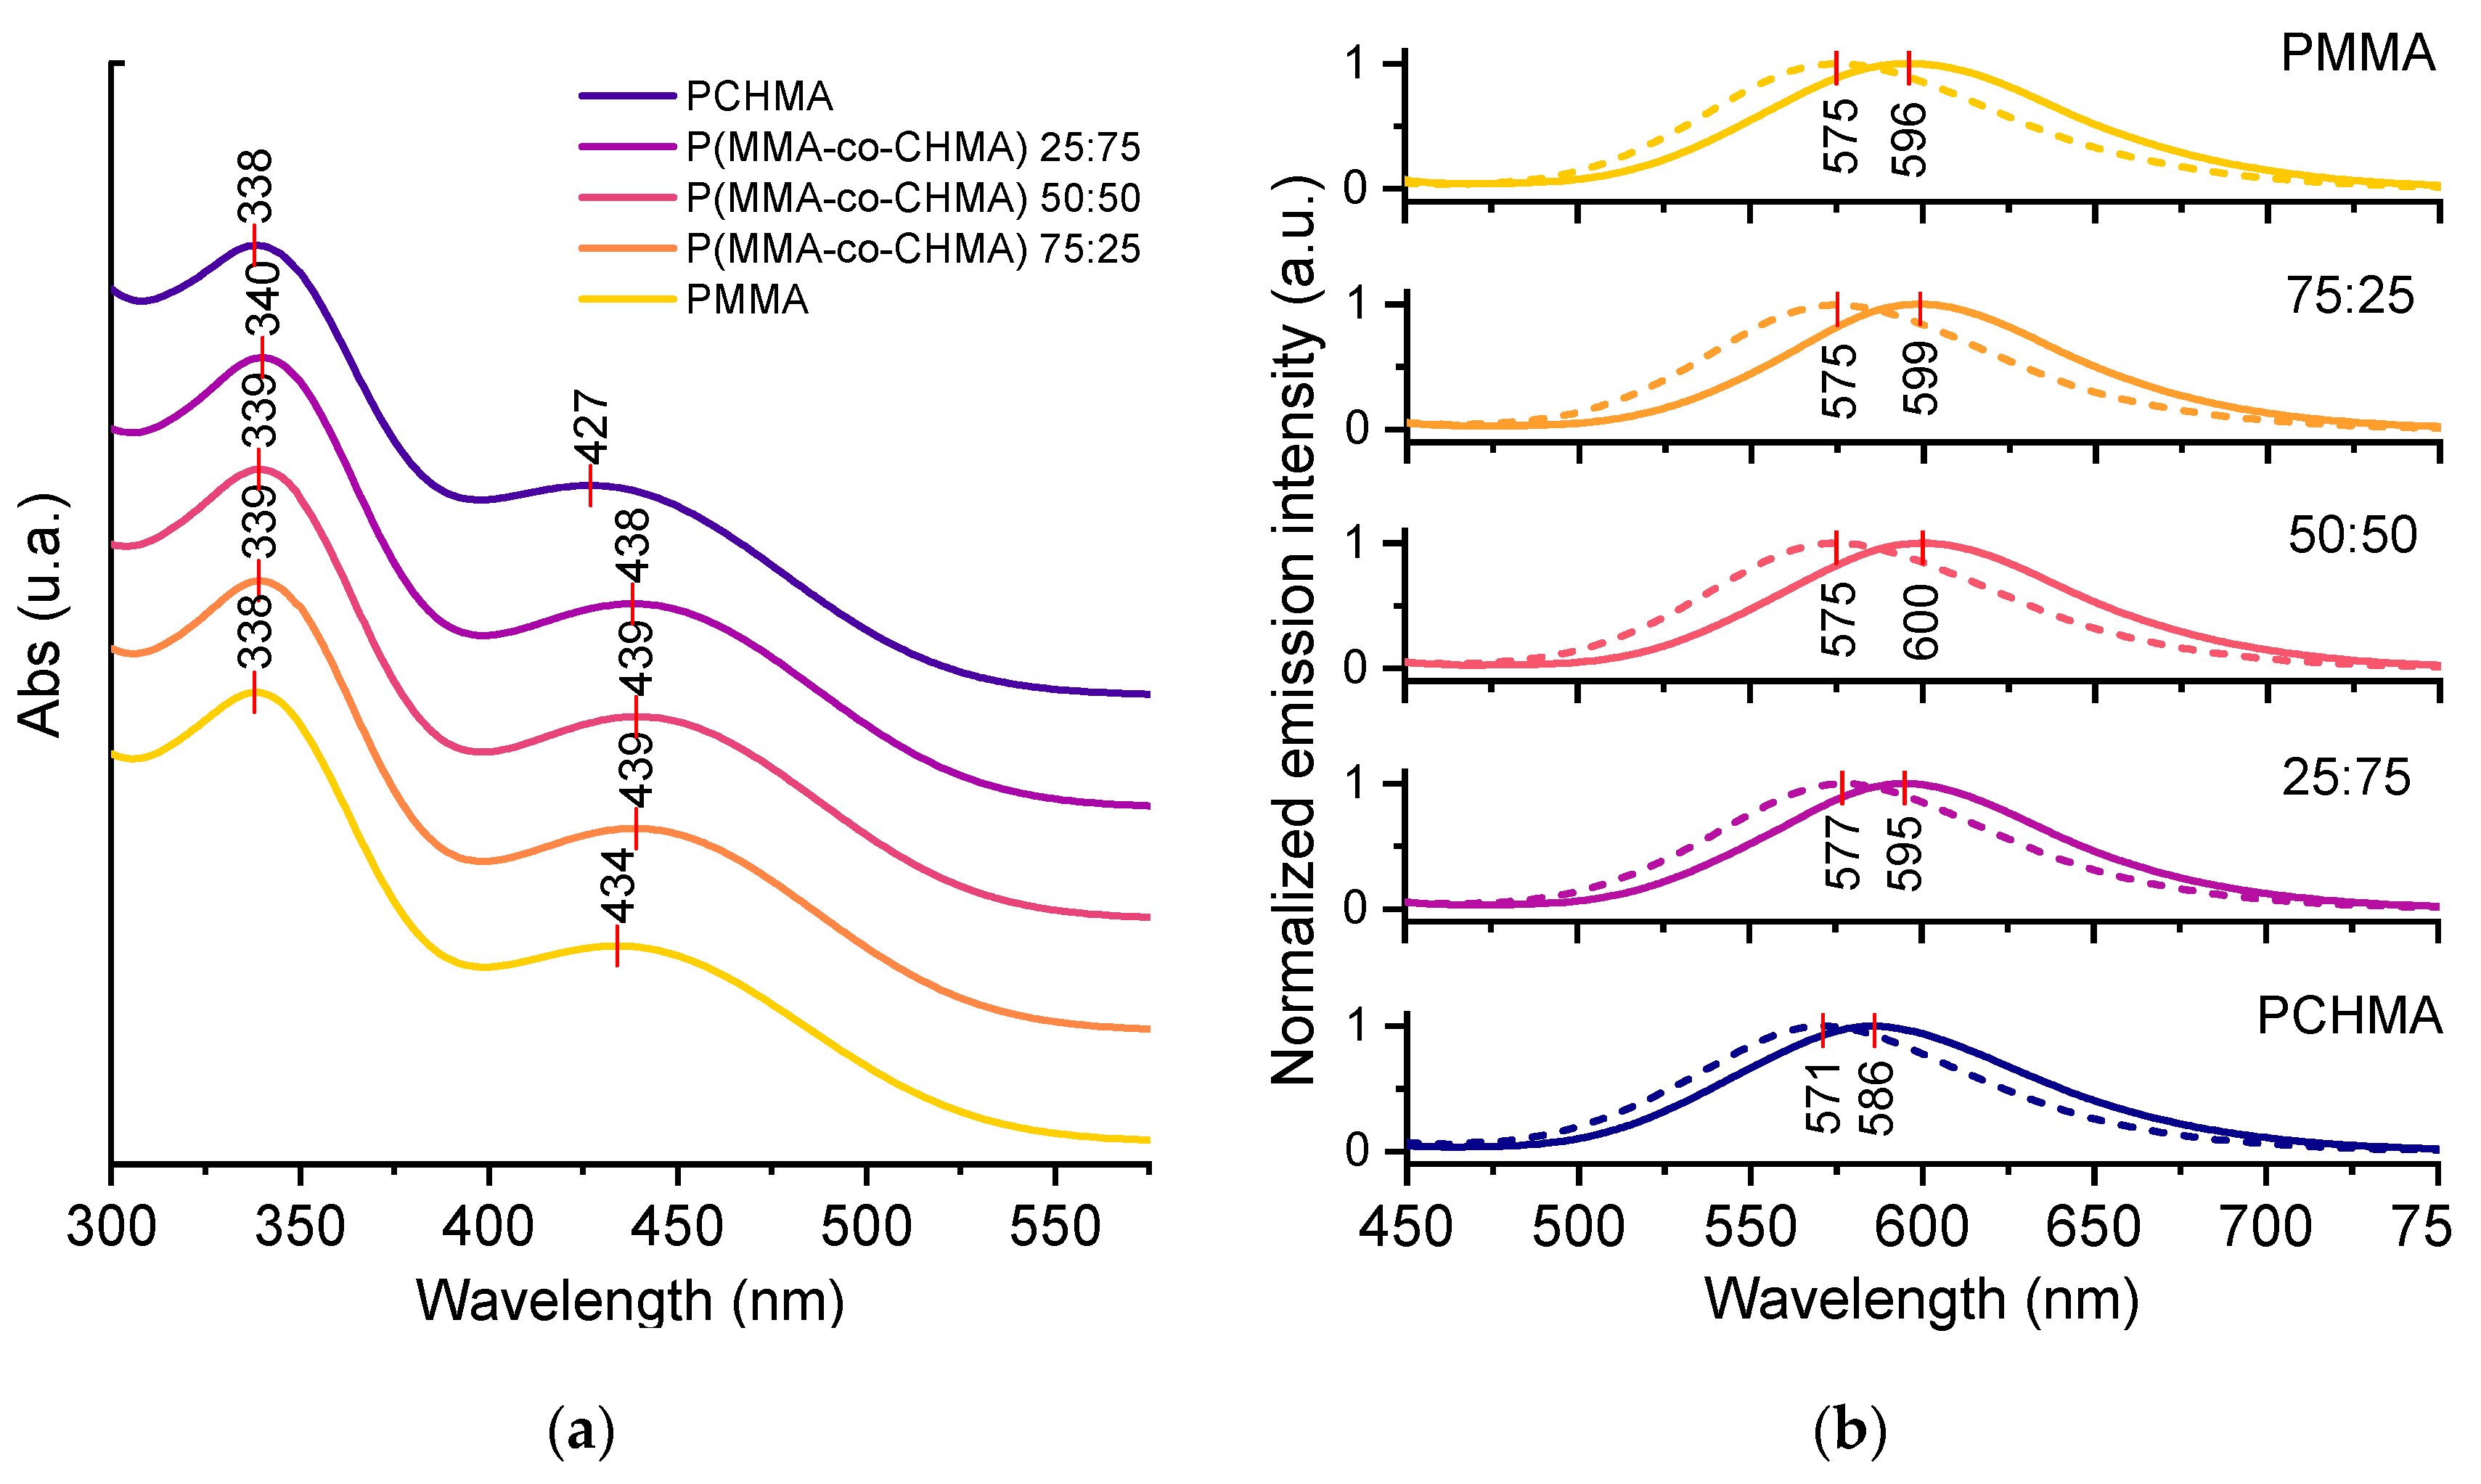
Figure 8.
(a) Quantum yield (QY %) vs. fluorophore concentration for the five TPE-BPAN-containing thin films. Error bars are shown only with reference to the 0.4 wt.% concentration for clarity (see all data from Figures S23 to S27); (b) Internal photonic efficiency and (c) External photonic efficiency vs. TPE-BPAN concentration in PMMA and P(MMA-co-CHMA) 75:25 films. (d) Electrical device efficiency vs. TPE-BPAN concentration in PMMA and P(MMA-co-CHMA) 75:25 films.
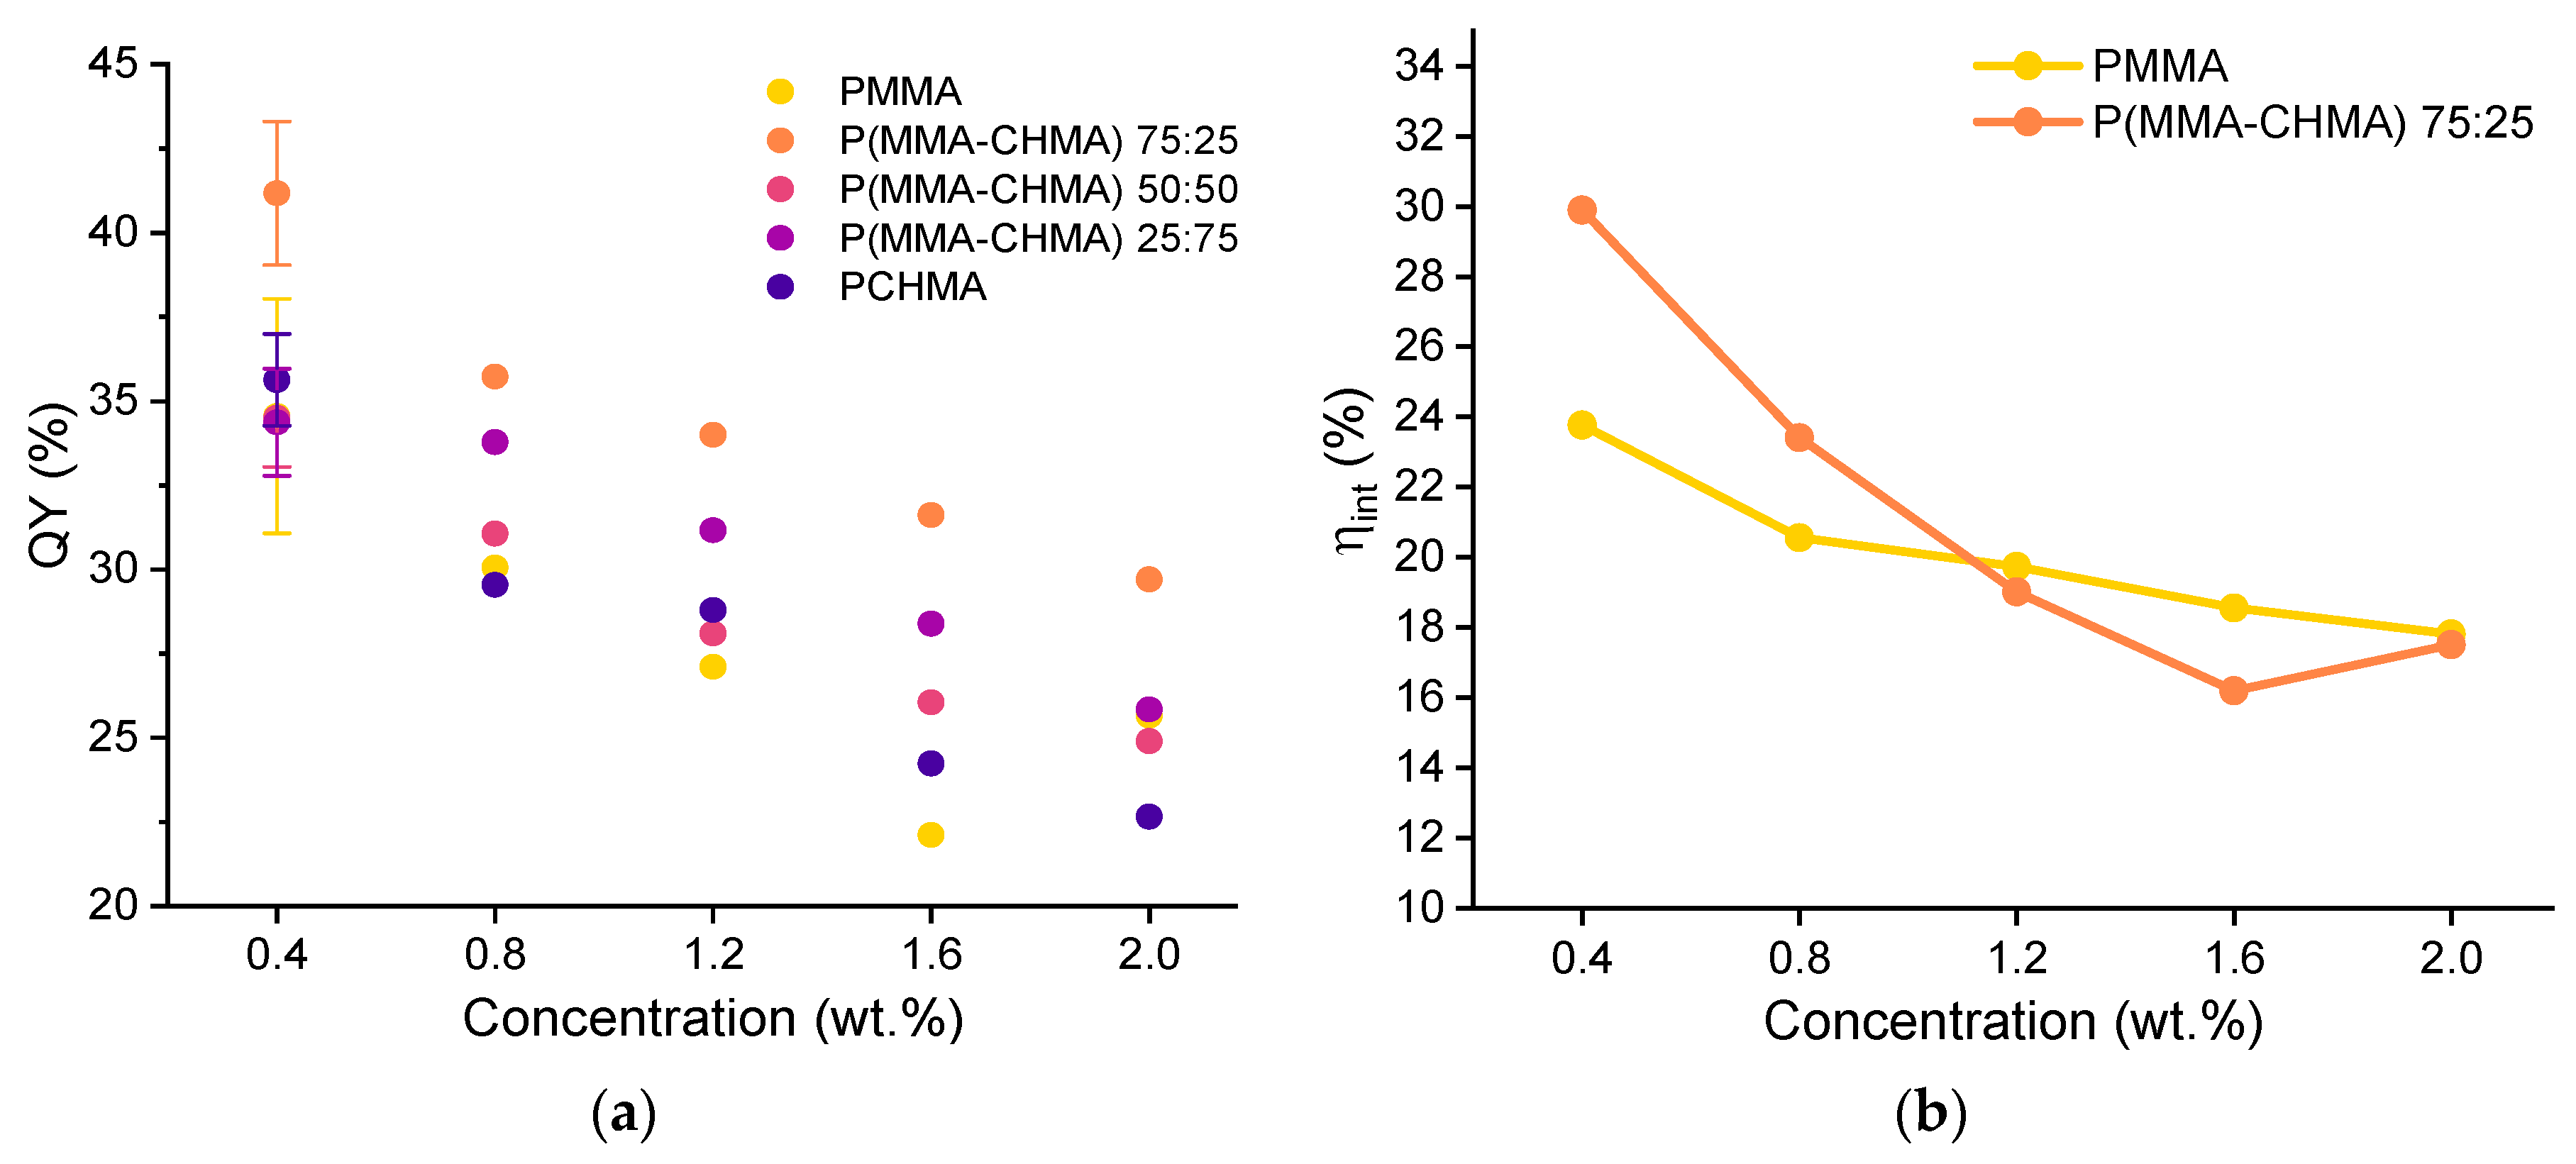
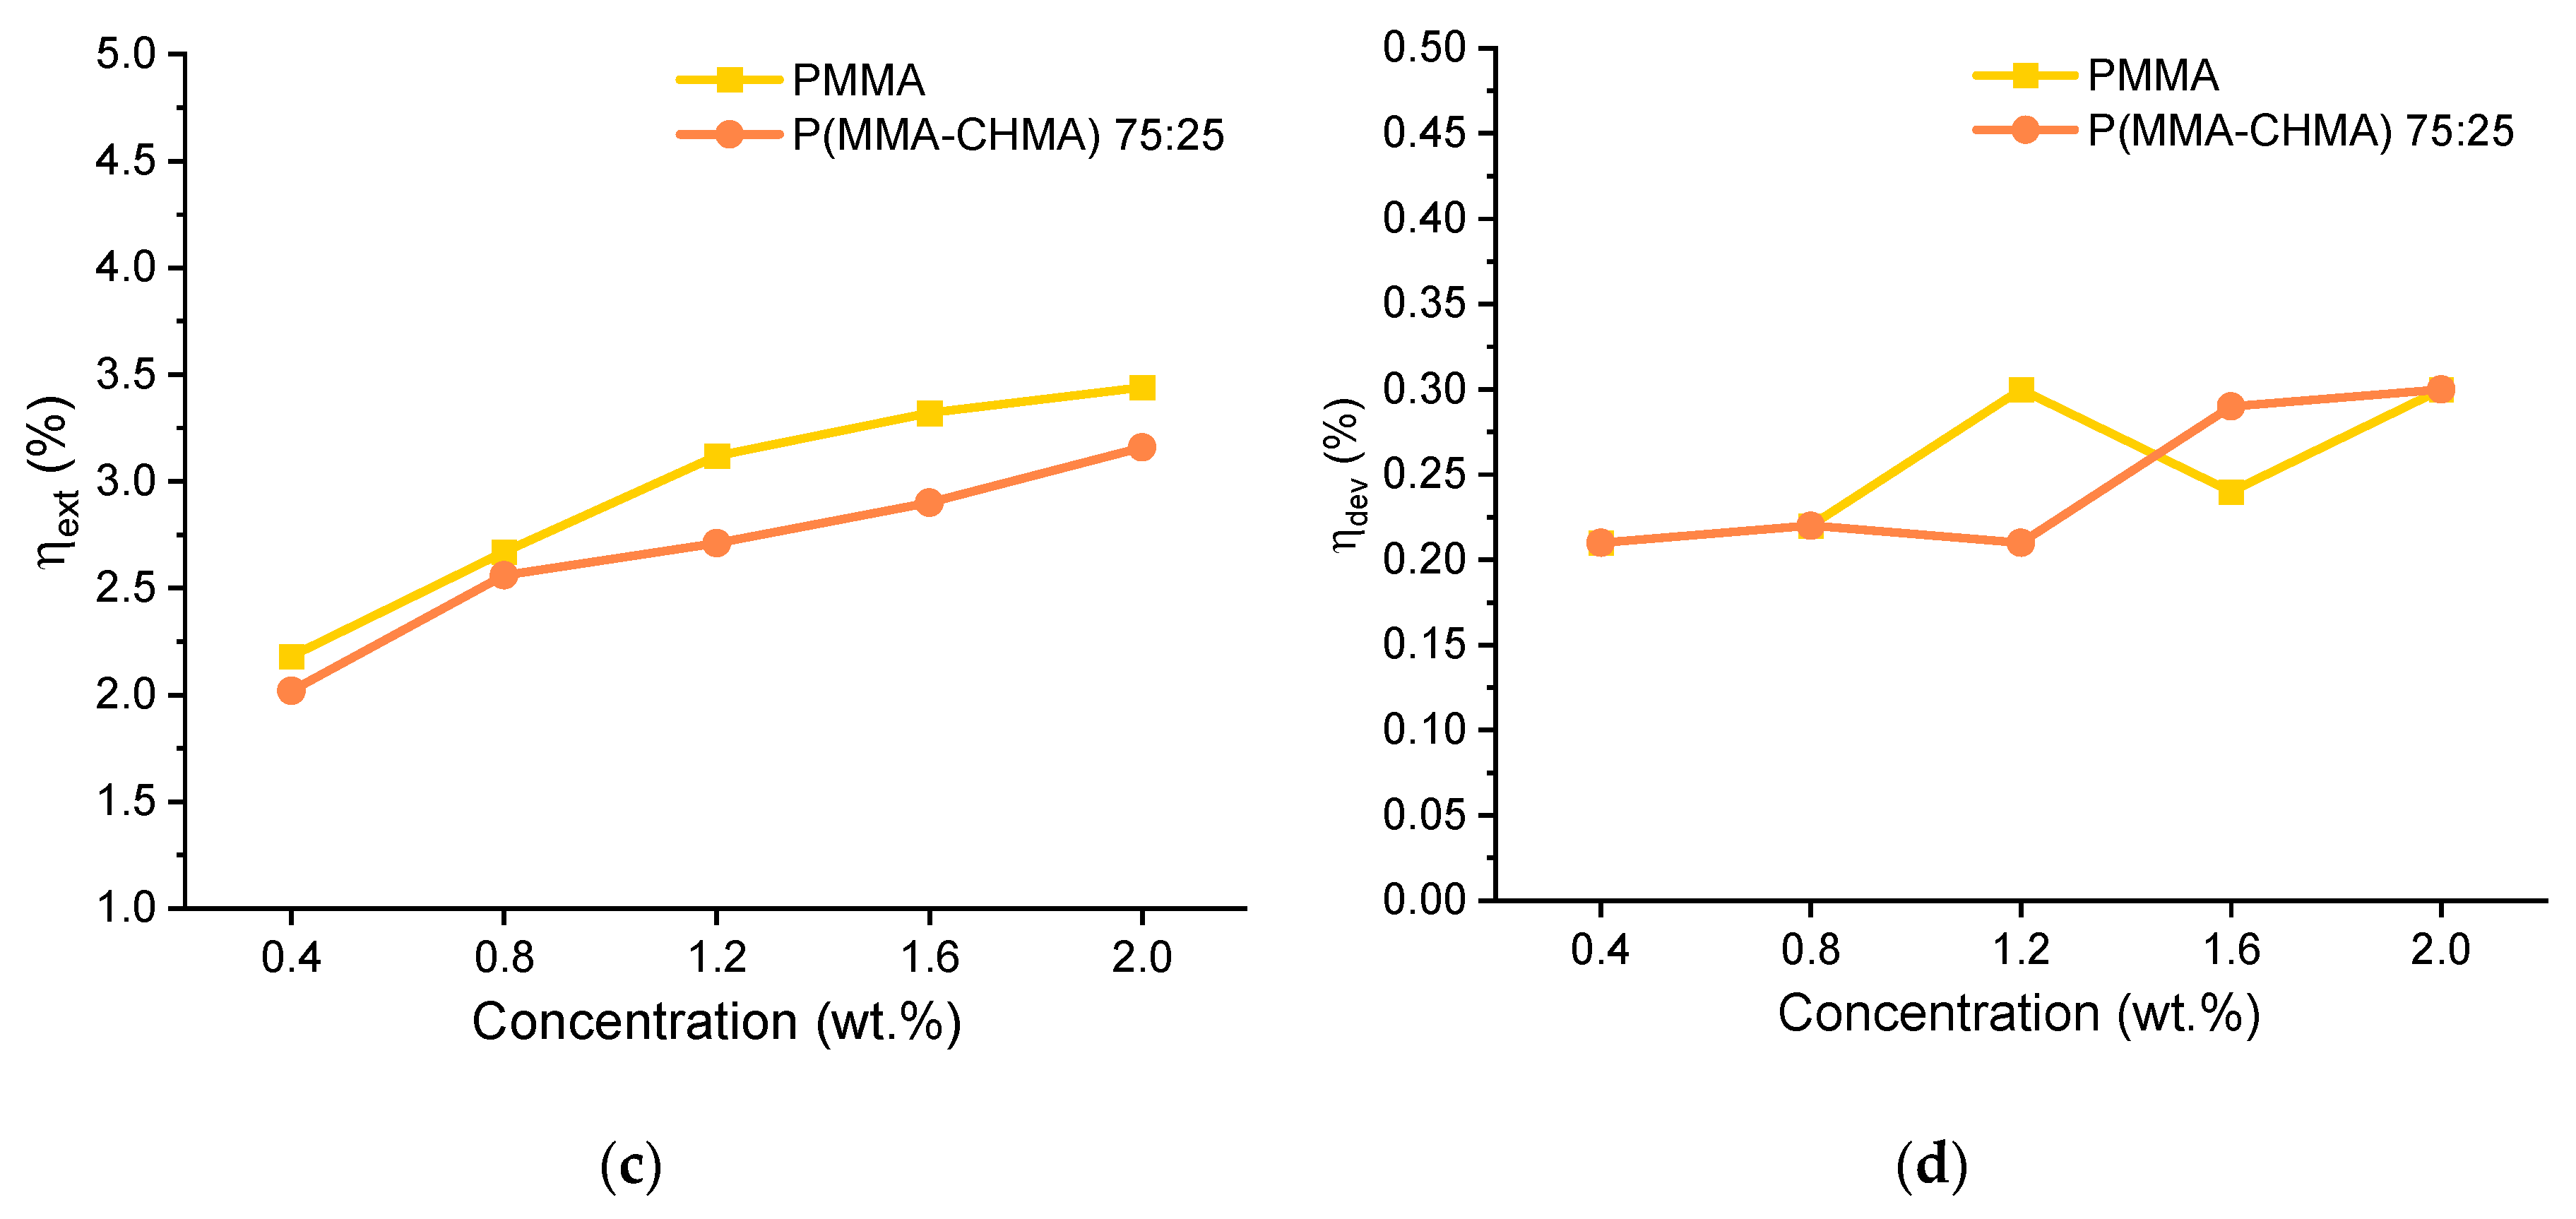
Figure 3.
(a) NTO orbital associated to the S0- S1 transition of TPE-BPAN. (isodensity = 0.025 a.u.). (b) Graphical representation of the DCT: barycenters of hole and electron charge distribution are in violet.
Figure 3.
(a) NTO orbital associated to the S0- S1 transition of TPE-BPAN. (isodensity = 0.025 a.u.). (b) Graphical representation of the DCT: barycenters of hole and electron charge distribution are in violet.
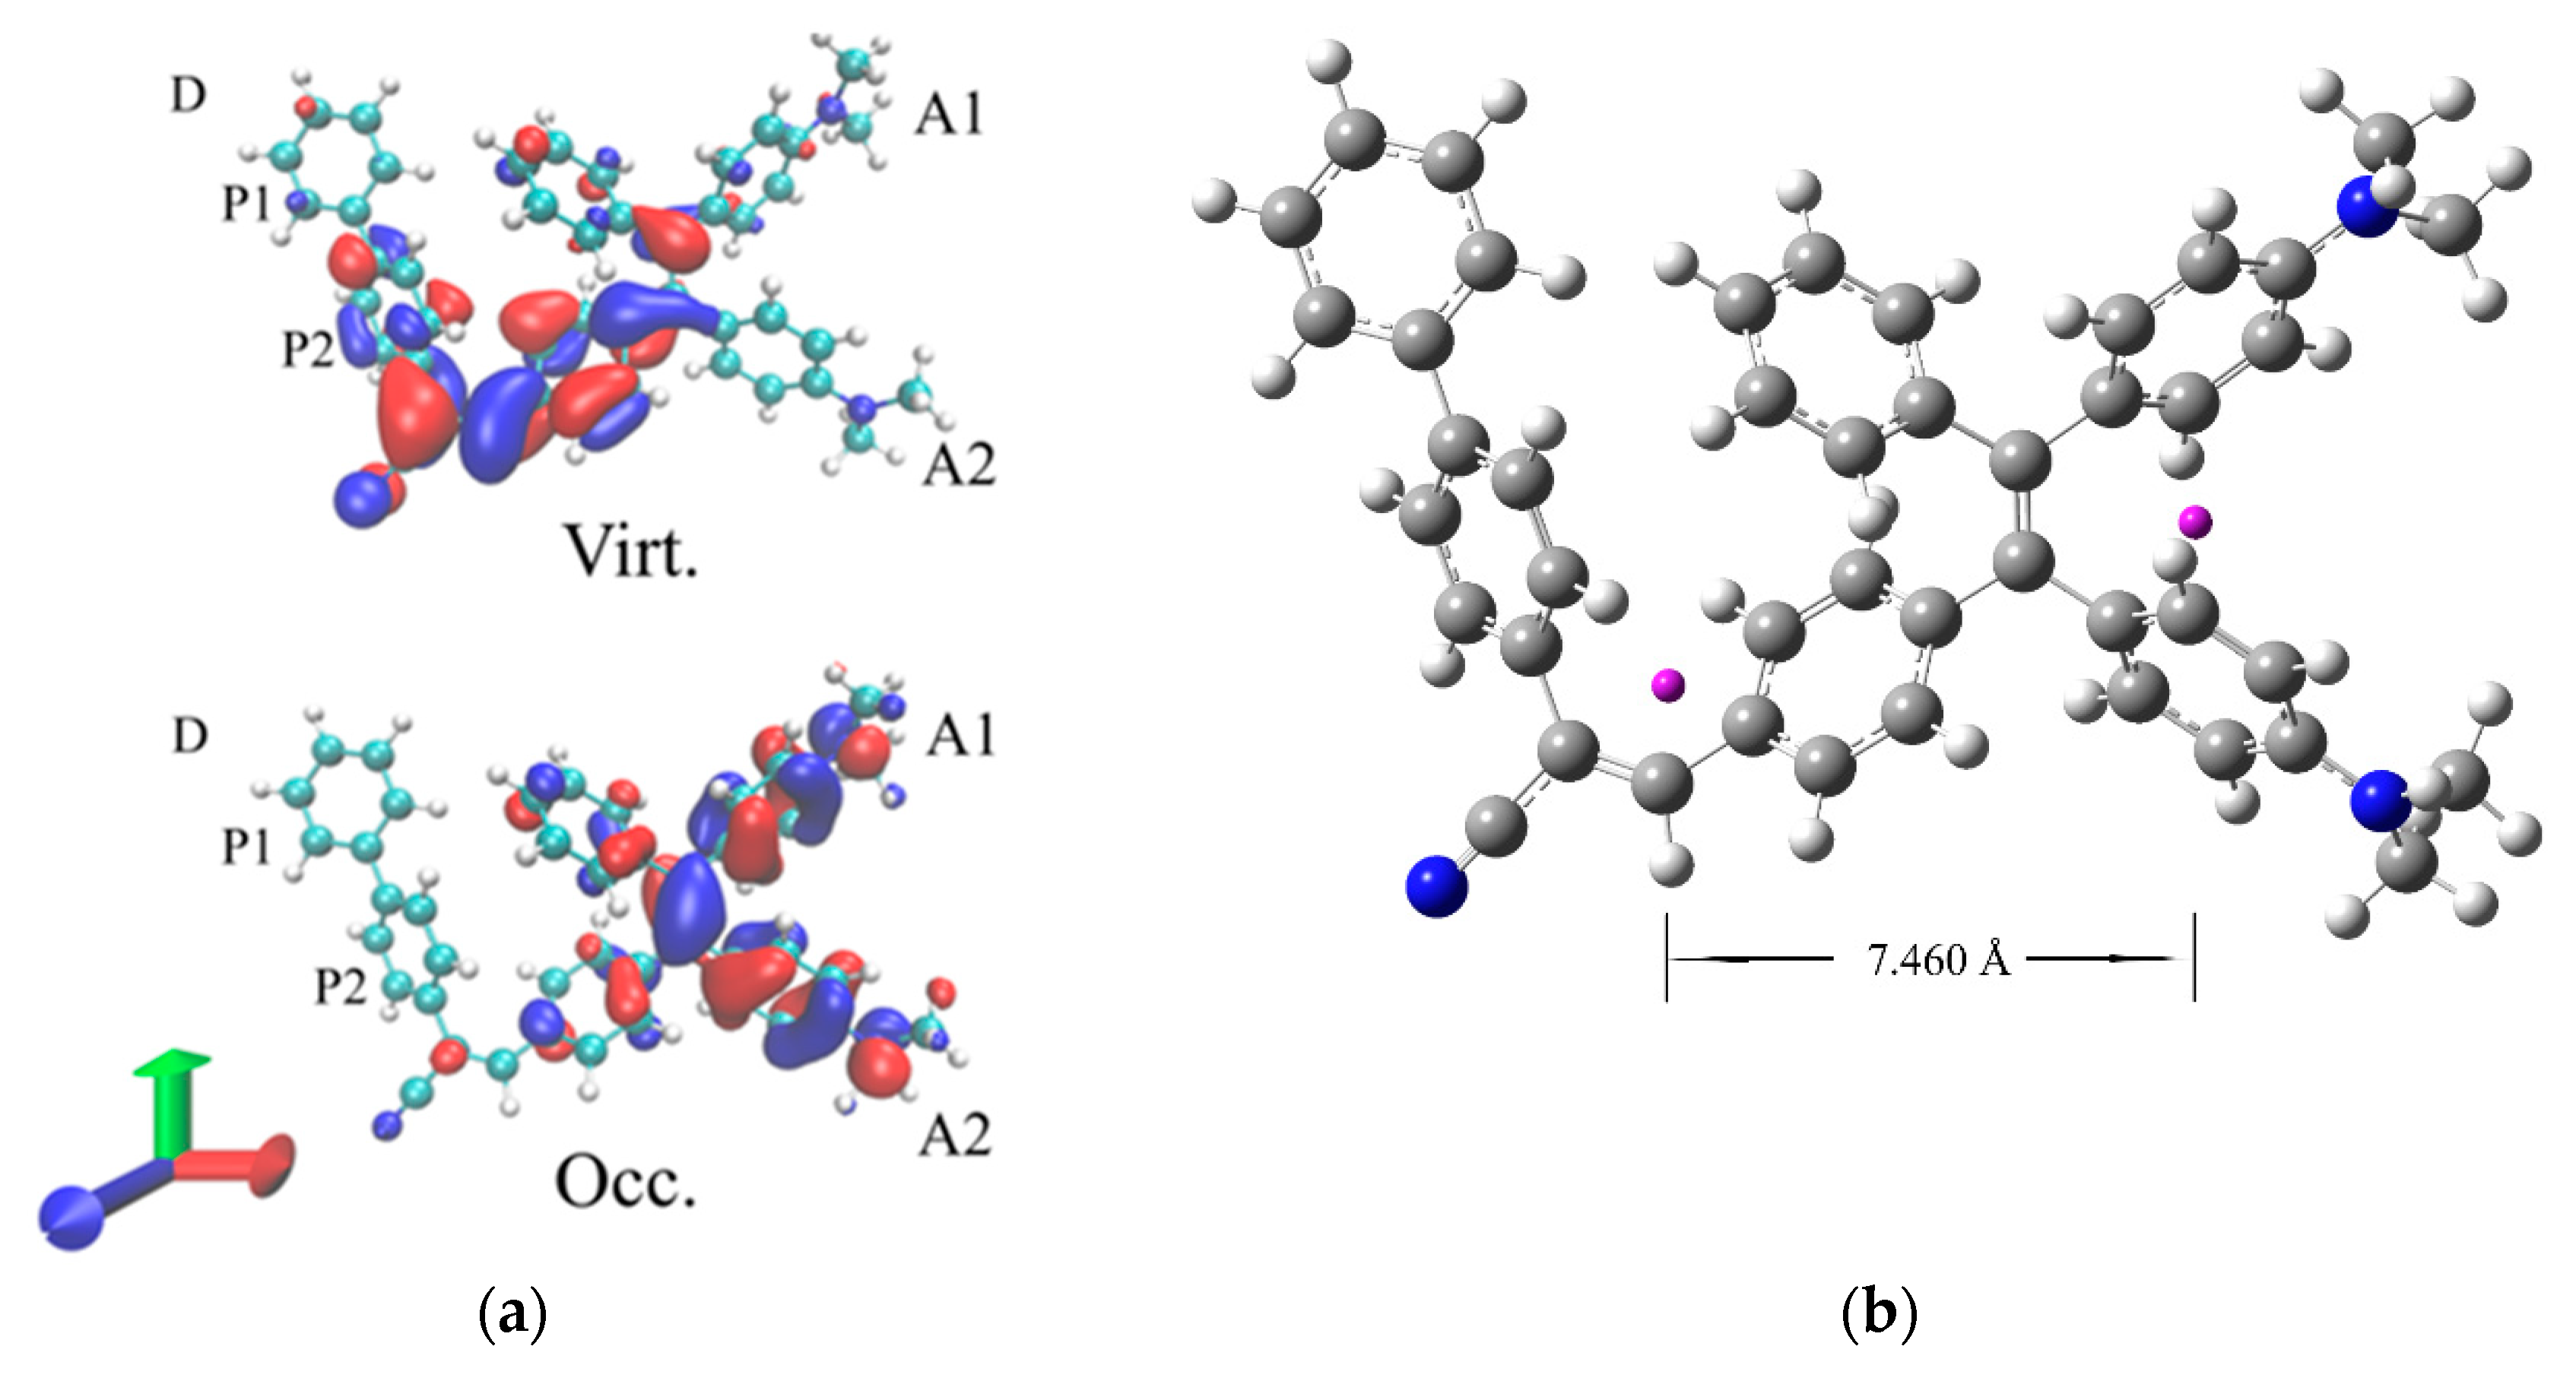
Figure 4.
Superposition of the optimized ground state (S0, gray) and first excited state (S1, cyan) structures computed for TPE-BPAN.
Figure 4.
Superposition of the optimized ground state (S0, gray) and first excited state (S1, cyan) structures computed for TPE-BPAN.
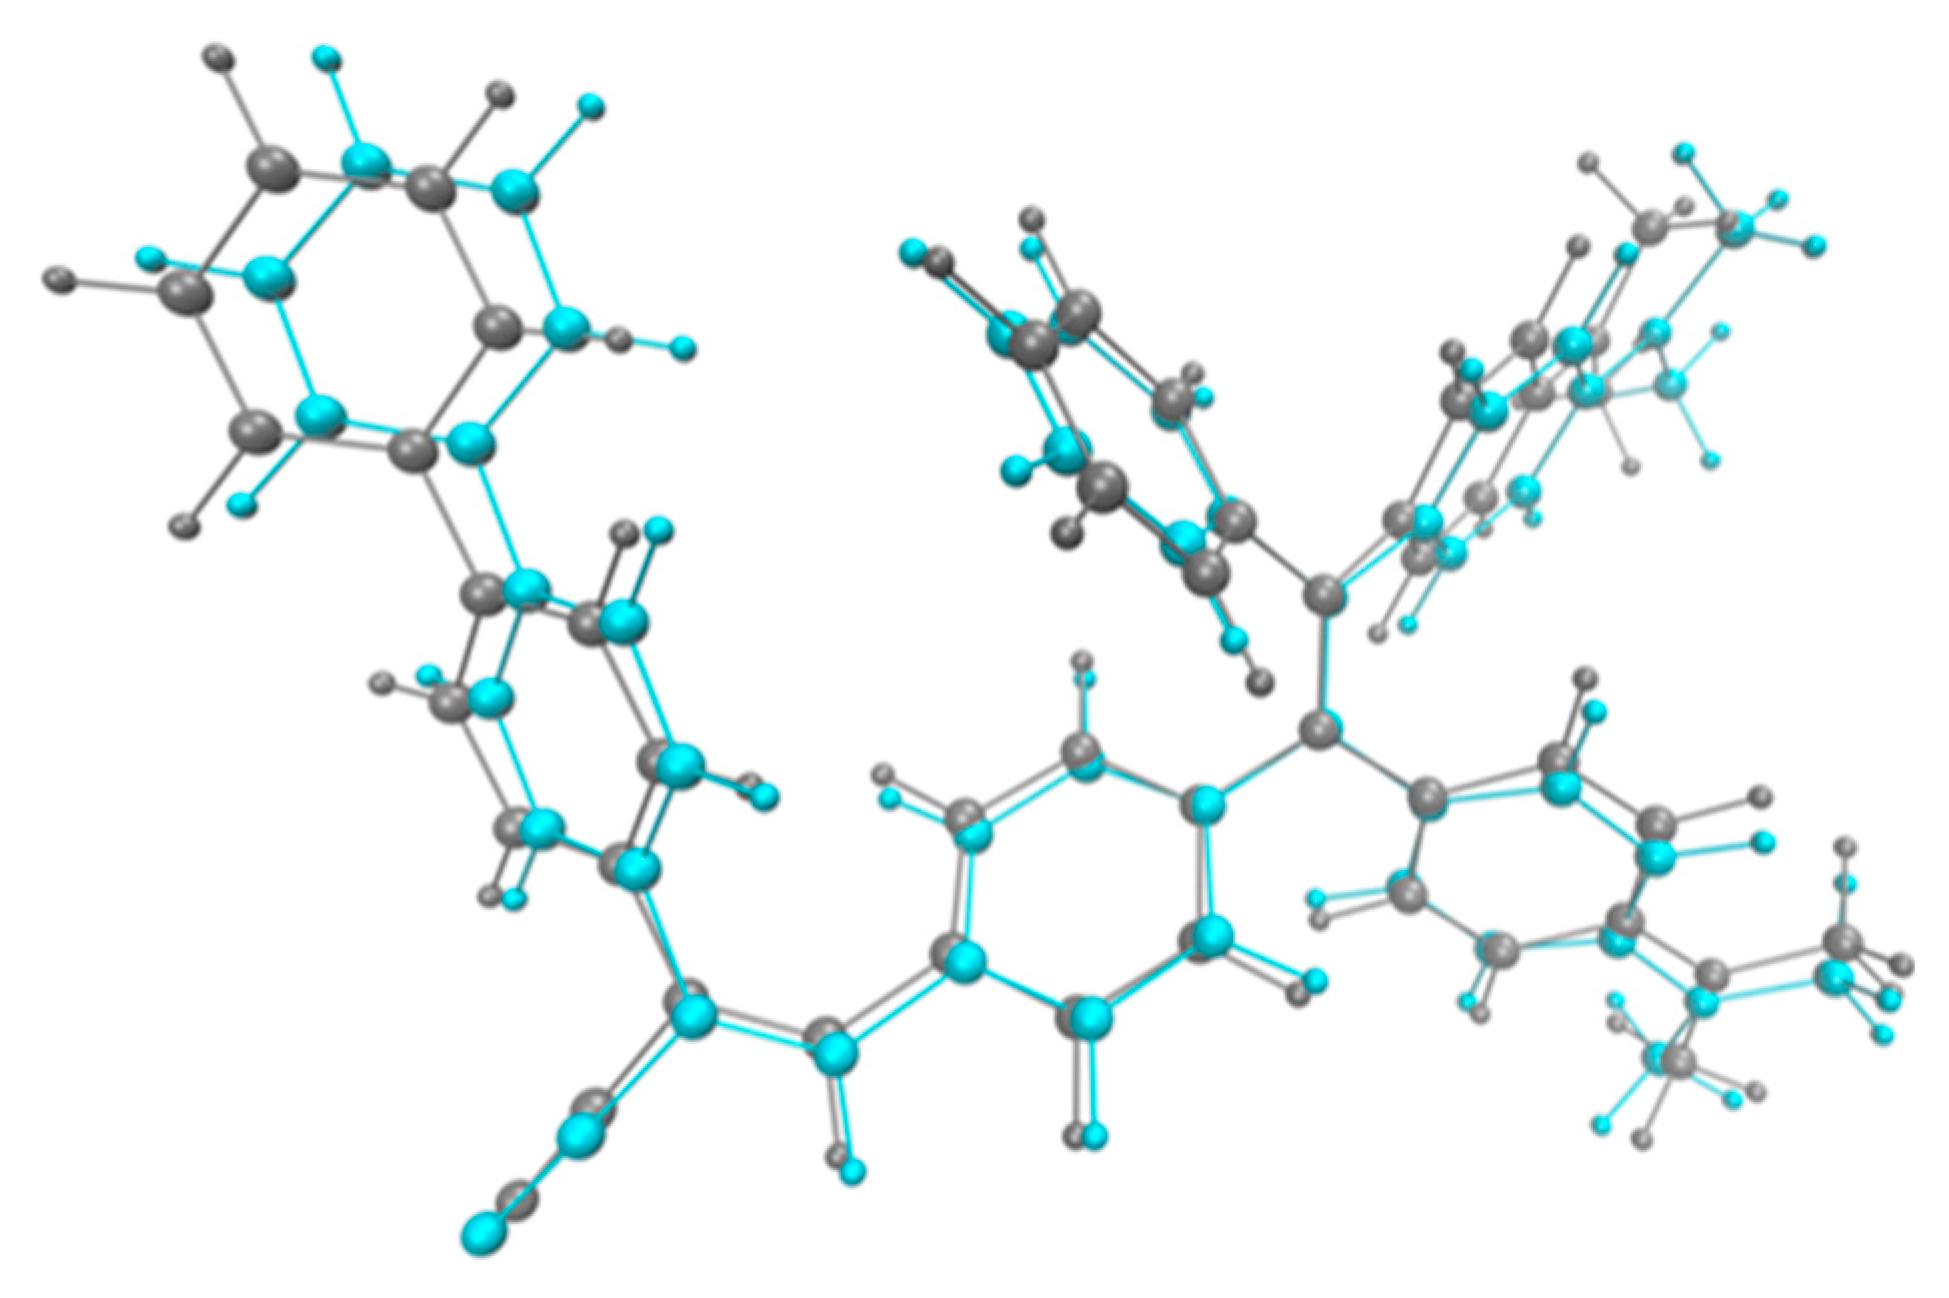
Figure 5.
Schematic representation of the normal modes related to the largest HR factors of TPE-BPAN.
Figure 5.
Schematic representation of the normal modes related to the largest HR factors of TPE-BPAN.
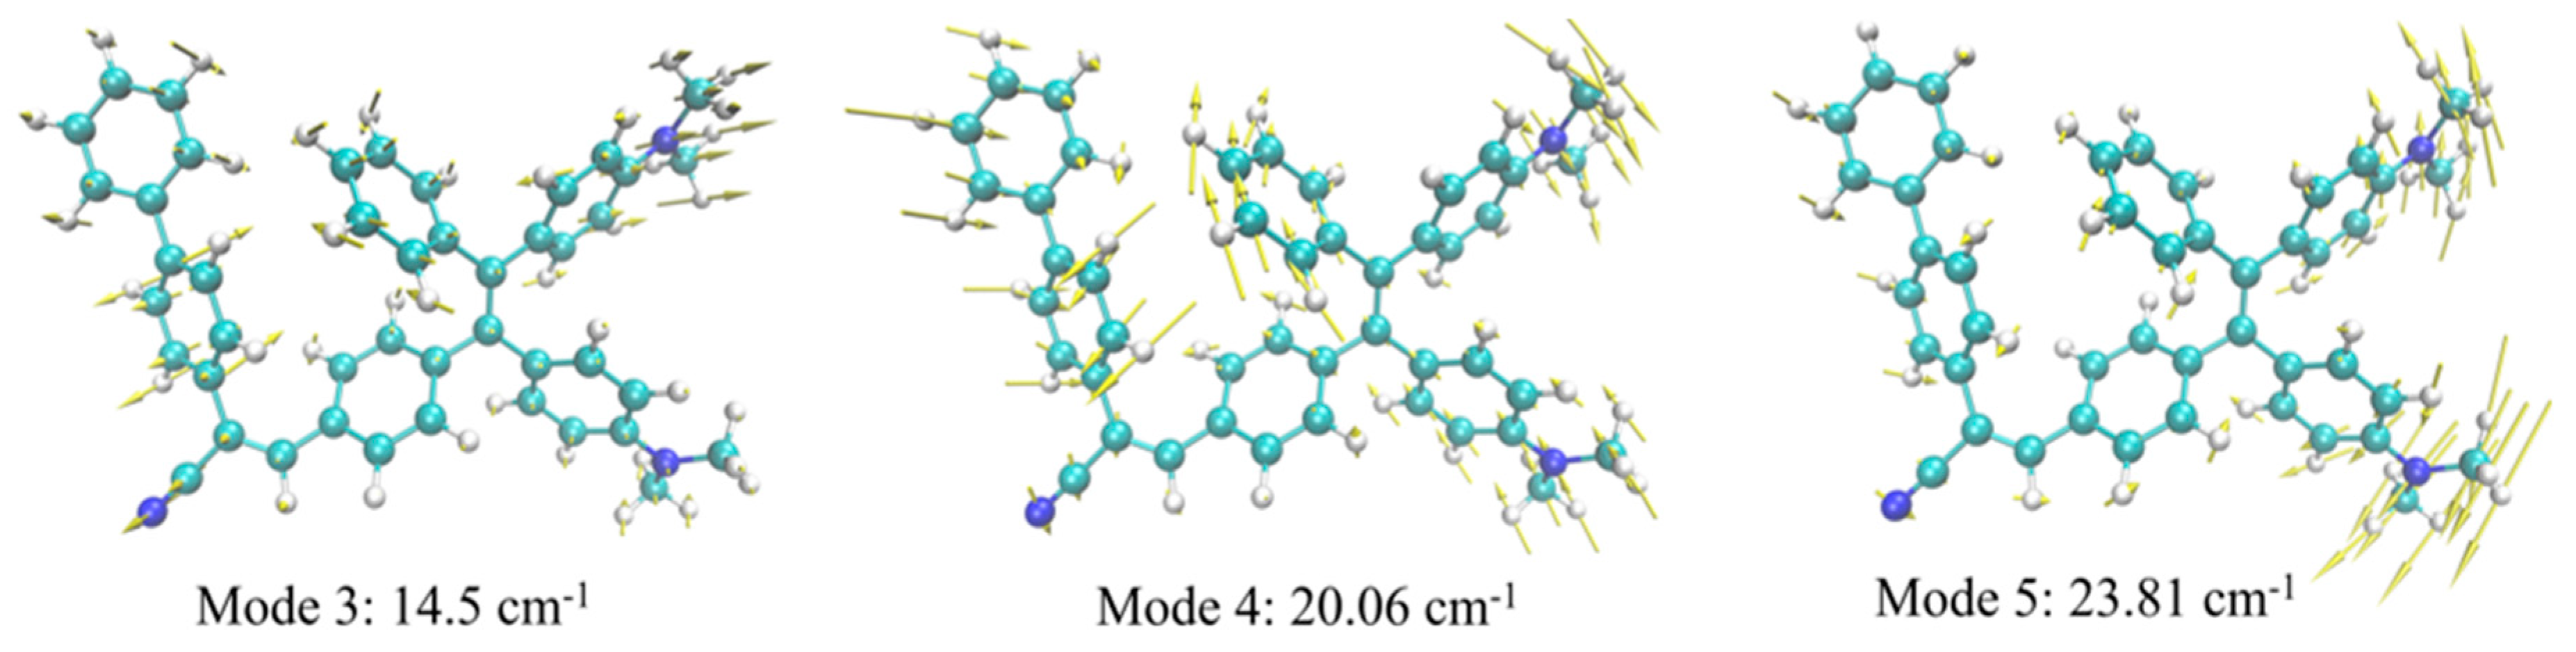

Table 1.
Computed and experimental absorption (Eabs) and emission (Eemi) energies of TPE-BPAN in different environments. Refer to SI for computational details.
Table 1.
Computed and experimental absorption (Eabs) and emission (Eemi) energies of TPE-BPAN in different environments. Refer to SI for computational details.
|
Eabs (eV) |
Eem (eV) |
Emi. Intensity (au) |
Stokes Shift (eV) |
|
| THFcalc | 2.281 | 1.578 | 13677 | 0.71 |
| H2Ocalc | 2.281 | 1.547 | 14413 | 0.734 |
| gas phasecalc | 2.460 | 1.789 | 8675 | 0.671 |
| THFexp. | 2.793 | 2.006 | 6650 | 0.787 |
Table 2.
Computed absorption and emission energies and oscillator strengths of TPE-BPAN polymorphs in comparison with available experimental data and computed data for TPE-BPAN in THF in solution.
Table 2.
Computed absorption and emission energies and oscillator strengths of TPE-BPAN polymorphs in comparison with available experimental data and computed data for TPE-BPAN in THF in solution.
| Eabs (eV) | fabs (a.u.) | Eemi (eV) | femi (a.u.) | ||
|---|---|---|---|---|---|
| PBE0-D3 | Pol_1 | 2.526 | 0.255 | 2.524 | 0.255 |
| Pol_2 | 2.380 | 0.195 | 1.767 | 0.192 | |
| Pol_3 | 2.459 | 0.199 | 1.605 | 0.154 | |
| Exp. 10% THF | - | 2.695 | 1.947 | ||
|
PBE0 |
THF sol |
2.281 | 0.290 | 1.578 |
0.338 |
| Exp THF solution | -- | 2.793 | 2.006 |
Disclaimer/Publisher’s Note: The statements, opinions and data contained in all publications are solely those of the individual author(s) and contributor(s) and not of MDPI and/or the editor(s). MDPI and/or the editor(s) disclaim responsibility for any injury to people or property resulting from any ideas, methods, instructions or products referred to in the content |
© 2023 by the authors. Licensee MDPI, Basel, Switzerland. This article is an open access article distributed under the terms and conditions of the Creative Commons Attribution (CC BY) license (https://creativecommons.org/licenses/by/4.0/).
Copyright: This open access article is published under a Creative Commons CC BY 4.0 license, which permit the free download, distribution, and reuse, provided that the author and preprint are cited in any reuse.


