Preprint
Article

The Diversity of Gut Microbiota at Weaning Is Altered in Prolactin Receptor Null Mice

Submitted:

01 August 2023

Posted:

02 August 2023

You are already at the latest version

A peer-reviewed article of this preprint also exists.

Abstract
Maternal milk supports offspring development by providing microbiota, macronutrients, micronutrients, immune factors, and hormones. The hormone prolactin (PRL) is an important component of milk with protective effects against chronic non-communicable diseases (NCDs). Because maternal milk regulates microbiota composition and microbiota protect against NCDs, we aimed to investigate whether PRL regulates gut microbiota in newborn mice. 16SrRNA sequencing of feces and bioinformatics analysis were performed to evaluate gut microbiota in mice null for the PRL receptor (Prlr-KO) at the onset of weaning (postnatal day 21). The normalized colon and cecal weights were higher and lower, respectively, in Prlr-KO mice relative to wild-type mice (Prlr-WT). Relative abundance (Simpson Evenness Index), phylogenetic diversity, and bacterial concentration in gut contents were lower in the absence of the PRL receptor. Eleven bacteria species, out of 470, differed between Prlr-KO and Prlr-WT mice with two bacterial genera (Anaerotruncus and Lachnospiraceae) related to NCD development being the most common in Prlr-KO. Furthermore, a higher metabolism of terpenoids and polyketides was predicted in Prlr-KO mice compared to Prlr-WT mice; these metabolites have antimicrobial properties and are present in microbe-associated pathogenicity. In summary, the absence of the PRL receptor changes intestinal microbiota composition, resulting in lower microbiota abundance and richness, which could contribute to NCD development.
Keywords: 
Subject: 
Biology and Life Sciences  -   Immunology and Microbiology

1. Introduction

Trillions of microbial cells, located in the intestinal compartment known as the “colonic microbiota”, develop during childhood and adulthood and play important roles in promoting the host´s health [1]. Several factors, such as birth mode (vaginal or cesarean) and feeding method (breast milk or formula), influence the composition of the gut microbiota [2]. Cesarean-born neonates have higher bacterial diversity than those born vaginally but are more prone to developing asthma, allergies, and obesity. This has been attributed, at least in part, to the gradual replacement of the Bacteroides genus, which helps regulate the immune system, by the Firmicutes genus in the first year of life [3]. Moreover, formula-fed children have less bacterial diversity and richness in the first 12-24 months than those fed breast milk, with lower levels of Lactobacillus, Staphylococcus, Megasphaera, and Actinobacteria [3].
Within the main microbial reservoirs that sustain the early neonate’s colonization, maternal milk is considered the second most abundant source after the mother’s areolar skin, contributing 8×10⁵ bacteria daily during lactation, particularly Lactobacillus, Bifidobacterium, Staphylococcus spp., and Streptococcus [4]. Milk components, such as milk oligosaccharides, serve as an energy source for selected bacterial populations, which in turn produce short-chain fatty acids (SCFAs) and other metabolites that act as protectants against pathogens such as Streptococcus pneumoniae or Campylobacter jejuni [5].
However, not only are microbiota and macromolecules in milk delivered from the mother to infants, but so are immune components, including immune cells, regulatory cells, and antibodies [6]; and hormones like prolactin (PRL), a protein that is known for its stimulatory effect on milk secretion and exerts a wide range of metabolic and immune actions [7]. Although PRL levels change depending on sex and physiopathological status, it has been recognized that the maintenance of a metabolically beneficial PRL level (HomeoFIT PRL: 7-100 µg/L) [8] could prevent metabolic diseases development. Whereas too low and too high PRL levels associate with increased prevalence of metabolic diseases [7,8]. During lactation, obesity is associated with reduced PRL action since the obese condition lowers the expression of PRL receptors (PRLRs) in mammary epithelial cells, hindering PRL signaling and causing a reduction in the production of milk components like β−casein and α−lactalbumin, leading to lactation insufficiency and precocious mammary gland involution [9]. Additionally, high-fat diet (HFD) feeding in rats reduces PRL levels in maternal milk, and their pups consuming obesogenic and hypoprolactinemic milk develop exacerbated adiposity, fatty liver, and insulin resistance at weaning, whereas PRL administration to the HFD-fed mothers or directly to the pups ameliorates those metabolic alterations [10]. PRL treatment in HFD-fed lactating rat dams normalized mammary gland function and restored milk yield and PRL levels [10]. Therefore, PRL in maternal milk favors metabolic homeostasis in the offspring, whereas lack of adequate PRL actions derived from an obesogenic environment contribute to the development of metabolic diseases.
Previous studies suggested that communication between the endocrine system and microorganisms regulates the host’s hormonal homeostasis [11]. For instance, germ-free rats have 25% higher PRL levels than gnotobiotic (standard microbiota) animals [12]. Moreover, a 24 h SCFAs treatment can inhibit Prl expression in primary dairy cow anterior pituitary cells (DCAPCs) in vitro [13], supporting the idea that bacterial metabolites can influence endocrine factors. However, there are no reports about the relationship between the absence of PRLR signaling and gut microbiota composition in neonates, particularly during the weaning period, which is a critical time frame for producing microbial adaptations that shape the neonates’ health and prevent the development of chronic conditions [14]. Altered microbiota has been implicated in several metabolic diseases such as cardiovascular diseases, obesity, and type 2 diabetes [15], and microbiota transplantation has been shown to reverse obesity, type 2 diabetes, or being used in the treatment of persistent and severe infections due to C. difficile [16].
Since maternal milk is a key regulator of gut microbiota composition, and microbiota protects against the development of metabolic diseases, in this work, we investigated whether PRL/PRL receptor signaling regulates gut microbiota composition in newborn mice at the end of lactation. Our hypothesis was that the absence of PRLR induces changes in gut microbiota diversity and composition, promoting a microbial profile potentially linked to an increased risk of developing metabolic diseases.

2. Materials and Methods

2.1. Animal husbandry, care, and macroscopic measurements

All animals were housed under standard laboratory conditions (12/12 h light-dark cycle, 20 ºC, and 40-50% relative humidity). The animals were cared for following the guidelines of the National Institutes of Health’s Guide for the Care and Use of Laboratory Animals. The experiments conducted were approved by the Bioethics Committee of the Institute of Neurobiology of the National Autonomous University of Mexico (ID: 075). All mice were fed a standard diet with pellets from Rodent Lab Chow 5001 (Purina, St. Louis, MO, USA).
Male and female C57BL/6J Prlr +/- mice from The Jackson Laboratory were bred and maintained for several generations in the Vivarium of the Institute of Neurobiology of the National Autonomous University of Mexico (UNAM). After birth, litter sizes were adjusted to 6-8 animals, and male and female Prlr +/+ or Prlr -/- pups (n: 15 pups/group) were maintained for 21 days until the lactation period ended. The pups were then anesthetized by CO2 inhalation and euthanized by decapitation. The pups’ body weight was measured every two days starting from the fifth day of birth. The pups’ colon was excised and weighed.

2.2. Fecal and cecal DNA extraction and quality control

Before conducting the extractions, to avoid contamination, the 21-day old pups were placed in cages containing clean sawdust previously irradiated with UV for 15 min in a standard biosafety level 1 cabinet. Surfaces were cleaned with 70% ethanol. The fecal and cecal contents (200-300 mg) were extracted from the euthanized pups (n=3/tube) and stored in DNA/RNA shield collection tubes (R1101, Zymo Research Corp., Irvine, CA, USA) at -80 ºC. Genomic DNA was extracted using the ZymoBIOMICS DNA Miniprep kit (D4300, Zymo Research Corp.) following the manufacturer’s instructions. Once extracted, the DNA samples were quantified in a NanoDrop 1000 Spectrophotometer (Thermo Fisher, Waltham, MA, USA), and electrophoretic running was conducted in a 1.5% agarose gel for 30 min for 1:10 diluted samples to verify DNA integrity.

2.3. Library preparation, 16S rRNA sequencing, and diversity index analyses

A total of five samples per group (each sample being a pool of DNA from three mice) were diluted in sterile water with a concentration of 20 µg/µL. Samples were then processed and analyzed by ZymoBIOMICS’ Targeted Metagenomics Sequencing (Zymo Research) service. The DNA samples were prepared for sequencing with the Quick-16S™ NGS Library Pep Kit (Zymo Research) and the V3-V4 Primer Set. The sequencing library was prepared through real-time PCR reactions to quantify pooled qPCR readings based on equal molarity. The library was then cleaned up with the Select-a-Size DNA Clean & Concentrator™ (Zymo Research) and quantified with TapeStation® (Agilent Technologies, Santa Clara, CA, USA) and Qubit® (Thermo Fisher). The ZymoBIOMICS® Microbial Community Standard (Zymo Research) was used as a positive control for each targeted library preparation. The final library was sequenced on Illumina® MiSeq™ with a V3 reagent kit (600 cycles) and a 10% PhiX spike-in. The unique amplicon sequences were identified from the raw reads, and the chimeric sequences were removed using the DADA2 pipeline [17]. The taxonomy assignment was performed using Uclust from Qiime v. 1.9.1, following the Zymo Research 16S database. Composition visualization, α-diversity, and β-diversity analyses were also performed in Qiime v. 1.9.1 [18]. A quantitative real-time PCR was set up to quantify the absolute abundance, with a standard curve made with plasmid DNA containing one copy of the 16S gene in 10-fold serial dilutions. The same primers used in the Targeted Library Preparation were used. The number of genome copies per DNA sample was calculated by dividing the gene copy number by an assumed number of gene copies per genome. The amount of DNA per microliter of sample was calculated using an assumed genome size of 4.64×10⁶ bp, the genome size of Escherichia coli. A two-dimensional Principal Coordinate Analysis (PCoA) was conducted for the visual hierarchical clustering and community ordination using the web-based tool MicrobiomeAnalyst [19]. For the Phylogenetic Investigation of Communities by Reconstruction of Unobserved States (PICRUSt) to predict metabolic pathways [20], the whole genomes of the annotated species were searched using the Kyoto Encyclopedia of Genes and Genomes (KEGG) genome database (https://www.genome.jp/kegg/ko.html) and MicrobiomeAnalyst.

2.4. Statistical analysis

Except for the microbiota composition, where data is presented as the media ± SD of five values (each representing three animals), all other data are presented as the media ± SD of 15 mice/group. After assessing the normality of data using normal distribution, normal quantile plots, and the Shapiro-Wilk’s test, an Analysis of Variance (ANOVA) followed by a post-hoc Kruskal-Wallis multiple test were conducted to assess differences, with a cut-off p-value < 0.05 or 0.01. GraphPad Prism v. 8.2 (Dotmatics, Boston, MA, USA) and MicrobiomeAnalyst were used to plot data, and JMP v. 16.0 (SAS, Cary, NC, USA) was used to perform the statistical analysis.

3. Results

3.1. Body weight and macroscopic measurements

Macroscopic characteristics of wild-type (Prlr +/+, Prlr-WT) and knockout (Prlr -/-, Prlr-KO) mice showed no differences in body weight evolution (Figure 1A) during lactation. However, KO mice displayed a higher normalized colon weight (p<0.01) (Figure 1B) and a reduced cecal weight (p<0.05) (Figure 1C) compared to WT mice.

3.2. General microbial diversity analysis from weaned Prlr-WT and Prlr-KO mice

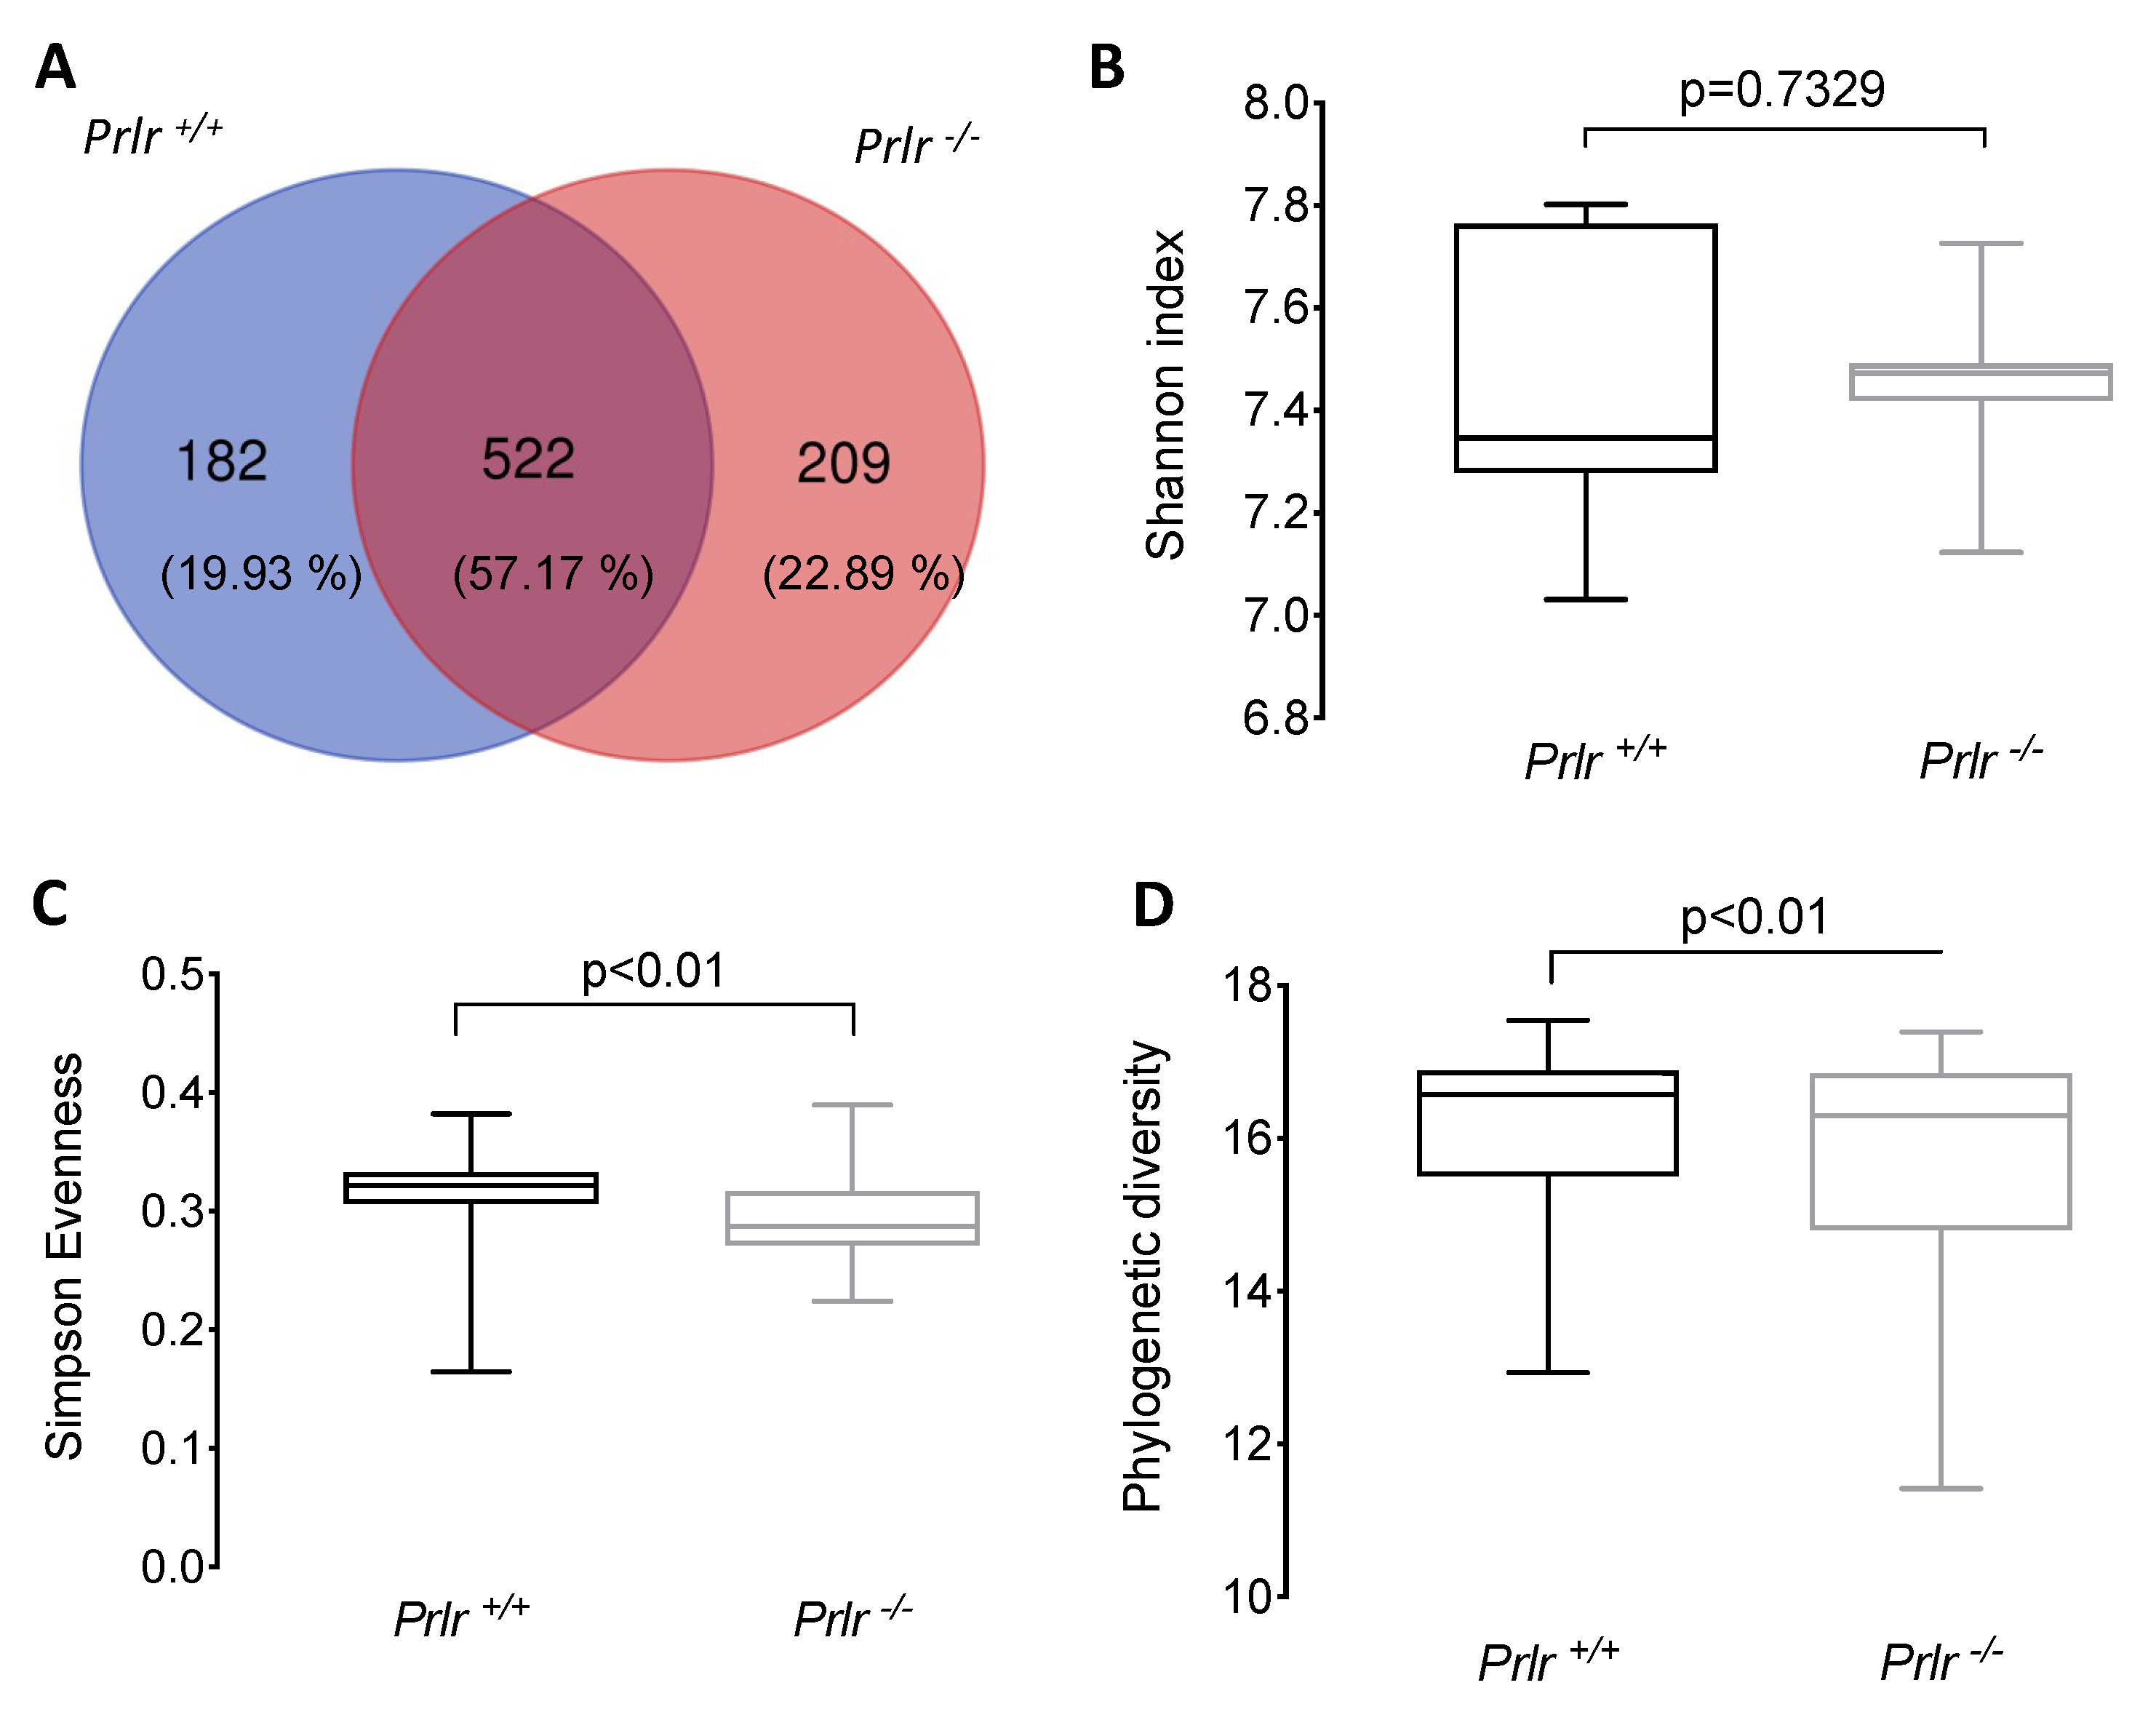
The α-diversity of the bacterial composition showed that both mouse genotypes shared 522 amplicon sequence variants (ASVs) (Figure 2), but Prlr-KO pups displayed a higher number of unshared ASV (+2.96%) than Prlr-WT animals (Figure 2A). Although no differences were found for the Shannon index (Figure 2B), Prlr +/+ pups exhibited a higher (p<0.01) Simpson Evenness (Figure 2C) and phylogenetic diversity (Figure 2D) than Prlr -/- pups. The Shannon index is a quantitative indicator of the number of different bacteria in the samples, indicating that higher Shannon indexes equal increased community diversity [21]. On the other hand, the Simpson Evenness index indicates the probability that individuals will belong to the same species, and a high Simpson Evenness value indicates a less diverse bacterial community [21,22].
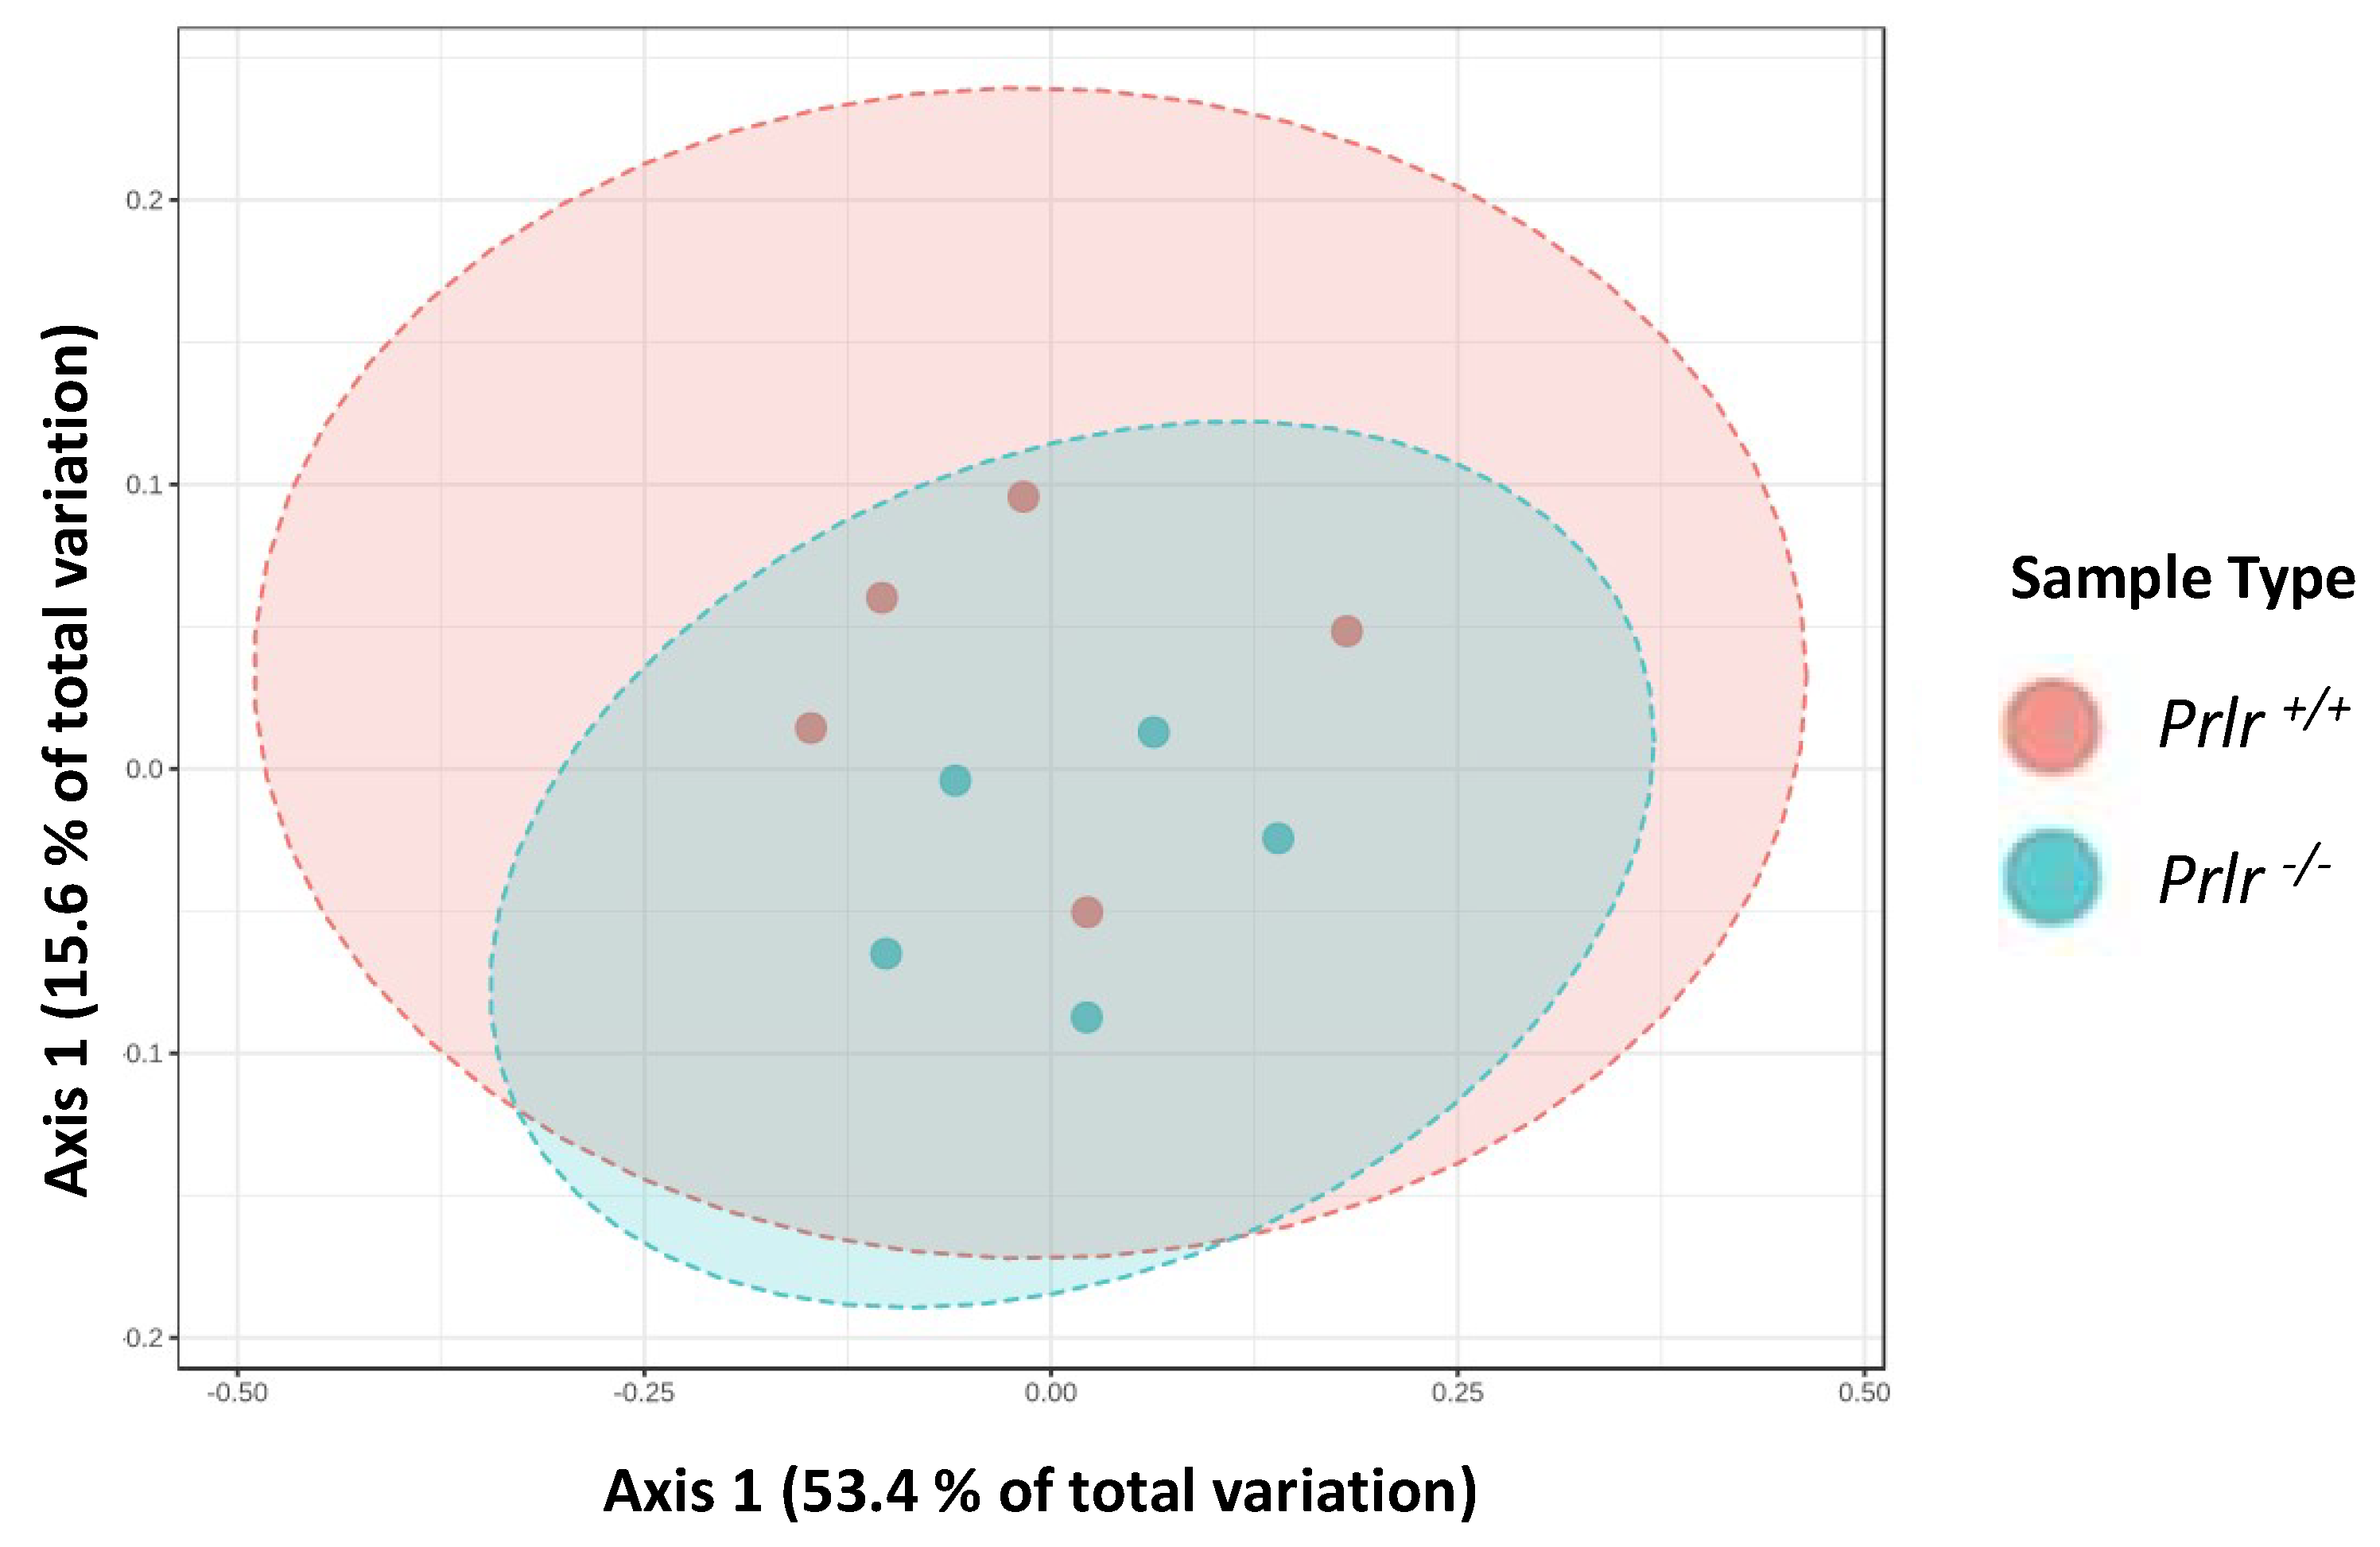
Although there were no differences in the genotype clustering for the β-diversity (Figure 3) using a Permutational Analysis of Variance (PERMANOVA), two differentiated clusters were shown for each genotype, where Prlr-KO mice variation was contained within Prlr-WT.

3.3. Taxonomical bacterial composition

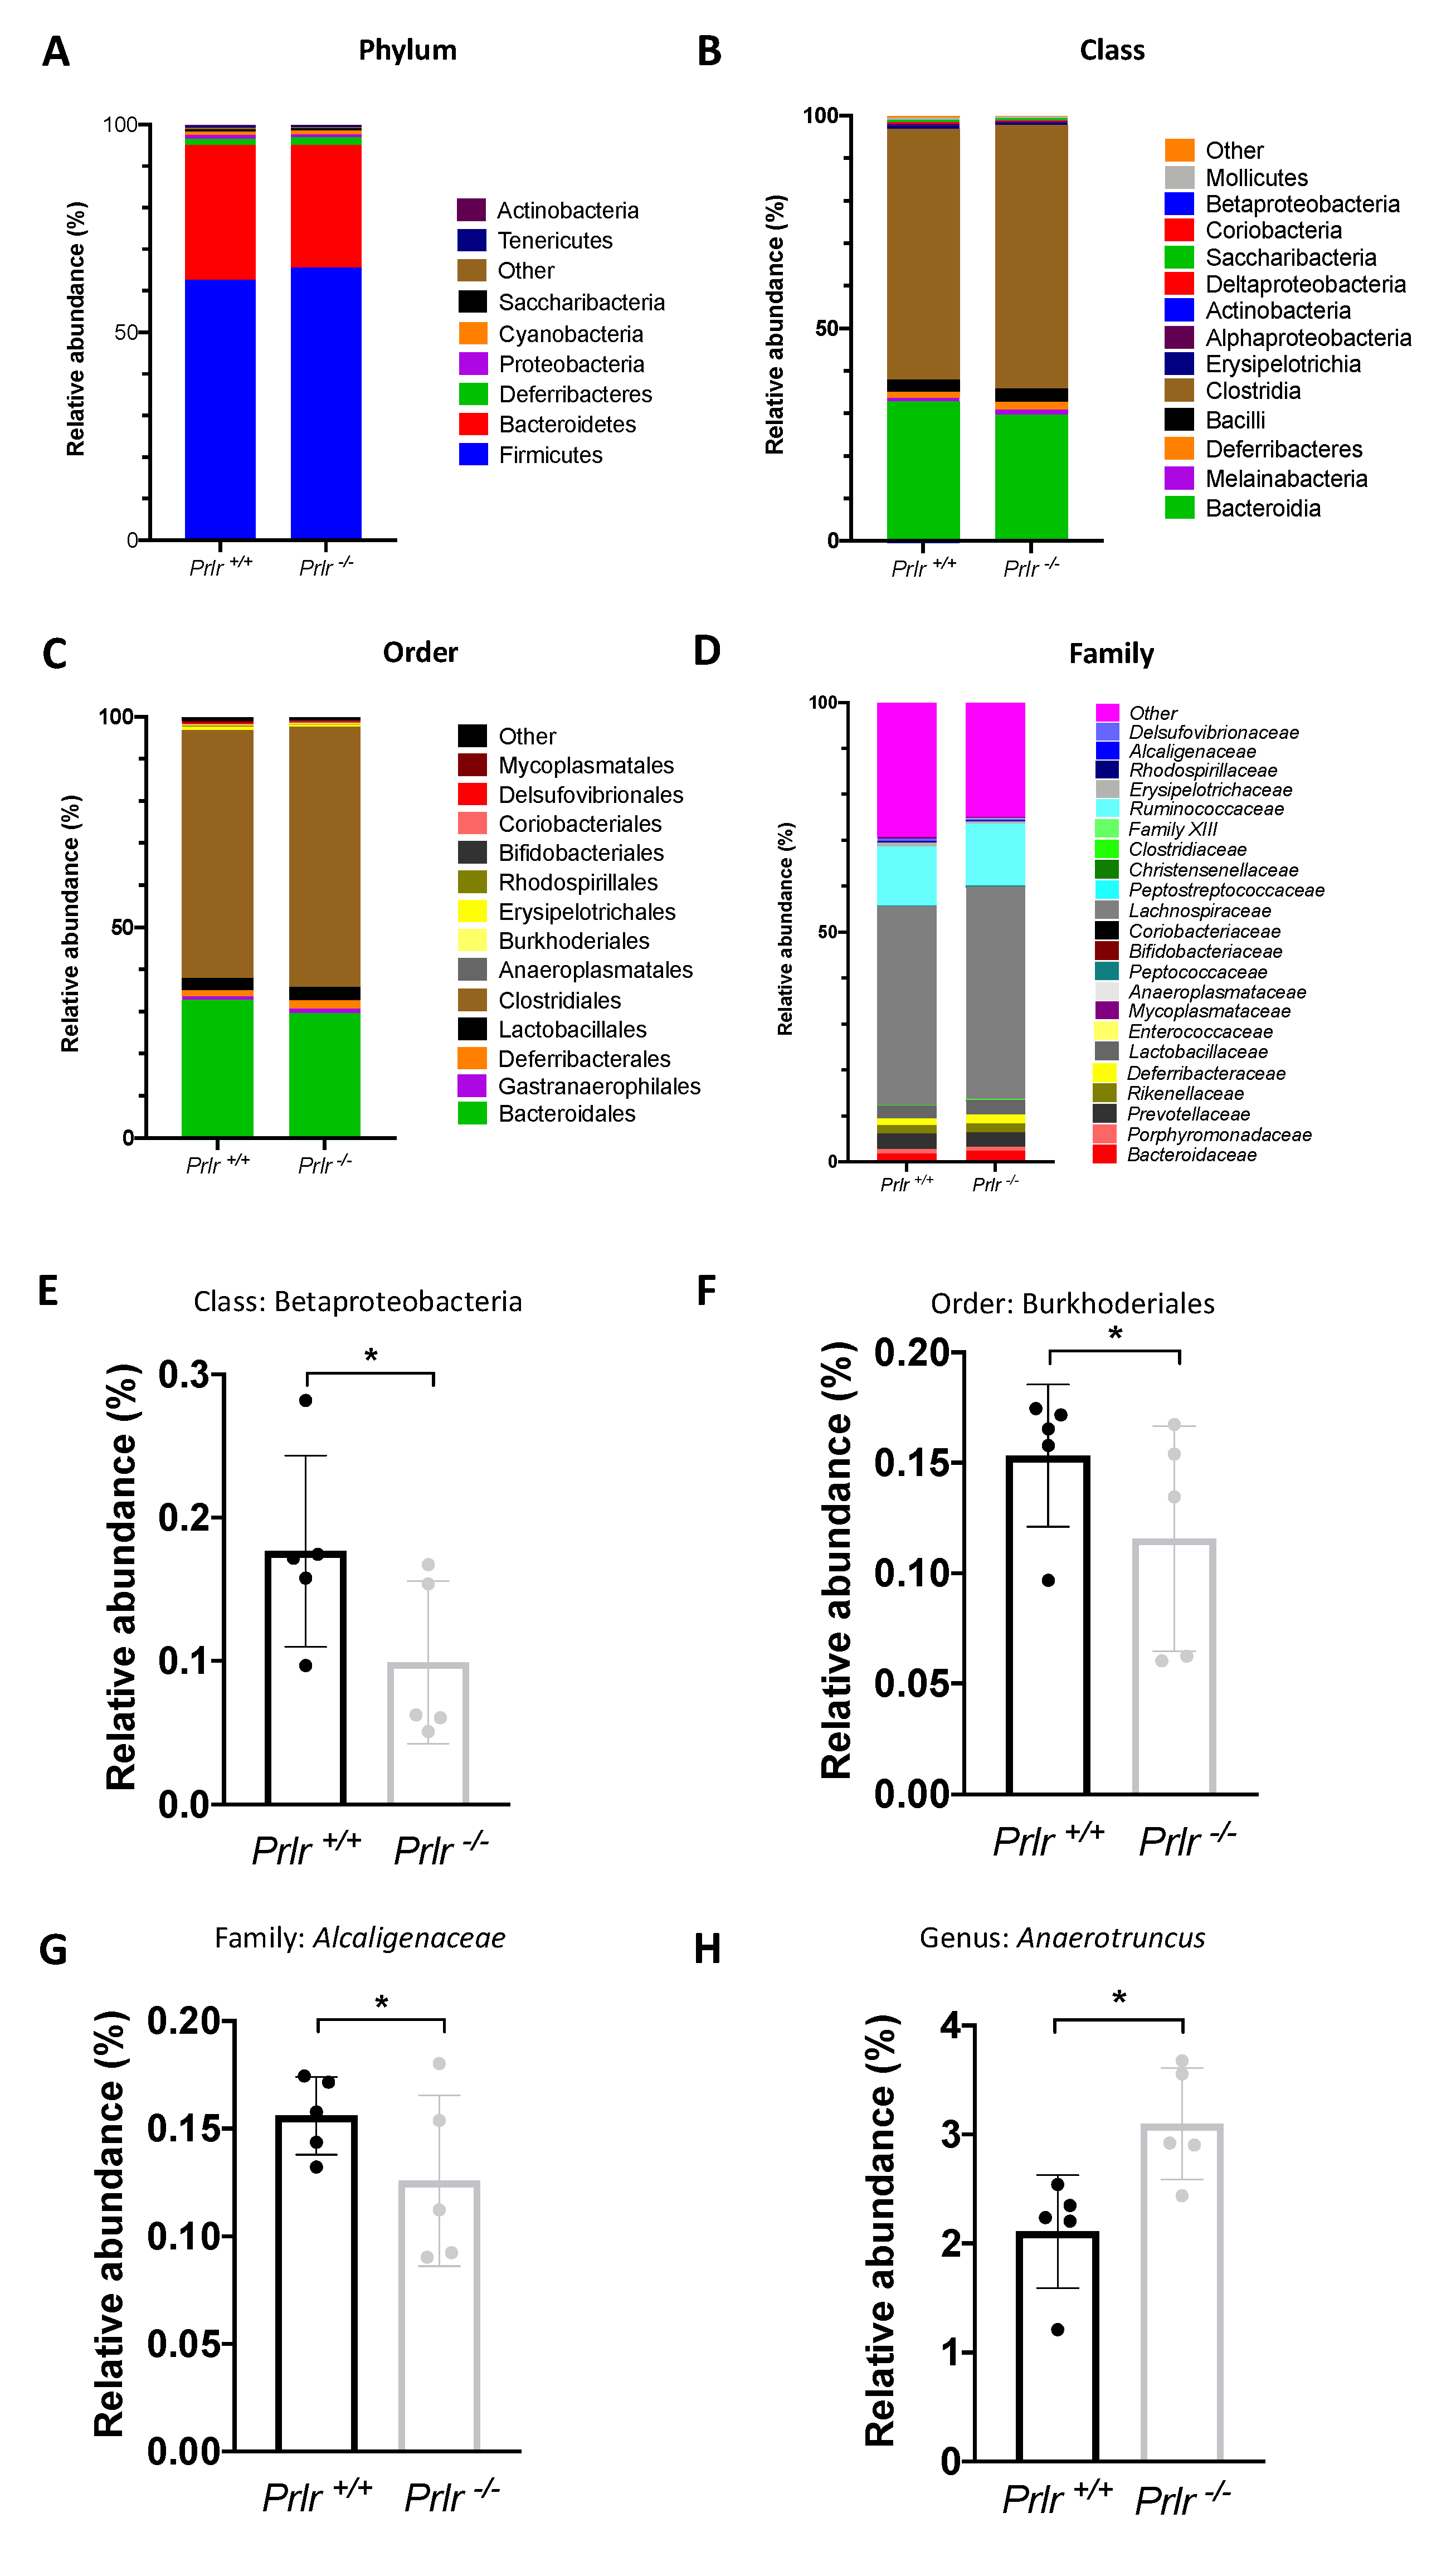
Next, we evaluated the relative abundance of phylum (Figure 4A), Class (Figure 4B), Order (Figure 4C), and Family (Figure 4D) distribution between the pups’ genotypes. Only the Betaproteobacteria class (Figure 4E), Burkhoderiales order (Figure 4F), Alcaligenaceae family (Figure 4G), and Anaerotruncus genus (Figure 4H) were different between genotypes (p<0.05). Overall, 9 phyla, 14 classes, 14 orders, and 23 families were found.
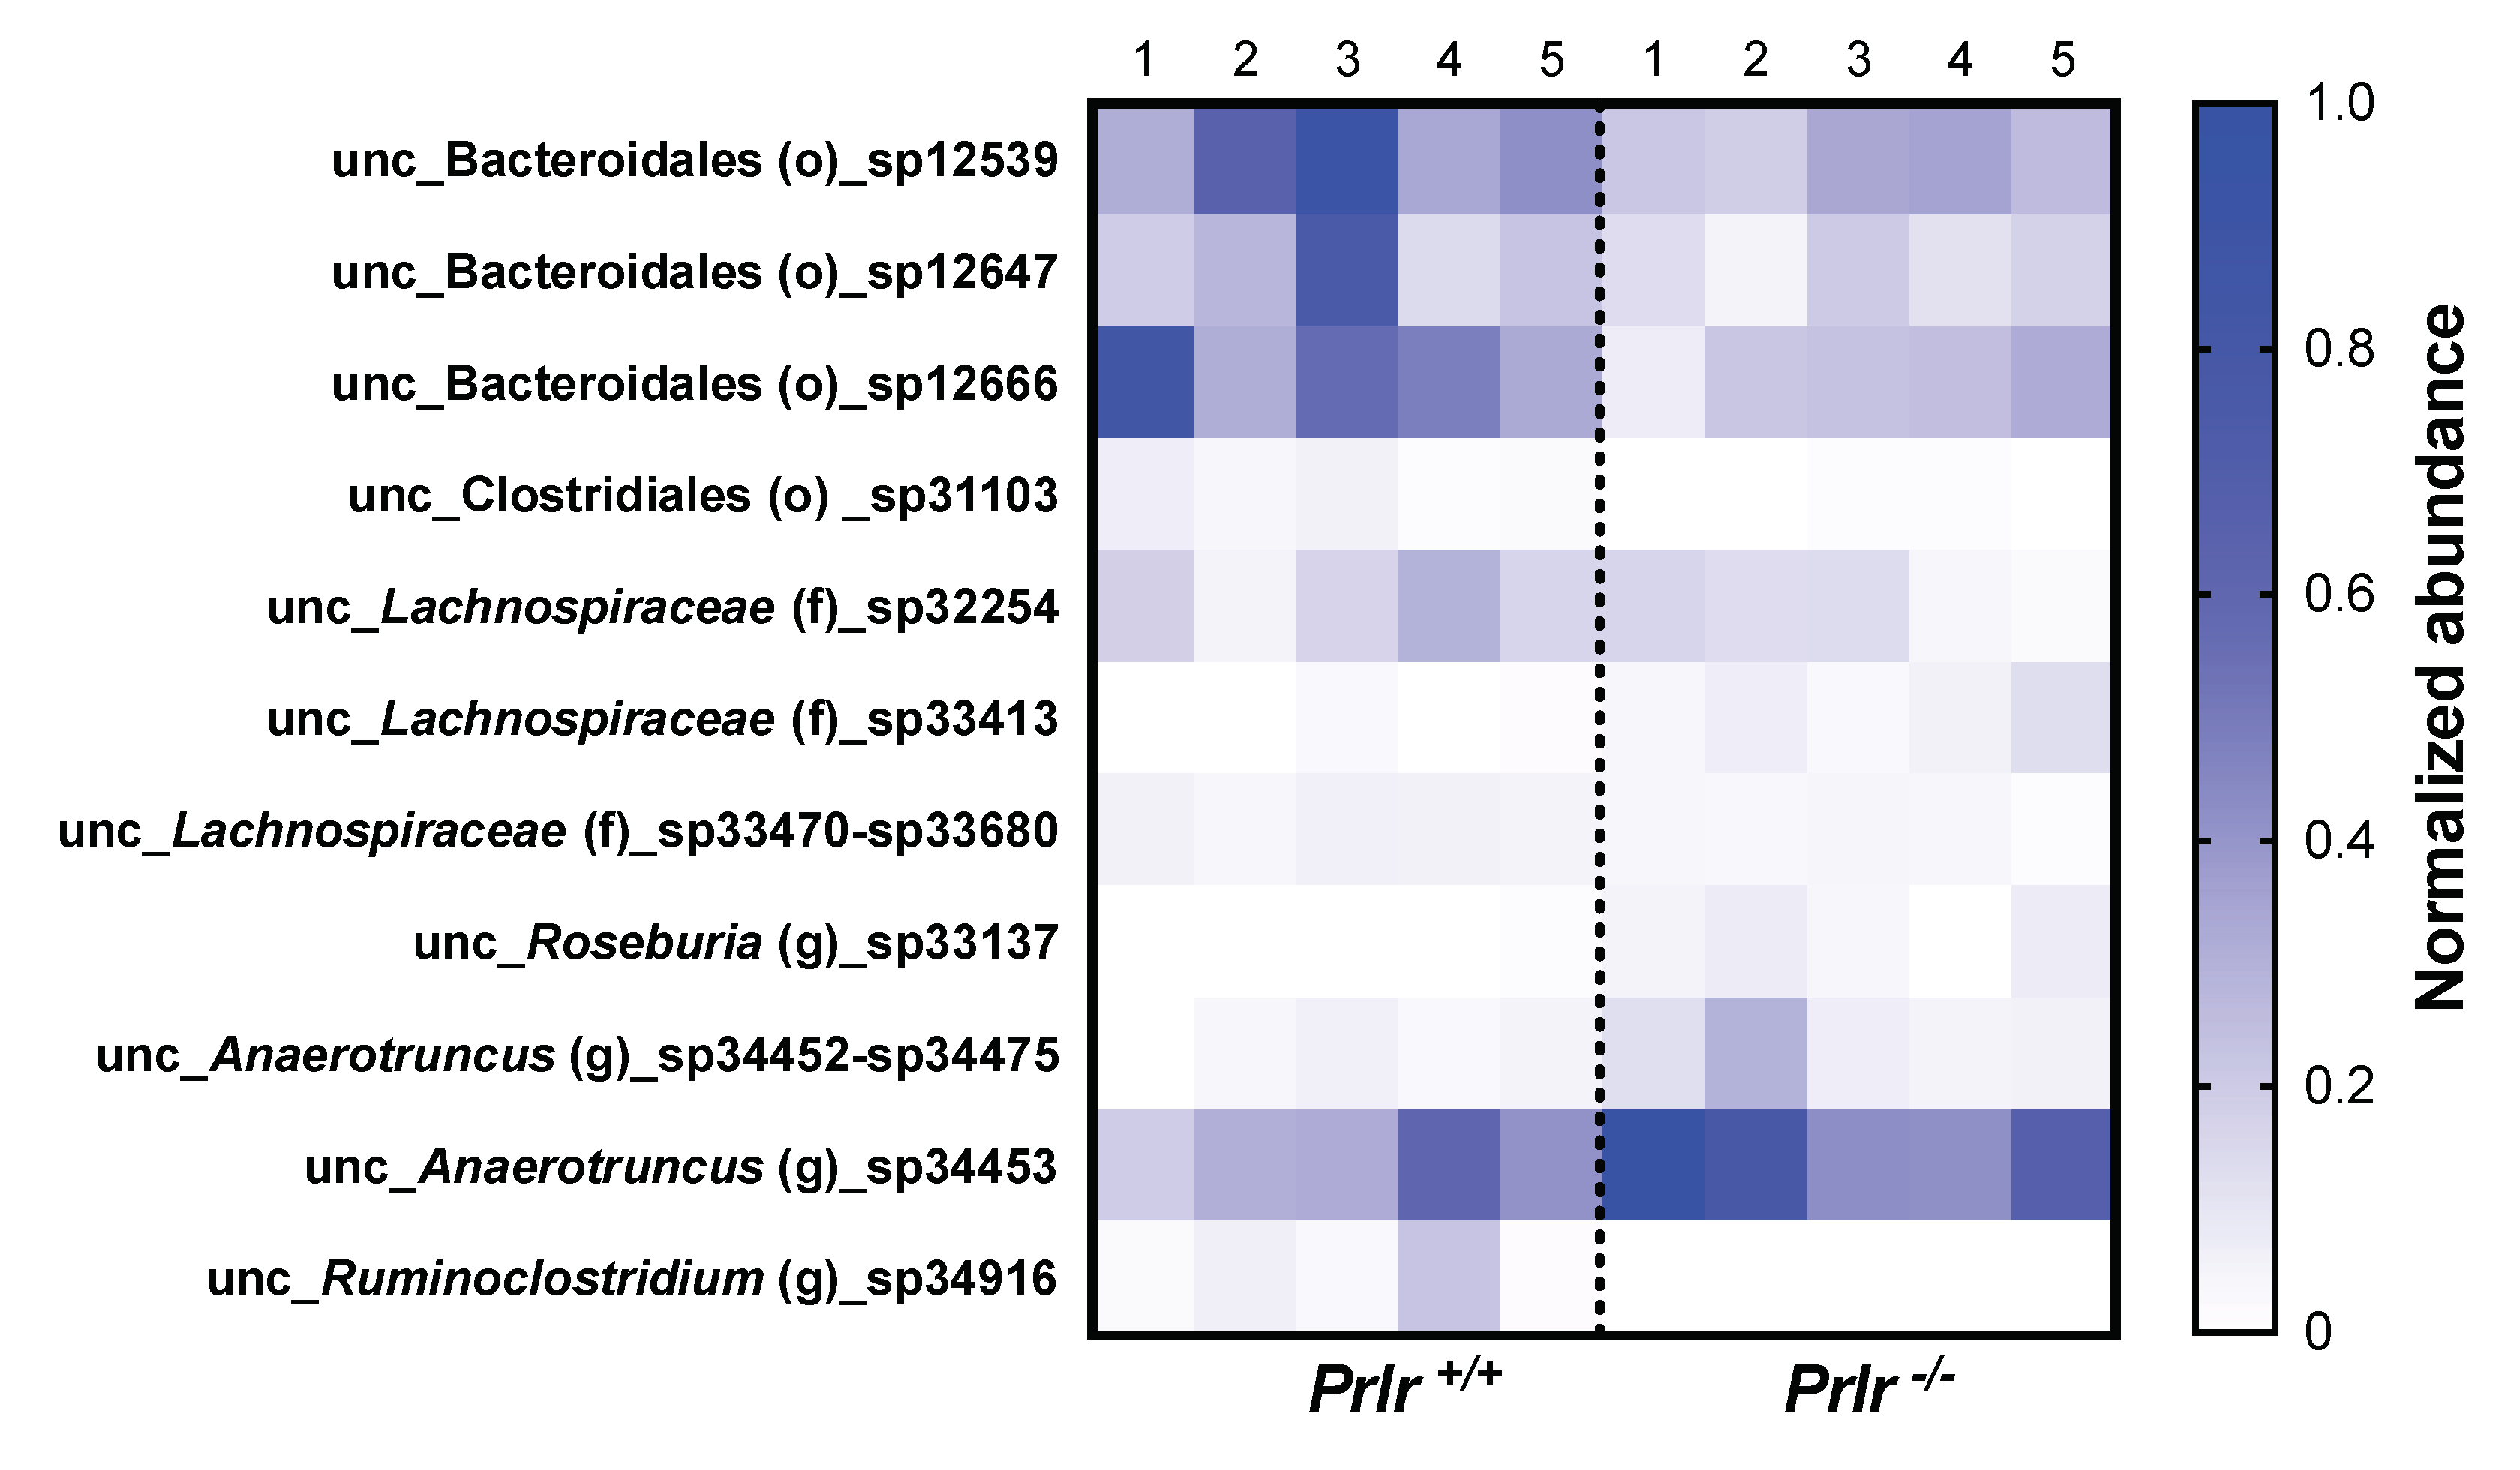
Out of 469 species, 11 species were different between genotypes (Figure 5). Although the identified species were unclassified according to the taxonomic database used, their known orders, families, or genus were placed accordingly. Prlr +/+ pups had greater abundance of species coming from the Bacteroidales and Clostridiales orders and the Anaerotruncus and Ruminoclostridium genera. On the other hand, Prlr -/- pups had the lowest abundance of species from the Lachnospiraceae family and the Roseburia genus.

3.4. PICRUSt metabolic prediction

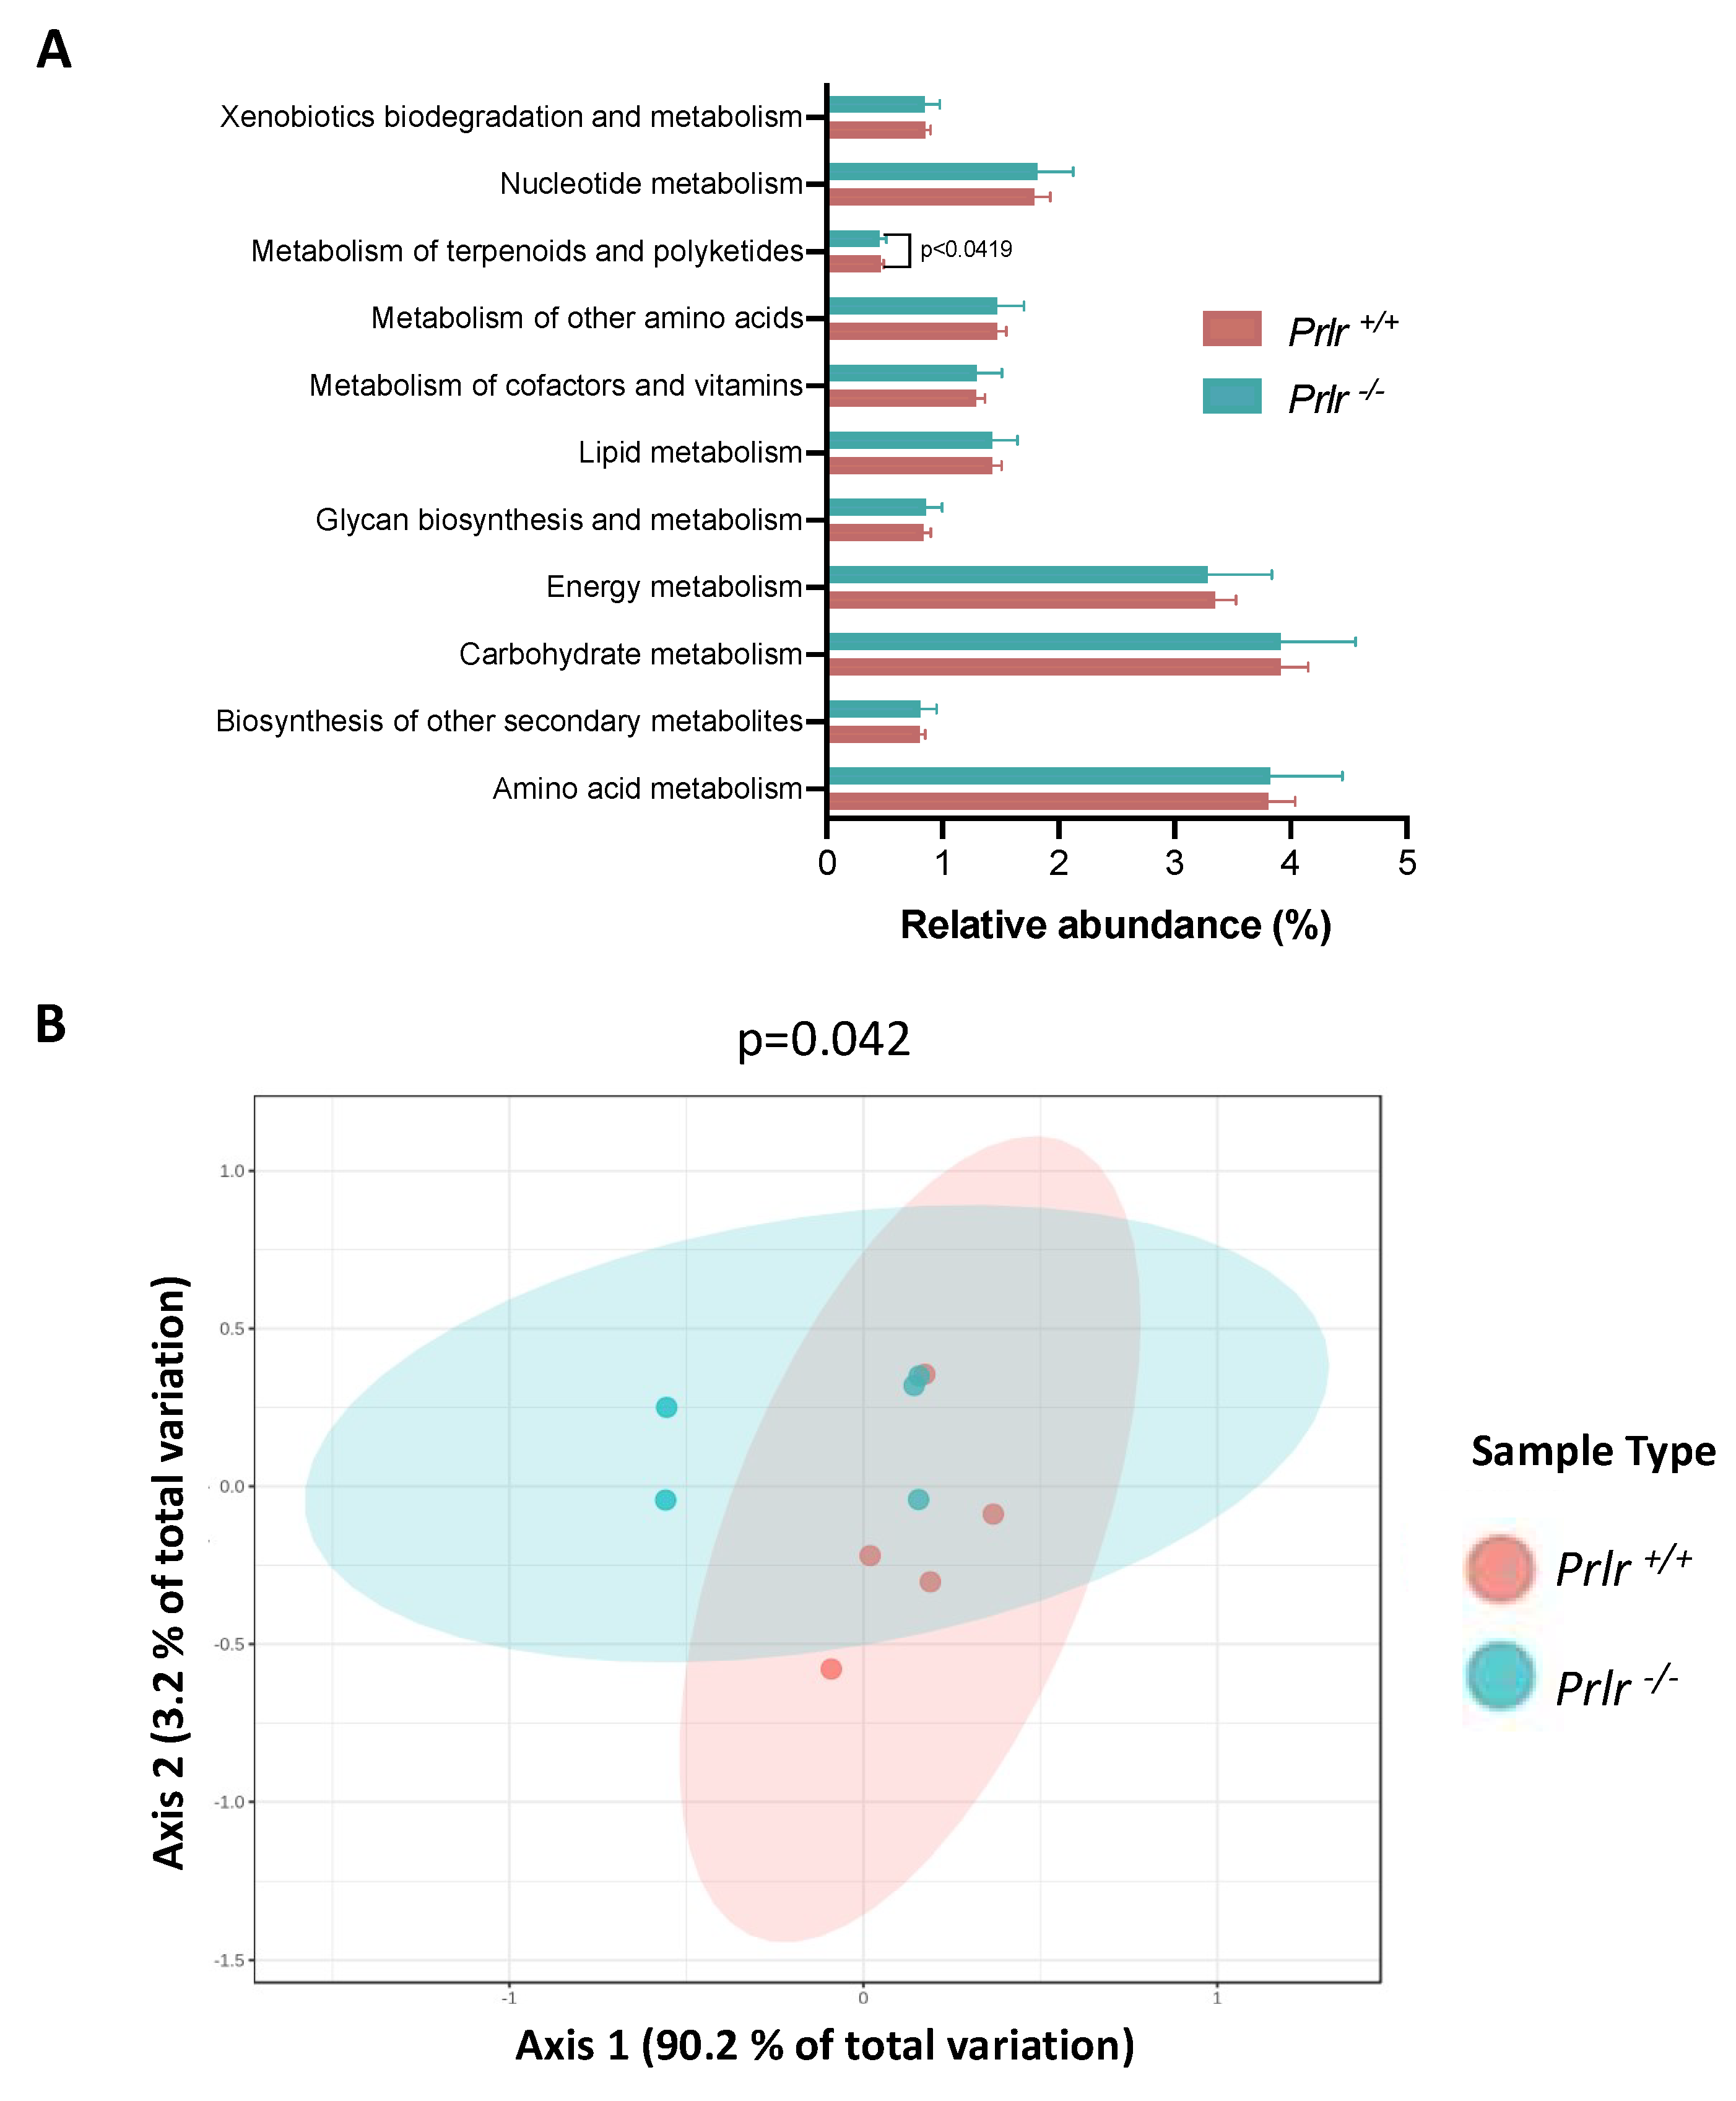
A PICRUSt metabolic prediction was performed based on the species classification obtained from the pups’ genotypes (Figure 6). The prediction highlighted 11 probable metabolic pathways, but only the metabolism of terpenoids and polyketides was found to be different (p<0.05) (Figure 6A). A PCoA analysis showed differences in the overall metabolic performance of the genotypes (p<0.05), with Prlr +/+ samples being more like each other compared to Prlr -/- samples.

4. Discussion

This research was intended to assess the impact of the absence of PRL/PRL receptor signaling in gut microbiota development on mice at weaning. The evaluation was conducted in a well-established PRLR knockout mouse model, originally created through gene targeting in 129svj [23] and later on C57BL/6 mice, where a 1.5 kb fragment of the targeting vector containing exon 5 was replaced with the similarly sized thymidine-neomycin (Tk-NO) cassette, resulting in an in-frame stop codon mutation [21]. Immunological characterization of the Prlr-KO mice has indicated that these mice do not have a defective hematopoietic system [24] and mice are capable of normal humoral and cell-mediated immune responses after exposure to T-independent/dependent antigens [25,26]. Previous results from our research group have shown that Prlr-KO mice display slightly altered liver growth, with higher liver to body weight (LBW) ratio at 2 weeks of age but lower LBW ratio after 4 weeks of age, compared to WT mice [22,23]. Adult Prlr-KO mice (16-18 weeks) do not show any differences in the visceral and subcutaneous adipose tissue weight or adipocyte area, compared to their WT counterparts. However, when challenged by a high fat diet (HFD) feeding for 8 weeks, Prlr-KO adult mice showed increased adiposity, characterized by adipocyte hypertrophy, and exacerbated glucose intolerance and insulin resistance compared to HFD-fed WT mice [27]. Also, streptozotocin (STZ)-induced diabetes in Prlr-KO adult mice (5-7 weeks old) resulted in increased hyperglycemia and glucose intolerance (p<0.05), and lower insulin levels (p>0.05) than STZ-induced diabetic WT mice [24], whereas no abnormalities in glucose and insulin levels were observed in non-diabetic Prlr-KO mice compared to their WT counterparts. Thus, Prlr-KO mice show increased susceptibility to develop exacerbated metabolic diseases. Despite several metabolic and phenotypic parameters have been described in the Prlr-KO mice, there are no reports about gut microbiota characterization in this mouse model. The rationale for studying the impact of PRL/PRL receptor signaling on gut microbiota at weaning is that maternal milk is a key regulator of gut microbiota composition and gut microbiota is critical for metabolic homeostasis of the host. Prolactin is a component of maternal milk regulating metabolism in the offspring [10], and during lactation in rodents, maternal milk is the main source of prolactin, as pituitary prolactin secretion (the primary source of circulating prolactin) starts around weaning [28,29].
The time and order in which microbiota colonize the gut, as well as the nutrients/substrates they encounter, are critical and highly contribute to the variation of microbiota between individuals [30]. Breast milk and the alveolar skin provide an abundant number of microorganisms to neonates, and the proportion of breast milk intake and its replacement with solid foods has a significant impact on microbiota diversity, an event that has been proposed as the major driver in the development of gut microbiota in human adults [2]. During weaning, Lactobacillaceae are gradually lost, followed by the expansion of Clostridiaceae [14], which are critical bacterial families that prevent colonization by bacterial pathogens [31]. Since mouse microbiota in early life cannot protect the host against pathogen colonization, Lactobacillaceae presence is important, as this bacterial family effectively and directly inhibits pathogens, contributes to barrier maintenance, and modulates the host’s immune system [32].
Along with microbiota and macro or micronutrients, breast milk delivers immune and endocrine factors that contribute to the neonates’ nutrition and development. This supports the concept of breast milk as a biological system [33,34]. Among the endocrine factors, PRL is delivered via maternal milk from the mother to the offspring in humans [35] and rodents [10], and studies suggest it regulates neonatal metabolic homeostasis [10], which could involve the modulation of gut microbiota composition and diversity. Although the relationship between microbiota changes and PRL activity has been scarcely explored, variations in PRL levels are linked to metabolic changes potentially implicating microbiota dysbiosis, as this is one of the reasons involved in the development of cardiovascular diseases, obesity and type 2 diabetes [15]. Moreover, microbiota transplantation has proven to reverse the severity of metabolic diseases [16]. Few reports have explored the association between endocrine factors and microbiota, and “microbial endocrinology” has been proposed as an emergent research area to study host-microbe interactions and how microbiota impact physiological processes, including endocrine and immune function, which are critical to preventing the development of chronic NCDs [36]. Here, we evaluated the impact of the absence of PRLR-PRL signaling on the gut microbiota composition of mice at weaning.
Macroscopically, both WT and KO mice displayed similar body weight development throughout lactation. However, at weaning, the Prlr-KO mice showed significantly higher colon weight, which is an early indicator of a pro-inflammatory state [37]. Changes in microbiota diversity have been associated with stress during weaning due to ecological mechanisms after the change in nutrient supply or maturation of the immune system (e.g., maternal IgA replacement with endogenous IgA) [38]. Operational taxonomic units (OTUs) were originally used to group bacterial reads into clusters, considering the microbial sequence identity [39]. However, the use of denoising methods migrated to identify exact sequence variants or ASVs, allowing to distinguish between the predicted “true” biological variation and those probably generated by sequencing error, and even a single nucleotide variation is defined as a separated ASV [40]. Hence, ASV variations in the tested animals indicate exact sequence variations interpreted as a differential bacterial composition for each mouse genotype, suggesting that Prlr -/- mice had a higher abundance of unique members of the bacterial community, but this does not reveal the size of the populations (absolute abundances), as observed by a lower Simpson Evenness and Phylogenetic diversity index in Prlr -/- mice compared to Prlr +/+ mice [41]. Lower microbial diversity and richness are linked to adverse conditions such as increased gut permeability, NCDs (e.g., insulin resistance and obesity), and pro-inflammatory phenotypes [42]. Since PRL activity is absent in Prlr-KO animals, it could be feasible that an excess of milk-derived PRL in the colon could influence bacterial populations as both Prlr-WT and Prlr-KO mice were subjected to the same potential stressful conditions to the gut microbiota, but differential bacterial profiles could be observed at several taxonomical levels. Another possibility is that PRL is converted into smaller fragments in the intestinal milieu, such as vasoinhibins (Vi) [43], and that the effects observed in Prlr-KO mice are the result of both a lack of PRLR signaling and an excess of Vi signaling. Excess Vi could be generated in the intestinal lumen derived from the cleavage of milk PRL or in the circulation of the pups resulting from elevated PRL levels known to be present in Prlr-KO animals. High PRL levels arose from absent PRLRs, which normally exert a negative feedback loop, stimulating dopamine release and inhibiting PRL production and secretion [44].
The effect of the hormonal milieu on the gut bacterial composition of newborn Wistar rats was recently evaluated, showing that daily oral administration of leptin and adiponectin decreased the Proteobacteria phylum and Blautia genus [45]. However, since a natural Proteobacteria decrease is presented along with intestinal maturation, the tested adipokines could enhance this process [46]. Moreover, leptin administration decreased Sutterella and increased Clostridium genera, while adiponectin decreased Roseburia and increased Enterococcus genera [45]. In another study, leptin concentrations in the maternal milk of women with obesity did not impact the neonates’ microbial diversity or composition, but a higher insulin concentration from the mothers’ milk was correlated with increased taxonomic diversity, particularly with Gammaproteobacteria, and was inversely correlated with Streptococcaceae [47]. It has also been reported that several bacterial genera could metabolize hormones such as progesterone or estradiol [48], and detectable plasmatic levels of progesterone (6-10 ng/mL) and 17β-estradiol (20-40 pg/mL) have been found in female rat pups at weaning [49], suggesting that colonic hormonal composition might influence bacterial growth based on their metabolism. There are no reports on the impact of PRL on gut microbiota, but germ-free rats were found to contain 25% more PRL plasma levels than gnotobiotic animals [50]. Moreover, bacterial families such as Lactobacillaceae (Lactobacillus gasseri, L. crispatus, and L. jenesnii), Peptostreptococcus, Bifidobacteriaceae (Bifidobacterium longum), and Streptococcaceae (Streptococcus agalactiae, Streptococcus anginosus) have been found to successfully grow in human follicular fluid [51], which contain several hormones, such as progesterone and PRL [52], advocating for a potential interaction between microbiota and PRL.
Regarding the mechanisms explaining the successful bacterial growth under hormone treatment, it has been found that the absence of estrogen receptor β signaling could differentially impact the overall abundance of bacterial phyla (e.g., Proteobacteria, Bacteroidetes, and Firmicutes) or orders (e.g., Lactobacillales) [53]. Moreover, the reported ability of Clostridium scidens to metabolize small traces of bile acids that easily escape from the small intestine into the cecum to produce adverse secondary bile acids, deoxycholic acid, lithocholic acid, and even glucocorticoids acting as signaling hormones in bacteria agrees with a proposed hormonal influence on bacteria [54]. Other reports indicate that epinephrine and norepinephrine from the host activate the transcription of virulence genes and flagella regulation in enterohemorrhagic E. coli., involving the participation of a histidine kinase sensor located at the bacterial surface [55].
Betaproteobacteria or its related order (Burkhoderiales) has been linked to NCD development in human adults. For instance, Betaproteobacteria abundance is increased in humans with type 2 diabetes [56]. Five-year-old infants resulting from hypertensive pregnancies showed fewer Alcaligenaceae and Coriobacteriaceae families than those from normotensive pregnancies [57]. The Anaerotruncus genus, which we found increased in Prlr-KO animals, is a butyrate-producing group of bacteria associated with obesity and correlates negatively with high carbohydrate-based diets but positively with total fat and the consumption of saturated fatty acids [58]. In rabbits, the Anaerotruncus genus was found to be negatively correlated with weaning weight [59].
Particularly for the differentially found species, the significant abundance of Lachnospiraceae species in the Prlr-WT mice could predict better intestinal health compared to Prlr-KO mice since Lachnospiraceae are largely believed to be health-promoting species critical to maintaining the colonic tissue due to their ability to produce SCFAs, the primary nutrition source for colonocytes [60], and known metabolites to decrease pro-inflammatory factors, protect the colonic mucosa, and inhibit NLRP3 inflammasome activation and reactive oxygen species (ROS) production [61]. Increased Lachnospiraceae abundance in 2-9–week-old children is considered one of the collective microbiota characteristics of appropriate growth after birth, together with augmented microbial diversity, a higher abundance of Streptococcus and strictly aerobic taxa, and a decrease in Staphylococcus and Enterobacteriaceae abundances [62].
The predicted functional analysis is consistent with maternal milk harboring bacteria linked to carbohydrates, amino acids, and energy metabolism [63]. Although reports are scarce, a recent article indicated that early exposure of neonates to elevated leptin and insulin concentrations from the maternal milk of women with obesity could impact the neonates’ metagenomic profile, as high leptin concentrations are inversely correlated with bacterial amino acids, carbohydrates, vitamins, and amino acid metabolism [64]. Products such as polyketides, alkaloids, and terpenoids are only derived from plants and can be formed by microorganisms [65]. Most terpenoids are terpene derivatives not encoded by microbiome genomes but represent microbial metabolites from dietary products or bile acid derivatives, and some of them are the result of the activity of oxidizing enzymes, such as terpene cyclases or synthases, and the addition of carbohydrates, amino acids, and fatty acid chains into polycyclic terpene backbones [66,67]. Some terpenes are widely synthesized by Proteobacteria, Actinobacteria, Firmicutes, and Bacteroidetes and display a wide range of biological properties, but little information regarding their colonic biosynthesis and effect has been reported [68]. On the other hand, polyketides are secondary metabolites produced mainly by Actinobacteria, Proteobacteria, Bacteroidetes, and Firmicutes, exhibiting antimicrobial properties against selected populations [69].

5. Conclusions

The results obtained in this research suggest that the absence of PRLR signaling could promote a higher abundance of gut microbiota potentially linked to NCDs during weaning. Both Prlr-WT and Prlr-KO weaned mice shared similarities in bacterial diversity, taxonomic composition, and metabolic functionalities, but Prlr-KO mice displayed differential bacterial species that could predispose mice to adverse disease conditions. Although it is challenging to establish a mechanism of action based on the results presented in this research, the fact that lack of prolactin receptor signaling derives in altered gut microbiota at a key developmental time point, opens new research avenues that merit additional research. Moreover, these results support the hypothesis that an altered microbiota profile in Prlr-KO mice contribute to their observed susceptibility to develop aggravated metabolic diseases.

Author Contributions

Conceptualization, Y.M. and I.L.O.; methodology, Y. M., I. L. O., A. L. O. R., and J. L. D. B.; software, I. L. O..; validation, Y. M., G. M. d. l. E., and C. C.; formal analysis, I. L. O., and Y. M.; investigation, I. L. O.; resources, Y. M., G. M. d. l. E., and C. C.; data curation, I. L., writing-original draft preparation, I. L. O., and Y. M.; writing-review and editing, I. L. O., Y. M., G. M. d. l. E., and C. C.; visualization, I. L. O.; supervision, Y. M.; project administration, Y. M.; funding acquisition, Y. M. All authors have read and agreed to the published version of the manuscript.

Funding

This research was funded by Consejo Nacional de Ciencia y Tecnología (CONACyT-Mexico) (ID: 284771) and UNAM-DGAPA-PAPIIT (ID: IN207321) to Y. Macotela.

Institutional Review Board Statement

The study was conducted in accordance with the Declaration of Helsinki and approved by the Bioethics Committee of the Instituto de Neurobiología at the National Autonomous University of Mexico [protocols: 075 (2014) and 033 (2007, updated on 2020)].

Informed Consent Statement

Not applicable.

Data Availability Statement

Data will be available upon reasonable request.

Acknowledgments

We thank Jessica Gonzalez-Norris for critically editing the manuscript. Author Ivan Luzardo-Ocampo acknowledges Programa de Becas Posdoctorales de la UNAM (DGAPA-CIC) for his postdoctoral scholarship (grant number: 5267). Authors Ana L. Ocampo-Ruíz and Jos-é Luis Dena-Beltran appreciate the support received by Consejo Nacional de Ciencia y Tecnología (CONACyT-Mexico) for their Ph. D. scholarships (grant numbers: 1004503 and 856829). We also thank Xarubet Ruiz-Herrera, Martín García-Servín, Alejandra Castilla, Maria Antonieta Carbajo, Antonio Prado, Daniel Mondragón, and Fernando López-Barrera for their technical assistance.

Conflicts of Interest

The authors declare no conflict of interest.

References

  1. Milani, C.; Duranti, S.; Bottacini, F.; Casey, E.; Turroni, F.; Mahony, J.; Belzer, C.; Delgado Palacio, S.; Arboleya Montes, S.; Mancabelli, L.; et al. The First Microbial Colonizers of the Human Gut: Composition, Activities, and Health Implications of the Infant Gut Microbiota. Microbiol. Mol. Biol. Rev. 2017, 81. [Google Scholar] [CrossRef]
  2. Bäckhed, F.; Roswall, J.; Peng, Y.; Feng, Q.; Jia, H.; Kovatcheva-Datchary, P.; Li, Y.; Xia, Y.; Xie, H.; Zhong, H.; et al. Dynamics and Stabilization of the Human Gut Microbiome during the First Year of Life. Cell Host Microbe 2015, 17, 690–703. [Google Scholar] [CrossRef] [PubMed]
  3. Bokulich, N.A.; Chung, J.; Battaglia, T.; Henderson, N.; Jay, M.; Li, H.; Lieber, A.D.; Wu, F.; Perez-Perez, G.I.; Chen, Y.; et al. Antibiotics, Birth Mode, and Diet Shape Microbiome Maturation during Early Life. Sci. Transl. Med. 2016, 8. [Google Scholar] [CrossRef] [PubMed]
  4. Lokossou, G.A.G.; Kouakanou, L.; Schumacher, A.; Zenclussen, A.C. Human Breast Milk: From Food to Active Immune Response With Disease Protection in Infants and Mothers. Front. Immunol. 2022, 13. [Google Scholar] [CrossRef]
  5. Gopalakrishnan, L.; Doriya, K.; Kumar, D.S. Moringa Oleifera: A Review on Nutritive Importance and Its Medicinal Applications. Food Sci. Hum. Wellness 2016, 5, 1–8. [Google Scholar] [CrossRef]
  6. Godhia, M.; Patel, N. Colostrum - Its Composition, Benefits As A Nutraceutical : A Review. Curr. Res. Nutr. Food Sci. J. 2013, 1, 37–47. [Google Scholar] [CrossRef]
  7. Macotela, Y.; Ruiz-Herrera, X.; Vázquez-Carrillo, D.I.; Ramírez-Hernandez, G.; Martínez de la Escalera, G.; Clapp, C. The Beneficial Metabolic Actions of Prolactin. Front. Endocrinol. (Lausanne). 2022, 13. [Google Scholar] [CrossRef]
  8. Macotela, Y.; Triebel, J.; Clapp, C. Time for a New Perspective on Prolactin in Metabolism. Trends Endocrinol. Metab. 2020, 31, 276–286. [Google Scholar] [CrossRef]
  9. Luzardo-Ocampo, I.; Dena-Beltrán, J.L.; Ruiz-Herrera, X.; Ocampo-Ruiz, A.L.; Martínez de la Escalera, G.; Clapp, C.; Macotela, Y. Obesity-Derived Alterations in the Lactating Mammary Gland: Focus on Prolactin. Mol. Cell. Endocrinol. 2023, 559, 111810. [Google Scholar] [CrossRef]
  10. de los Ríos, E.A.; Ruiz-Herrera, X.; Tinoco-Pantoja, V.; López-Barrera, F.; Escalera, G.M.; Clapp, C.; Macotela, Y. Impaired Prolactin Actions Mediate Altered Offspring Metabolism Induced by Maternal High-fat Feeding during Lactation. FASEB J. 2018, 32, 3457–3470. [Google Scholar] [CrossRef]
  11. Rizzetto, L.; Fava, F.; Tuohy, K.M.; Selmi, C. Connecting the Immune System, Systemic Chronic Inflammation and the Gut Microbiome: The Role of Sex. J. Autoimmun. 2018, 92, 12–34. [Google Scholar] [CrossRef] [PubMed]
  12. Neuman, H.; Debelius, J.W.; Knight, R.; Koren, O. Microbial Endocrinology: The Interplay between the Microbiota and the Endocrine System. FEMS Microbiol. Rev. 2015, 39, 509–521. [Google Scholar] [CrossRef] [PubMed]
  13. Wang, J.-F.; Fu, S.-P.; Li, S.-N.; Hu, Z.-M.; Xue, W.-J.; Li, Z.-Q.; Huang, B.-X.; Lv, Q.-K.; Liu, J.-X.; Wang, W. Short-Chain Fatty Acids Inhibit Growth Hormone and Prolactin Gene Transcription via CAMP/PKA/CREB Signaling Pathway in Dairy Cow Anterior Pituitary Cells. Int. J. Mol. Sci. 2013, 14, 21474–21488. [Google Scholar] [CrossRef] [PubMed]
  14. Al Nabhani, Z.; Dulauroy, S.; Marques, R.; Cousu, C.; Al Bounny, S.; Déjardin, F.; Sparwasser, T.; Bérard, M.; Cerf-Bensussan, N.; Eberl, G. A Weaning Reaction to Microbiota Is Required for Resistance to Immunopathologies in the Adult. Immunity 2019, 50, 1276–1288.e5. [Google Scholar] [CrossRef] [PubMed]
  15. Noce, A.; Marrone, G.; Di Daniele, F.; Ottaviani, E.; Wilson Jones, G.; Bernini, R.; Romani, A.; Rovella, V. Impact of Gut Microbiota Composition on Onset and Progression of Chronic Non-Communicable Diseases. Nutrients 2019, 11, 1073. [Google Scholar] [CrossRef] [PubMed]
  16. Choi, H.H.; Cho, Y.-S. Fecal Microbiota Transplantation: Current Applications, Effectiveness, and Future Perspectives. Clin. Endosc. 2016, 49, 257–265. [Google Scholar] [CrossRef] [PubMed]
  17. Callahan, B.J.; McMurdie, P.J.; Rosen, M.J.; Han, A.W.; Johnson, A.J.A.; Holmes, S.P. DADA2: High-Resolution Sample Inference from Illumina Amplicon Data. Nat. Methods 2016, 13, 581–583. [Google Scholar] [CrossRef] [PubMed]
  18. Caporaso, J.G.; Kuczynski, J.; Stombaugh, J.; Bittinger, K.; Bushman, F.D.; Costello, E.K.; Fierer, N.; Peña, A.G.; Goodrich, J.K.; Gordon, J.I.; et al. QIIME Allows Analysis of High-Throughput Community Sequencing Data. Nat. Methods 2010, 7, 335–336. [Google Scholar] [CrossRef]
  19. Dhariwal, A.; Chong, J.; Habib, S.; King, I.L.; Agellon, L.B.; Xia, J. MicrobiomeAnalyst: A Web-Based Tool for Comprehensive Statistical, Visual and Meta-Analysis of Microbiome Data. Nucleic Acids Res. 2017, 45, W180–W188. [Google Scholar] [CrossRef]
  20. Langille, M.G.I.; Zaneveld, J.; Caporaso, J.G.; McDonald, D.; Knights, D.; Reyes, J.A.; Clemente, J.C.; Burkepile, D.E.; Vega Thurber, R.L.; Knight, R.; et al. Predictive Functional Profiling of Microbial Communities Using 16S RRNA Marker Gene Sequences. Nat. Biotechnol. 2013, 31, 814–821. [Google Scholar] [CrossRef]
  21. Yin, L.; Wan, Y.-D.; Pan, X.-T.; Zhou, C.-Y.; Lin, N.; Ma, C.-T.; Yao, J.; Su, Z.; Wan, C.; Yu, Y.-W.; et al. Association Between Gut Bacterial Diversity and Mortality in Septic Shock Patients: A Cohort Study. Med. Sci. Monit. 2019, 25, 7376–7382. [Google Scholar] [CrossRef]
  22. Moore, J.C. Diversity, Taxonomic versus Functional. In Encyclopedia of Biodiversity; Levin, S.A., Ed.; Academic Press - Elsevier, 2013; pp. 648–656. ISBN 978-0-12-384720-1. [Google Scholar]
  23. Ormandy, C.J.; Camus, A.; Barra, J.; Damotte, D.; Lucas, B.; Buteau, H.; Edery, M.; Brousse, N.; Babinet, C.; Binart, N.; et al. Null Mutation of the Prolactin Receptor Gene Produces Multiple Reproductive Defects in the Mouse. Genes Dev. 1997, 11, 167–178. [Google Scholar] [CrossRef] [PubMed]
  24. Horseman, N.D. Defective Mammopoiesis, but Normal Hematopoiesis, in Mice with a Targeted Disruption of the Prolactin Gene. EMBO J. 1997, 16, 6926–6935. [Google Scholar] [CrossRef] [PubMed]
  25. Foster, M.P.; Jensen, E.R.; Montecino-Rodriguez, E.; Leathers, H.; Horseman, N.; Dorshkind, K. Humoral and Cell-Mediated Immunity in Mice with Genetic Deficiencies of Prolactin, Growth Hormone, Insulin-like Growth Factor-I, and Thyroid Hormone. Clin. Immunol. 2000, 96, 140–149. [Google Scholar] [CrossRef] [PubMed]
  26. Bouchard, B.; Ormandy, C.J.; Di Santo, J.P.; Kelly, P.A. Immune System Development and Function in Prolactin Receptor-Deficient Mice. J. Immunol. 1999, 163, 576–582. [Google Scholar] [CrossRef] [PubMed]
  27. Ruiz-Herrera, X.; de los Ríos, E.A.; Díaz, J.M.; Lerma-Alvarado, R.M.; de la Escalera, L.M.; López-Barrera, F.; Lemini, M.; Arnold, E.; de la Escalera, G.M.; Clapp, C.; et al. Prolactin Promotes Adipose Tissue Fitness and Insulin Sensitivity in Obese Males. Endocrinology 2017, 158, 56–68. [Google Scholar] [CrossRef]
  28. Moreno-Carranza, B.; Bravo-Manríquez, M.; Baez, A.; Ledesma-Colunga, M.G.; Ruiz-Herrera, X.; Reyes-Ortega, P.; de los Ríos, E.A.; Macotela, Y.; Martínez de la Escalera, G.; Clapp, C. Prolactin Regulates Liver Growth during Postnatal Development in Mice. Am. J. Physiol. Integr. Comp. Physiol. 2018, 314, R902–R908. [Google Scholar] [CrossRef]
  29. Ben-Jonathan, N.; LaPensee, C.R.; LaPensee, E.W. What Can We Learn from Rodents about Prolactin in Humans? Endocr. Rev. 2008, 29, 1–41. [Google Scholar] [CrossRef]
  30. van den Elsen, L.W.J.; Garssen, J.; Burcelin, R.; Verhasselt, V. Shaping the Gut Microbiota by Breastfeeding: The Gateway to Allergy Prevention? Front. Pediatr. 2019, 7, 1–10. [Google Scholar] [CrossRef]
  31. Kim, Y.-G.; Sakamoto, K.; Seo, S.-U.; Pickard, J.M.; Gillilland, M.G.; Pudlo, N.A.; Hoostal, M.; Li, X.; Wang, T.D.; Feehley, T.; et al. Neonatal Acquisition of Clostridia Species Protects against Colonization by Bacterial Pathogens. Science (80-. ). 2017, 356, 315–319. [Google Scholar] [CrossRef]
  32. McKenney, P.T.; Pamer, E.G. From Hype to Hope: The Gut Microbiota in Enteric Infectious Disease. Cell 2015, 163, 1326–1332. [Google Scholar] [CrossRef]
  33. Christian, P.; Smith, E.R.; Lee, S.E.; Vargas, A.J.; Bremer, A.A.; Raiten, D.J. The Need to Study Human Milk as a Biological System. Am. J. Clin. Nutr. 2021, 113, 1063–1072. [Google Scholar] [CrossRef]
  34. Erliana, U.D.; Fly, A.D. The Function and Alteration of Immunological Properties in Human Milk of Obese Mothers. Nutrients 2019, 11, 1284. [Google Scholar] [CrossRef] [PubMed]
  35. Yuen, B.H. Prolactin in Human Milk: The Influence of Nursing and the Duration of Postpartum Lactation. Am. J. Obstet. Gynecol. 1988, 158, 583–586. [Google Scholar] [CrossRef] [PubMed]
  36. Jensen, E.A.; Young, J.A.; Mathes, S.C.; List, E.O.; Carroll, R.K.; Kuhn, J.; Onusko, M.; Kopchick, J.J.; Murphy, E.R.; Berryman, D.E. Crosstalk between the Growth Hormone/Insulin-like Growth Factor-1 Axis and the Gut Microbiome: A New Frontier for Microbial Endocrinology. Growth Horm. IGF Res. 2020, 53–54, 101333. [Google Scholar] [CrossRef] [PubMed]
  37. Tran, H.Q.; Bretin, A.; Adeshirlarijaney, A.; Yeoh, B.S.; Vijay-Kumar, M.; Zou, J.; Denning, T.L.; Chassaing, B.; Gewirtz, A.T. “Western Diet”-Induced Adipose Inflammation Requires a Complex Gut Microbiota. Cell. Mol. Gastroenterol. Hepatol. 2020, 9, 313–333. [Google Scholar] [CrossRef]
  38. Schloss, P.D.; Schubert, A.M.; Zackular, J.P.; Iverson, K.D.; Young, V.B.; Petrosino, J.F. Stabilization of the Murine Gut Microbiome Following Weaning. Gut Microbes 2012, 3, 383–393. [Google Scholar] [CrossRef]
  39. Schloss, P.D.; Westcott, S.L. Assessing and Improving Methods Used in Operational Taxonomic Unit-Based Approaches for 16S RRNA Gene Sequence Analysis. Appl. Environ. Microbiol. 2011, 77, 3219–3226. [Google Scholar] [CrossRef]
  40. Callahan, B.J.; McMurdie, P.J.; Holmes, S.P. Exact Sequence Variants Should Replace Operational Taxonomic Units in Marker-Gene Data Analysis. ISME J. 2017, 11, 2639–2643. [Google Scholar] [CrossRef]
  41. Lou, J.; Yang, L.; Wang, H.; Wu, L.; Xu, J. Assessing Soil Bacterial Community and Dynamics by Integrated High-Throughput Absolute Abundance Quantification. PeerJ 2018, 6, e4514. [Google Scholar] [CrossRef]
  42. Le Chatelier, E.; Nielsen, T.; Qin, J.; Prifti, E.; Hildebrand, F.; Falony, G.; Almeida, M.; Arumugam, M.; Batto, J.-M.; Kennedy, S.; et al. Richness of Human Gut Microbiome Correlates with Metabolic Markers. Nature 2013, 500, 541–546. [Google Scholar] [CrossRef] [PubMed]
  43. Triebel, J.; Robles, J.P.; Zamora, M.; Martínez de la Escalera, G.; Bertsch, T.; Clapp, C. Regulator of Angiogenesis and Vascular Function: A 2019 Update of the Vasoinhibin Nomenclature. Front. Endocrinol. (Lausanne). 2019, 10. [Google Scholar] [CrossRef] [PubMed]
  44. Devost, D.; Boutin, J.-M. Autoregulation of the Rat Prolactin Gene in Lactotrophs. Mol. Cell. Endocrinol. 1999, 158, 99–109. [Google Scholar] [CrossRef] [PubMed]
  45. Grases-Pintó, B.; Abril-Gil, M.; Castell, M.; Rodríguez-Lagunas, M.J.; Burleigh, S.; Fåk Hållenius, F.; Prykhodko, O.; Pérez-Cano, F.J.; Franch, À. Influence of Leptin and Adiponectin Supplementation on Intraepithelial Lymphocyte and Microbiota Composition in Suckling Rats. Front. Immunol. 2019, 10. [Google Scholar] [CrossRef]
  46. Marungruang, N.; Arévalo Sureda, E.; Lefrançoise, A.; Weström, B.; Nyman, M.; Prykhodko, O.; Fåk Hållenius, F. Impact of Dietary Induced Precocious Gut Maturation on Cecal Microbiota and Its Relation to the Blood-Brain Barrier during the Postnatal Period in Rats. Neurogastroenterol. Motil. 2018, 30, e13285. [Google Scholar] [CrossRef]
  47. Lemas, D.J.; Young, B.E.; Baker, P.R.; Tomczik, A.C.; Soderborg, T.K.; Hernandez, T.L.; de la Houssaye, B.A.; Robertson, C.E.; Rudolph, M.C.; Ir, D.; et al. Alterations in Human Milk Leptin and Insulin Are Associated with Early Changes in the Infant Intestinal Microbiome, Am. J. Clin. Nutr. 2016, 103, 1291–1300. [Google Scholar] [CrossRef]
  48. Adlercreutz, H.; Pulkkinen, M.O.; Hämäläinen, E.K.; Korpela, J.T. Studies on the Role of Intestinal Bacteria in Metabolism of Synthetic and Natural Steroid Hormones. J. Steroid Biochem. 1984, 20, 217–229. [Google Scholar] [CrossRef]
  49. Léonhardt, M.; Lesage, J.; Croix, D.; Dutriez-Casteloot, I.; Beauvillain, J.C.; Dupouy, J.P. Effects of Perinatal Maternal Food Restriction on Pituitary-Gonadal Axis and Plasma Leptin Level in Rat Pup at Birth and Weaning and on Timing of Puberty. Biol. Reprod. 2003, 68, 390–400. [Google Scholar] [CrossRef]
  50. Wostmann, B.S. Morphology and Physiology, Endocrinology and Biochemistry. In Germfree and Gnotobiotic Animal Models; Wostmann, B.S., Ed.; CRC Press: London, UK, 1996; pp. 39–66. ISBN 9780138753320. [Google Scholar]
  51. Pelzer, E.S.; Allan, J.A.; Theodoropoulos, C.; Ross, T.; Beagley, K.W.; Knox, C.L. Hormone-Dependent Bacterial Growth, Persistence and Biofilm Formation – A Pilot Study Investigating Human Follicular Fluid Collected during IVF Cycles. PLoS One 2012, 7, e49965. [Google Scholar] [CrossRef]
  52. Ohwaki, M.; Suganuma, N.; Seo, H.; Nawa, A.; Kikkawa, F.; Narita, O.; Matsui, N.; Tomoda, Y. Source of Prolactin in Human Follicular Fluid. Endocrinol. Jpn. 1992, 39, 601–607. [Google Scholar] [CrossRef]
  53. Menon, R.; Watson, S.E.; Thomas, L.N.; Allred, C.D.; Dabney, A.; Azcarate-Peril, M.A.; Sturino, J.M. Diet Complexity and Estrogen Receptor β Status Affect the Composition of the Murine Intestinal Microbiota. Appl. Environ. Microbiol. 2013, 79, 5763–5773. [Google Scholar] [CrossRef]
  54. Ridlon, J.M.; Ikegawa, S.; Alves, J.M.P.; Zhou, B.; Kobayashi, A.; Iida, T.; Mitamura, K.; Tanabe, G.; Serrano, M.; De Guzman, A.; et al. Clostridium Scindens: A Human Gut Microbe with a High Potential to Convert Glucocorticoids into Androgens. J. Lipid Res. 2013, 54, 2437–2449. [Google Scholar] [CrossRef]
  55. Clarke, M.B.; Hughes, D.T.; Zhu, C.; Boedeker, E.C.; Sperandio, V. The QseC Sensor Kinase: A Bacterial Adrenergic Receptor. Proc. Natl. Acad. Sci. 2006, 103, 10420–10425. [Google Scholar] [CrossRef] [PubMed]
  56. Larsen, N.; Vogensen, F.K.; van den Berg, F.W.J.; Nielsen, D.S.; Andreasen, A.S.; Pedersen, B.K.; Al-Soud, W.A.; Sørensen, S.J.; Hansen, L.H.; Jakobsen, M. Gut Microbiota in Human Adults with Type 2 Diabetes Differs from Non-Diabetic Adults. PLoS One 2010, 5, e9085. [Google Scholar] [CrossRef] [PubMed]
  57. Susic, D.F.; Wang, L.; Roberts, L.M.; Bai, M.; Gia, A.; McGovern, E.; Jiang, X.-T.; Davis, G.K.; El-Omar, E.; Henry, A. The P4 Study: Postpartum Maternal and Infant Faecal Microbiome 6 Months After Hypertensive Versus Normotensive Pregnancy. Front. Cell. Infect. Microbiol. 2022, 12. [Google Scholar] [CrossRef]
  58. Bailén, M.; Bressa, C.; Martínez-López, S.; González-Soltero, R.; Montalvo Lominchar, M.G.; San Juan, C.; Larrosa, M. Microbiota Features Associated With a High-Fat/Low-Fiber Diet in Healthy Adults. Front. Nutr. 2020, 7. [Google Scholar] [CrossRef] [PubMed]
  59. Fang, S.; Chen, X.; Zhou, L.; Wang, C.; Chen, Q.; Lin, R.; Xiao, T.; Gan, Q. Faecal Microbiota and Functional Capacity Associated with Weaning Weight in Meat Rabbits. Microb. Biotechnol. 2019, 12, 1441–1452. [Google Scholar] [CrossRef] [PubMed]
  60. Vacca, M.; Celano, G.; Calabrese, F.M.; Portincasa, P.; Gobbetti, M.; De Angelis, M. The Controversial Role of Human Gut Lachnospiraceae. Microorganisms 2020, 8, 573. [Google Scholar] [CrossRef]
  61. Luzardo-Ocampo, I.; Loarca-Piña, G.; Gonzalez de Mejia, E. Gallic and Butyric Acids Modulated NLRP3 Inflammasome Markers in a Co-Culture Model of Intestinal Inflammation. Food Chem. Toxicol. 2020, 146, 111835. [Google Scholar] [CrossRef]
  62. Younge, N.E.; Newgard, C.B.; Cotten, C.M.; Goldberg, R.N.; Muehlbauer, M.J.; Bain, J.R.; Stevens, R.D.; O’Connell, T.M.; Rawls, J.F.; Seed, P.C.; et al. Disrupted Maturation of the Microbiota and Metabolome among Extremely Preterm Infants with Postnatal Growth Failure. Sci. Rep. 2019, 9, 8167. [Google Scholar] [CrossRef]
  63. Pannaraj, P.S.; Li, F.; Cerini, C.; Bender, J.M.; Yang, S.; Rollie, A.; Adisetiyo, H.; Zabih, S.; Lincez, P.J.; Bittinger, K.; et al. Association Between Breast Milk Bacterial Communities and Establishment and Development of the Infant Gut Microbiome. JAMA Pediatr. 2017, 171, 647. [Google Scholar] [CrossRef]
  64. Galluzzi, L.; Vitale, I.; Aaronson, S.A.; Abrams, J.M.; Adam, D.; Agostinis, P.; Alnemri, E.S.; Altucci, L.; Amelio, I.; Andrews, D.W.; et al. Molecular Mechanisms of Cell Death: Recommendations of the Nomenclature Committee on Cell Death 2018. Cell Death Differ. 2018, 25, 486–541. [Google Scholar] [CrossRef]
  65. Ağagündüz, D.; Cemali, Ö.; Çelik, E. Interaction Between Natural Products and Gut Microbiota. Curr. Pharmacol. Reports 2022, 9, 7–31. [Google Scholar] [CrossRef]
  66. Heinken, A.; Ravcheev, D.A.; Baldini, F.; Heirendt, L.; Fleming, R.M.T.; Thiele, I. Systematic Assessment of Secondary Bile Acid Metabolism in Gut Microbes Reveals Distinct Metabolic Capabilities in Inflammatory Bowel Disease. Microbiome 2019, 7, 75. [Google Scholar] [CrossRef] [PubMed]
  67. Oldfield, E.; Lin, F.-Y. Terpene Biosynthesis: Modularity Rules. Angew. Chemie Int. Ed. 2012, 51, 1124–1137. [Google Scholar] [CrossRef] [PubMed]
  68. Fobofou, S.A.; Savidge, T. Microbial Metabolites: Cause or Consequence in Gastrointestinal Disease? Am. J. Physiol. Liver Physiol. 2022, 322, G535–G552. [Google Scholar] [CrossRef]
  69. Tang, X.; Kudo, Y.; Baker, J.L.; LaBonte, S.; Jordan, P.A.; McKinnie, S.M.K.; Guo, J.; Huan, T.; Moore, B.S.; Edlund, A. Cariogenic Streptococcus Mutans Produces Tetramic Acid Strain-Specific Antibiotics That Impair Commensal Colonization. ACS Infect. Dis. 2020, 6, 563–571. [Google Scholar] [CrossRef]
Figure 1. Macroscopic measurements in pups. (A) Body weight evolution during lactation. (B) Normalized colon weight to body weight, and (C) Normalized cecal content weight to body weight. Data were presented as the mean ± SD of 15 mice. The asterisks indicate significant differences (* p<0.05; ** p<0.01) according to the Kruskal-Wallis test.
Preprints 81163 g001
Figure 2. Alpha-diversity of the bacterial composition of weaned 21-day-old pups. (A) Venn diagram of the shared and unshared amplicon sequence variants (ASVs) between the groups; (B) Shannon index; (C) Simpson evenness; (D) Faith’s phylogenetic diversity. Data (B-D) was presented as the mean ± SD of five samples (three mice each). Differences were assessed through a Kruskal-Wallis test.
Preprints 81163 g002
Figure 3. Bray–Curtis distance matrix PCoA plot. Each dot represents the pooled data from three mice (n=15/group). Analysis was conducted considering the species diversity, and data were not significant (p=0.075) based on a Permutational Analysis of Variance (PERMANOVA) analysis (p>0.05).
Preprints 81163 g003
Figure 4. Taxonomic bacterial composition of the groups (21-day-old mice). Relative abundance of phylum (A), class (B), order (C), and family (D). Significantly different (p<0.05) class (E), order (F), family (G), and genus (H). Data was presented as the mean ± SD of five samples (three mice each). Differences were assessed through the Kruskal-Wallis test (* p<0.05).
Preprints 81163 g004
Figure 5. Significantly different bacterial species between 21-day-old pups of each group (five samples from each group were taken, each representing three mice). The values were presented in normalized abundance after a min-max normalization [(sample-min)/(max-min)]. F: family; G: genus; O: Order; UNC: unclassified.
Preprints 81163 g005
Figure 6. PICRUSt metabolic prediction based on species composition from 21-day-old, weaned mice. (A) Relative metabolic abundance for each group; (B) PCoA analysis of the metabolic performance. Data in (A) was presented as the mean ± SD of 469 identified species. Differences in (A) were evaluated through the Kruskal-Wallis test (p<0.05). Differences in (B) were assessed using PERMANOVA (p<0.05). Each dot in (B) represents three mice.
Preprints 81163 g006
Disclaimer/Publisher’s Note: The statements, opinions and data contained in all publications are solely those of the individual author(s) and contributor(s) and not of MDPI and/or the editor(s). MDPI and/or the editor(s) disclaim responsibility for any injury to people or property resulting from any ideas, methods, instructions or products referred to in the content.
Copyright: This open access article is published under a Creative Commons CC BY 4.0 license, which permit the free download, distribution, and reuse, provided that the author and preprint are cited in any reuse.
Alerts
Prerpints.org logo

Preprints.org is a free preprint server supported by MDPI in Basel, Switzerland.

Subscribe

© 2025 MDPI (Basel, Switzerland) unless otherwise stated