3.1. Characteristics of Fly Ashes
The fly ash used in this study, derived from municipal solid waste (MSW), was obtained from the Chengxi Incineration Plant situated in Tainan, Taiwan. The initial phase of the experimental investigation involved a comprehensive analysis aimed at determining the intrinsic properties of the fly ash. Utilizing the X-ray fluorescence (XRF) technique, an elemental analysis was performed, and the obtained results are presented in
Table 3. Subsequently, aqua regia digestion was conducted on the fly ash, followed by elemental analysis using atomic absorption spectrometry (AAS).
Table 4. provides an overview of the relative proportions of different elements identified in the fly ash. Comparative analysis of
Table 3. and
Table 4. reveals that the dominant constituents of the fly ash primarily consist of calcium, sodium, and potassium, whereas the proportions of heavy metals, such as zinc, lead, copper, chromium, and cadmium, are comparatively lower. Despite the relatively low concentrations of heavy metals in the fly ash, their potential for leaching remains a significant environmental concern.
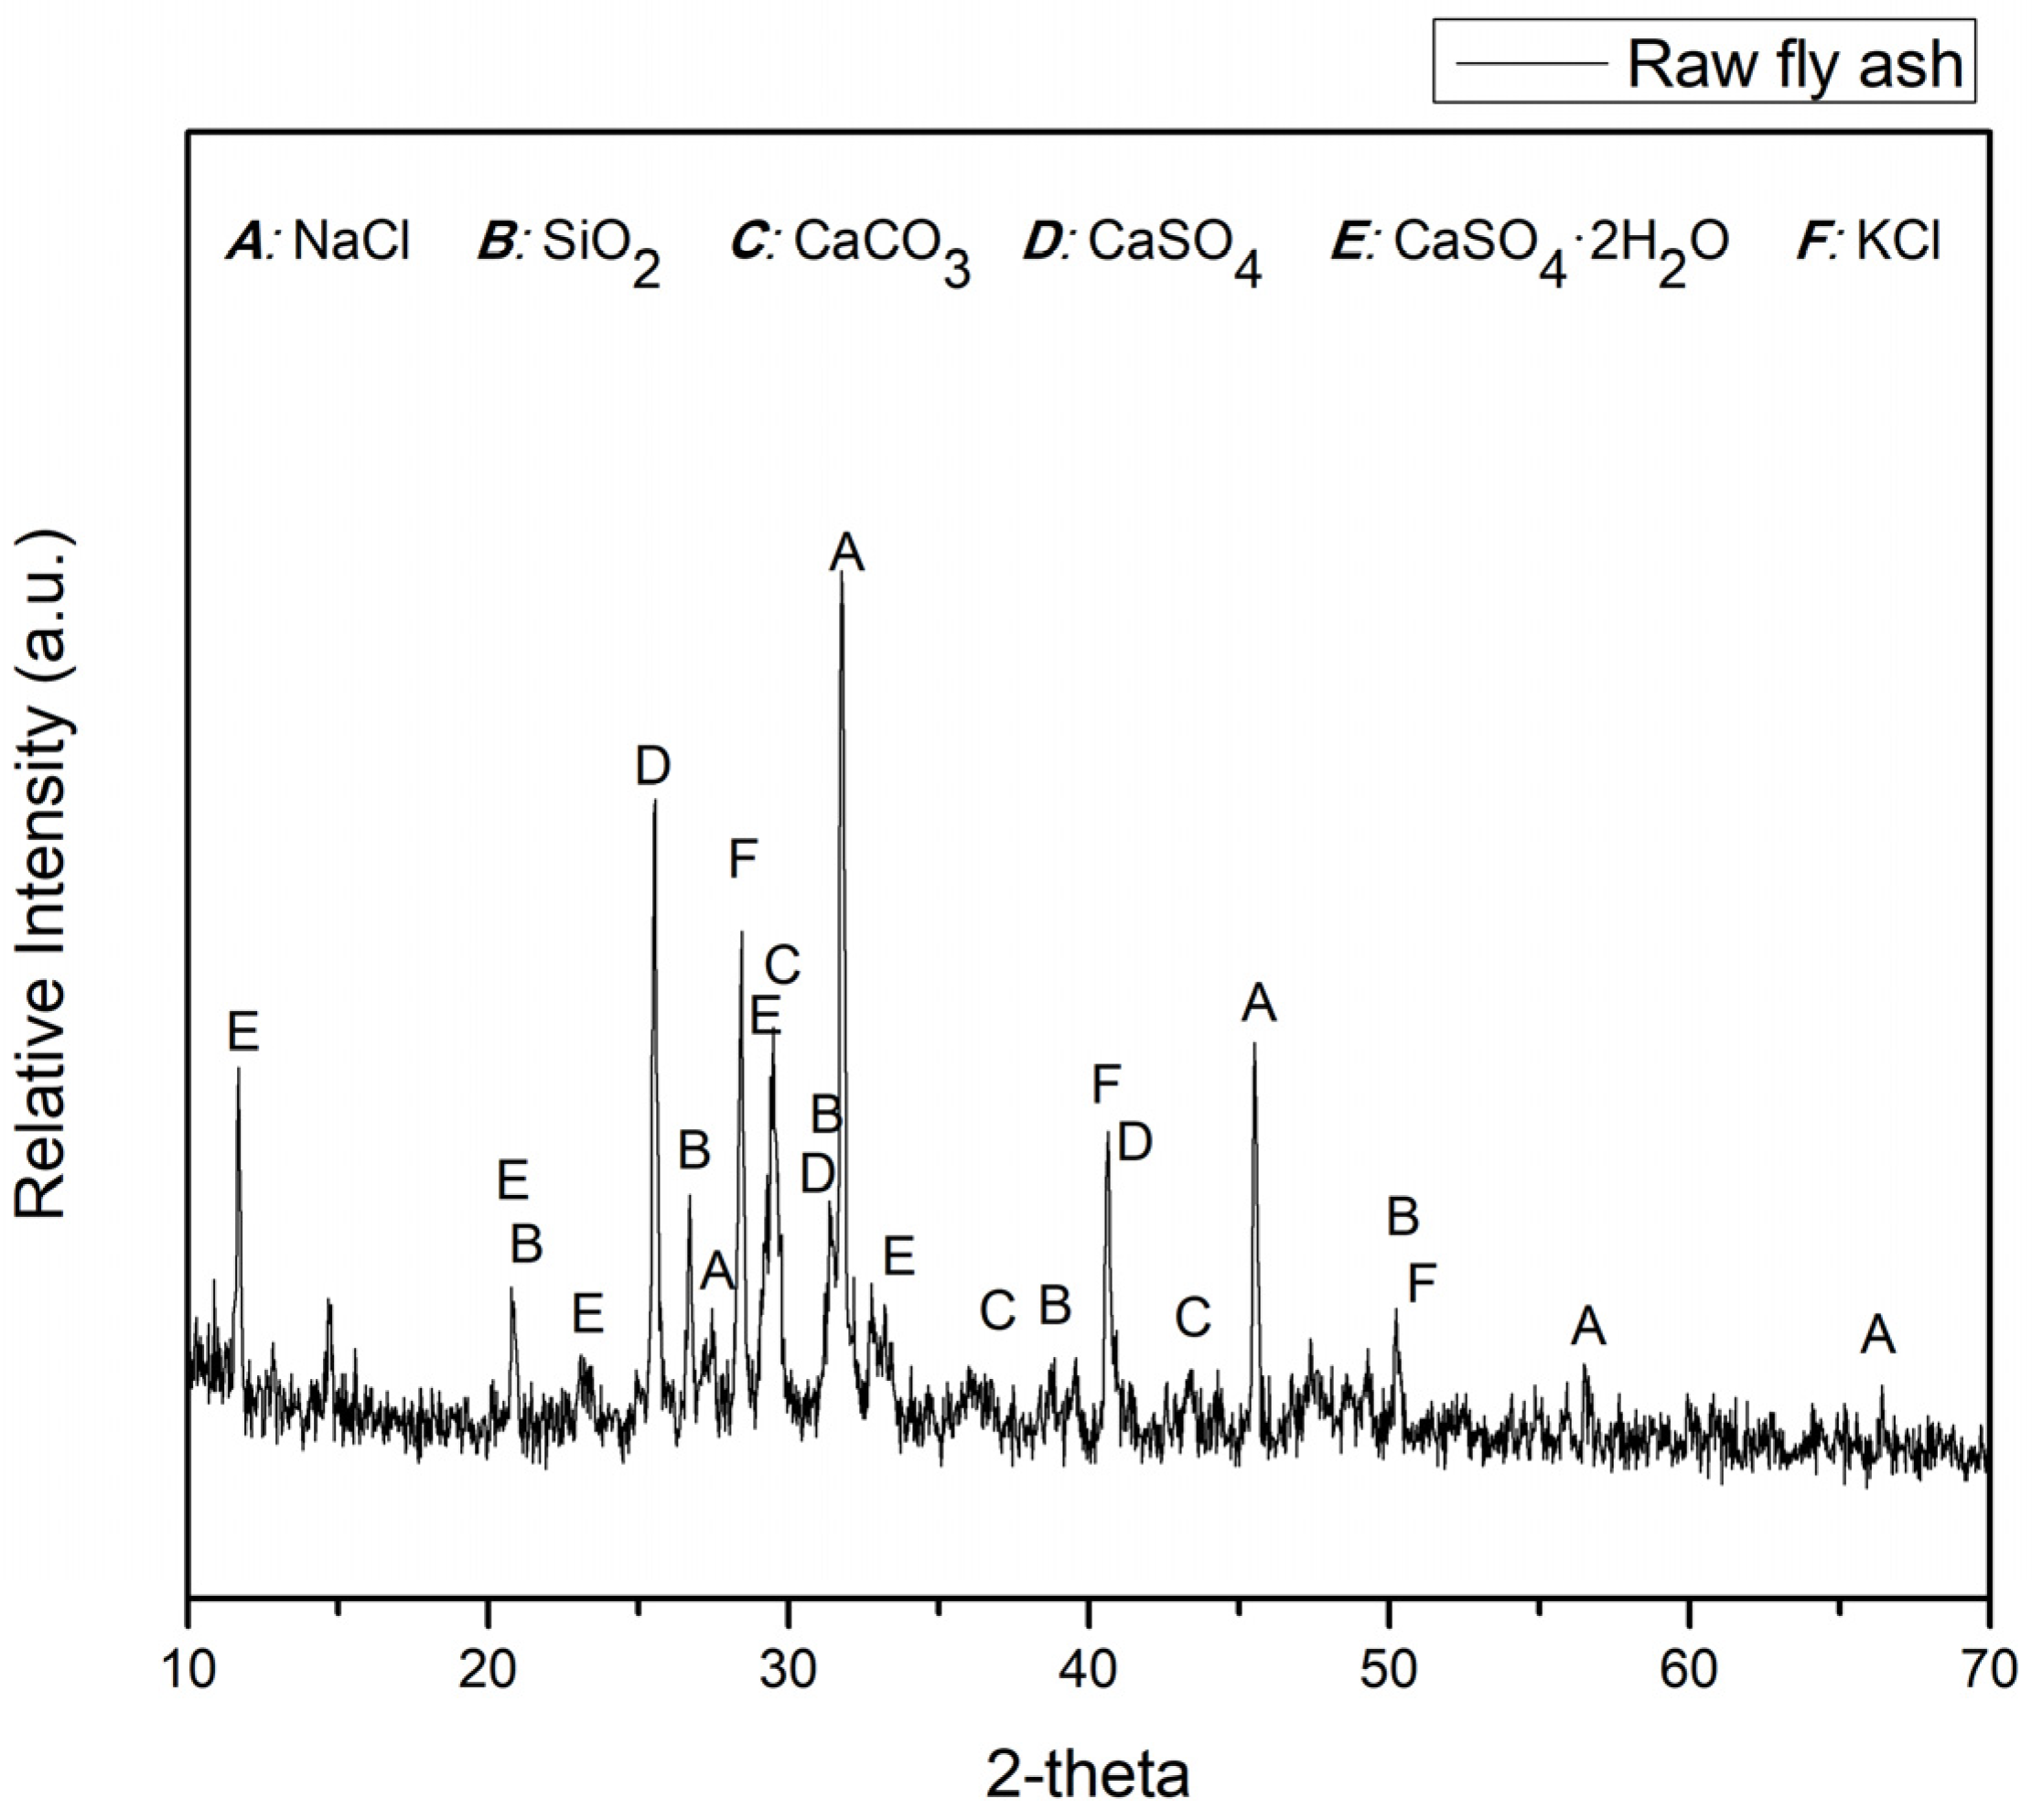
The XRD analysis conducted on the fly ash sample at room temperature, as illustrated in
Figure 1., revealed the predominant crystalline phases present in the fly ash composition. These include NaCl (Halite, PDF#05-0628), SiO
2 (Quartz, PDF#46-1045), CaCO
3 (Calcite, PDF#05-0586), CaSO
4 (Anhydrite, PDF#37-1496), and KCl (Sylvite, PDF#41-1476). Based on the X-ray diffraction (XRD) results, it can be observed that the fly ash used in this study exhibits minimal differences compared to fly ash generated from general municipal waste incineration.
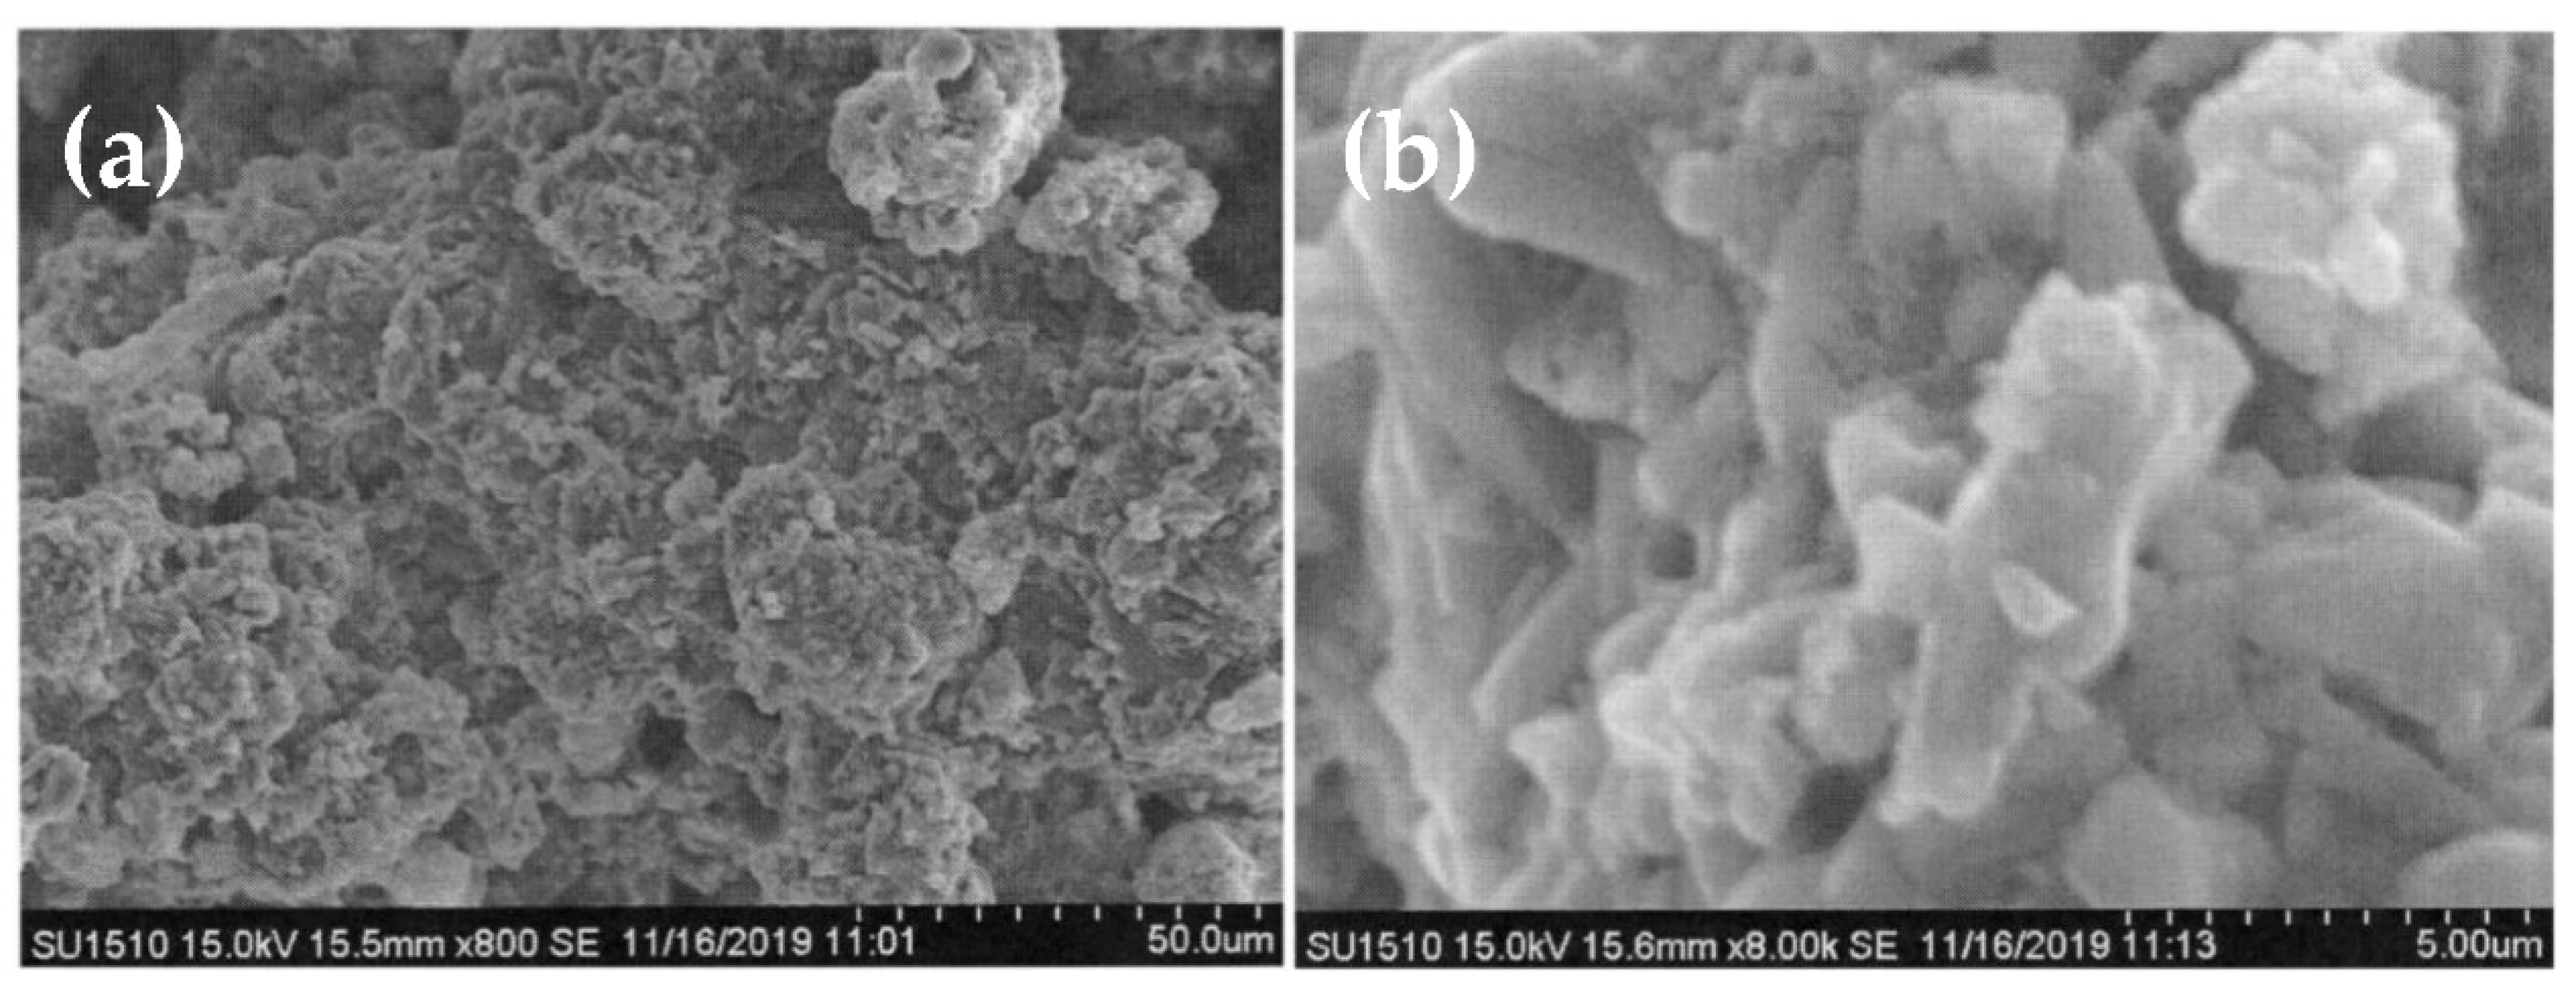
SEM images at different magnifications, as illustrated in
Figure 4a,b, depict the surface morphology of fly ash particles in their original state.
Figure 4a displays the SEM image of the fly ash sample at 800 times magnification, revealing conglomerates of larger fly ash particles composed of numerous smaller particles with sizes ranging approximately in the tens of micrometers. These larger particles exhibit a multi-layered structure, indicative of agglomerates rather than individual primary particles. The loose stacking of these large particles suggests a lack of strong bonding between them. The irregular surface topography of these particles results from their formation through the gradual aggregation of acidic high-temperature flue gas (containing heavy metals, organic compounds, etc.) generated during waste incineration, followed by the introduction of alkaline agents in the gas treatment system.
Increasing the SEM magnification to 8000 times in
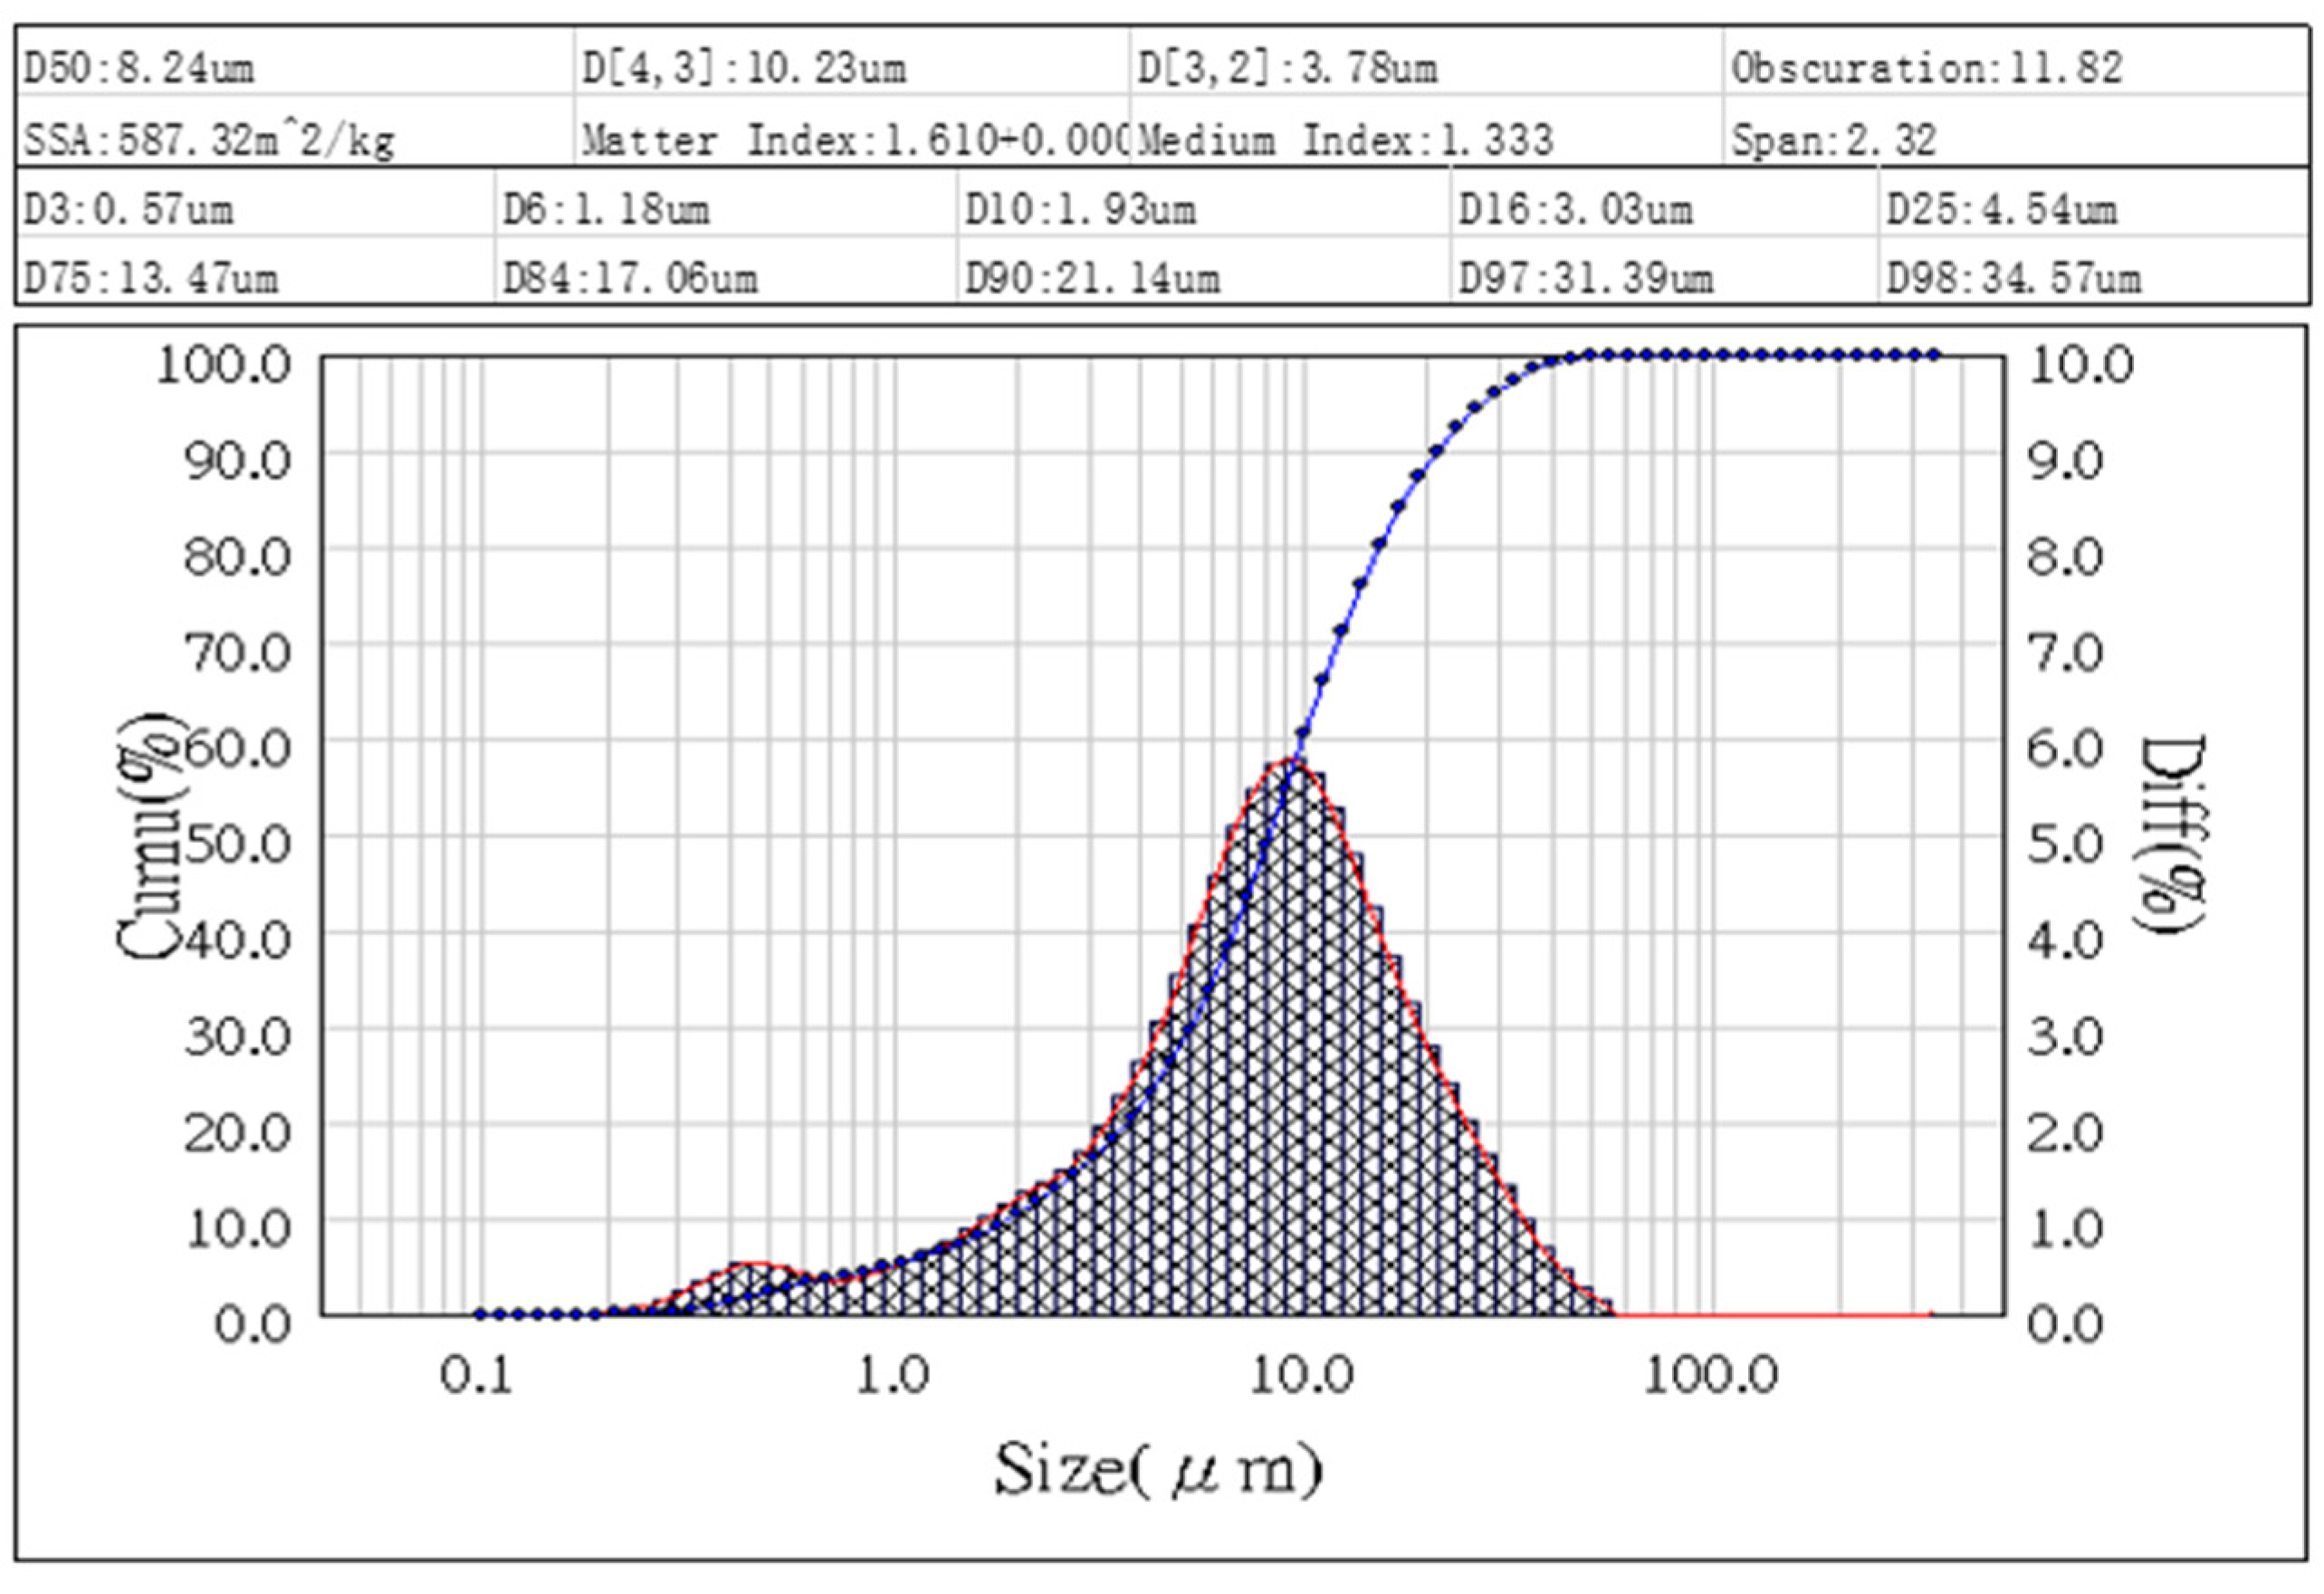
Figure 4b allows for clear visibility of the smaller fly ash particles on the surface of the larger particles. These smaller particles exhibit sizes ranging from approximately 1 to 10 micrometers and possess a more angular and disordered shape. Previous studies have reported a typical particle size range of 10-50 micrometers for fly ash, although larger fly ash particles up to 300 micrometers in size have been observed. The results of laser particle size analysis conducted on the fly ash samples are presented in
Figure 5. The D50 value, representing the median particle size, is determined to be 8.24 micrometers. The particle size distribution of the fly ash sample ranges from approximately 0.67 micrometers to 34.57 micrometers, as depicted in the graph. These findings align with the observations from the SEM analysis in
Figure 2, providing further evidence of a diverse range of particle sizes present in the fly ash sample.
Figure 3.
XRD analysis of MSWI fly ash sample.
Figure 3.
XRD analysis of MSWI fly ash sample.
Figure 4.
SEM analysis of MSWI fly ash samples (a) 800x (b) 8,000x.
Figure 4.
SEM analysis of MSWI fly ash samples (a) 800x (b) 8,000x.
Figure 5.
laser particle size analysis of fly ash samples.
Figure 5.
laser particle size analysis of fly ash samples.
3.2. Cold Sintering Process Pre-treatment
In order to enhance the energy efficiency of cold sintering and promote the uniformity of fly ash, a pre-processing step was employed in this study. The fly ash powder underwent a series of treatments, including a 24-hour drying process, a 24-hour ball milling process, and a two-stage sieving process using 50 mesh and 150 mesh screens. The pre-treatment fly ash samples were then subjected to laser particle size analysis and SEM analysis.
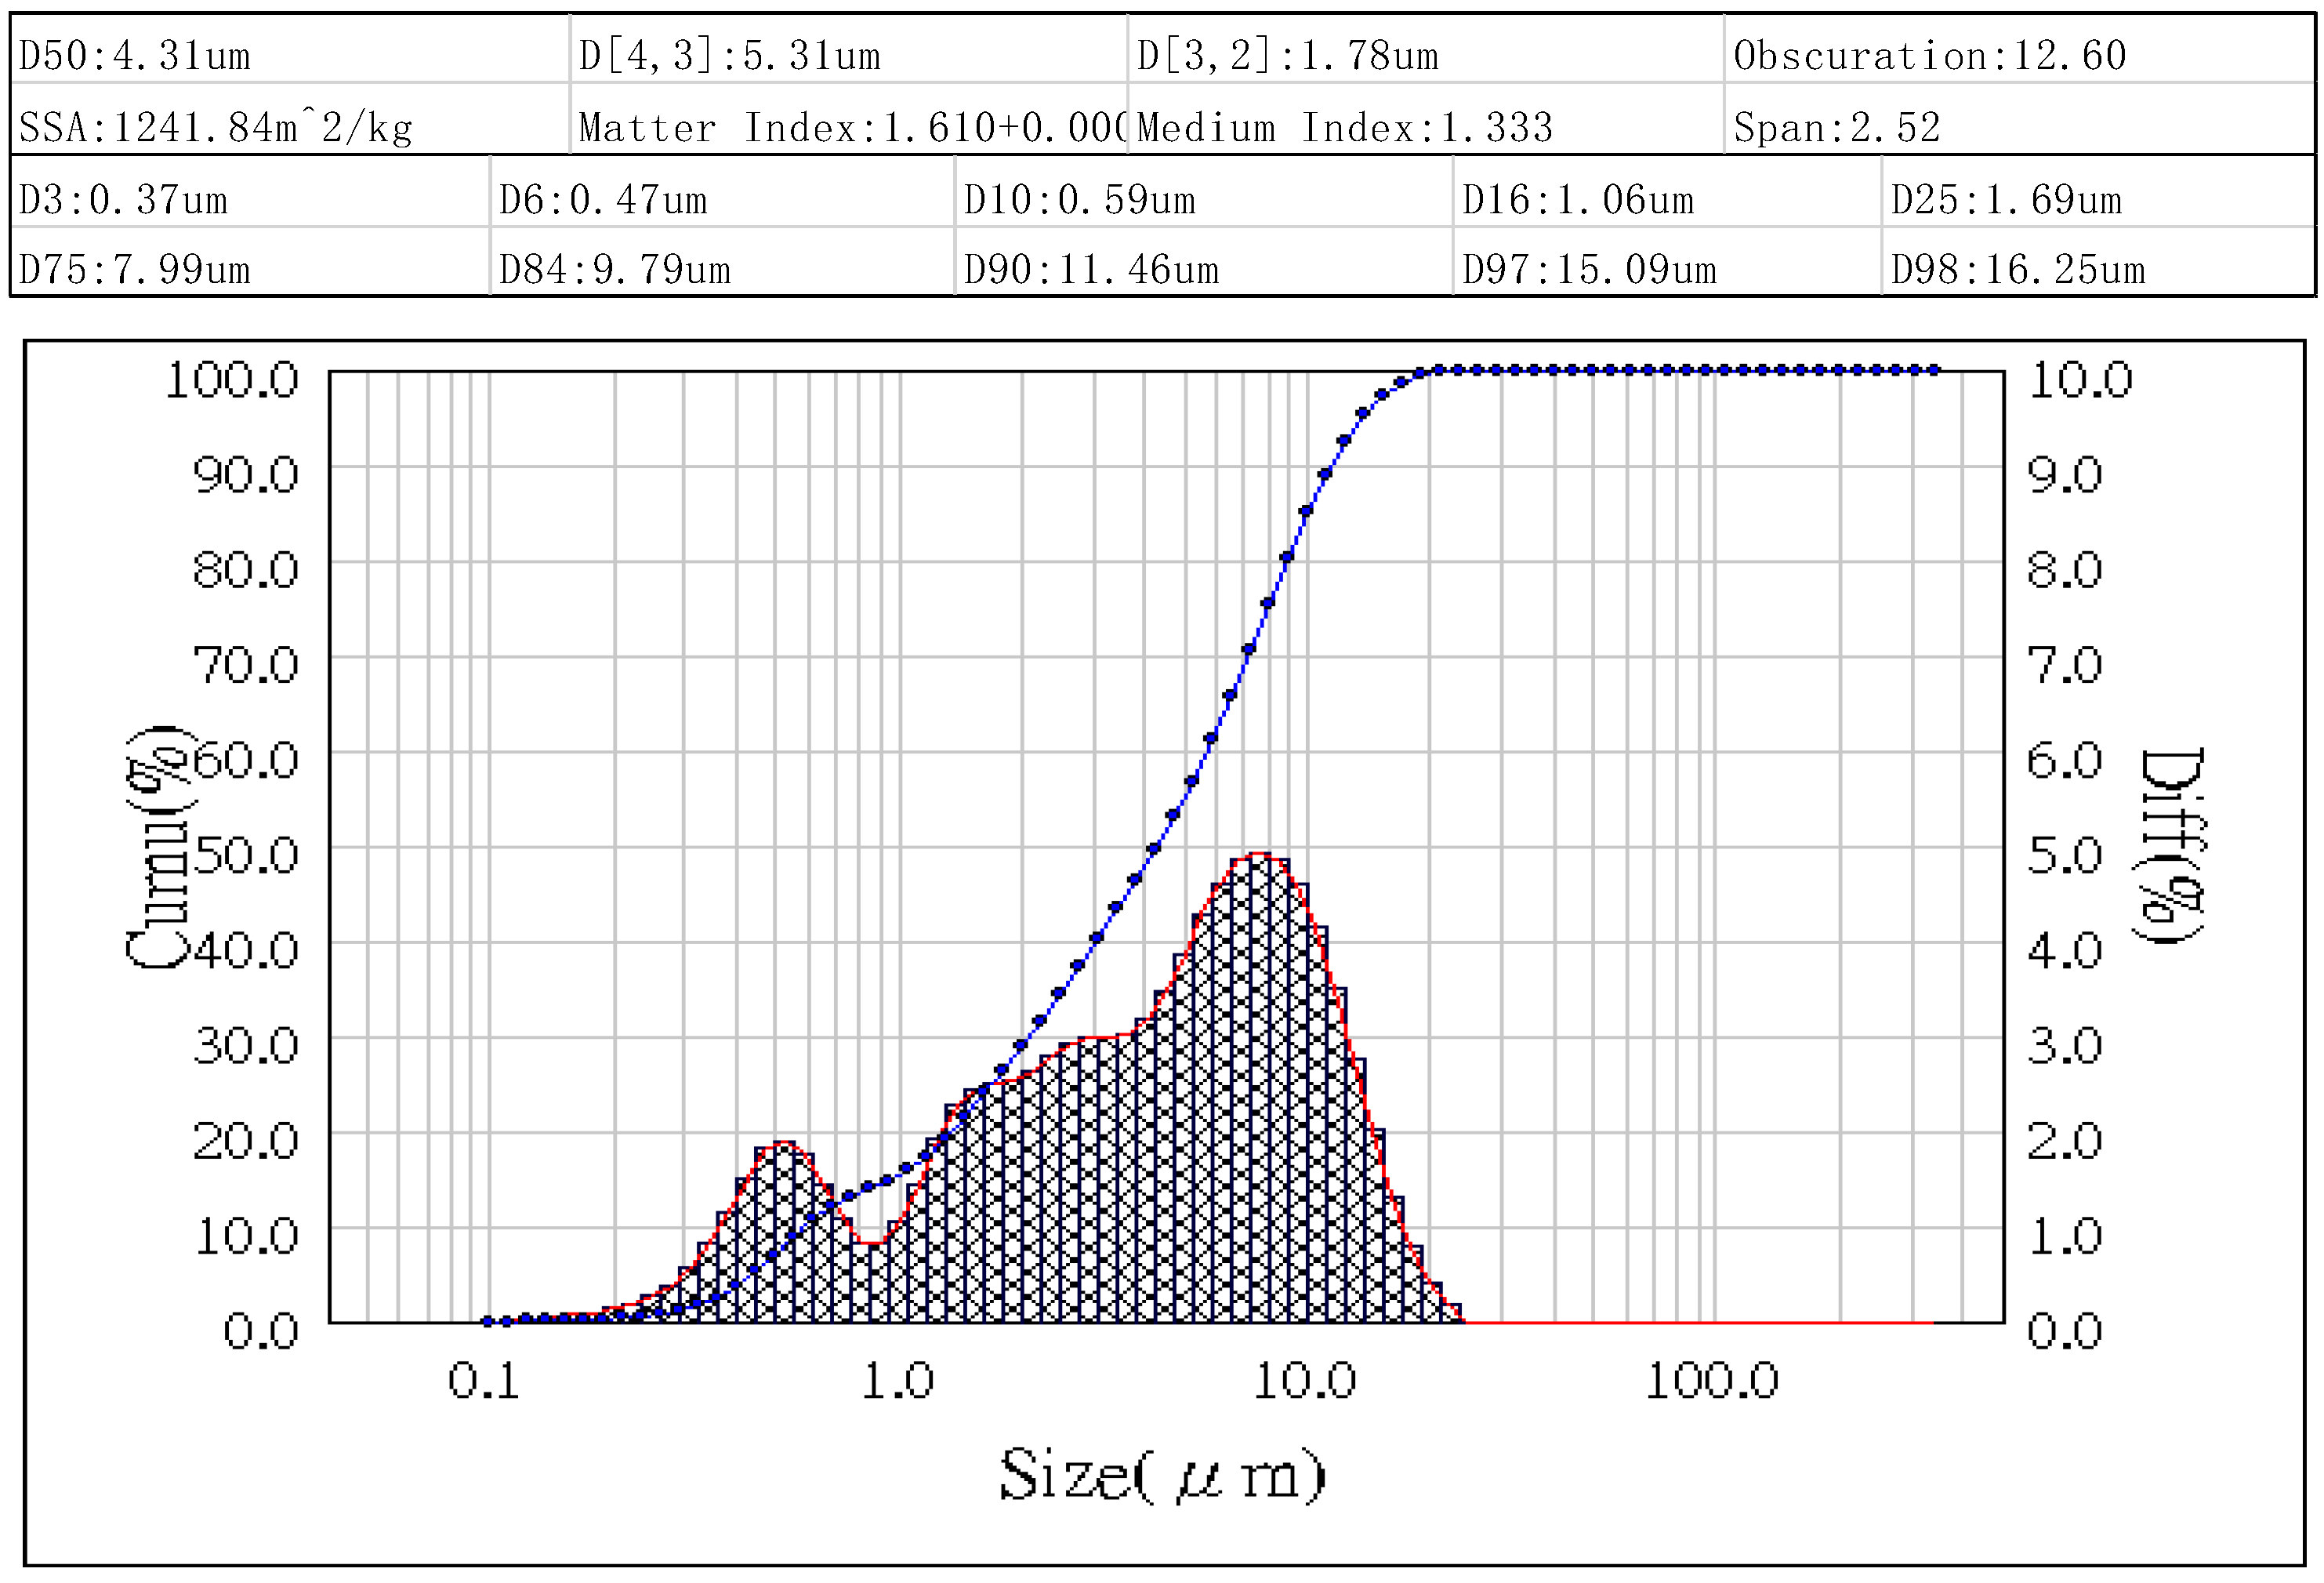
Oversized fly ash particles require more energy for densification during the sintering process. Conversely, undersized fly ash particles are prone to move into the gaps between molds during cold sintering, leading to a shortened mold lifespan. In cases where the particle size distribution curve exhibits a bimodal distribution, smaller particles can fill the voids between larger particles, facilitating subsequent densification processes. The particle size distribution analysis, as presented in
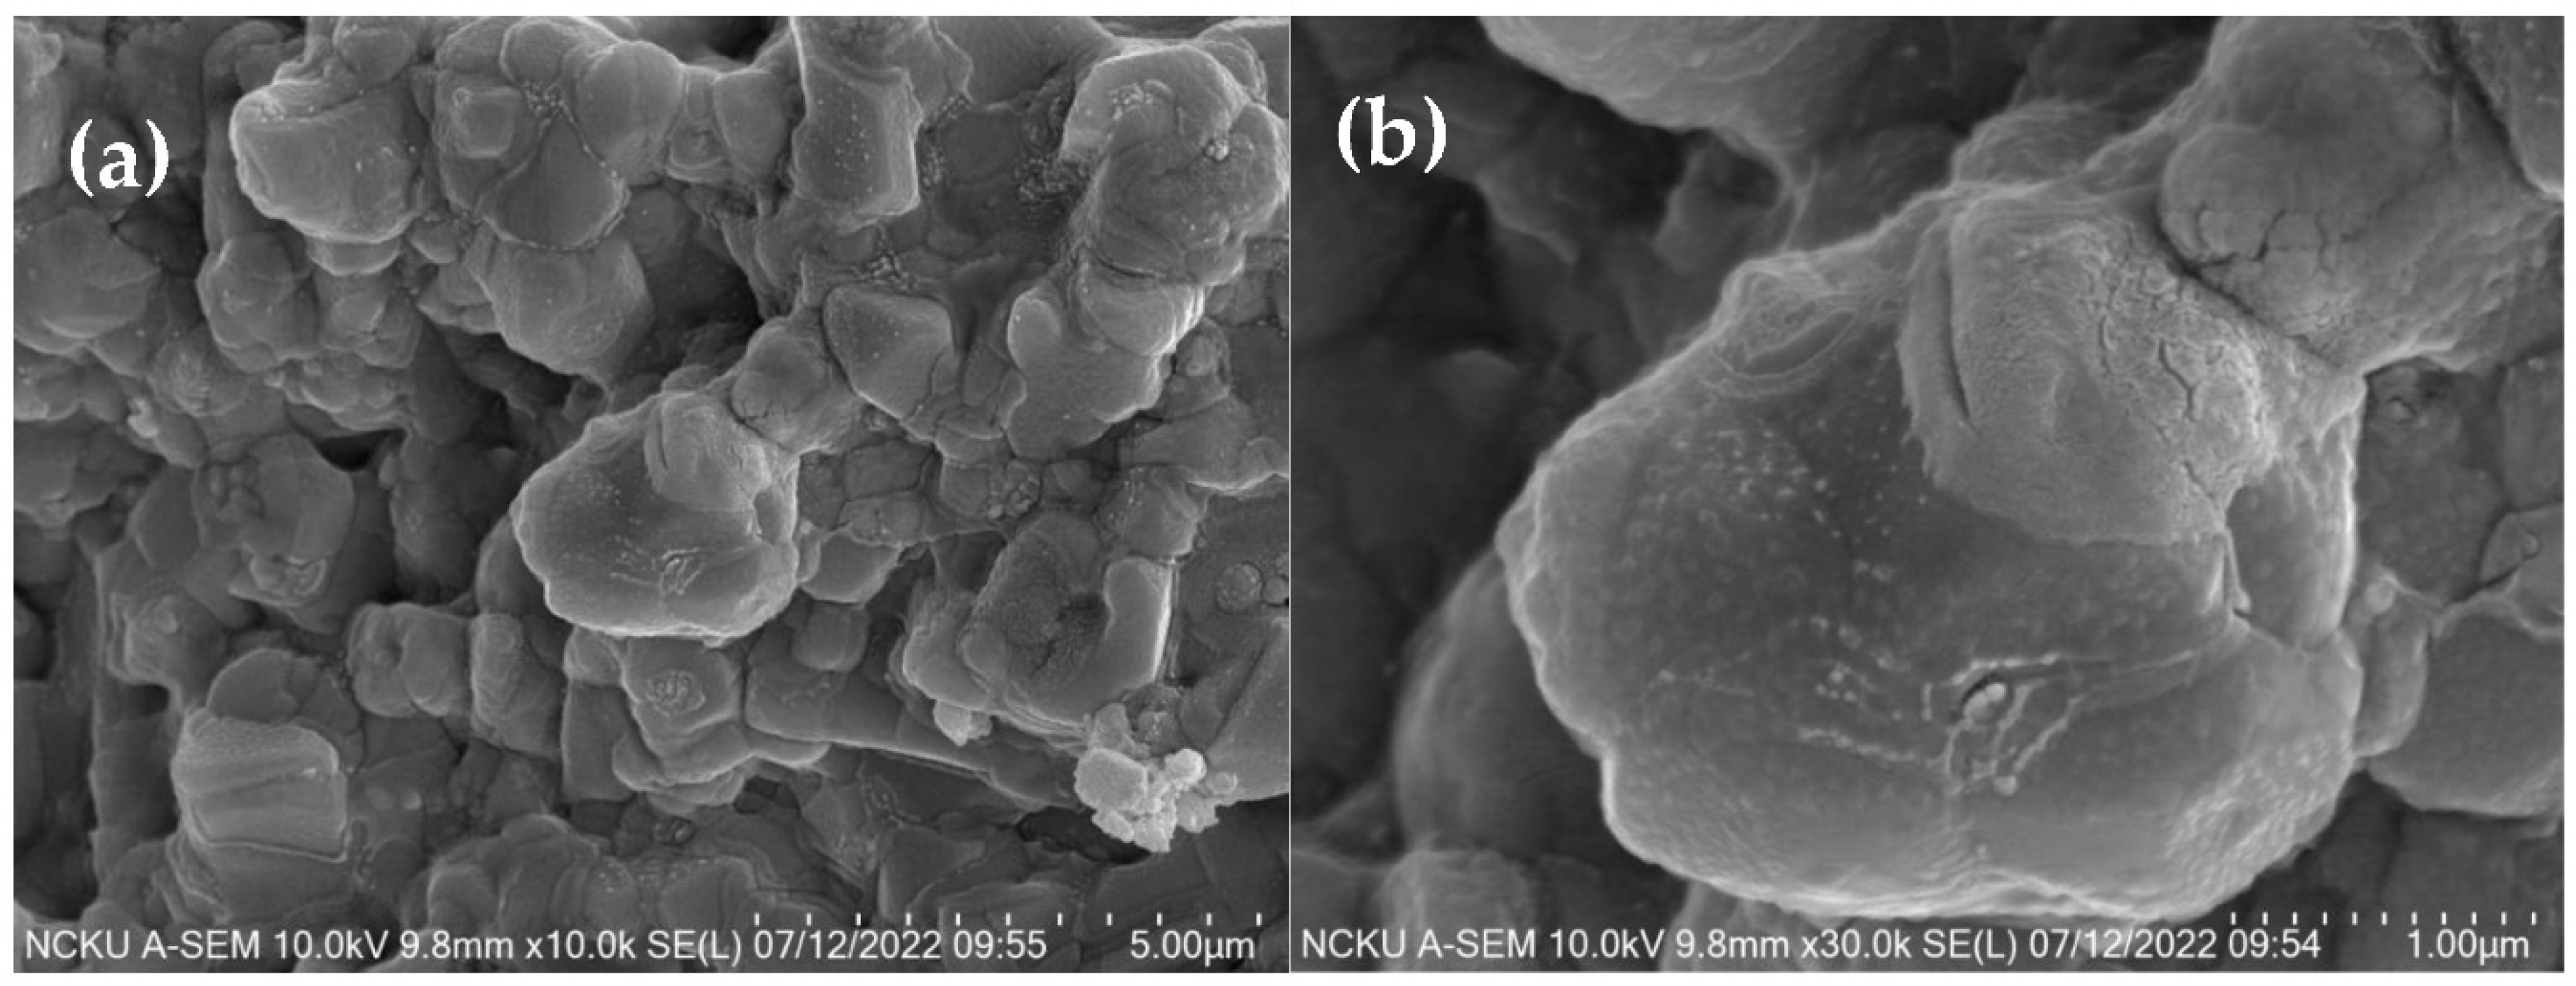
Figure 7, indicates a notable reduction in the D50 value from 8.24 micrometers to 4.31 micrometers after the pre-processing steps, representing a decrease of 47.7%. Moreover, the particle size distribution range narrowed from 0.67-34.57 micrometers in the original fly ash sample to 0.31-16.25 micrometers after the pre-processing. SEM images
Figure 6a,b at a magnification of 10,000 times and 30,000 times demonstrate well-defined grain morphology and grain boundaries in the pre-treatment fly ash samples. Notably, the grain edges appear smoother and exhibit reduced angularity compared to the fly ash samples without pre-processing. The sequential treatments of drying, ball milling, and sieving have effectively refined the particle size distribution of the fly ash, resulting in smaller and more uniform particles.
The SEM analysis further verifies the improved surface characteristics of the pre-treatment fly ash, suggesting its potential for enhanced performance in various applications. The optimized particle size distribution and refined morphology attained through the pre-processing steps offer promising prospects for the utilization of fly ash in diverse fields.
3.3. Taguchi Experiment and Optimization of Cold Sintering Process
In this study, we employed an L
16(4
5) Taguchi orthogonal array to investigate the effects of five control factors, namely sintering temperature, uniaxial pressure, sintering time, water additives, and sodium carbonate additives, on the immobilization of heavy metals during the CSP. The objective was to determine the optimal conditions for effective immobilization of heavy metals in the CSP.
Table 1. presents the L
16(4
5) Taguchi orthogonal array used in the experimental design, while
Table 2. displays the levels of the control factors within the orthogonal array.
The complete results of the L
16(4
5) orthogonal array experiment are revealed in
Table 5. The first column, labeled EXP., represents the experiment numbers, comprising 16 sets of different combinations of factor levels. Cd(1), Cd(2), and Cd(3) represent the cadmium concentrations (mg/L) measured in the TCLP solution after the fly ash underwent CSP under specific control factor conditions. The number in parentheses denotes the replicate experiment number. The concentration of cadmium in the solution serves as the quality characteristic, indicating the extent of cadmium leaching and serving as an indicator of the effectiveness of heavy metal immobilization. The Cd AVE. represents the arithmetic average of Cd(1), Cd(2), and Cd(3), and it will be utilized in the subsequent calculations of the factor response table/graph. The symbol S
n represents the standard deviation of Cd(1), Cd(2), Cd(3), and Cd AVE., which is calculated using equation (1). In this equation, y
i represents the quality characteristic,
represents the average value of the quality characteristic, and n represents the number of individual elements. Unlike the typical formula for standard deviation calculation, equation (1) uses n as the denominator instead of the more common n-1. Under this condition, the sample standard deviation tends to be equal to the population standard deviation. However, regardless of the specific calculation method, the standard deviation represents the degree of dispersion of n data points.
In the Taguchi method, the S/N ratio serves as a quality index, where a higher S/N ratio indicates better quality. In this study, the objective is to minimize the leaching of heavy metals during the TCLP testing, thus adopting the "smaller the better" characteristic for ideal functionality. The S/N ratio calculation for the "smaller the better" characteristic is expressed by equation (2), where
represents the mean value and S
n represents the standard deviation.
Table 6 presents the factor response table of the orthogonal array experiment, while
Figure 8
displays the factor response graph. The values in
Table 6. represent the S/N ratio contributions of
each control factor at different levels, calculated based on the data from
Table 1 and
Table 5. By
recording the S/N ratio contributions of each control factor at different levels, the S/N ratio factor
response graph can be plotted. Additionally, by subtracting the maximum and minimum values of
the S/N ratio contributions for each control factor at different levels, the Range values in
Table 6. are
obtained. These Range values indicate the ranking of the impact of each control factor on the S/N
ratio.
Table 6 and
Figure 8 results indicate the ranking of the impact of control factors on the S/N ratio
from highest to lowest as follows: sintering temperature, Na
2CO
3 additives, water additives, sintering
time, and uniaxial pressure.
Table 7 presents the variability analysis of the experimental results from
Table 5.
Table 7 in the context of analysis of variance (ANOVA), SS (Sum of Squares) represents the sum
of squared differences between each variation vector and the mean. The Total Sum of Squares (SST)
is defined as follows:
Where n is the number of columns in the orthogonal array and r is the number of experimental replications. The sum of squares for the factor effects (SS
A) can be expressed as:
Where L
A is the levels of control factor. The sum of squares for error (SS
e) can be expressed as:
The definition of degrees of freedom (DOF) is that for a set of x samples, when x independent pieces of information can be provided, DOF = x - 1. The total degrees of freedom (DOF
T) can be expressed as:
The degrees of freedom for factor A (DOF
A) can be expressed as:
The degrees of freedom for error (DOF
e) can be expressed as:
Variance is defined as the SS) divided by the DOF. Taking the square root of this value yields the standard deviation. The relationship between these three measures can be summarized as follows:
When the number of sample approaches infinity, the F-value tends to approach 1. In finite samples, a larger F-value indicates that the numerator and denominator come from a smaller probability space within the sample, indicating a stronger impact of the factor effect. In practice, the F-value can be calculated as:
The denominator (S
y2) represents the total variance (V
T = S
T2) calculated from the original sample. The numerator (Sz
2) is the variance estimated from the "sample means" and multiplied by the factor m, resulting in the unaveraged original sample variance. By calculating the magnitude of the F-value, we can make preliminary judgments about the size of the effect of the factor. Furthermore, using a probability function, we can calculate the probability of obtaining an F-value greater than the observed F-value. The calculation can be done as follows:
DOFz represents the degrees of freedom for the numerator in the F-value calculation. It is equal to the total number of sample (n) divided by the factor m, minus 1. DOFy represents the degrees of freedom for the denominator in the F-value calculation.
Its purpose is to validate the correctness of the ranking of control factor impacts in the S/N factor response table/graph and to examine the significance of control factors in immobilizing heavy metals (whether they have a significant impact or not). The results of the variability analysis in
Table 7. confirm that the ranking of control factor impacts in
Table 6. and
Figure 8. is correct. Furthermore, by maximizing the S/N ratio, the optimal conditions for fly ash CSP in immobilizing heavy metals can be predicted as follows: sintering temperature: level 4 (300℃), uniaxial pressure: level 2 (10 tons), sintering time: level 2 (60 minutes), water additives: level 4 (25 wt%), Na
2CO
3 additives: level 4 (9 wt%). Additionally, an Additive Model can be utilized to calculate the S/N ratio and theoretical values of the quality characteristic for the optimal CSP conditions. A comparison can then be made between the calculated values and the actual experimental data.
After identifying the optimal conditions for CSP in immobilizing heavy metals using the Taguchi method, it is necessary to conduct confirmation experiments. These experiments involve comparing the actual experimental values obtained under the optimal CSP conditions with the theoretical values calculated using the additive model. This comparison aims to assess the accuracy and reliability of the empirical model in predicting the response variable.
Table 8 presents a comparison between the additive model calculated values and the average experimental values obtained from triple replications under the optimal CSP conditions for both the quality characteristic and the S/N ratio. In terms of the quality characteristic, which represents the cadmium leaching concentration of the CSP-treated fly ash blocks after 18 hours of TCLP testing, there is a difference of 0.085 mg/L between the experimental values and the additive model calculated values. For the S/N ratio, there is a difference of 0.615 dB. The slight differences between the additive model theoretical values and the experimental values can be attributed to several possible reasons identified by our team. Firstly, it is possible that certain control factors with significant effects were overlooked during the initial selection process. For example, the inclusion of more effective solid additives or solution additives that facilitate the CSP process might have improved the results. Secondly, there may be interactions among the existing control factors that were not accounted for, leading to deviations in the predictions of the empirical model. Finally, there could be noise factors present in the experimental conditions of the existing control factors that cannot be ignored, contributing to the observed discrepancies.
Based on the results from the factor response graphs/tables and the variance analysis, it can be observed that under the current selection of control factors and their respective levels, the optimal CSP conditions (sintering temperature: 300℃, uniaxial pressure: 10 tons, sintering time: 60 minutes, water additives: 25 wt%, Na2CO3 additives: 9 wt%) still demonstrate a relatively good effect in immobilizing cadmium. Additionally, within a certain range, the empirical model can be used to make predictions for the response variable with reasonable accuracy.
Triple replicate cold sintering experiments were conducted using the optimal CSP conditions for fly ash, and the resulting sintered blocks were subjected to TCLP testing, along with the original fly ash sample. The results are shown in
Table 9. In this study, cadmium was used as an indicator for the leaching concentration of heavy metals. The results indicate that under the optimal CSP conditions, there was a significant reduction in the leaching concentrations of cadmium (77.71%), lead (21.14%), zinc (42.37%), and chromium (99.99%) compared to the original fly ash sample. It is noteworthy that lead, zinc, and chromium, despite being heavy metals, exhibited different outcomes under the same solidification conditions. Based on the compositional analysis results in
Table 3 and
Table 4, it can be inferred that the high initial content of lead and zinc in the fly ash compared to cadmium and chromium may have exceeded the solidification limits of CSP or there might have been certain factors during the CSP process that hindered the effective solidification of lead and zinc.
3.4. Analysis of properties and solidification mechanism of fly ash CSP blocks
The fly ash ceramic blocks prepared under the optimal conditions of CSP at a temperature of 300°C, a uniaxel pressure of 10T, sintering time 60 minutes, water additives of 25 wt%, and a sodium carbonate (Na
2CO
3) addition of 9 wt% are shown in
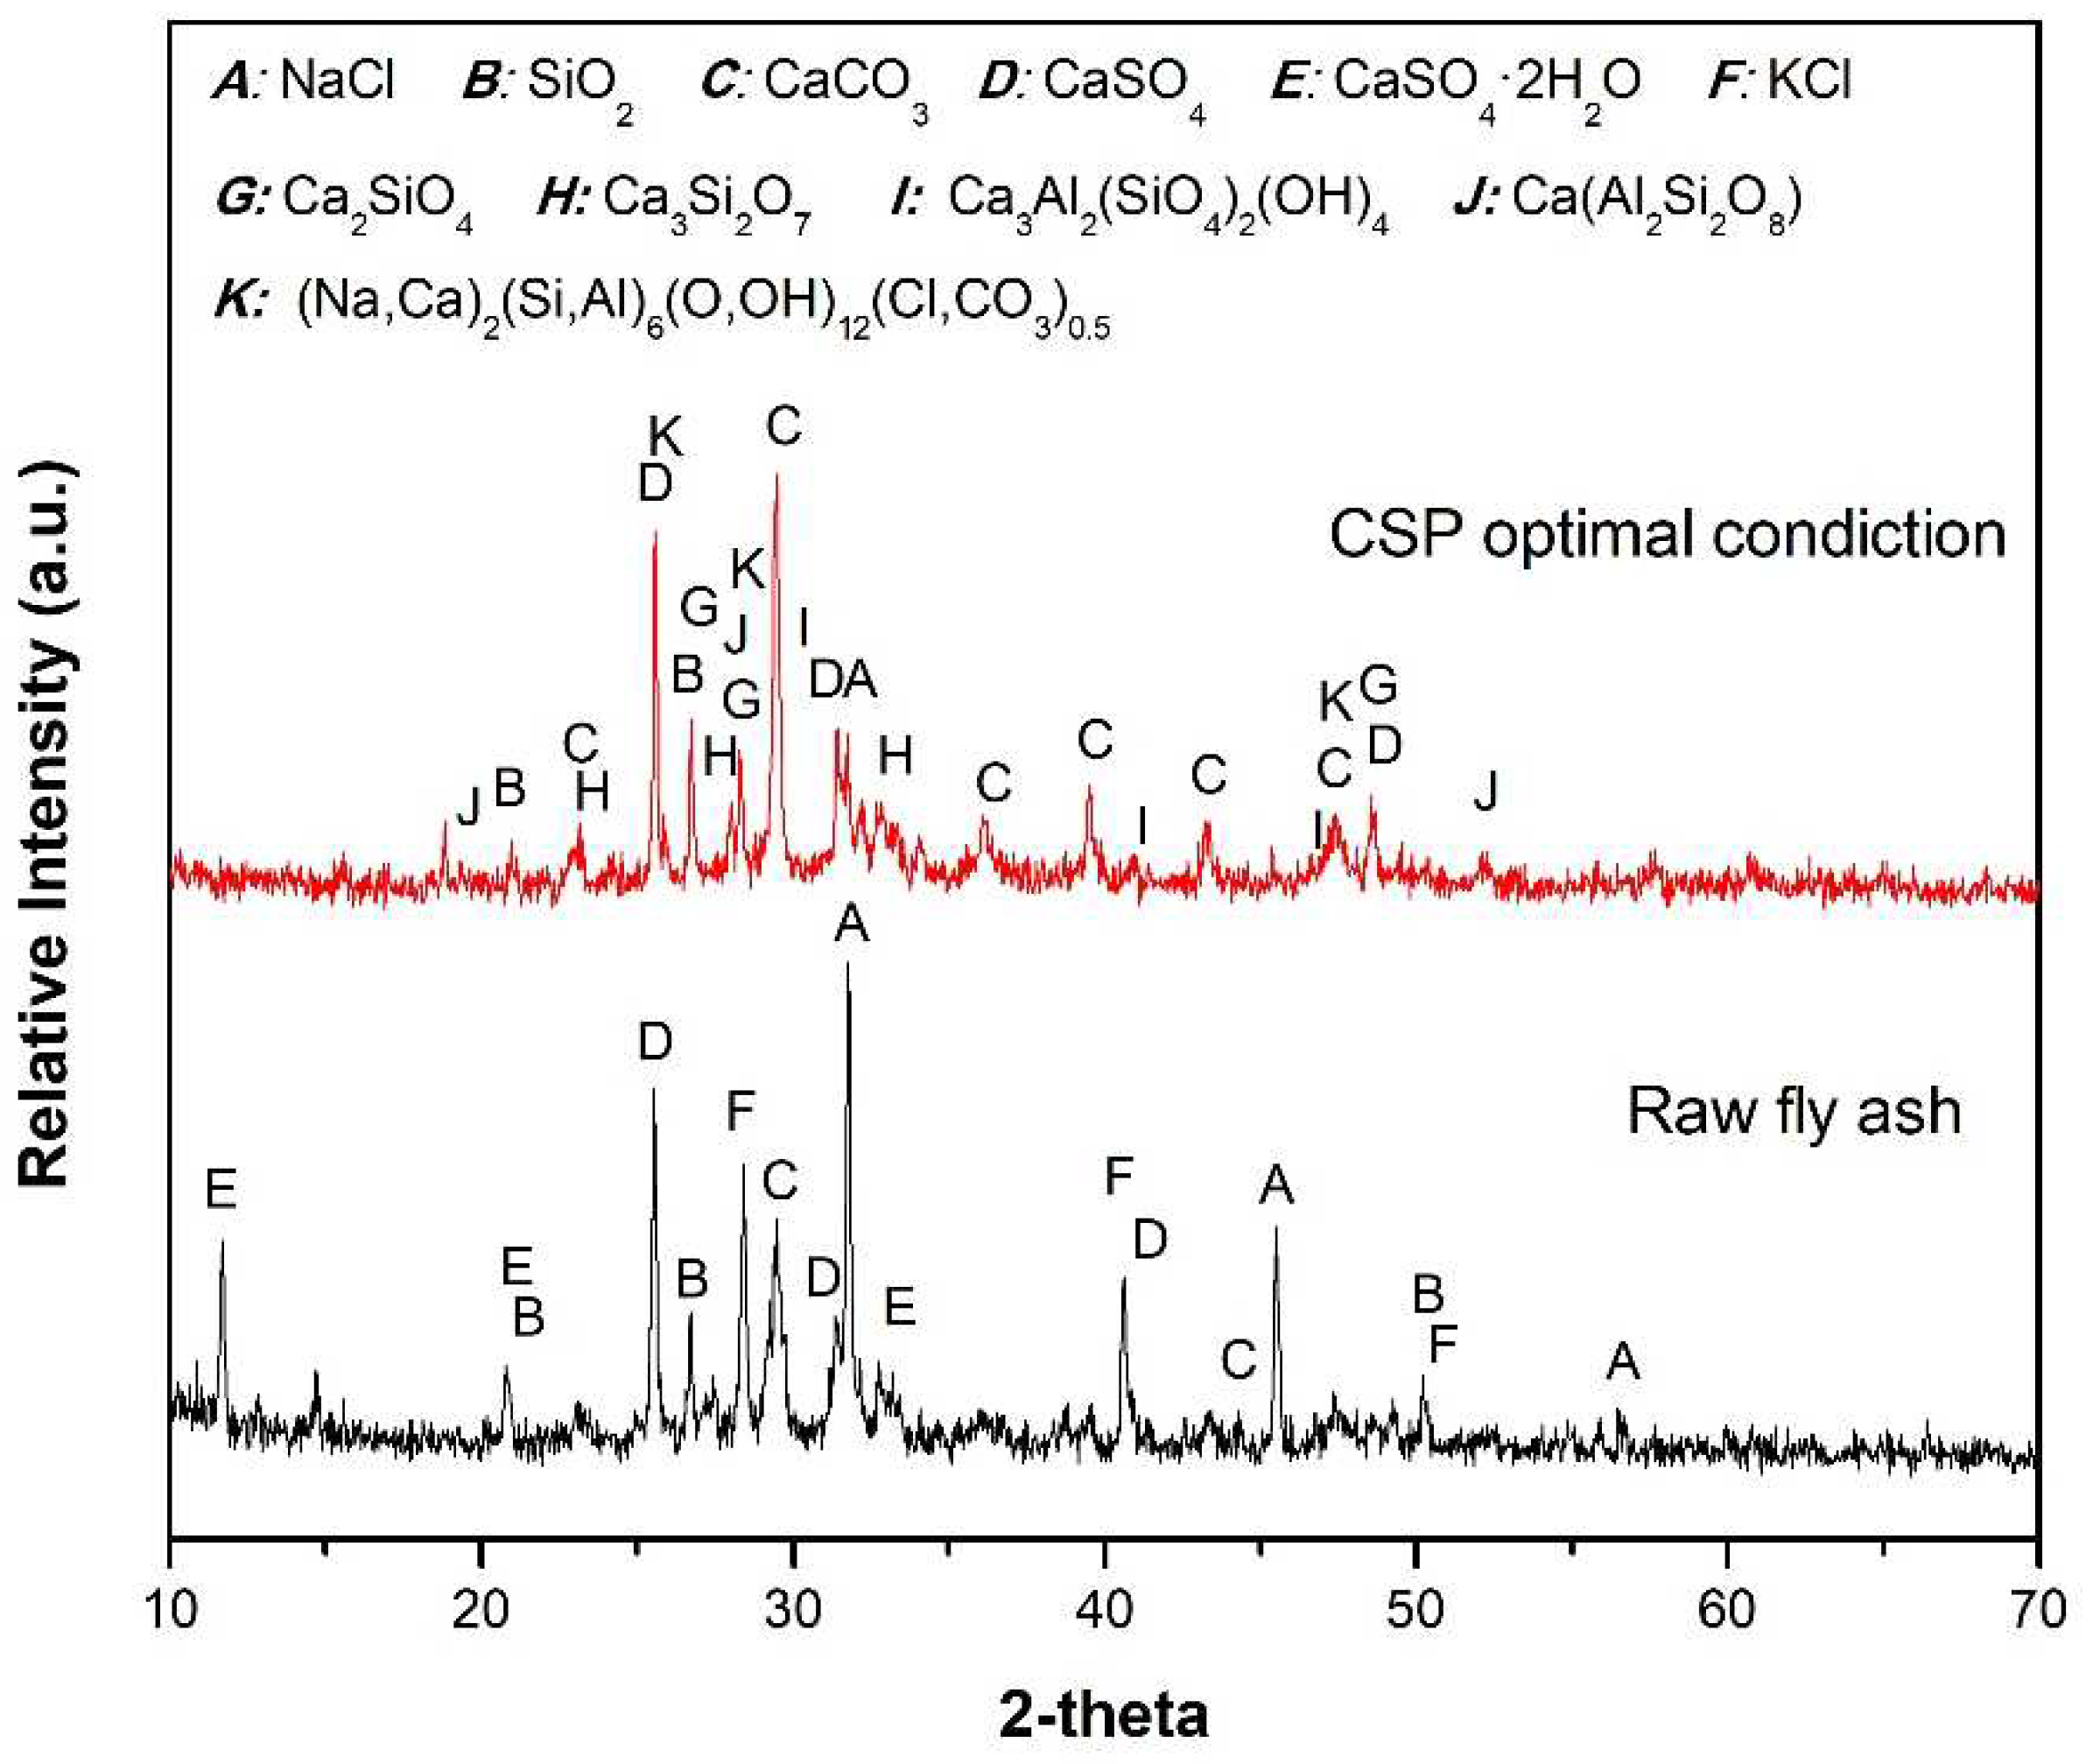
Figure 9, along with the XRD analysis results of the fly ash sample. The main phases identified in the fly ash include halite (NaCl, PDF#05-0628), quartz (SiO
2, PDF#46-1045), calcite (CaCO
3, PDF#05-0586), anhydrite (CaSO
4, PDF#37-1496), gypsum (CaSO
4·2H
2O, PDF#33-0311), and sylvite (KCl, PDF#41-1476). During the CSP process, where multiple factors such as temperature, pressure, time, and liquid composition are simultaneously involved, the peak intensities of NaCl and KCl grad ually decrease, while new phases such as calcium silicate (Ca
2SiO
4, PDF#31-0302), rankinite (Ca
3Si
2O
7, PDF#22-0539), hydrogrossular (Ca
3Al
2(SiO
4)
2(OH)
2, PDF#420570), anorthite (Ca(Al
2Si
2O
8), PDF#86-1716), and marilite ((Na,Ca)
2(Si,Al)
6(O,OH)
12(Cl,CO3)
0.5, PDF#31-1279) begin to appear. Based on the formation of secondary phases observed in
Figure 9 and the effectiveness of heavy metal immobilization of fly ash under the optimal CSP conditions shown in
Table 9, it can be inferred that the secondary phases generated during the CSP process have the ability to inhibit the leaching of internal heavy metals during the TCLP test to some extent.
Under the combined influence of temperature, pressure, time, liquid composition, and sodium carbonate addition, the overall structure during the CSP process exhibits a high level of density.
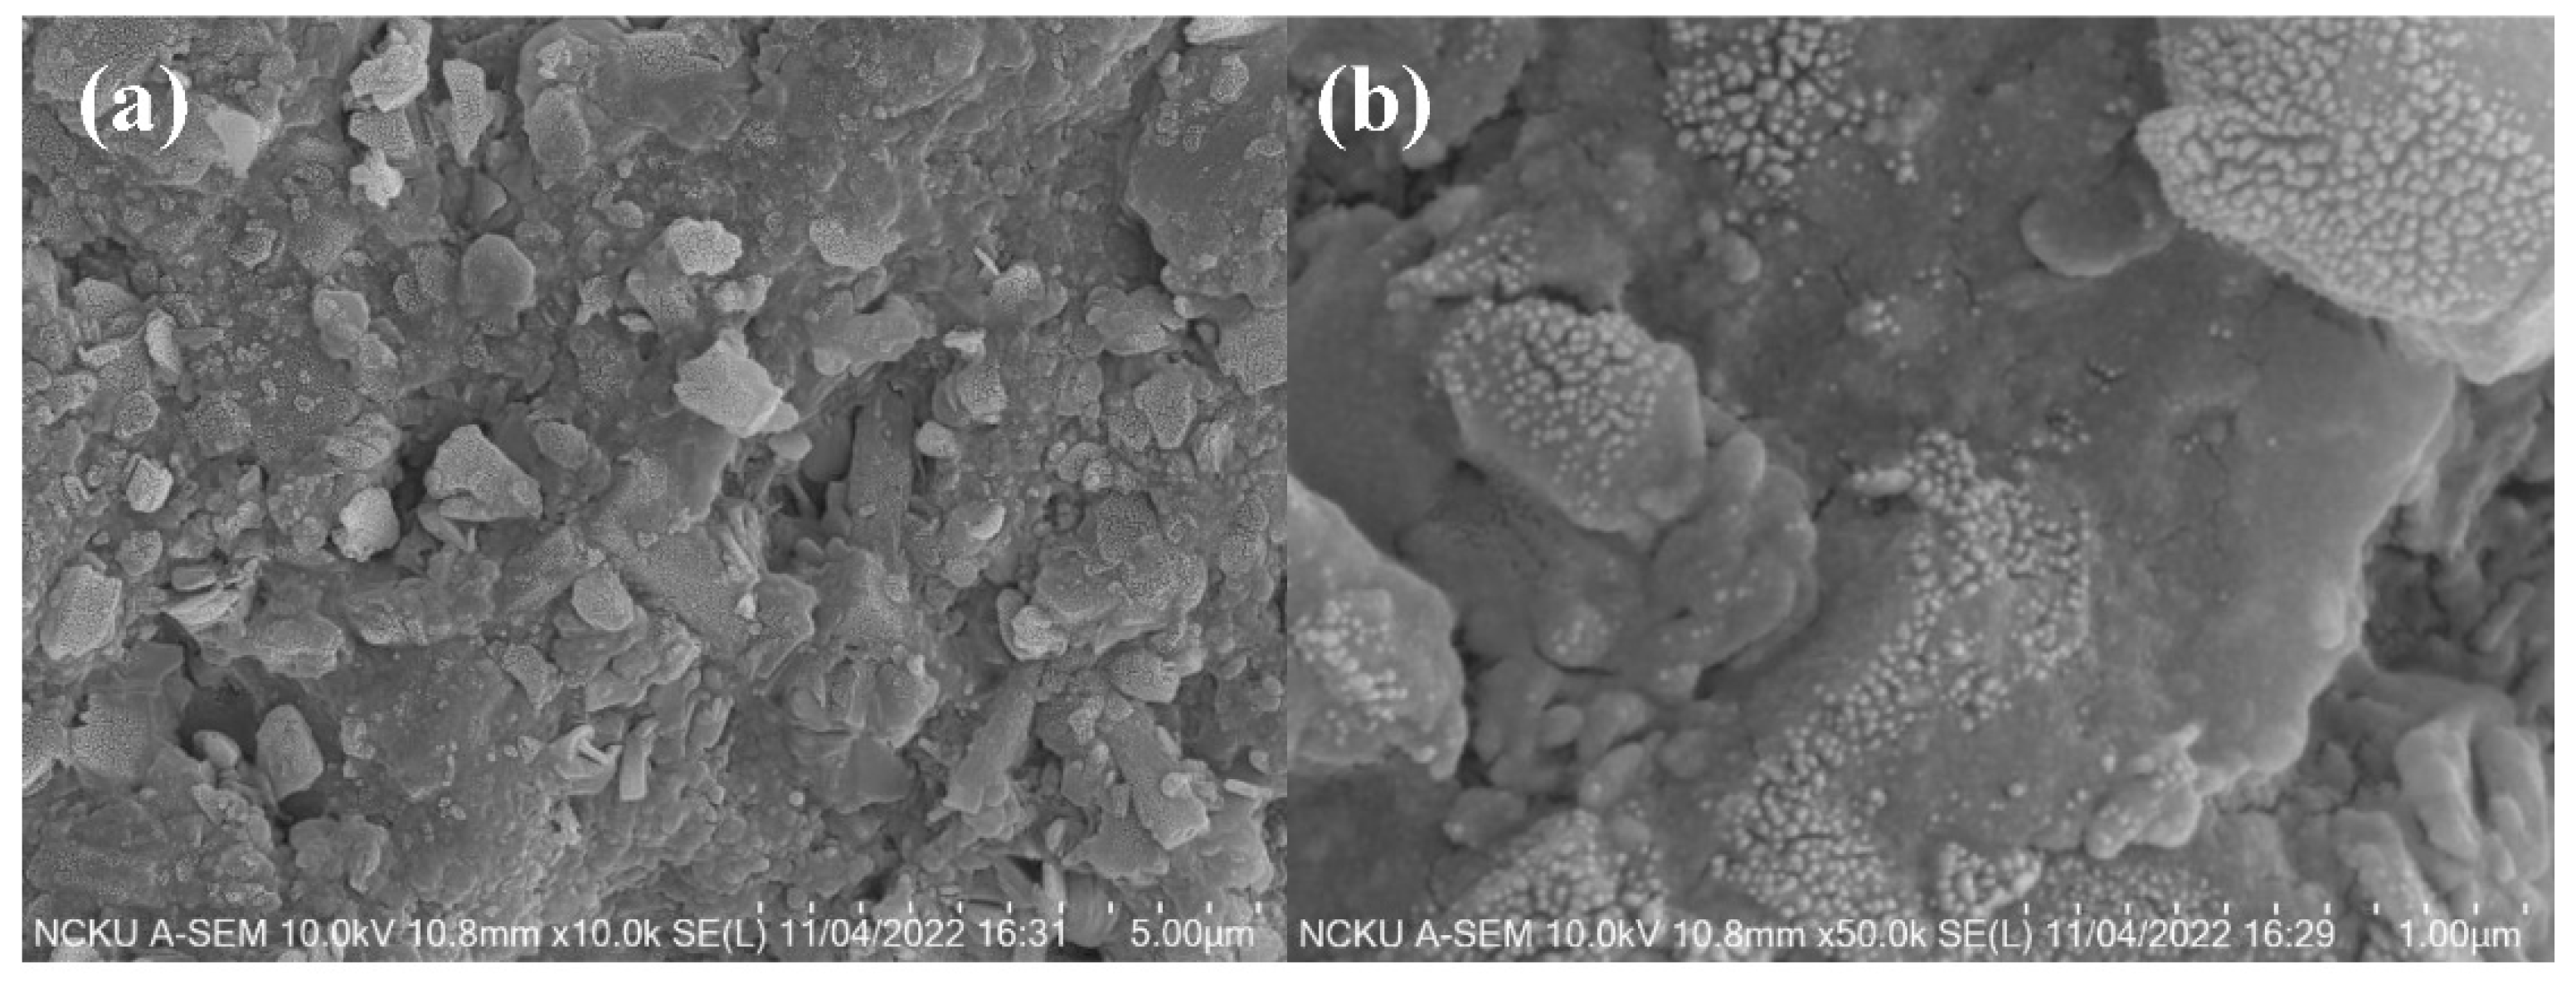
Figure 10a illustrates the sintered blocks of fly ash under the optimal CSP conditions, as observed by SEM at a magnification of 10,000 times. Compared to the untreated fly ash sample in
Figure 6, the overall structure shows a significant improvement in density, with some small pores visible on the surface leading to the interior. From a CSP perspective, these small pores are likely remnants of water evaporating from the blocks at temperatures above the boiling point during the CSP. In
Figure 11a at the top left corner, it is evident that the fly ash ceramic blocks produced under the optimal CSP conditions display sharp fracture surfaces with distinct angular features. This indicates that the crystals possess specific growth directions during the crystallization process, indirectly supporting the presence of secondary phases observed in the XRD results.
Figure 11b reveals the intertwined growth patterns within the internal structure of the fly ash after undergoing the optimal CSP conditions. This suggests that when the fly ash sample is mixed with sodium carbonate and water, and subjected to the entire CSP process, reactions such as dissolution, precipitation, and the formation of new secondary phases occur between the fly ash particles. As a result, a dense and mutually enclosed structure is formed.
The SEM images captured in
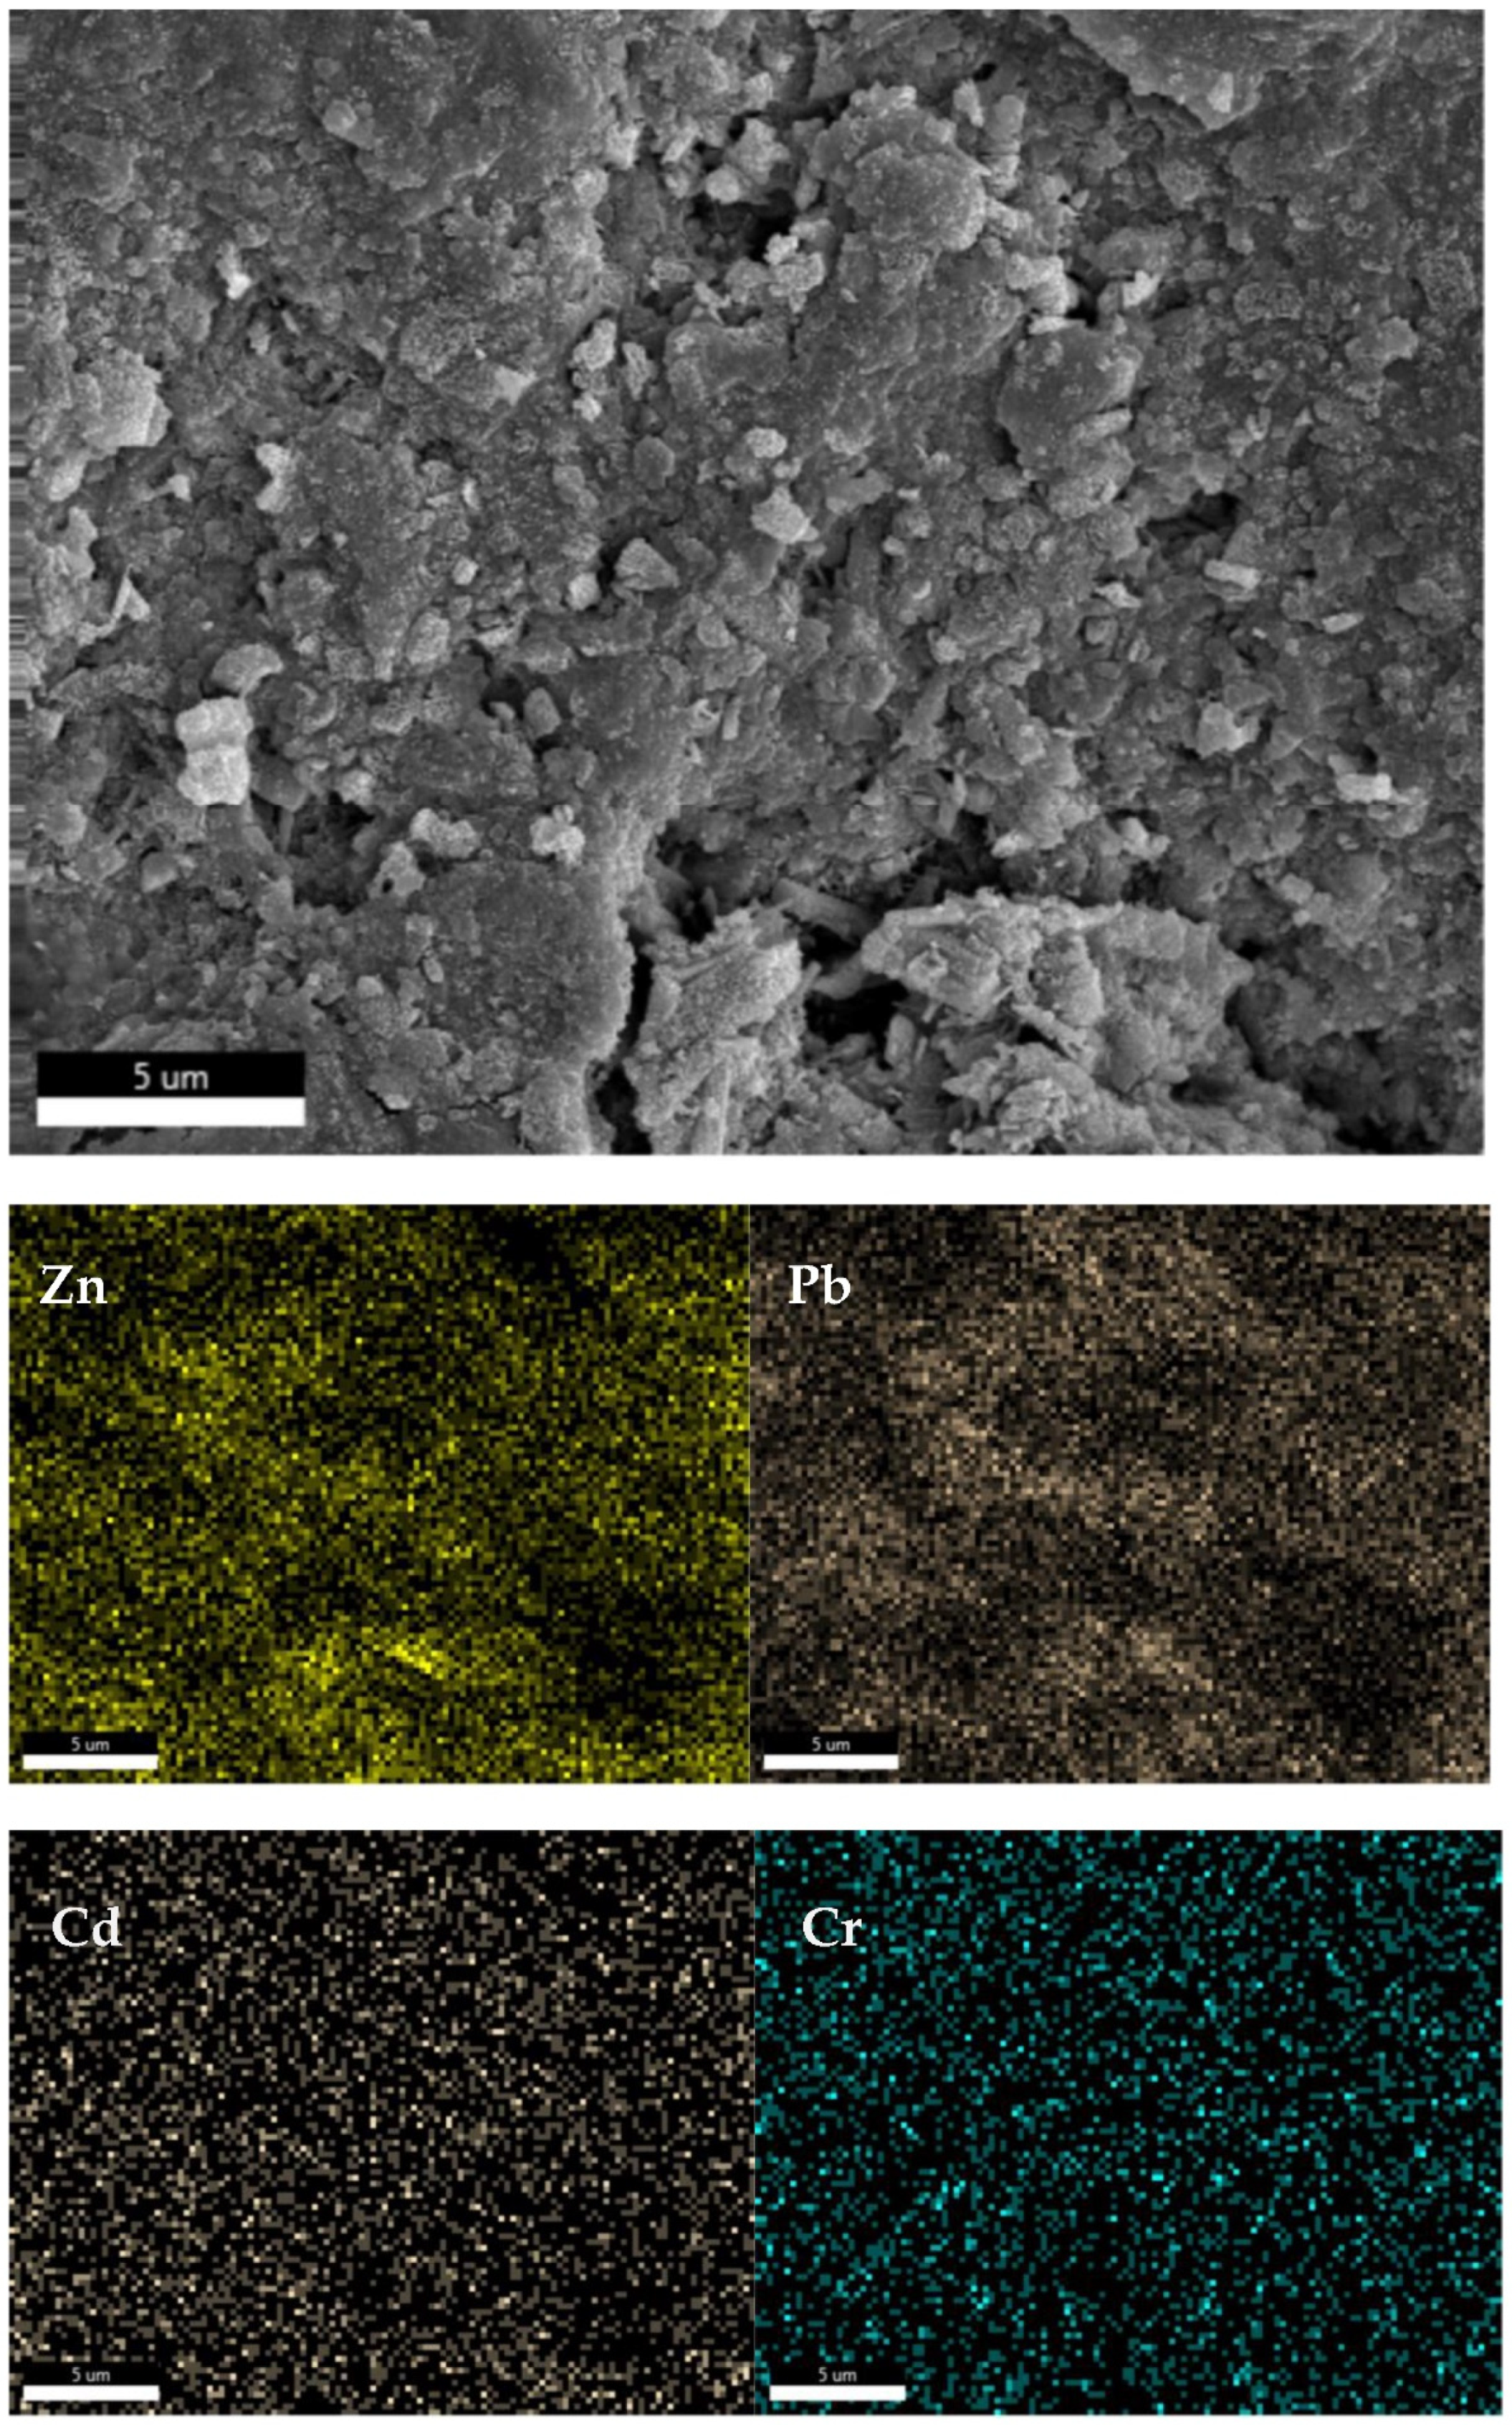
Figure 12 clearly reveal the presence of cavities at the bottom center of the image, which are formed when water escapes from the fly ash ceramic blocks under high temperatures and pressures. Upon examining the distribution of various elements on the surface of the blocks, it is evident that the concentrations of zinc and lead are relatively non-uniform, with significantly higher concentrations observed in the vicinity of the cavities at the bottom of the image. This suggests that during the CSP process, a portion of the lead and cadmium present in the fly ash dissolves in the added water. As the water gradually leaves the fly ash blocks under high temperature and pressure, these elements are transported to the surface of the blocks, resulting in poor solidification efficiency.
This phenomenon may be attributed to the fact that both zinc and lead are amphoteric metals. When the fly ash initially combines with water, the resulting solution exhibits strong alkalinity with a pH above 10. Consequently, lead, zinc, and other soluble substances are leached out together.
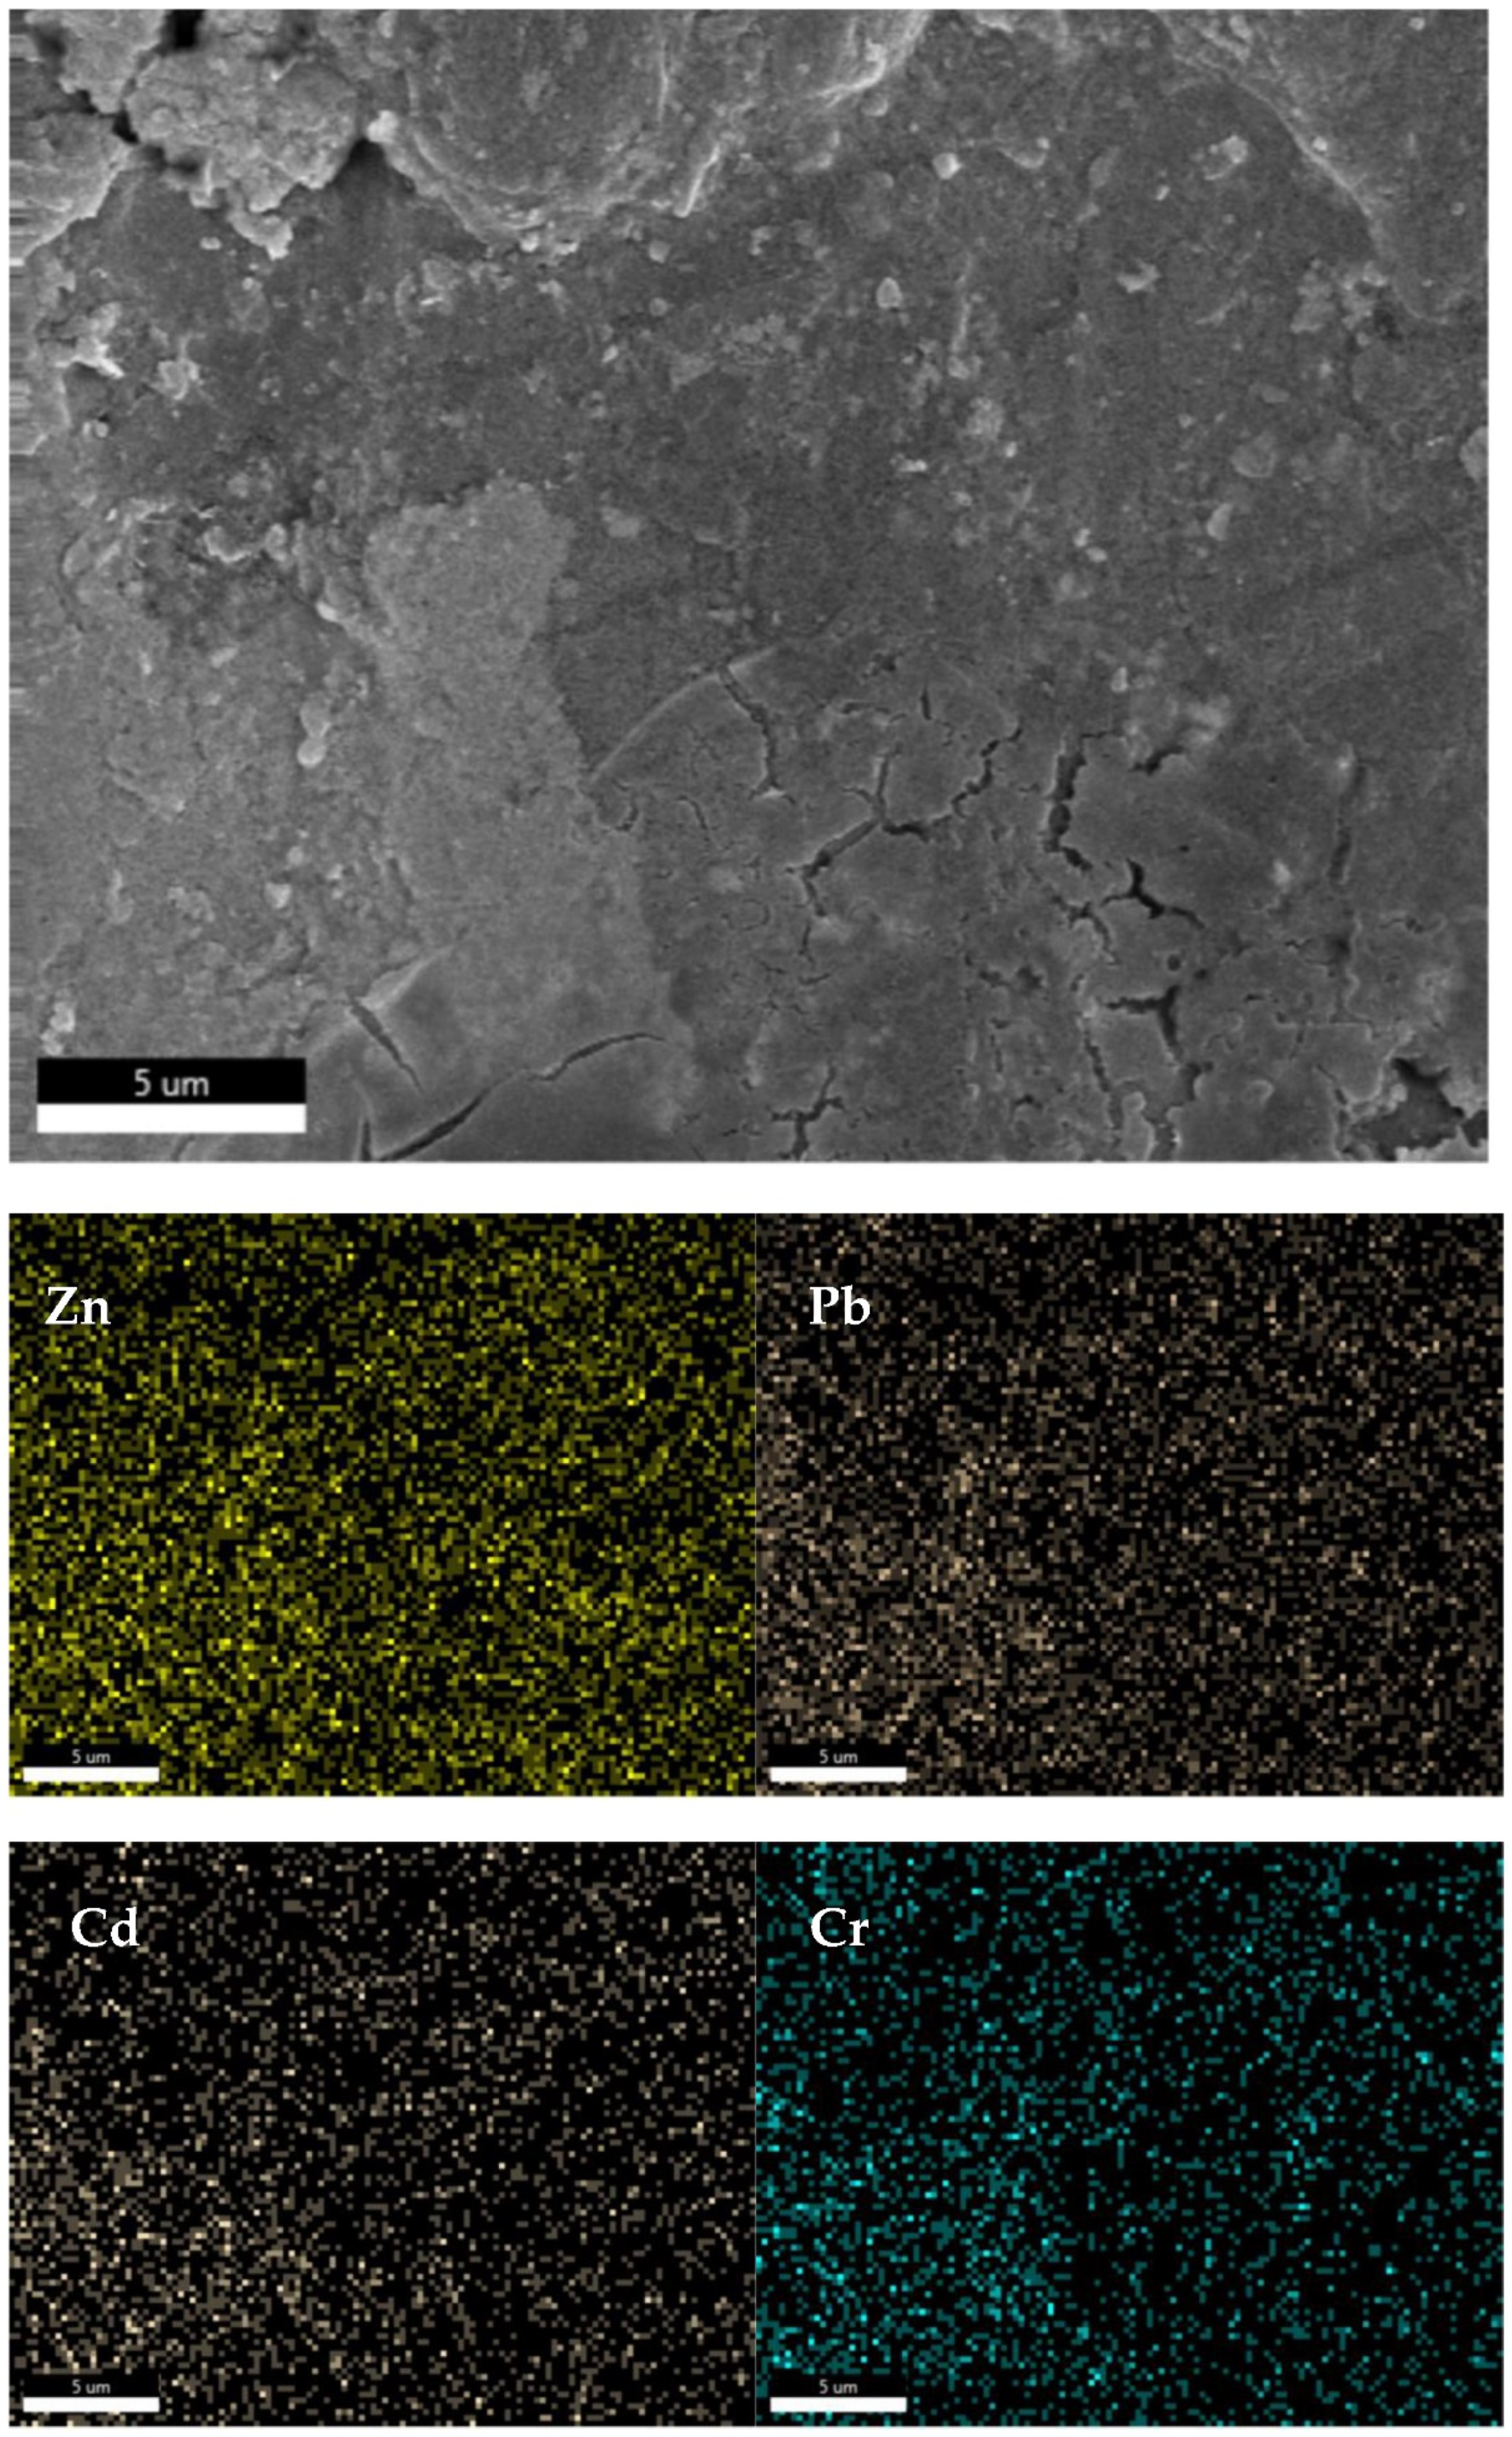
Figure 13 depicts the elemental distribution of zinc (Zn), lead (Pb), cadmium (Cd), and chromium (Cr) in the cross-section of the fly ash ceramic blocks under the optimal CSP conditions, as measured by EDS. In
Figure 13, the SEM image, the distribution of zinc, lead, cadmium, and chromium elements appears to be more uniform compared to the surface of the blocks.
Based on the comprehensive analysis of XRD, SEM, and EDS results, the mechanism of internal heavy metal immobilization in fly ash through the CSP process is illustrated in
Figure 14. Prior to CSP initiation, when pre-processed fly ash is mixed with sodium carbonate, water, and other additives (
Figure 1), certain substances on the surface of fly ash particles dissolve into the water, including some heavy metals. As CSP progresses, uniaxial stress is applied to the entire system, causing the fly ash particles to undergo mutual compression and plastic deformation, resulting in densification of the overall structure. Simultaneously, compared to the non-pressurized state, more surface substances of the fly ash particles dissolve. As the temperature increases, along with the applied uniaxial stress, more surface substances of the fly ash particles transfer to the liquid phase (resembling a pressurized leaching effect), where water plays a crucial role in mass transfer. As the temperature rises above the boiling point of water, water gradually evaporates from the interior of the blocks, leading to an increase in pH and the migration of some heavy metals from the interior to the surface of the blocks. Substances originally dissolved in the water (including heavy metals and soluble salts) become supersaturated due to water evaporation and precipitate between the fly ash particles. Simultaneously, under the influence of thermal and mechanical energy, phase transformations occur at the grain boundaries of the fly ash particles, resulting in the formation of stable secondary phases that encapsulate the precipitated heavy metals at the grain boundaries, thus reducing the leaching of heavy metals in the TCLP test. However, heavy metals carried to the surface of the blocks during the evaporation process are less effectively encapsulated by the newly formed secondary phases (such as lead and zinc) compared to those within the blocks, resulting in a lower immobilization effectiveness. This difference in effectiveness is also related to the higher content of lead and zinc in the fly ash, in addition to the nature of amphoteric metals.
