Submitted:
01 August 2023
Posted:
03 August 2023
You are already at the latest version
Abstract

Keywords:
1. Introduction
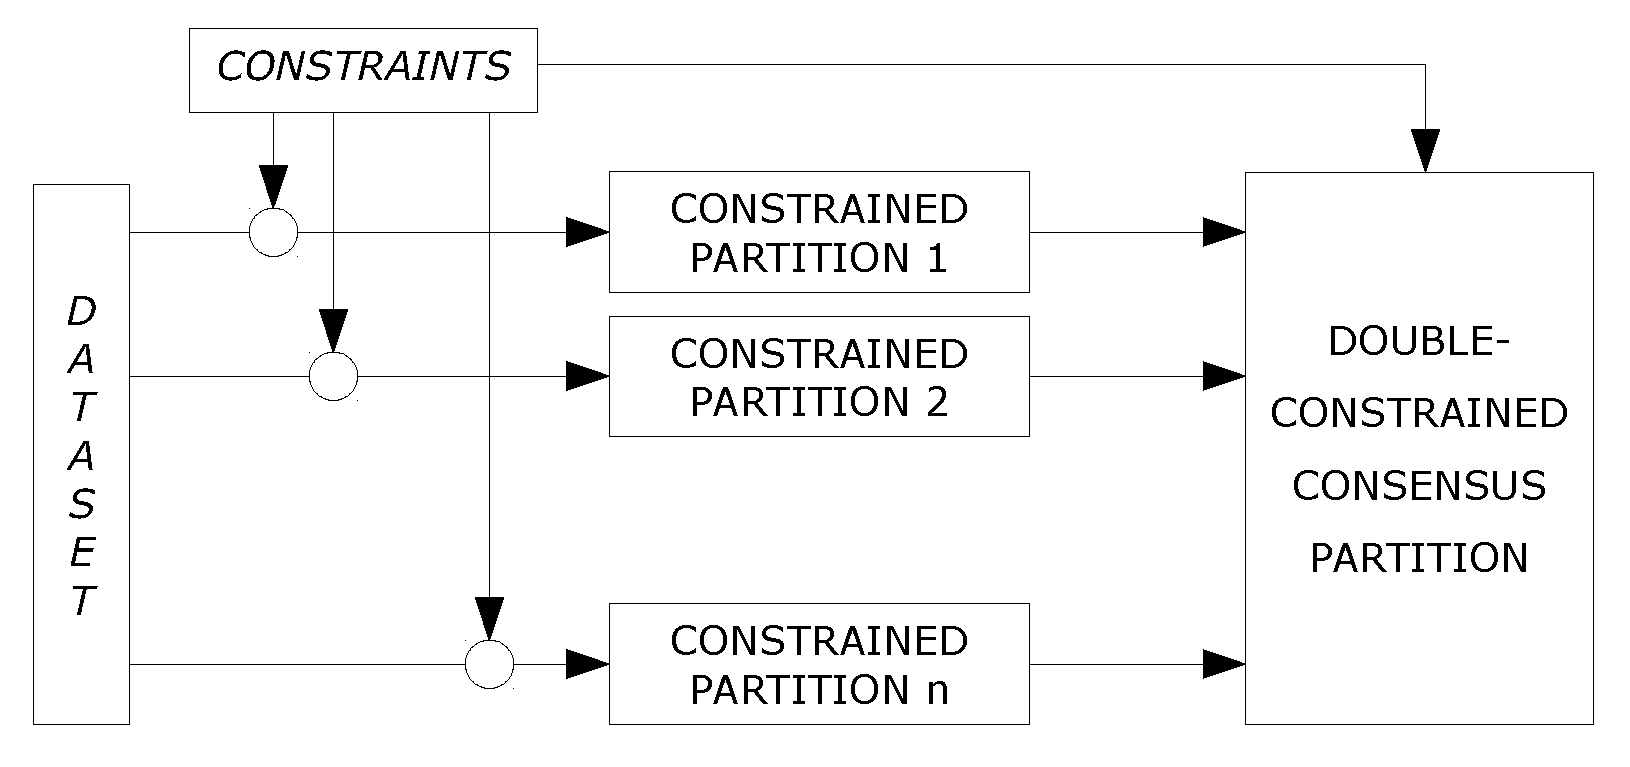
- We define a novel framework for semi-supervised consensus clustering that exploits constraints both to build the base partitions and to combine them through an optimization-based constrained consensus clustering algorithm. The framework has been implemented into a system named CCC.
- We offer an analysis of the logical implications between constraints that helps optimize their use not only in CCC but in any clustering algorithm making use of must- and cannot-links constraints.
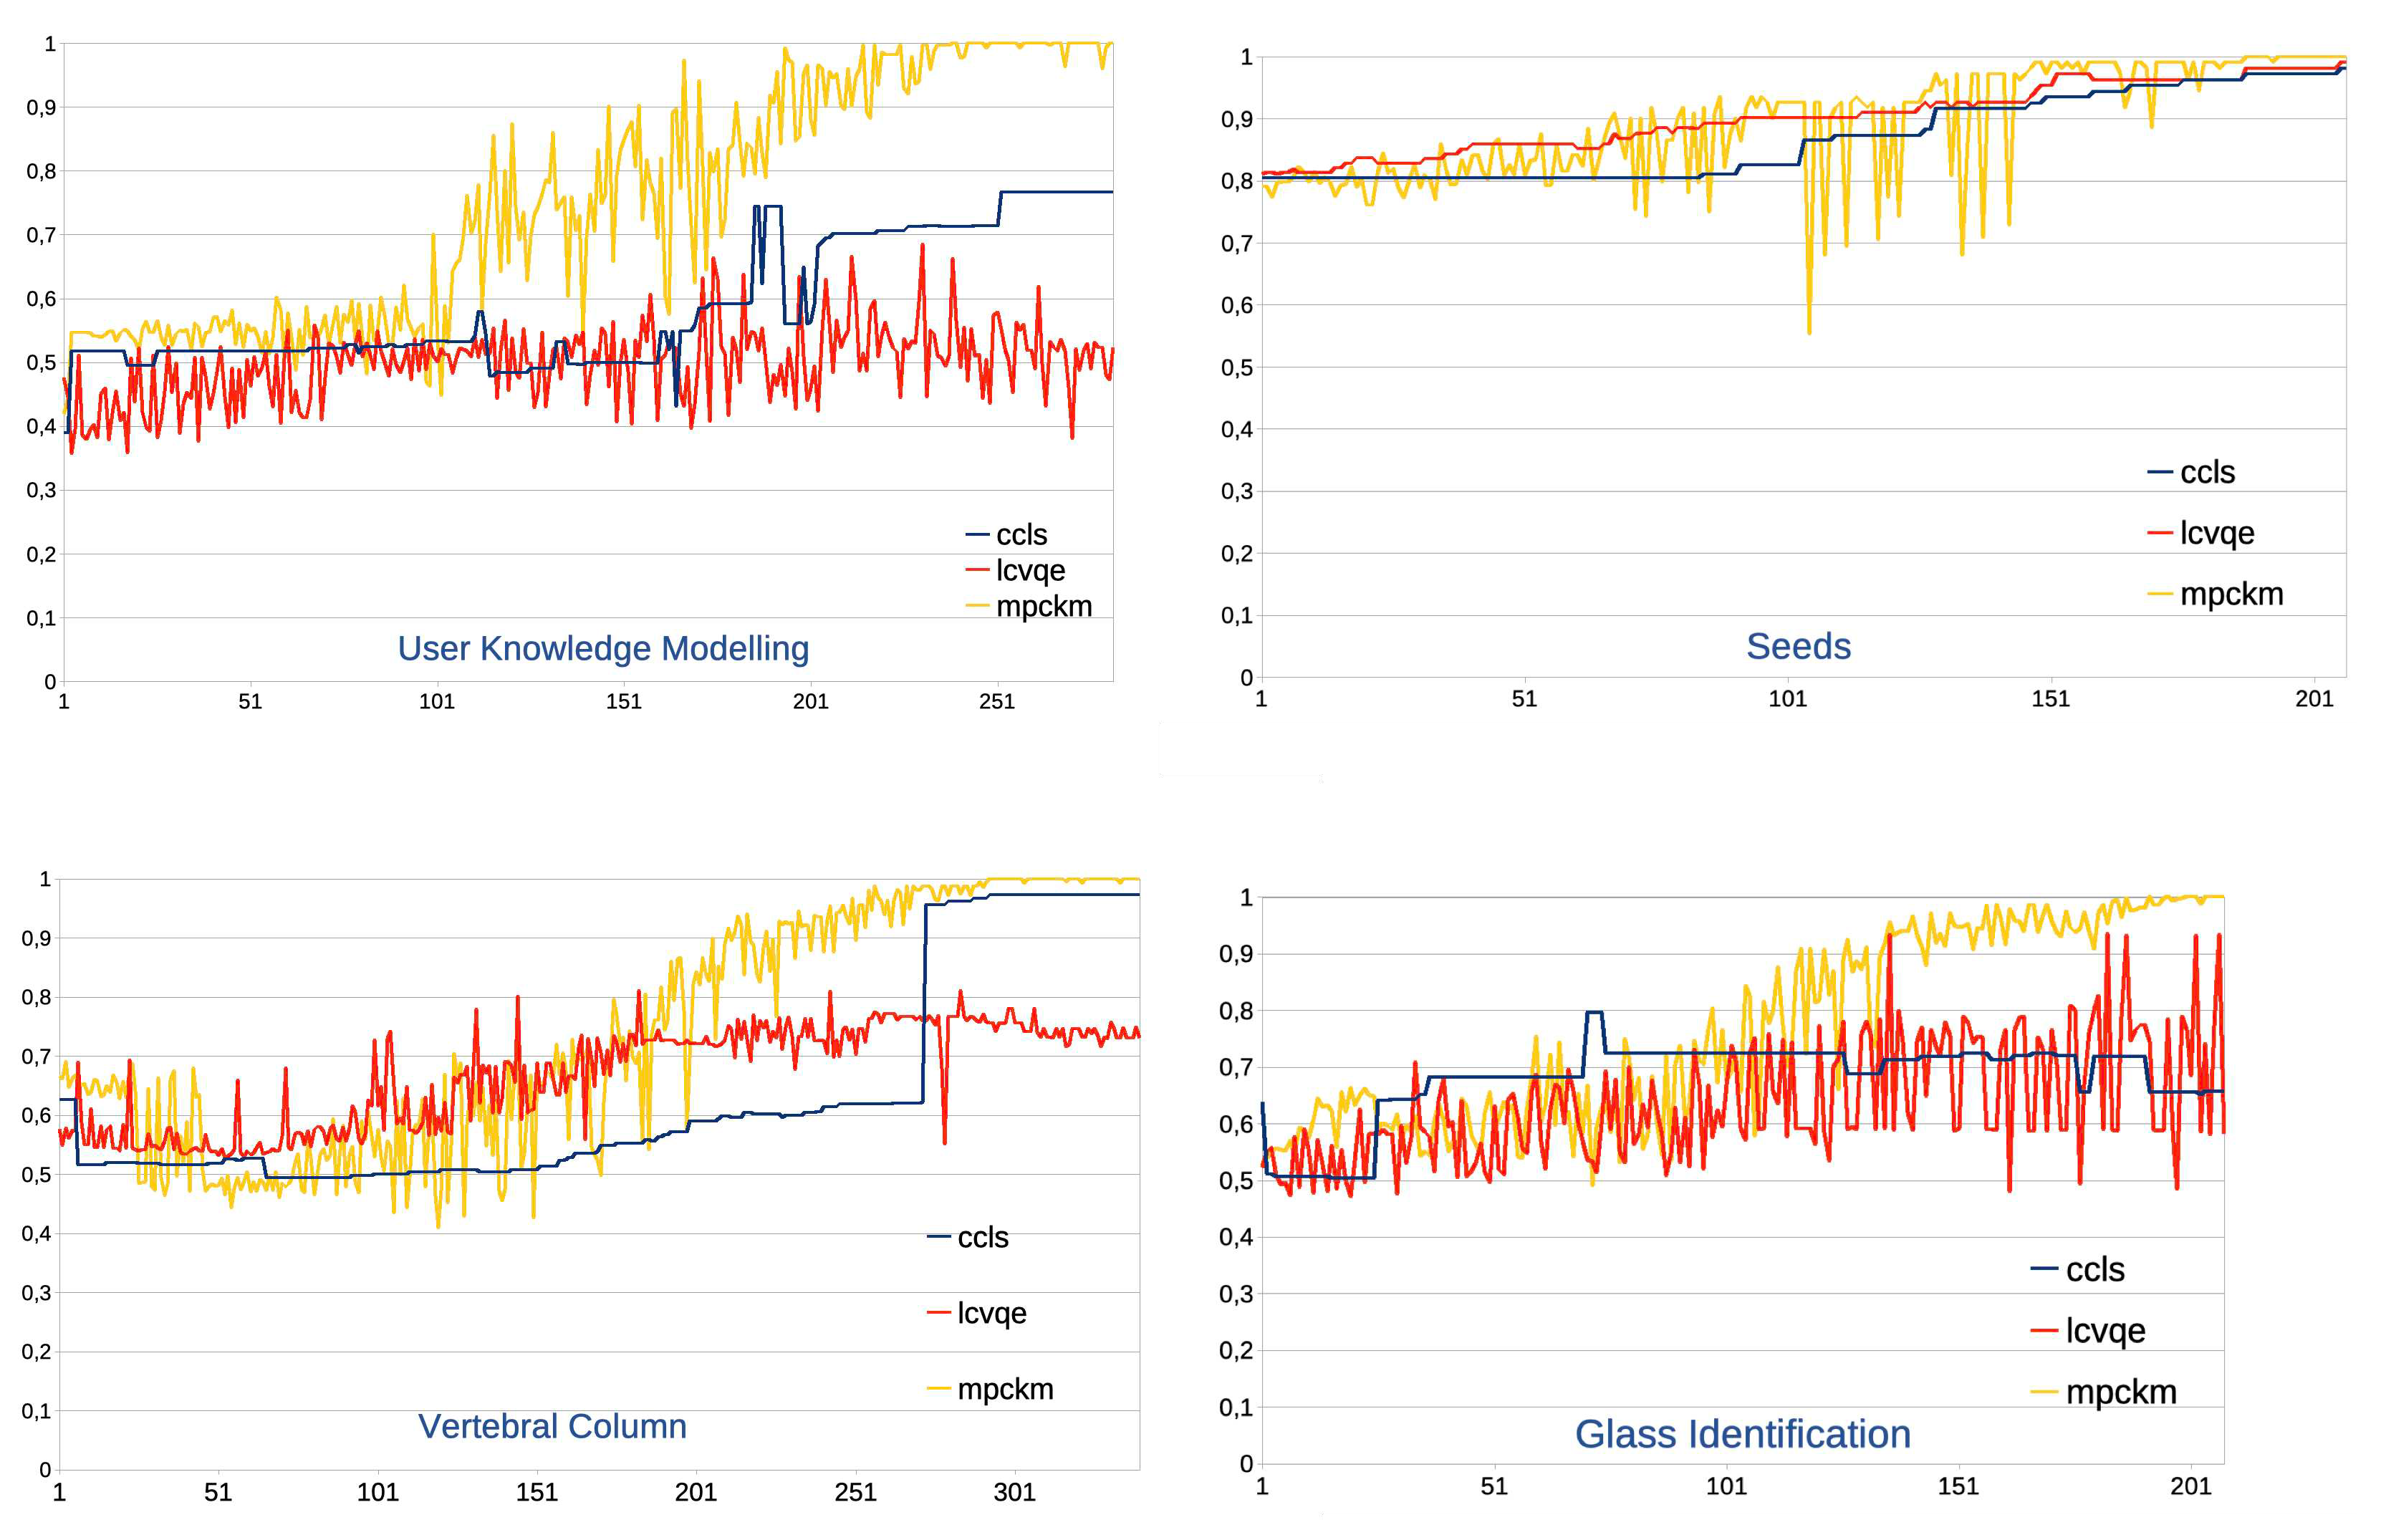
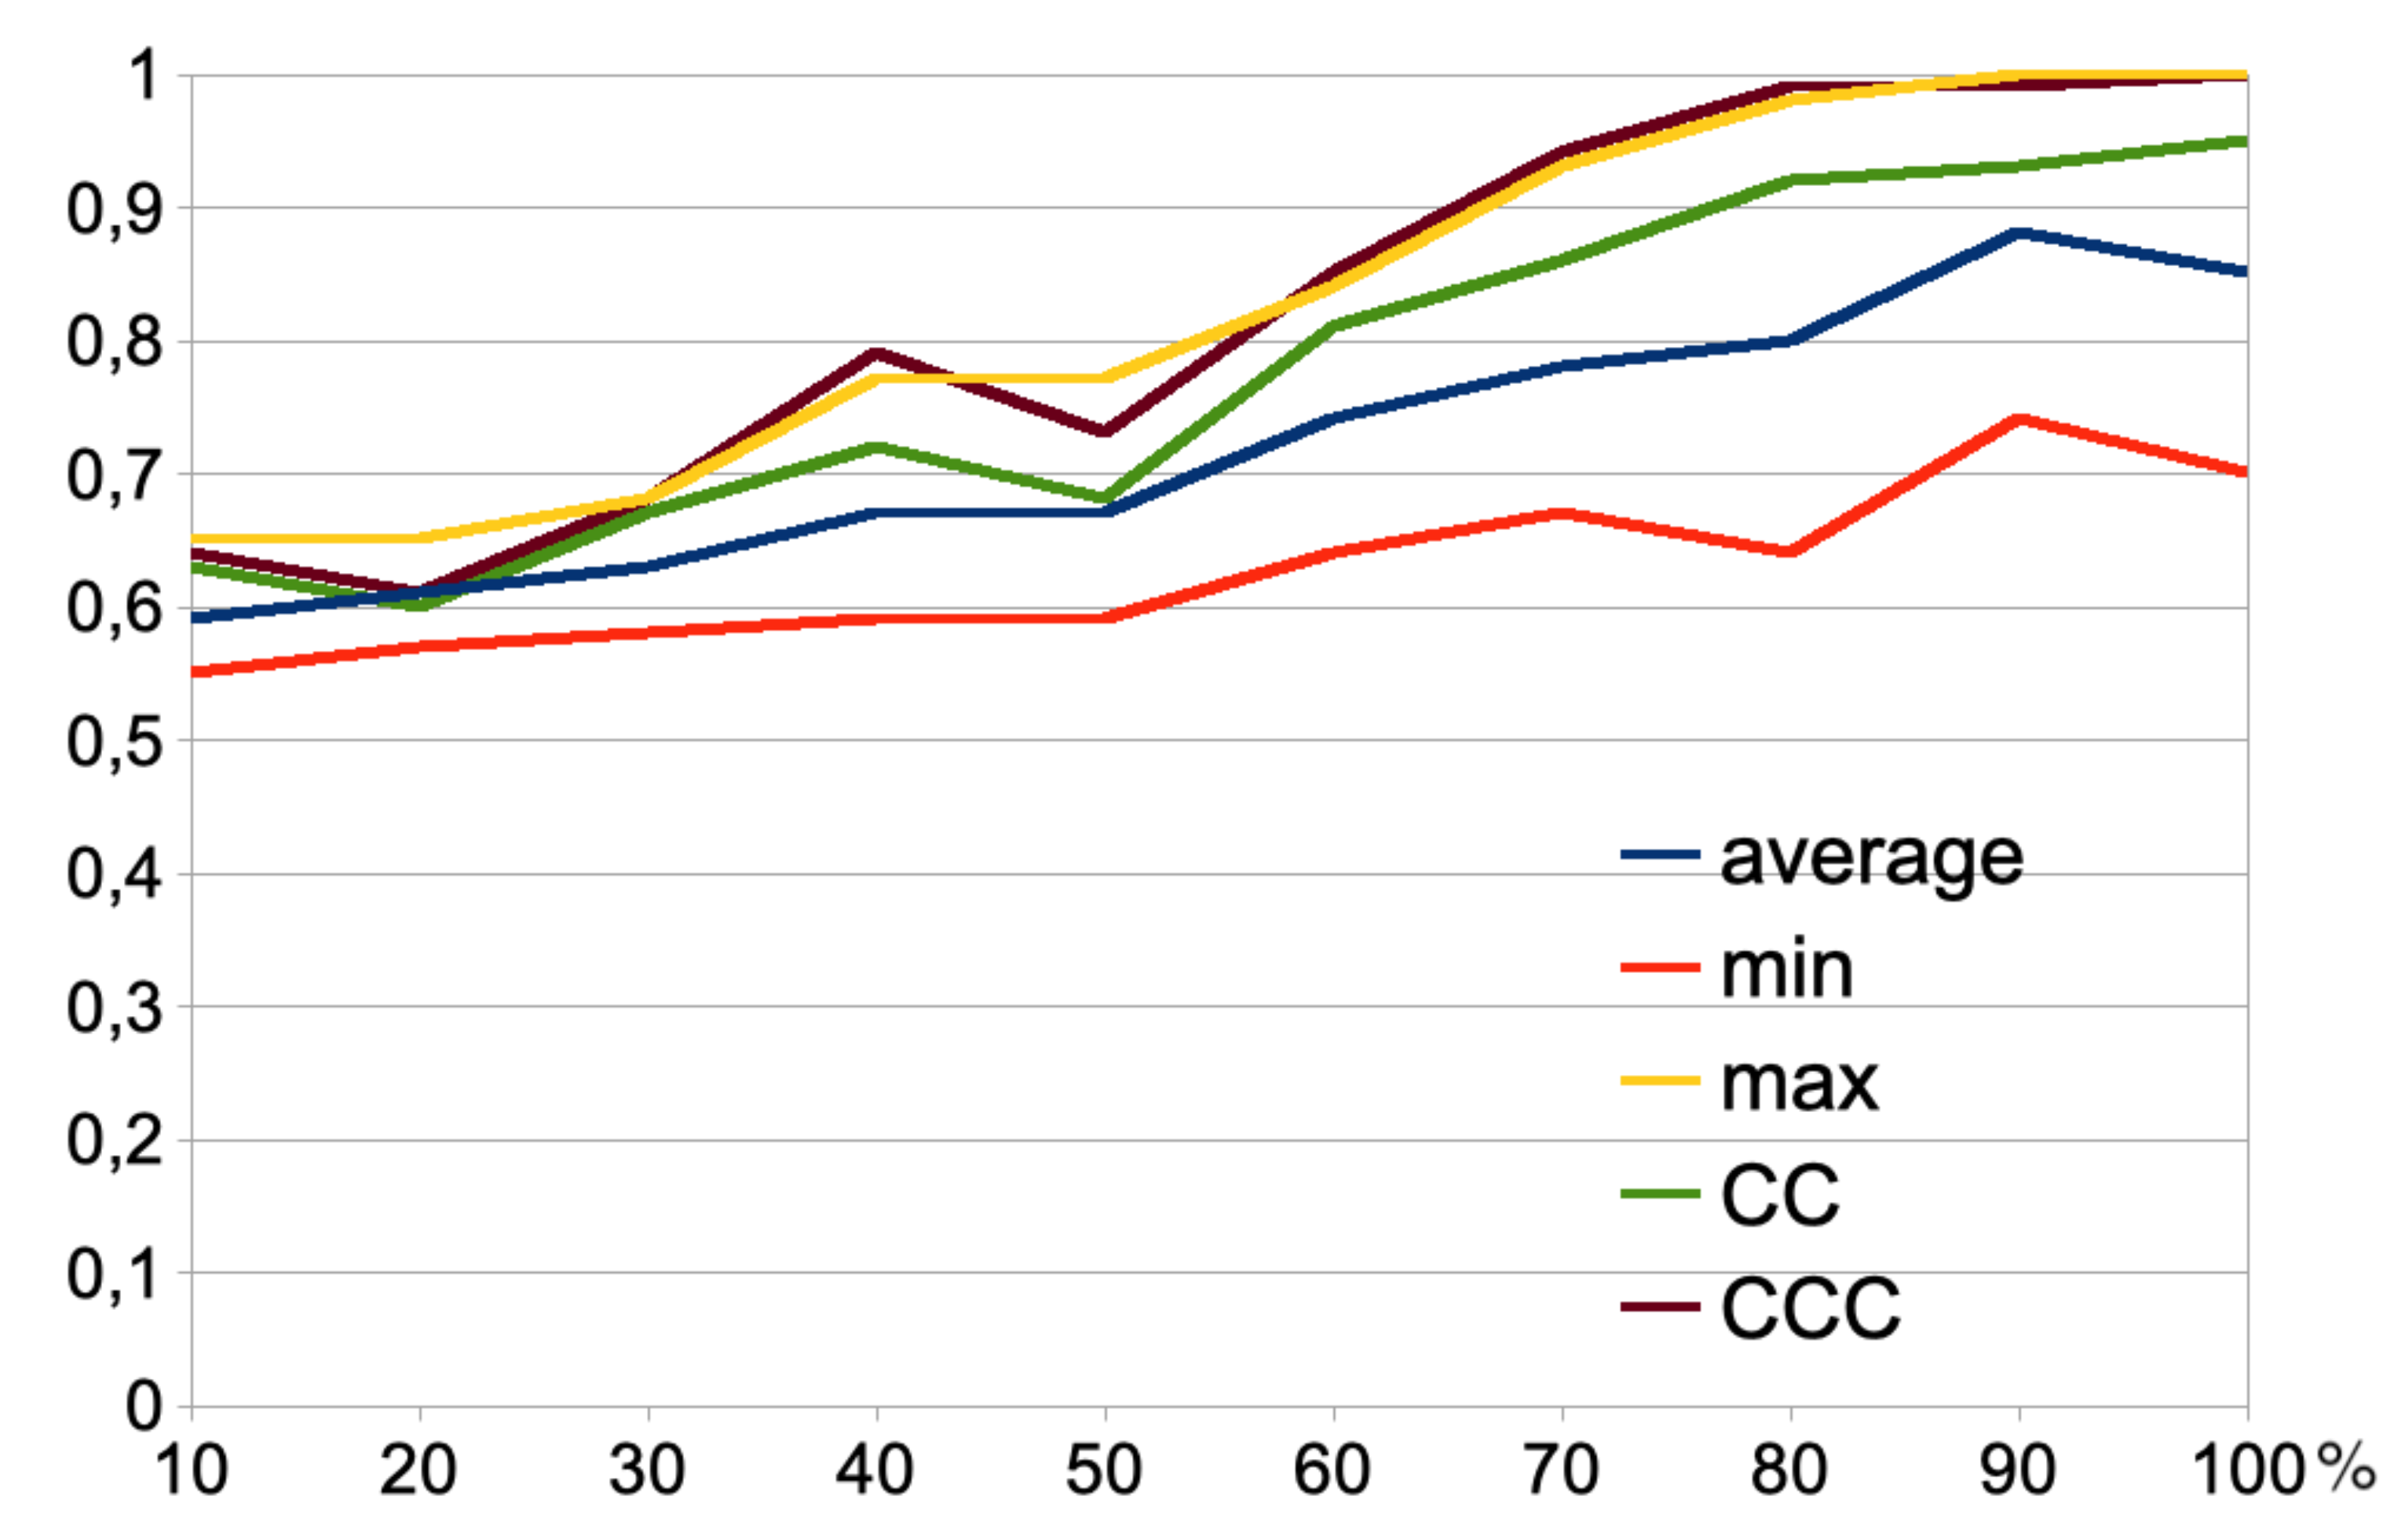
- We present an experimental evaluation with the UCI datasets showing that the re-utilization of constraints within the consensus function that combines base constrained partitions is more effective than using unenhanced consensus clustering.
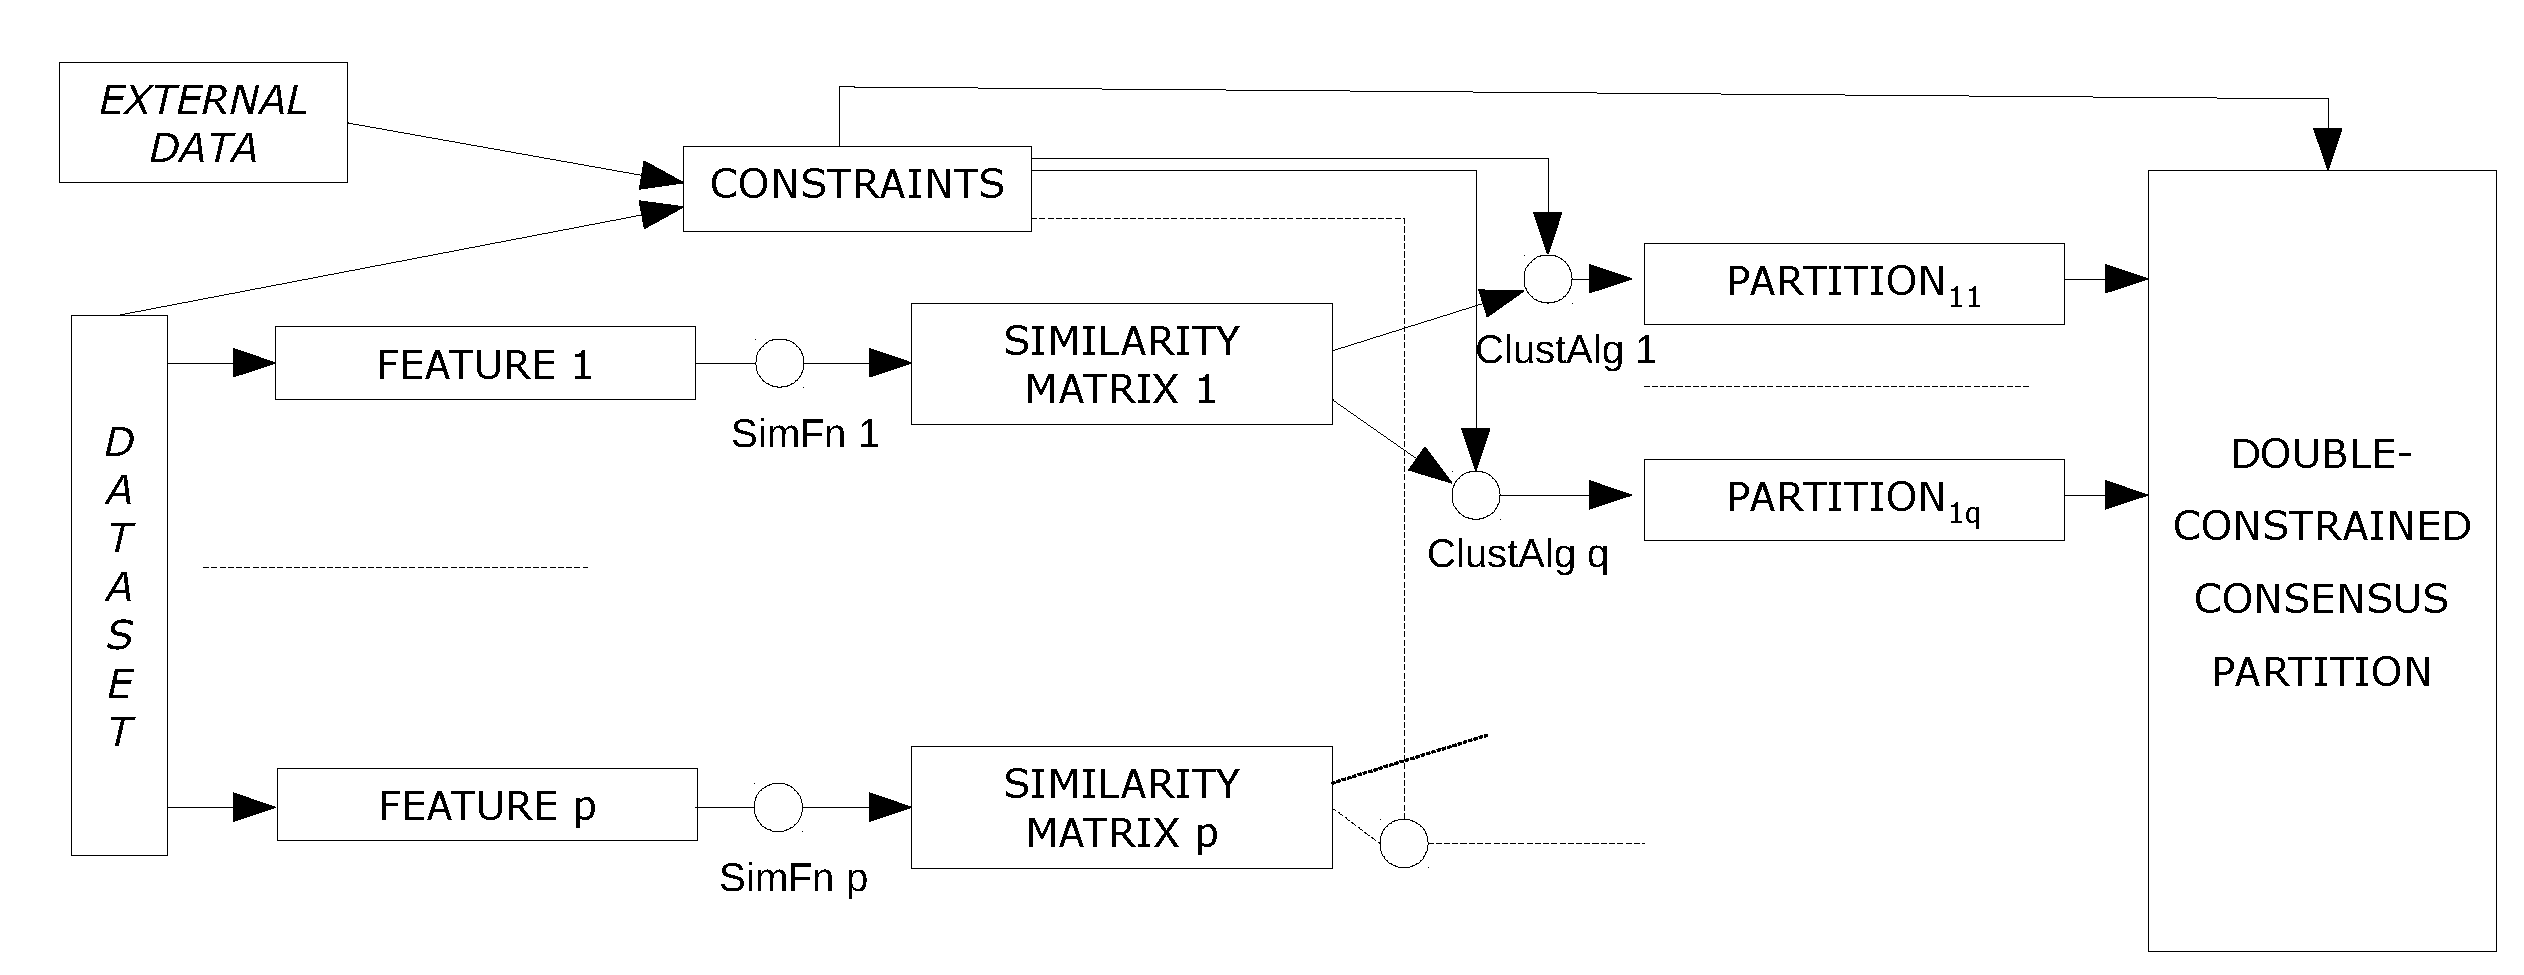
- We demonstrate the potential of using CCC to analyze counterfeit web shops and detect affiliate programs. This is done through a comprehensive approach starting from raw data and including the automatic generation of constraints and experimentation with a new test collection made available for use.
2. Double-constrained consensus clustering framework
2.1. Notation and background
- : number of pairs of objects that are in the same cluster in both and ,
- : number of pairs of objects that are in different clusters in both and ,
- : number of pairs of objects that are in the same cluster in but in different clusters in ,
- : number of pairs of objects that are in different clusters in but in the same cluster in .
- ,
- ,
- ,
- .
2.2. Constrained consensus clustering as an optimization problem
2.3. Analysis of constraints
2.4. A heuristic solution
3. Experimenting with UCI datasets
3.1. Design and preparation
3.2. Results
4. Experimenting with counterfeit web shops
4.1. Motivation and approach overview
4.2. Experiment design and preparation
4.2.1. Goals
4.2.2. Construction of the ground truth dataset
4.2.3. Clustering features and distance matrices
4.2.4. Base clustering algorithms
4.2.5. Automatic acquisition of constraints
4.3. Results
5. Related work
5.1. Semi-supervised ensemble clustering
5.2. Clustering fraudulent websites
6. Conclusions and future work
Acknowledgments
References
- Kleinberg, J. An impossibility theorem for clustering. In Proceedings of the Proceedings of the 15th International Conference on Neural Information Processing Systems (NIPS’02), Vancouver, British Columbia, Canada, 2002, pp.; pp. 463–470.
- Estivill-Castro, V. Why so many clustering algorithms: a position paper. SIGKDD Explorations 2002, 4, 65–75. [Google Scholar] [CrossRef]
- Boongoen, T.; Iam-On, N. Cluster ensembles: A survey of approaches with recent extensions and applications. Computer Science Review 2018, 28, 1–25. [Google Scholar] [CrossRef]
- Bair, E. Semi-supervised clustering methods. Wiley Interdisciplinary Reviews: Computational Statistics 2013, 5, 349–361. [Google Scholar] [CrossRef]
- Taha, K. Semi-supervised and un-supervised clustering: A review and experimental evaluation. Information Systems 2023, 114. [Google Scholar] [CrossRef]
- Xibin Dong, Zhiwen Yu, W. C.Y.S.; Ma, Q. A survey on ensemble learning. Frontiers of Computer Science 2020, 14, 241–2585. [Google Scholar] [CrossRef]
- Carpineto, C.; Romano, G. Consensus Clustering Based on a New Probabilistic Rand Index with Application to Subtopic Retrieval. IEEE Transactions on Pattern Analysis and Machine Intelligence 2012, 34, 2315–2326. [Google Scholar] [CrossRef]
- Rand, W.M. Objective criteria for the evaluation of clustering methods. Journal of American Statistical Association 1971, 66, 846–850. [Google Scholar] [CrossRef]
- Hubert, L.; Arabie, P. Comparing partitions. Journal of Classification 1985, 2, 193–218. [Google Scholar] [CrossRef]
- Rovetta, S.; Masulli, F.; Cabri, A. The Probabilistic Rand Index: A Look from Some Different Perspectives. In Neural Approaches to Dynamics of Signal Exchanges: Smart Innovation, Systems and Technologies; Esposito, A.; Faundez-Zanuy, M.; Morabito, F.C.; Pasero, E., Eds.; 2019; Vol. 151, pp. 95–105.
- Wagstaff, K.; Cardie, C.; Rogers, S.; Scrödl, S. Constrained K-means Clustering with Background Knowledge. In Proceedings of the Proceedings of the 18th International Conference on Machine Learning, Williamstown, MA, USA.; Morgan Kaufmann, 2001; pp. 577–584.
- Bansal, N.; Blum, A.; Chawla, S. Integrating constraints and metric learning in semi-supervised clustering. In Proceedings of the Proceedings of the twenty-first international conference on Machine learning (ICML ’04), Banff, Alberta, Canada.; ACM, 2004; pp. 81–88.
- Ghasemi, Z.; Khorshidi, H.A.; Aickelin, U. A survey on Optimisation-based Semi-supervised Clustering Methods. In Proceedings of the 2021 IEEE International Conference on Big Knowledge (ICBK), Auckland, New Zealand. IEEE; 2021; pp. 477–482. [Google Scholar]
- Carpineto, C.; Romano, G. Optimal meta search results clustering. In Proceedings of the Proceedings of SIGIR 2010, Geneva, Switzerland.; ACM Press, 2010; pp. 170–177.
- Luke, S. Essentials of Metaheuristics; 2009. available at. Available online: http://cs.gmu.edu/∼sean/book/metaheuristics/.
- Pelleg, D.; Baras, D. K-Means with Large and Noisy Constraint Sets. In Proceedings of the Proceedings of 2007 European Conference on Machine Learning, Warsaw, Poland, 2007, pp.; pp. 6747–682.
- Hiep, T.K.; Duc, N.M.; Trung, B.Q. Local search approach for the pairwise constrained clustering problem. In Proceedings of the SoICT ’16: Proceedings of the 7th Symposium on Information and Communication Technology (SoICT ’16), Ho Chi Minh City, Vietnam.; AC, 2016; pp. 107–118.
- Manning, C.D.; Raghavan, P.; Schütze, H. Introduction to Information Retrieval; Cambridge University Press, 2008.
- Craenendonck, T.V.; Blockeel, H. Constraint-based clustering selection. Machine Learning 2017, 106, 1497–1521. [Google Scholar] [CrossRef]
- Wadleigh, J.; Drew, J.; Moore, T. The E-Commerce Market for "Lemons": Identification and Analysis of Websites Selling Counterfeit Goods. In Proceedings of the Proceedings of the 24th International Conference on World Wide Web (WWW ’15), 2015, pp.; pp. 1188–1197.
- Carpineto, C.; Romano, G. Learning to detect and measure fake ecommerce websites in search-engine results. In Proceedings of the Proceedings of 2017 IEEE/WIC/ACM International Conference on Web Intelligence (WI 2017), Leipzig, Germany, 2017, pp.; pp. 403–410.
- Beltzung, L.; Lindley, A.; Dinica, O.; Hermann, N.; Lindner, R. Real-Time Detection of Fake-Shops through Machine Learning. In Proceedings of the Proceedings of 2020 IEEE International Conference on Big Data.; IEEE, 2020; pp. 2254–2263.
- Carpineto, C.; Romano, G. An Experimental Study of Automatic Detection and Measurement of Counterfeit in Brand Search Results. ACM Transactions on the Web 2020, 14, 1–35. [Google Scholar] [CrossRef]
- Gopal, A.R.D.; Hojati, A.; Patterson, R.A. Analysis of third-party request structures to detect fraudulent websites. Decision Support Systems 2022, 154, Issue C.
- Der, A.M.F.; Saul, L.K.; Savage, S.; Voelker, G.M. Knock it off: profiling the online storefronts of counterfeit merchandise. In Proceedings of the Proceedings of the 20th ACM SIGKDD international conference on Knowledge discovery and data mining.; ACM, 2014; pp. 1759–1768.
- Drew, J.M.; Moore, T. Optimized combined-clustering methods for finding replicated criminal websites. EURASIP Journal on Information Security 2014, 14, 1–13. [Google Scholar] [CrossRef]
- Geraci, F. Identification of Web Spam through Clustering of Website Structures. In Proceedings of the Proceedings of the 23th international conference on World Wide Web (Companion Volume).; ACM, 2015; pp. 1447–1452.
- Nagai, T.; Kamizono, M.; Shiraishi, Y.; Xia, K.; Mohri, M.; Takano, Y.; Morii, M. A Malicious Web Site Identification Technique Using Web Structure Clustering. IEICE Transactions on Information and Systems 2019, E102.D, 1665–1672. [Google Scholar] [CrossRef]
- Price, B.; Edwards, M. Resource networks of pet scam websites. In Proceedings of the Proceedings of 2020 APWG Symposium on Electronic Crime Research (eCrime), 2005, pp.; pp. 1–10.
- Phillips, R.; Wilder, H. Tracing Cryptocurrency Scams: Clustering Replicated Advance-Fee and Phishing Websites. In Proceedings of the Proceedings of 2020 IEEE International Conference on Blockchain and Cryptocurrency (ICBC); 2020. [Google Scholar]
- Wang, A.C.; Yu, Y.; Pu, A.; Shi, F.; Huang, C. Spotlight on Video Piracy Websites: Familial Analysis Based on Multidimensional Features. In Proceedings of the Proceedings of 15th International Conference on Knowledge Science, Engineering and Management, 2022, pp.; pp. 272–288.
- Levchenko, K.; Pitsillidis, A.; Chachra, N.; Enright, B.; Felegyhazi, M.; Grier, C.; Halvorson, T.; Kanich, C.; Kreibich, C.; Liu, H.; et al. Click Trajectories: End-to-End Analysis of the Spam Value Chain. In Proceedings of the Proceedings of 2011 IEEE Symposium on Security and Privacy, 2011, pp.; pp. 431–446.
- Bernardini, A. Extending domain name monitoring. Identifying potential malicious domains using hash signatures of DOM elements. In Proceedings of the Proceedings of ITASEC 2018, Italian Conference on Cybersecurity, 2018. [Google Scholar]
- Prettejohn, N. Phishing Website Identification through Visual Clusteringe. PhD thesis, Department of Computing Imperial College London, London, UK, 2016.
- Leontiadis, N.; Moore, T.; Christin, N. Measuring and analyzing search-redirection attacks in the illicit online prescription drug trade. In Proceedings of the Proceedings of 20th USENIX Security Symposium (USENIX Security 11).
- Wei, C.; Sprague, A.; Warner, G.; Skjellum, A. Clustering Spam Domains and Destination Websites: Digital Forensics with Data Mining. Journal of Digital Forensics, Security and Law (JDFSL) 2010, 5. [Google Scholar] [CrossRef]
- Starov, O.; Zhou, Y.; Zhang, X.; Miramirkh, N.; Nikiforakis, N. Document Clustering With Committees. In Proceedings of the Proceedings of the 2018 World Wide Web Conference.; ACM Press, 2018; pp. 227–236.
- Navarro-Arribas, G.; Torra, V.; Erola, A.; Castellà-Roca, J. User k-anonymity for privacy preserving data mining of query logs. Information Processing & Management 2019, 48, 476–487. [Google Scholar]
- Yu, Z.; Luo, P.; You, J.; Wong, H.S.; Leung, H.; Wu, S.; Zhang, J.; Han, G. Incremental Semi-Supervised Clustering Ensemble for High Dimensional Data Clustering. IEEE Transactions on Knowledge and Data Engineering 2015, 28, 701–714. [Google Scholar] [CrossRef]
- Ho, T.K. The Random Subspace Method for Constructing Decision Forests. IEEE Transactions on Pattern Analysis and Machine Intelligence 1998, 20, 832–844. [Google Scholar]
- Luo, R.; Yu, Z.; Cao, W.; Liu, C.; Won, H.S.; Chen, C.L.P. The Random Subspace Method for Constructing Decision Forests. IEEE Access 2019, 8, 17926–17934. [Google Scholar] [CrossRef]
- Yu, Z.; Luo, P.; Liu, J.; Wong, H.S.; You, J.; Han, G.; Zhang, J. Semi-Supervised Ensemble Clustering Based on Selected Constraint Projection. IEEE Transactions on Knowledge and Data Engineering 2018, 30, 2394–2407. [Google Scholar] [CrossRef]
- Wei, S.; Li, Z.; Zhang, C. Combined constraint-based with metric-based in semi-supervised clustering ensemble. International Journal of Machine Learning and Cybernetics 2017, 9, 1085–1100. [Google Scholar] [CrossRef]
- Yu, Z.; Wongb, H.S.; You, J.; Yang, Q.; Liao, H. Knowledge based cluster ensemble for cancer discovery from biomolecular data. IEEE Transactions on Nanobioscience 2011, 10, 76–85. [Google Scholar] [PubMed]
- Ding, S.; Jia, H.; Zhang, L.; Jin, F. Research of semi-supervised spectral clustering algorithm based on pairwise constraints. Neural Computing and Applications 2014, 24, 211–219. [Google Scholar] [CrossRef]
- Xiao, W.; Yang, Y.; Wang, H.; Li, T.; Xing, H. Semi-supervised hierarchical clustering ensemble and its application. Neurocomputing 2016, 173, 1362–1376. [Google Scholar] [CrossRef]
- Ma, T.; Zhang, Z.; Guo, L.; Wang, X.; Qian, Y.; Al-Nabhan, N. Semi-supervised Selective Clustering Ensemble based on constraint information. Neurocomputing 2021, 462, 412–425. [Google Scholar] [CrossRef]
- Karypis, G.; Han, E.H.; Kumar, V. Chameleon: hierarchical clustering using dynamic modeling. IEEE Computer 1999, 32, 68–75. [Google Scholar] [CrossRef]
- Yang, T.; Pasquier, N.; Precioso, F. Semi-supervised consensus clustering based on closed patterns. Knowledge-Based Systems 2022, 235. [Google Scholar] [CrossRef]
- Yang, Y.; Teng, F.; Li, T.; Wang, H.; Wang, H.; Zhang, Q. Parallel Semi-Supervised Multi-Ant Colonies Clustering Ensemble Based on MapReduce Methodology. IEEE Transactions on Cloud Computing 2015, 6. [Google Scholar] [CrossRef]
- Guilbert, M.; Vrain, C.; Dao, T.B.H.; de Souto, M.C.P. Anchored Constrained Clustering Ensemble. In Proceedings of the Proceedings of 2022 International Joint Conference on Neural Networks.; IEEE; p. 2022.
- Lu, Z.; Ip, H.H.; Peng, Y. Exhaustive and Efficient Constraint Propagation: A Semi-Supervised Learning Perspective and Its Applications. In Proceedings of the arXiv:1109.4684 [cs.AI]; 2011. [Google Scholar]
- Yu, Z.; Kuang, Z.; Liu, J.; Chen, H.; Zhang, J.; You, J.; Wong, H.S.; Han, G. Adaptive Ensembling of Semi-Supervised Clustering Solutions. IEEE Transactions on Knowledge and Data Engineering 2017, 29, 1577–1599. [Google Scholar] [CrossRef]
- Bai, L.; Liang, J.; of Computer, F.C.S.; Information Technology, Shanxi University, T. S.C. Semi-Supervised Clustering With Constraints of Different Types From Multiple Information Sources. IEEE Transactions on Pattern Analysis and Machine Intelligence 2020, 43, 3247–3268. [Google Scholar] [CrossRef]
| 1 | The terms partition and clustering will be used interchangeably throughout the paper. |
| 2 | |
| 3 | CAP is available at https://www.kaggle.com/datasets/claudiocarpineto/counterfeit-affiliate-programs/code. |
| 4 |

| 1 | |||||
| 1 | 1 | ||||
| -1 | -1 | -1 | |||
| Input: |
|---|
| A set O of n objects |
| A set SP of q (constrained) partitions |
| A set ML of must-link constraints |
| A set CL of cannot-link constraints |
| Output: |
| A partition of O |
| 1. Find . |
| 2. Set to the input partition with the highest similarity with SP. |
| 3. Assign an object in to a different (possibly empty) cluster such that |
| the newly created partition has a higher similarity with SP than . |
| 4. Update to . |
| 5. Iterate between (3) and (4) until no partition with a higher has been found. |
| 6. Return . |
| Dataset | objects | attributes | classes | must-links | cannot-links | must-links | cannot-links |
|---|---|---|---|---|---|---|---|
| in the cover | in the cover | (total no.) | (total no.) | ||||
| GI | 214 | 10 | 6 | 208 | 208 | 5921 | 16870 |
| S | 210 | 7 | 3 | 207 | 207 | 7245 | 14700 |
| UKM | 258 | 5 | 4 | 254 | 282 | 9460 | 23693 |
| VC | 310 | 6 | 3 | 307 | 340 | 17895 | 30000 |
| feature | min | max | avg | 0 (CC) | 10 | 20 | 30 | 40 | 50 | 60 | 70 | 80 |
|---|---|---|---|---|---|---|---|---|---|---|---|---|
| Dom | 0.47 | 0.85 | 0.65 | 0.70 | 0.65 | 0.72 | 0.72 | 0.77 | 0.78 | 0.79 | 0.79 | 0.91 |
| (8%) | (0%) | (11%) | (11%) | (18%) | (20%) | (22%) | (22%) | (40%) | ||||
| Header30 | 0.30 | 0.69 | 0.55 | 0.69 | 0.68 | 0.62 | 0.71 | 0.72 | 0.76 | 0.81 | 0.82 | 0.87 |
| (25%) | (24%) | (13%) | (29%) | (31%) | (38%) | (47%) | (49%) | (58%) | ||||
| Header60 | 0.30 | 0.69 | 0.54 | 0.68 | 0.68 | 0.68 | 0.71 | 0.72 | 0.75 | 0.80 | 0.81 | 0.86 |
| (26%) | (26%) | (26%) | (31%) | (33%) | (39%) | (48%) | (50%) | (59%) | ||||
| Header90 | 0.30 | 0.69 | 0.58 | 0.69 | 0.73 | 0.71 | 0.70 | 0.72 | 0.75 | 0.81 | 0.82 | 0.85 |
| (19%) | (26%) | (22%) | (21%) | (24%) | (29%) | (40%) | (41%) | (47%) | ||||
| Header120 | 0.29 | 0.69 | 0.56 | 0.66 | 0.67 | 0.65 | 0.72 | 0.70 | 0.73 | 0.79 | 0.81 | 0.85 |
| (18%) | (20%) | (16%) | (29%) | (25%) | (30%) | (41%) | (45%) | (52%) | ||||
| Header150 | 0.33 | 0.69 | 0.57 | 0.68 | 0.66 | 0.62 | 0.72 | 0.72 | 0.75 | 0.80 | 0.81 | 0.86 |
| (19%) | (16%) | (9%) | (26%) | (26%) | (32%) | (40%) | (42%) | (51%) | ||||
| Privacy | 0.61 | 0.76 | 0.72 | 0.76 | 0.74 | 0.76 | 0.80 | 0.80 | 0.80 | 0.84 | 0.85 | 0.87 |
| (6%) | (3%) | (6%) | (11%) | (11%) | (11%) | (17%) | (18%) | (21%) | ||||
| Shipping | 0.47 | 0.72 | 0.65 | 0.72 | 0.72 | 0.73 | 0.75 | 0.77 | 0.76 | 0.79 | 0.80 | 0.87 |
| (11%) | (11%) | (12%) | (15%) | (18%) | (17%) | (22%) | (23%) | (34%) | ||||
| avg | 0.38 | 0.72 | 0.60 | 0.70 | 0.69 | 0.69 | 0.73 | 0.74 | 0.76 | 0.80 | 0.81 | 0.87 |
| (17%) | (15%) | (15%) | (22%) | (23%) | (27%) | (33%) | (35%) | (45%) |
Disclaimer/Publisher’s Note: The statements, opinions and data contained in all publications are solely those of the individual author(s) and contributor(s) and not of MDPI and/or the editor(s). MDPI and/or the editor(s) disclaim responsibility for any injury to people or property resulting from any ideas, methods, instructions or products referred to in the content. |
© 2023 by the authors. Licensee MDPI, Basel, Switzerland. This article is an open access article distributed under the terms and conditions of the Creative Commons Attribution (CC BY) license (http://creativecommons.org/licenses/by/4.0/).


