1. Introduction
High-resolution micro angle measurement techniques have rapidly evolved, playing a crucial role in various fields, particularly in aerospace. [
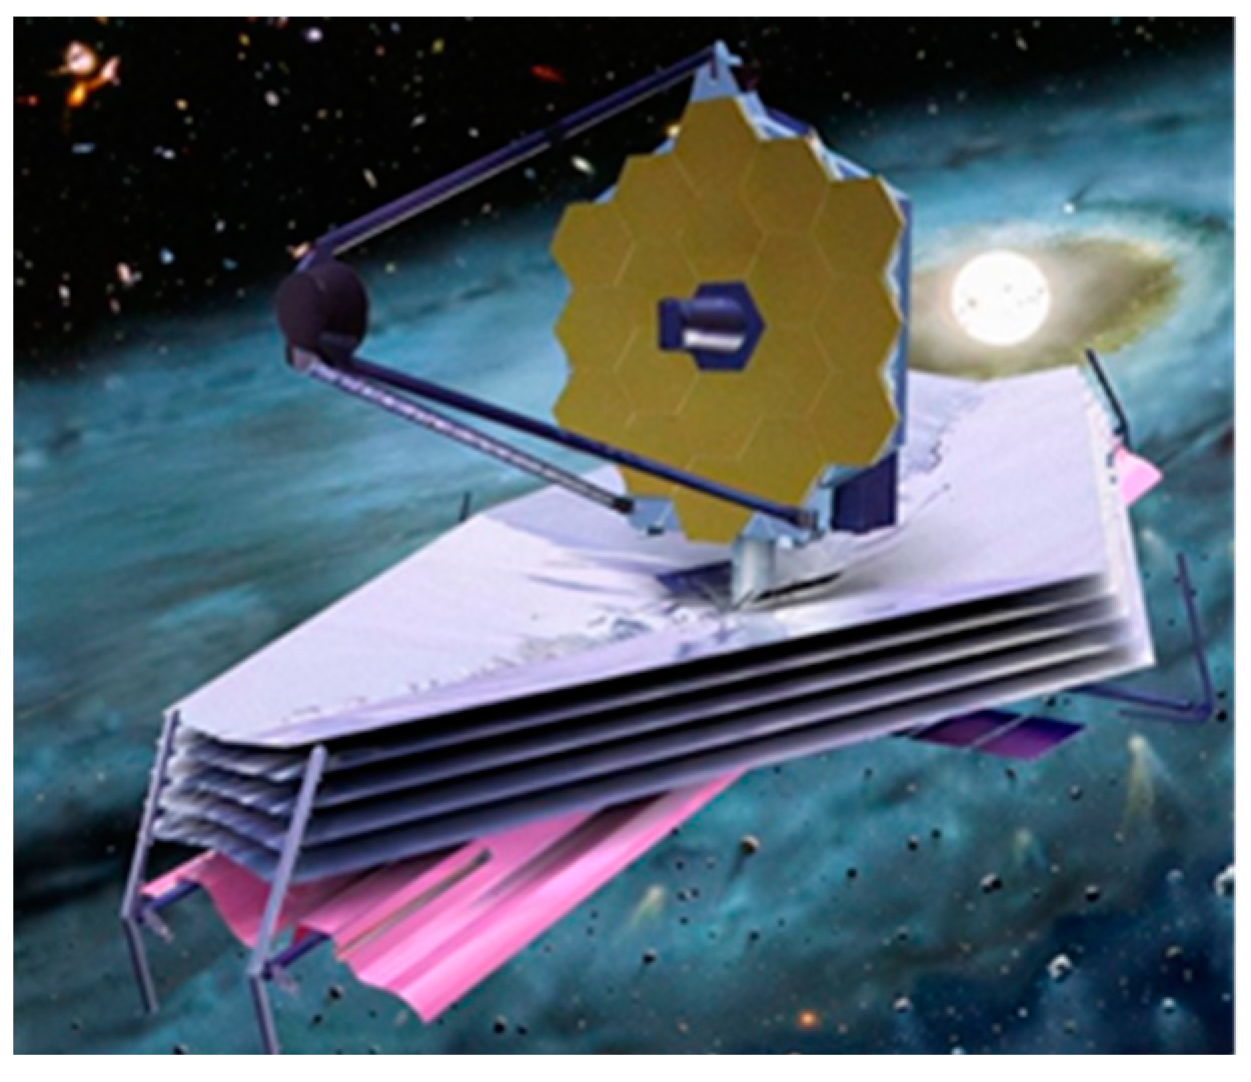
1]. In astronomical exploration, the thermal deformation of large aperture spliced mirrors directly determines the imaging quality: for example, the James Weber Telescope, successfully launched in 2021, has a main mirror diameter of 6.5 meters and is composed of 18 sub mirrors spliced together [
2]. Similarly, the effective aperture of the TMT Third Realm under construction has reached 30 meters, consisting of 492 hexagonal fragments [
3]. The thermal deformation of these spliced mirrors due to temperature changes must be accurately determined. By using an independent sub mirror support system and a common phase correction system (i. e. sub mirror common phase correction device), the influence of temperature and other factors on the spatial position of the mirror can be corrected, achieving sub mirror confocal common phase [
4,
5,
6] and achieving the optimal performance of large aperture splicing mirrors.
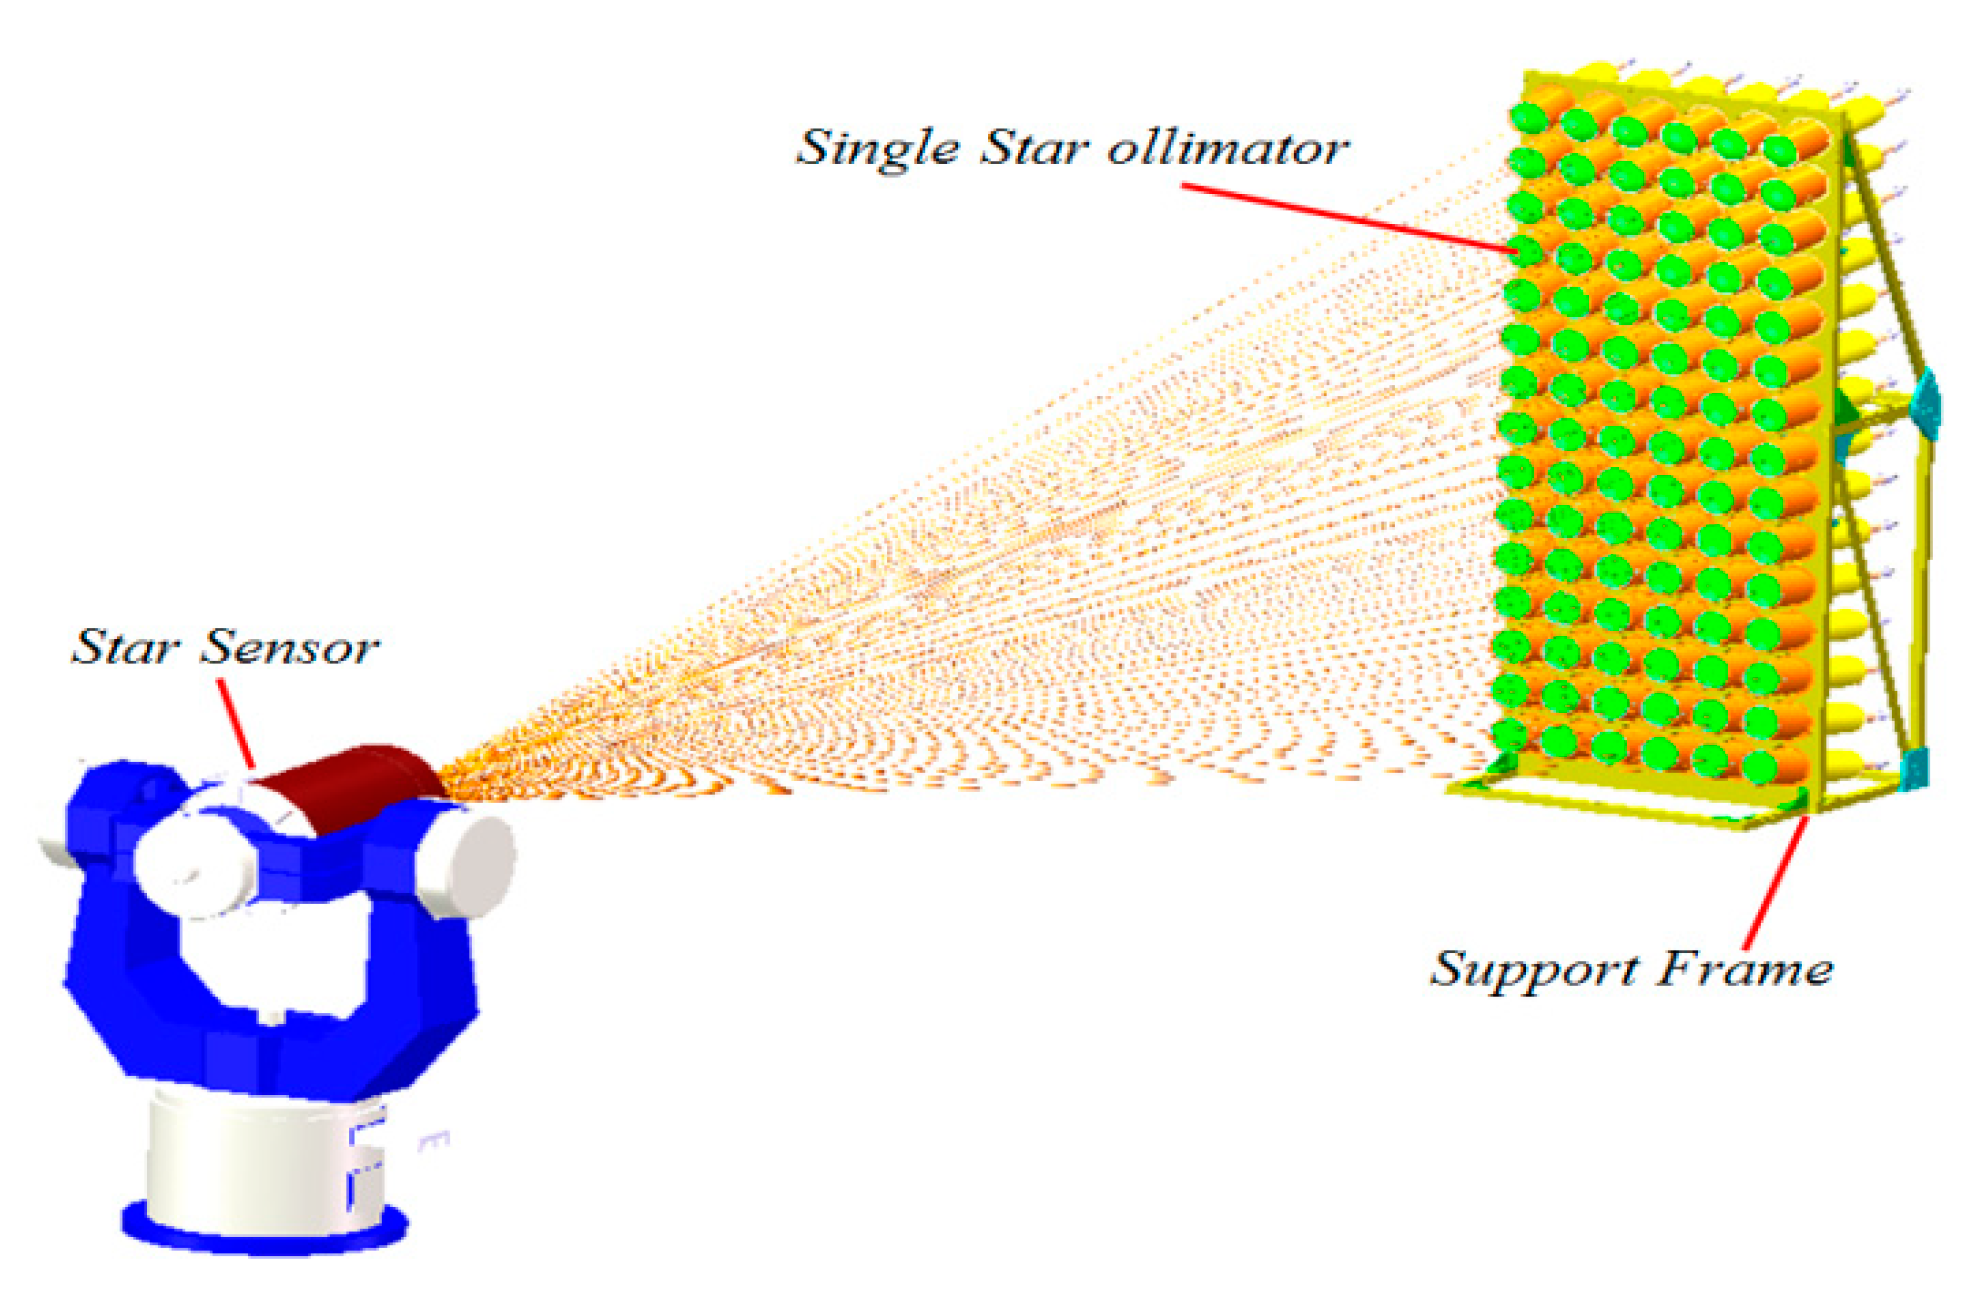
Similarly, in the calibration of star sensors, the thermal deformation of the support frame of the dome-type multi-star simulator significantly impacts the star map simulation accuracy of the simulator [
7,
8,
9]. By identifying the thermal deformation direction of the support frame, timely correction of the thermal deformation error can improve the simulation accuracy of the star simulator.
Figure 1.
James Webb Space Telescope(JWST)[
2]
.
Figure 1.
James Webb Space Telescope(JWST)[
2]
.
Figure 2.
Thirty Meter Telescope (TMT)[
3]
.
Figure 2.
Thirty Meter Telescope (TMT)[
3]
.
Figure 3.
Schematic diagram of dome type multi star simulator.
Figure 3.
Schematic diagram of dome type multi star simulator.
However, the evaluation of thermal deformation currently relies primarily on simulation analysis and lacks direct testing of object deformation. Several unresolved issues contribute to this limitation:
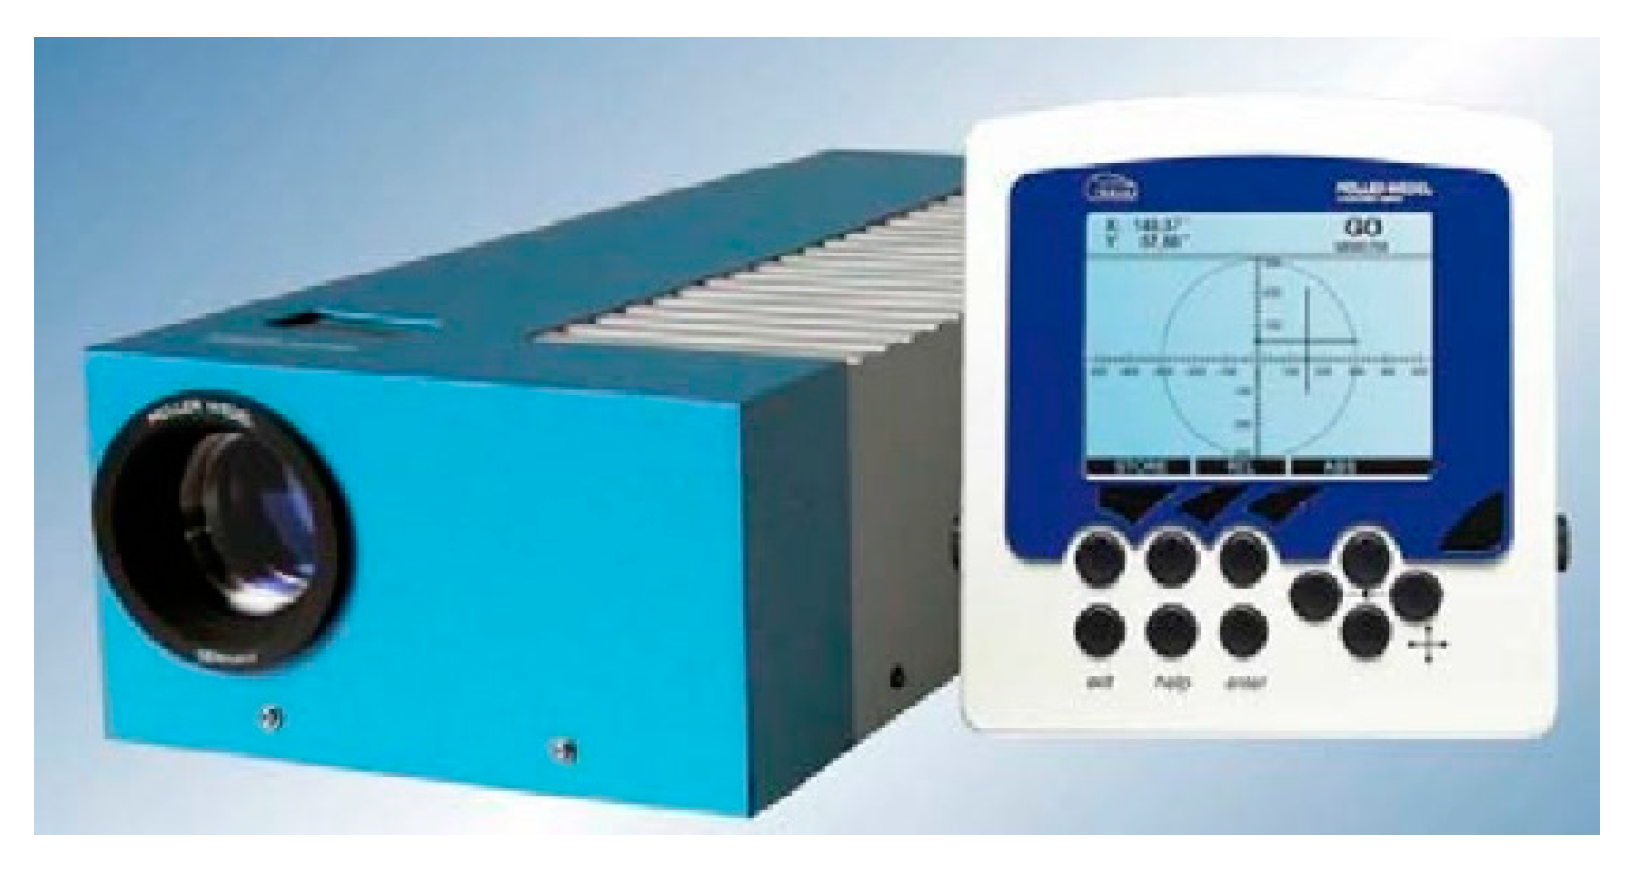
Firstly, the thermal deformation of an object is generally elastic deformation, and the change in the normal direction angle of the test area is measured in arc, sub arc, or even ultra sub arc, and it is tested at any elevation angle. Currently, the only testing equipment with a testing accuracy of 0.01 "is the Muller HR photoelectric autocollimator [
10], as shown in
Figure 4. However, this device's testing is limited to the horizontal direction within a 10° field of view to achieve the desired accuracy [
11]. Therefore, this device cannot be used for thermal deformation testing. It can be seen that there is currently no equipment that can meet the requirements for thermal deformation index testing.
Secondly, all conventional small angle testing studies focus on univariate angle testing. But, the deformation of an object is a change in the relative position of multiple parts of the object itself. Therefore, the thermal deformation of an object requires testing the changes in the bivariate angle between different parts, which is a new problem.
Lastly, thermal deformation index is proposed under specific temperature conditions. However, it is difficult to consistently replicate these exact temperature conditions during testing. Therefore, we cannot directly obtain indicator test results, which is also a problem that needs to be addressed.
This paper proposes a high-precision thermal deformation index testing scheme, which provide valuable insights for related thermal deformation index testing.
2. Testing Methods
2.1. Theoretical basis of ultra sub arc level angle measurement
For long-distance small angle testing, we usually consider using optical non-contact measurement methods, such as auto-collimation method [
12,
13], Moire fringe method [
14,
15], internal reflection reflectance method [
16], internal reflection interference phase method [
17,
18], etc.
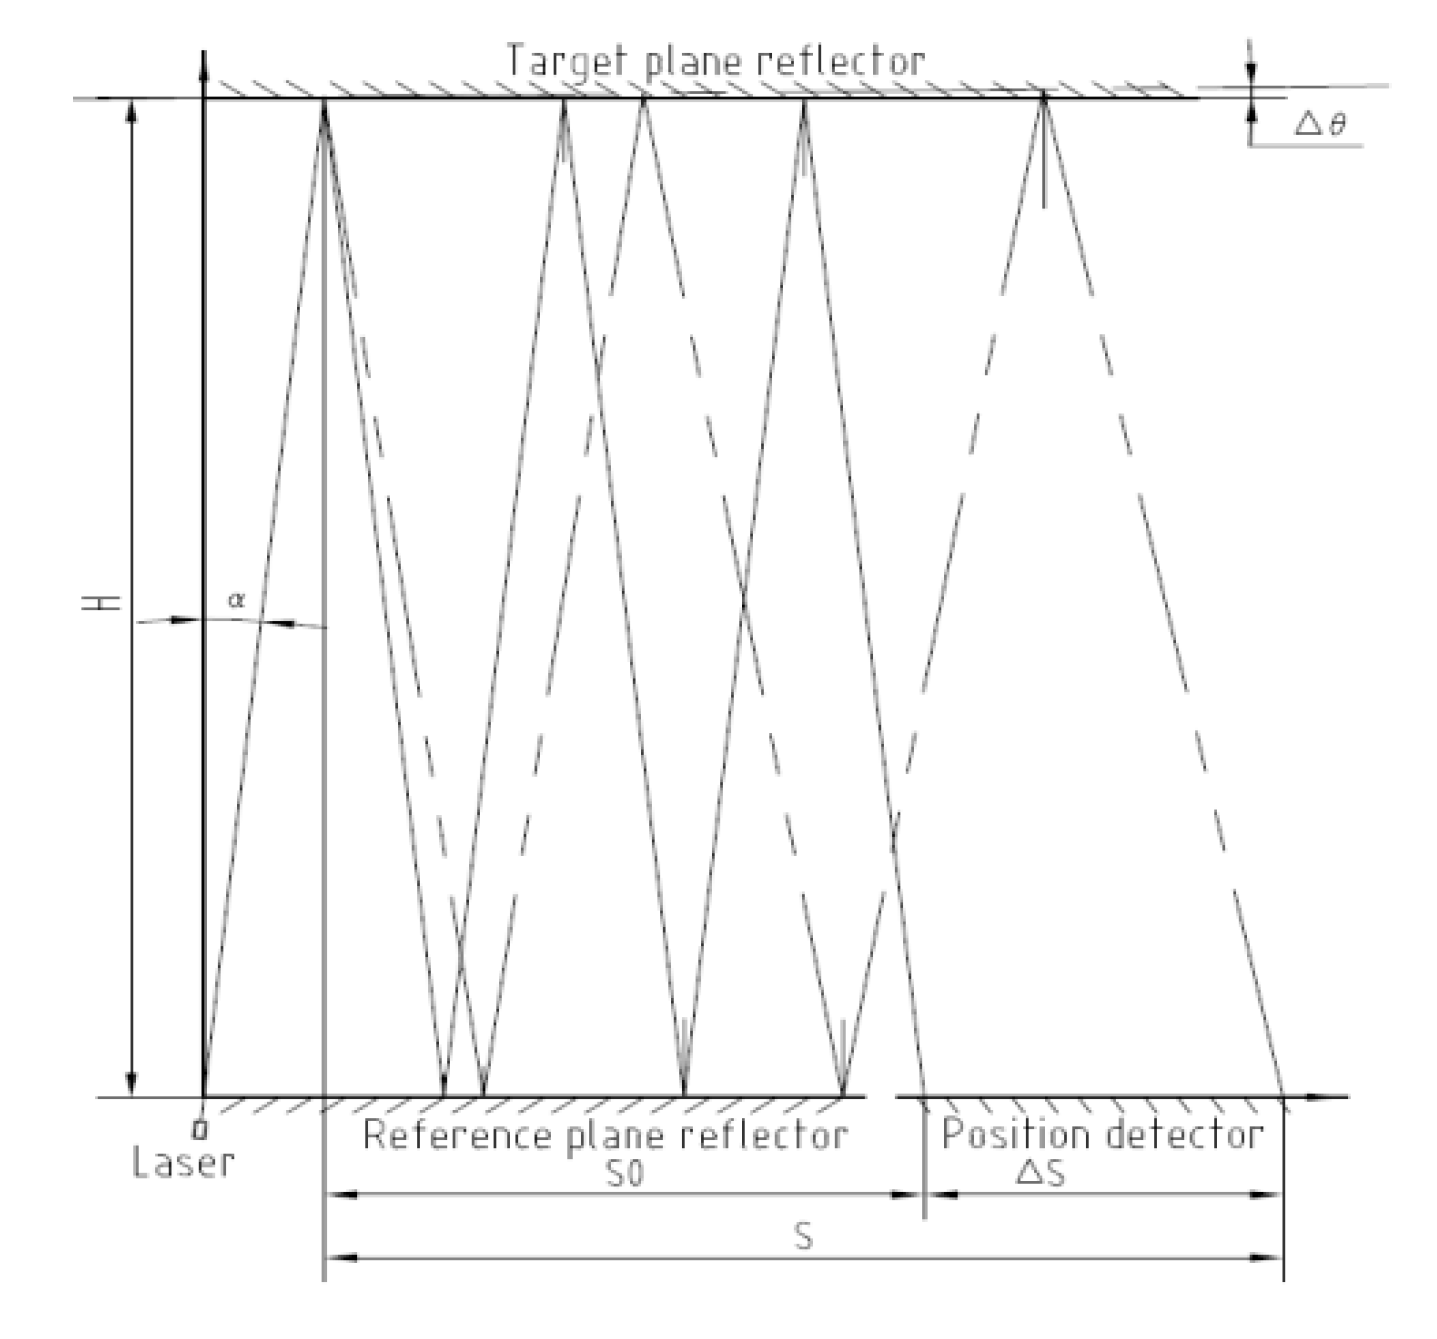
The biplane reflection calculates the angle change value through the displacement change value of the light spot [
19] as shown in
Figure 5: two plane reflector mirrors are parallel to each other; One of them serves as the target plane mirror, rigidly fixed with the measured object, deflecting along with the measured object, while the other plane mirror serves as the reference reflector mirror; The laser and the spot position detector are separated on the left and right sides of the reference plane reflector mirror; The laser is incident at a small angle, forming n reflections between two biplane mirrors. The final output laser is received by the spot position detector, recording the initial position of the light spot. The distance between the light spot and the emitting end is:
S0 is the initial position of the laser spot, α is the incident angle of the laser, H is the distance between two planar mirrors, and n is the number of times the laser reflects between two plane reflector mirrors.
When the measured object is deflected along with the target plane reflector mirror △θ, The light spot on the detector will generate a displacement △S, with a total displacement of S:
Displacement of light spot Δ S can be approximated as:
Among them, dθ represents the angle testing accuracy, and ds represents the displacement resolution of the spot position detector.
We can see from formula (5) that increasing the number of reflection cycles n and increasing the distance H of the double-sided mirror can both improve the sensitivity of angle measurement. As long as we select a detector with appropriate resolution, match the number of reflections n and the testing distance H, we can theoretically obtain a testing accuracy of ultra sub arc. Moreover, this testing principle is not limited by the pitch angle and can be tested at any pitch angle.
2.2. Dual variable angle variation test
We can see from equation (4) that the angle change value is calculated through the displacement change value of the light spot. Therefore, we can also calculate the change value of the bivariate angle through the relative displacement value of the bivariate spot for testing.
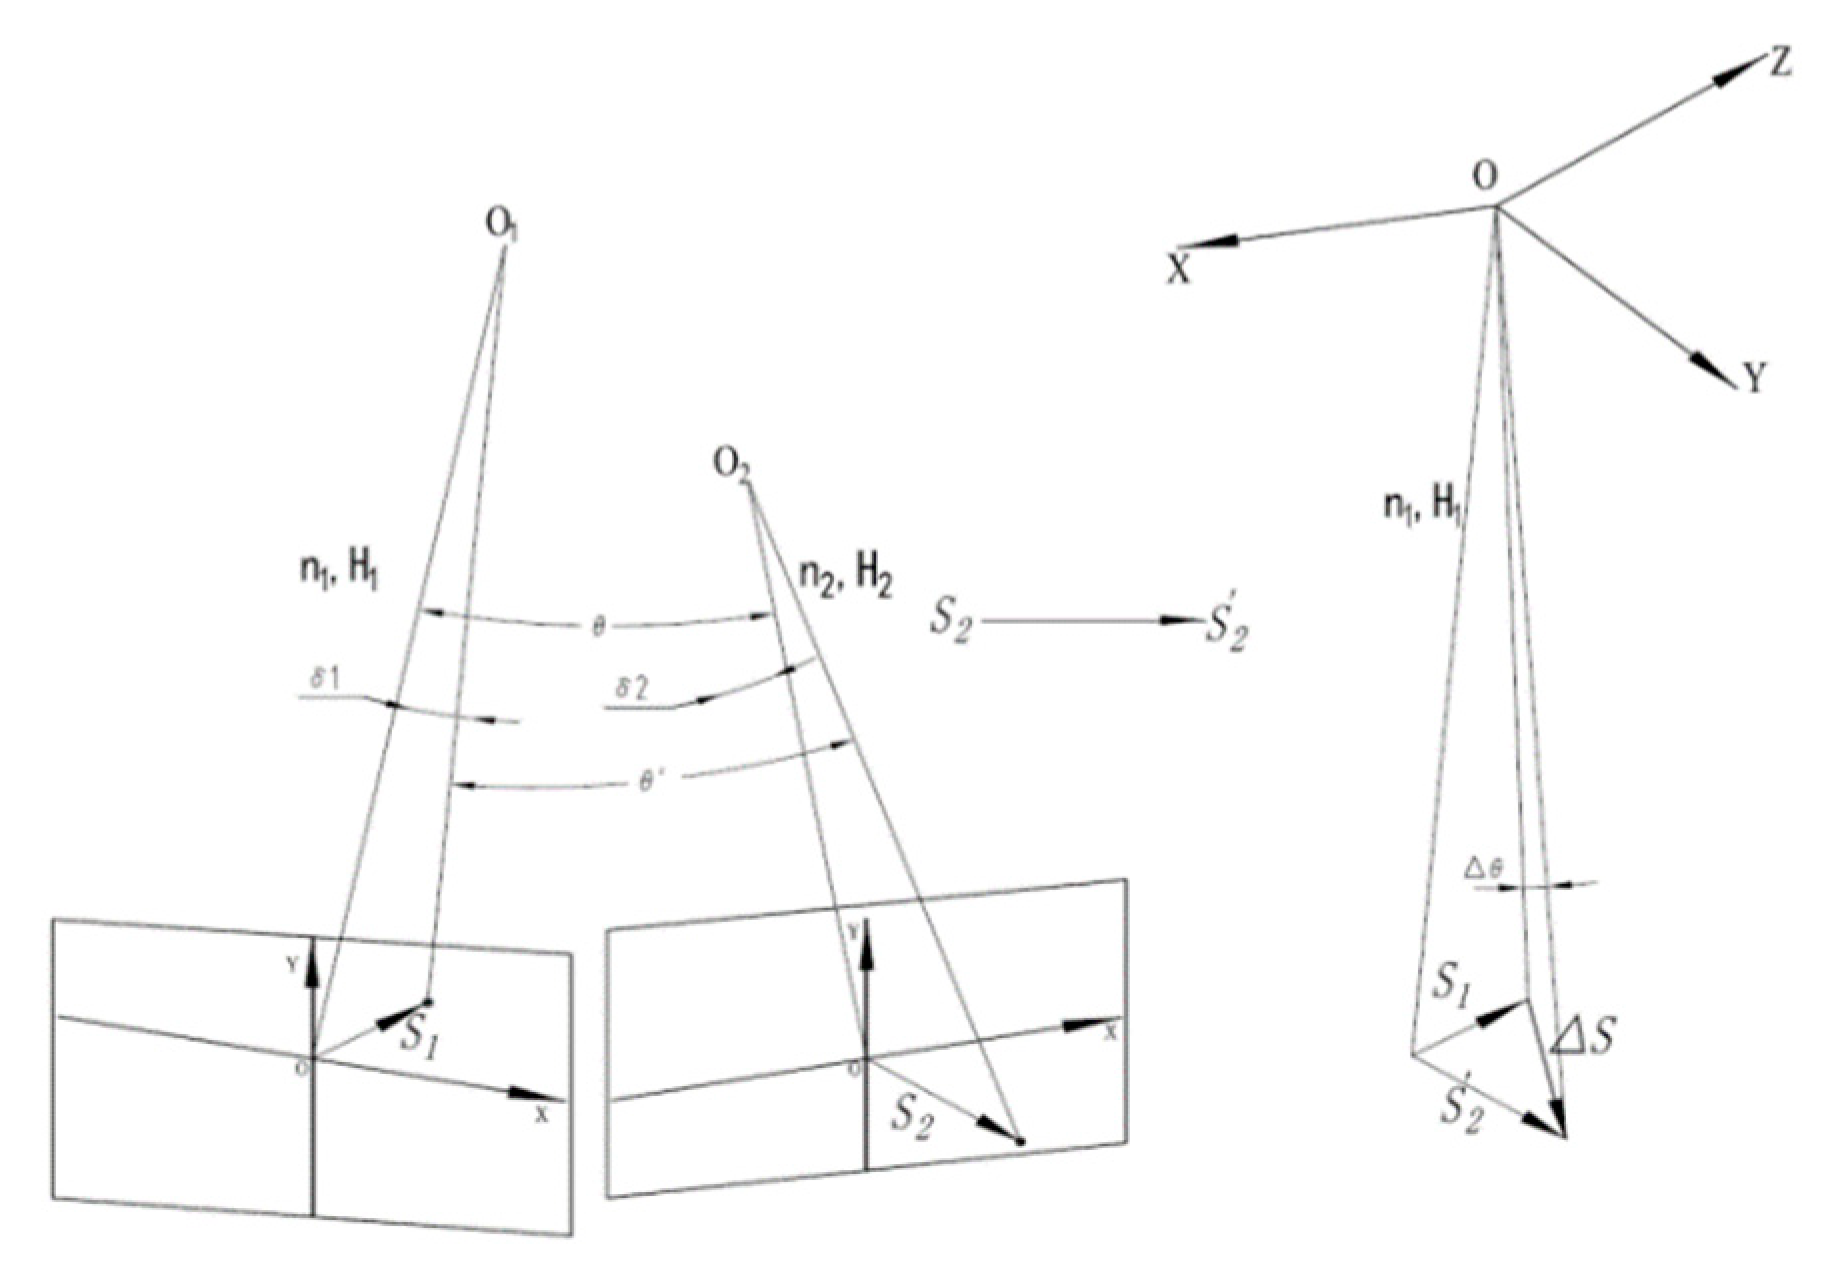
To calculate the relative displacement of the bivariate laser spot, we first need to convert the displacement Si measured at different reflection times ni and testing distance Hi to the uniform displacement Si 'of the spot under the conditions of reflection times n and testing distance H; Then, through vector calculation, obtain the relative displacement value △S of the bivariate laser spot; Finally, calculate the relative angle change value of the two variables according to equation (4).
We assume two variables: O1 and O2: the test parameters for variable O1 are: reflection number n1 and distance H1, spot displacement S1, and the test parameters for variable O2 are: reflection number n2 and distance H2, spot displacement S2.
Based on the test parameters of variable O
1, convert S
2 measured under O
2 n
2 and H
2 conditions to S
2 'under O
1, n
1 and H
1 conditions:
We can see from equation (6) that the conversion of displacement only changes the numerical value and does not change the vector direction of O
2 displacement. The relative displacement △S of the dual laser spot:
We then calculate the relative angle change value △θ of the two variables based on equation (4), and the schematic diagram of relative displacement calculation is shown in
Figure 6.
2.3. Conversion algorithm for thermal conditions
We know that the thermal deformation of linear materials is directly proportional to temperature within the temperature range of linear expansion coefficient. Therefore, we can infer that within the linear temperature range, the thermal deformation between the two temperature measuring points of the linear material is directly proportional to the magnitude of the temperature gradient, as shown in equation (8).
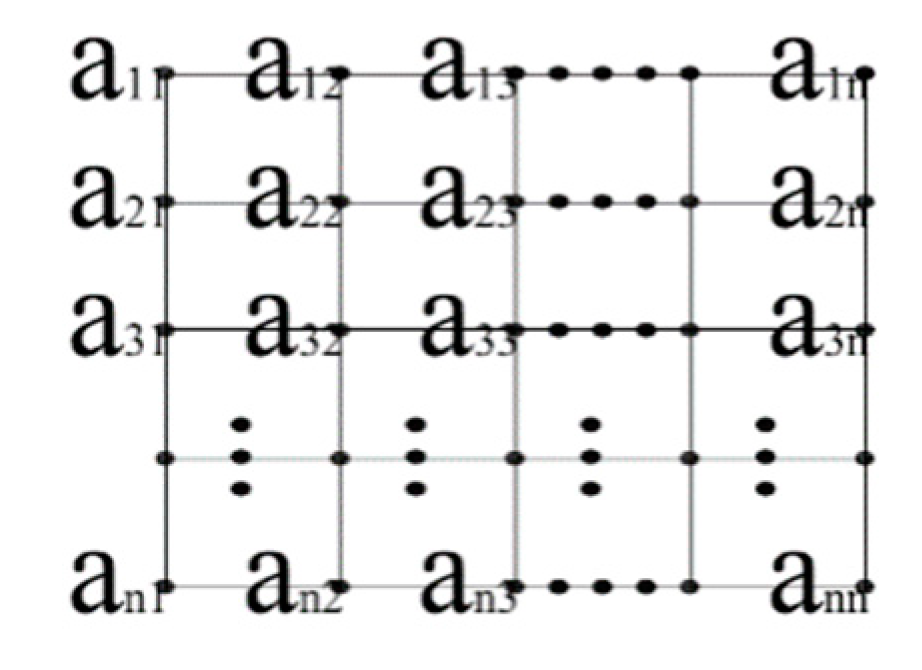
We use the Discretization mathematical idea to set the temperature control conditions as the small grid temperature matrix, as shown in
Figure 7.
We can further infer that the ratio of thermal deformation under the actual temperature controlled temperature gradient to the thermal deformation under the specified temperature gradient is directly proportional to the ratio of the two temperature gradients, as shown in equation (9):
We use the Discretization mathematical idea to set the temperature control conditions as the small grid temperature matrix, as shown in
Figure 7. We obtain the set temperature gradient matrix (ΔT
0)by decomposing the set temperature conditions, and calculate the actual temperature gradient matrix(ΔT)′ from the actual temperature matrix, as shown in equation (10).
We calculate the ratio of the corresponding elements of two matrices, as shown in equation (11), and obtain a comparison matrix N, as shown in equation (12). We use the concept of mathematical Matrix norm to calculate the norm formula of the comparison matrix N, as shown in Formula (13).
The temperature gradient matrix is divided into row direction temperature gradient matrix and column direction temperature gradient matrix. Taking the row direction temperature gradient matrix as an example, the row direction comparison Matrix norm is:
Similarly, the column direction comparison Matrix norm is:
Therefore, the average norm of the ratio matrix, which is the average multiplier of the temperature gradient, is:
According to the linear expansion law of materials, the thermal deformation index under the set temperature gradient is:
3. Test and verification
3.1. Test System Parameter Design
3.1.1. Introduction to Test Objectives
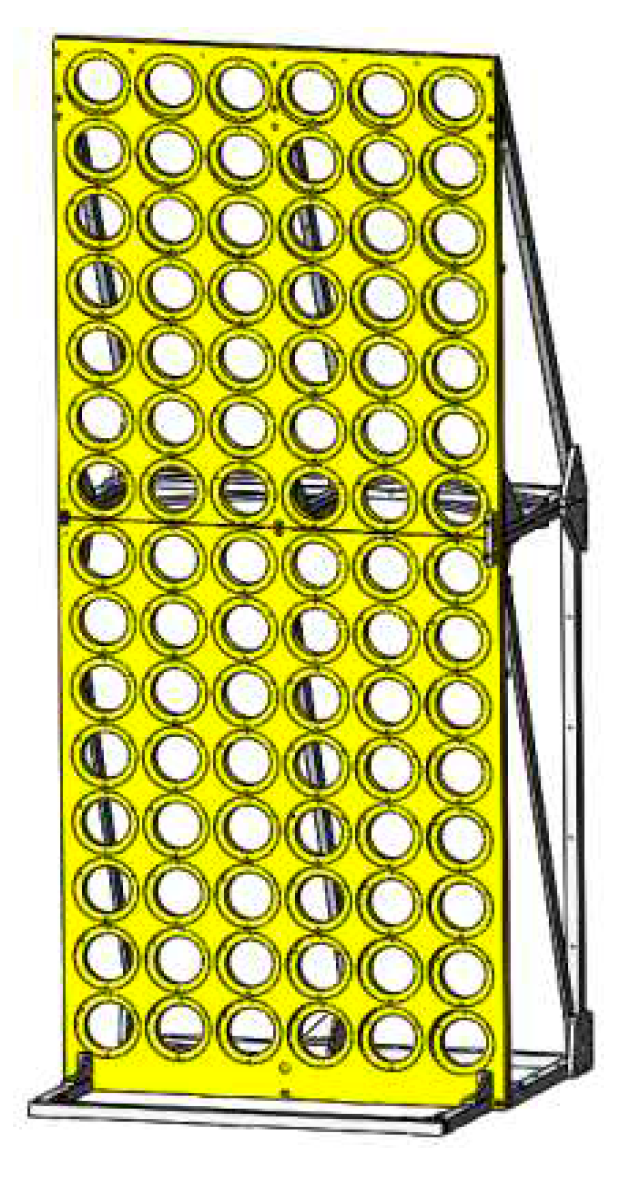
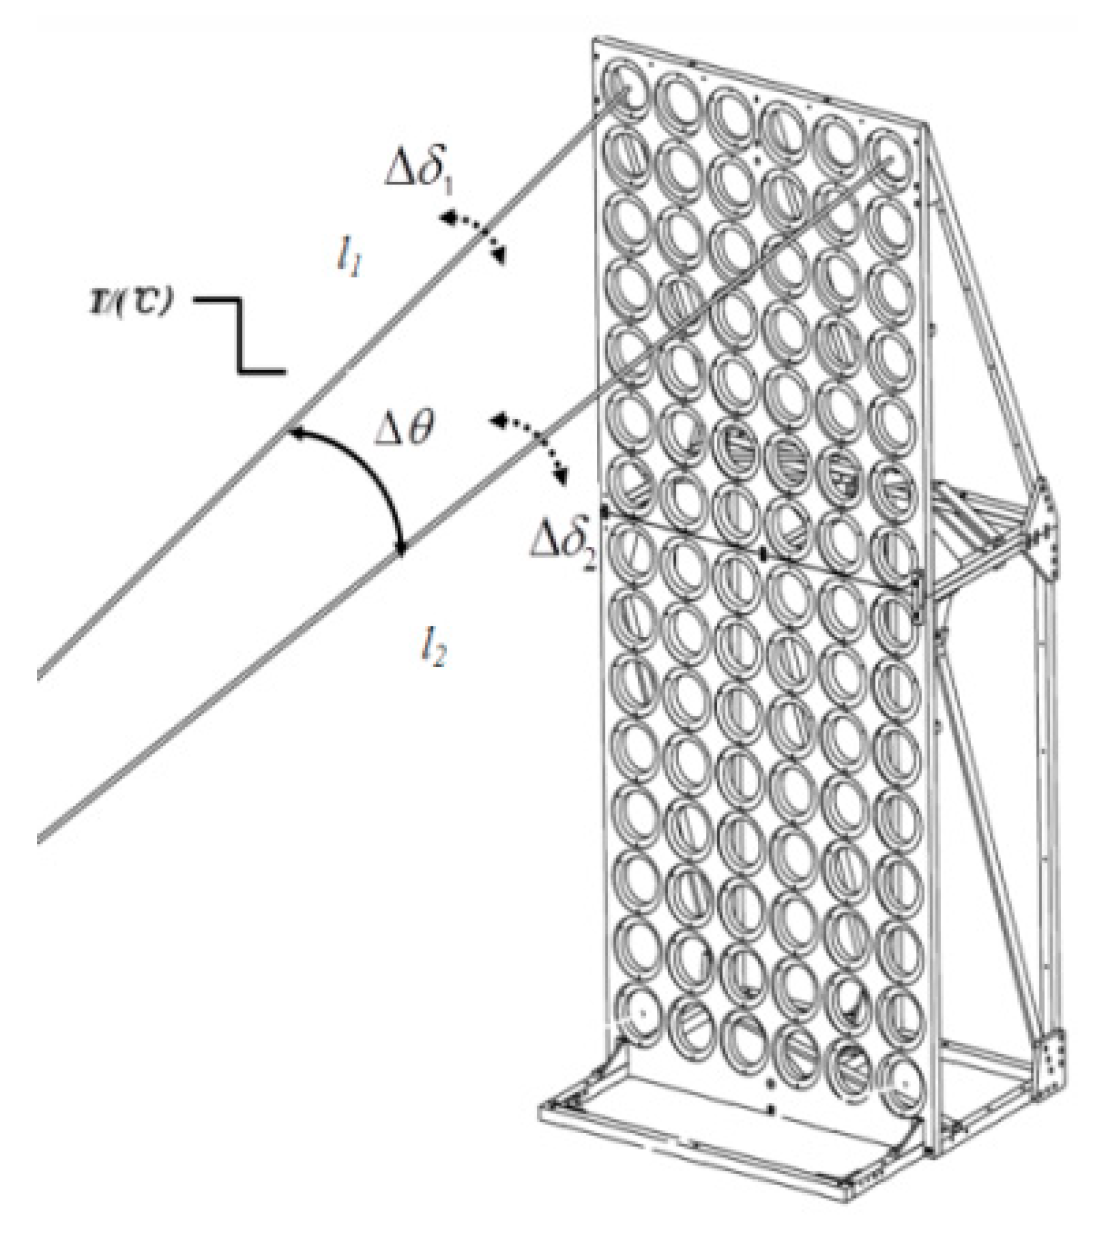
In order to verify the rationality of the above testing plan, we test the thermal stability of the support frame of a certain dome multi star simulator. The schematic diagram of the support frame is shown in
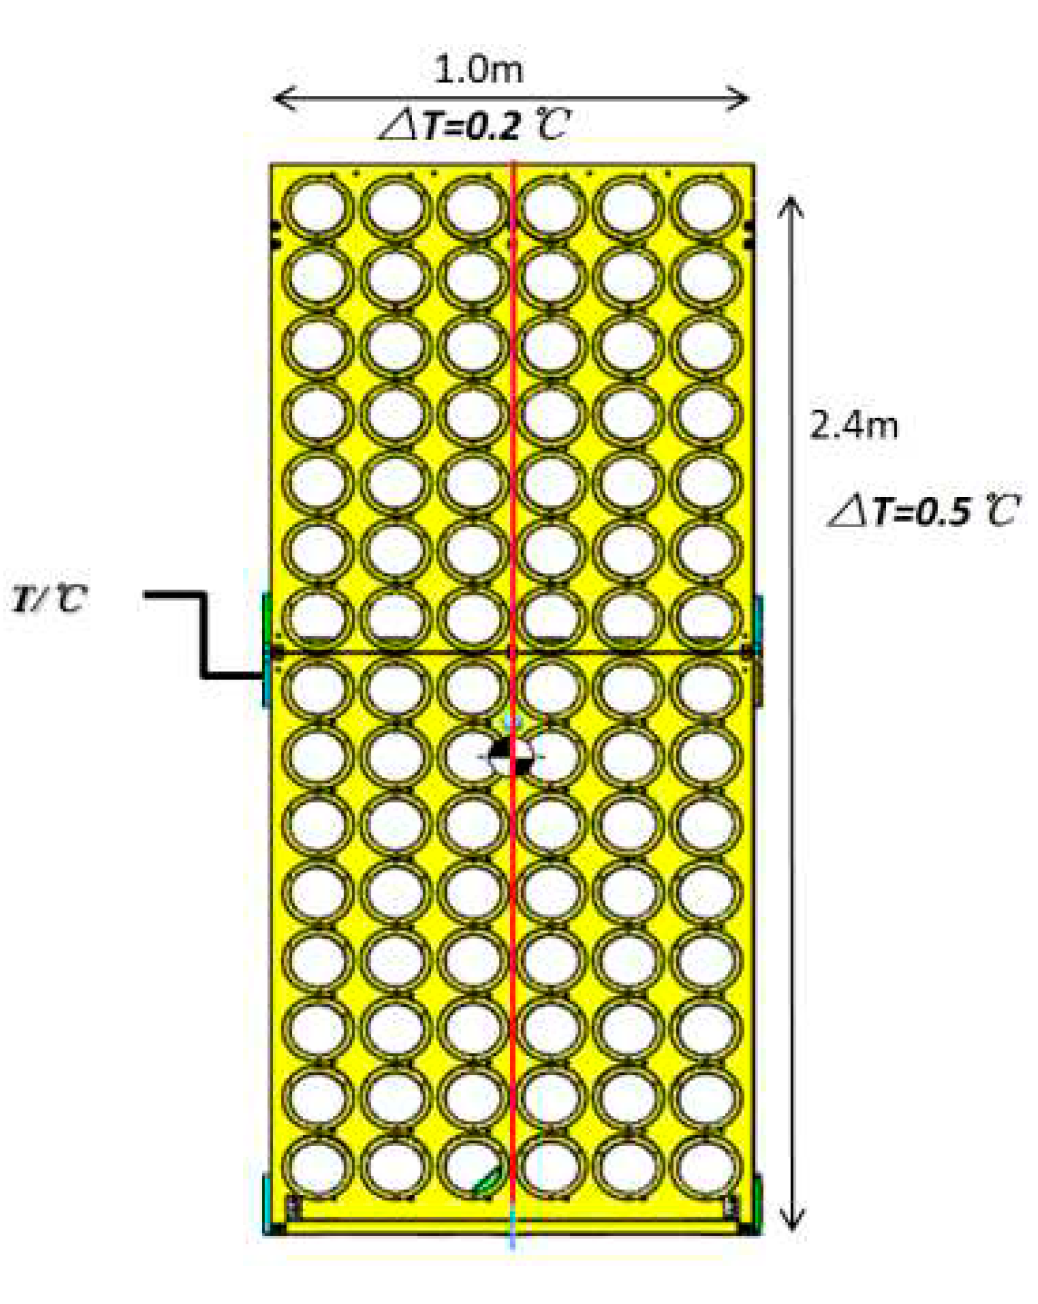
Figure 8, and the temperature gradient conditions of its thermal index is shown in
Figure 9. Through finite element simulation analysis, we have learned that the thermal deformation rate of the angle between the installation surface normals of the two single star parallel light tubes in the upper left and upper right corners of the support frame is ν= 0.359 ″/℃, as shown in
Figure 10. The physical definition of the rate of angular thermal deformation change is shown in formula 18.
Based on the testing plan, it can seen that the rate of change of the angle at a specific temperature is:
At the same time, we can see from
Figure 9 that the left and right mirror symmetrical structure of the support frame, and the relative angle between the two normals is 6.71 °, which means that the thermal deformation changes of its upper left and upper right mounting surfaces should be mirror symmetrical. Therefore, we only need to measure the change in normal direction of one of the single variables, and simultaneously obtain the change in normal direction of the two variables.
3.1.2. Test System Parameter Design
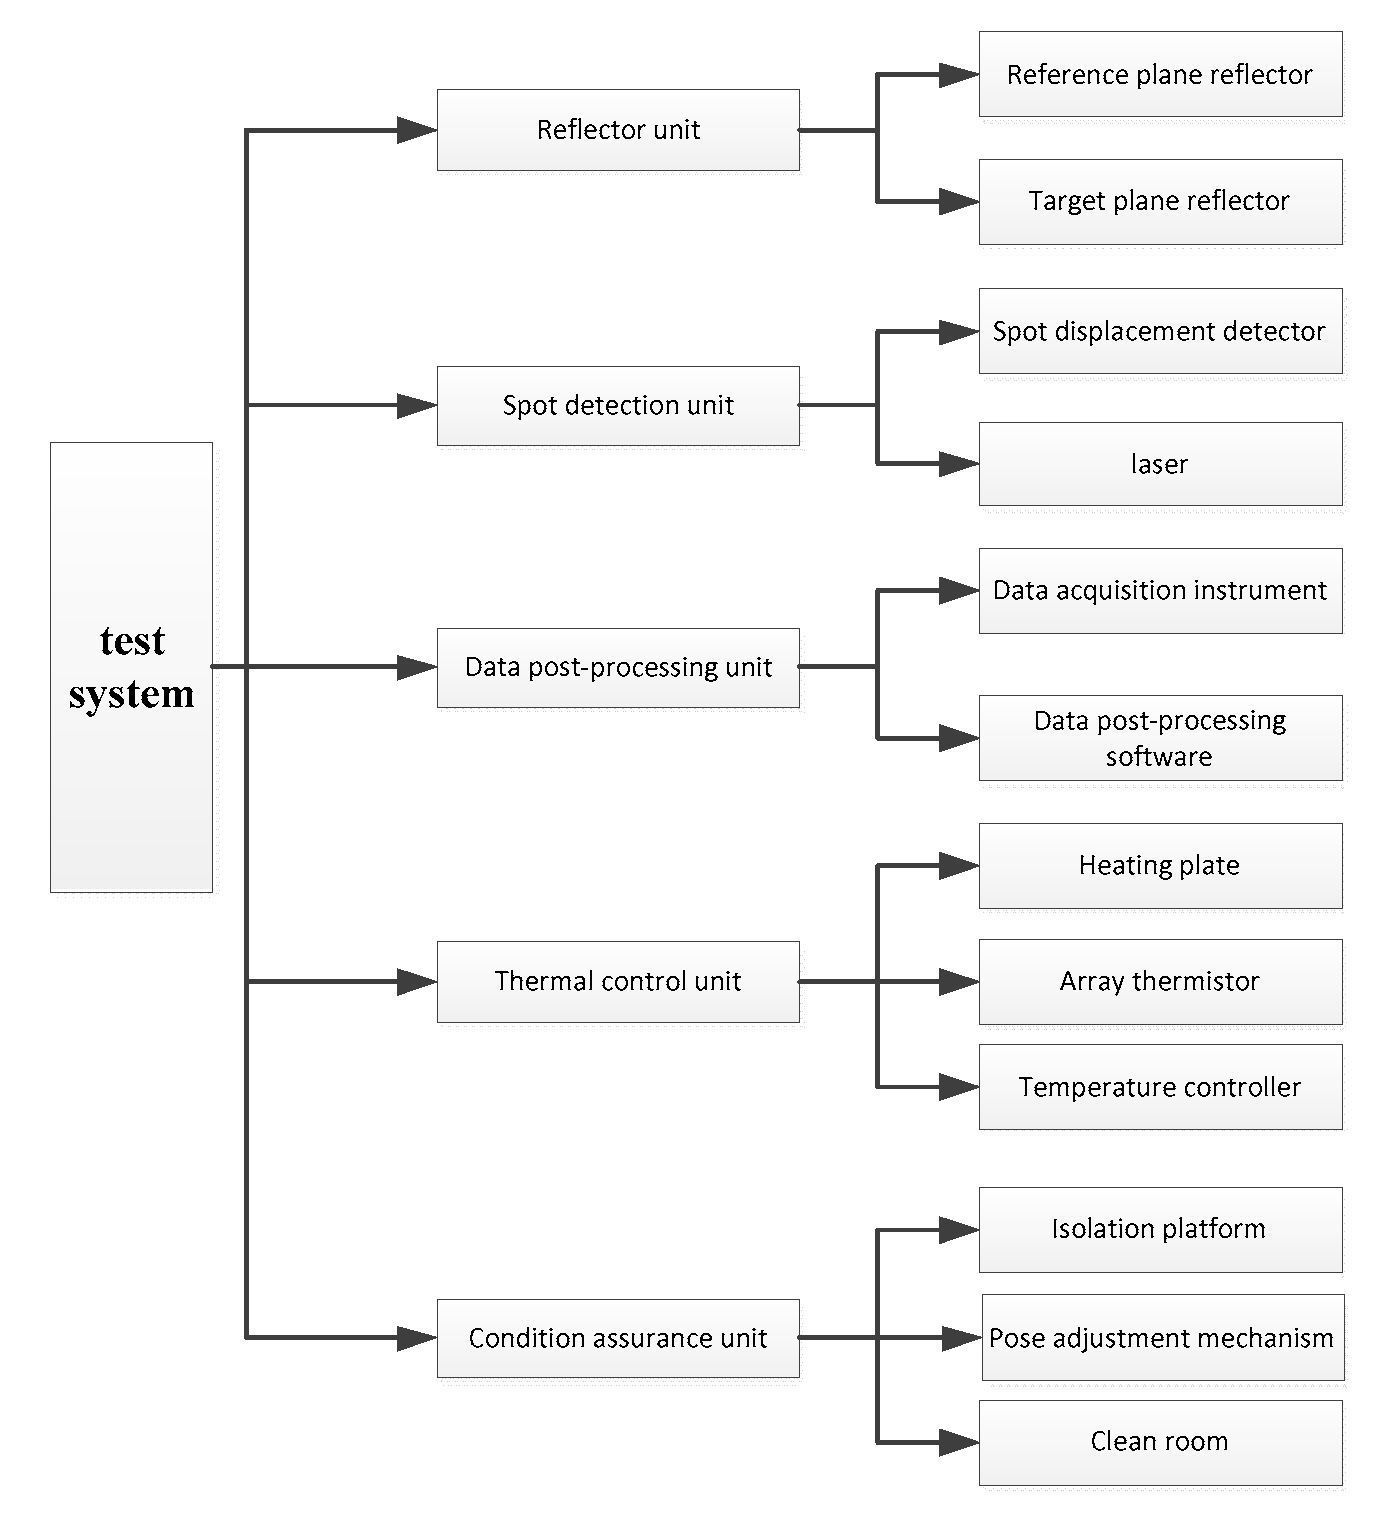
According to the aforementioned testing methods, we have developed a dual variable relative angle thermal deformation angle measurement system, which includes a laser spot detection unit, a biplane reflector unit, a post-processing unit, and a condition guarantee unit,the specific composition is shown in
Figure 11. Among them, the biplane reflection unit and the laser spot detection unit are used for detecting deformation laser spot displacement changes, and the thermal control unit is used for the heating operation of the support frame.
For laser spot displacement detectors, we choose Position Sensitive Detector (PSD) devices[
20]. This is because PSD has the following advantages[
21]: 1) The shape of the light spot does not affect the measurement of the displacement change value of the light spot by PSD; 2) The PSD target resolution is extremely high and has achieved 1 μ M resolution, 3) and has a high sampling frequency, which can output the spot coordinate value in real time, which is conducive to the development of Test automation equipment in the later stage.
Therefore, PSD is widely used in non-contact rapid measurement of displacement and distance [
22]. Meanwhile, with the further evolution and optimization of PSD, the measurement accuracy of PSD will become more precise. For example, the 3CSiC/Si heterostructure proposed by Abu Riduan, Md Foisal et al may be a position sensitive detector [
23], which is a promising choice in harsh environments (such as highly corrosive environments). Therefore, choosing PSD in this paper is more conducive to the later promotion and application of the testing plan. Therefore, choosing PSD devices is more conducive to the promotion and application of this scheme.
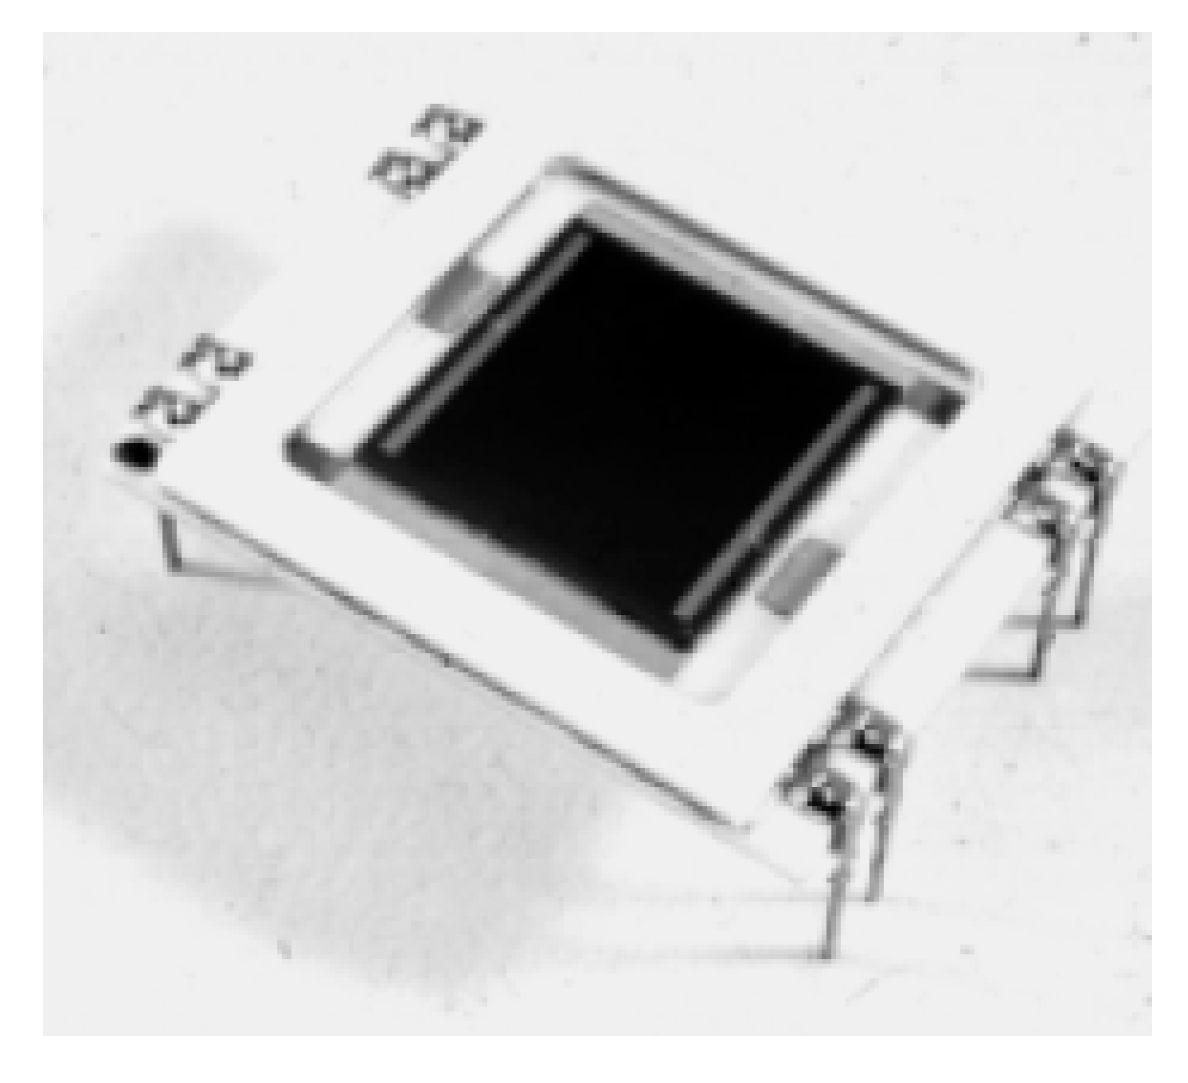
Finally, we select Shanghai Ou-guang Company's S2-0003-2L10-SU24 two dimensional PSD detector and its controller [
24], as shown in
Figure 12. Its resolution is 1μm, effective photosensitive surface is 10mm×10mm, spectral response range is 380nm~1000 nm.
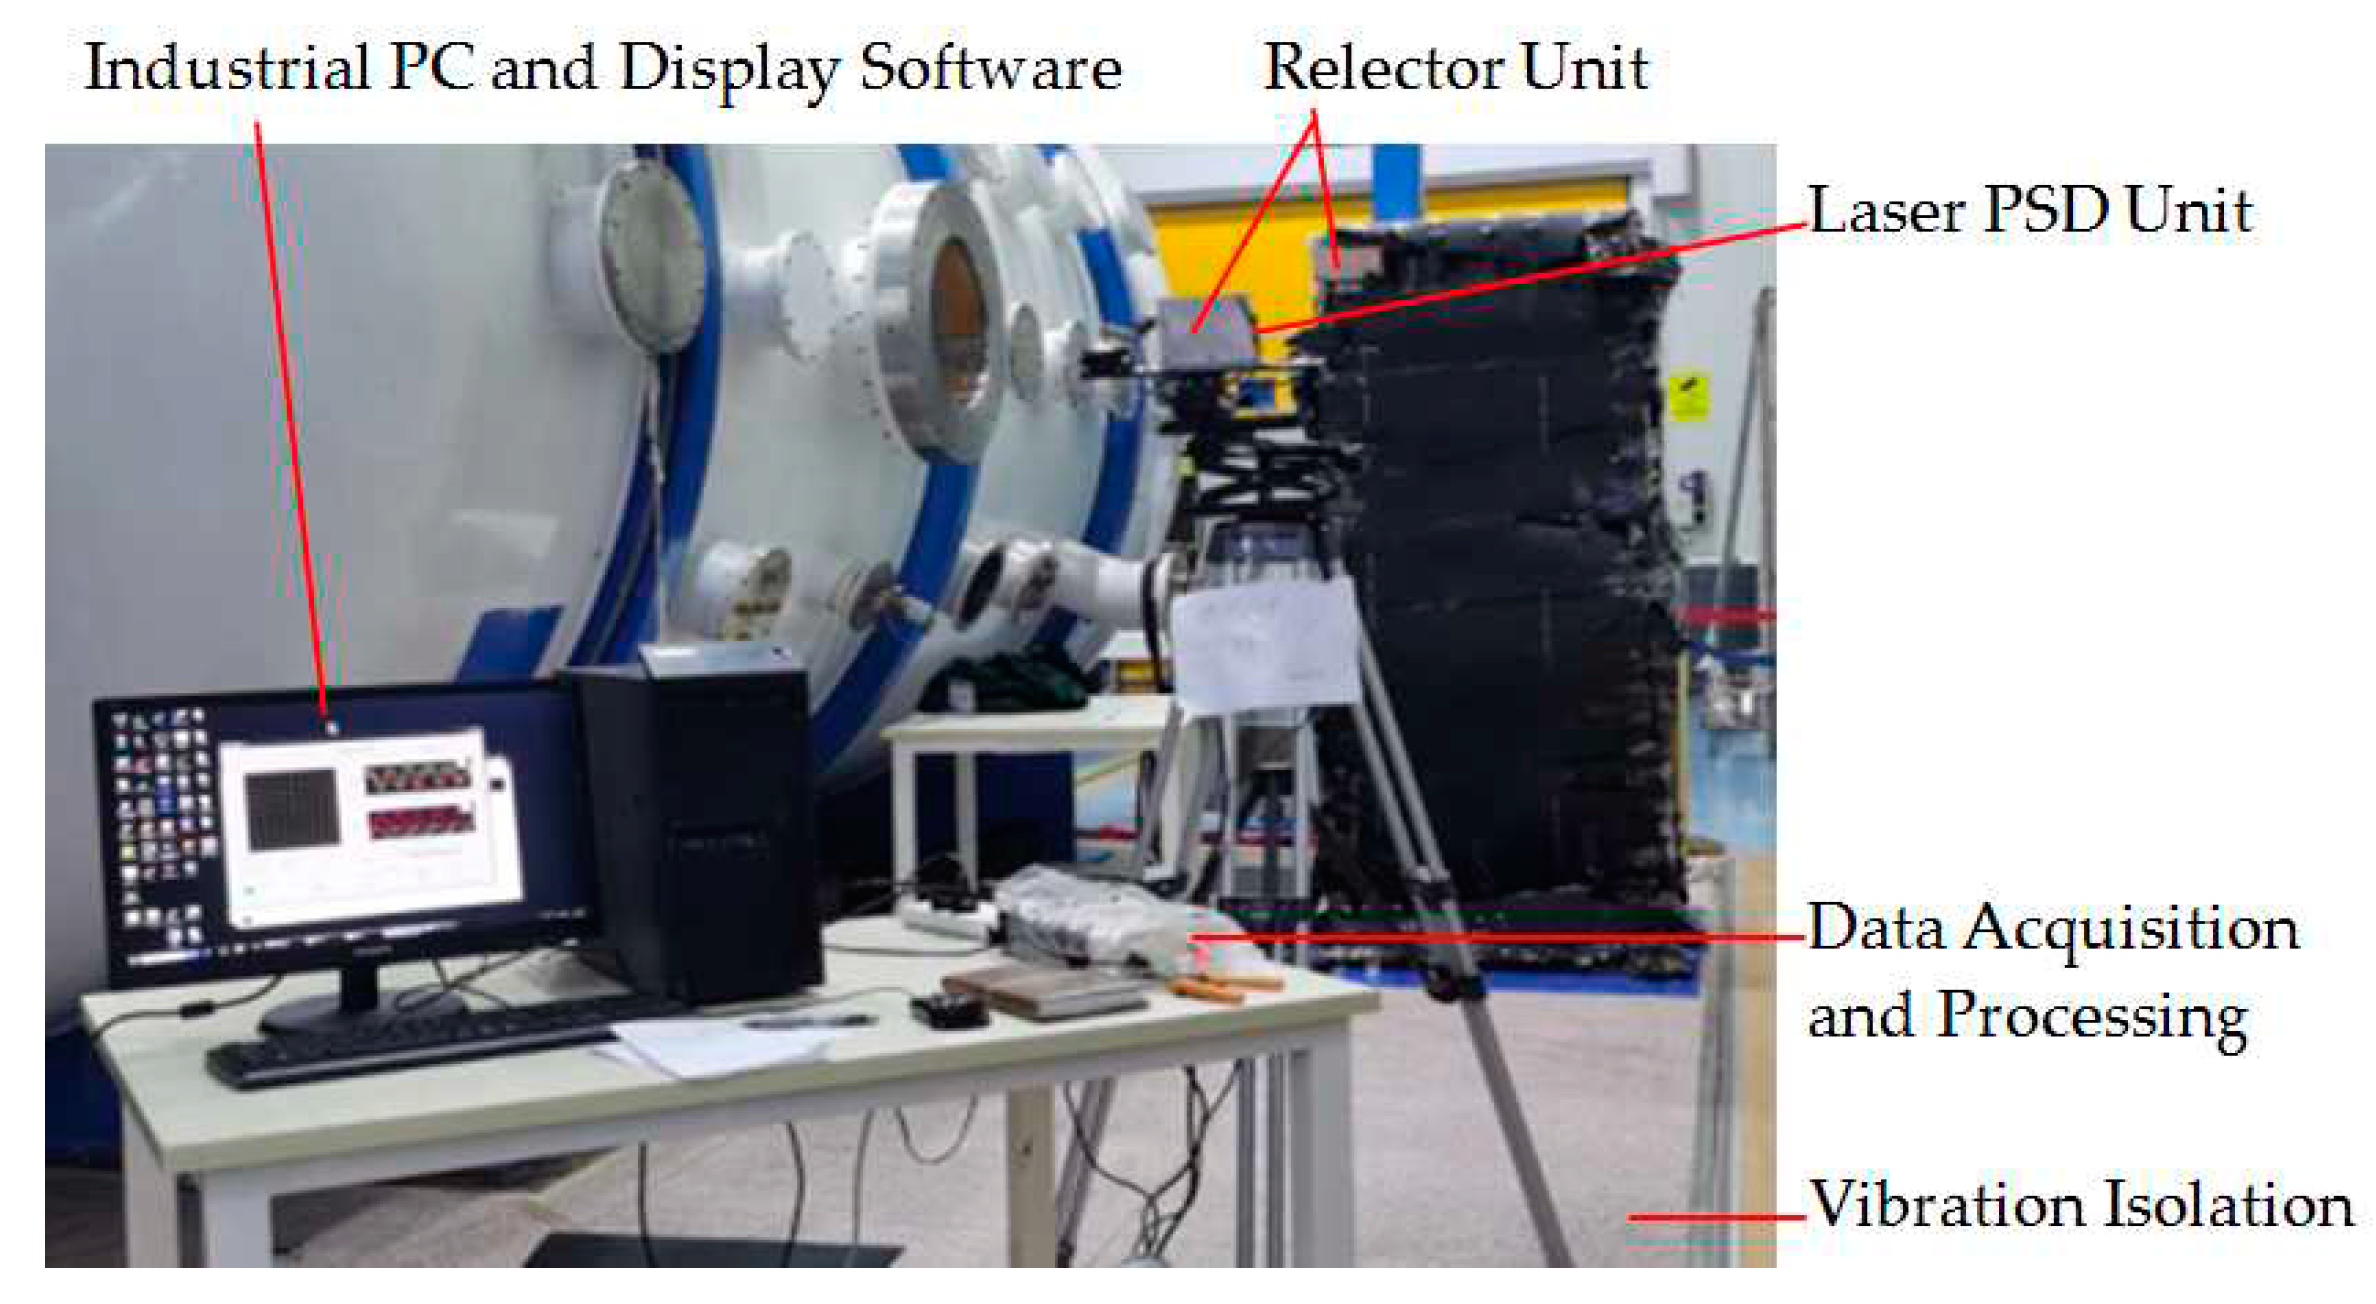
The composition of the testing system is shown in
Figure 13, where the laser passes through two reflection cycles and lands on the PSD detector. The distance H between the two planar mirrors is 3435 mm.
The composition of the entire testing system is shown in
Figure 12. The laser passes through two reflection cycles and lands on the PSD detector, with two planar mirrors spaced at a distance of H of 3435 mm. According to the biplane reflection principle mentioned earlier, the parameters of the above testing system are brought into equation (17), and the testing resolution of the testing system is 0.015 ″, which can achieve angle testing accuracy of bivariate angle overpressure angle in seconds.
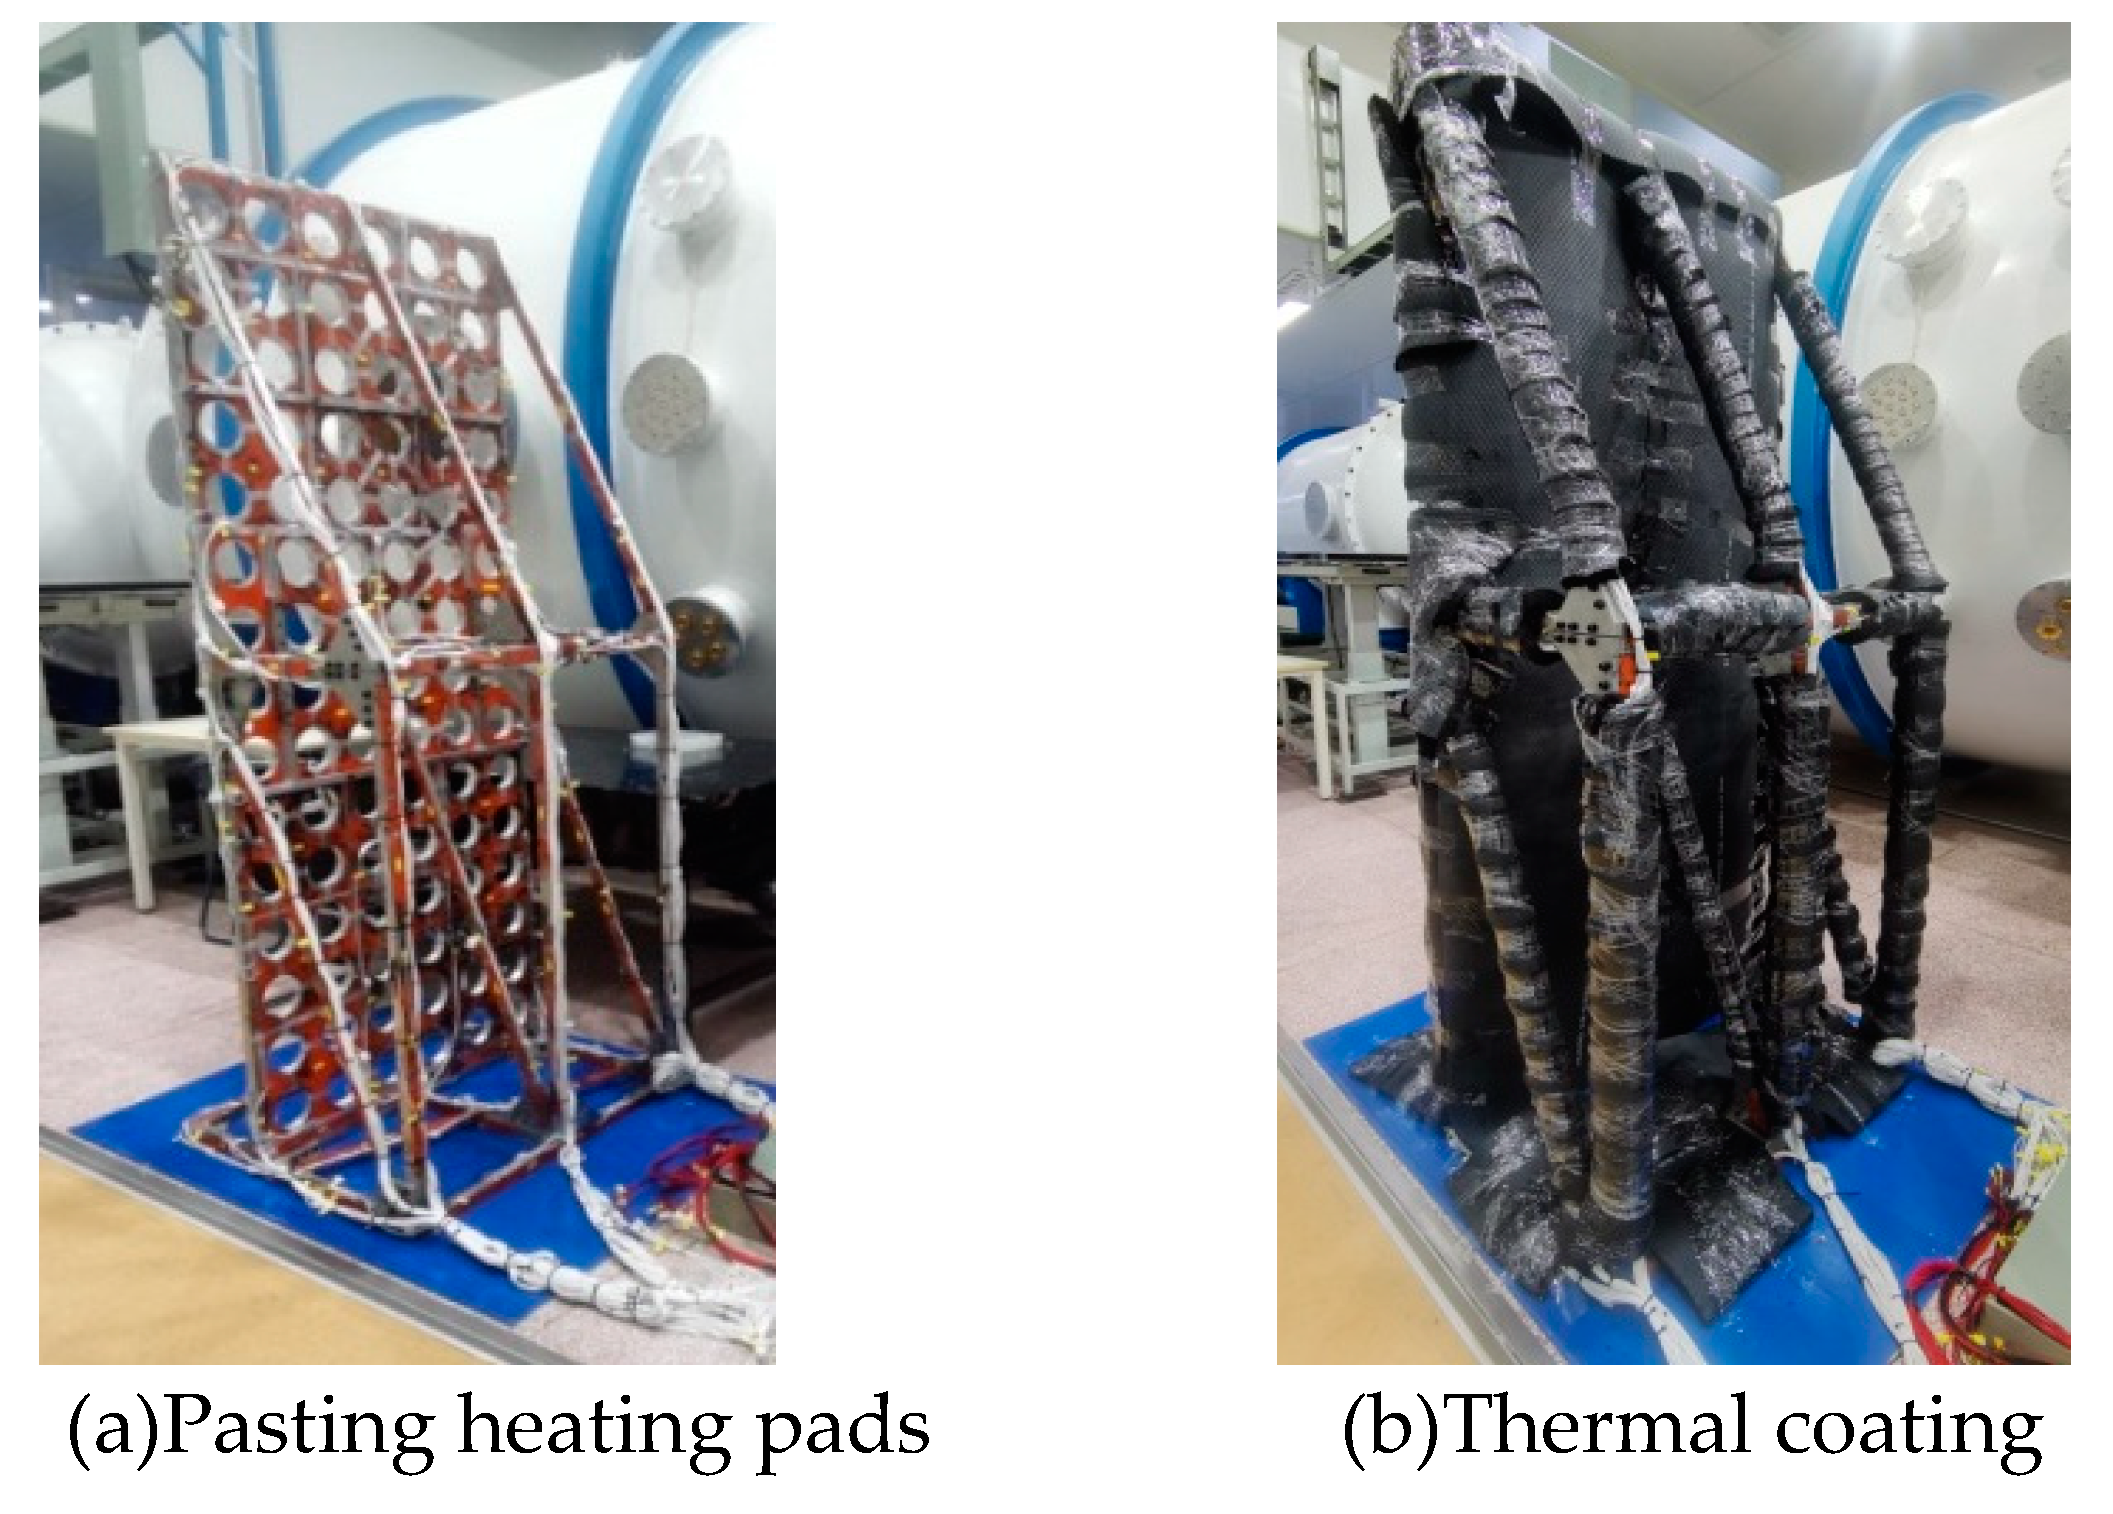
The coverage and thermal coating of the heating element implemented by the thermal control of the support frame are shown in
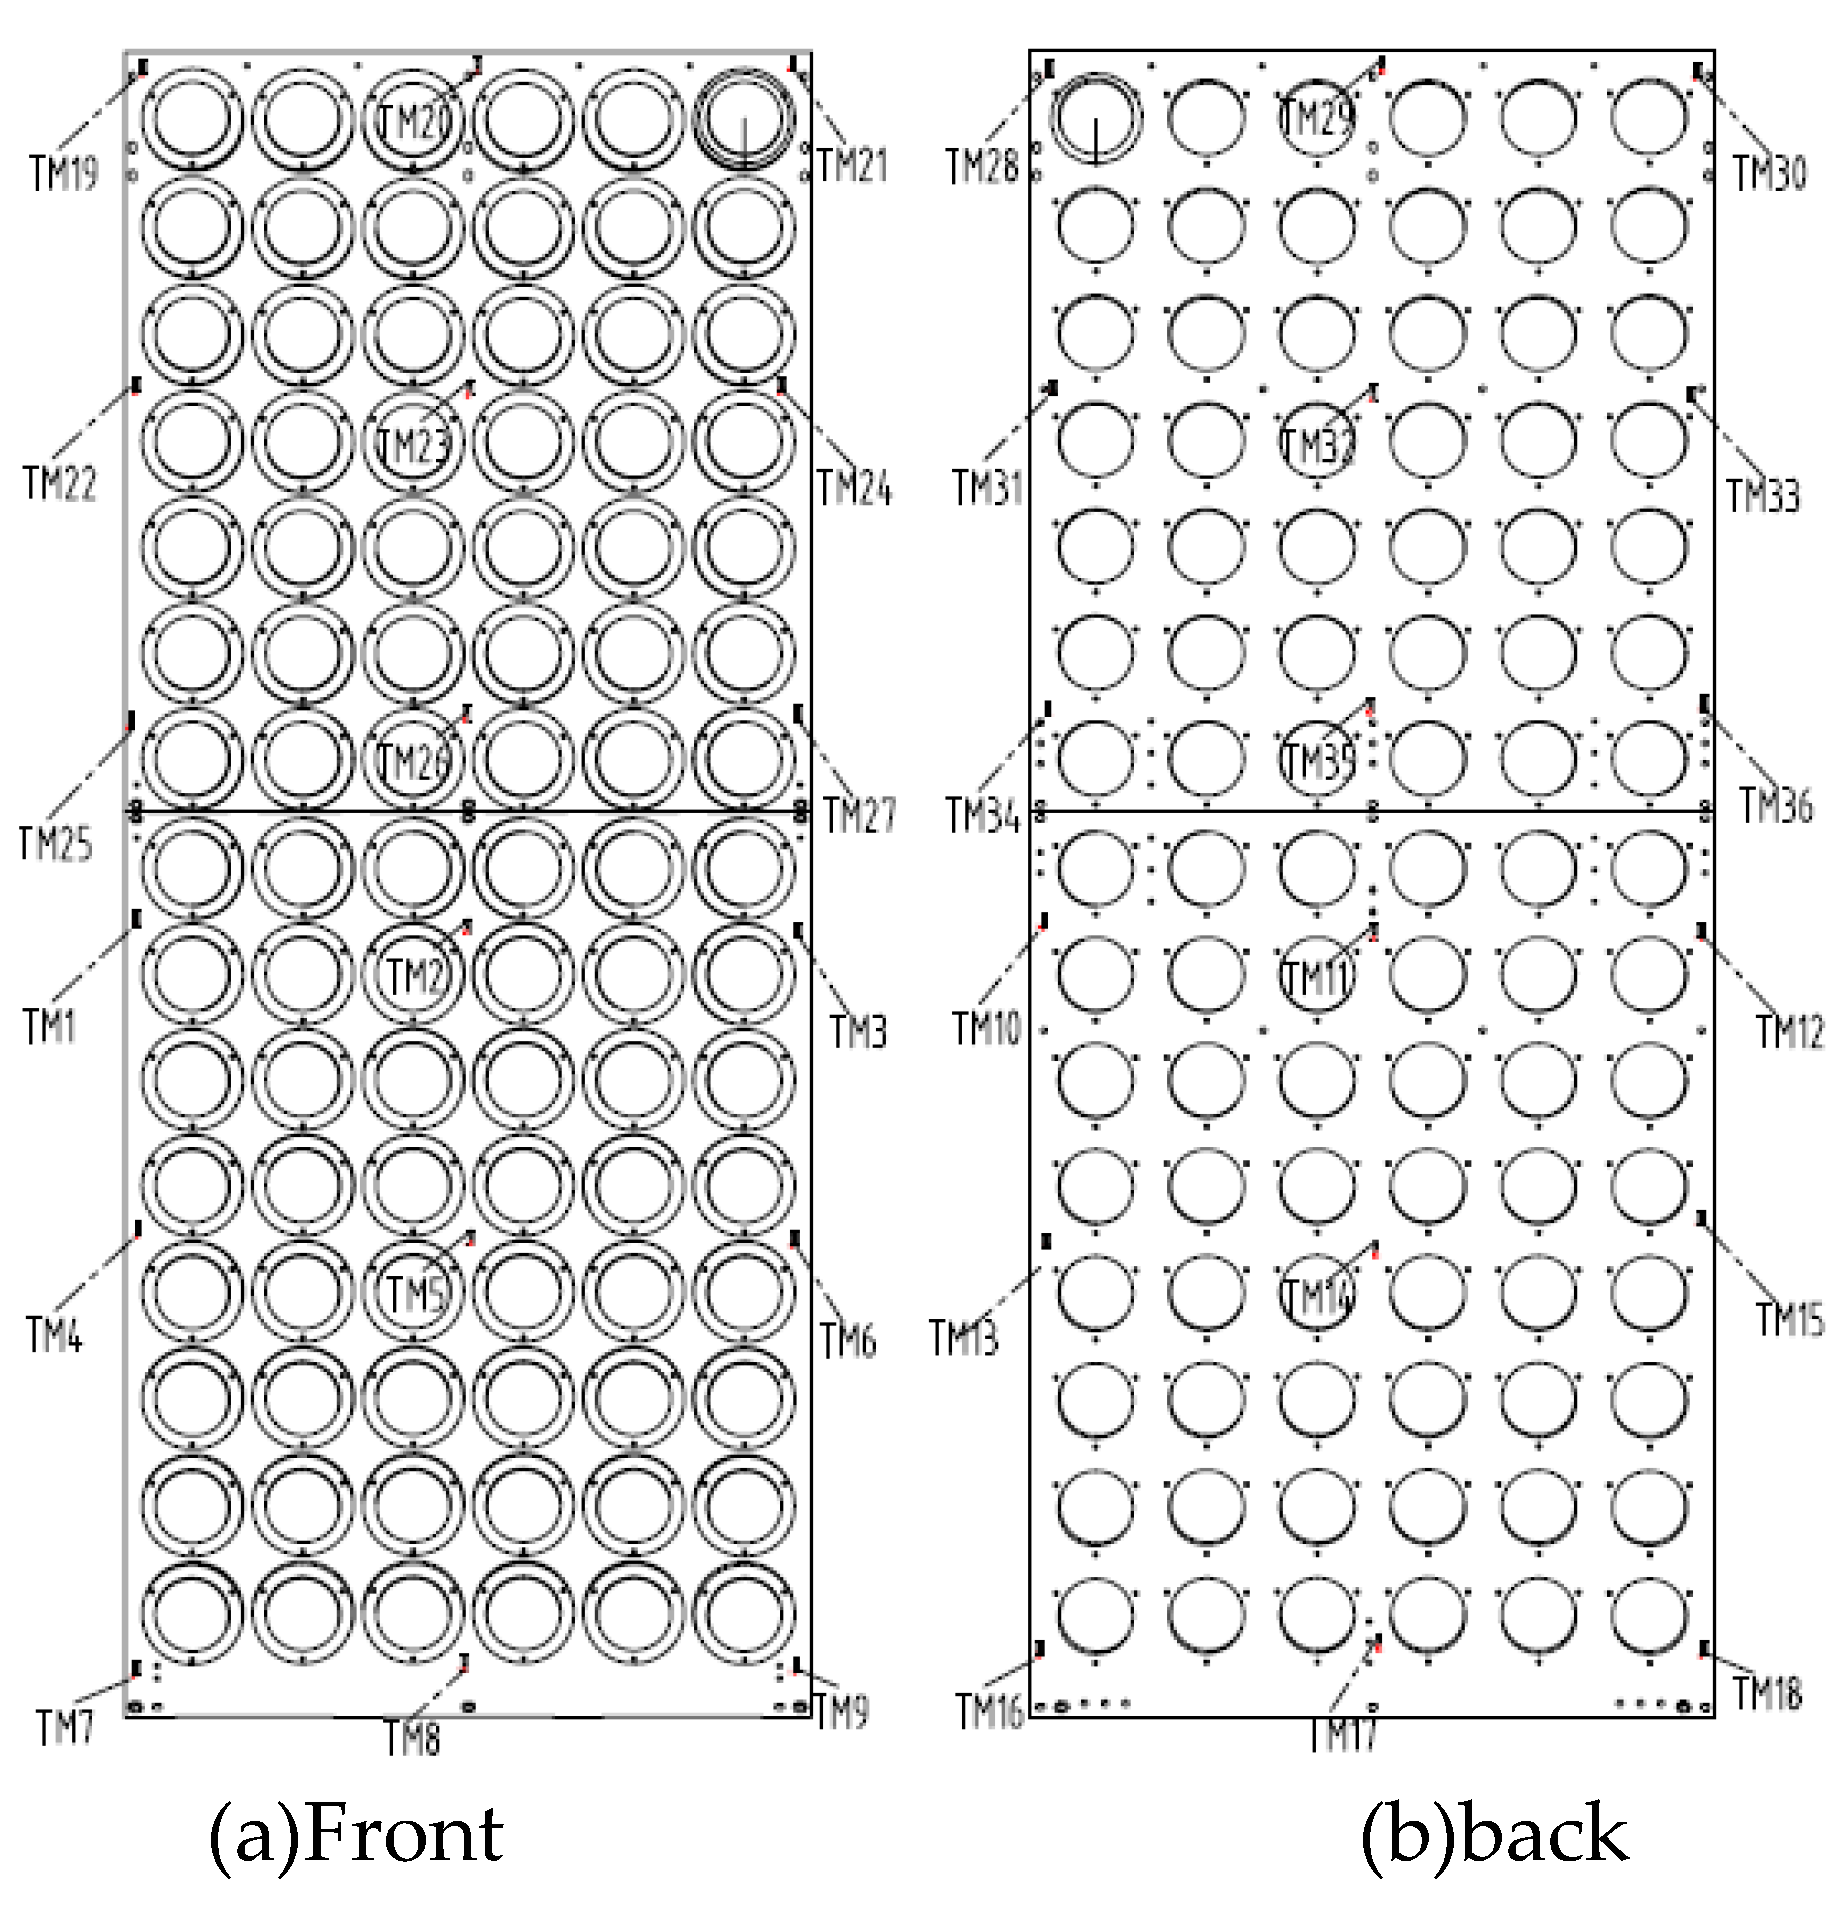
Figure 14, and the distribution of the thermistor is shown in
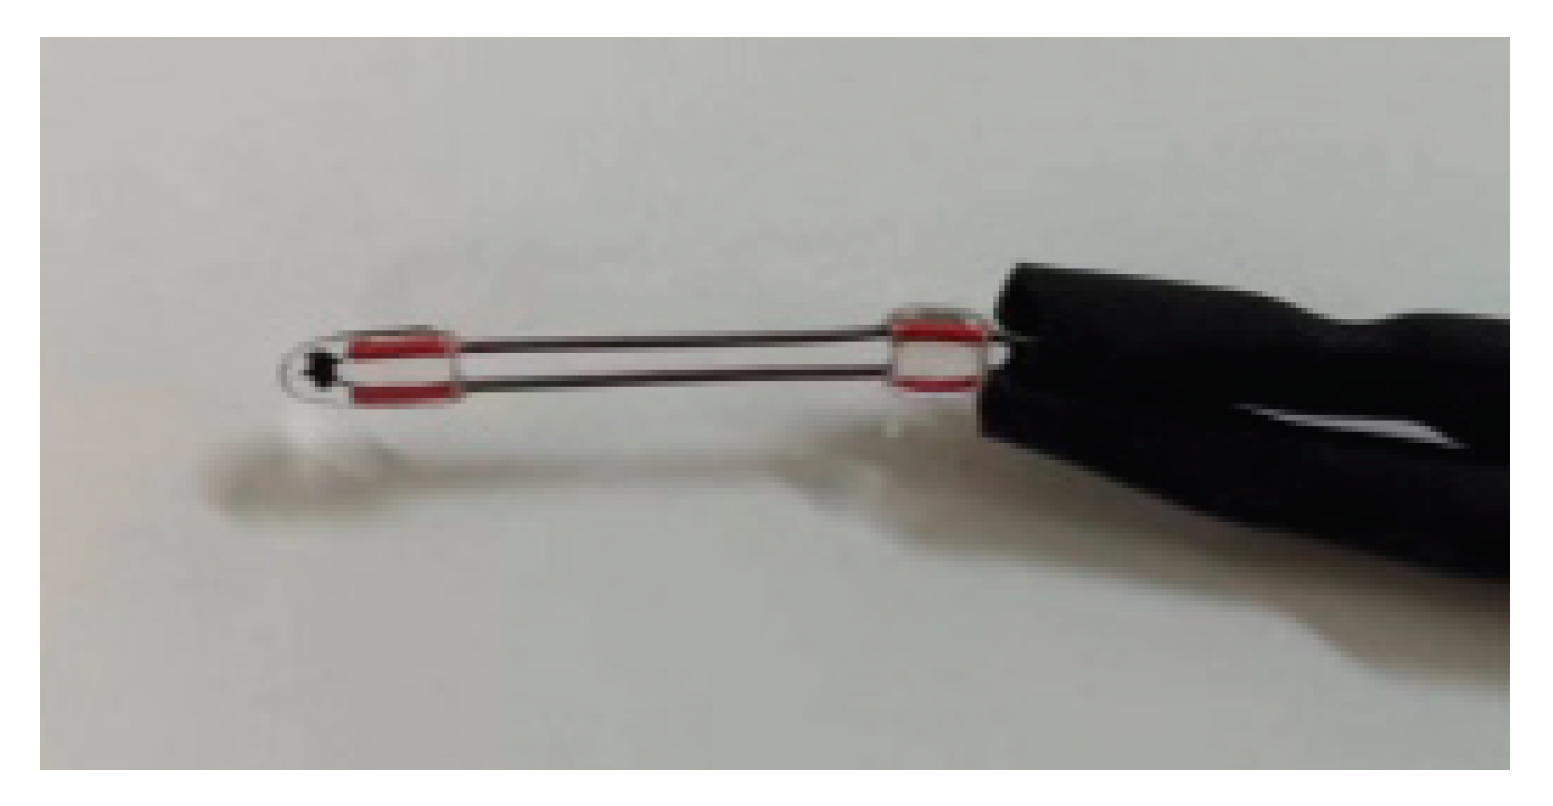
Figure 15. The temperature measurement accuracy of the thermistor used is ± 0.1 ℃, and the appearance is shown in
Figure 16.
3.1.3. Test implementation
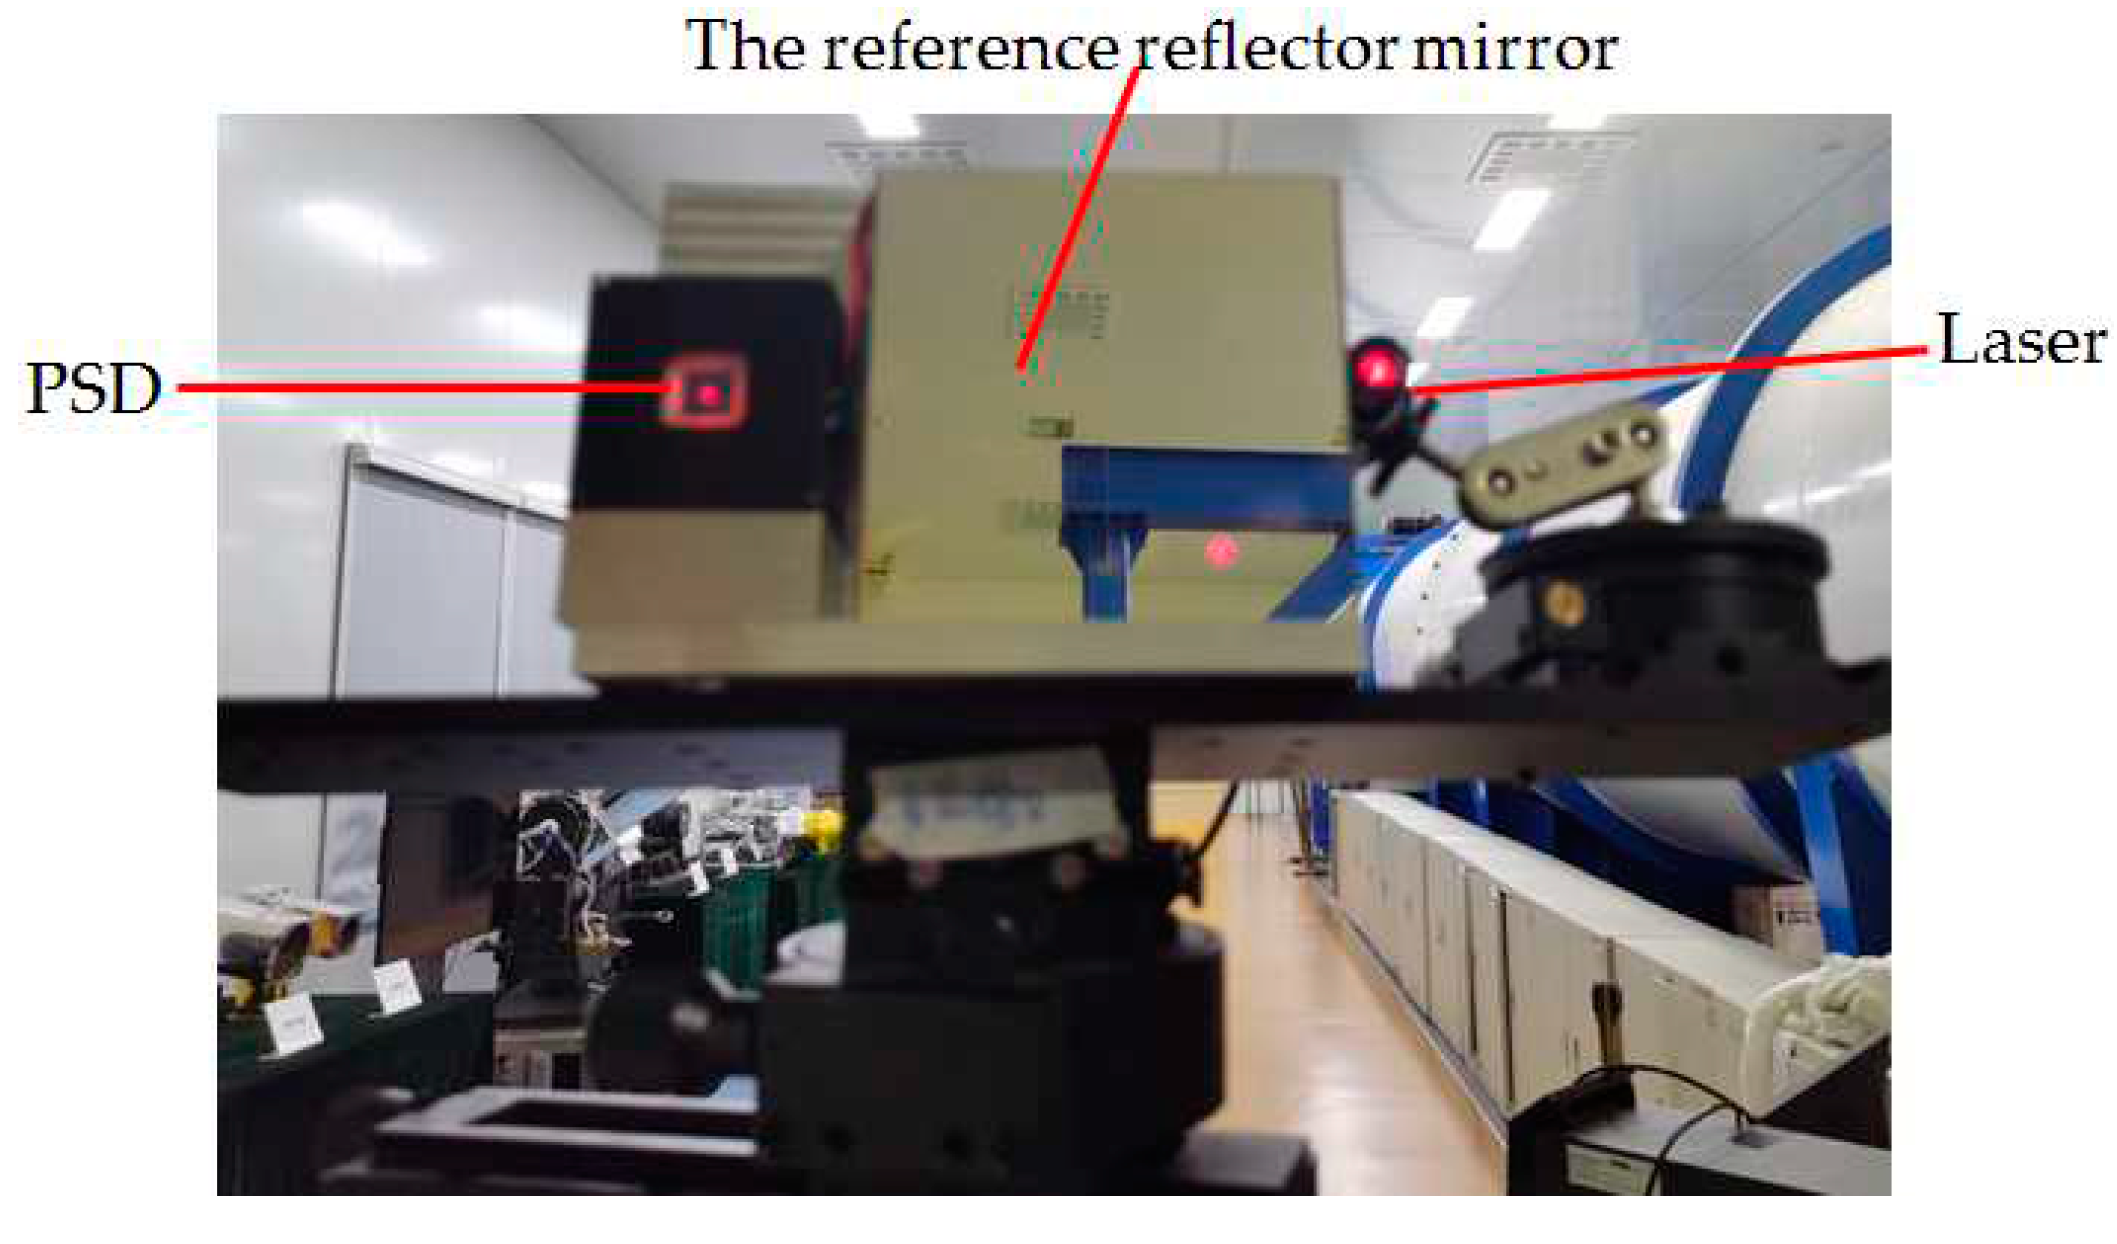
After setting up the testing system, we begin to experiment: The laser falls on the PSD target surface after two reflection cycles, as shown in
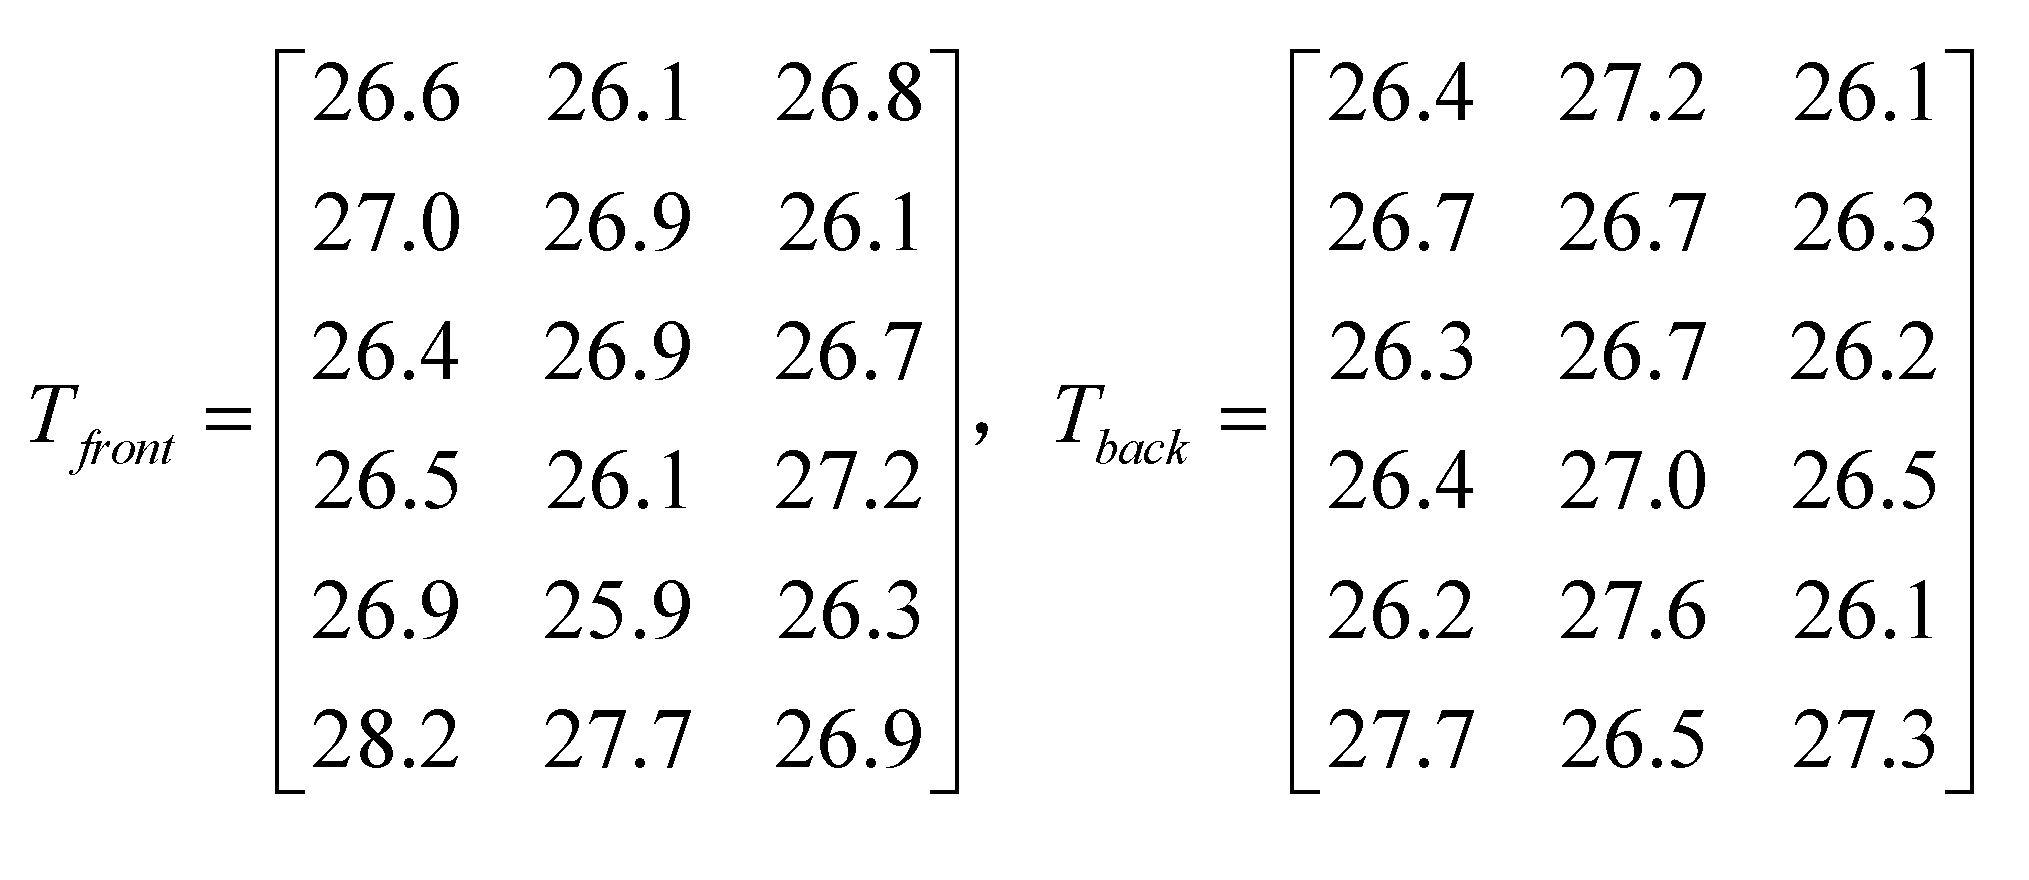
Figure 17; Read the initial temperature matrix value of the support frame, as shown in
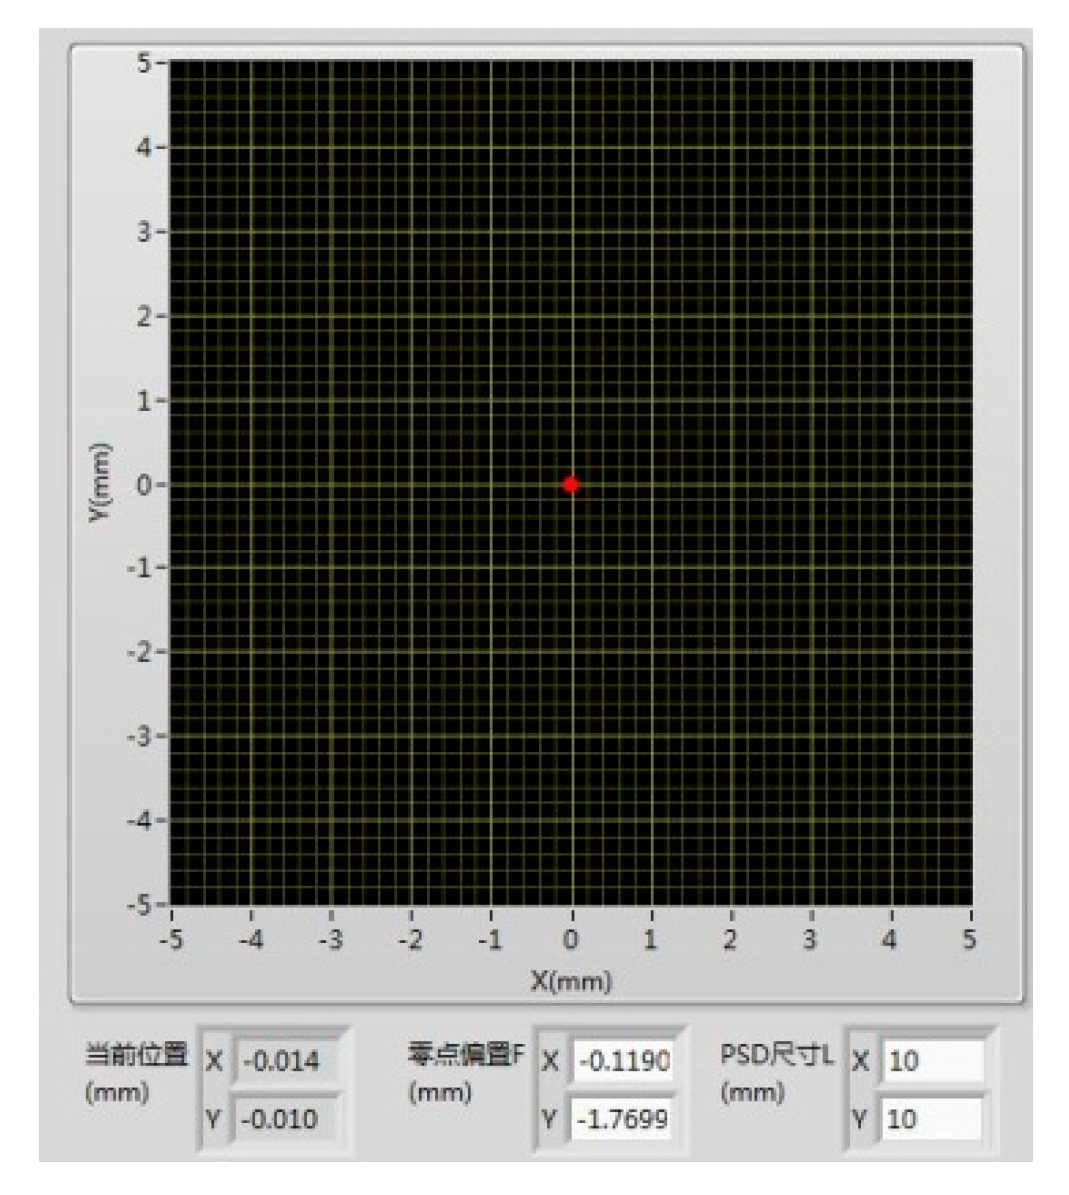
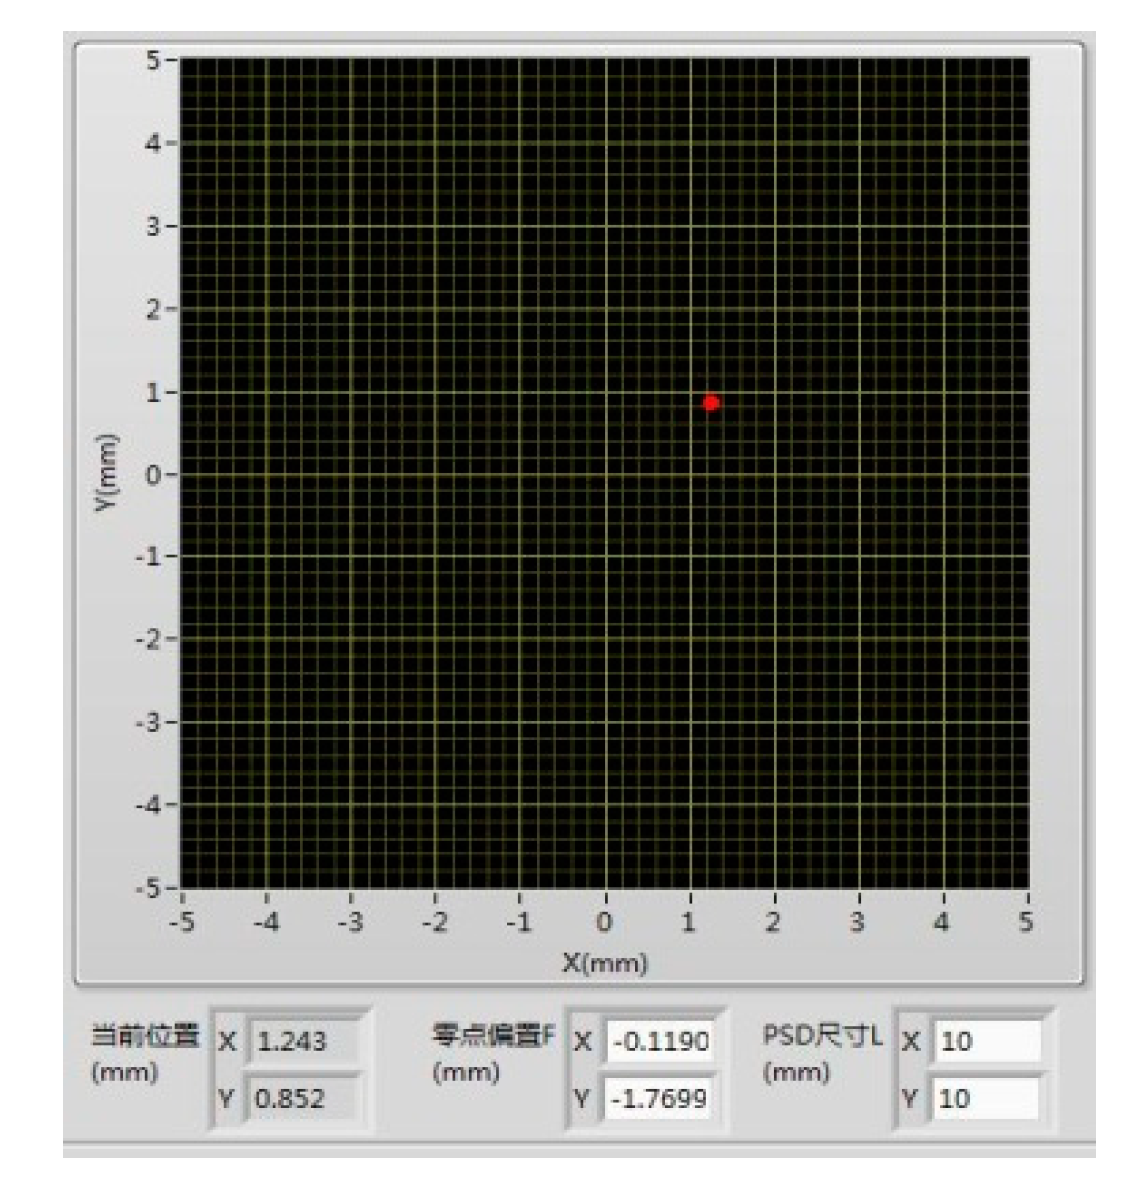
Figure 18; The laser spot of the PSD detector is set to zero as shown in
Figure 19, while reading the displacement drift error of the spot, as shown in
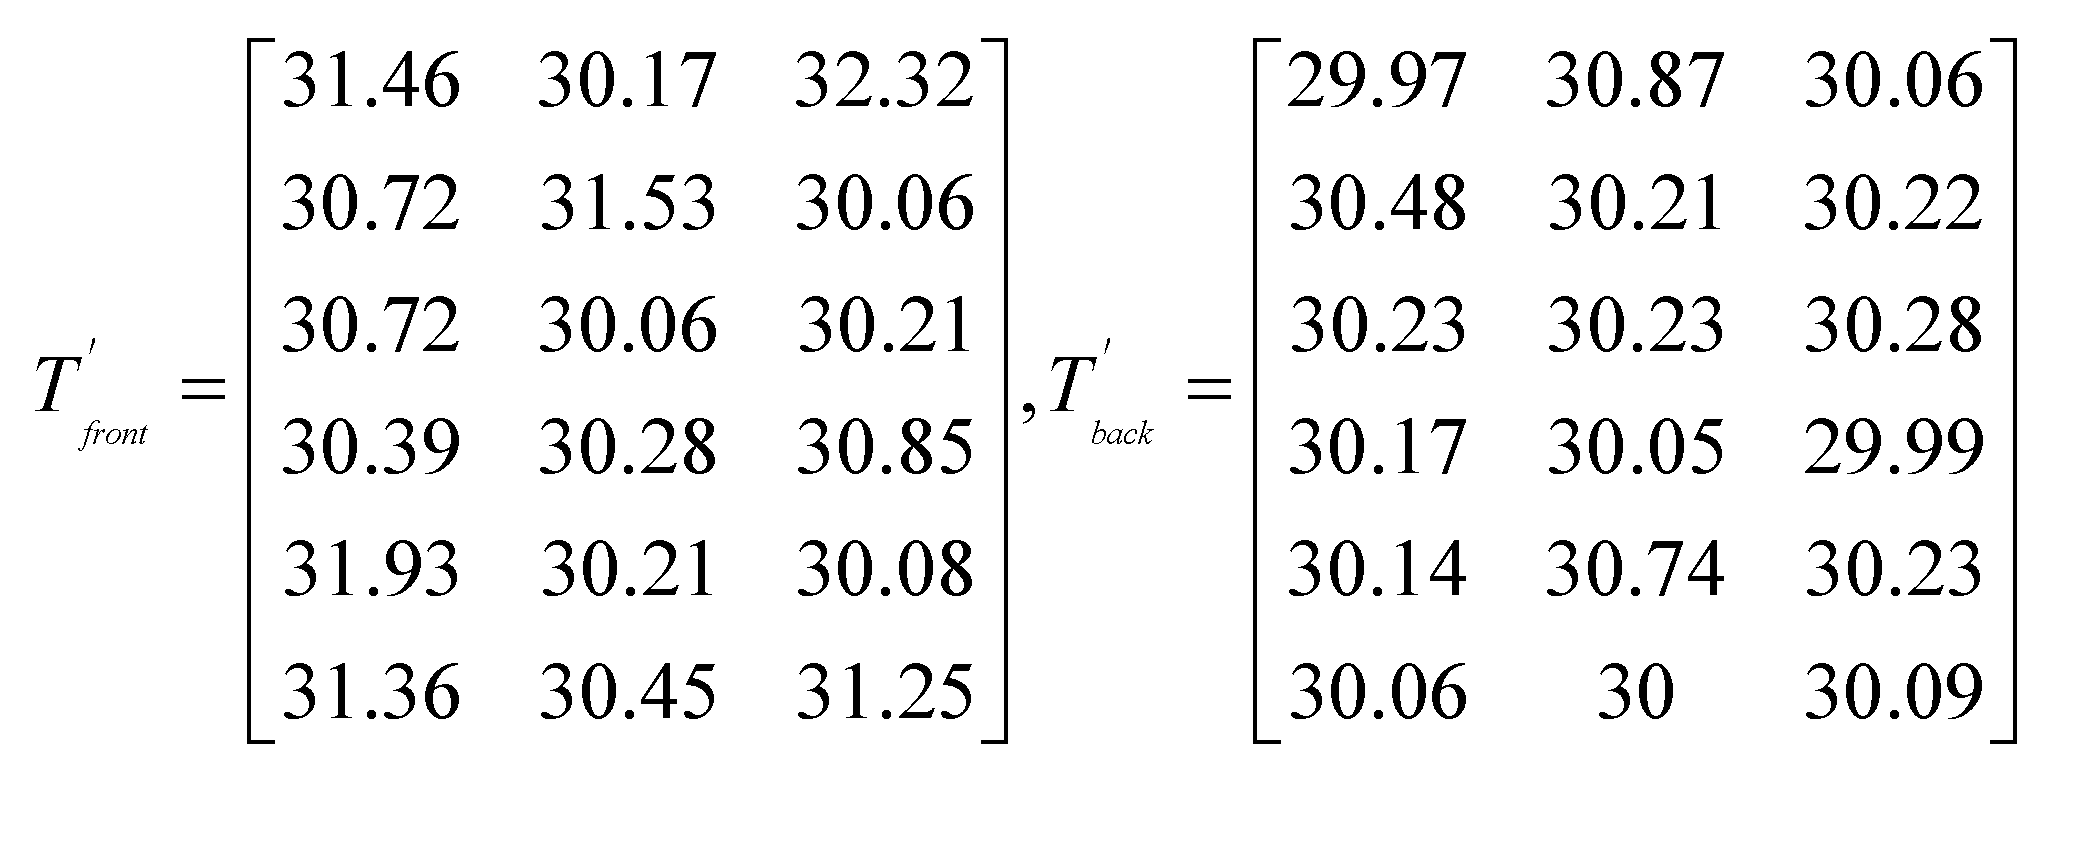
Table 1; After the support frame is heated up by about 10 degrees Celsius, it is first kept warm for 1 hour. The temperature matrix value after the heating is read for the second time, and after waiting for half an hour, the final temperature matrix value is read for the third time, as shown in
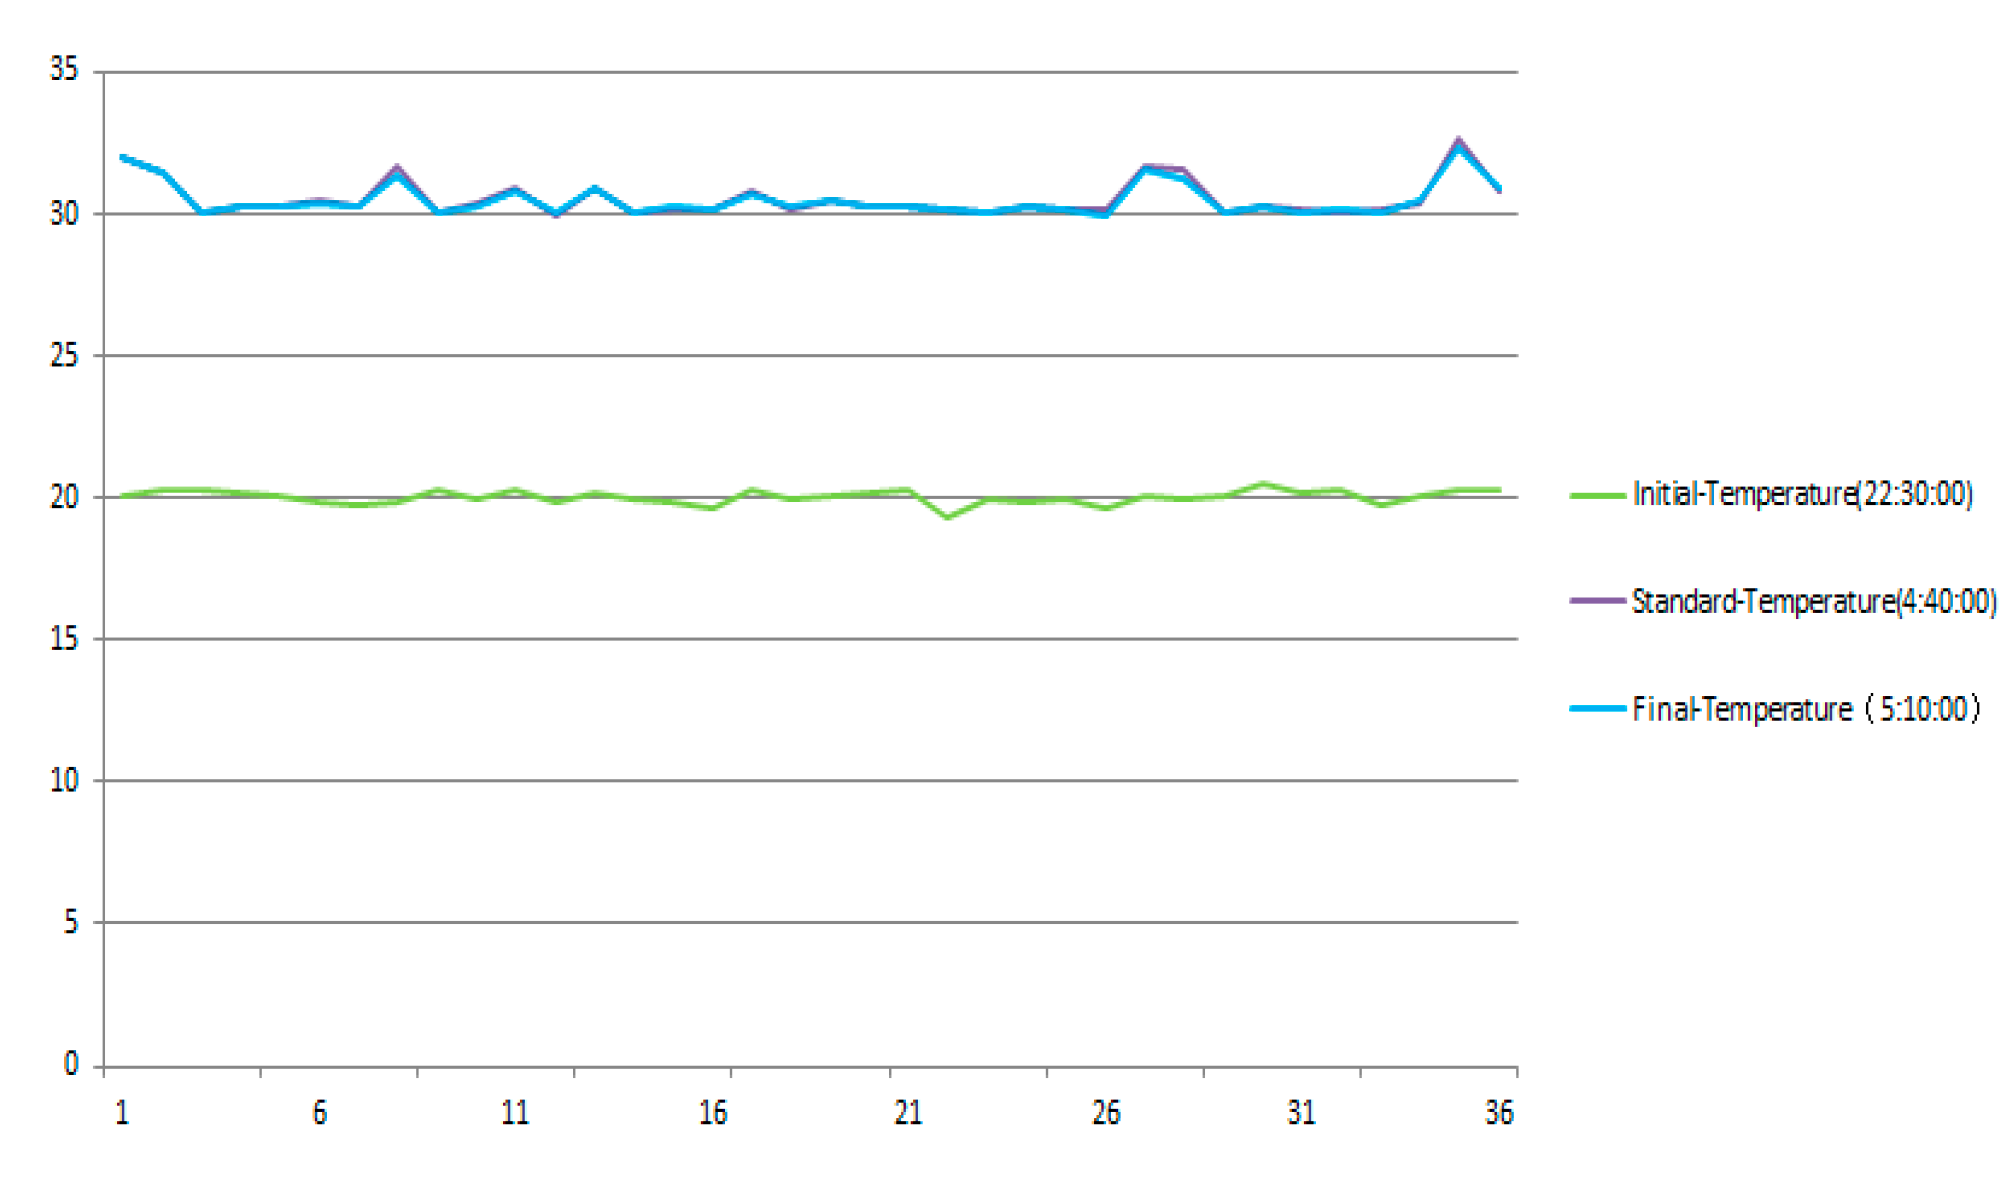
Figure 20. The three temperature change curves are obtained, as shown in
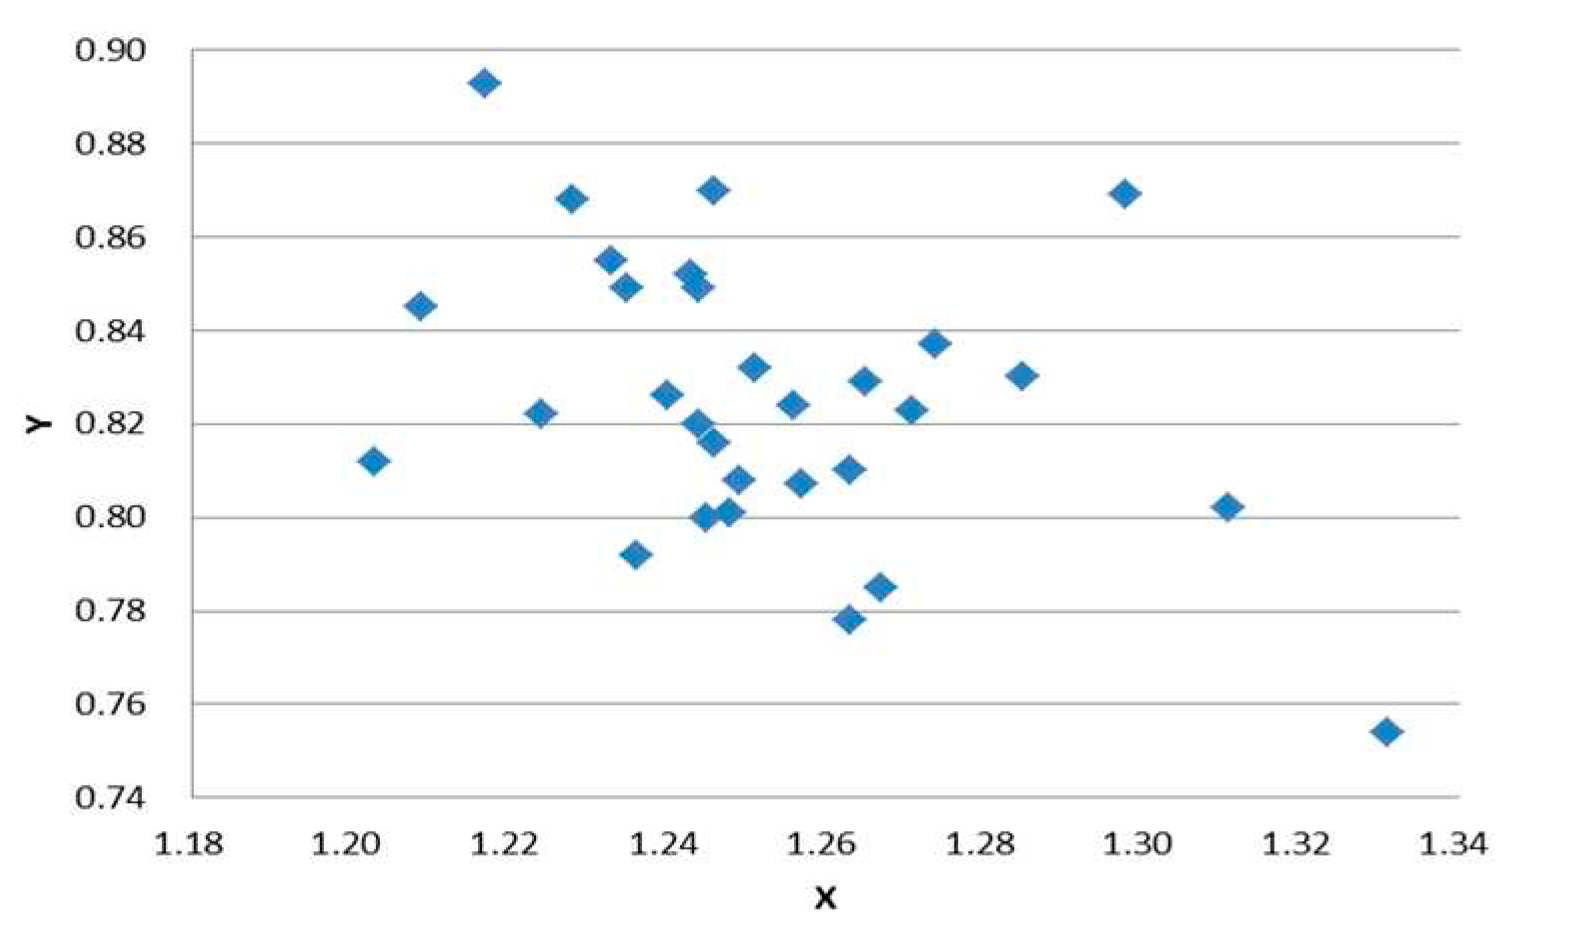
Figure 21. The PSD spot deviates, and the displacement deviation is shown in
Figure 22. The displacement sampling values are shown in
Figure 23.
3.2. Calculation of test results
3.2.1. Calculation of angle test results
Based on the collected experimental data, we first calculate the average displacement value of the laser spot and the average heating value of the support frame, as shown in
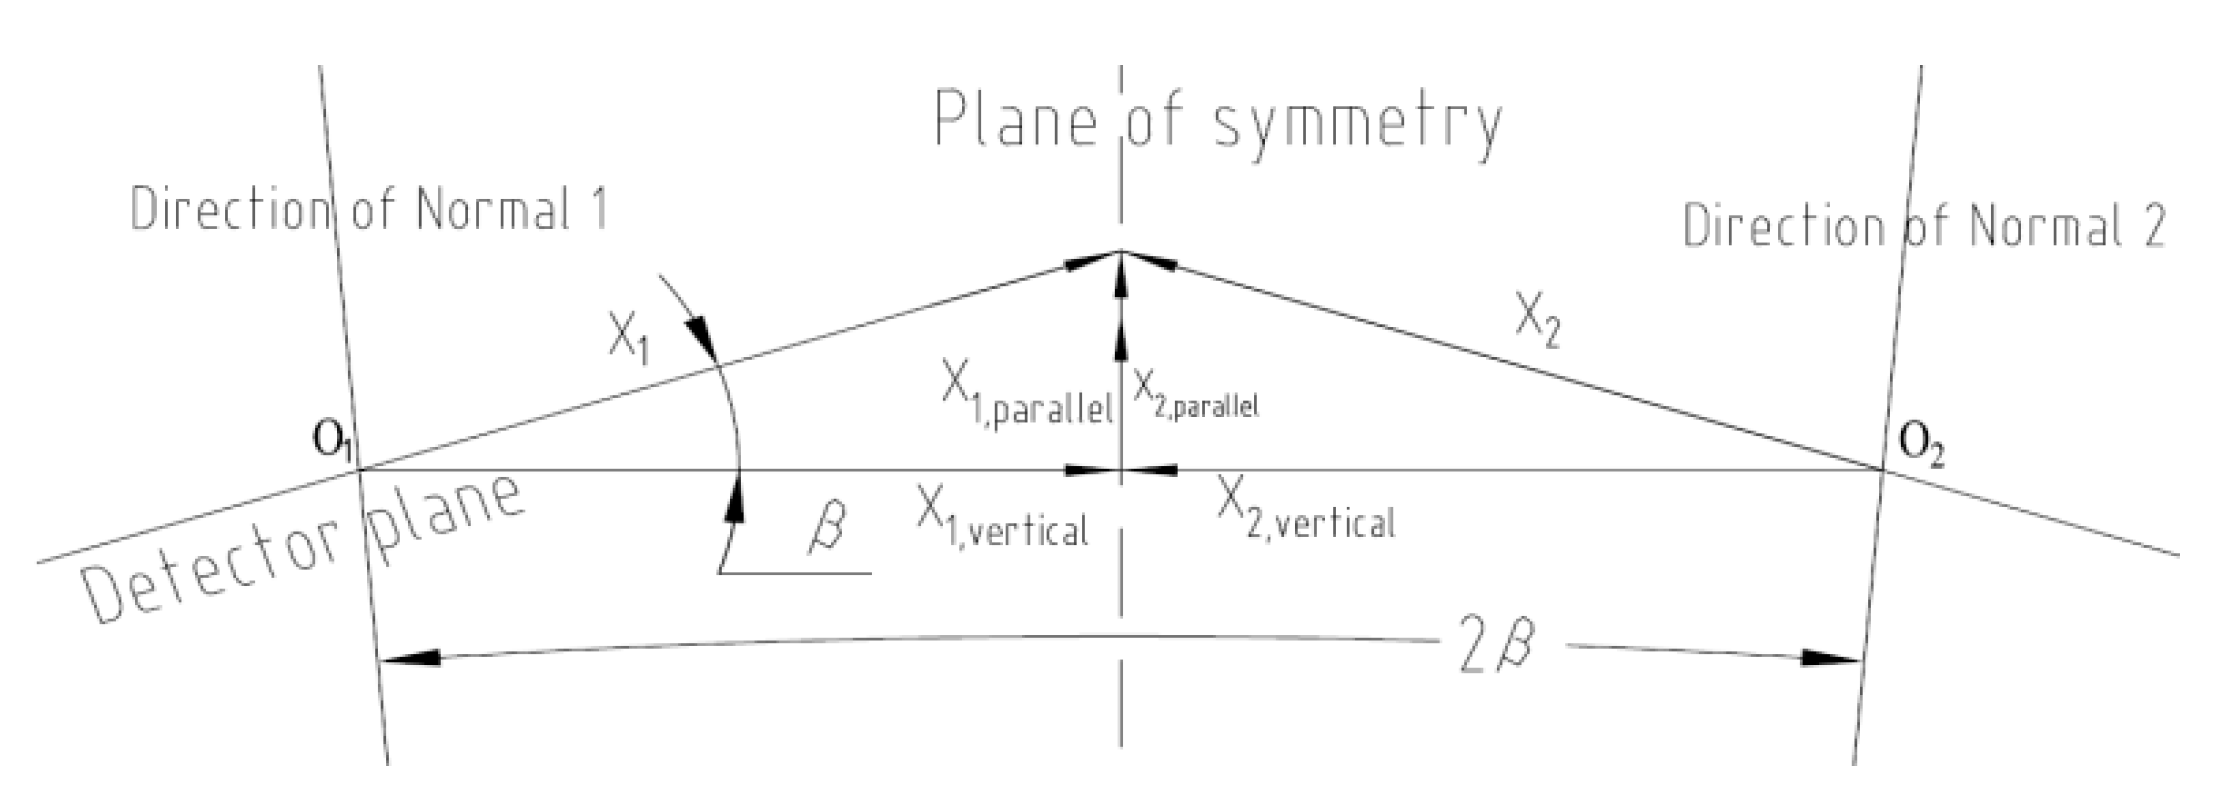
Table 2. Then, using the symmetry of the support frame mirror image, we calculate the relative displacement value of the bivariate laser spot. The displacement vector calculation diagram is shown in
Figure 23, and the displacement calculation is shown in equation (20).
We take the test parameters H=3435 mm, n=2, and △S into equation (4), and obtain the relative angle change value of the two variables as:
3.2.2. Calculation of thermal condition magnification
The temperature gradient required by the indicator is 0.2℃ in the row direction and 0.5℃ in the column direction. According to the uniform distribution of the actual temperature matrix 6 * 3 columns, the temperature gradient matrix in the row direction is a matrix of 6 * 2, as shown in Equation 21. The temperature gradient matrix in the column direction is a matrix of 5 * 6, as shown in Equation 22.
To calculate the temperature gradient comparison matrix in the row direction, merge the two temperature matrices in
Figure 16 into a temperature matrix with 12 rows and 3 columns:
Calculate the temperature gradient matrix △T
col′in the row direction
Similarly, in order to obtain the temperature gradient comparison matrix in the column direction, the two temperature matrices in
Figure 16 are merged into a temperature matrix of 6 rows and 6 columns:
Calculate the temperature gradient matrix △T
col′in the column direction:
By introducing equations (11) and (12), the multiplication matrices for row and column directions are obtained as follows:
By introducing equations (14) and (15), the ratio Matrix norm of row direction and column direction is:
By introducing equation (16), the average norm of the temperature gradient matrix is obtained as:
3.2.3. Calculation of test results for indicators
We substitute the results of the angle change of the relative angle between the two variables tested and the temperature condition multiplier value into formula (17), and obtain the change value of the angle between the normal direction of the double hole installation surface under the specific temperature gradient condition of the indicator as follows:
By introducing equation (18), the final target test value is:
3.3. Test error analysis
According to formula (19), there are three sources of error in indicator testing: 1) Angle testing error, ε (△θ)=0.015″; 2) The temperature sensor thermistor temperature test error limit is ε (△T)=0.2℃, 3) and the calculation error of temperature gradient ratio N: ε (△N)=0.2℃/0.1=2. The error in the rate of angle change under specified temperature conditions is:
The results of this testing system's indicators are:
The relative error between the test results and the thermal deformation simulation analysis results 0.359″/℃ is:
It can be seen that the relative error between the indicator test results and the thermal deformation simulation analysis results is 9.55%. The two are basically consistent.
4. Conclusion
This paper proposes a novel approach for thermal deformation testing, specifically focusing on the measurement of dual variable angles. Building upon the current research on thermal deformation index testing, a measurement system has been developed and applied to the thermal deformation testing of a single star light tube support frame in a dome multi-star simulator. With a testing accuracy of 0.015″, this system allows for super sub-arc testing accuracy of dual variable angles, even at different pitch angles. Through calculation, the relative deviation between the final test results of the support frame indicators and the simulation analysis results is 9.55%. The test results validate the correctness, reasonability, and feasibility of the proposed measurement scheme, making it a valuable reference for thermal deformation index testing and other areas of deformation index testing.
Author Contributions
Conceptualization, Y.L.; methodology, Y.L.; software, S.L.; validation, Y.X.; investigation, H.W.; resources, S.Y.; data curation, J.L.; writing—original draft preparation, Y.L.; writing—review and editing, Y.P. All authors have read and agreed to the published version of the manuscript.
Funding
This research was funded by the National Natural Science Foundation of China Grant. No. 11803075.
Institutional Review Board Statement
Not applicable.
Informed Consent Statement
Not applicable.
Data Availability Statement
Not applicable.
Acknowledgments
The authors thank the outstanding work of the space sensor optical technology teams from Xi’an Institute of Optics and Precision Mechanics of Chinese Academy of Sciences.
Conflicts of Interest
The authors declare no conflict of interest.
References
- Jin-yang Li, Jian-tong Wu, Hui-qun Han. Small angle measurement with optical methods and its application. Applied Science and Technology, 2006,33(7):15-16.
- Sahai, R. Observing Planetary and Pre-Planetary Nebulae with the James Webb Space Telescope. Galaxies 2020, 8, 61. [CrossRef]
- Shi-dong Shen, Xiang-qun Cui, Yong Zhang. Simulation and analysis of co-phasing errors of the segmented primary mirror tiled by hexagonal segments in LOT. Research in Astronomy and Astrophysics. 2021, Vol. 21 No. 10, 245(9pp).
- Jia-ning Hu, Ji-hong Dong, Ping-wei Zhou. Review on active support system of large ground-based telescope primary mirror. Laser & Infrared, 2017,47(1):5-12.
- Hong Xu, Li-wei Yang, Hui-sheng Yang. Recent progress of active support system for large optical telescope primary mirror. Laser & Optoelectronics Progress,2018,55 (10):11-23.
- Xu-peng Li, Jin-feng Shi, Wei Wang, et al. Review on splicing structure technology of large aperture space primary mirror. Laser & Optoelectronics Progress, 2018,55(3):22-34.
- Liu, M.; Wang, H.; Yi, H.; Xue, Y.; Wen, D.; Wang, F.; Shen, Y.; Pan, Y. Space Debris Detection and Positioning Technology Based on Multiple Star Trackers. Appl. Sci. 2022, 12, 3593. [CrossRef]
- Liu, M.; Wei, X.; Wen, D.; Wang, H. Star Identification Based on Multilayer Voting Algorithm for Star Sensors. Sensors 2021, 21, 3084. [CrossRef]
- Hong-gang Xu, Bing Han, et al. Design and verification of high-precision multi-star simulator with a wide field of view. Chinese Optics.2020, 13(6):1343-1351.
- Yin-guo Huang. Study on Micro-angle Measuring Basic Technique of Laser Autocollimation[D], Tianjin university, Tianjin, China, 2009.
- 11. ELCOMAT HR Operation Manual, MÖLLER-WEDEL OPTICAL.
- Konyakhin KONYAKHIN Igor A, TIMOFEEV Alexandr N, KONYAKHIN Aleksey. Three-axis optic-electronic autocollimation system for the inspection of large- scale objects. Proceedings of SPIE, 2013,8788: 87882C-1-8.
- KONYAKHIN I A, KOPYLOVA T V, KONYAKHIN A I. Optic-electronic autocollimation sensor for measurement of the three-axis angular deformation of industry objects. Proceedings of SPIE, 2012, 8439:84391N-1-7.
- Cheng-liang Di, Wei Yan, Song Hu, et al. Moire-Based absolute interferometry with large measurement range in Wafer-Mask alignment. IEEE Photonics Technology Letters, 2015, 27(4): 435-438.
- Qing-hua Wang, Shien Ri, Hiroshi Tsuda. Digital sampling Moireas asubstitute for microscope scanning Moire for high-sensitivity and full-field deformation measurement at micron/nano scales. Applied Optics, 2016, 55(25):6858-6885.
- Ai-yu Zhang, Pei-sen Huang. Total internal reflection for precision small-angle measurement. Applied Optics, 2001, 40(10):167-1622.
- Ming-hung Chui, Shinn-Fwu Wang, Rong-seng Chang. Instrument for measuring small angles by use of multiple total internal reflection in heterodyne interferometry. Applied Optics, 2004, 43(29):5438-5442.
- Jiun-you Lin, Yu-Cheng Liao, Small-angle measurement with highly sensitive total internal- reflection heterodyne interferometer. Applied Optics,2014,53(9):1903-1908.
- Tao Ma, Wei-hua Wang. Sub-Arc Accuracy Small Angle Measurement Based on Dual Mirrors Reflections. Flight Control &Detection, 2019.09,2(5):84-89.
- Mao, S.; Wang, Z.; Pan, J. Microscope 3D Point Spread Function Evaluation Method on a Confirmed Object Plane Perpendicular to the Optical Axis. Appl. Sci. 2020, 10, 2430. [CrossRef]
- Sen Zhou, Zhi-wei Zhang, Rui-bo Cai, High Precision Micro Displacement Measurement System Based on PSD. Flight Control &Detection, 2020.10,18(5): 22-27.
- Ya-ping Yang. Development and application of position sensitive detector[J]. Sci-Tech Information Development &Econom, 2006, (24): 183-185.
- Foisal Abu Riduan Md, Nguyen Thanh, Dinh Toan, et.al. 3C-SiC/Si hetero structure: An excellent platform for position-sensitive detectors based on photovoltaic effect. ACS Applied Materials &,2019,11(43):55-58.
- Yu-ting He, Feng-wen Mi, Wei-qi Jin, et al. Design of an autocllimator swing micro-mirror angle measurement system based on PSD. OPTICAL TECHNIQUE, 2017.11, 43(6):561-565.
Figure 4.
ELCOMAT HR photoelectric auto collimator.
Figure 4.
ELCOMAT HR photoelectric auto collimator.
Figure 5.
Measuring Principle.
Figure 5.
Measuring Principle.
Figure 6.
Schematic diagram of displacement conversion.
Figure 6.
Schematic diagram of displacement conversion.
Figure 7.
Temperature control temperature matrix.
Figure 7.
Temperature control temperature matrix.
Figure 8.
Schematic diagram of Support Frame.
Figure 8.
Schematic diagram of Support Frame.
Figure 9.
Schematic diagram of temperature conditions.
Figure 9.
Schematic diagram of temperature conditions.
Figure 10.
Schematic diagram of changes in thermal deformation angle.
Figure 10.
Schematic diagram of changes in thermal deformation angle.
Figure 11.
Schematic diagram of testing system composition.
Figure 11.
Schematic diagram of testing system composition.
Figure 12.
The PSD device selected in this paper.
Figure 12.
The PSD device selected in this paper.
Figure 13.
Principle sketch for the experiment.
Figure 13.
Principle sketch for the experiment.
Figure 14.
Thermal control implementation.
Figure 14.
Thermal control implementation.
Figure 15.
Distribution diagram of thermistor.
Figure 15.
Distribution diagram of thermistor.
Figure 16.
thermistor sensor.
Figure 16.
thermistor sensor.
Figure 17.
Laser reflection situation.
Figure 17.
Laser reflection situation.
Figure 18.
Initial temperature matrix.
Figure 18.
Initial temperature matrix.
Figure 19.
Schematic diagram of PSD spot shift to zero.
Figure 19.
Schematic diagram of PSD spot shift to zero.
Figure 20.
Temperature matrix after heating up.
Figure 20.
Temperature matrix after heating up.
Figure 21.
Temperature sampling curve for installing the base plate.
Figure 21.
Temperature sampling curve for installing the base plate.
Figure 22.
Laser spot displacement sampling for PSD devices.
Figure 22.
Laser spot displacement sampling for PSD devices.
Figure 23.
Spot displacement sampling point chart.
Figure 23.
Spot displacement sampling point chart.
Figure 23.
Coordinate System Conversion.
Figure 23.
Coordinate System Conversion.
Table 1.
PSD Spot Coordinate Zeroing Sampling.
Table 1.
PSD Spot Coordinate Zeroing Sampling.
| Sampling |
X |
Y |
| 1 |
-0.014 |
-0.01 |
| 2 |
0 |
-0.004 |
| 3 |
-0.003 |
-0.019 |
| 4 |
0.017 |
0.024 |
| 5 |
-0.003 |
-0.004 |
| 6 |
0.012 |
-0.047 |
| 7 |
0.005 |
-0.04 |
| 8 |
0.008 |
-0.007 |
| 9 |
0.012 |
0.014 |
| Average drift error |
0.003778 |
-0.01033 |
Table 2.
Calculation of spot displacement and temperature rise.
Table 2.
Calculation of spot displacement and temperature rise.
| Displacement Direction |
X1
|
Y1
|
| Average Displacement value (mm) |
1.25 |
0.83 |
| Average drift error(mm) |
0.003778 |
-0.01033 |
| Absolute displacement value (mm) |
1.24622 |
0.8403 |
| Average temperature change value (℃) |
10.4633 |
|
Disclaimer/Publisher’s Note: The statements, opinions and data contained in all publications are solely those of the individual author(s) and contributor(s) and not of MDPI and/or the editor(s). MDPI and/or the editor(s) disclaim responsibility for any injury to people or property resulting from any ideas, methods, instructions or products referred to in the content. |
© 2023 by the authors. Licensee MDPI, Basel, Switzerland. This article is an open access article distributed under the terms and conditions of the Creative Commons Attribution (CC BY) license (http://creativecommons.org/licenses/by/4.0/).
