Preprint
Article

MRI Images Compression by Deep Convolution Network with Optimize Pixel Predictor

Altmetrics

Downloads

107

Views

30

Comments

0

This version is not peer-reviewed

Submitted:

02 August 2023

Posted:

04 August 2023

You are already at the latest version

Alerts
Abstract
The primary goal of picture compression is to reduce the amount of unused image data while still storing or transmitting it in a format that is appropriate. The compression of raw binary data is quite different from the compression of a picture, and these differences may be rather substantial. In light of this, compression is often regarded as an essential technique for the purposes of both data storage an d transmission in order to mitigate the excessive amounts of data that are generated by these images. In order to transmit enormous datasets, particularly for the purposes of telemedicine and teleradiology, one needs a significant amount of storage capacity as well as an expansive network. As a result, compression is an important aspect of medical imaging. In addition to the importance of compression, the quality of the photos themselves is also an essential factor in the success of analysis. In addition to this, the amount of time necessary to compress the photographs before sending them should be reduced.
Keywords: 
Subject: Computer Science and Mathematics  -   Computer Science

1. INTRODUCTION

Deep learning framework integrated with predictive encoding is implemented in this work for improving the compression performance of medical images. Inter pixel redundancy is eliminated by considering the causal template. Current pixel is predicted from causal template by considering the difference between the previous pixel and current pixel.Convolutional Neural Network (CNN) is employed for generating convergence. Convergence property of CNN with a novel Local Maximal Contiguous Directional Predictor (LMCDP) is integrated with an entropy encoder has attained an effective compression. The performance measures such as Compression Ratio, Peak Signal to Noise Ratio, Mean Square Errorand Structural Similarity Index Measure are utilized to evaluate the compression performance compared with other existing methods.method for image prediction to perform efficient medical image compression. In this approach, LMCDP is utilized for predicting the current pixel with the neighborhood pixels. The proposed LMCDP employs a two layer approach for prediction. This is very much helpful to obtain a superior compression performance which is considered as the objective of this proposed work.
The contributions of this Research are given as follows:
  • A novel predictor LMCDP is proposed in which horizontal, vertical and diagonal elements along with a centre element are considered for finding the residual image obtained after prediction.Two-layer novel predictor structure is presented along with different orientation for eliminating interpixel redundancy
  • Convolutional Neural Network (CNN) is proposed for compression which provides a compact representation of the image.
  • Convolutional Neural Network combined with LMCDP a novel predictor and arithmetic encoder is employed for enhancing the compression ratio results.
  • Compression Ratio (CR) is compared with the existing techniques to justify the results.
  • Accurate reconstruction is attained after compression as two-layer neighborhood is implemented for obtaining the prediction values.
  • Quality of the image is improved and is proven with experimental results.
  • Error rate is less for the proposed method when compared to the existing techniques which reveals that there is not much degradation when comparing the original image with the reconstructed image.

2. LITERATURE REVIEW

Table 1. GAPS IN PREVIOUS APPROACHES.
Study Gap Methodology Dataset
 [1] Limited exploration of deep learning methods Convolutional Neural Networks (CNNs) ImageNet, MNIST
 [2] Lack of consideration for lossless compression Predictive coding with arithmetic coding Medical Image Compression Benchmark (MedCom2018)
 [3] Inadequate evaluation of subjective quality Structural Similarity Index (SSIM) Kodak Lossless True Color Image Suite, LIVE Image Quality DB
 [4] Insufficient analysis of computational complexity Transform-based methods (DCT, DWT) DICOM CT and MRI images
 [5] Limited investigation of hybrid methods Combination of transform coding and predictive coding Lung CT scans
 [2,3] Lack of consideration for specific modalities Region-of-Interest (ROI) coding Digital Retinal Images for Vessel Extraction (DRIVE) dataset
 [5,6] Insufficient exploration of medical video Motion compensation with predictive coding VIDIT (Video Database for Imaging Technology) dataset
 [7,8] Limited analysis of compression ratios JPEG2000 standard CT colonography images
 [9,10] Lack of evaluation of different compression levels Quantization and entropy coding Publicly available medical image databases (e.g., ImageCLE

3. MATERIAL AND METHODOLOGY

3.1. MATERIAL

The IXI Dataset provides a valuable resource for studying and developing medical image compression algorithms specifically tailored for brain imaging. It contains images from a large number of subjects, capturing both healthy individuals and patients with various brain conditions. The dataset includes images acquired from different scanners and imaging protocols, reflecting the variability encountered in clinical practice.
Access to the IXI Dataset requires registration and adherence to specific data usage agreements. You can find more information about the dataset and access instructions on the official IXI website (http://brain-development.org/ixi-dataset/).

3.2. M

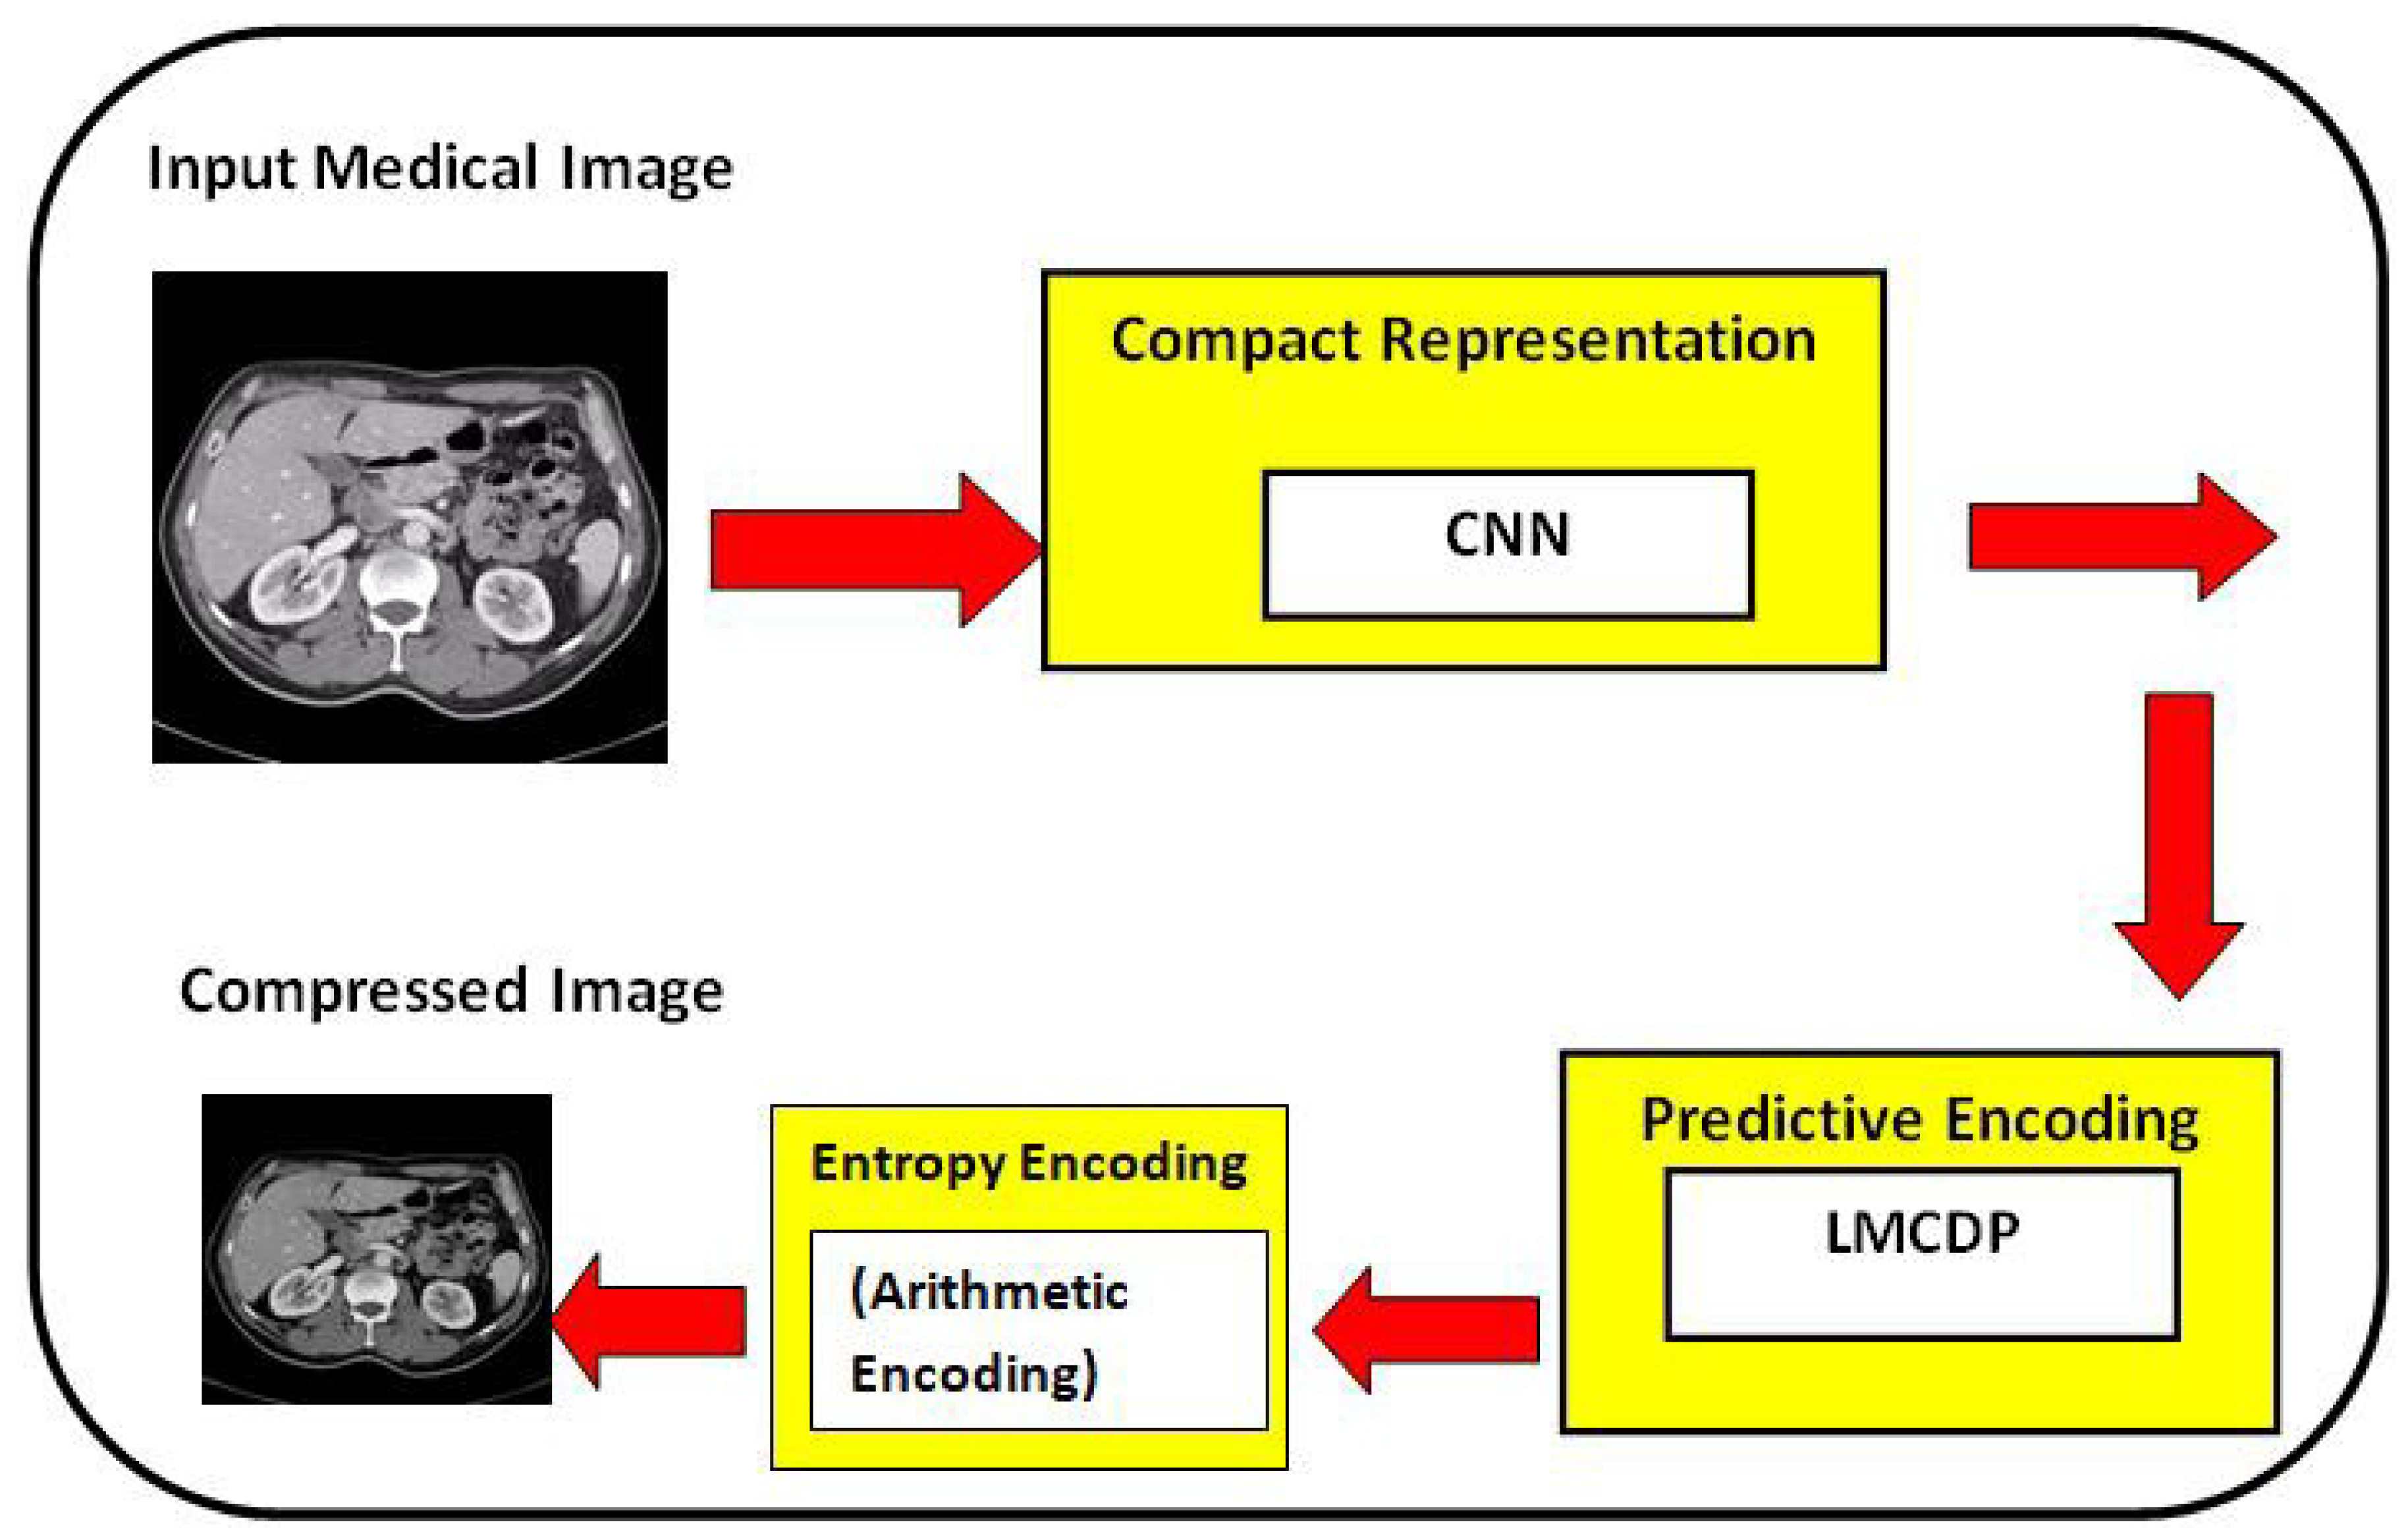
Figure 1 shows the complete structure of the proposed method. The proposed methodology consists of three stages for obtaining compact representation namely, deep learning using CNN, predictive coding using LMCDP and entropy coding using arithmetic encoder.
Figure 1. Overall Architecture Diagram of the Proposed System.
Preprints 81405 g001
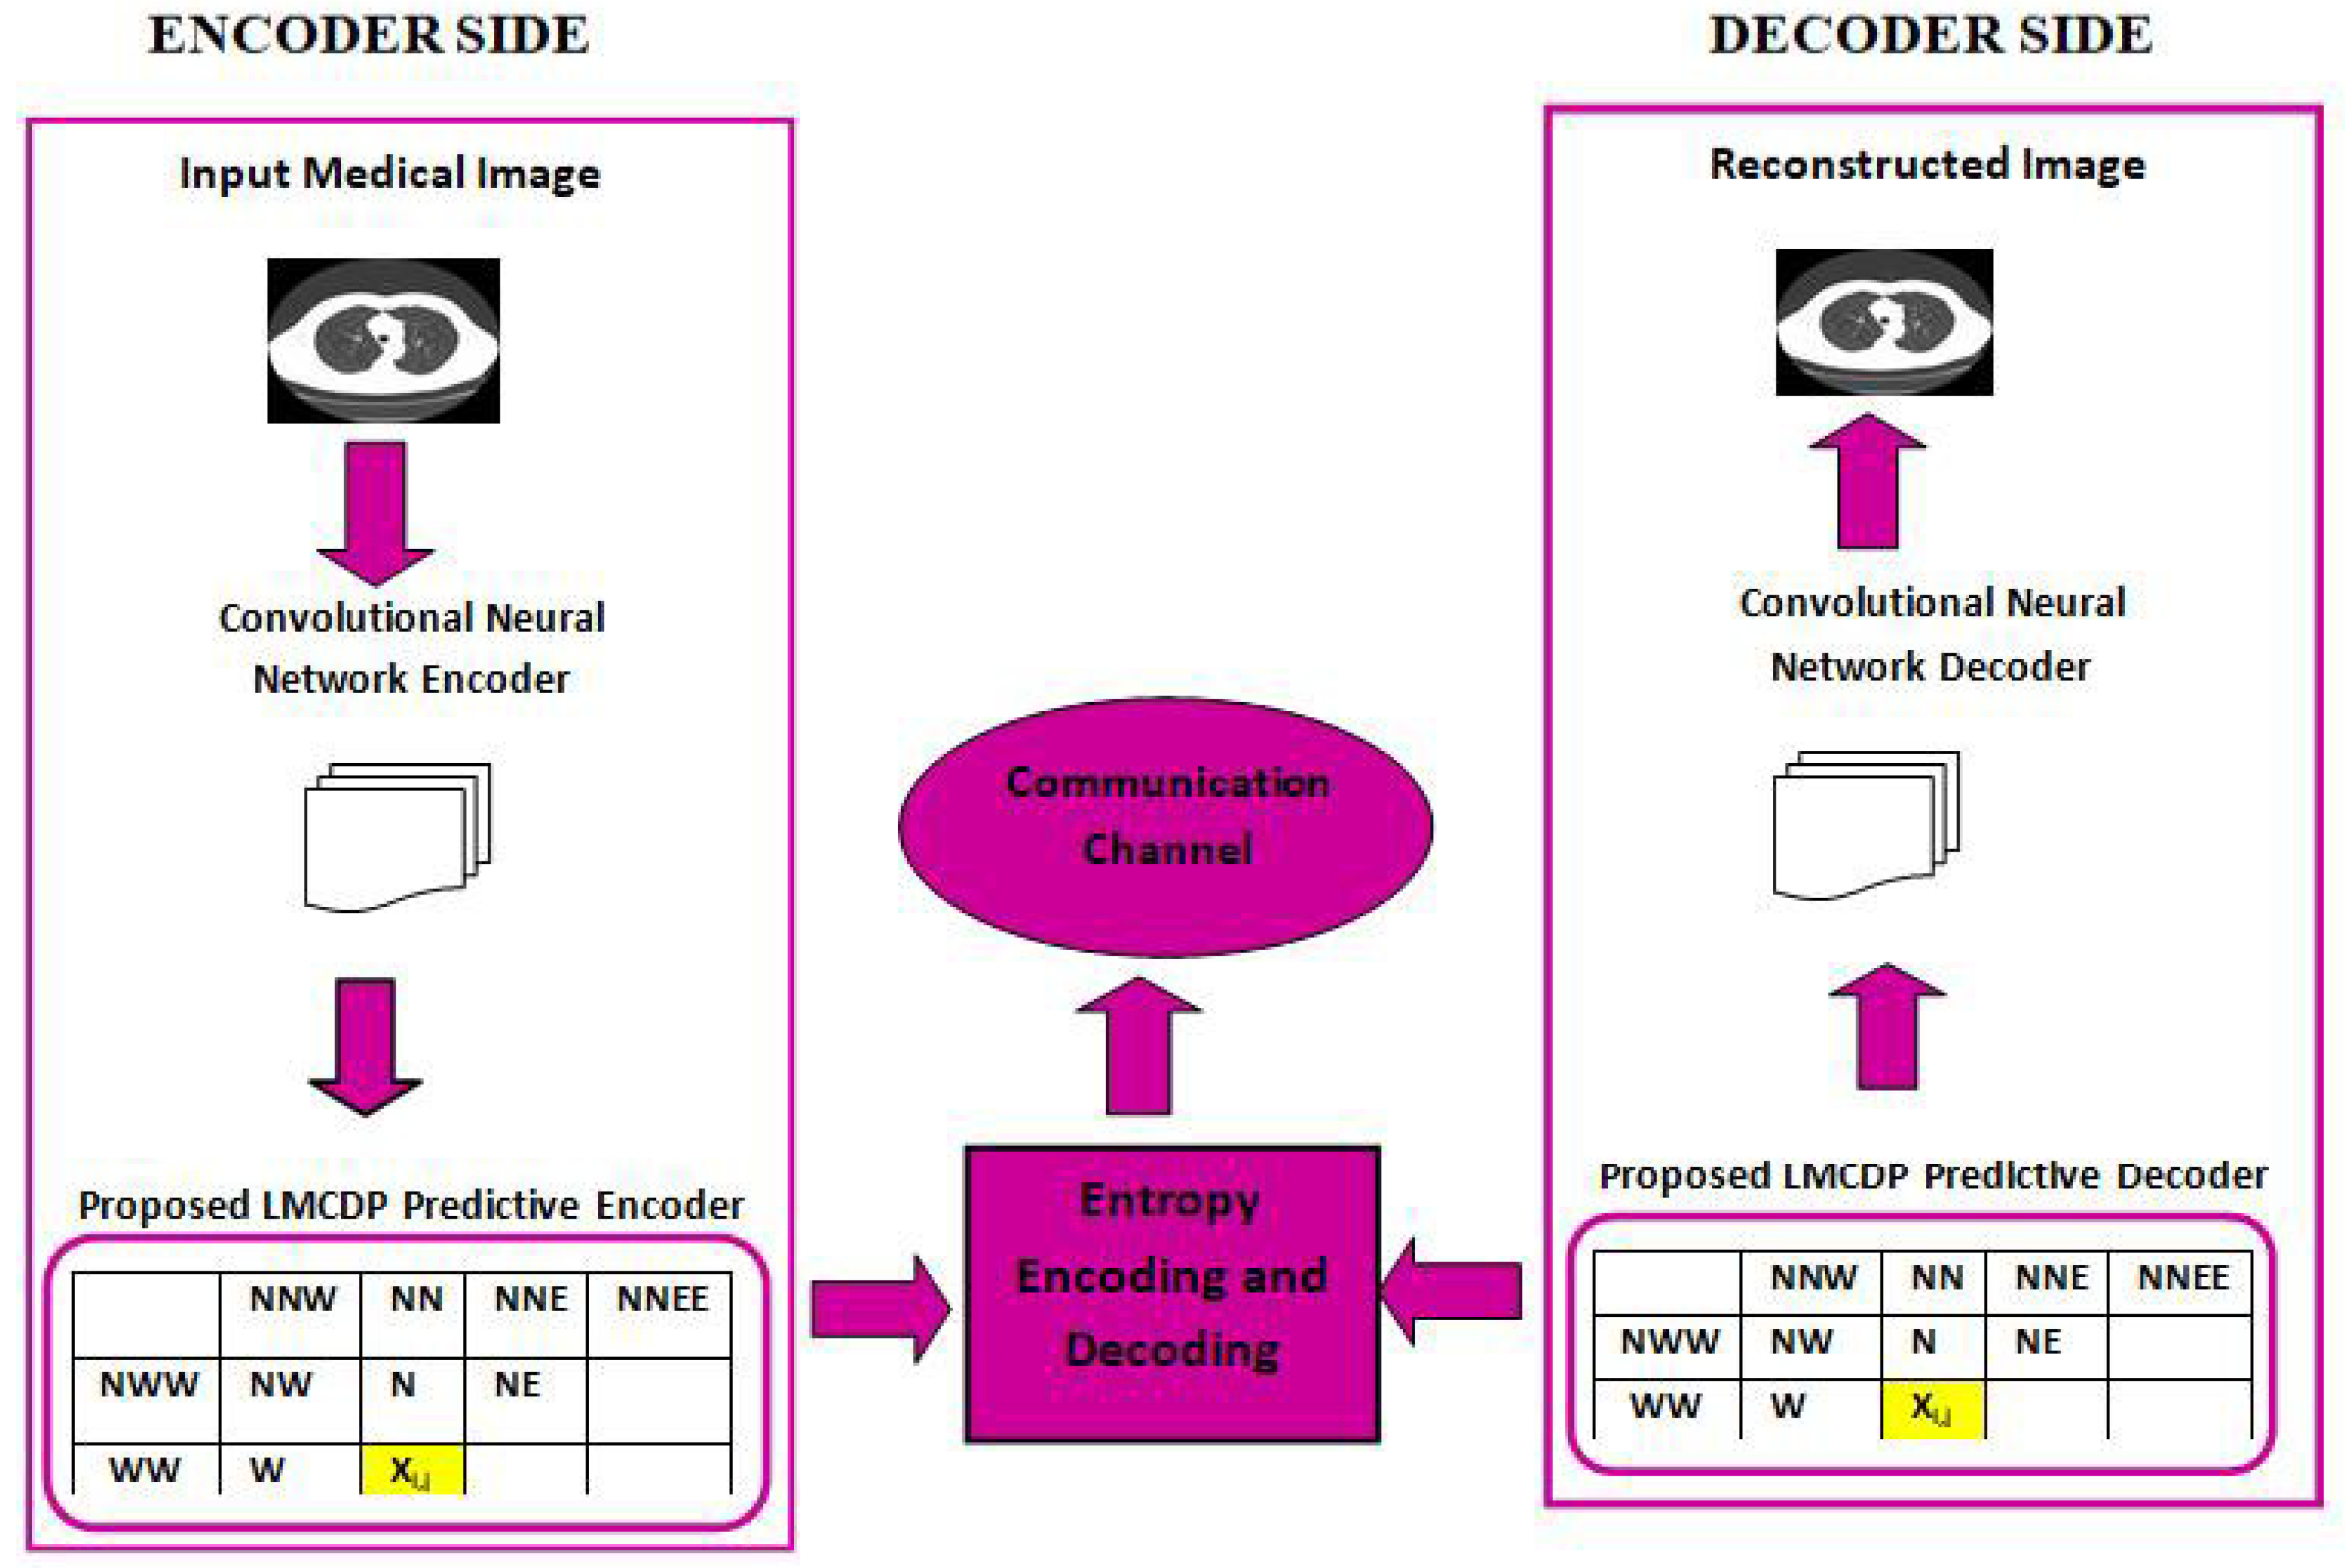
Figure 2 highlights the encoder and decoder model employed in the proposed work. Figure 4.3 and Figure 4.4 illustrates the encoding and decoding algorithm employed for the proposed system respectively.
Figure 2. A Complete Framework of Encoder and Decoder for the Proposed Methodology.
Preprints 81405 g002
Algorithm 1: Encoder algorithm Input:
Uncompressed Medical Image, I Output: Compressed Image, CI Perform Convolutional Neural Network Encoding (CNNEnc) for the Image I of size M x N Compute prediction for each pixel using LMCDP Perform arithmetic encoding to obtain compressed image
Algorithm 2: Decoder algorithm
Input: Compressed Medical Image, CI Output: Uncompressed Image, I
Perform arithmetic decoding for the entire stream of bits Compute prediction for each pixel using LMCDP Perform Convolutional Neural Network Decoding (CNNDec) for the Image I of size M x N
Perform Convolutional Neural Network Encoding (CNNEnc) for the Image I of size M x Compute prediction for each pixel using LMCDP Perform arithmetic encoding to obtain compressed image Perform arithmetic decoding for the entire stream of bits Compute prediction for each pixel using LMCDP Perform Convolutional Neural Network Decoding (CNNDec) for the Image I of size M x N Step by step workflow of the algorithm of the proposed work CNN- LMCDP is presented in Figure 3

3.2.1. Proposed Work of LMCDP Predictor

The architecture of the proposed LMCDP is shown in Figure 4. This method is proposed to predict the pixel which is used for eliminating the inter pixel redundancy thereby enhancing compression accuracy.The schematic map explains the proposed LMCDP lossless predictive encoder algorithm of an M×N input image. CNN is employed to generate a compact representation for the input image. Contiguous directional difference is estimated along 45, 90, 135 and 180. The four vectors are sorted in ascending order and the maximum index is found from each vector.In a medical image I, consider a pixel X i , j , where 1 i N and 1 j N columns, where N rows and N columns represent the total number of rows and columns of the image. Let us consider a pixel X i , j which is the pixel to be predicted using the proposed method LMCDP with the help of the causal template as shown in Figure 6
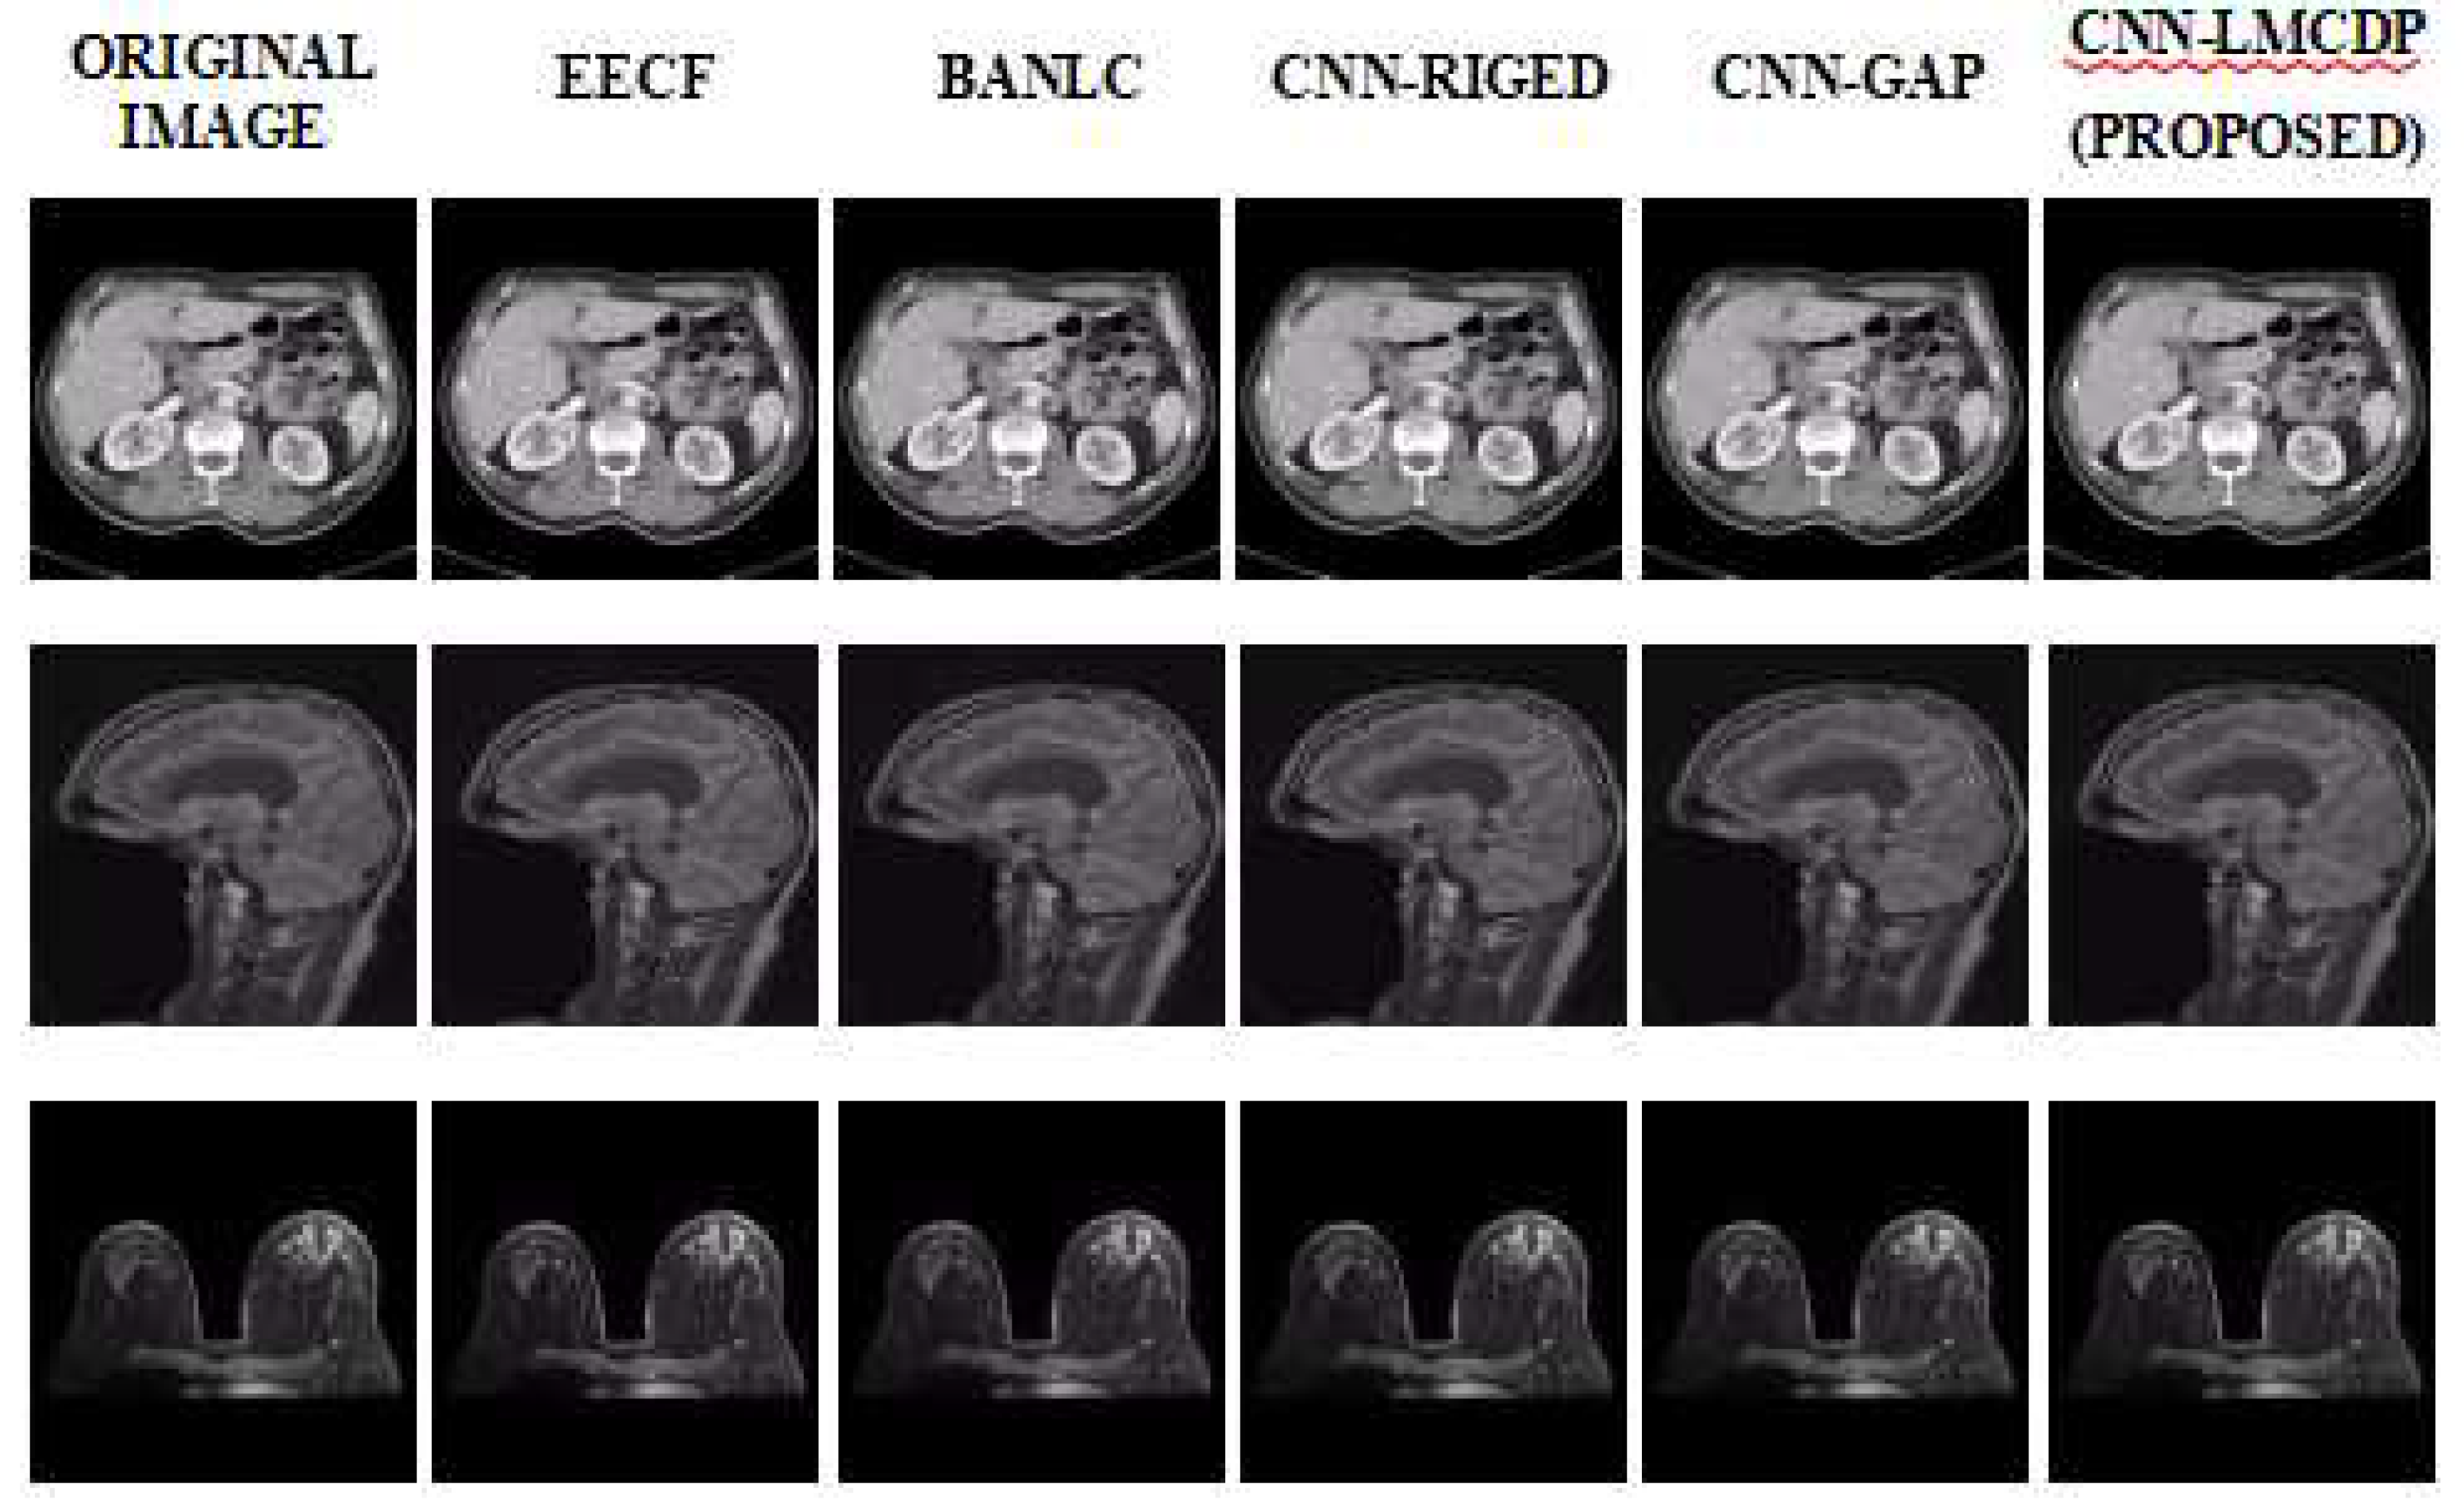
Figure 4. Compression performance of Medical Image Samples of Proposed Work Compared with Existing Works
Preprints 81405 g004
Figure 5. Sample outputs of the Proposed Work
Preprints 81405 g005
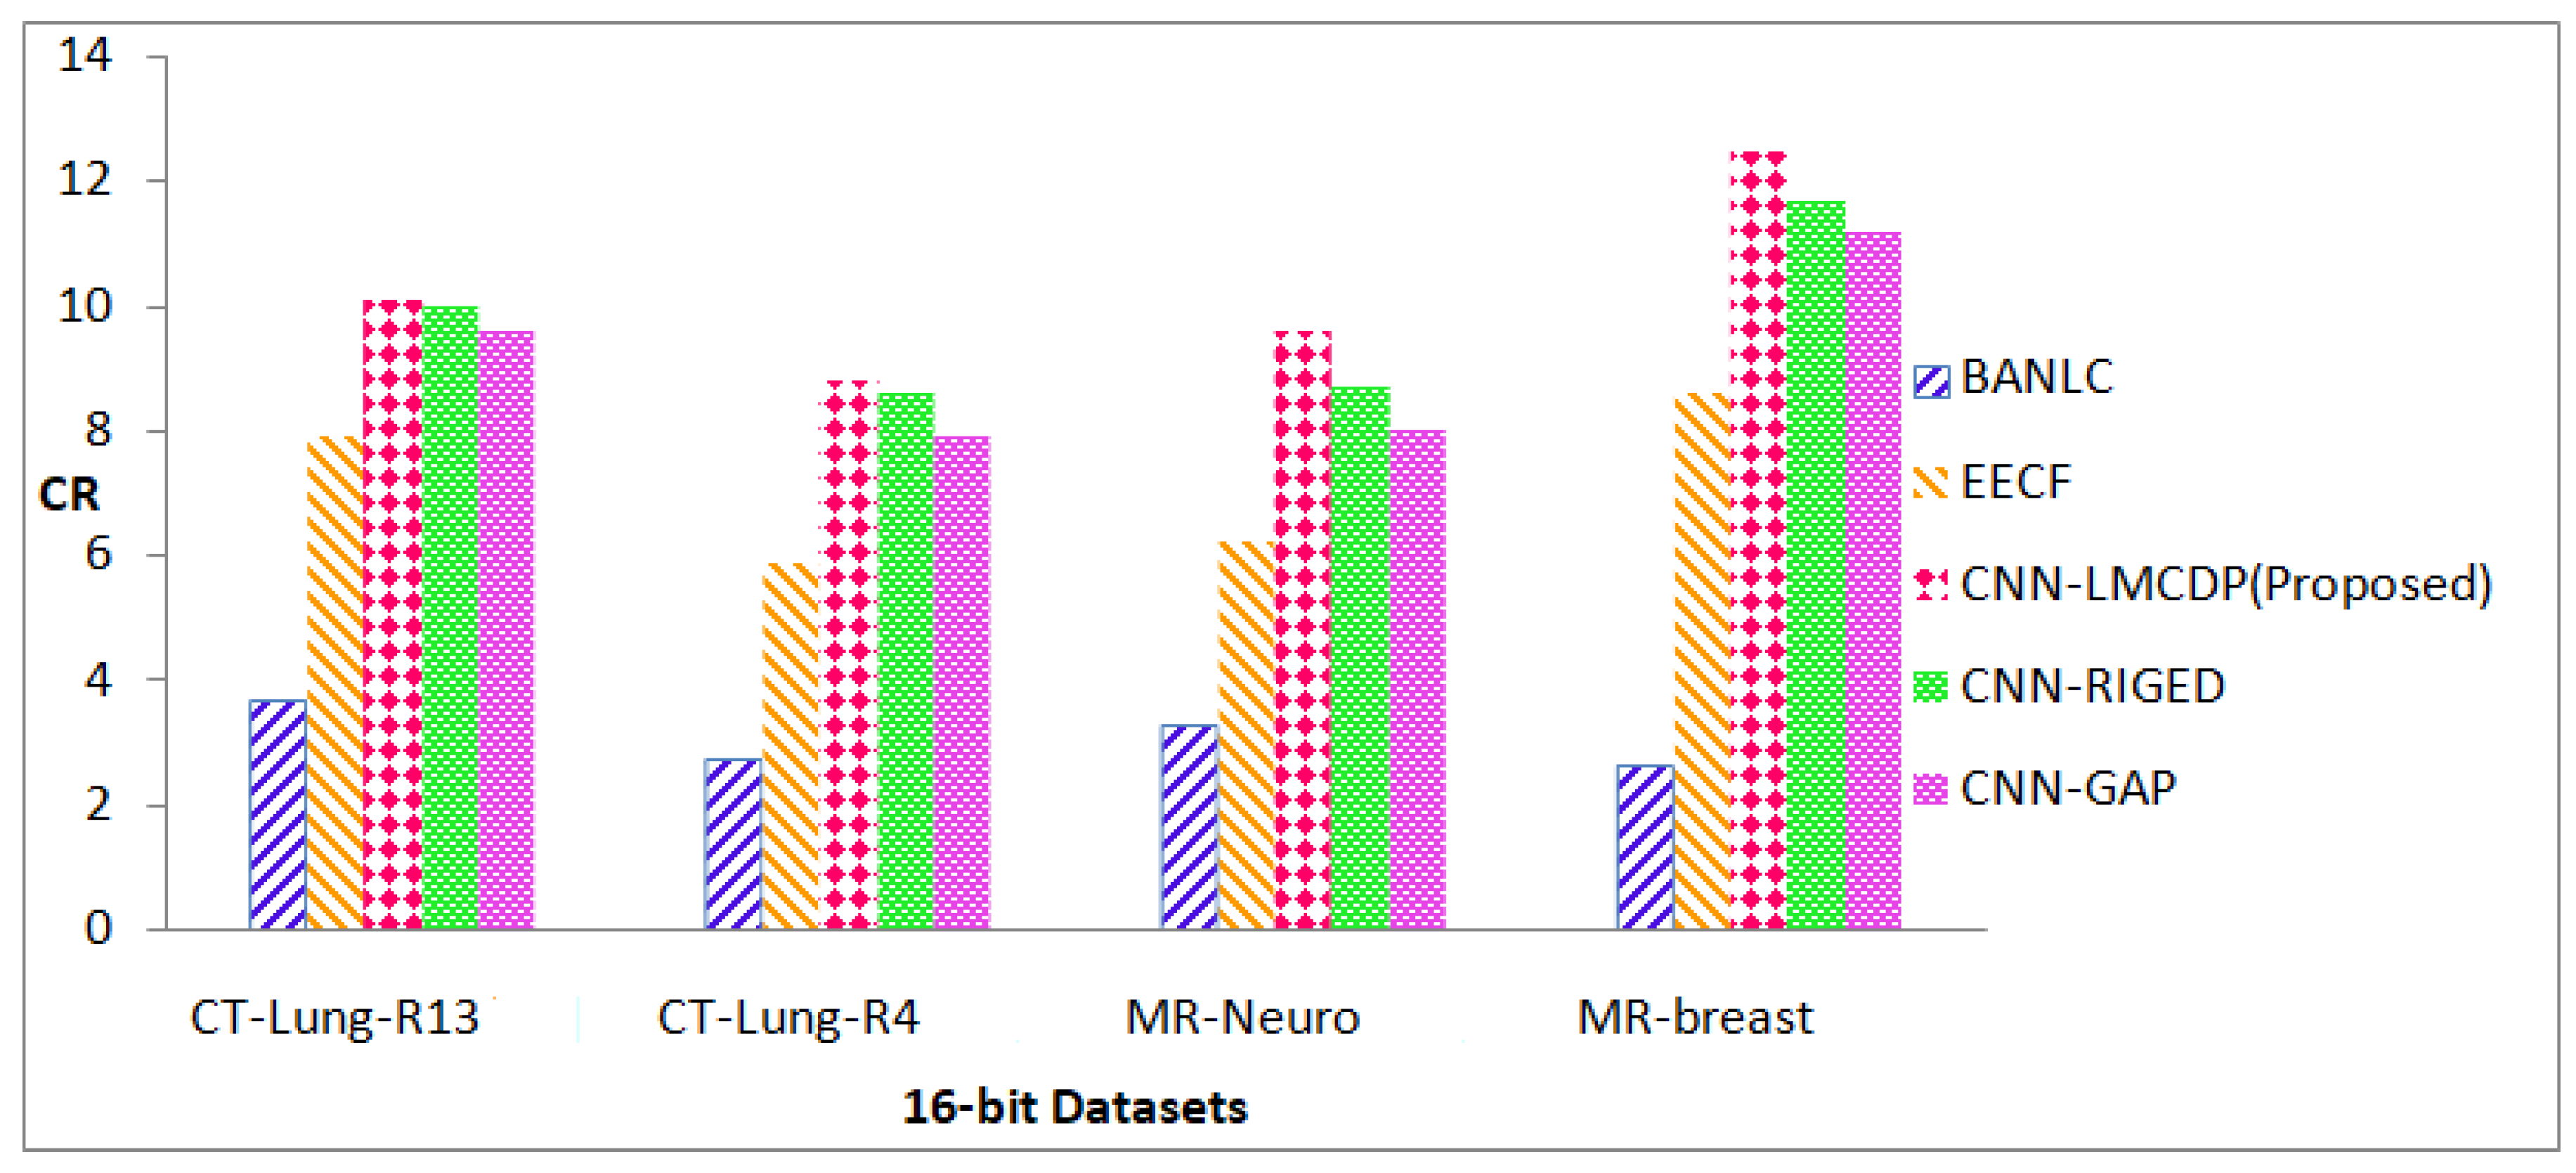
Figure 6. Comparison of CR (16 bit images) obtained by the proposed method with existing compression methods
Preprints 81405 g006

Estimating contiguous directional difference for prediction

Difference can be estimated for each pixel in level one with the pixel in level two along four orientations such as 45, 90, 135, 180. The general representation for difference estimation along four orientations is given in Equation (1).
P θ d i f f C P θ P ( 1 )
where P refers to pixels contiguous to the predicting pixel X i , , j c o n t i g u o u s such as W,NW,N,NE in level one and CP refers to the pixels contiguous to X i , , j c o n t i g u o u s such as WW, NWW, NNWW, NNW, NN, NNE, NNEE of level two.
Vectors are generated for the pixels in level one, by considering the context of contiguous pixels along four orientations. W is calculated using intensity difference between Win level one with WW in level two, whereas W is calculated using intensity difference between Win level one with NWW in level two, whereas W is calculated using intensity difference between Win level one with NW in level two, whereas W is calculated using intensity difference between Win level one with N in level two.
The predicted values contain both positive and negative values. Absolute function is used for converting the negative values into positive values. The contiguous directional difference for predicting the intensity value of W along the four orientations is calculated using Equation (2) to (4.5). The causal template for computing directional difference along 180, 135, 90 and 45, for W direction is shown in Figure 4.9.
W 180 d i f f a b s W W W ( 2 )
W 135 d i f f a b s N W W W ( 4.3 )
W 90 d i f f a b s N W W ( 4.4 )
W 45 d i f f a b s N W ( 4.5 )
Table 2. Causal Template for N along four orientations 45, 90, 135 and 180 for pixel prediction
NNW NN NNE NNEE NNWW NNW NN NNE NNEE
NWW NW N NE NWW NW N NE
WW W X WW W X
Table 3. Causal Template for N along four orientations 45, 90, 135 and 180 for pixel prediction
NNWW NNW NN NNE NNEE NNWW NNW NN NNE NNEE
NWW NW N NE NWW NW N NE
WW W X WW W X
Figure 4.9 Causal Template for W along four orientations 45, 90, 135 and 180 for pixel prediction
The contiguous directional difference for predicting the intensity value of NW along the four orientations is calculated using Equation (4.6) to (4.9). The causal template for computing directional difference along 180, 135, 90 and 45, for NW direction is shown in Figure 4.10.
N W 180 d i f f a b s N W W W ( 4.6 )
W 135 d i f f a b s N N W W N W ( 4.7 )
W 90 d i f f a b s N N W N W ( 4.8 )
W 45 d i f f a b s N N W ( 4.9 )
Table 4. Causal Template for N along four orientations 45, 90, 135 and 180 for pixel prediction
NNWW NNW NN NNE NNEE NNWW NNW NN NNE NNEE
NWW NW N NE NWW NW N NE
WW W X WW W
Table 5. Causal Template for N along four orientations 45, 90, 135 and 180 for pixel prediction
NNWW NNW NN NNE NNEE NNWW NNW NN NNE NNEE
NWW NW N NE NWW NW N NE
WW W X WW W X
Figure 4.10 Causal Template for NW along four orientations 45, 90, 135 and 180 for pixel prediction
The contiguous directional difference for predicting the intensity value of N along the four orientations is calculated using Equation (4.10) to (4.13). The causal template for computing directional difference along 180, 135, 90 and 45, for N direction is shown in Figure 4.11.
N W 180 d i f f a b s N W W ( 4.10 )
W 135 d i f f a b s N N W N W ( 4.11 )
W 90 d i f f a b s N N N ( 4.12 )
W 45 d i f f a b s N N E W ( 4.13 )
Table 6. Causal Template for N along four orientations 45, 90, 135 and 180 for pixel prediction
NNW NN NNE NNEE NNW NN NNE NNEE
NWW NW N NE NWW NW N NE
WW W X WW W X
Table 7.
NNW NN NNE NNEE NNW NN NNE NNEE
NWW NW N NE NWW NW N NE
WW W X WW W X
Figure 4.11 Causal Template for N along four orientations 45, 90, 135 and 180 for pixel prediction
The contiguous directional difference for predicting the intensity value of NE along the four orientations is calculated using Equation (4.14) to (4.17). The causal template for computing directional difference along 180, 135, 90 and 45, for NE direction is shown in Figure 4.12.
N E 180 d i f f a b s N N E ( 4.14 )
N E 135 d i f f a b s N N N E ( 4.15 )
N E 90 d i f f a b s N N E ( 4.16 )
N E 45 d i f f a b s N N E E N E ( 4.17 )
Table 8. Causal Template for N along four orientations 45, 90, 135 and 180 for pixel prediction
NNW NN NNE NNEE NNW NN NNE NNEE
NWW NW N NE NWW NW N NE
WW W X WW W X
NNW NN NNE NNEE NNW NN NNE NNEE
NWW NW N NE NWW NW N NE
WW W X WW W X
Figure 4.12 Causal Template for NE along four orientations 45, 90, 135 and 180 for pixel prediction

Directional difference vector generation

After the directional difference estimation for W, NW, N and NE of the contributing pixels, the directional vectors computed are:
W, NW, N, NE as in Equation (4.18) to (4.21).
W θ d i f f = W 180 d i f f , W 135 d i f f , W 90 d i f f , W 45 d i f f ( 4.18 )
N W θ d i f f = N W 180 d i f f , N W 135 d i f f , N W 90 d i f f , N W 45 d i f f ( 4.19 )
N θ d i f f = N 180 d i f f , N 135 d i f f , N 90 d i f f , N 45 d i f f ( 4.20 )
N E θ d i f f = N E 180 d i f f , N E 135 d i f f , N E 90 d i f f , N E 45 d i f f ( 4.21 )
Now, W , NW , N , NE constitutes four positive values for each directional vector of k elements. The four positive values difference
vectors are shown in Equation (4.18) to (4.21). Then the four vectors are arranged in increasing order for k elements.

4. PERFORMANCE METRICS AND RESULTS

The proposed experimental works are conducted for 8 bit and 16 bit MRI and CT medical image samples. Various compression performance metrics such as CR, PSNR, MSE, BPP, SSIM, SC, NAE, NK and LMSE are used to validate the compression performance.

4.1

4.1.1. Performance Metrics

The proposed work is evaluated using various quantitative measurements for medical images and standard chain code images.

Compression Ratio (CR)

CR which is an objective measure is used to measure the original image size with the compressed image size as shown in Equation (4.32).
CR = size of the original image / size of the compressed image (4.32)

Mean Square Error (MSE

Equation (4.33) defines the cumulative squared error compared with the compressed and the input image.where, M 2 denotes the size of the image, y i , , j and y i , j represents the intensity values of the original image and reconstructed image respectively. If the PSNR value is high, then the quality of the reconstructed image is also high.

Peak Signal to Noise Ratio (PSNR

Equation (4.34) defines PSNR as a measure of peak error. Higher value of PSNR indicates that the quality is good.
P S N R = 20 l o g F r a n g e r o o t o f M S E ( 4.34 )
where, the range of the signal is denoted as F r a n g e and is measured in decibels(dB).

Percentage Rate of Distortion (PRD

Equation (4.35) which is a fidelity measure used for quantifying the amount of distortion occurred after image reconstruction. A minimum value of PRD specifies the effective image reconstruction and is shown in Equation (4.35)
P R D = u = 1 Q v = 1 R g u , v g ( u , v ) 2 u = 1 Q v = 1 R g u , v 2 × 100 ( 4.35 )
Here, Q×R represents size of the image, g (u,v) istheoriginalis the reconstructedimage.

Correlation Coefficient (CC

Equation (4.36) is a measure which is used to find the amount of correlation that exists between the original image and the reconstructed image.CC value of 1specifies perfect reconstruction.
C C = a = 1 R b = 1 S g ( a , b ) × g ( a , b ) a = 1 R b = 1 S ( g a , b ) 2 a = 1 R b = 1 S ( g a , b ) 2 ( 4.36 )
Here, R×S represents size of the image, g(a,b) is the original image
and g a , b is the reconstructed image.

Normalized Absolute Error (NAE

It is a parameter used for measuring the quality of an image which is conveyed in Equation (4.37) as,
N A E = j = 1 M k = 1 V X j , k X j , k j = 1 M k = 1 N X j , k ( 4.37 )
Equation (4.37) depicts that if the value of NAE is high then the rebuild image is of low quality.

Normalized Cross Correlation (NCC

This is a measure which is used to reveal the similarity between the original image and the reconstructed image which is conveyed in Equation (4.38) as,
N C C = j = 1 M K = 1 V x j , k x j , k j = 1 M k = 1 N x j , k 2 ( 4.38 )

Least Mean Square Error (LMSE

This metric is used to measure the significance of edge and it is expressed in Equation (4.39) as,
L M S E = j = 1 M K = 1 V o x j , k O x j , k j = 1 M k = 1 N O x j , k x 2 ( 4.39 )
If the value of LMSE is high, then the image is of very poor
quality.

Structured Correlation (SC

This measure is used to compare two images to identify the common properties that exist between them. SC value nearer to 1 indicates the reconstructed image of high quality and greater than 1 depicts an image of poor quality and it is expressed in Equation (4.40) as,
S C = m = 1 P n = 1 Q Y 2 m , n m = 1 P n = 1 Q Y 2 m , n ( 4.40 )
Here, P and Q are the dimensions of the image.

4.2. EXPERIMENTAL RESULTS

In this section, the experimental analysis is carried out for medical image datasets namely, CT-skull, MRI_ head, CT-Lung R13 (Grove, 2015), CT-Lung-R4 (Grove, 2015), MR-Neuro (Barboriak, 2015) and MR-Breast (Meyer, 2015) which are publicly available.
The CT-skull images used for testing are collected from CIPR dataset and MRI_ head samples from Computer Vision Group . CT-Lung R13, CT-Lung-R4, MR-Neuro and MR-Breast test samples of 16-bit depth are collected from Cancer Imaging Archive (Clark, 2013) dataset.
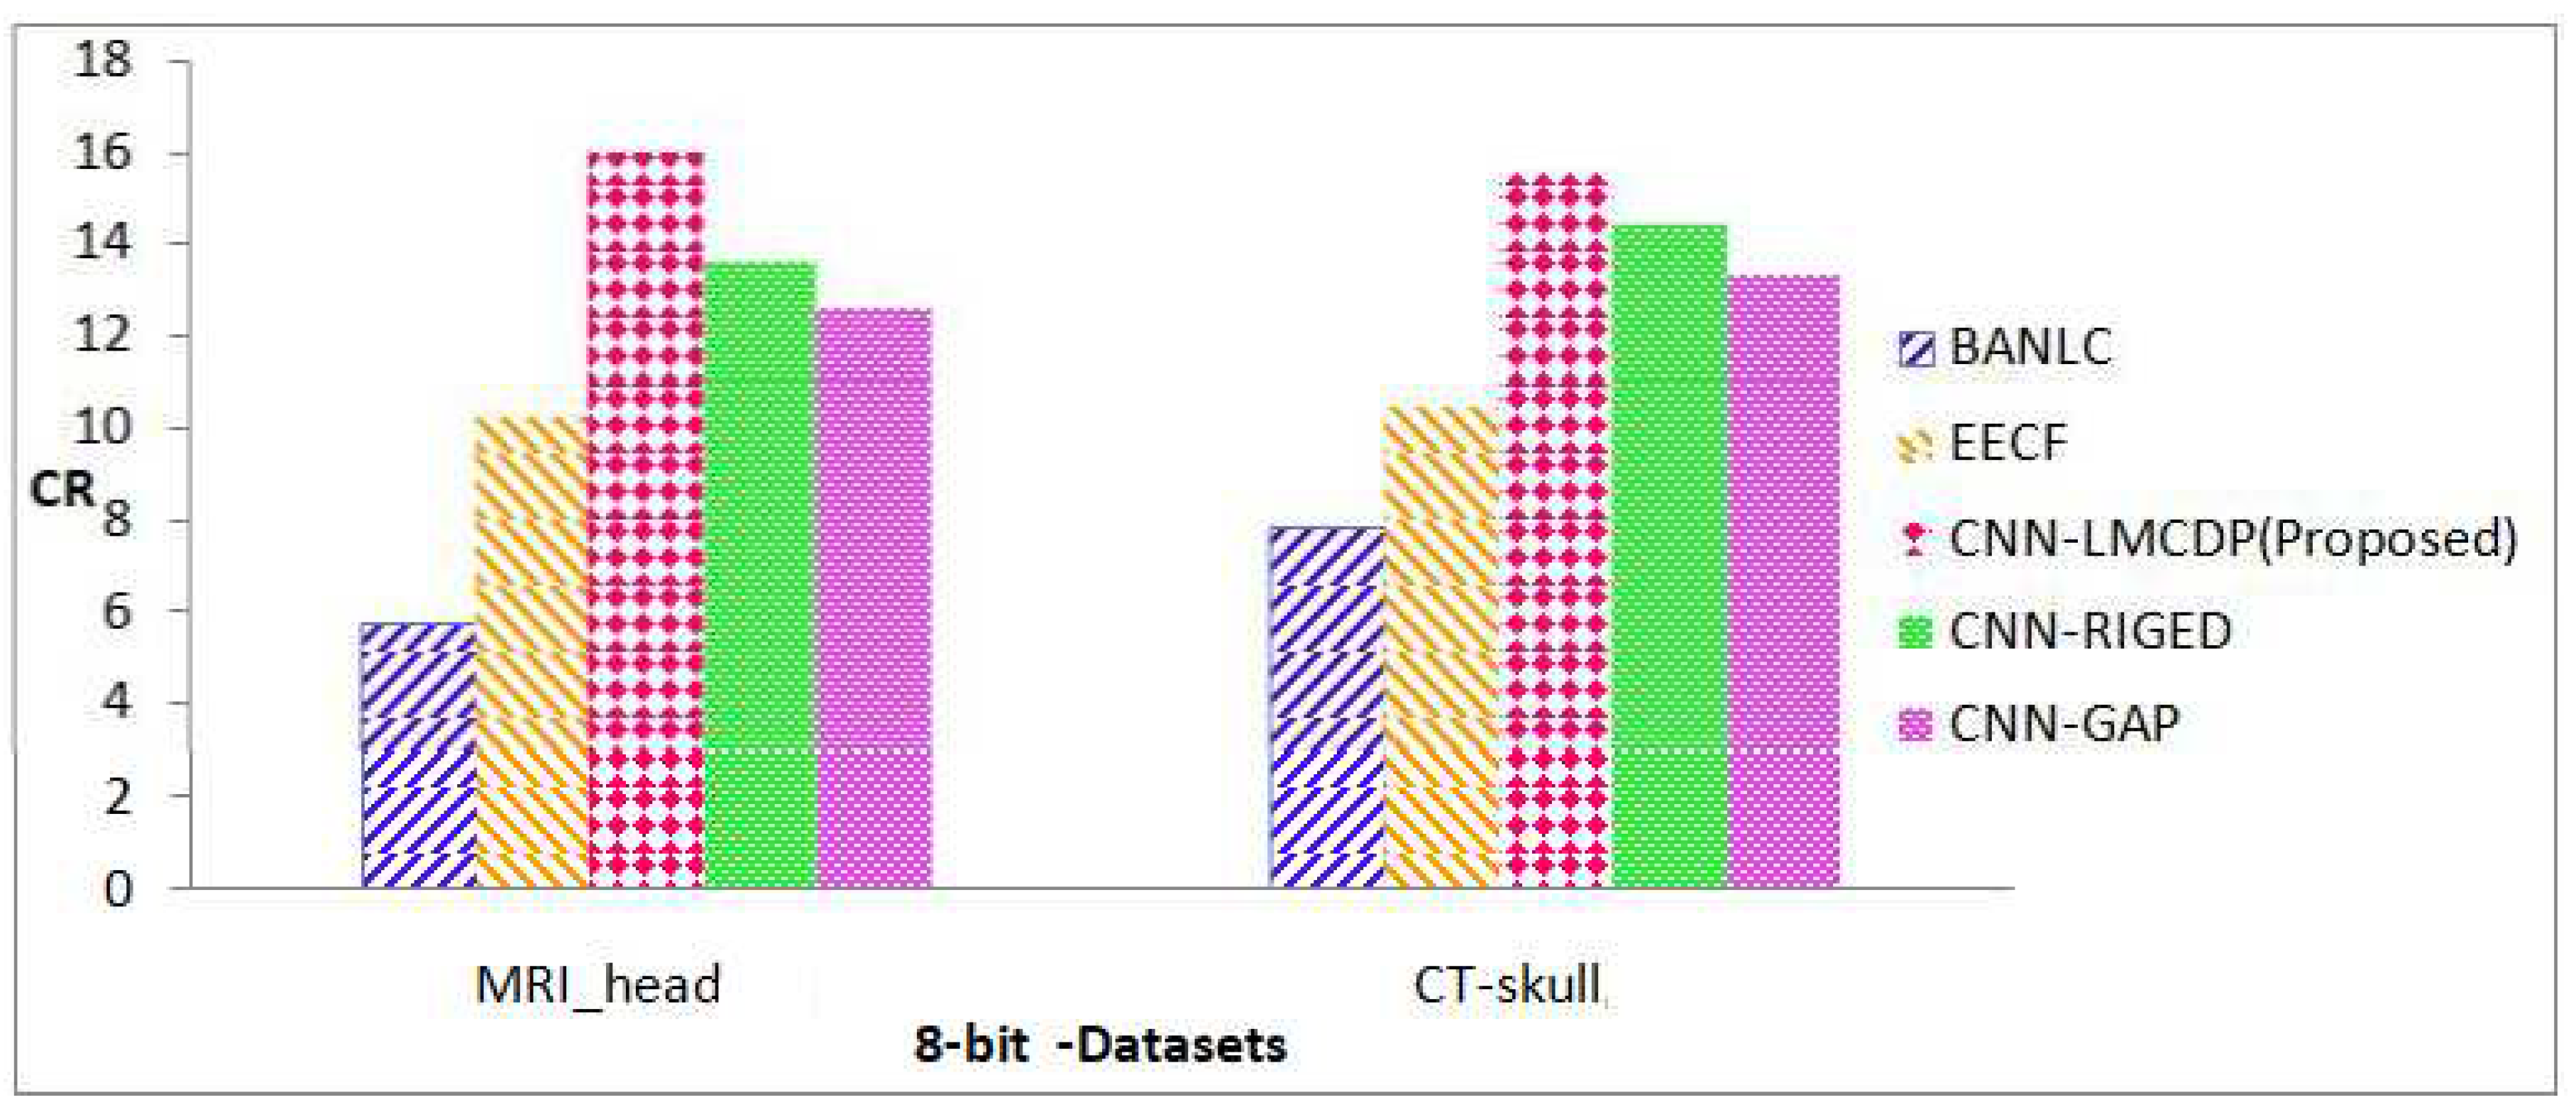
Figure 7 represents compression performance of various medical image samples. The proposed CNN-LMCDP method is compared with the existing techniques such as End to End Compression Framework (EECF) (Jiang, 2017), Block Adaptive Near Lossless Compression (BANLC) (Sharma,2020), CNN-RIGED and CNN-GAP respectively. From the figure, it is observed that the proposed work is better compared to the existing techniques.
Figure 7. Comparison of CR (8 bit images) obtained by the proposed method with existing compression methods
Preprints 81405 g007
Figure 7 represents the sample outputs obtained while compressing various medical image samples. Firstly, the original image is fed into the encoder. Secondly, the predicted image is obtained after prediction. Thirdly, the predicted image is recovered and as a final step, the compressed image is obtained.
From the results obtained from Table 9, it is reported that the PSNR of the proposed CNN-LMCDP method for 16 bit depth images is compared with other existing approaches such as BANLC, EECF, CNN- RIGED and CNN-GAP. The proposed CNN-LMCDP method has achieved 1% improvement in the average PSNR results. Cancer Imaging Archive, a publicly available dataset reported in Table 9 have achieved 1% improvement in PSNR for the proposed work, when compared to BANLC method, 1% improvement in PSNR for EECF method, 1% improvement in PSNR for CNN-RIGED and 1% improvement in PSNR for CNN-GAP.
Table 9. Comparison of PSNR values (16 bit images) for the proposed method with the existing compression methods
DATASETS BANLC EECF CNN- RIGED CNN- GAP CNN-LMCDP (Proposed)
CT-Lung-R13 66.35 65.42 66.64 65.87 67.35
CT-Lung-R4 67.30 67.02 67.60 66.81 68.32
MR-Neuro 64.46 65.16 63.74 63.99 65.43
MR-Breast 63.94 63.05 64.22 63.98 64.91
Average 65.51 65.16 65.55 65.16 66.50
CIPR, a publicly available dataset reported in Table 10 for MRI_head image sequences have achieved approximately 5% improvement in PSNR for the proposed work when compared to BANLC method, 1% improvement in PSNR for EECF, 1% improvement in PSNR for CNN- RIGED and 2% improvement in PSNR for CNN-GAP CIPR dataset of BANLC, EECF, CNN-RIGED and CNN-GAPreported in Table 10 for CT skull image sequences have achieved 5% improvement in PSNR when compared to BANLC method, 2% improvement in PSNR for EECF method, 1% improvement in PSNR for CNN-RIGED and 2% improvement in PSNR for CNN-GAP. From Figure 8, it is observed that the PSNR values of the proposed work for 16 bit depth images has achieved better results when compared to the existing techniques. It is 4%, 2%, 1%, 1%, 1% and 1% better than Set Partitioning in Hierarchical Trees (SPIHT) (Said, 1996), JPEG 2000[65], BANLC, EECF, CNN-RIGED and CNN-GAP respectively.
Table 10. Comparison of PSNR values (8 bit images) for the proposed method with the existing methods
DATASETS BANLC EECF CNN- RIGED CNN- GAP CNN-LMCDP (Proposed)
MRI_head 43.617 46.88 44.86 45.32 46.09
CT-skull 46.018 50.44 52.00 50.56 52.06
Average 44.8175 48.66 48.43 47.94 49.075
From Figure 9, it is observed that the PSNR value of the proposed work for 8 bit depth images is better when compared to the existing techniques. It is 5%, 5%, 5%, 1%, 1% and 2% better than SPIHT, JPEG 2000, BANLC, EECF, CNN-RIGED and CNN-GAP respectively.
Various measures are taken into consideration to validate the proposed method results.CR is an effective measure which is used for assessing compression efficiency. Figure 4.17 and 4.18 represent the results obtained from various datasets for 16 bit and 8 bit images in terms of CR. Higher value of CR represents better compression and that is attained in the proposed work.From Figure 8, it is revealed that the proposed CNN-LMCDP method has achieved a maximum CR compared with other existing works. For the 16 bit test samples such as CT-Lung R13, CT-Lung-R4, MR-Neuro and MR-Breast images, the proposed CNN-LMCDP method has exhibited superior results with a higher average CR of 10.22.
CT-Lung R13 image sequences have achieved 7% improvement in CR for the proposed work, when compared to BANLC method, 2% improvement in CR for EECF method, 1% improvement in CR for CNN- RIGED and 2% improvement in CR for CNN-GAP. CT-Lung R4 image sequences have achieved 6% improvement in CR when compared to BANLC method, 3% improvement in CR for EECF method, 1% improvement in CR for CNN-RIGED and 1% improvement in CR for CNN-GAP.
Cancer Imaging Archive [27] dataset for MR-Neuro image sequences have achieved 6% improvement in CR when compared to BANLC method, 3% improvement in CR for EECF, 1% improvement in CR for CNN- RIGED and 2% improvement in CR for CNN-GAP. For MR-Breast image sequences, the dataset has achieved 9% improvement in CR when compared to BANLC method, 3% improvement in CR for EECF method, 1% improvement in CR for CNN-RIGED and 1% improvement in CR for CNN- GAP.
For all the other methods, the test images have achieved an average CR of 3.05,7.14,9.74 and 9.17 for BANLC, EECF, CNN-RIGED and CNN-GAP respectively, which is very less when compared to the proposed method.
Figure 9 for MRI_head and CT-skull image sequences have achieved a maximum average CR of 15.75 bits which is an improvement of 9%, 5%, 1% and 3% for BANLC, EECF, CNN-RIGED and CNN-GAP respectively.
In the same manner, Figure 9 for 16 bit dataset images such as MRI_head and CT-skull, the proposed method excels with superior performance with an average CR of 10.22. There is an improvement by 8%, 8%, 7%, 3%, 1% and 1% for SPIHT, JPEG 2000, BANLC, EECF, CNN-RIGED and CNN-GAP respectively for the proposed method.
From Figure 10, it is observed that the proposed work for 8 bit depth images has achieved better CR results when compared to the existing techniques. It is 10%, 11%, 9%, 5%, 2% and 3% better than SPIHT, JPEG- 2000, BANLC, EECF, CNN-RIGED and CNN-GAP respectively.the proposed method is compared with state of art compression techniques
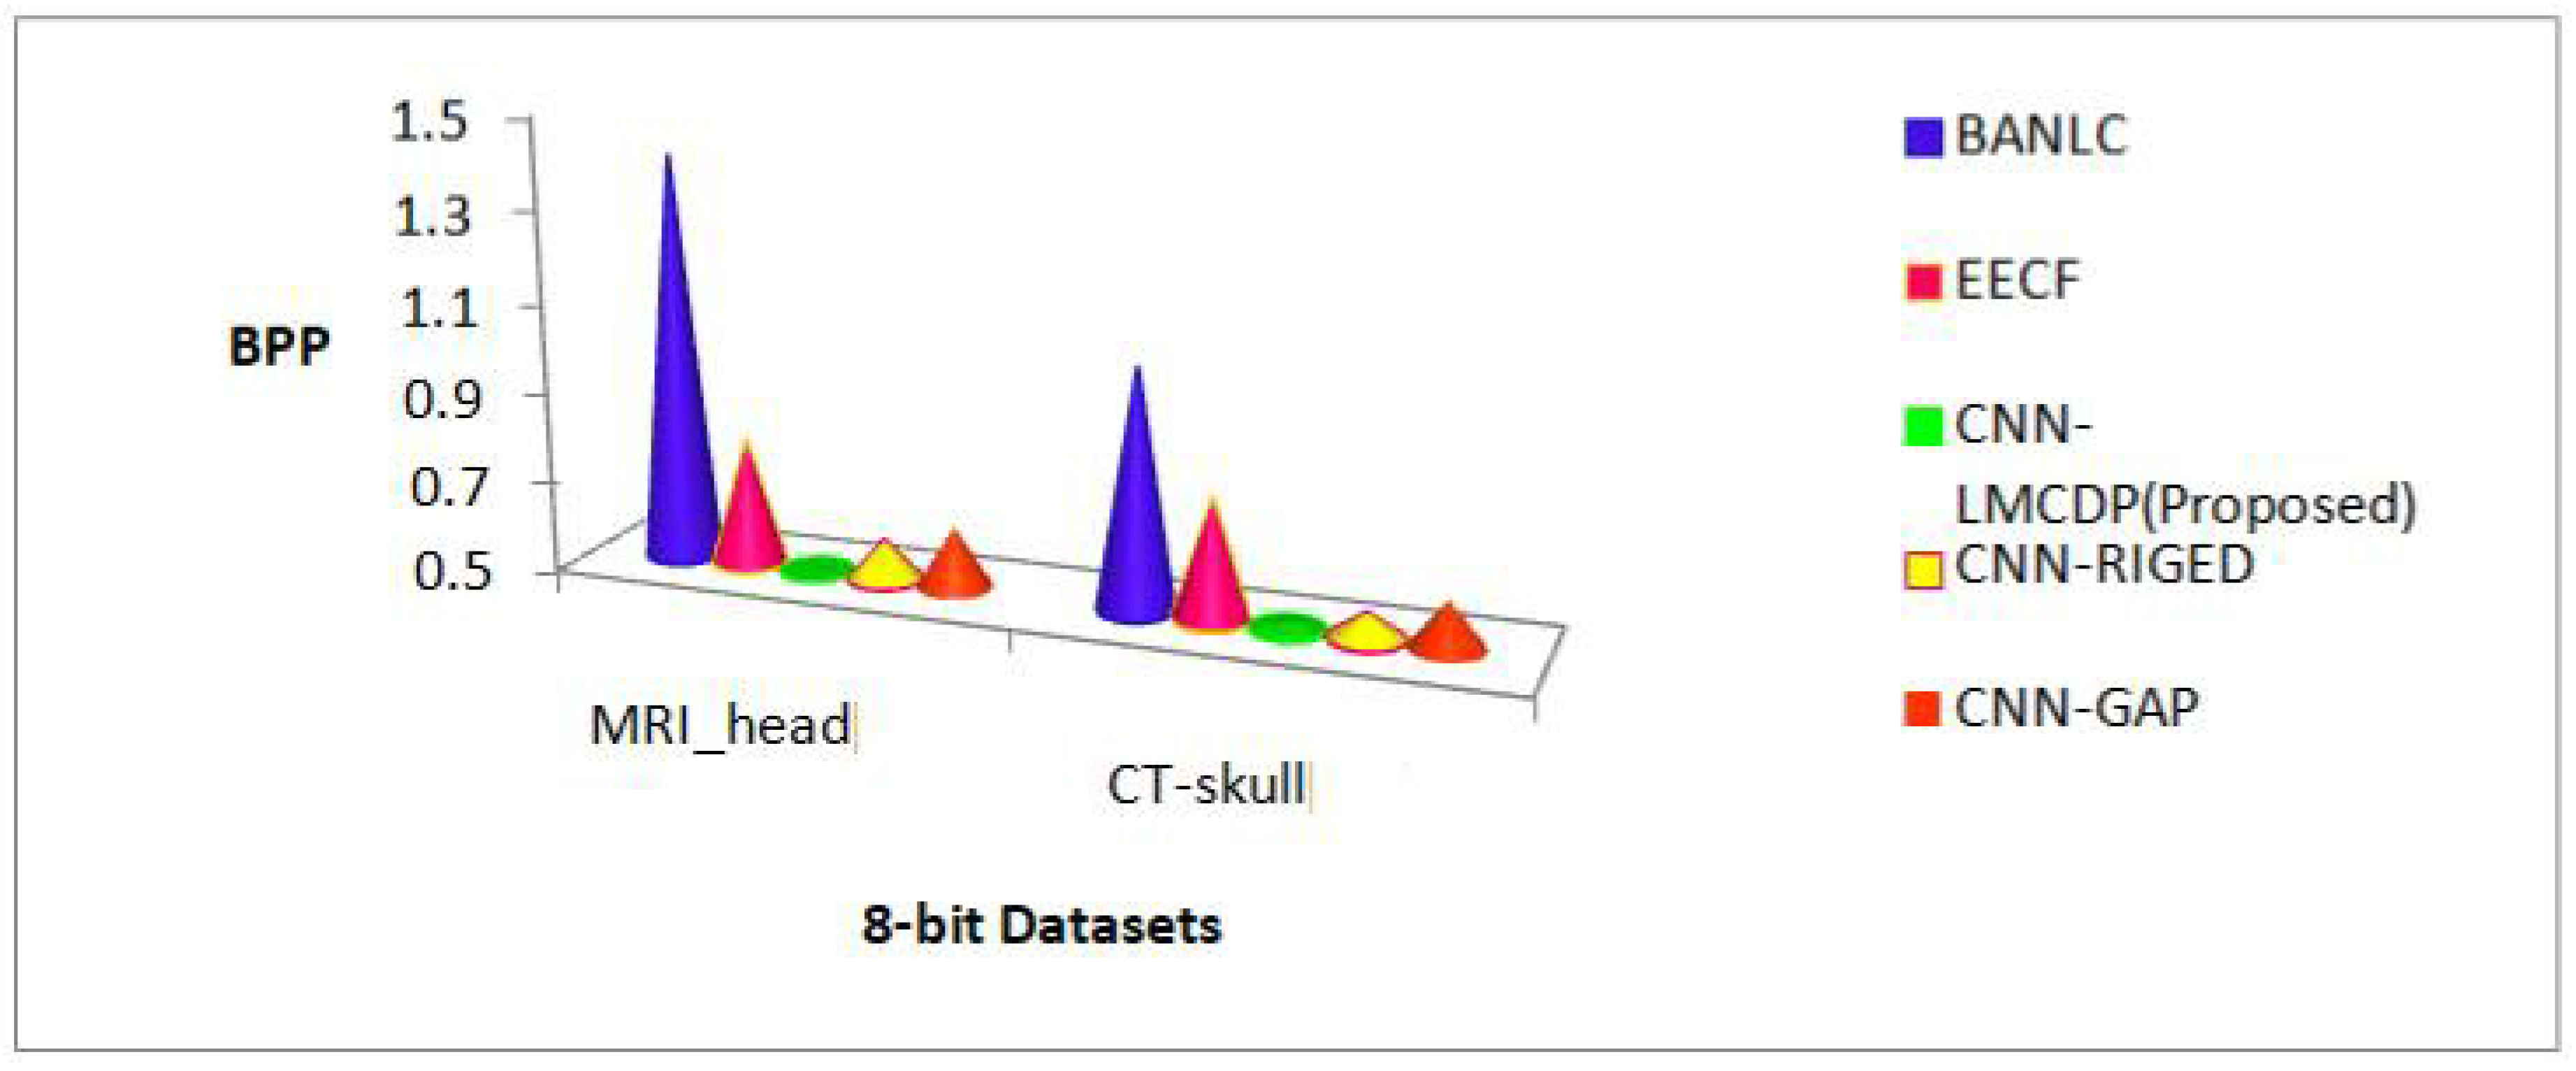
Figure 8. 1 BPP results (8 bit images) obtained by the proposed method is compared with existing compression techniques for MRI_head and CT-skull datasets
Preprints 81405 g008
From Figure 11, it is observed that the proposed work for 8 bit depth images has achieved better CR results when compared to the existing techniques. It is 10%, 11%, 9%, 5%, 1% and 3% better than SPIHT, JPEG 2000, BANLC, EECF, CNN-RIGED and CNN-GAP respectively.
Figure 9. 2 BPP results (16 bit images) obtained by the proposed method is compared with existing compression techniques for MRI and CT Datasets
Preprints 81405 g009
From Figure 12, it is observed that the proposed work for 16 bit depth images has achieved better BPP results of 0.79 bits when compared to the existing techniques. BPP results achieved by existing methods such as BANLC, EECF, CNN-RIGED and CNN-GAP are 2.67, 1.15, 0.83 and 0.89respectively.
In the same manner, Figure 13 for 16 bit test samples such as CT- Lung R13, CT-Lung-R4, MR-Neuro and MR-Breast images, the proposed CNN-LMCDP method has exhibited BPP results with a minimum average BPP of 0.7.
Figure 14 explains the result of the proposed method compared to the standard methods such as SPIHT and JPEG 2000 and with the existing methods like BANLC, EECF, CNN-RIGED and CNN-GAP. From the results, it is revealed that the BPP result for the proposed CNN-LMCDP method of 8- bit image samples outperform other methods. The BPP result achieved by the proposed LMCDP technique is 0.50 whereas the BPP results excels by the other methods such as SPIHT, JPEG 2000, BANLC, EECF, CNN-RIGED and CNN-GAP with 1.43, 1.81, 1.21, 0.77, 0.57 and 0.61 respectively.
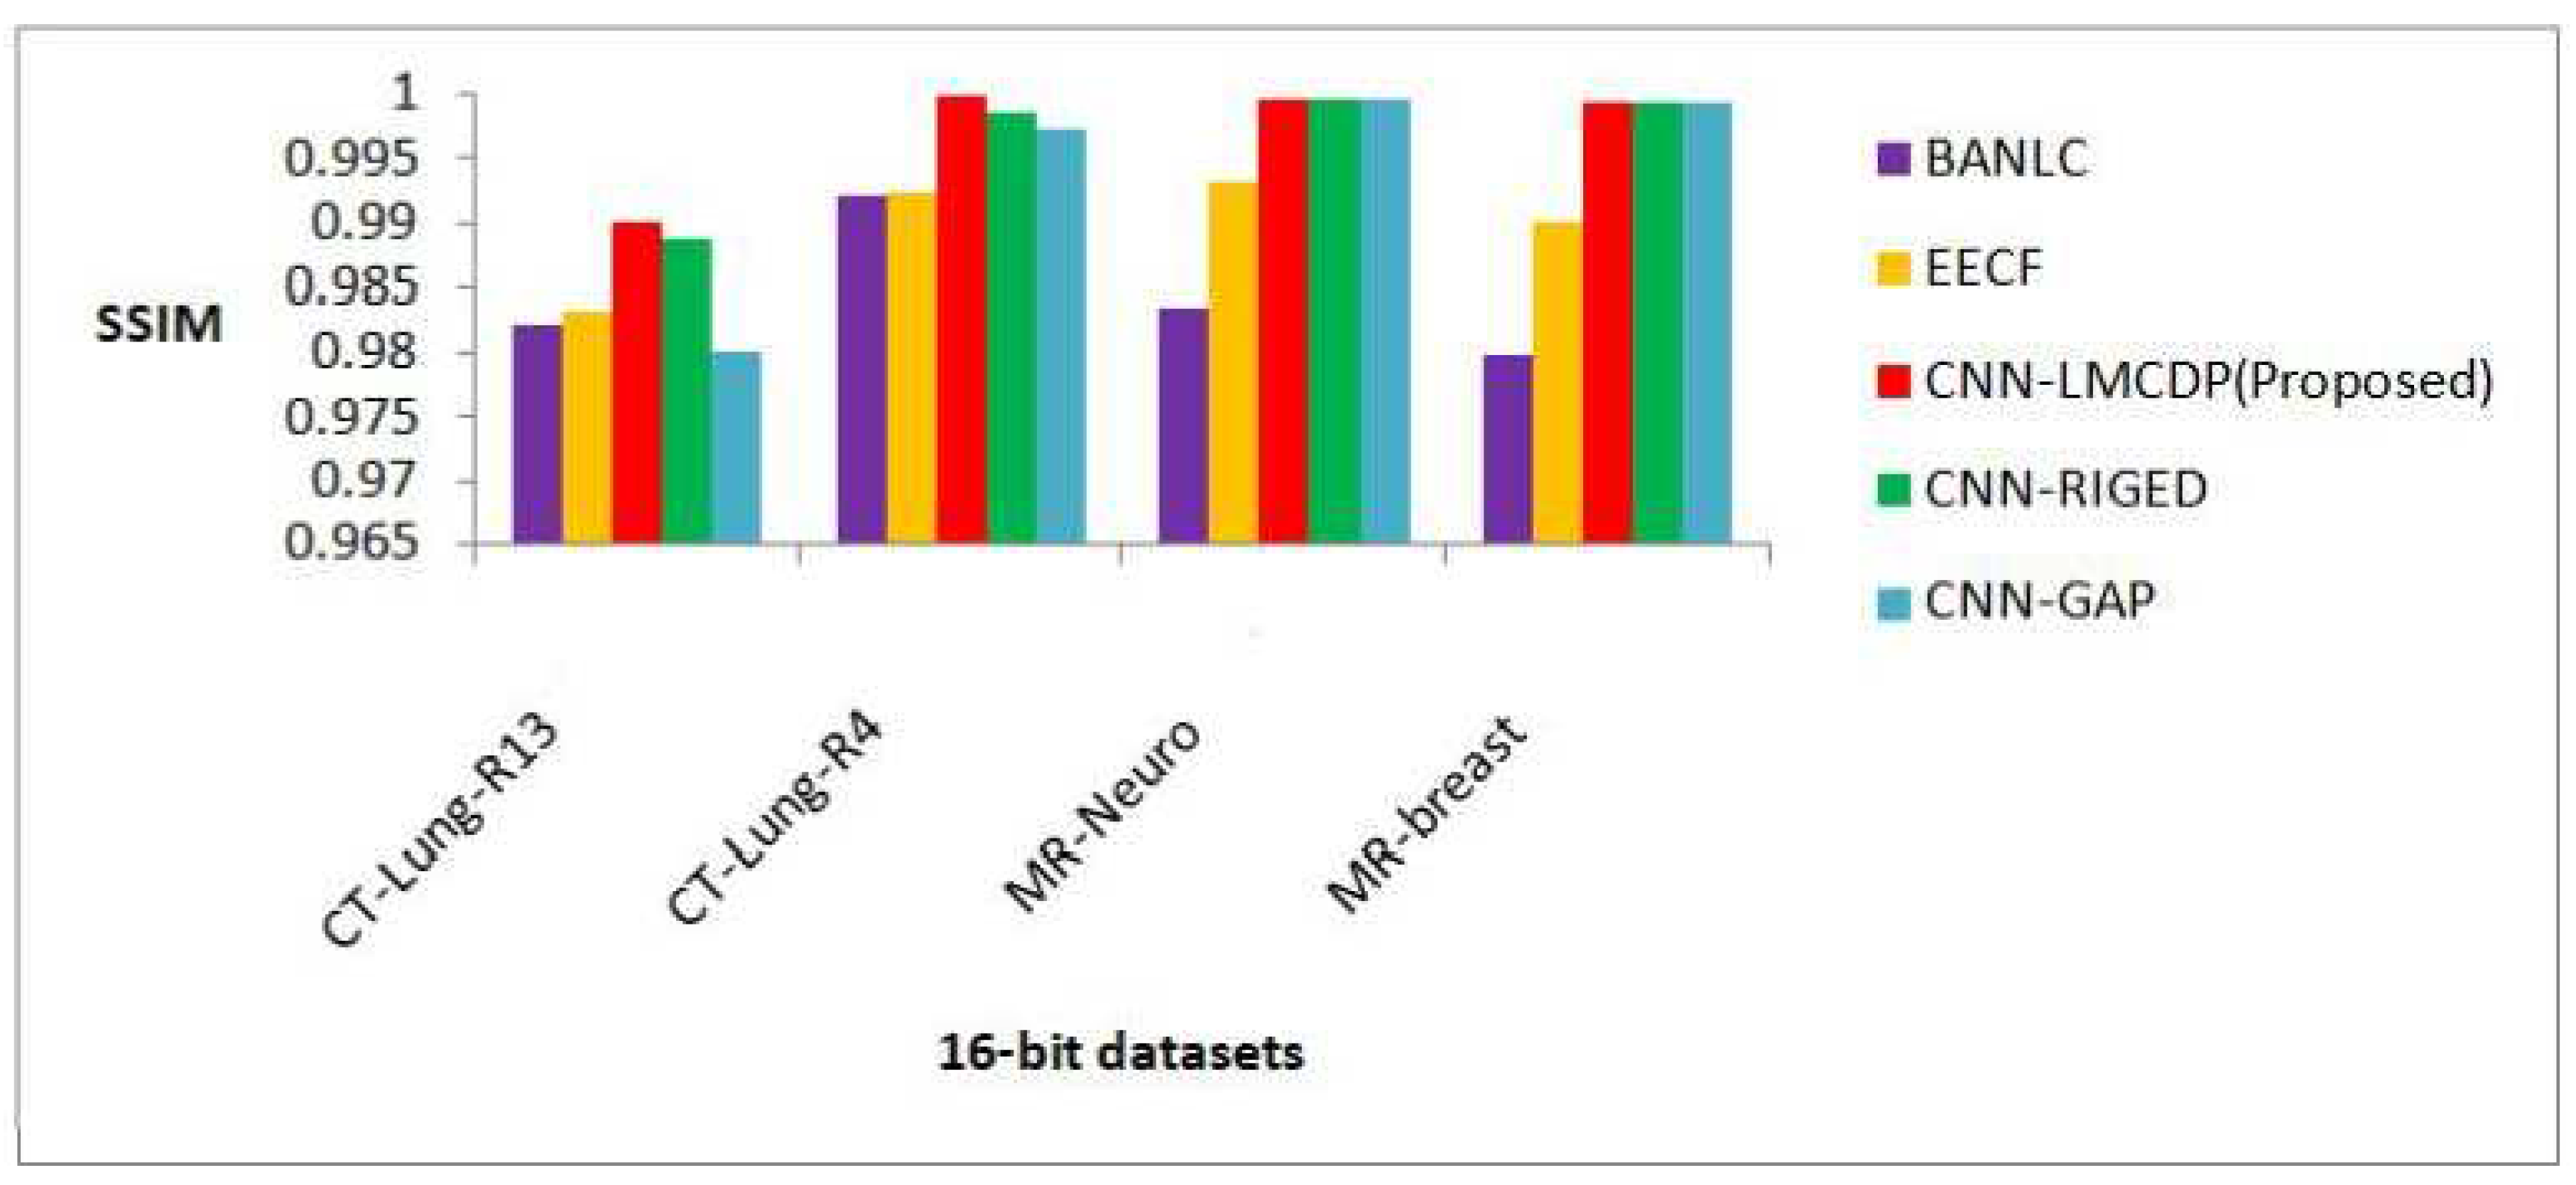
From Figure 15, it is revealed that the proposed CNN-LMCDP method has achieved the maximum average SSIM of 0.997 compared with other existing works for 16 bit test samples for different datasets such as CT- Lung R13, CT-Lung-R4, MR-Neuro and MR-breast images. For all the other methods, the test images have achieved an average SSIM of 0.984, 0.990, 0.996 and 0.990 for BANLC, EECF, CNN-RIGED and CNN-GAP respectively.
Figure 10. 5 Comparison of proposed method in terms of SSIM for 16 bit images over other compression techniques
Preprints 81405 g010
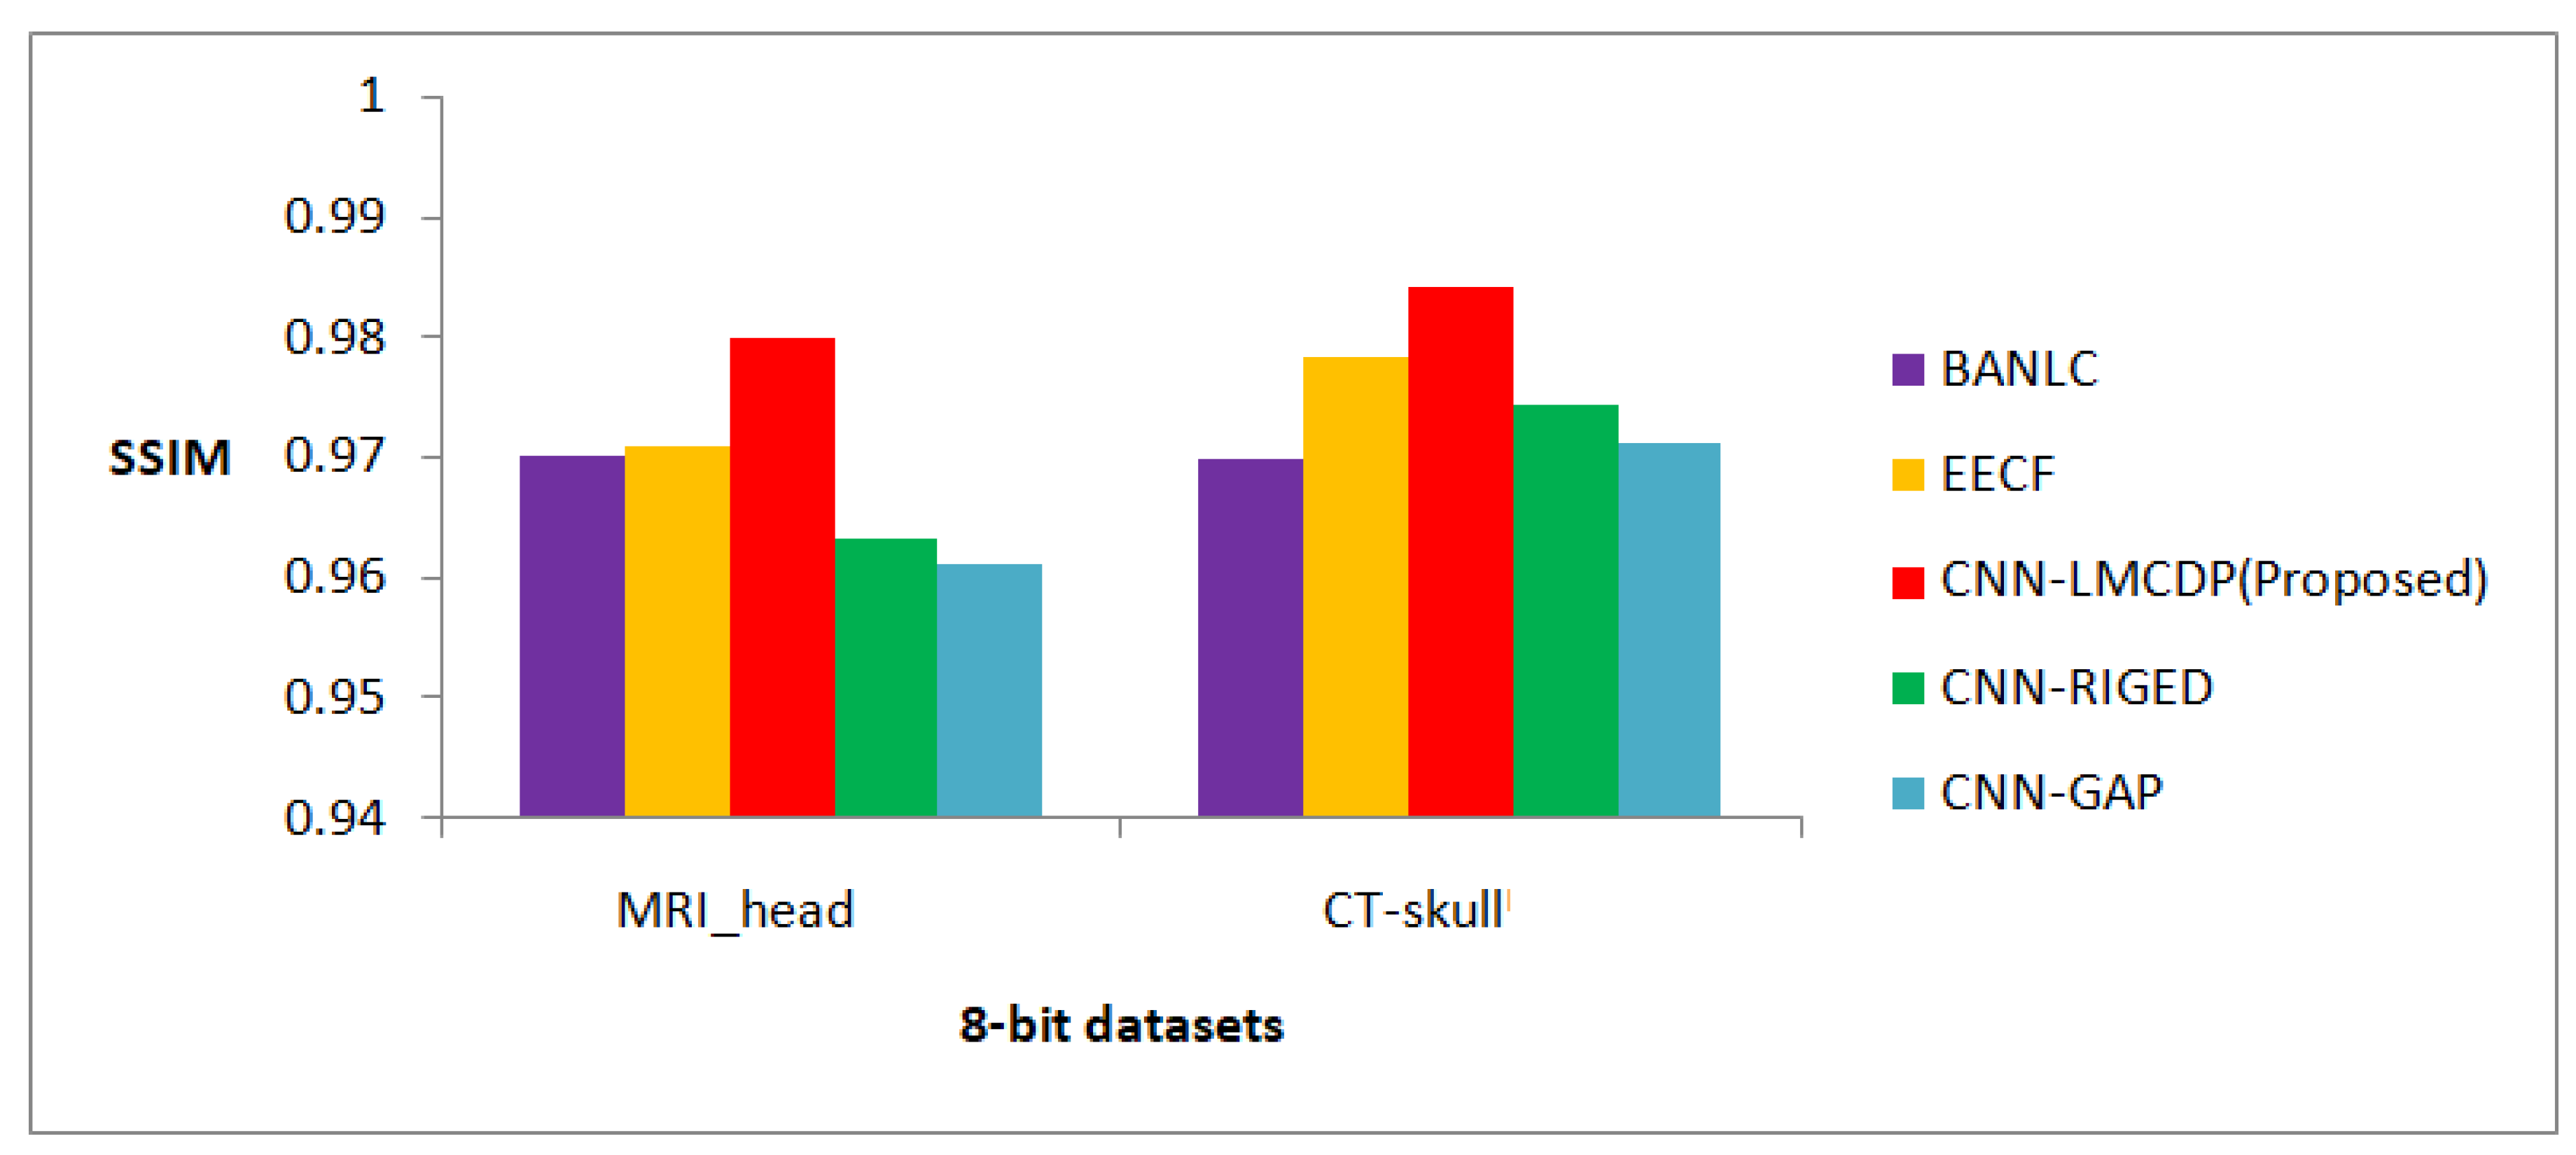
Figure 11. Comparison of proposed method in terms of SSIM for 8 bit images over other compression techniques
Preprints 81405 g011
From Figure 13, it is obvious that for 8 bit dataset images such as MRI-head and CT-skull, the proposed CNN-LMCDP method has exhibited best result with an average SSIM of 0.982. For all the other methods, the test images have achieved an average SSIM of 0.970, 0.974, 0.968 and 0.966 for BANLC, EECF, CNN-RIGED and CNN-GAP respectively
Table 11. Comparison of SC values for the proposed method over other existing compression techniques for various datasets
DATASETS BANLC EECF CNN- RIGED CNN- GAP CNN-LMCDP (Proposed)
CT-Lung-R13 0.9935 1.0067 0.98793 0.9744 1.0023
CT-Lung-R4 0.9895 0.9895 1.0043 0.98054 0.9998
MR-Neuro 0.9997 0.9977 0.9922 0.9893 1.0045
MR-breast 0.9933 0.9905 0.9605 0.9751 0.9832
MRI_head 0.9531 0.9653 0.9622 0.9608 0.9727
CT-skull 0.9503 0.961 0.9711 0.963 0.9766
explains the SC value for the proposed work which is compared with the existing approaches such as BANLC, EECF, CNN-RIGED and CNN-GAP for different datasets such as CT-Lung R13, CT-Lung-R4, MR-Neuro, MR-Breast, MRI_ head and CT-skull images.
Table 12. Comparison of NAE values for the proposed method over other existing compression techniques for various datasets
DATASETS BANLC EECF CNN- RIGED CNN- GAP CNN- LMCDP (Proposed)
CT-Lung-R13 0.000617 0.000617 0.000617 0.000617 0.000617
CT-Lung-R4 0.000619 0.000619 0.000619 0.000619 0.000619
MR-Neuro 0.000941 0.000941 0.000937 0.000937 0.000937
MR-breast 0.000628 0.000627 0.000627 0.000627 0.000626
MRI_head 0.001050 0.001050 0.001042 0.001042 0.001049
CT-skull 0.001044 0.001040 0.001040 0.001040 0.001038
The SC value for the proposed scheme for different datasets such as CT-Lung R13, CT-Lung-R4, MR-Neuro, MR-Breast and MRI_ head and CT- skull reported are 1.0023, 0.9998, 1.0045, 0.9832, 0.9727 and 0.97666 respectively. The SC value nearer to 1 indicates that the reconstructed image is of high quality and it is achieved by all the datasets and it is also superior compared to other methods.explains the NAE value for the proposed work and is compared with the existing approaches such as BANLC, EECF, CNN-RIGED and CNN-GAP. The NAE value for the proposed scheme for different datasets such as CT-Lung-R13, CT-Lung-R4, MR-Neuro, MR-Breast, MRI_head and CT-skull reported are 1.0023, 0.9998, 1.0045, 0.9832, 0.9727 and 0.97666 respectively.
Table 13. Comparison of NCC values for the proposed method over other existing compression techniques for various datasets
DATASETS BANLC EECF CNN- RIGED CNN-GAP CNN- LMCDP (Proposed)
CT-Lung-R13 0.98001 0.9889 0.9812 0.9799 0.9901
CT-Lung-R4 0.9722 0.9844 0.98762 0.9712 0.9922
MR-Neuro 0.9844 0.9965 0.9901 0.9799 0.9955
MR-breast 0.9744 0.9803 0.9688 0.9611 0.9813
MRI_head 0.9512 0.9533 0.9677 0.9711 0.9733
CT-skull 0.9512 0.9599 0.9612 0.9599 0.9798
illustrates the NCC value for the proposed work and is compared with the existing approaches such as BANLC, EECF, CNN-RIGED and CNN-GAP for different datasets such as CT-Lung R13, CT-Lung-R4,
MR-Neuro, MR-Breast, MRI_ head and CT-skull images. The NK value for the proposed scheme for different datasets such as CT-Lung R13, CT-Lung- R4, MR-Neuro and MR-Breast reported are 1.0023, 0.9998, 1.0045, 0.9832,
Table 14. Comparison of LMSE values for the proposed method over other existing compression techniques for various datasets
DATASETS BANLC EECF CNN- RIGED CNN- GAP CNN- LMCDP (Proposed)
CT-Lung-R13 0.001235 0.00124 0.00122 0.00121 0.00121
CT-Lung-R4 0.001216 0.00122 0.0012 0.0012 0.00121
MR-Neuro 0.001321 0.00132 0.00131 0.00131 0.00131
MR-breast 0.001224 0.00119 0.00118 0.00118 0.00115
MRI_head 0.001578 0.00152 0.00152 0.00153 0.00150
CT-skull 0.001512 0.001498 0.001465 0.001467 0.001436
The LMSE value for the proposed work is compared with the existing approaches such as BANLC, EECF, CNN-RIGED and CNN-GAP with different datasets such as CT-Lung R13, CT-Lung-R4, MR-Neuro, MR- Breast, MRI_ head and CT-skull images which are shown in Table 4.6. The LMSE value for the proposed scheme for different datasets such as CT-Lung R13, CT-Lung-R4, MR-Neuro and MR-Breast reported are 1.0023, 0.9998, 1.0045, 0.9832, 0.9727 and 0.97666, respectively. For most of the data sets, the encoding time for RLE and AE is less when compared to the proposed work.
Table 15. Comparison of MSE values for the proposed method over other existing compression techniques for various datasets
DATASETS BANLC EECF CNN- RIGED CNN- GAP CNN- LMCDP (Proposed)
CT-Lung-R13 0.04605 0.04613 0.04601 0.04602 0.04501
CT-Lung-R4 0.04512 0.04527 0.0453 0.0453 0.04513
MR-Neuro 0.04645 0.04622 0.04548 0.04548 0.04548
MR-breast 0.04683 0.04624 0.04378 0.04376 0.04591
MRI_head 0.05619 0.05366 0.0552 0.05592 0.05356
CT-skull 0.05326 0.05144 0.50394 0.05322 0.5034
The MSE value for the proposed work is compared with the existing approaches such as BANLC, EECF, CNN-RIGED and CNN-GAP with different datasets such as CT-Lung R13, CT-Lung-R4, MR-Neuro, MR- Breast, MRI_ head and CT-skull images which are shown in Table 4.7.
Table 16. Comparison of PSNR values for the proposed method over other existing compression techniques for various datasets
DATASETS BANLC EECF CNN- RIGED CNN- GAP CNN-LMCDP (Proposed)
CT-Lung-R13 66.35 65.42 66.64 65.87 67.35
CT-Lung-R4 67.30 67.02 67.60 66.81 68.32
MR-Neuro 64.46 65.16 63.74 63.99 65.43
MR-Breast 63.94 63.05 64.22 63.98 64.91
MRI_head 43.61 46.88 44.86 45.32 46.09
CT-skull 46.01 50.44 52.00 50.56 52.06
The MSE value for the proposed scheme for different datasets such as CT-Lung R13, CT-Lung-R4, MR-Neuro and MR-Breast reported are 1.0023, 0.9998, 1.0045, 0.9832, 0.9727 and 0.97666, respectively. The MSEvalue nearer to 1 indicates that the reconstructed image is of high quality and it is achieved by all the datasets for the proposed work. reports the PSNR value for the proposed work in comparison with the existing approaches such as BANLC, EECF, CNN- RIGED and CNN-GAP. The PSNR values of the proposed scheme for different datasets such as CT-Lung R13, CT-Lung-R4, MR-Neuro, MR- Breast, MRI_ head and CT-skull images reported are 67.35, 68.32, 65.43, 64.91, 46.09 and 52.06 respectively. The PSNR value is improved by 1%,2%,1%, and 2% for CT-Lung R13 and improved by 1%, 1%,1%, and 2% for CT-Lung R4 dataset.
Table 17. Comparison of CR values for the proposed method over other existing encoding techniques of various datasets
DATASETS BANLC EECF CNN- RIGED CNN- GAP CNN- LMCDP (Proposed)
CT-Lung-R13 3.64 7.89 10.00 9.59 10.06
CT-Lung-R4 2.69 5.88 8.61 7.92 8.79
MR-Neuro 3.27 6.20 8.67 7.98 9.58
MR-breast 2.59 8.60 11.68 11.19 12.46
MRI_head 5.71 10.25 13.61 12.58 15.97
CT-skull 7.79 10.49 14.39 13.27 15.53
Similarly, the PSNR value is improved by 1%, 0.27%, 2% and 2% for MR-Neuro and is improved by 1%, 1%, 0.69% and 2% for MR-Breas dataset. And also, the PSNR value is improved by 3%, 0.79%, 2% and 1% for MR-head and improved by 6%, 2%, 0.06% and 2% for CT-skull dataset. The high PSNR value indicates that the reconstructed image is of high quality and it is achieved for all the datasets.discusses the CR value for the proposed work and is compared with the existing approaches suchas BANLC, EECF, CNN-RIGED and CNN-GAP. The CR value of the proposed scheme is superior for different datasets such as CT-Lung R13, CT-Lung-R4, MR-Neuro, MR- Breast, MRI_ head and CT-skull and the results reported are 10.06, 8.79, 9.58, 12.46, 15.97 and 15.53 respectively.
Table 18. Comparison of BPP values for the proposed method over other existing compression techniques for various datasets
DATASETS BANLC EECF CNN-RIGED CNN-GAP CNN-LMCDP (Proposed)
CT-Lung-R13 2.193 1.01 0.7999 0.83 0.795
CT-Lung-R4 2.967 1.36 0.929 1.01 0.91
MR-Neuro 2.445 1.29 0.923 1.0031 0.835
MR-breast 3.082 0.93 0.685 0.715 0.642
MRI_head 1.4 0.78 0.588 0.636 0.501
CT-skull 1.026 0.762 0.556 0.603 0.515
0 explains the BPP value for the proposed work in comparison with the existing approaches such as BANLC, EECF, CNN- RIGED and CNN-GAP. The BPP value reported for the proposed scheme for different datasets such as CT-Lung R13, CT-Lung-R4, MR-Neuro, MR- Breast, MRI_ head and CT-skull are 0.795, 0.91, 0.835, 0.642, 0.501 and
4.3. COMPARATIVE ANALYSIS OF EXISTING WORKS OVER THE PROPOSED WORK

From Table 19, it is obvious that the CR (%) of the proposed work is better for MRI dataset when evaluated with the previous techniques. This is because of the subsequent processing of deep learning technique followed by CNN-LMCDP prediction and arithmetic encoding. During each stage of processing, convergence has occurred which paves the way for efficient compression. The rest of the works are weaker than the proposed method in terms of Compression Ratio.
Table 19. Comparison of proposed work with the existing approaches
Author Year Dataset Used CR (Compression Ratio) in Bits Technique used
 [6] 2018 MRI CR=4.5 Enhanced Zero Tree Wavelet
 [11] 2020 CR=3.70 Inter-slice correlation switched predictor
 [12] 2022 CR=2.94 Tetrolet transform
Proposed(CNN-LMCDP) - CR=15.9 CNN-LMCDP Predictor
To assess the proposed method in a thorough manner, CR of Table 20 is analyzed with existing methods and the results are shown.The performance of the proposed work in terms of CR is high because of the implementation of three stage compression process. Deep Learning based convolutional neural network provides convergence on theimage thereby aids in better compression. Local Maximal Contiguous Directional Predictor (LMCDP) employed in the second step removes the inter pixel redundancies after convolving with neural network. Finally, the arithmetic encoding is applied which considers the entire sequence as a single stream of bits for achieving efficient storage.
Table 20. Comparison of CR for the proposed work with the existing methods for CIPR dataset [26]
TECHNIQUES USED CR PSNR BPP SS (%)
BP Coder [13] 4.21 36.3 1.9 76.247031
SPIHT+AC [14] 11.42 38.1 0.7 91.243433
DPCM [15] 5.71 38.3 1.4 82.486865
JPEG-LS+WAT [16] 3.47 38.5 2.3 71.181556
EC [17] 26.66 38.8 0.3 96.249062
SPIHT [18] 6.66 40.1 1.2 84.984985
Spatial Prediction [19] 4.21 47.3 1.9 76.247031
RIGED [20] 6.15 51.3 1.3 83.739837
Proposed(CNN-LMCDP) 15.75 52.06 0.515 93.650794

5. Conclusion

This research work proposes a novel CNN-LMCDP using a near lossless medical image compression. The proposed work is tested with 8 bitand 16 bit medical images. The prediction efficiency is compared with various datasets such as CT-Lung R13, CT-Lung R4, MR-Neuro, MR-Breast, MRI_ head and CT-skull images. The compression performance of the proposed CNN-LMCDP technique is compared with the existing approaches such as BANLC, EECF, CNN-RIGED and CNN-GAP. The proposed method achieves superior results for compression ratio with high reconstruction quality.

References

  1. Lalitha, Y.S.; Latte, M.V. Image Compression of MRI Image using Planar Coding. Int. J. Adv. Comput. Sci. Appl. 2011, 2. [Google Scholar] [CrossRef]
  2. A Region-based Compression Technique for Medical Image Compression using Principal Component Analysis (PCA). Int. J. Adv. Comput. Sci. Appl. 2022, 13. [CrossRef]
  3. Ashok, D.T.; Bhaskarareddy. Image Compression Techniques Using Modified high quality Multi wavelets. Int. J. Adv. Comput. Sci. Appl. 2011, 2. [Google Scholar] [CrossRef]
  4. Chakib, H.; Minaoui, B.; Fakir, M.; Salhi, A.; Badi, I. A Proposed Approach for Image Compression based on Wavelet Transform and Neural Network. Int. J. Adv. Comput. Sci. Appl. 2017, 8. [Google Scholar] [CrossRef]
  5. Bandyopadhyay, T.S.K.; Paul, U.; Raychoudhury, A. Image Compression using Approximate Matching and Run Length. Int. J. Adv. Comput. Sci. Appl. 2011, 2. [Google Scholar] [CrossRef]
  6. Sunil, H.; Hiremath, S.G. A combined scheme of pixel and block level splitting for medical image compression and reconstruction. Alex. Eng. J. 2018, 57, 767–772. [Google Scholar] [CrossRef]
  7. Eman, A.; Al-Hilo, R.; Zehwar. Comparison Fractal Color Image Compression using YIQ and YUV Color Model. Int. J. Adv. Comput. Sci. Appl. 2015, 6. [Google Scholar] [CrossRef]
  8. Wen, H.; Shah, F.; Li, J.; Memon, R.A.; Shah, F. X-Ray image reliability using biorthogonal wavelet compression for medical big data. In Proceedings of the 13th International Computer Conference on Wavelet Active Media Technology and Information Processing, Chengdu, China, 16–18 December 2016; pp. 256–259. [Google Scholar]
  9. Sun, D.; Cham, W.K. Postprocessing of low bit-rate block DCT coded images based on a fields of experts prior. IEEE Trans. Image Process. 2007, 16, 2743–2751. [Google Scholar] [PubMed]
  10. Constrained non-convex low-rank model for image deblocking. IEEE Trans. Image Process 2016, 25, 15751914. [CrossRef]
  11. Zhang, K.; Zuo, W.; Chen, Y.; Meng, D.; Zhang, L. Beyond a gaussian denoiser: Residual learning of deep cnn for image denoising. IEEE Trans. Image Process. 2020, 26, 3142–3155. [Google Scholar] [CrossRef] [PubMed]
  12. Ye, Z. ; &auner, G. In Principalcomponent analysis approach for biomedical sample identification. In Proceedings of the 2004 IEEE International Conference on Systems, Man and Cybernetics, The Hague, The Netherlands, 10–13 October 2004; pp. 1348–1353. [Google Scholar]
  13. Xu, Z.; Bartrina-Rapesta, J.; Sanchez, V.; Serra-Sagrista, J. ; &munoz Gómez, J. In Diagnostically lossless compression of X-ray angiography images based on automatic segmentation using ray- -shapes. In Proceedings of the 2013 IEEE International Conference on Image Processing, Bordeaux, France, 16–19 Octorber 2022; pp. 738–742. [Google Scholar]
  14. Vlahakis, V. ; &kitney, R. I. Wavelet-based, inhomogeneous, near-lossless compression of ultrasound images of the heart. In Proceedings of the Computers in Cardiology, Lund, Sweden, 7–10 September 1997; pp. 549–552. [Google Scholar] [CrossRef]
  15. Zhang, X.; Xiong, R.; Fan, X.; Ma, S.; Gao, W. Compression artefact reduction by overlapped-block transform coefficient estimation with block similarity. IEEE Trans. Image Process. 2023, 22, 4613–462. [Google Scholar] [CrossRef] [PubMed]
  16. Thung, K.H.; Ng, S.C.; Lim, C.L.; Raveendran, P. A preliminary study of compression efficiency and noise robustness of orthogonal moments on medical X- ray images. In 5th Kuala Lumpur International Conference on Biomedical Engineering; Springer: Berlin/Heidelberg, Germany, 2011; pp. 587–590. [Google Scholar]
  17. Shapiro, J.M. , 1993.
  18. Hand region extraction and gesture recognition using entropy analysis. IJCSNS Int. J. Comput. Sci. Netw. Secur. 2006, 6, 216–222.
  19. Witten, I.H.; Neal, R.M.; Cleary, J.G. Arithmetic coding for data compression. Commun. ACM 1987, 30, 520–540. [Google Scholar] [CrossRef]
  20. Sharma, M. Compression using Huffman coding. IJCSNS Int. J. Comput. Sci. Netw. D 2010, 10, 133–141. [Google Scholar]
Figure 3. Causal Template along four orientations for 45, 90, 135 and 180 for pixel predictionEdge and Texture Feature Prediction using LMCDP Input: Compact Representation Image
Preprints 81405 g003
Disclaimer/Publisher’s Note: The statements, opinions and data contained in all publications are solely those of the individual author(s) and contributor(s) and not of MDPI and/or the editor(s). MDPI and/or the editor(s) disclaim responsibility for any injury to people or property resulting from any ideas, methods, instructions or products referred to in the content.
Copyright: This open access article is published under a Creative Commons CC BY 4.0 license, which permit the free download, distribution, and reuse, provided that the author and preprint are cited in any reuse.
Prerpints.org logo

Preprints.org is a free preprint server supported by MDPI in Basel, Switzerland.

Subscribe

© 2024 MDPI (Basel, Switzerland) unless otherwise stated