3.1. Scanning Electron Microscopy
Figure 1 and
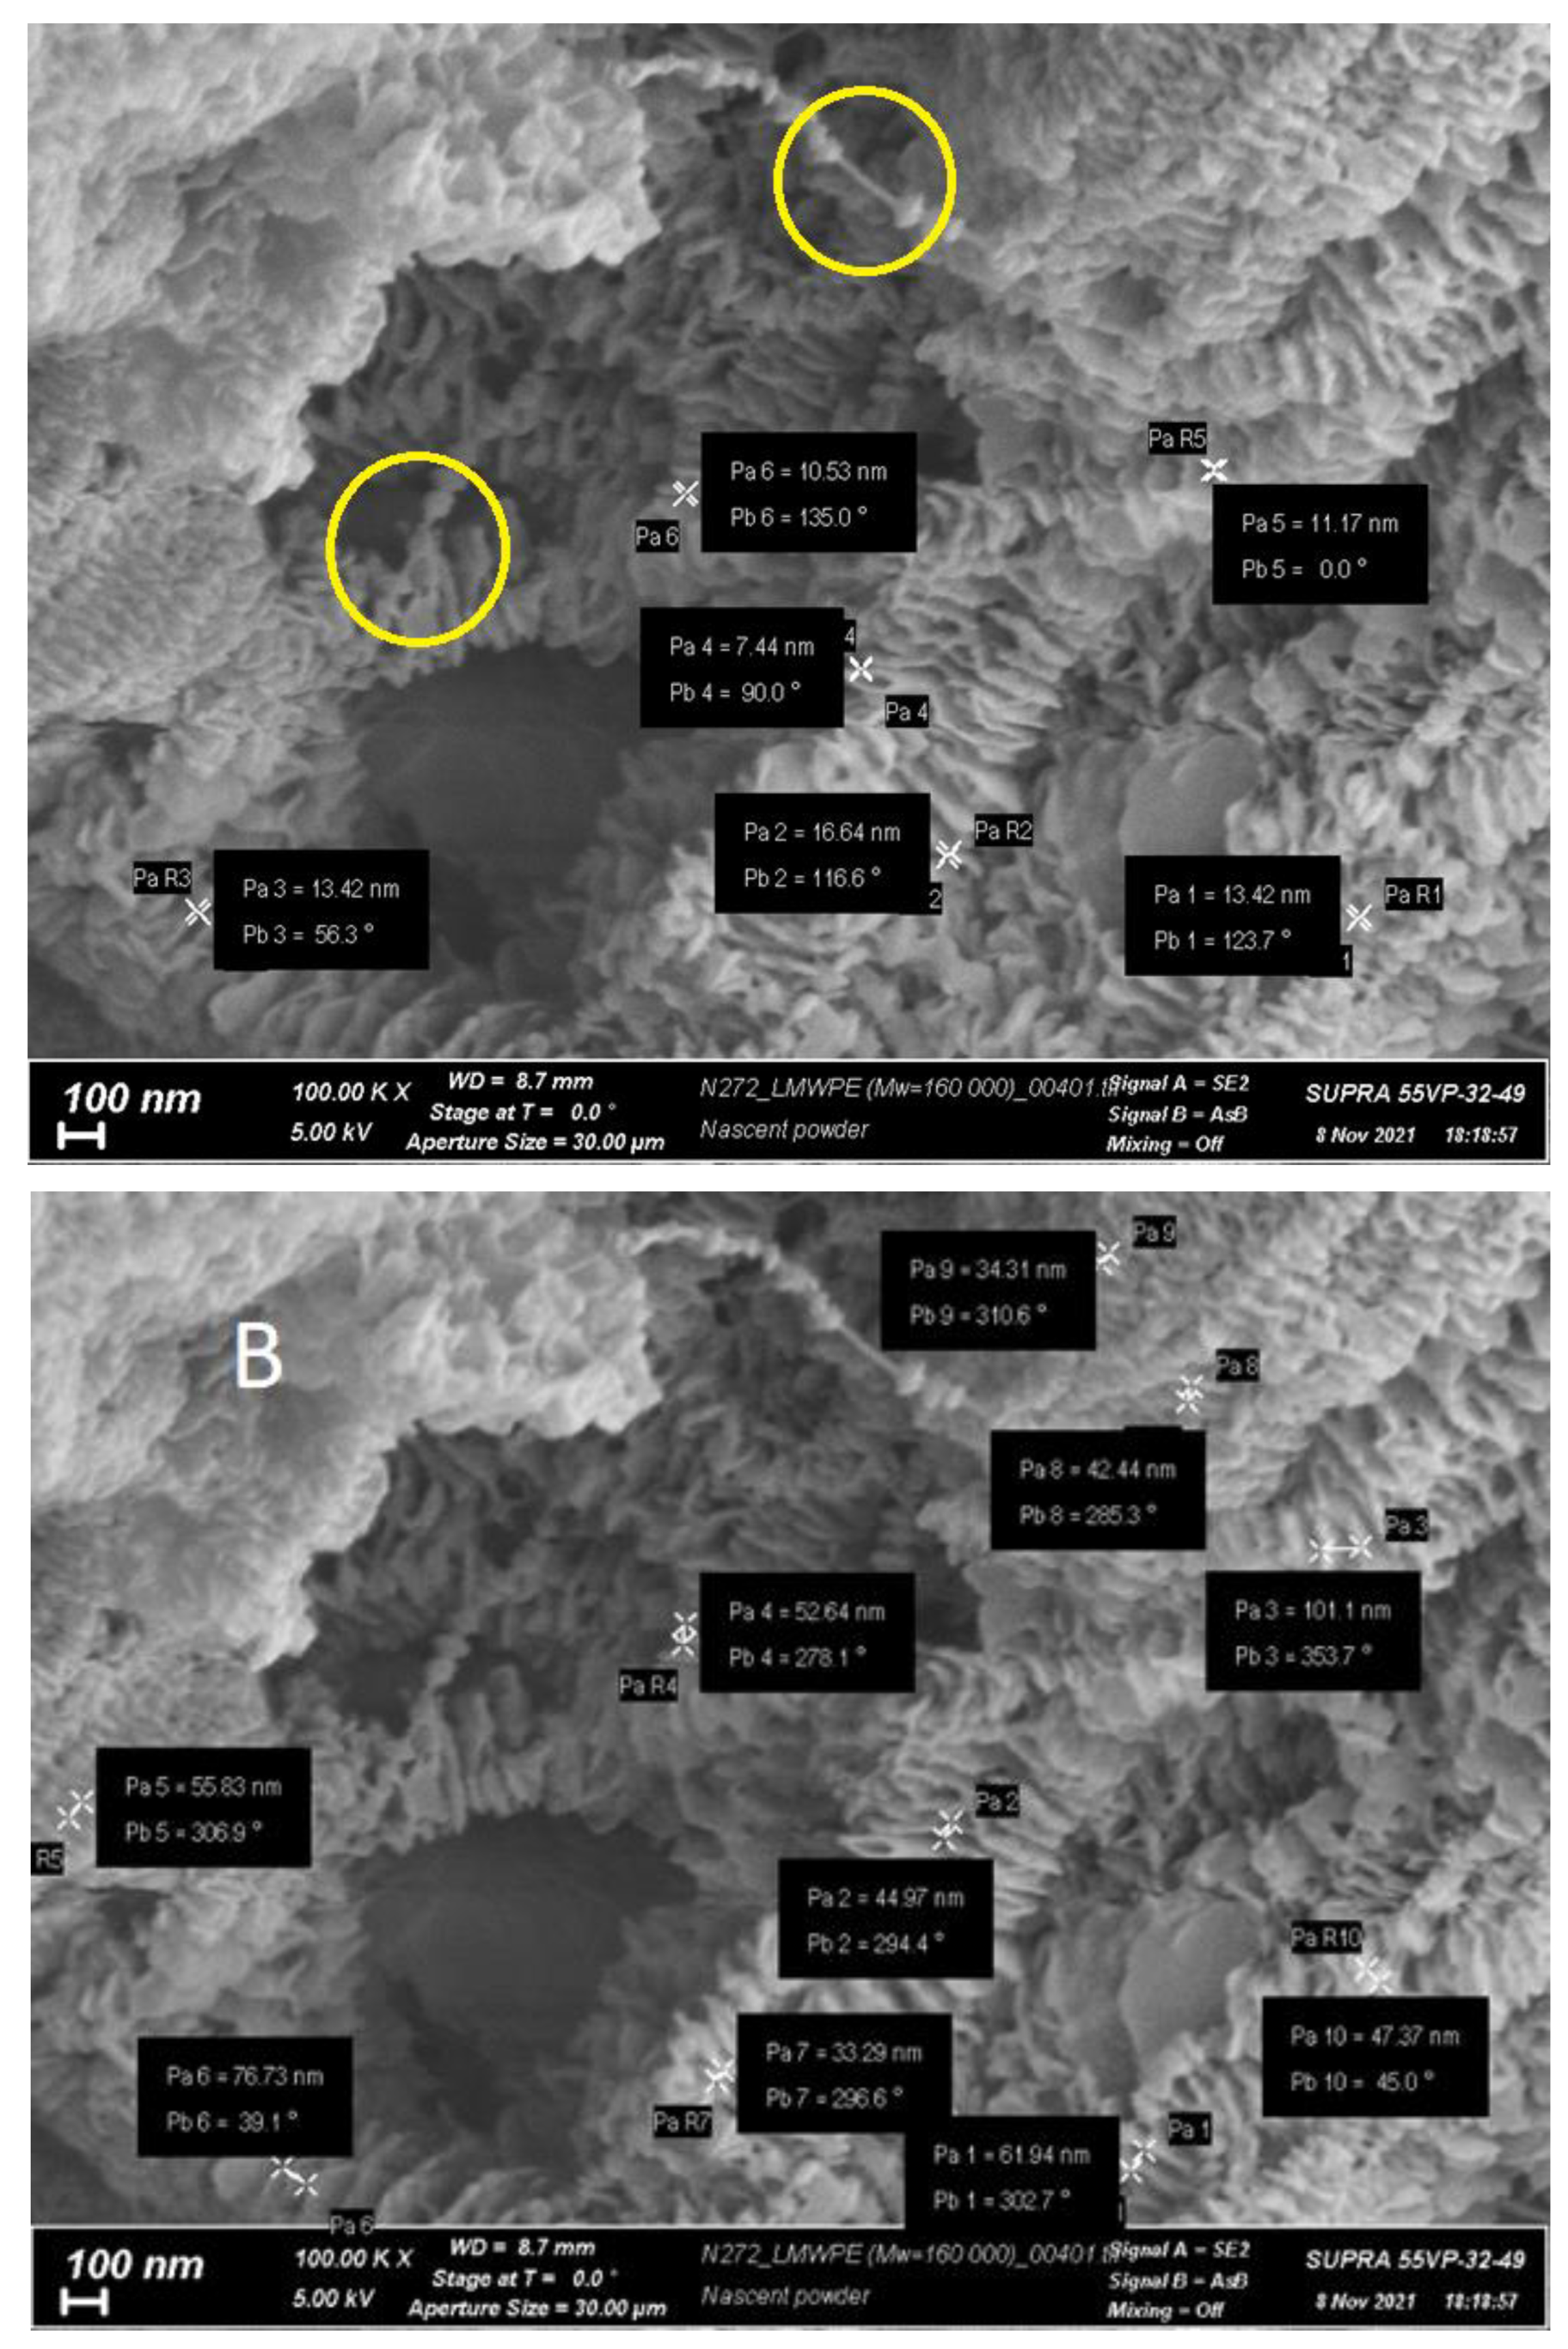
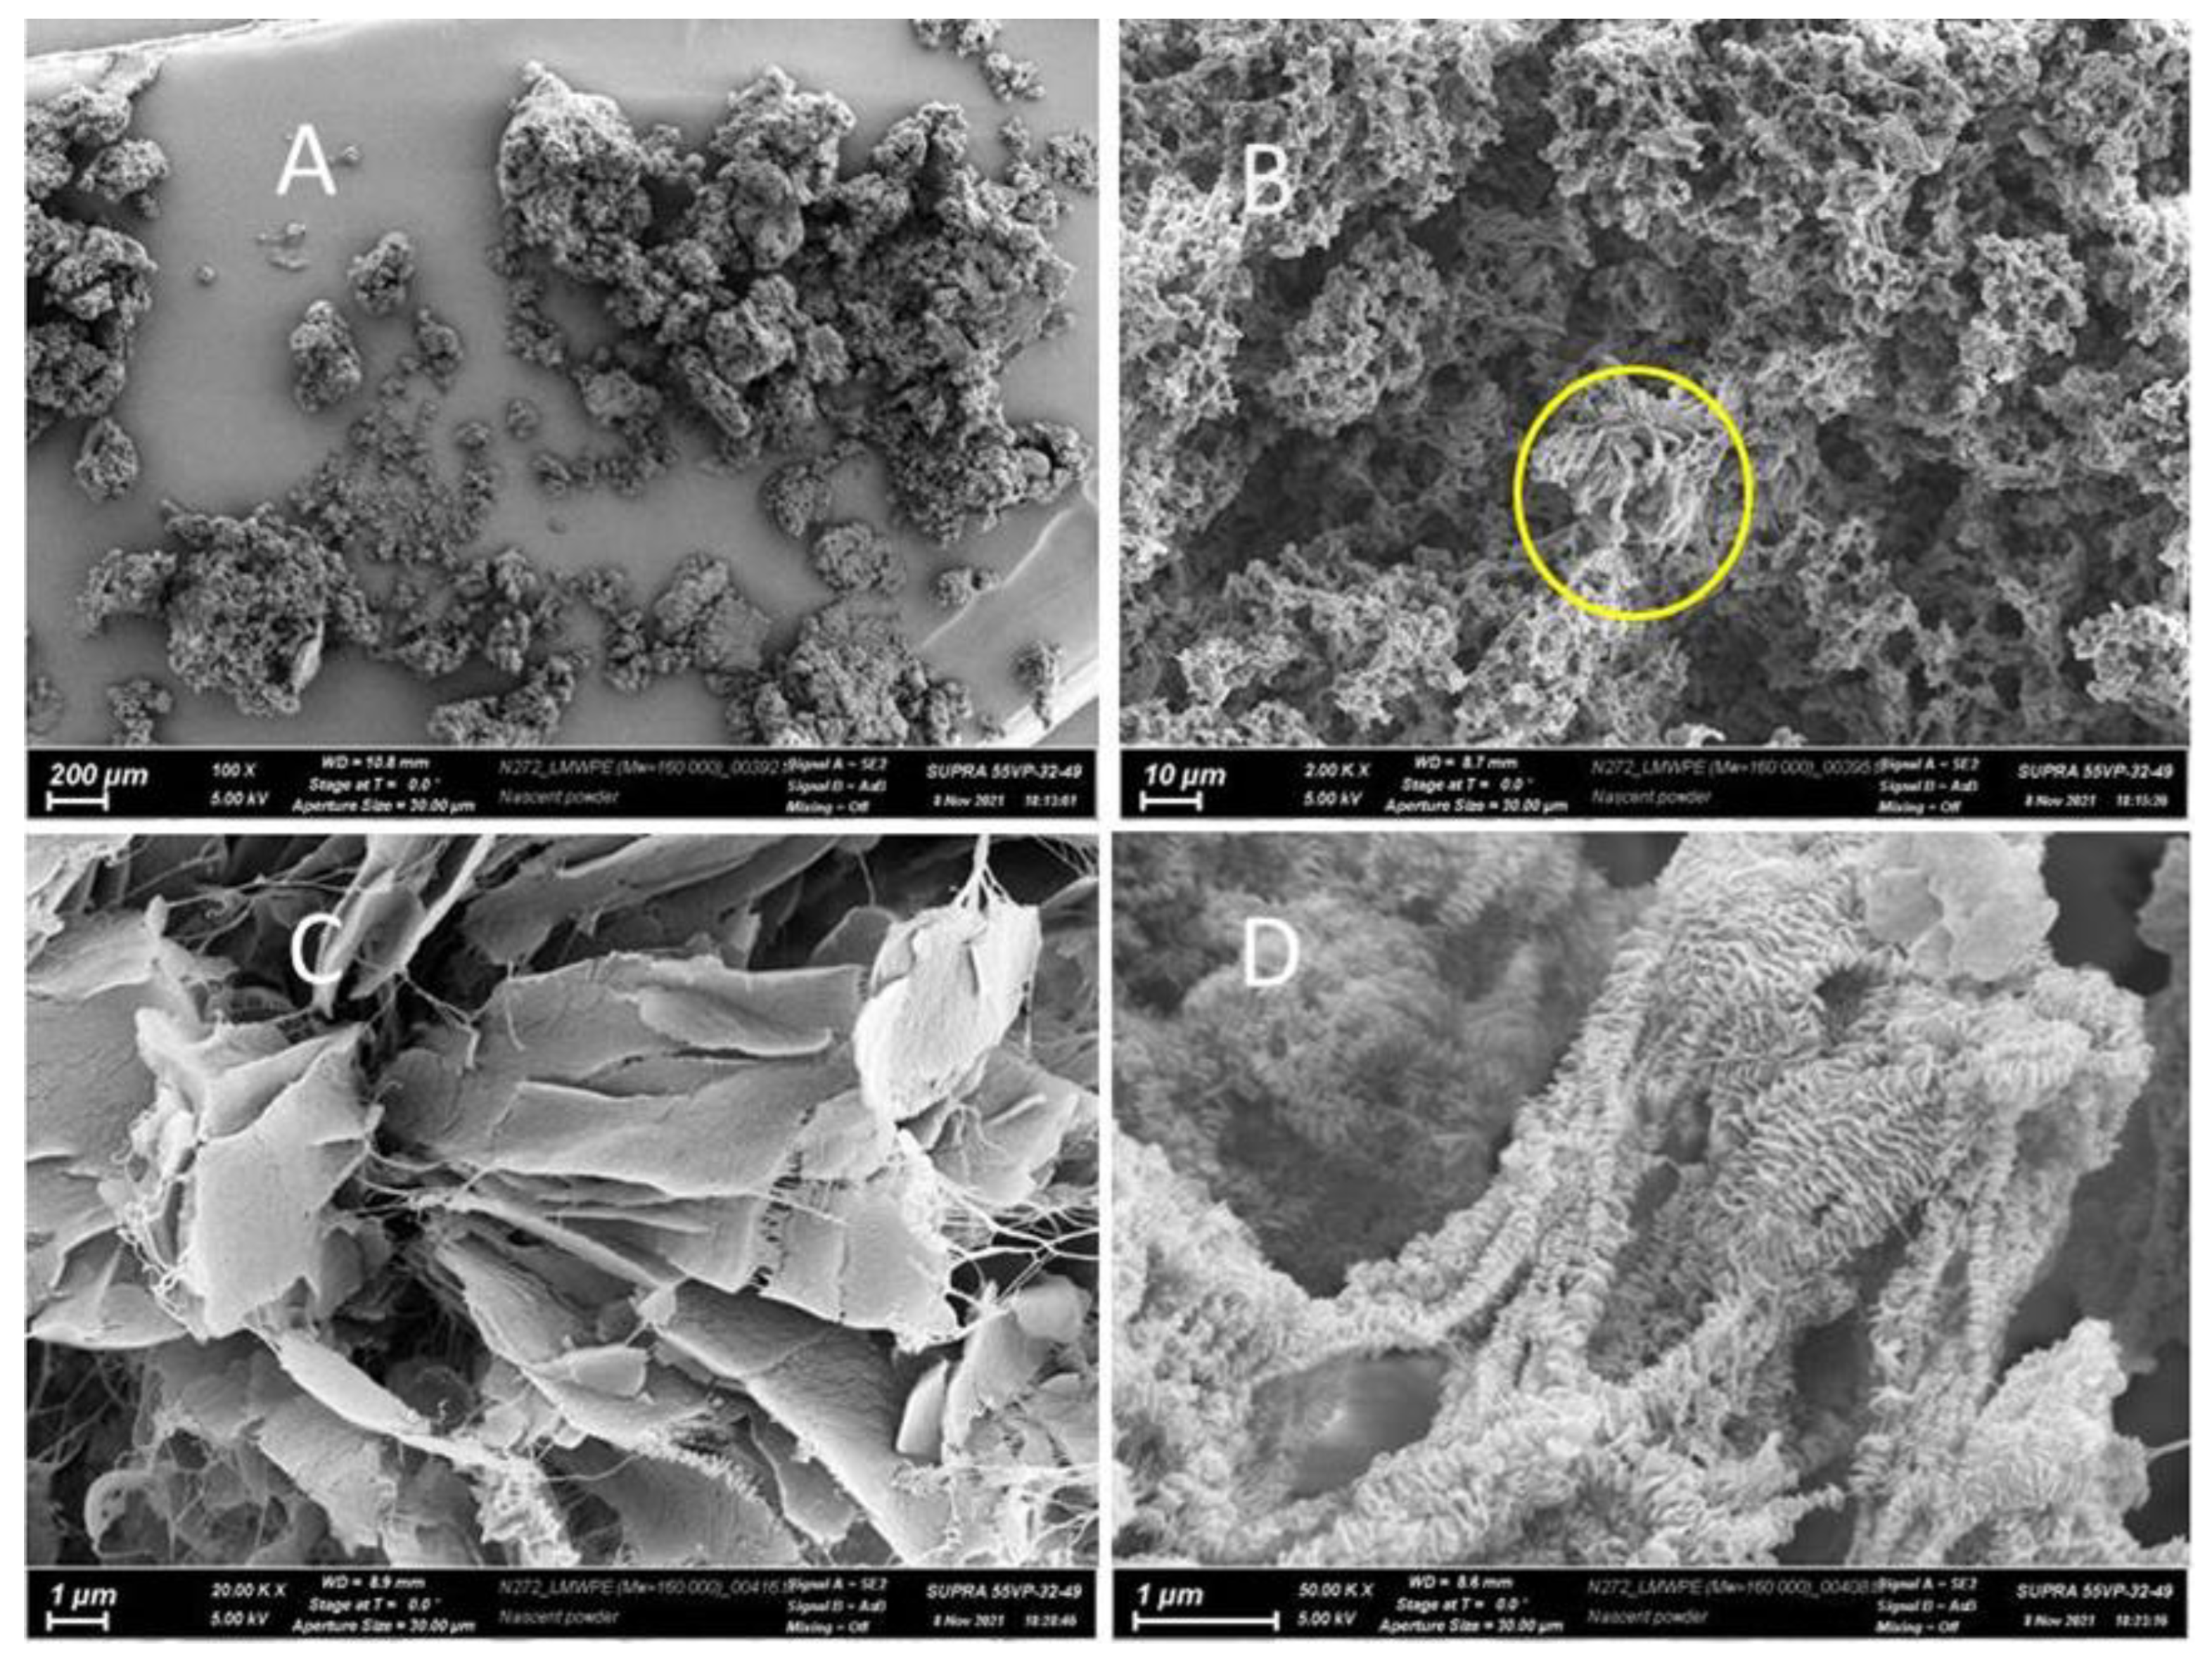
Figure 2 shows electron micrographs of the investigated reactor HDPE powder, taken at different magnifications.
It is quite clear from the given micrographs that in the particles of reactor powder various morphological structural units coexist, that is clearly visible at high magnifications. It is possible to distinguish a number of morphoses that are frequently encountered:
extended lamellar plates (
Figure 1C is the enlarged area marked with a circle in
Figure 1B). Since it can be seen in the selected area that the lamellae are deformed with the formation of fibrils, like classical single-crystal mats with simultaneous unfolding molecular folds at the transition boundary from lamella to fibrils, it can be assumed that they are formed by folded crystallites with regular folds;
the fibrils themselves, which are formed during the deformation of the lamellae under the action of tensile forces arising from the pressure of the polymer mass growing during the synthesis. The forces leading to the deformation of the lamellae do not arise from the very beginning of synthesis, but upon the accumulation of a certain mass of polymer at a certain stage of synthesis;
classic shish-kebab formations (
Figure 1D), which, as is known, consist of a central shish and lamellar kebabs of folded crystals crystallizing on it [
15];
it is important to note that the sizes of kebabs and the distance between them vary markedly. It is possible to distinguish at least three types of structures with transverse dimensions of about 200 nm, 100 nm and 50 nm (
Figure 2);
central shishas, clearly visible in
Figure 2A in yellow circles.
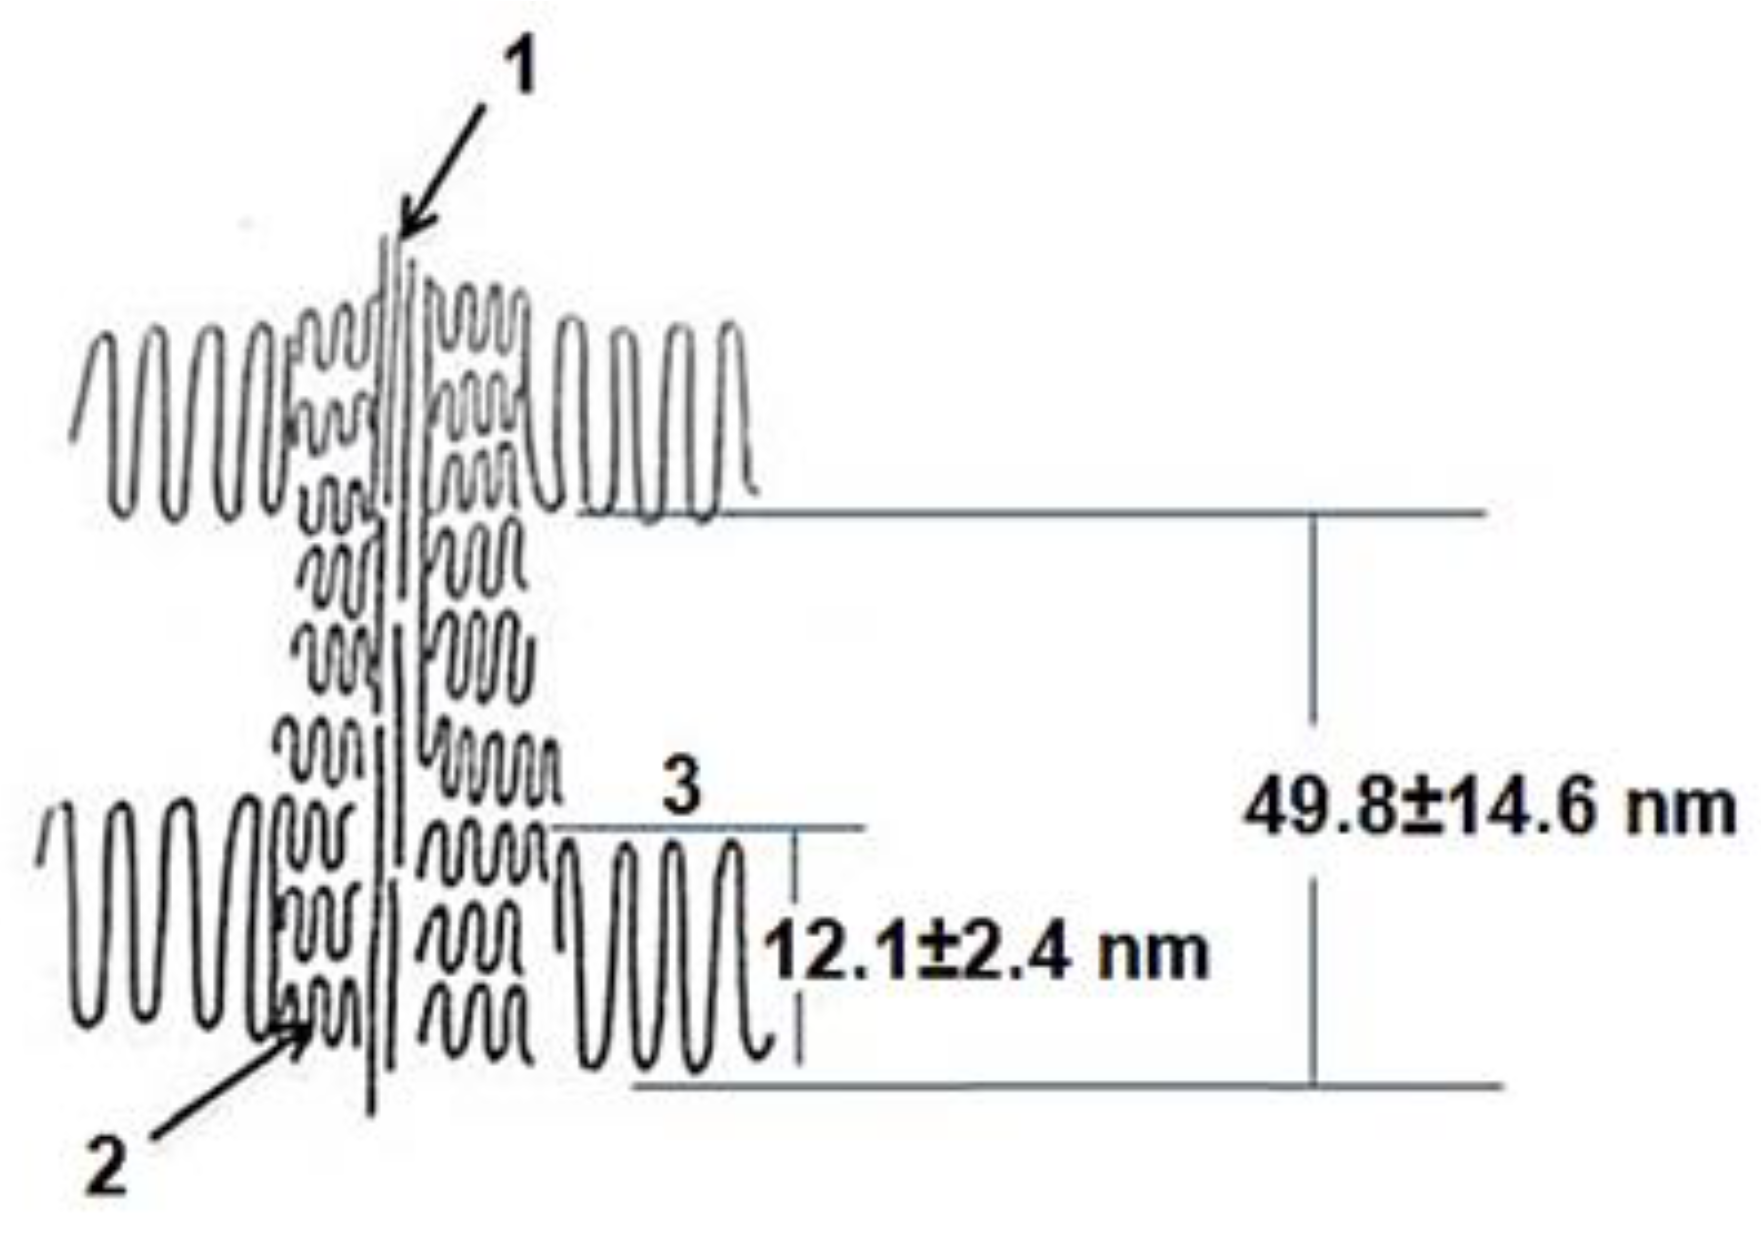
In addition, the central shish can have a complex structure and themself consists of a central thread formed by partially extended molecules (1), and micro-kebabs (2) growing on them (
Figure 3).
Figure 2.
Enlarged area where shish-kebab morphological units are observed. The results of measurements of the thickness of individual kebabs (A) and measurements of the periodicity in kebabs location on the central shishas (B) are shown.
Figure 2.
Enlarged area where shish-kebab morphological units are observed. The results of measurements of the thickness of individual kebabs (A) and measurements of the periodicity in kebabs location on the central shishas (B) are shown.
The latter are not visualized on scanning micrographs, but one can presumably speak of the possibility of their existence, since the micro-shish-kebab structure was previously observed when studying polyethylene crystallized from a stirred solution using high-resolution transmission electron microscopy [
15]. Note that the HDPE reactor powder we studied also crystallizes during suspension synthesis in a stirred solvent.
It is rather difficult to estimate the true percentage of the morphological units in the reactor powder using electron micrograph images. First, more statistics is needed. Second, the operators often pay more attention to the most expressive structural areas and can skip areas with less pronounced structure. Even if the operator is attentive to all possible structures, it is impossible to obtain reliable statistical results from SEM images, not to mention the fact that the ratio of different structures in the volume and on the surface of the polymer may differ. In addition, in determining the thickness of the lamellae, even in the images where the lamellae are oriented by sideways to the observer, there is a large uncertainty in the thickness of the platinum layer spattered to avoid charging of the sample.
We nevertheless took such measurements in order to compare them with small-angle X-ray data. The average thickness of lamellar macro-kebabs was 12.1 ± 2.4 nm, with their periodic arrangement along the central shish equal to 49.8 ± 14.6 nm. There is no polymer material between the macro-kebabs.
Figure 3.
Schematic representation of the central thread (1) with micro (2) and macro (3) shish-kebab structure.
Figure 3.
Schematic representation of the central thread (1) with micro (2) and macro (3) shish-kebab structure.
At the same time, scanning electron microscopy does not provide information on the distribution of crystalline and amorphous regions in morphological units. To quantify crystalline regions, disordered regions, and their location, it is necessary to involve such research methods as WAXS, SAXS and differential scanning calorimetry (DSC).
Often in the literature, a large period, determined from SAXS, is denoted by the letters L, the same as the thickness of the lamella (L), which sometimes leads to some confusion in understanding the data published. To clarify the experimental data obtained, we present below our model proposed earlier for lamellar structure [
16] consisting of the lamellae themselves and the disordered regions separating them, formed by the ends of the molecules, regular and irregular folds, as well as tie molecules of different degrees of conformation (
Figure 4).
LSAXS is the so-called long period (lcr+la+ 2linterphase), determined by SAXS; lcr (1) is the crystalline core size of the three-dimensional coherent scattering region in the direction of the chain (D002) determined by WAXS; linterphase (2) is the transition region between crystalline core and true amorphous region (la) consisting of a set of different conformers (irregular folds (3), strongly curved molecular molecules (4), ends of molecules (5), weakly curved molecular molecules (6), molecular folds connecting 2-3 molecules at the exit of the crystallite (7) and taut tie molecules (8); Llam is the thickness of the lamella (crystal core + two thicknesses of the more or less regular folded surface that melt simultaneously with the crystalline core). Obviously, LSAXS > Llam > lcr.
To estimate the parameters of the lamellar structure of the investigated HDPE reactor powder, the above listed experimental methods were used.
3.2. Small Angle X-ray Scattering (SAXS)
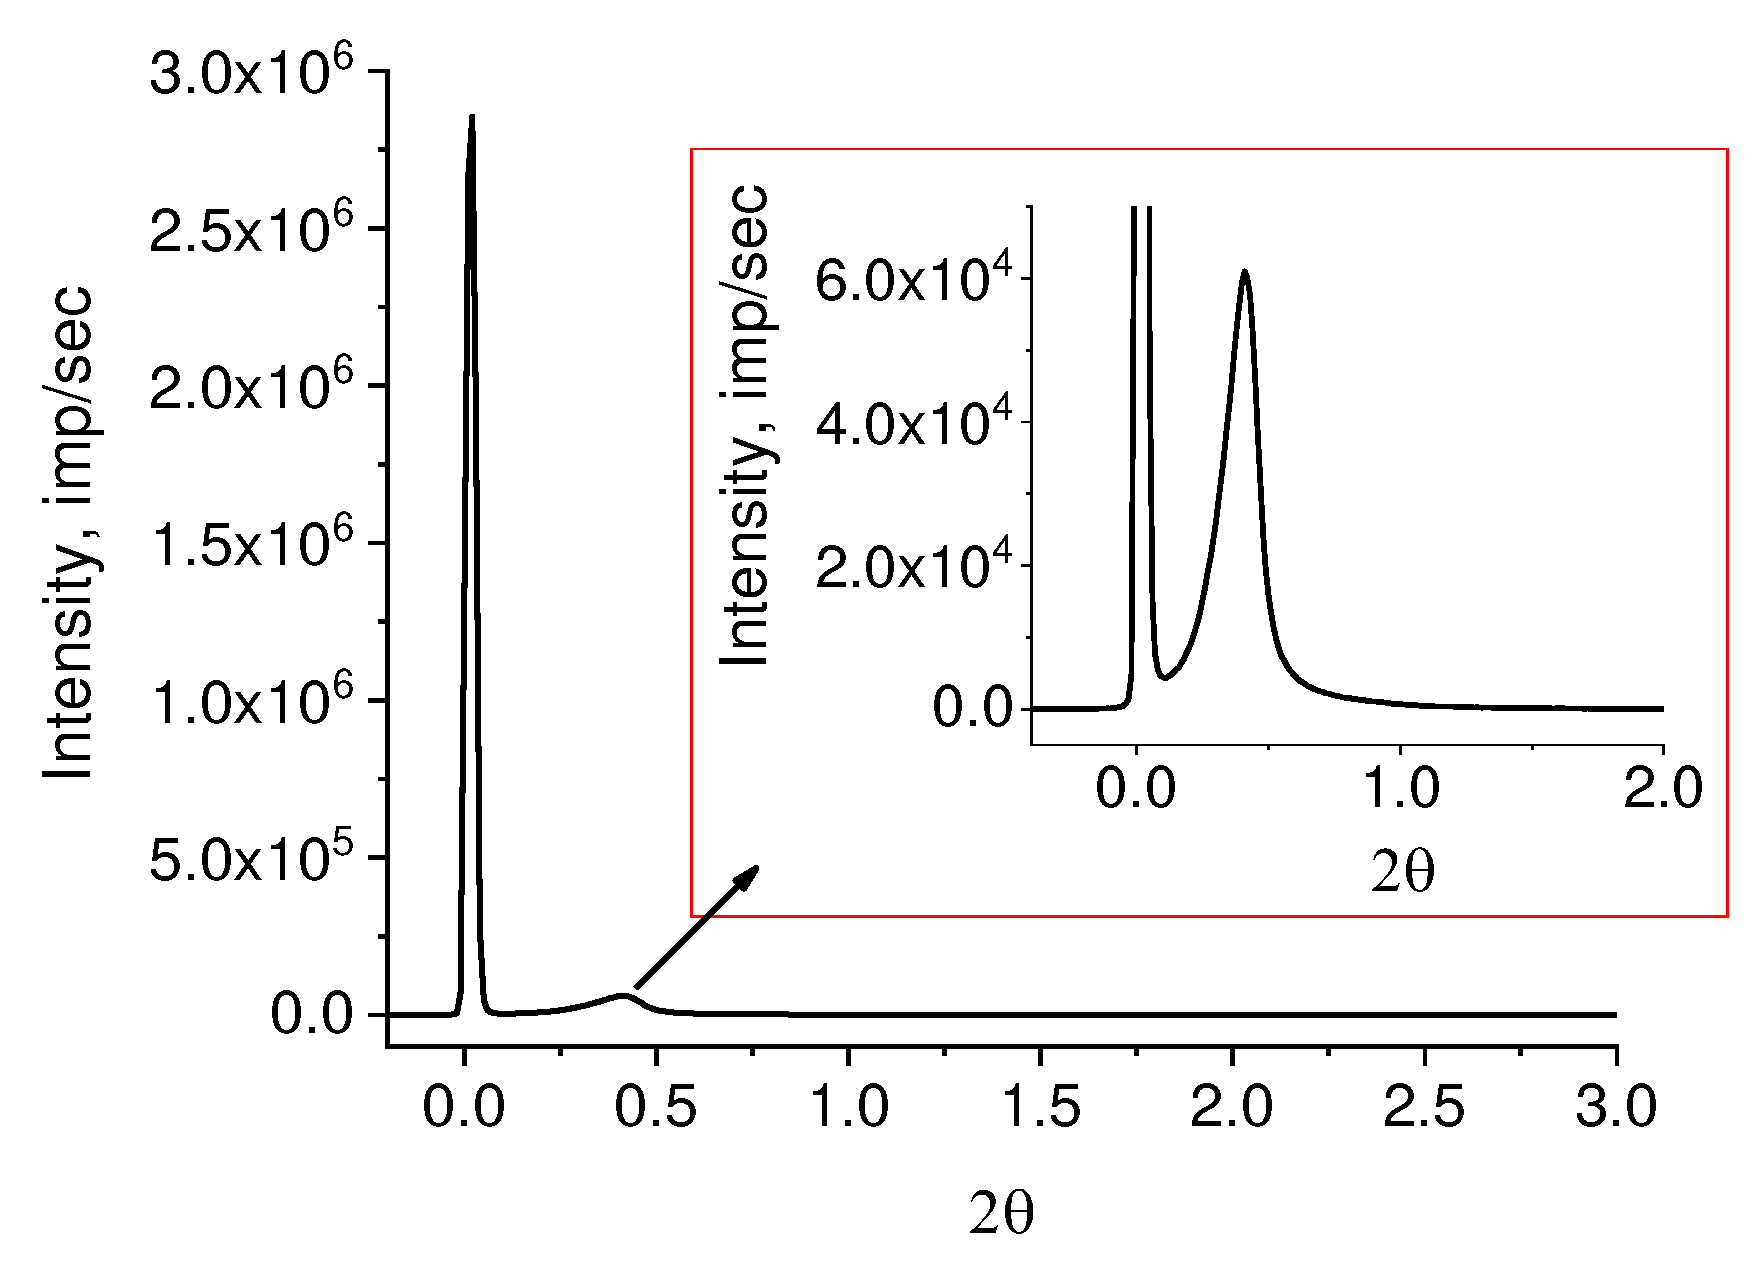
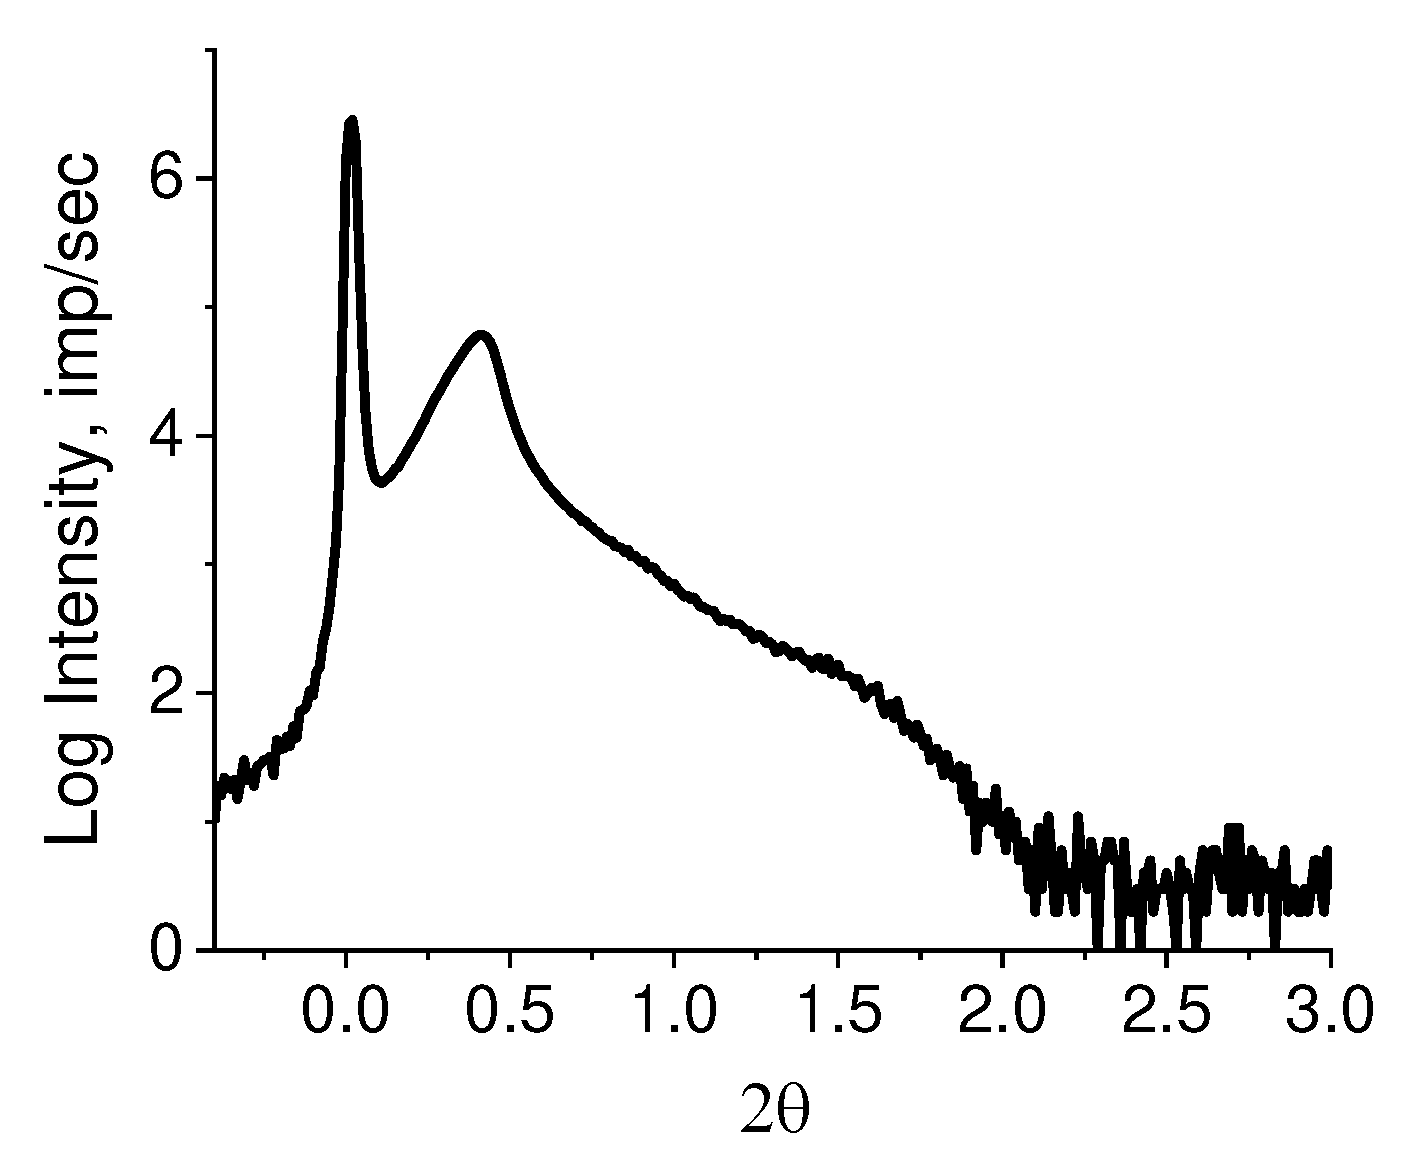
SAXS picture from the powder is presented in
Figure 5.
Despite the fact that many authors, as a rule, do not detect a diffraction peak on SAXS of RP, it still exists. It is merely masked by air scattering on porous powders. We succeeded in its detection adding a drop of mineral oil to a powder sample which has an electron density close to that of PE. The peak is well seen in the inset in a right upper corner of
Figure 5. The asymmetric profile of the observed peak implies the overlapping of lamellar stacks with different periodicity. It is possible to decompose the observed diffraction peak into elementary peaks with a known degree of reliability only in the range of angles 0.1 ≤ 2θ ≤ 1.0. The intensity in the range of angles 1 ≤ 2θ ≤ 2 is small and almost does not change. When taking the logarithm of the initial curve (lg I(2θ)), a rather high intensity is observed in this region, allowing to assume the presence of periodic structures with other (smaller) values of long periods (
Figure 6).
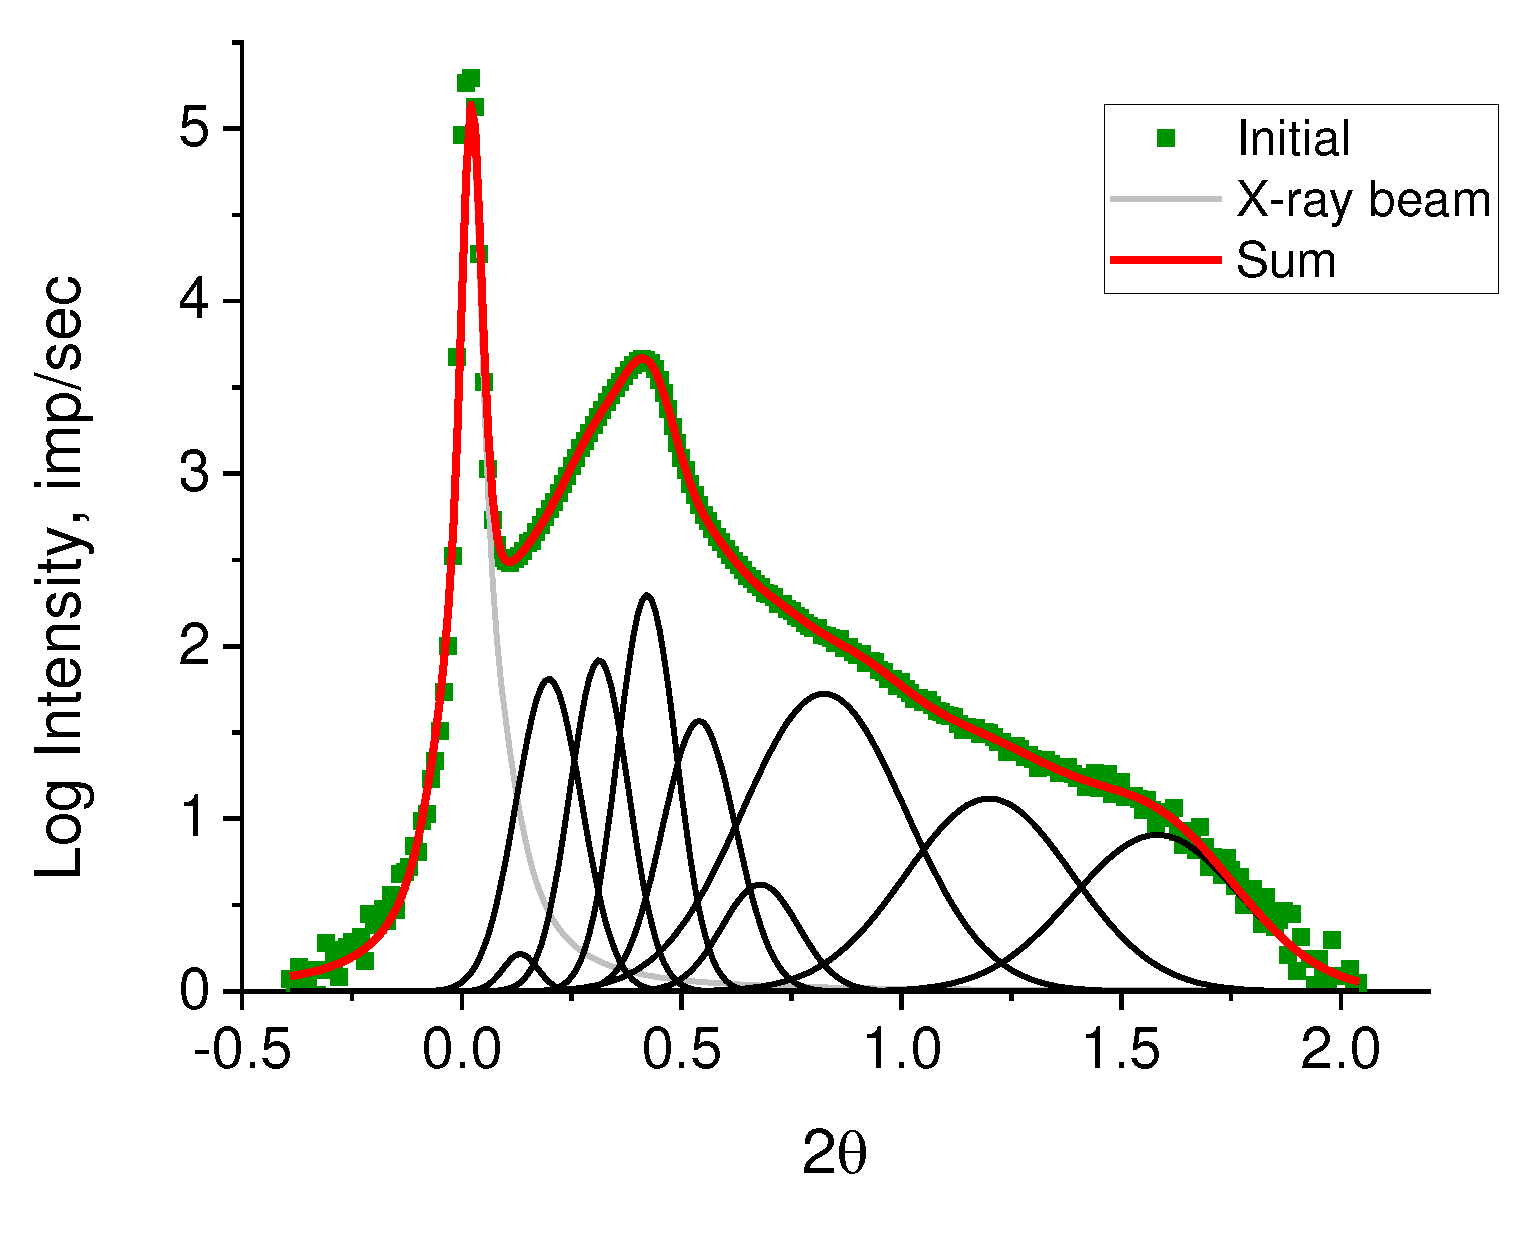
The periodic structures can be identified by decomposing the resulting curve (
Figure 6) using Fityk 1.3.1 software (
Figure 7).
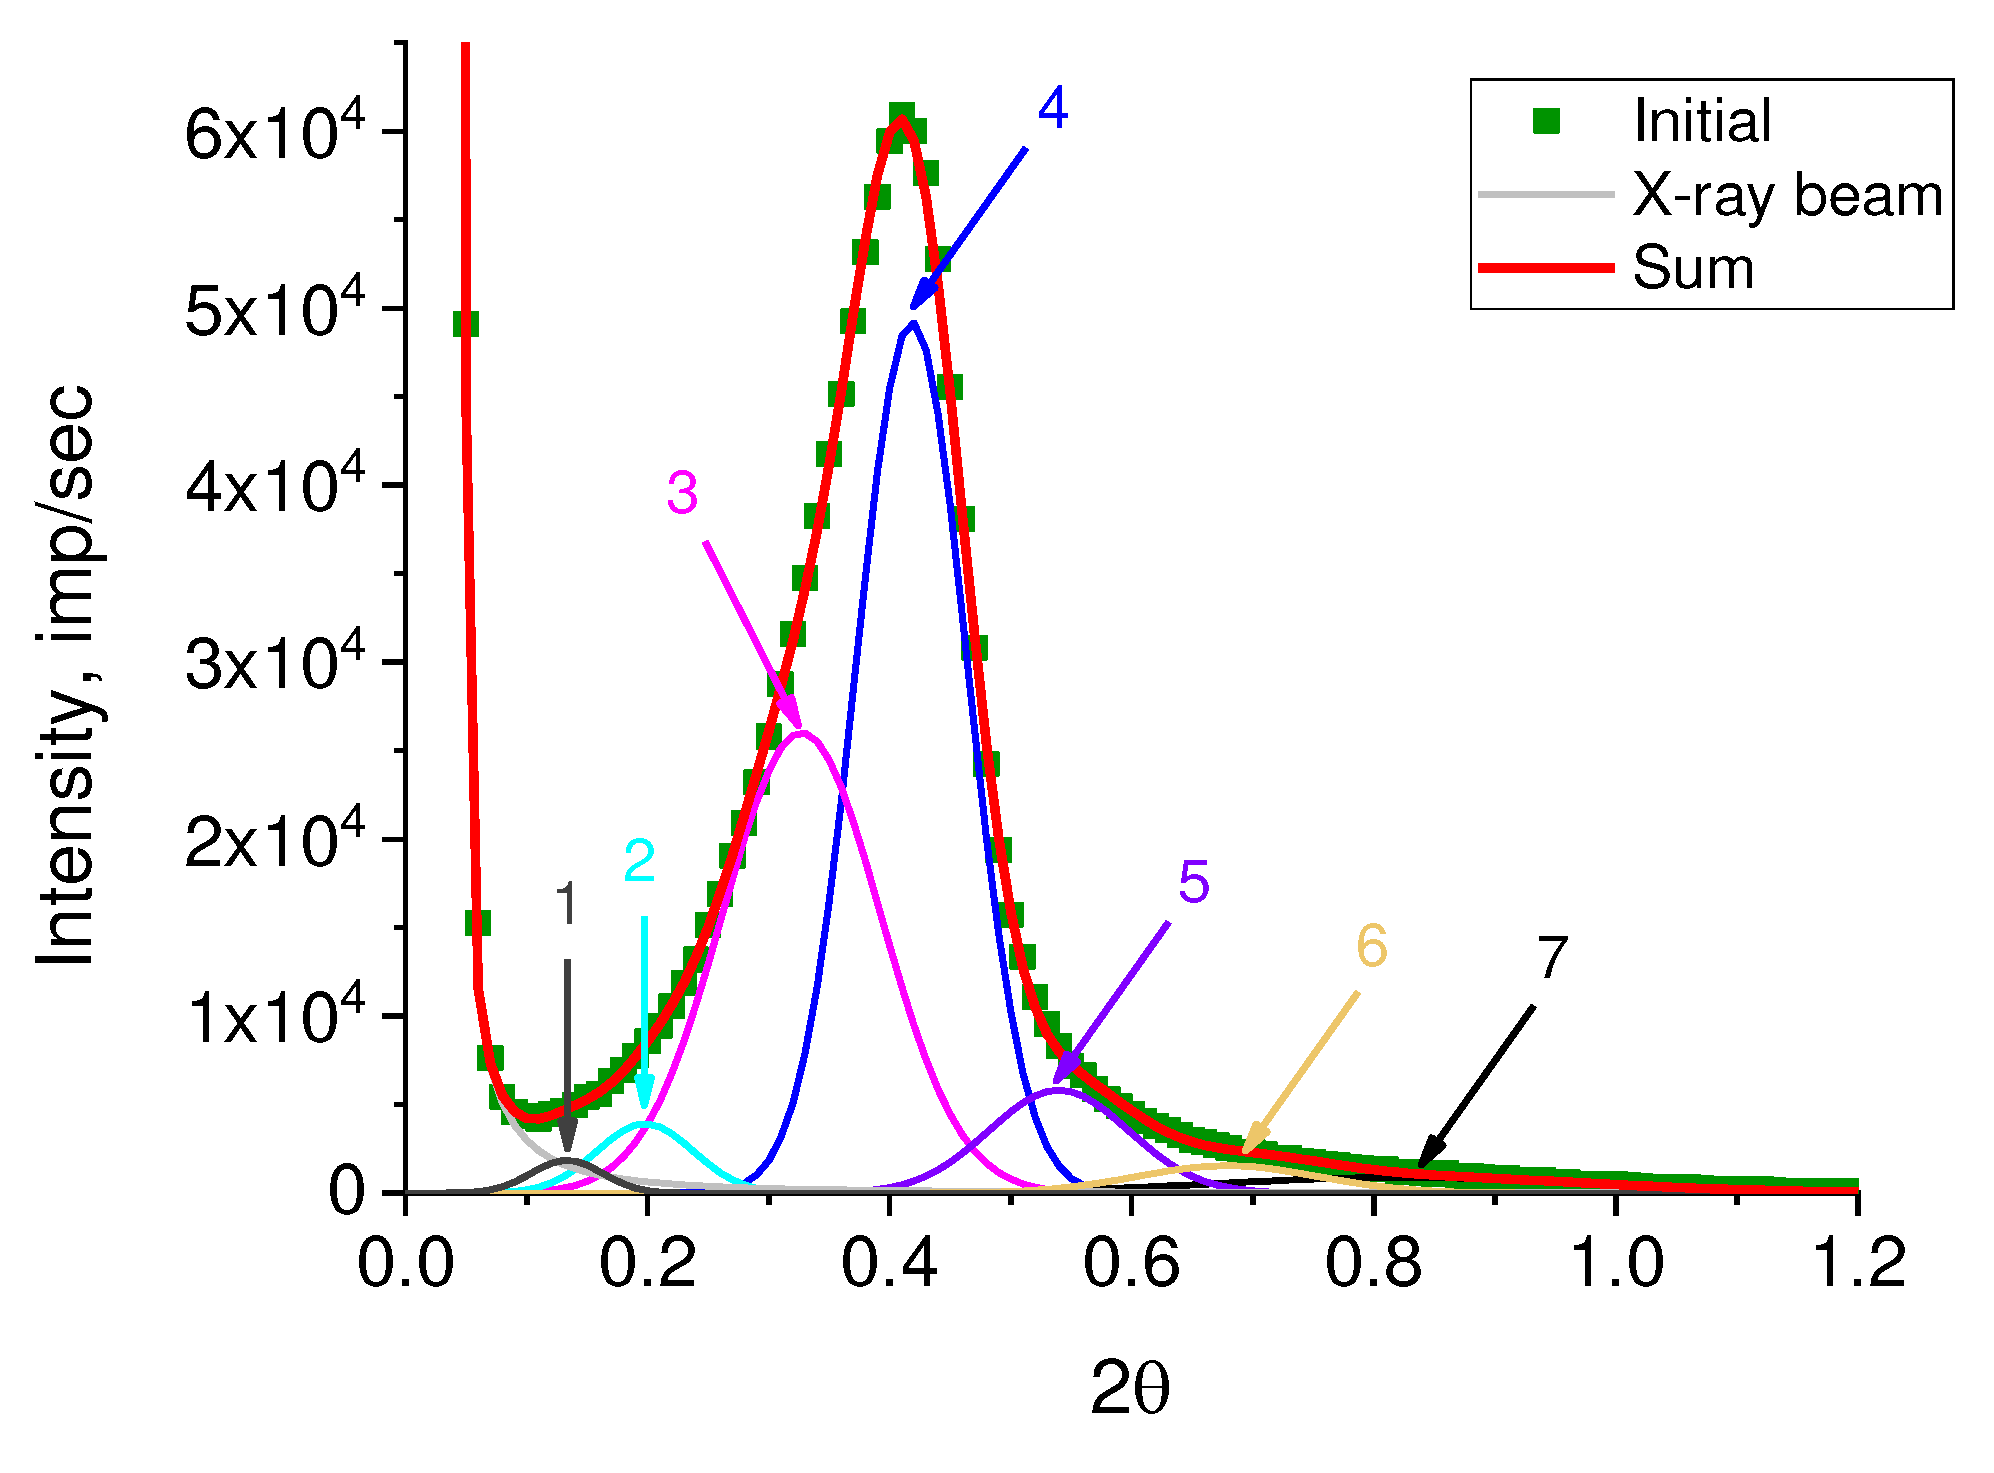
The number of substantiated peaks in the decomposition was chosen in accordance with the number of different morphoses in the powder under study. It should be emphasized that the logarithmic scale makes it possible to obtain the elementary peaks without taking into account their real weight contribution. To estimate the real weight contribution, the decomposition of the original curve (
Figure 8) was carried out with fixed angular positions of the peaks obtained by decomposing lg I(2θ) (
Figure 7). As a profile function, the Pearson function was used.
As is known, a small-angle diffraction peak occurs when a stack of alternating regions with different electron densities (regions of order and disorder) is present in the object under study, the so-called long period (L
SAXS), as it was mentioned above. In our case, the regions of order are lamellae (L
lam) and disordered areas between them (l
a). Moreover, the intensity of low-angle peaks depends on the squared difference in the densities (
ρ) of these areas (Δ
ρ2) and the degree of stack regularity (ΔL
SAXS/L
SAXS). The diffraction peak distribution obtained (
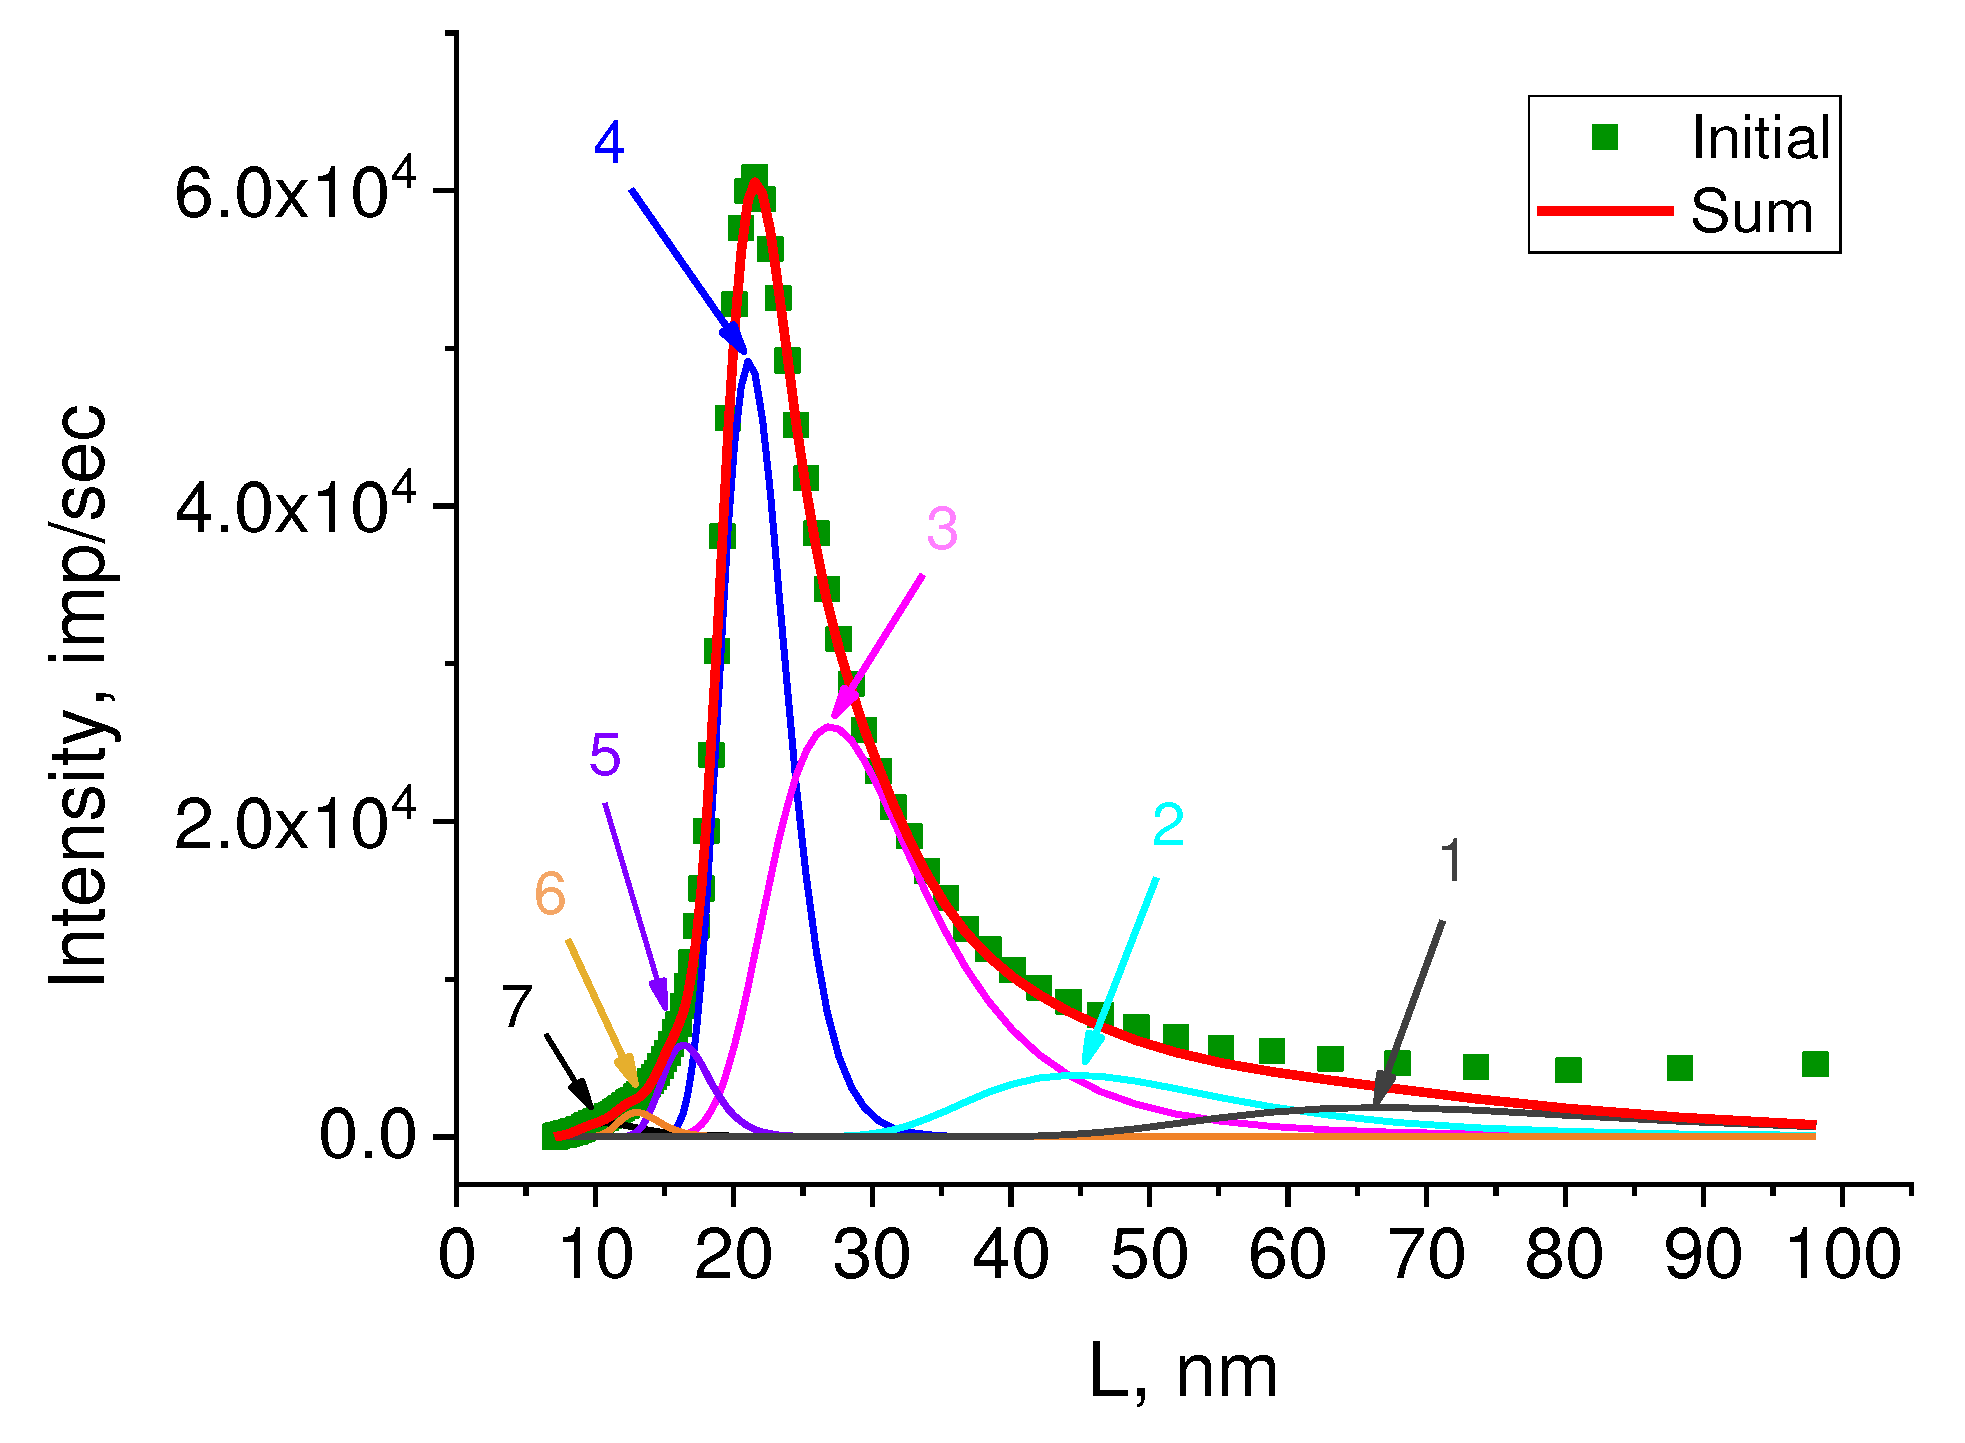
Figure 8) was recalculated to the long period size distribution using the Bragg equation 2Lsinθ = nλ (
Figure 9).
The values of long periods L
SAXS, calculated using the Bragg equation, and their weight contribution to the overall small-angle scattering curve in % are given in
Table 1.
Comparison of the contributions of different long periods L
SAXS calculated from the dependence I(L
SAXS) with SEM data allows us to presumably attribute them to certain morphoses. So that, for example, large long L
SAXS periods (peaks 1 and 2) are closest in size to macro-shish-kebabs, clearly visible on SEM of HDPE microphotographs in
Figure 2B (49.8 ± 14.6 nm). However, there are not so many of them (7.2 and 11.0%), although the SEM images give the impression that macro-shish kebabs are the main structural elements in reactor powders. In addition, the intensity of these peaks is low compared to the intensity of the peaks related to L
SAXS with a value of 21.0 – 27.0 nm (
Figure 9), while from such structures with a huge difference in the density of the kebab and interkebab space (“voids” in SEM images), one could, on the contrary, expect the maximum scattering intensity.
Apparently, there are two reasons for the moderate contribution of these large LSAXS to the total scattering curve. Firstly, the preferred choice by the operator of the shooting area with the predominant localization of macro-shish-kebabs, while in another place on the surface there may be much less of them. Secondly, a large scatter in the thickness of kebabs and a scatter in the periodicity of their location along the central shish (which is clearly seen in SEM images) can significantly reduce the X-ray scattering intensity which will lead to a decrease in the peak area and, accordingly, a decrease in the estimate of the contribution of these peaks to the overall scattering curve.
Comparing the sizes and percentages of other elementary peaks given in the
Table 1 with electron microscope images, we can assume that the structures with a frequency of 21.0 – 27.0 nm and the highest percentage (32.9 and 44.7%) are localized not along the central shish, but inside it and represent micro-kebabs (
Figure 3), which were mentioned above. On SEM images of the RP (
Figure 2A), micro-kebabs are not visualized due to the deposited metal layer, but they, apparently, still exist.
It is rather difficult to speak about the localization of structures with a periodicity of 10.7 – 16.3 nm, the contribution of which is very small (0.6% and 2.9%). These can be micro-kebabs with a large scatter of periodicity, and/or extended lamellae, occasionally found on SEM images of the RP (
Figure 1C).
Knowing the degree of crystallinity (χ) calculated from the area of the melting peak on the temperature dependence of the heat capacity obtained by DSC, it is possible to calculate the sizes of ordered regions (but not the regions of three-dimensional coherent scattering, the magnitude of which is determined from high-angle X-ray patterns (lcr), but regions that contribute to the enthalpy of melting (in our case, lamellae Llam; Llam = LSAXS × χ) and proper disordered regions (la = LSAXS - Llam).
The true dimensions of the crystalline core of the lamellae lcr in the direction of the chain were calculated from WAXS data for linear halfwidth of D002 reflex and were 6.2 nm. Half the difference between the lamella thickness and the size of the crystalline core ((Llam - lcr)/2) gives the value of the transition zones on both sides of the lamella, the thickness of the surface layer of the lamellae (linterphase).
The average degree of crystallinity χ of the studied HDPE, calculated from the dependence of heat capacity on temperature for a RP sample (m = 2.0 ± 0.1 mg) at a scanning rate of 2 K/min, was χ = 54%. However, taking into account the heterogeneity of the supermolecular structure of the studied RP, it can be assumed that the degree of crystallinity is unequal, especially for areas with a pronounced macro-shish-kebab structure. The schema on
Figure 3 shows areas that are visible and invisible on microscopic images. We only see macro-kebabs alternating along the thick shish. There is no polymer material between them. Obviously, the crystalline part here is much less than 54%. You can estimate the "degree of crystallinity" of macro-kebabs: χ(1) = 12.1/49.8 = 24.3% (see
Figure 3). At the same time, macro-kebabs account for 18.2% in the total set of various structures and, accordingly, somewhat underestimate the total crystallinity of the remaining structures. Then it is possible to estimate the crystallinity of macro-shish-kebab structures and the degree of crystallinity of all other periodic structures according to the relation below:
χ(2) is the crystallinity of other structures. It is appeared to be to 60.6%.
Then for macro-shish-kebab structure Llam = 0.243 × LSAXS, and for other periodic structures Llam = 0.606 × LSAXS.
Knowing the values of the degree of crystallinity and the melting temperature, it is possible to calculate the values of the surface energy for each lamella found from the analysis SAXS data. The true melting temperature of the investigated HDPE was determined from the heat capacity peak taking into account the above-mentioned methodological error ΔТ = 1.2 K, and amounted to: T
m = 400.1 K. The surface energy σ
e can be calculated from the generalized Gibbs-Thomson equation [
17], based on the balance of surface and volume energies
where a and b are the dimensions of the crystallite (the region of coherent scattering) in the plane of the section perpendicular to the longitudinal axis coinciding with the direction of the macromolecule; L is the longitudinal size of the crystallite; σ is the surface energy of the side surfaces of the crystallite; σ
e is the surface energy of the fold surface; ΔH
0 is the heat of fusion.
In the supermolecular lamellar structure of the polymer, the parameters a and b >> L, therefore, in expression (1), the terms σ/a and σ/b can be neglected and it can be re-written in a simpler form:
The following data were used in further calculations: T
0 = 415.5 K; ΔH
0 = 279 J/g [
14]. Since the long period L
SAXS is determined by the SAXS, the longitudinal size of the crystalline part, more precisely the thickness of the lamella L
lam in expression (2) is L
lam = χ × L
SAXS.
Table 2 shows the parameters of the structures identified in the analysis of SAXS data and the surface energies calculated for them using equation (2).
As follows from the data given in the
Table 2, the surface energy value (85.3 × 10
-3 J/m
2), which is closest to the energy of a regular fold (90 × 10
-3 J/m
2) [
14], is observed in the thickest lamellae with a thickness of 16.5 nm, which, as we assume, are localized in micro-kebabs and make the largest contribution to the small-angle scattering curve (44.7 %). At the same time, the surface energy of lamellae of almost the same thickness (L
lam = 15.2 nm), which form kebabs in macro-shish-kebab structures, also has a fairly high surface energy (78.6 × 10
-3 J/m
2), which allows us to assume a similar structure of the surface of the morphoses under consideration.
However, it is surprising that in these most perfect micro- and macro-bump formations with predominantly regular folds, according to the calculation within the Thompson Gibbs theory, the largest transition phase is observed (4.50 nm and 5.15 nm). The only explanation for this phenomenon can be the occurrence of strong distortions in the crystalline cores of the lamellae in the region of regular folds, which distort the crystallographic lattice in the near-surface layers of the lamellae.
In crystalline cores of lamellae with lower values of surface energy (30–60 × 10-3 J/m2) and, accordingly, with a large number of irregular folds, such distortions are practically absent and the size of the transition zone near the lamella surface is smaller (1.85–3.35 nm).
Note that the investigated HDPE reactor powder was obtained by suspension synthesis in toluene at 70°C with stirring of the reaction liquid during synthesis. Polymerization and crystallization are exothermic processes. Therefore, in local regions of the reactor, even with intensive stirring, there may be temperature regions that differ from the average temperature. In addition, the emergence of a crystallization nucleus from segments of extended molecules (in shishas) leads to an instantaneous stress drop in the nearest environment [
18,
19], which allows folded crystals (kebabs) to crystallize in a quasi-stationary field. Thus, the crystallization of the resulting polymer occurs in shear fields with an inhomogeneous distribution of both shear stresses and temperature over the reactor volume. This, apparently, is the reason for such heterogeneity in the size of the lamellae and the difference in the structure of their surfaces.
