1. Introduction
Analytical methods based on quantitative determination of sugars plays a fundamental role in various applications of biosciences. The phenol-sulfuric acid method is widely employed for determination of sugars in oligosaccharides, glycoproteins, glycolipids, and even DNA [
1,
2,
3]. This colorimetric method is recognized for its simplicity and reliability, making it a preferred choice for sugar analysis across multiple fields of study. The phenol-sulfuric acid method is a widely adopted approach due to its notable sensitivity and straightforwardness. Although alternative methods, such as those employing anthrone [
4], orcinol [
5], or resorcinol [
6], may exhibit similar levels of sensitivity, they lack the same level of convenience and ease of use.
Colorimetric biosensors offer rapid detection methods that can be employed at the point of care, enabling real-time diagnosis of biomarkers and emerging viruses [
7,
8]. Indeed, various colorimetric biosensors have been developed to specifically detect and quantify nucleic acids, offering valuable insights into virus diagnostics, genetic analysis, and biotechnological applications[
9,
10,
11,
12]. These assays use diverse dyes or nanoparticles, serving as indicators [
13,
14,
15], which undergo distinct color changes upon interaction with target DNA or RNA molecules. The detection principle often involves the formation of complexes or aggregates, leading to alterations in the absorbance spectrum. Such colorimetric detection strategies provide a promising avenue for sensitive and label-free nucleic acid analysis, presenting an attractive alternative to more complex and expensive analytical techniques.
Furthermore, biosensors play a crucial role in the sensitive detection of intercalator agents and genotoxic molecules by leveraging their ability to interact with DNA through intercalation, which hinder the DNA hybridization step or providing valuable insights into potential DNA damage and mutagenicity[
16,
17]. These specialized sensors are designed to recognize and bind to intercalating compounds that can insert themselves between the base pairs of DNA, leading to structural modifications[
18]. As a result, the hybridization process, which involves the pairing of complementary DNA strands, is inhibited. By monitoring this interference, biosensors can provide valuable information about the presence and concentration of genotoxic substances in various samples[
19]. The utilization of biosensors for this purpose holds great promise in environmental monitoring, medical diagnostics, and toxicological studies, enabling efficient and reliable detection of potentially harmful agents and contributing to the advancement of public health and safety.
In this study, our objective is to develop a colorimetric biosensor that exploits the sugar reaction for the detection of DNA target, RNA target, and intercalator molecules. Building upon the widely utilized phenol-sulfuric acid method, we aim to harness its simplicity and sensitivity to extend its applicability to target detection in nucleic acids and intercalator molecules. By integrating the sugar reaction with colorimetric indicators (phenol-sulfuric acid reagent), we seek to create a novel biosensing platform capable of accurate and rapid analysis of these important biomolecules. To achieve this, we followed a method similar to that described by Maliana et al.[
7], where a sequence probe complementary to the target sequence was immobilized on the surface of 96-microplate wells. The sample containing the sequence target was then added to the prepared microplate and subjected to two washes. Subsequently, a phenol-sulfuric acid reagent was added to the microplate, resulting in the immediate appearance of an orange color. The absorbance of the colored complex was measured using a microplate reader at 490 nm. The obtained absorbance was directly correlated with the concentration of the target DNA or RNA. Hence, a higher concentration of the target DNA or RNA yielded a greater level of the colored complex. This principle enables the quantification of the target DNA or RNA using the developed biosensor, offering a potential tool for sensitive and specific detection in various applications. Furthermore, we also developed a colorimetric biosensor for the detection of intercalator agents that inhibit the hybridization of DNA complementary to the immobilized capture DNA on the 96-microplate wells.
2. Materials and Methods
2.1. Chemicals and Reagents
Potassium hydroxide (KOH), glutaraldehyde (Glu), ethanolamine (ETA), Adenosine 5′-triphosphate (ATP) disodium salt hydrate, phenol, DNA fish sperm, Curcumin, ribose, glucose, fructose, and potassium chloride (KCl) were bought from Merck, Germany. (3-Aminopropyl) triethoxysilane (APTES) was obtained from ALFA AESAR, United Kingdom. Hydrochloric acid (HCl) was purchased from VWR life science AMRESCO, Ireland. Ethanol was obtained from Laurylab, France. Sulfuric acid (H2SO4) and sodium phosphate dibasic (Na2HPO4, 12H2O) were bought from Solvachim (Casablanca, Morocco).
The chemicals used for the preparation of phosphate buffer saline (0.01 M PBS containing 2.7 mM KCl and 137 mM NaCl, pH 7.4) were bought from Merck, Germany. All the used reagents were of analytical grade.
PBS was used as a washing buffer.
Eurofins Genomics provided HPLC pure oligonucleotides as a lyophilized powder, The Ulis, France. The sequences of oligonucleotides were listed in
Table 1. The stock solutions of synthetic oligonucleotides were prepared in ultra-pure water, aliquoted, and stored at -20 °C.
2.2. Apparatus
For absorbance measurements, An ELx800 absorbance microplate reader (BioTek, Winooski, USA) was used to measure the optical density of the developed colorimetric product at 490 nm. Data were evaluated with Gen5 software. OriginPro8 was used as the data analysis and artwork, and graphing software.
For the characterization, An UV-Vis double beam spectrophotometer (UK) JENWAY (6850) with a 1.0-cm matched cell was employed.
2.3. Microplate-Based Phenol-Sulfuric Acid Method for Sugar Source Analysis
The phenol-sulfuric acid reaction is well-established for its proficiency in detecting and quantifying sugars. This reaction involves the combination of phenol and sulfuric acid, resulting in the creation of a stable-colored complex. Notably, it has been reported that phenol undergoes sulfonation in situ during this reaction, leading to the production of a sulfonic acid derivative [
20]. This sulfonic acid derivative plays a crucial role in generating the characteristic color utilized for sugar analysis, which is typically measured at 490 nm. To initiate the reaction, 100 µL of the sugar solution was added to a microplate, followed by the addition of 100 µL of concentrated sulfuric acid and 10 µL of phenol (120 mg/mL). A distinctive yellow-orange color was developed, indicative of sugar presence. The reaction was carried out at room temperature.
2.4. Construction of the Phenol-Sulfuric Acid Method-based developed biosensor for DNA or RNA target detection
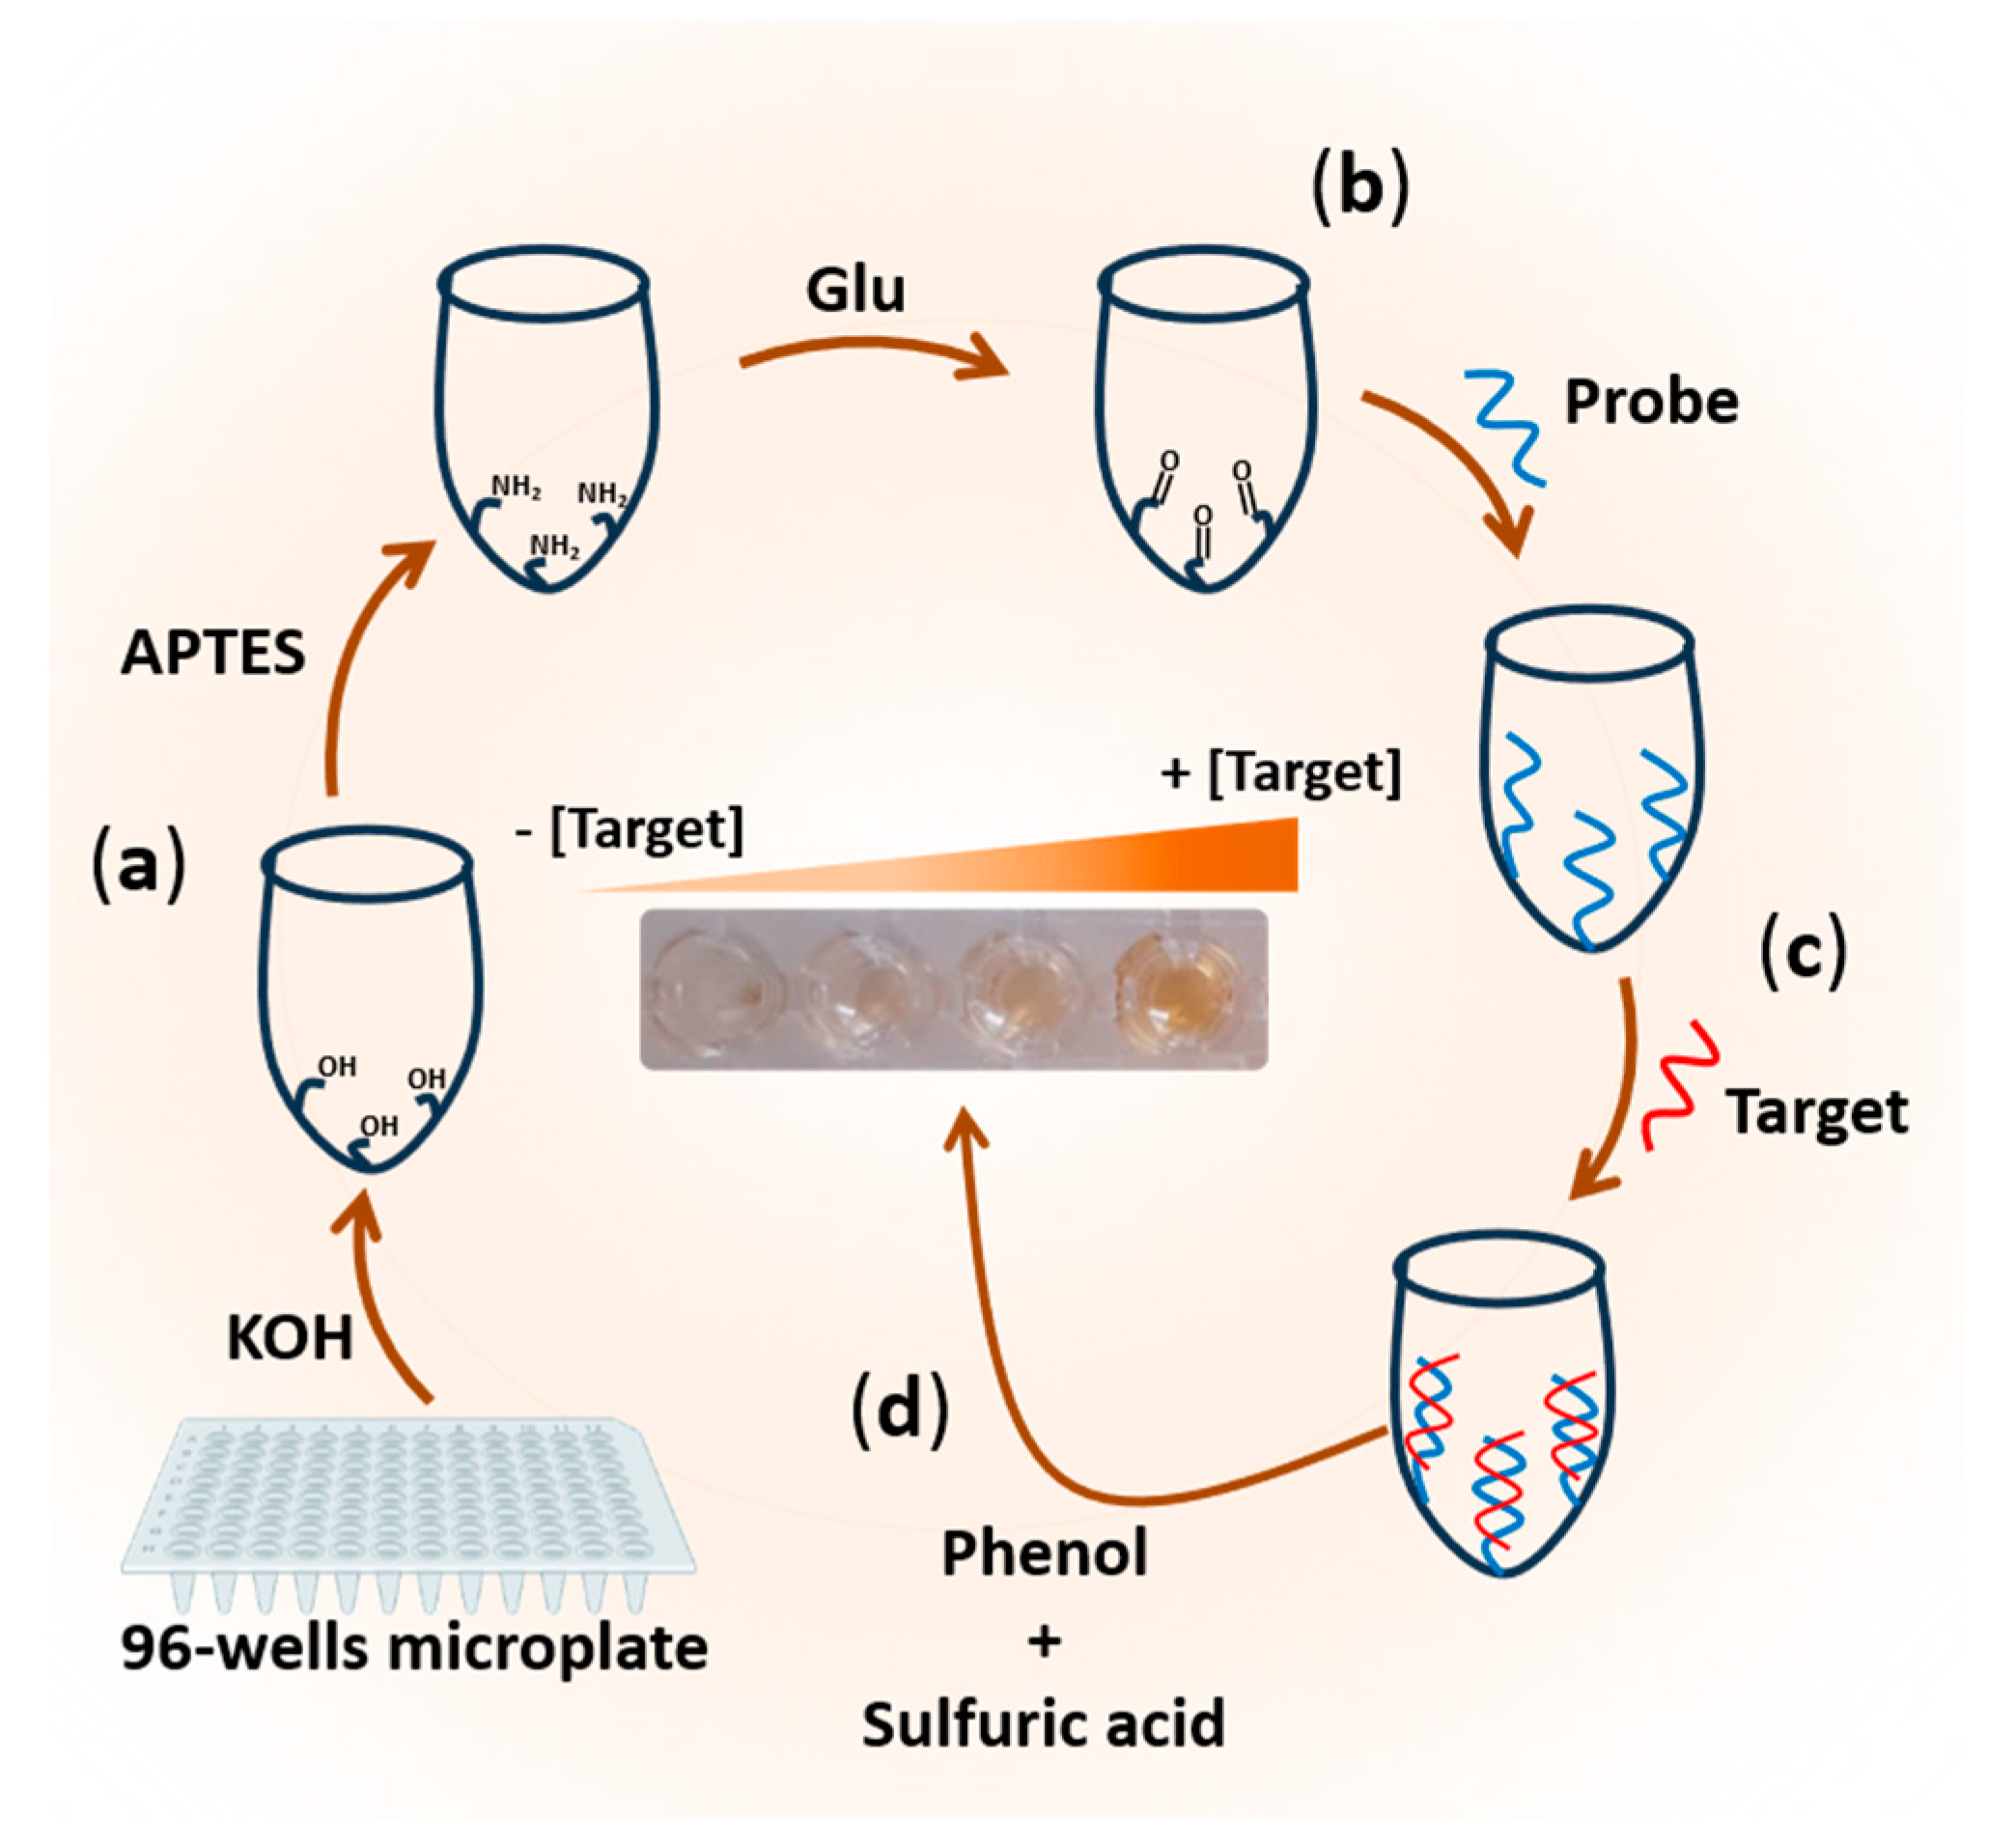
The developed biosensor is based on a series of steps involving the activation and functionalization of polystyrene 96-well microplates. As described in
Scheme 1 and as will be detailed in the next paragraphs
2.4.1. Surface Activation and Functionalization of 96-Well Microplates
To enable the immobilization of unmodified single-stranded DNA, the surface of a polystyrene microplate was functionalized by leveraging the amine functionality of its nitrogenous bases. This process involved two main phases to modify each well of the microplate. Initially, the plate surface was activated by treating the wells with potassium hydroxide (KOH) for 10 minutes, using a total volume of 100 µL. This activation step facilitated the formation of hydroxyl groups essential for subsequent silanization. Subsequently, the plates were thoroughly rinsed with distilled water, ensuring a minimum of three washes. Following this, 100 µL of APTES was added to each well, initiating the silanization process. During silanization, silanol linkages (-O-Si-) were formed between the hydroxyl functional groups (-OH) on the plate's surface and the alkoxy groups of APTES, thereby introducing amino functionalities. After 30 minutes of silanization, the amino-functionalized polystyrene 96-well microplates were washed three times with 10 mM PBS. Consequently, the polystyrene 96-well microplate substrate was successfully modified to possess amine functionality (
Scheme 1a).
2.4.2. Probe immobilization on the amine-functionalized 96-well microplate
To immobilize the unmodified ssDNA probe complementary to the RNA or DNA target, glutaraldehyde was employed as a cross-linking agent. On the surface of NH
2-functionalized polystyrene 96-well microplates, glutaraldehyde was immobilized through the formation of a C=N linkage. The reaction proceeded for 45 minutes, a suitable concentration of 5% was used. Subsequently, the microplate was washed with distilled water. Next, 1 µM of the capture probe (ssDNA) in 10 mM PBS pH 7.4 was added to each plate and allowed to incubate for one hour at 37 °C. Following three washes, non-specific sites were blocked for 15 minutes using 1 mM ethanolamine. The resulting microplate, modified with the capture probe (DNA
capture-modified microplate), served as a pre-activated, ready-to-use bio-platform for the rapid on-site detection of DNA or RNA targets (
Scheme 1b).
2.4.3. Target RNA/DNA hybridization
For target DNA or RNA detection, strict hybridization conditions were maintained. A volume of 100 µL containing target DNA or RNA at various concentrations (ranging from 0.2 µM to 1 µM) in PBS was added to each DNA
capture-modified plate. The hybridization process was allowed to proceed for one hour at a temperature of 37 °C. Subsequently, the wells were thoroughly washed three times using a washing buffer, ensuring the removal of any non-specifically bound molecules (
Scheme 1c).
2.4.4. Target DNA/RNA Detection via Phenol-Sulfuric Acid Method
To initiate the reaction, 100 µL of concentrated sulfuric acid and 10 µL of phenol (120 mg/mL) were added to each well (DNA
capture-modified microplate), before and after hybridization step. A yellow-orange color was immediately developed in the solution. Subsequently, the color produced was measured at a wavelength of 490 nm using an ELx800 absorbance microplate reader (
Scheme 1d).
2.5. Construction of a Biosensor for Intercalating Agent Detection Based on the Phenol-Sulfuric Acid Method
The biosensor was constructed following the steps outlined above, including activation, functionalization, and DNA capture immobilization. During the hybridization step, a solution containing the DNA target (1 µM) and curcumin at different concentrations (ranging from 10 µM to 100 µM) was added simultaneously. The solution was incubated for 1 hour at 37 °C. Subsequently, a washing step was performed to remove any unhybridized DNA target. Notably, the presence of curcumin demonstrated an inhibitory effect on the hybridization process. Then, the developed method based on the phenol and sulfuric acid described above was carried out to evaluate the concentration of Curcumin.
3. Results and Discussions
3.1. Integrated Approach for Sugar Source Analysis and DNA Detection using Microplate-Based Phenol-Sulfuric Acid Method
The reaction between sugars and phenol-sulfuric acid is based on the condensation of hydroxyl groups in sugars with phenol groups in the presence of sulfuric acid. This condensation reaction forms furfurals, which exhibit strong absorption at 490 nm [
1,
21]. The sulfuric acid serves as a dehydrating agent, facilitating the conversion of sugars into furfurals. The yellow-orange color intensity is directly proportional to the sugar concentration in the sample. This method provides a reliable and sensitive approach for sugar source analysis, enabling accurate determination of sugar content in various samples.
3.1.1. Sugar Reaction via the Developed Phenol-Sulfuric Acid Method
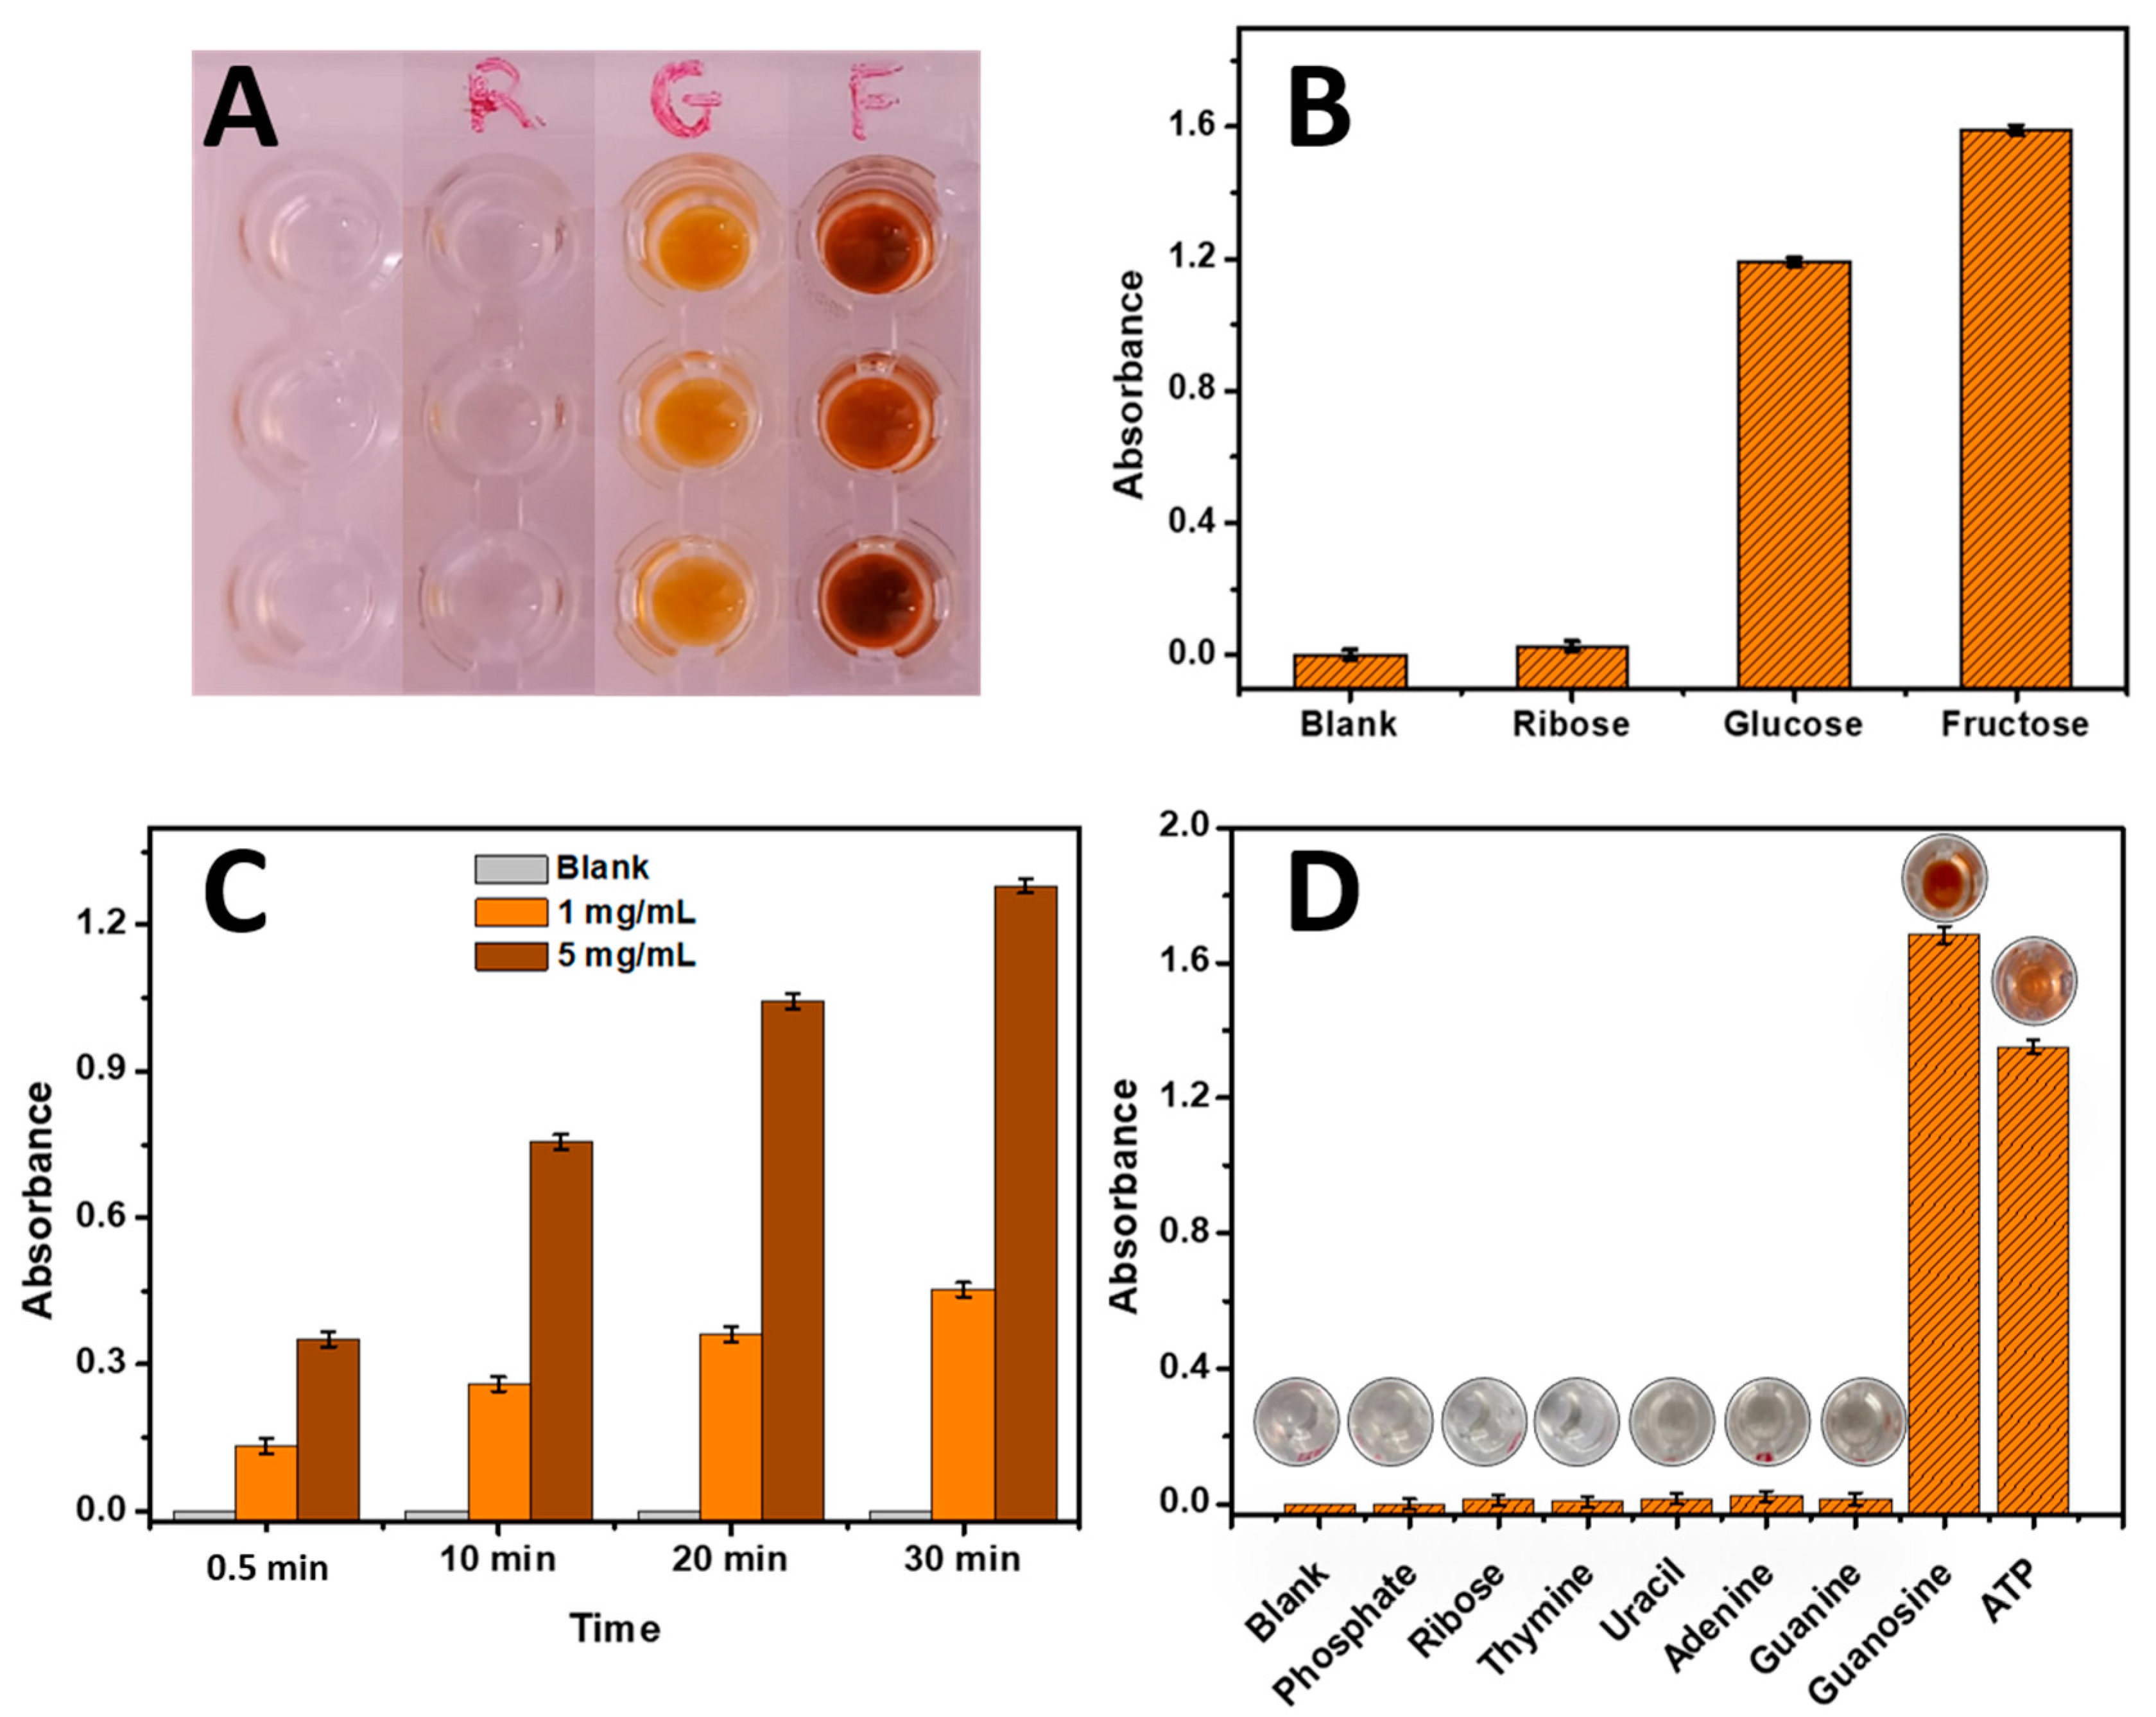
Three sugars, namely Ribose, Glucose, and Fructose, were investigated to evaluate the phenol-sulfuric acid reaction. The concentrations used were 10 mg/mL for each sugar. The results are presented in
Figure 1. As depicted in
Figure 1A and confirmed in
Figure 1B, the blank control without any sugar source remained colorless, indicating the absence of a reaction. However, the wells containing Ribose exhibited a mild color change, consistent with literature findings that Ribose yields a weaker signal compared to Glucose and Fructose [
3]. In contrast, the Glucose and Fructose wells displayed intense coloration, confirming their higher reactivity with the phenol-sulfuric acid reagent. This observation aligns with previous studies highlighting the different reactivity levels among these sugars [
3].
3.1.2. Application of the Phenol-Sulfuric Acid Sugar Reaction Method for DNA of Fish Sperm Analysis
Since the reaction of sugars with phenol-sulfuric acid was effective, it was employed for the analysis of DNA from fish sperm samples, considering that DNA contains ribose as a sugar source. DNA samples from fish sperm were analyzed at different concentrations (0, 1, and 5 mg/mL). The results are presented in
Figure 1C. It can be observed that as the concentration of DNA fish sperm increased from 0 mg/mL to 5 mg/mL, the absorbance of the resulting color also increased. This increase in absorbance cannot be attributed only to the higher concentration of ribose present in the DNA samples, since the absorbances obtained with free ribose (
Figure 1 B) are lower than the absorbances obtained with ribose as a key sugar component of DNA (
Figure 1C). Additionally, it is noteworthy that the presence of sulfuric acid in the reaction mixture leads to a slight hydrolysis of the DNA strands, contributing to the generation nucleosides which may lead to high color intensity. Furthermore, as described in the literature, the absorbance showed a time-dependent increase for all concentrations (
Table S1).
3.1.3. Application of the Phenol-Sulfuric Acid Sugar Reaction Method for each Component of DNA
In this study, various DNA compounds including phosphate, thymine, uracil, guanine, adenine, ribose, guanosine, and ATP were individually analyzed using the phenol-sulfuric acid reaction method. As shown in
Figure 1D, the results revealed that except for guanosine and ATP, none of the other compounds exhibited significant absorbance. This surprising outcome suggests that the phenol-sulfuric acid reaction specifically interacts with the sugar component present in guanosine and ATP. The reactivity towards guanosine and ATP indicates the capability of the phenol-sulfuric acid reaction to react with ribose-based compounds. These findings highlight the importance of understanding the chemical reaction of the phenol-sulfuric acid method and its potential applicability as a method for the quantification of DNA. This opens up potential avenues for developing sensitive and specific assays for molecular diagnostics and genetic analysis. For that, this research focus on refining and optimizing the phenol-sulfuric acid method to expand its scope and enhance its utility in DNA biosensing applications.
3.2. DNA-based biosensor for specific targets ( DNA, RNA ) detection using the phenol-sulfuric acid method
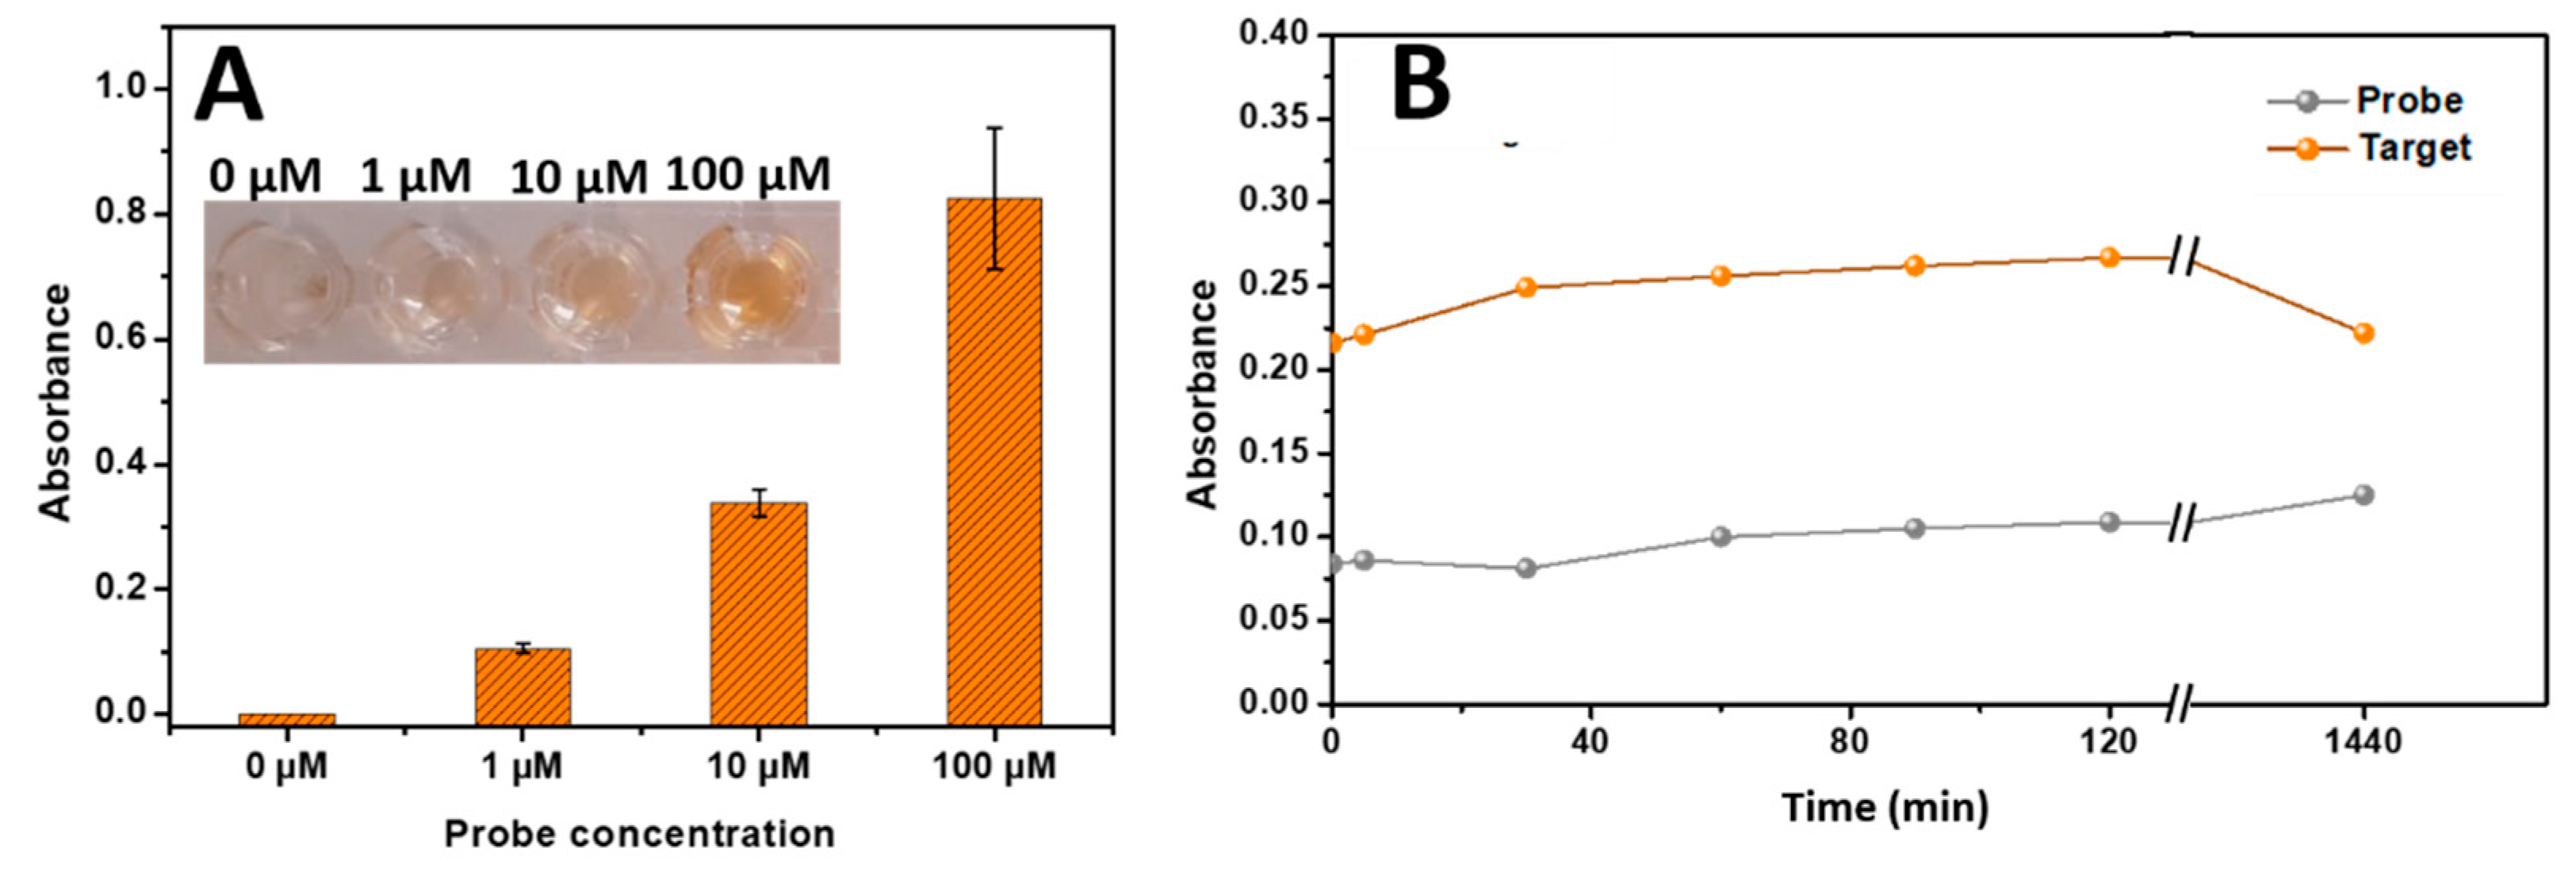
The immobilization of the unmodified probe was successfully demonstrated by immobilizing various concentration of probe (1 µM, 10 µM and 100 µM) on the well surface and submitted the phenol – sulfuric acid reaction. As described above in
Figure 2A the absorbance in the wells increased with the increase of the probe concentration immobilized on the wells.
Using the phenol-sulfuric acid method combined with the DNA
capture-modified microplate, specific targets (DNA, RNA ) were analyzed. once the DNA
capture-modified plate has been established as described above (
Scheme 1). Therefore, in the presence of the target DNA or RNA, the capture probe hybridized with the complementary sequence, forming a double-stranded structure. The concentration of the target DNA or RNA captured by the capture probe was quantified using the phenol-sulfuric acid method. The ribose/deoxyribose component present in the backbone of DNA or RNA reacted with the phenol and the sulfuric acid, resulting in the development of a colored complex measured at 490 nm. The higher the concentration of the target DNA or RNA, the higher the level of the colored complex generated (
Figure 2A). This principle enables the quantification of the target DNA or RNA using the developed biosensor, offering a potential tool for sensitive and specific detection in various applications.
The time-dependent behavior of the proposed biosensor was investigated to assess the reaction kinetics for target DNA or RNA detection. As illustrated in
Figure 2B, the absorbance exhibited an instantaneous high increase of absorbance followed with a very slight increase as a function of time, indicating that the color development process did not significantly impede the measurement of absorbance which can be performed the first minute or several hours later. This finding suggests that the biosensor can be effectively monitored within the first minute. By measuring the absorbance during this early stage, accurate and time-efficient detection can be achieved, streamlining the overall assay procedure.
3.3. Optimizing Phenol and Sulfuric Acid Concentrations Parameters for the Developed Biosensor Based on the Phenol-Sulfuric Acid reaction
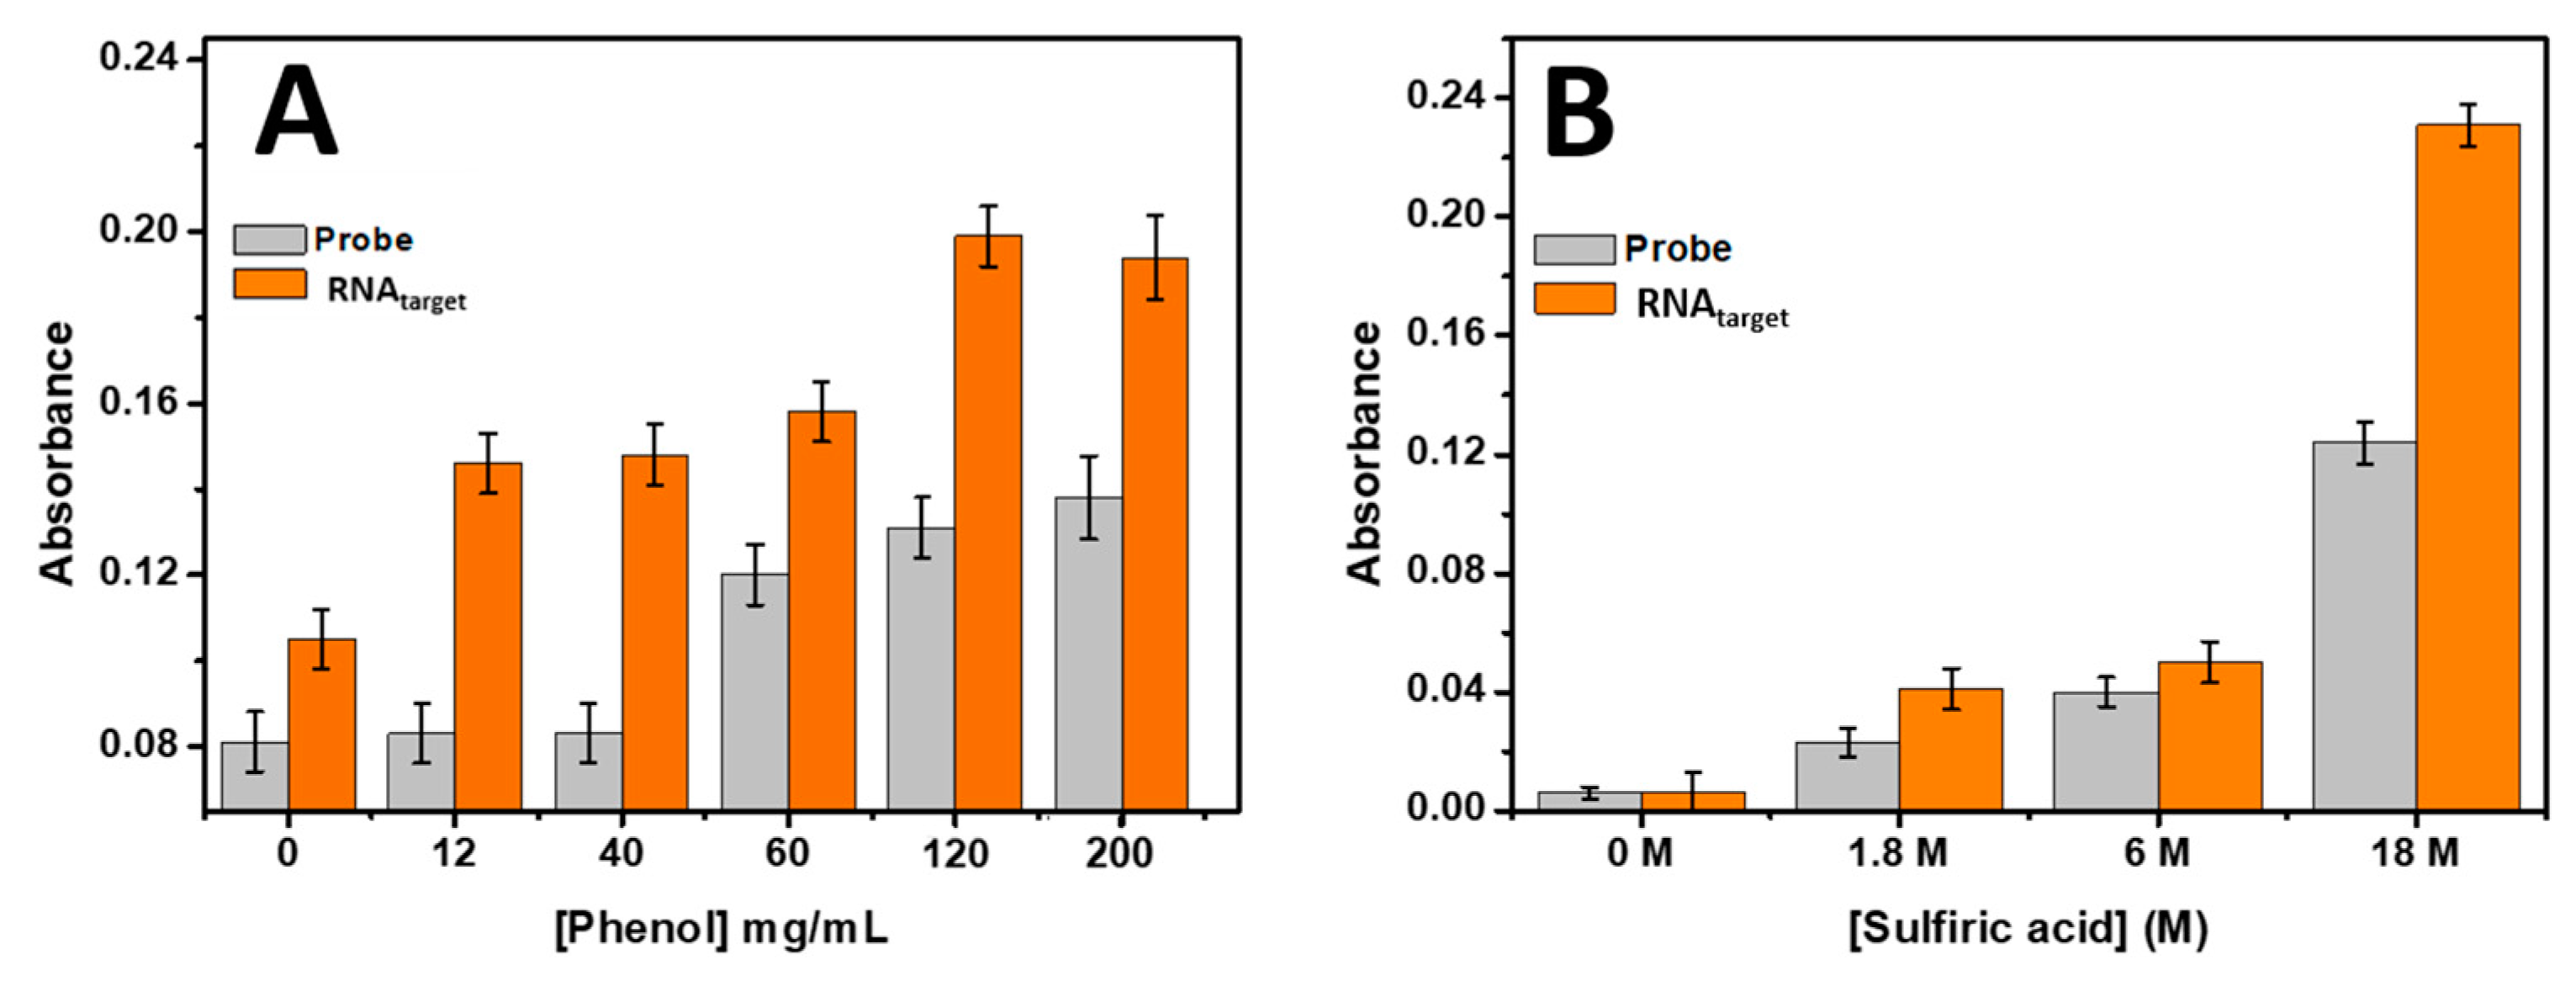
The optimization of reagent concentrations, specifically sulfuric acid and phenol, was conducted to determine the optimal conditions for detecting 0.5 µM of target RNA using the proposed biosensor. Various concentrations of phenol ranging from 0 to 200 mg/mL were tested in combination with concentrated sulfuric acid. The results, presented in
Figure 3A, revealed that the absorbance increased with the increase in phenol concentration, reaching a maximum at 120 mg/mL. Based on this finding, a phenol concentration of 120 mg/mL was chosen for subsequent experiments.
Furthermore, the concentration of sulfuric acid was also optimized by testing concentrated sulfuric acid, as well as dilutions of 3 times and 10 times, while keeping the phenol concentration fixed at 120 mg/mL for 0.5 µM of target RNA. The results (
Figure 3B) demonstrated that most concentrated sulfuric acid yielded the highest absorbance response in the developed biosensor. Therefore, concentrated sulfuric acid was selected as the optimal concentration for the rest of the study.
The optimization of both sulfuric acid and phenol concentrations ensures the maximum absorbance response in the biosensor, enhancing its sensitivity and accuracy for target RNA detection. These findings provide valuable insights into the selection of appropriate reagent concentrations to optimize the performance of the proposed biosensor.
3.4. Application of the developed DNA-based biosensor for DNA or RNA target Detection
3.4.1. Analytical performance
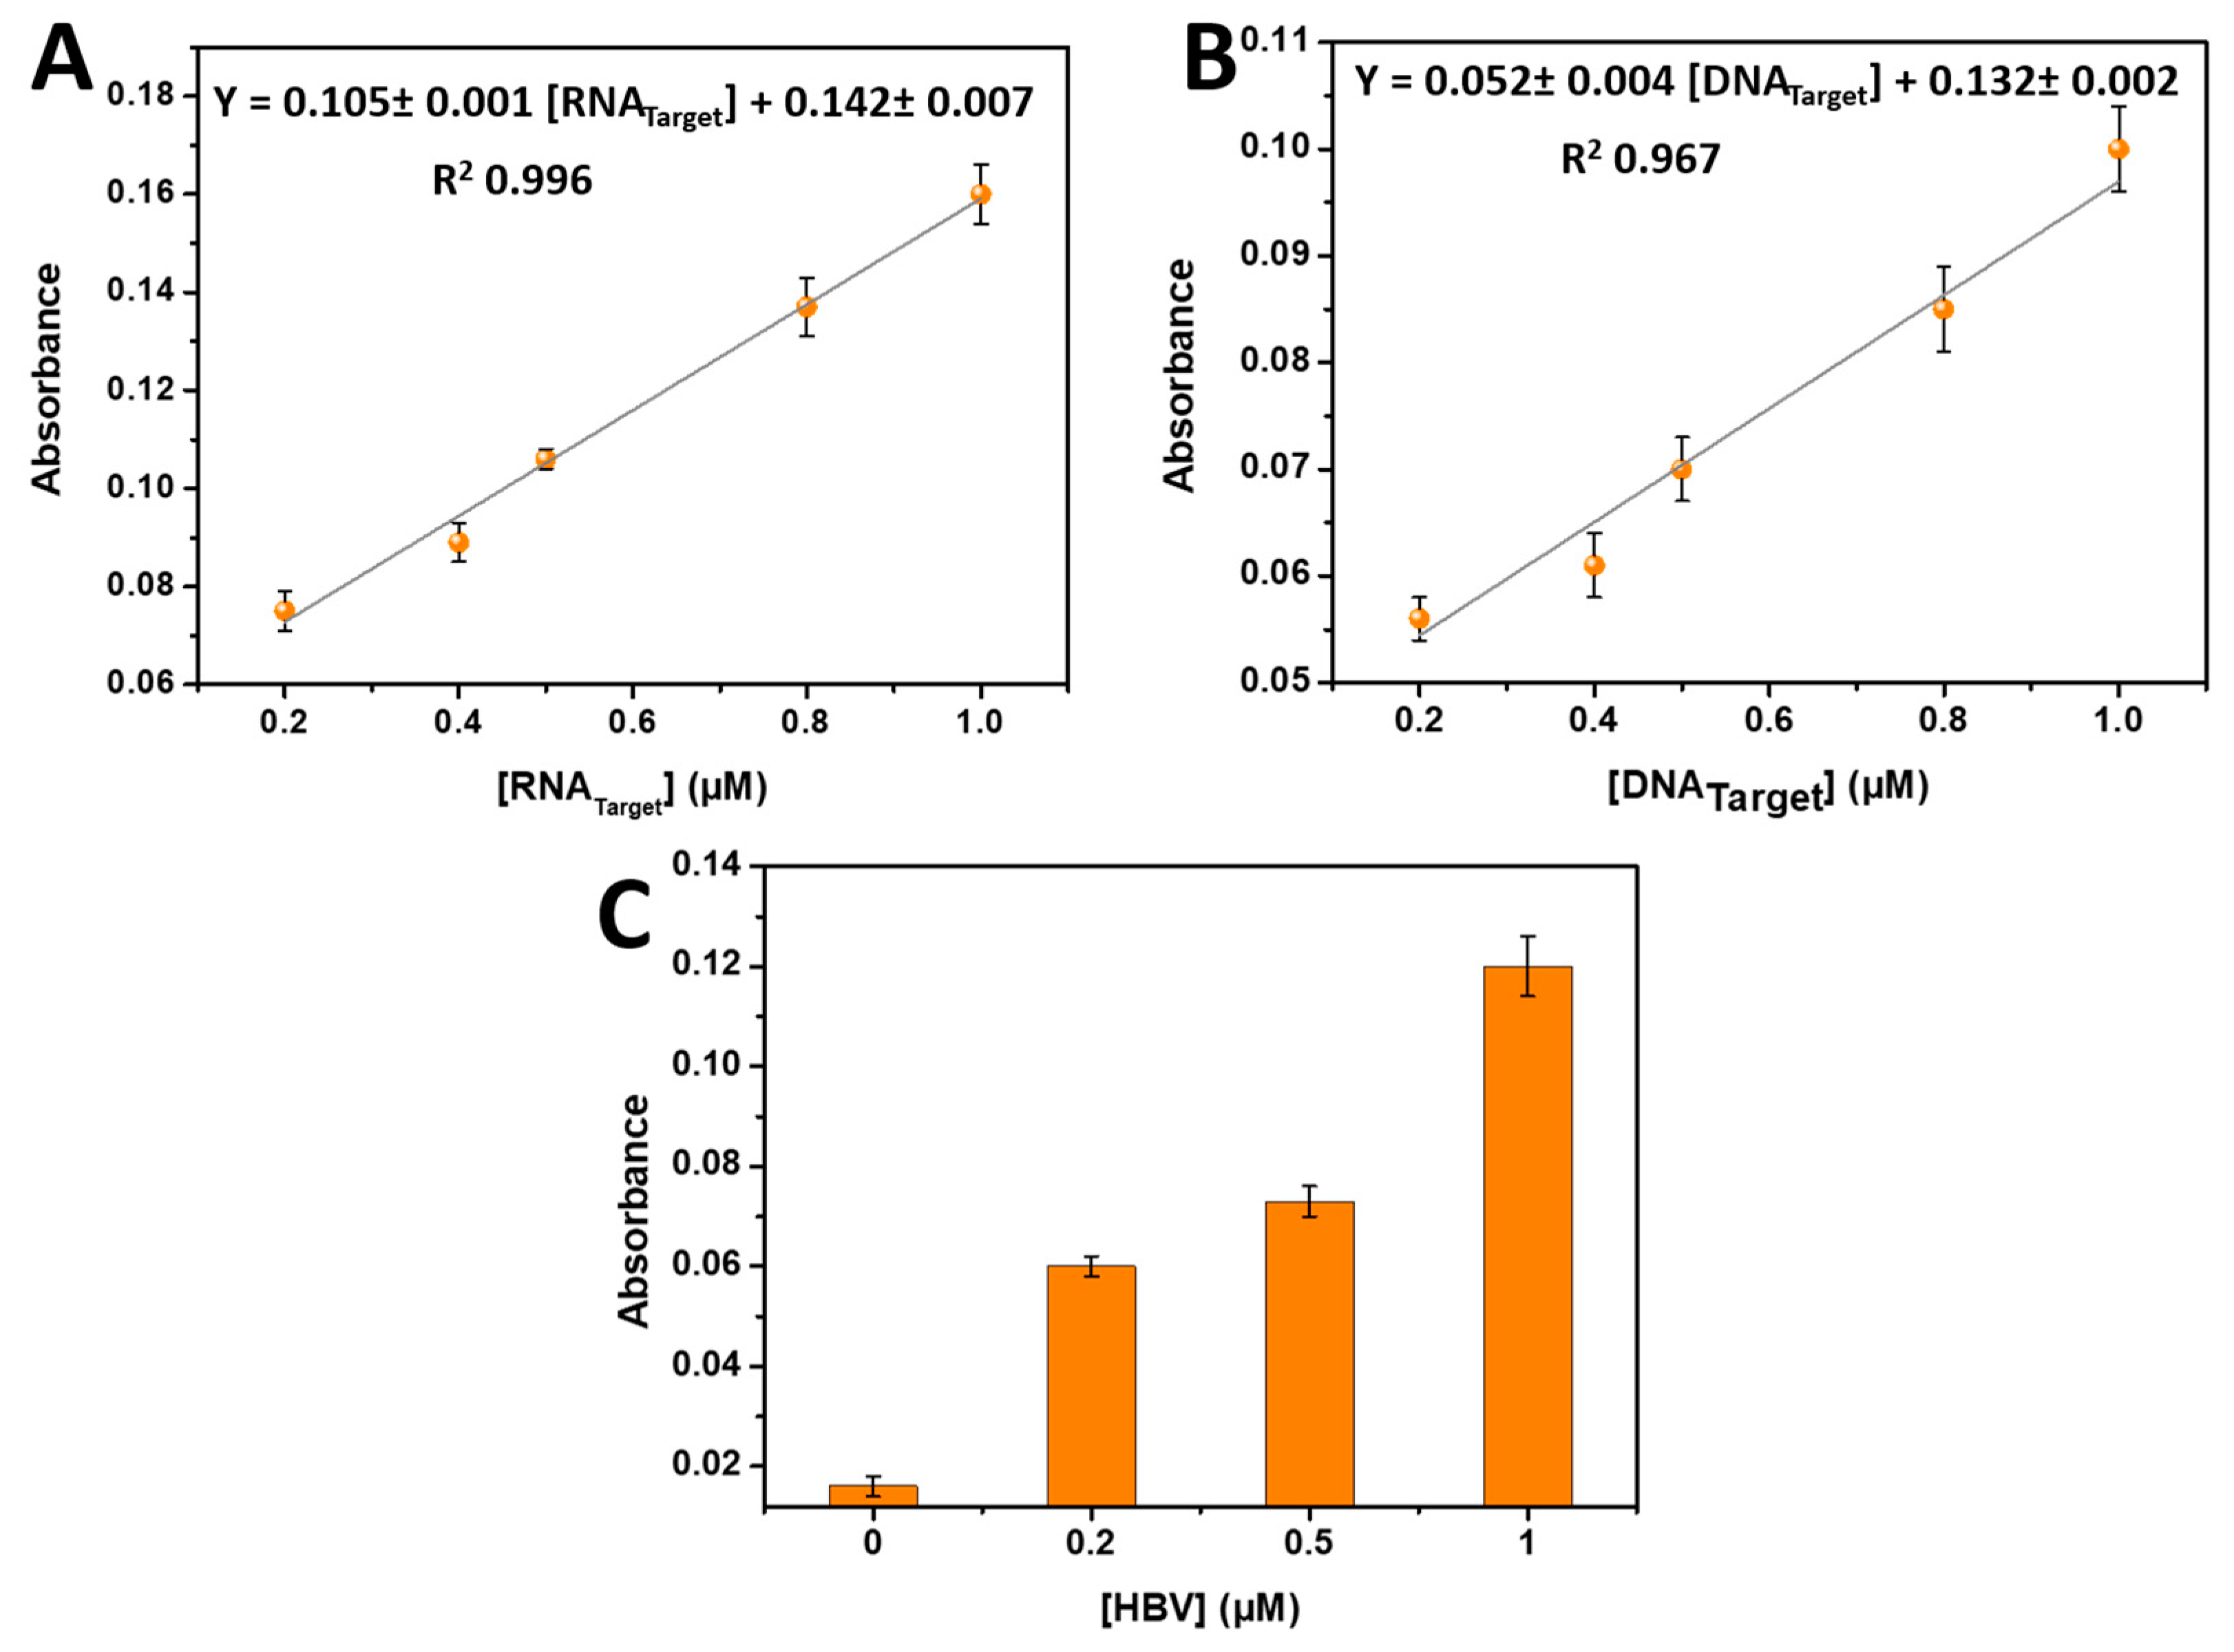
The analytical performance of the developed biosensor was evaluated under the optimized conditions. Different concentrations of target DNA or RNA were incubated in separate microplates and subjected to the proposed detection method, resulting in a visible color change. The color intensity gradually increased as the concentration of target DNA or RNA increased from 0.2 µM to 1 µM.
Figure 4A,B demonstrate that a linear relationship exists between the DNA target concentrations ranging from 0.2 µM to 1 µM and the RNA target concentrations ranging from 0.2 µM to 1 µM. This linear relationship confirms the quantitative nature of the biosensor's response to varying target concentrations. Moreover, the limit of detection (LOD) for RNA detection was estimated to be 0.17 µM, while the LOD for DNA detection was determined to be 0.2 µM at a signal-to-noise ratio of 3.
The linear regression equations were derived as follows: Y = 0.142 ±0.007 + 0.105 ±0.001 [RNATarget] (µM) with a correlation coefficient (R2) of 0.996 for RNA detection, and Y = 0.132 ±0.002 + 0.052 ±0.004 DNA target (µM) with an R2 value of 0.967 for DNA detection. These regression equations highlight the linear relationship between the biosensor's response and the concentrations of the target DNA or RNA.
Overall, the developed biosensor exhibits excellent analytical performance with a low limit of detection, and a strong correlation between target concentration and color intensity. The linear range obtained meets the concentration values of the extracted DNA or RNA from the well-established kits [
22]. These results demonstrate the potential of the biosensor for sensitive and accurate detection of target DNA or RNA in various applications. For that and as an application, the developed biosensor was tested with various concentrations of hepatitis B virus (HBV) as the DNA target. The DNA capture probe was immobilized on the microplate, and different concentrations of the HBV target (0, 0.2, 0.5, and 1 µM) were added. After the hybridization step, phenol and sulfuric acid were introduced to the wells, and the absorbance was measured at 490 nm. The results are presented in
Figure 4C, clearly indicating that the absorbance increased with higher HBV DNA target concentrations, confirming the successful application of the developed biosensor for HBV detection.
3.4.2. Selectivity
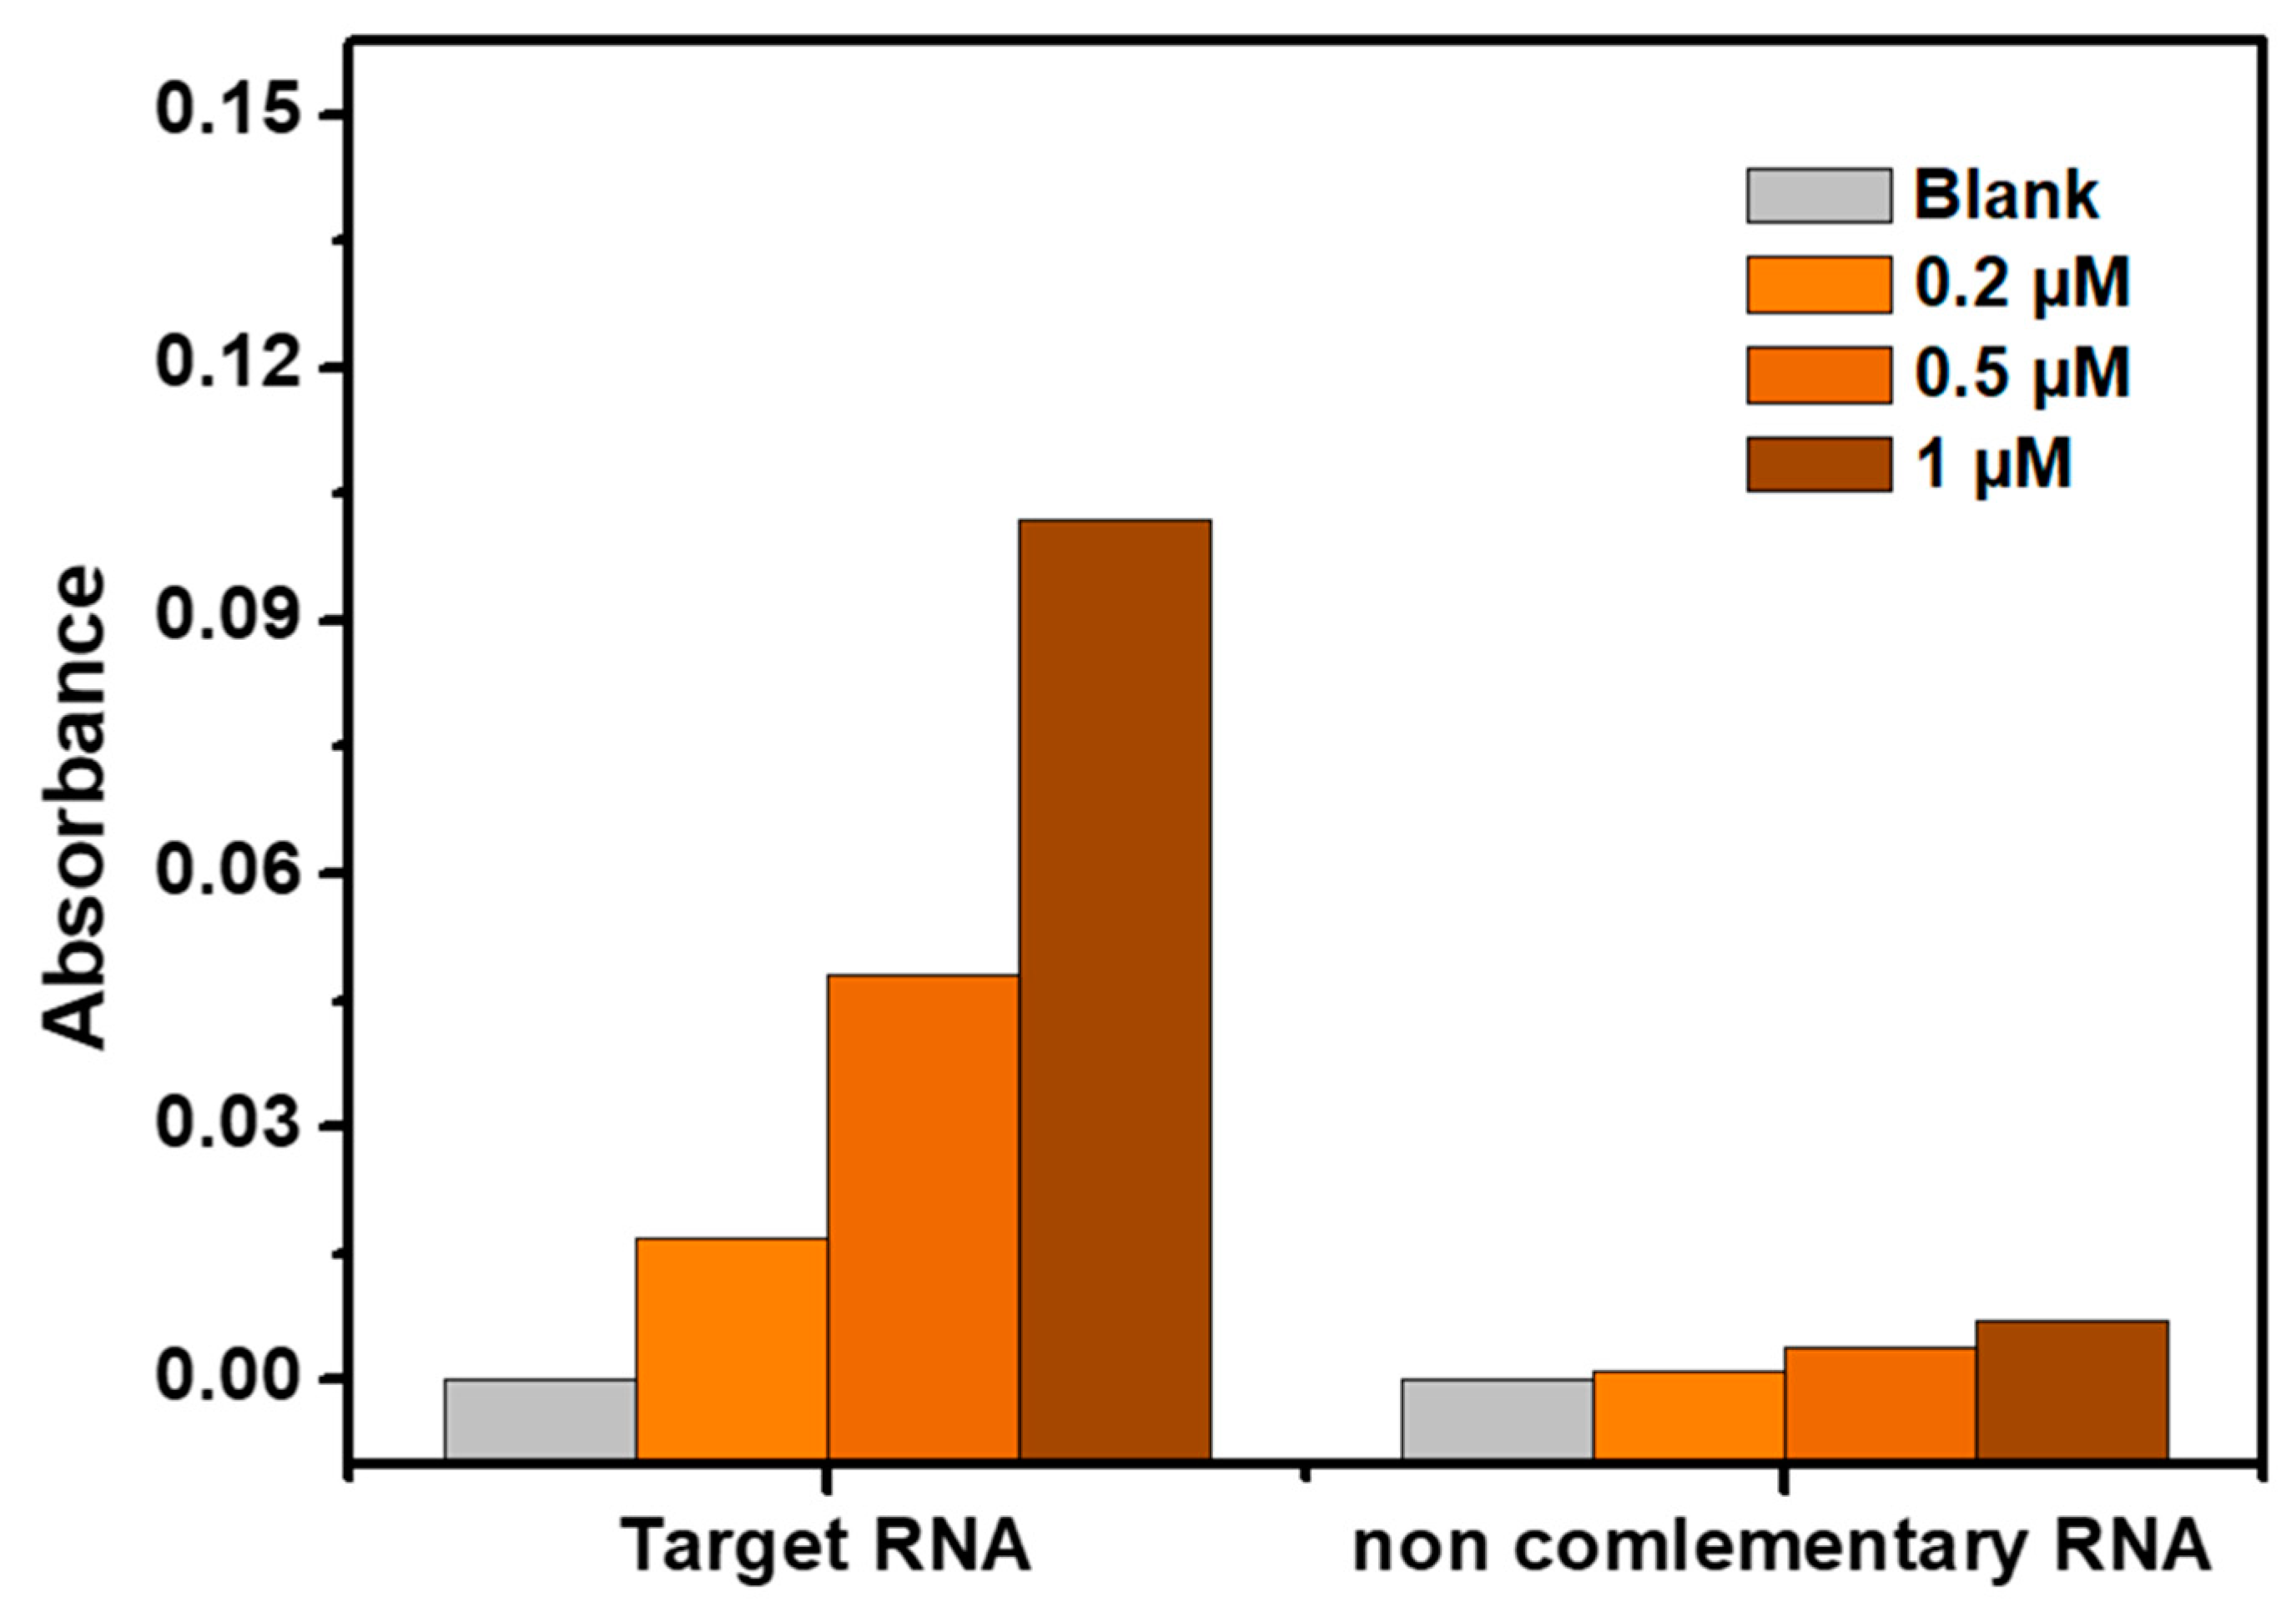
To assess the selectivity of the developed biosensor for RNA target detection, a selectivity test was conducted using a perfectly non-complementary target RNA at different concentrations (0, 0.2 µM, 0.5 µM, and 1 µM). The results, depicted in
Figure 5, clearly demonstrate that the absorbance of the colorimetric assay towards the perfectly matched target RNA was significantly stronger compared to the non-complementary target RNA at all concentrations. This observation highlights the high selectivity of the proposed method for RNA target detection. The sensitivity and selectivity combination of the biosensor make the proposed biosensor a promising tool for the quantitative detection of targets. Overall, the results of the selectivity study support the conclusion that the developed biosensor offers a sensitive, selective, and simple approach with a high quantitative capacity for the detection of RNA/DNA target sequences.
3.5. Application of the DNA-based biosensor developed for the detection of intercalating agents
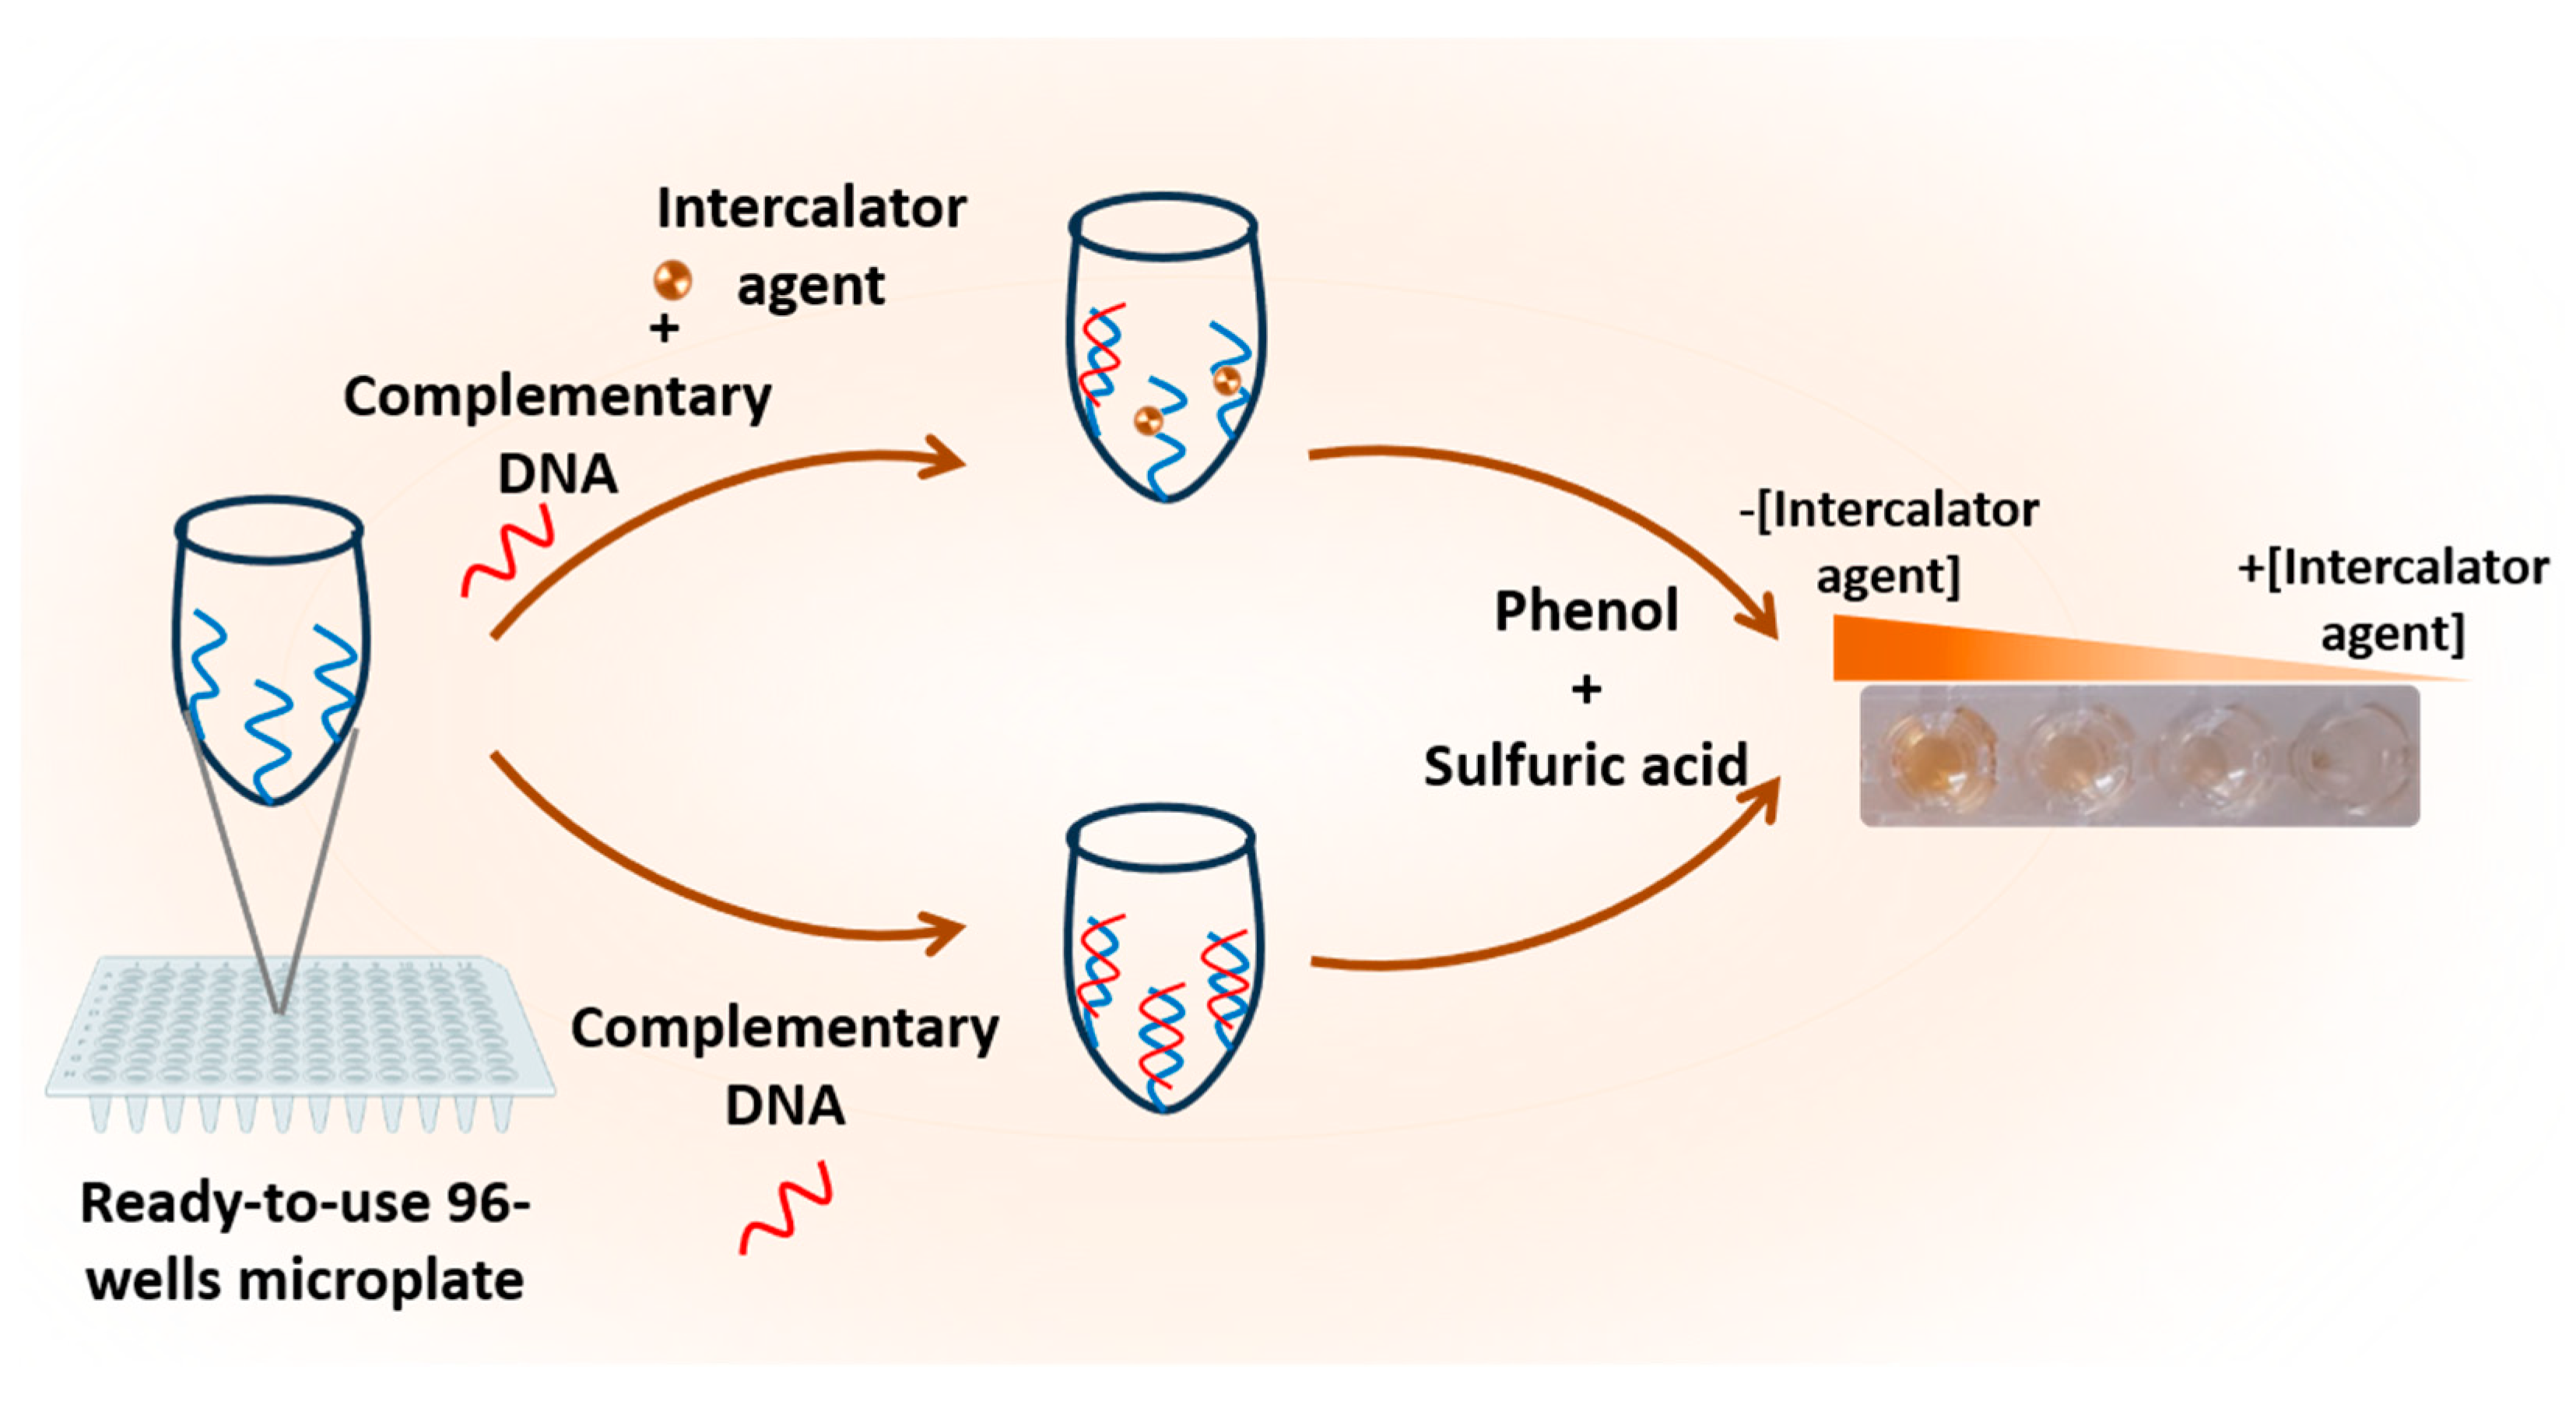
The versatility of the developed biosensor was further demonstrated by its application in detecting intercalating agents that hinder the hybridization of DNA complementary to the immobilized capture DNA on the 96-well microplate (
Scheme 2). To evaluate the inhibition of the hybridization step of the developed bio-assay for an intercalating agent detection, several intercalating agents were employed.
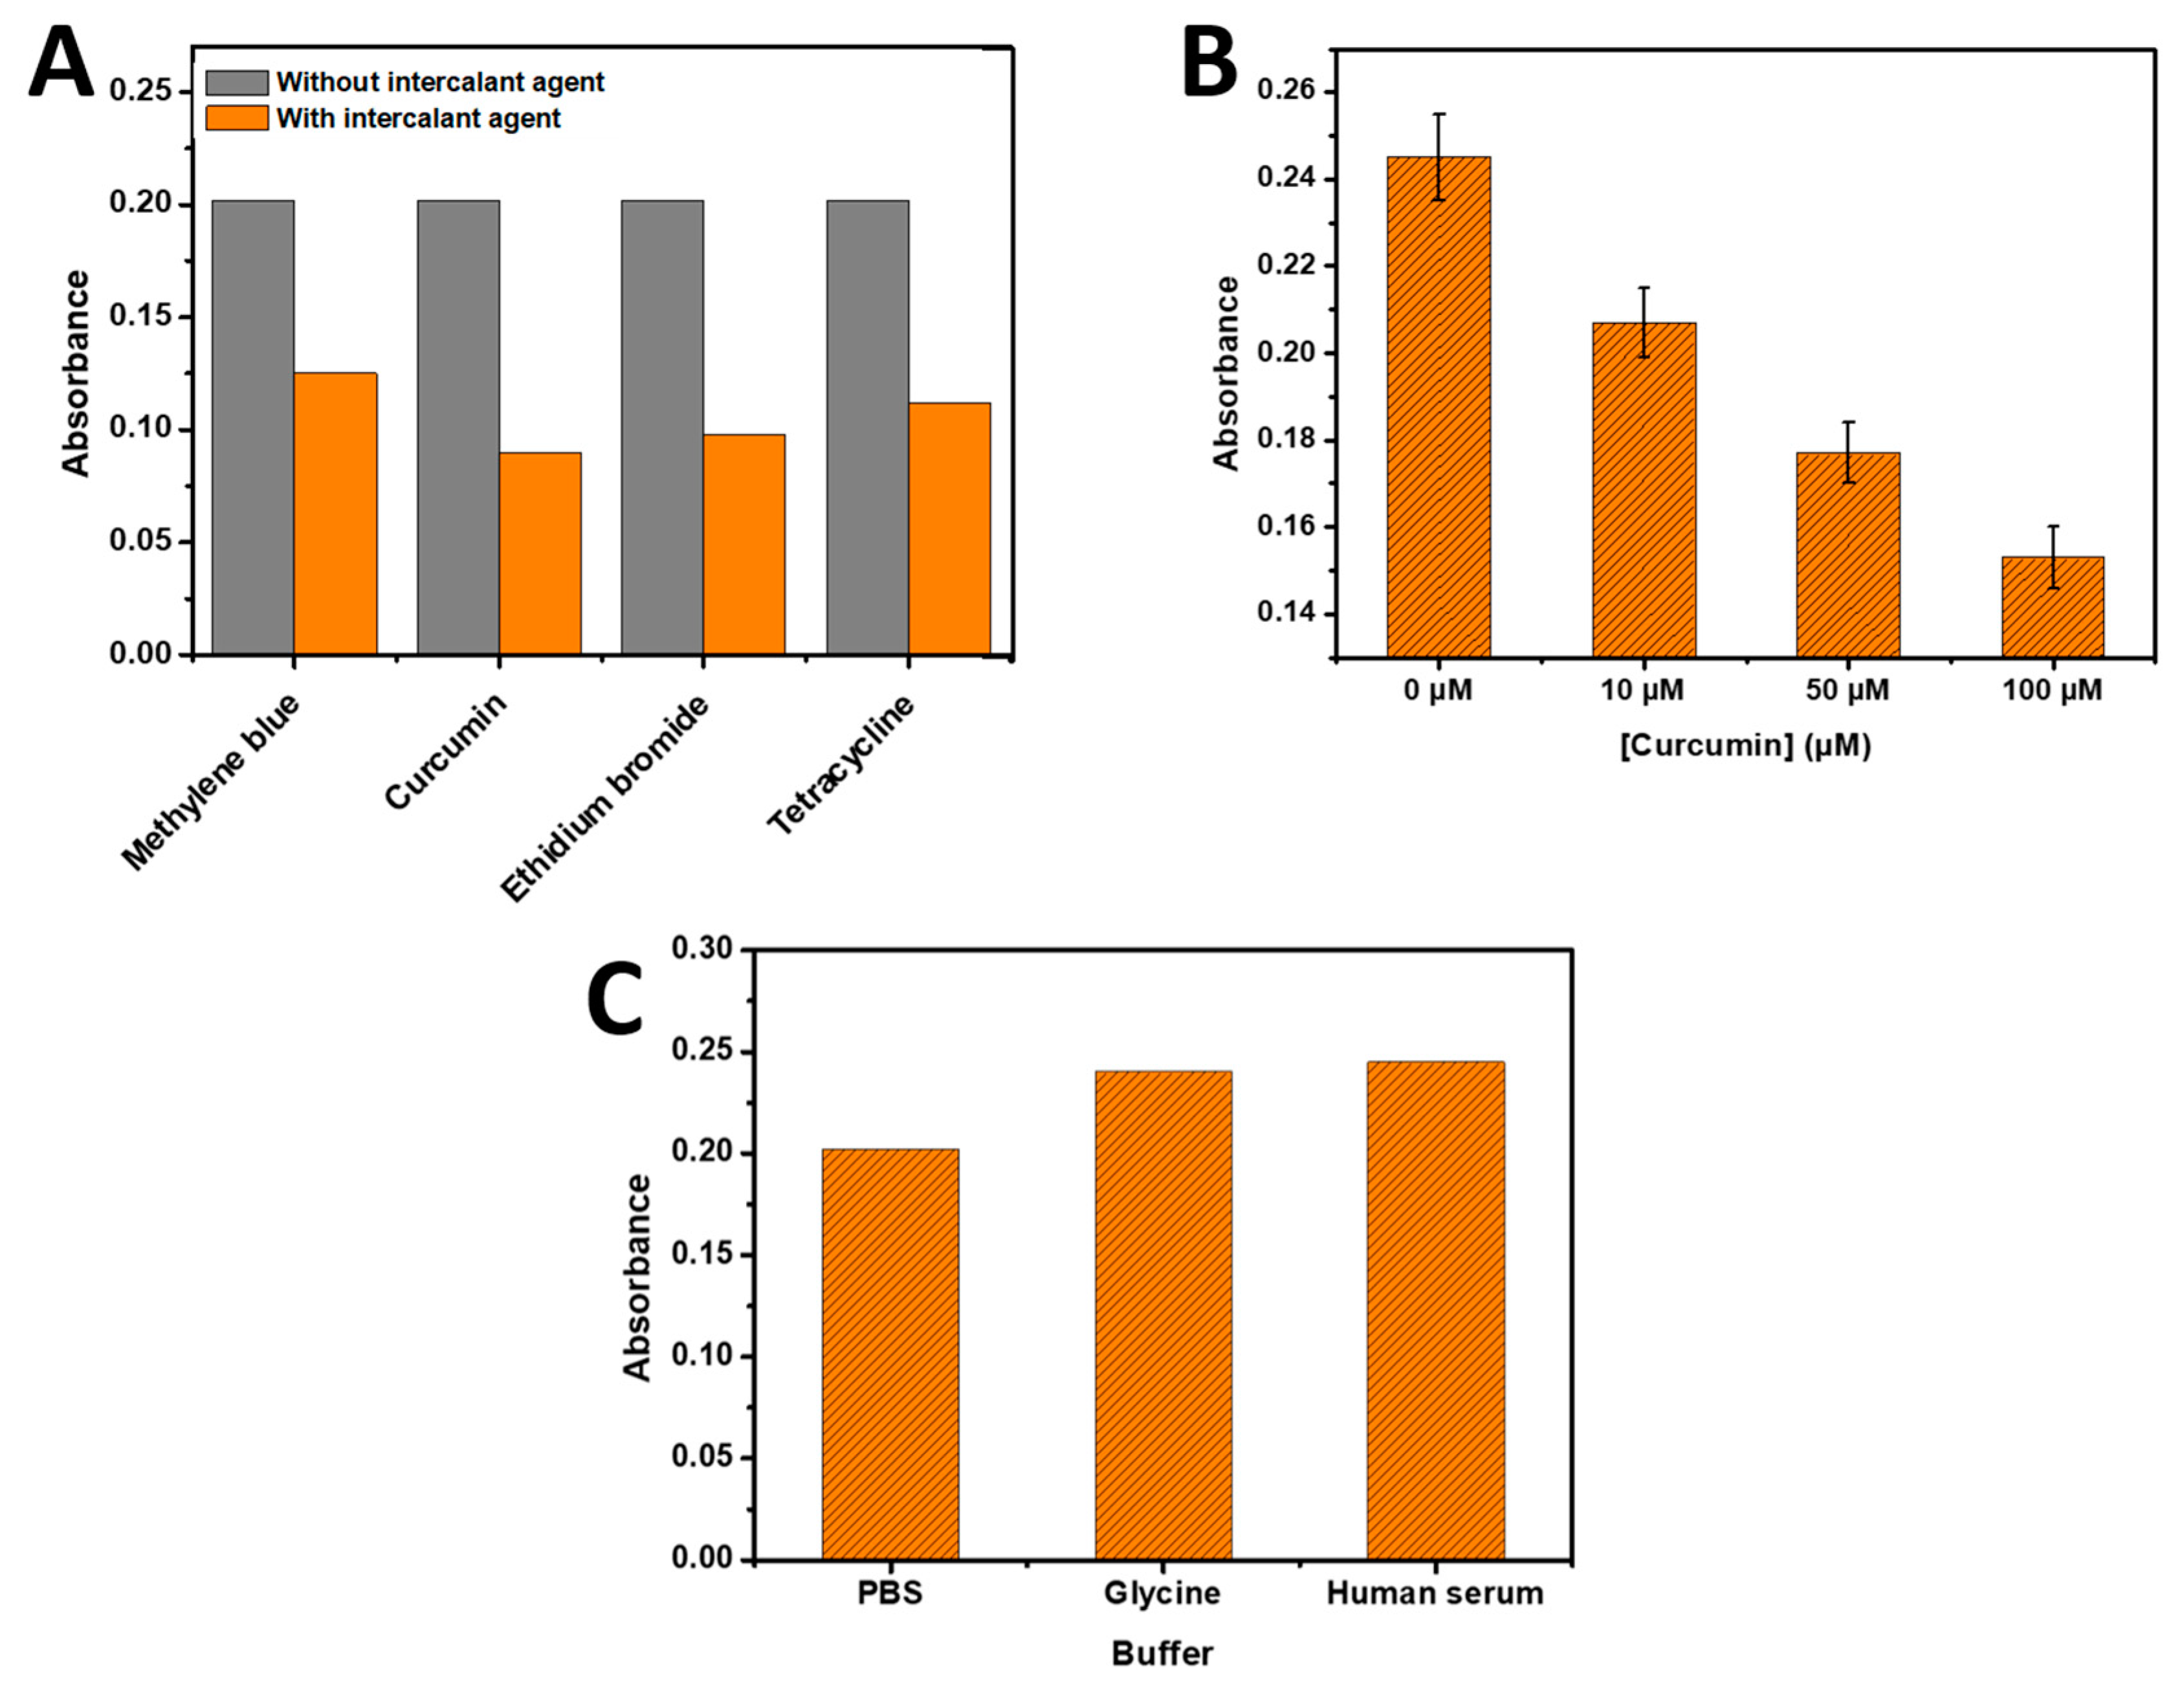
Figure 6A illustrates the results obtained with (100 µM) of methylene blue, curcumin, ethidium bromide, and tetracycline respectively, which were tested for their ability to inhibit the hybridization reaction (using 0.5 µM of complementary RNA) and subsequently measured by the developed bio-assay. All intercalating agents exhibited a decrease in absorbance upon their addition, indicating an inhibitory effect on the hybridization step. This decrease in signal can be attributed to the interference caused by the intercalating agents during the hybridization process. The curcumin and ethidium bromide showed the most inhibitor agent in the present bio-assay.
3.5.1. Application for Curcumin intercalating agent
The developed biosensor was also employed for the quantification of curcumin as the intercalant agent that inhibit the hybridization of DNA complementary to the immobilized capture DNA on the 96-microplate wells. Curcumin, a commonly used intercalant agent, was chosen for this application. Different concentrations of curcumin solution (10 µM, 50 µM, and 100 µM) were added simultaneously with the target DNA (0.5 µM), which resulted in an initial absorbance of 0.240. The presence of Curcumin hindered the hybridization process, leading to a decrease in the absorbance obtained from the developed method based on the phenol-sulfuric acid detection.
As illustrated in
Figure 6B, the absorbance gradually decreased with an increase in Curcumin concentration. This indicates that higher concentrations of Curcumin resulted in greater inhibition of the hybridization process between the DNA target and the immobilized capture DNA. The inhibitory effect of Curcumin on the hybridization process can be attributed to its intercalation between DNA base pairs, which disrupts the stability of the double-stranded DNA structure.
Furthermore, the hybridization step with 0.5 µM of target DNA was performed in glycine and commercial human serum. As shown in
Figure 6C, the resulting absorbance for both glycine and human serum was comparable to that obtained in the PBS buffer, suggesting the absence of intercalating agents in glycine and human serum that could hinder the hybridization step. This finding is supported by the technical specifications of the commercial human serum from Sigma Aldrich, which indicates the composition of the prepared human serum (210 mg/dl of cholesterol, 175 mg/dl of triglyceride, 140 mg/dl of glucose, 9.0 g/dl of total protein, and < 30 mg/dl of Hemoglobin)
The successful detection and quantification of intercalant agents using the developed biosensor highlight its versatility and potential applications in the field of DNA genosensor analysis. By incorporating intercalant agent detection into the biosensor platform, it becomes a valuable tool for studying the interactions between intercalant agents and DNA molecules, as well as for screening potential intercalators or investigating the effects of intercalation on DNA hybridization efficiency.
Overall, the results obtained in this study demonstrate the capability of the developed biosensor to evaluate the genotoxicity of the intercalant agents, offering a new avenue for applications in drug development, environmental monitoring, and genetic research.
4. Conclusions
In conclusion, the development of the biosensor utilizing the phenol-sulfuric acid reagent for sugar detection was successfully employed for the detection of DNA, RNA, as specific target and intercalator molecules thanks to the significant color intensity of the nucleoside produced under partial hydrolysis by sulfuric acid at room temperature. With its advantages of simplicity, cost-effectiveness, and potential for further optimization, the proposed biosensor paves the way to various applications in molecular diagnostics, genetic analysis, and drug discovery. The successful application of this biosensor to detect DNA, RNA, and intercalator molecules serves as a compelling proof of concept for its capabilities and effectiveness as a bioanalytical tool.
Supplementary Materials
The following supporting information can be downloaded at the website of this paper posted on Preprints.org, Table S1: Images of DNA fish sperm (1 mg/mL and 5 mg/mL) reacted with phenol - sulfuric acid after 0.5 min, 10 min, 20 min and 30 min of reaction incubation time.
Author Contributions
Conceptualization, EL AAMRI Maliana, KHALKI Yasmine, MOHAMMADI Hasna and AMINE Aziz; methodology, EL AAMRI Maliana, KHALKI Yasmine, MOHAMMADI Hasna and AMINE Aziz; software, EL AAMRI Maliana, KHALKI Yasmine; validation, MOHAMMADI Hasna and AMINE Aziz; formal analysis, EL AAMRI Maliana, KHALKI Yasmine; resources, MOHAMMADI Hasna and AMINE Aziz; writing—original draft preparation, EL AAMRI Maliana; writing—review and editing, MOHAMMADI Hasna and AMINE Aziz; supervision, MOHAMMADI Hasna and AMINE Aziz. All authors have read and agreed to the published version of the manuscript.”, Authorship must be limited to those who have contributed substantially to the work reported.
Acknowledgments
The authors acknowledge the bilateral collaboration program Morocco - Canada. Research Project (N° 327029)
Conflicts of Interest
The authors declare no conflict of interest.
References
- Masuko, T.; Minami, A.; Iwasaki, N.; Majima, T.; Nishimura, S.-I.; Lee, Y.C. Carbohydrate analysis by a phenol–sulfuric acid method in microplate format. Analytical biochemistry 2005, 339, 69–72. [Google Scholar] [CrossRef]
- Dubois, M.; Gilles, K.A.; Hamilton, J.K.; Rebers, P.A.; Smith, F. A colorimetric method for the determination of sugars. Nature 1951, 168, 167. [Google Scholar] [CrossRef] [PubMed]
- DuBois, M.; Gilles, K.A.; Hamilton, J.K.; Rebers, P.; Smith, F. Colorimetric method for determination of sugars and related substances. Analytical chemistry 1956, 28, 350–356. [Google Scholar] [CrossRef]
- Laurentin, A.; Edwards, C.A. A microtiter modification of the anthrone-sulfuric acid colorimetric assay for glucose-based carbohydrates. Analytical biochemistry 2003, 315, 143–145. [Google Scholar] [CrossRef] [PubMed]
- Irwin, M.; Leaver, A.G. Use of the orcinol-sulphuric acid reaction in the positive identification of certain monosaccharides from a salivary mucoid. Nature 1956, 177, 1126. [Google Scholar] [CrossRef] [PubMed]
- Monsigny, M.; Petit, C.; Roche, A.-C. Colorimetric determination of neutral sugars by a resorcinol sulfuric acid micromethod. Analytical biochemistry 1988, 175, 525–530. [Google Scholar] [CrossRef]
- Aamri, M.E.; Mohammadi, H.; Amine, A. Novel label-free colorimetric and electrochemical detection for MiRNA-21 based on the complexation of molybdate with phosphate. Microchemical Journal 2022, 182, 107851. [Google Scholar] [CrossRef]
- Aamri, M.E.; Mohammadi, H.; Amine, A. Paper-Based Colorimetric Detection of miRNA-21 Using Pre-Activated Nylon Membrane and Peroxidase-Mimetic Activity of Cysteamine-Capped Gold Nanoparticles. Biosensors 2023, 13, 74. [Google Scholar] [CrossRef] [PubMed]
- Moustakim, H.; Mohammadi, H.; Amine, A. Electrochemical DNA Biosensor Based on Immobilization of a Non-Modified ssDNA Using Phosphoramidate-Bonding Strategy and Pencil Graphite Electrode Modified with AuNPs/CB and Self-Assembled Cysteamine Monolayer. Sensors 2022, 22, 9420. [Google Scholar] [CrossRef] [PubMed]
- Mohammadi, H.; Amine, A. Spectrophotometric and electrochemical determination of MicroRNA-155 using sandwich hybridization magnetic beads. Analytical Letters 2018, 51, 411–423. [Google Scholar] [CrossRef]
- Yammouri, G.; Mohammadi, H.; Amine, A. A highly sensitive electrochemical biosensor based on carbon black and gold nanoparticles modified pencil graphite electrode for microRNA-21 detection. Chemistry Africa 2019, 2, 291–300. [Google Scholar] [CrossRef]
- Chahri, I.; Karrat, A.; Mohammadi, H.; Amine, A. Development of a New Route for the Immobilization of Unmodified Single-Stranded DNA on Chitosan Beads and Detection of Released Guanine after Hydrolysis. Molecules 2023, 28, 2088. [Google Scholar] [CrossRef] [PubMed]
- Alexandre, I.; Hamels, S.; Dufour, S.; Collet, J.; Zammatteo, N.; De Longueville, F.; Gala, J.-L.; Remacle, J. Colorimetric silver detection of DNA microarrays. Analytical Biochemistry 2001, 295, 1–8. [Google Scholar] [CrossRef]
- Jazayeri, M.H.; Aghaie, T.; Avan, A.; Vatankhah, A.; Ghaffari, M.R.S. Colorimetric detection based on gold nano particles (GNPs): An easy, fast, inexpensive, low-cost and short time method in detection of analytes (protein, DNA, and ion). Sensing and bio-sensing research 2018, 20, 1–8. [Google Scholar] [CrossRef]
- Xu, X.; Daniel, W.L.; Wei, W.; Mirkin, C.A. Colorimetric Cu2+ detection using DNA-modified gold-nanoparticle aggregates as probes and click chemistry. Small 2010, 6, 623–626. [Google Scholar] [CrossRef]
- Trinh, K.H.; Kadam, U.S.; Rampogu, S.; Cho, Y.; Yang, K.-A.; Kang, C.H.; Lee, K.-W.; Lee, K.O.; Chung, W.S.; Hong, J.C. Development of novel fluorescence-based and label-free noncanonical G4-quadruplex-like DNA biosensor for facile, specific, and ultrasensitive detection of fipronil. Journal of Hazardous Materials 2022, 427, 127939. [Google Scholar] [CrossRef]
- Lucarelli, F.; Palchetti, I.; Marrazza, G.; Mascini, M. Electrochemical DNA biosensor as a screening tool for the detection of toxicants in water and wastewater samples. Talanta 2002, 56, 949–957. [Google Scholar] [CrossRef]
- Radhakrishnan, K.; Kumar, P.S. Target-receptive structural switching of ssDNA as selective and sensitive biosensor for subsequent detection of toxic Pb2+ and organophosphorus pesticide. Chemosphere 2022, 287, 132163. [Google Scholar] [CrossRef]
- Shen, L.; Wang, P.; Ke, Y. DNA nanotechnology-based biosensors and therapeutics. Advanced healthcare materials 2021, 10, 2002205. [Google Scholar] [CrossRef]
- Nielsen, S.S. Phenol-sulfuric acid method for total carbohydrates. Food analysis laboratory manual 2010, 47–53. [Google Scholar]
- Yue, F.; Zhang, J.; Xu, J.; Niu, T.; Lü, X.; Liu, M. Effects of monosaccharide composition on quantitative analysis of total sugar content by phenol-sulfuric acid method. Frontiers in nutrition 2022, 9, 963318. [Google Scholar] [CrossRef] [PubMed]
- Wright, K.; de Silva, K.; Purdie, A.C.; Plain, K.M. Comparison of methods for miRNA isolation and quantification from ovine plasma. Sci Rep 2020, 10, 825. [Google Scholar] [CrossRef] [PubMed]
Scheme 1.
Illustration of the colorimetric biosensor based on the phenol-sulfuric acid reaction for DNA or RNA detection.
Scheme 1.
Illustration of the colorimetric biosensor based on the phenol-sulfuric acid reaction for DNA or RNA detection.
Figure 1.
(A) Image of the yellow-orange produced color from the phenol-sulfuric acid reaction with (10 mg/mL) ribose, glucose and fructose; (B) Product absorbance of phenol-sulfuric acid reaction with (10 mg/mL) ribose, glucose and fructose measured at 490 nm. (C) Absorbance of DNA fish sperm (1 mg/mL and 5 mg/mL) reacted with phenol - sulfuric acid at different incubation times (0.5 min, 10 min, 20 min, and 30 min) measured at 490 nm. (D) Absorbance histograms of DNA components (Phosphate, Ribose, Thymine, Uracil, Adenine, Guanine, and Guanosine) and ATP using the phenol-sulfuric acid method at 490 nm. Error bars were obtained from three parallel experiments.
Figure 2.
(A) Absorbance histograms of immobilized DNAProbe at various concentrations (0 µM, 1 µM, 10 µM, and 100 µM) using the phenol-sulfuric acid reaction on a 96-well microplate at 490 nm. (B) Kinetics curves of the detection step on the phenol – sulfuric acid reaction based developed biosensor in the absence and presence of the target sequence. The absorbance was measured at 490 nm. Error bars were obtained from three parallel experiments.
Figure 3.
Optimization of (A) phenol concentration (from 0 to 200 mg/mL) and (B) sulfuric acid concentration (from 0 to 18 M) induced in the reaction of phenol – sulfuric acid. The absorbance was measured at 490 nm. Error bars were obtained from three parallel experiments.
Figure 3.
Optimization of (A) phenol concentration (from 0 to 200 mg/mL) and (B) sulfuric acid concentration (from 0 to 18 M) induced in the reaction of phenol – sulfuric acid. The absorbance was measured at 490 nm. Error bars were obtained from three parallel experiments.
Figure 4.
(A) Calibration plots of absorbance values measured at 490 nm against different microRNA-21 target concentrations ranging from 0.2 µM to 1 µM. (B) Calibration plots of absorbance values measured at 490 nm as a function of different concentrations of DNA target from 0.2 µM to 1 µM. (C) Application of the developed biosensor for 0, 0.2, 0.5, and 1 µM of HBV. Three parallel experiments yielded error bars.
Figure 5.
Selectivity study of the developed phenol – sulfuric acid-based biosensor toward 0, 0.2, 0.5 and 1 µM of noncomplementary RNA target.
Figure 5.
Selectivity study of the developed phenol – sulfuric acid-based biosensor toward 0, 0.2, 0.5 and 1 µM of noncomplementary RNA target.
Scheme 2.
Illustration of the colorimetric biosensor based on the phenol-sulfuric acid reaction for intercalator agent detection.
Scheme 2.
Illustration of the colorimetric biosensor based on the phenol-sulfuric acid reaction for intercalator agent detection.
Figure 6.
(A) Absorbance histograms of phenol-sulfuric acid-based developed bio-assay in the absence and presence of 100 µM of various intercalating agent (Methylene blue, curcumin, ethidium bromide and tetracycline) at 490 nm. (B) Absorbance histograms of various curcumin concentration (0, 10, 50, and 100 µM) tested in the developed bio-assay. Three parallel experiments yielded error bars. (C) Absorbance histograms of phenol-sulfuric acid developed biosensor with 0.5 µM of target DNA in different buffer.
Table 1.
Nucleic acids employed in the present work.
Table 1.
Nucleic acids employed in the present work.
| Nucleic acid |
Sequence (5’-3’) |
| Target microRNA-21 |
5′-UAGCUUAUCAGACUGAUGUUGA-3′ |
| DNAprobe (complementary sequence of microRNA-21) |
5′-AAATCAACATCAGTCTGATAAGCTA-3′ |
| Target DNA (E.coli) |
5’-TATTAACTTTACTCCCTTCCTCCCCGCTGA -3’ |
| DNAprobe (complementary sequence of DNAE.coli) |
5’-TCAGCGGGGAGGAAGGGAGTAAAGTTAATA-3’ |
| MicroRNA-155 (non-complementary oligonucleotide) |
5’-UUAAUGCUAAUCGUGAUAGGGGUU-3’ |
| Target DNA (Hepatitis B virus HBV) |
5'- GTGTCTGCGGCGTTTTATCATCTTC -3' |
| DNAprobe (complementary sequence of DNAHBV) |
5’-TGATAAAACGCCGCAGACAC-3’ |
|
Disclaimer/Publisher’s Note: The statements, opinions and data contained in all publications are solely those of the individual author(s) and contributor(s) and not of MDPI and/or the editor(s). MDPI and/or the editor(s) disclaim responsibility for any injury to people or property resulting from any ideas, methods, instructions or products referred to in the content. |
© 2023 by the authors. Licensee MDPI, Basel, Switzerland. This article is an open access article distributed under the terms and conditions of the Creative Commons Attribution (CC BY) license (http://creativecommons.org/licenses/by/4.0/).

