Submitted:
03 August 2023
Posted:
07 August 2023
You are already at the latest version
Abstract
Keywords:
1. Introduction
2. Materials and Methods
2.1. Animals
2.2. Experimental Protocols
2.3. Neurological Test
2.4. Novel Object Recognition (NOR) Test
2.5. RNA-Sequencing and Data Analysis
2.6. Real-Time PCR (RT-PCR)
2.7. Immunofluorescence Assay
2.8. Western Blot
2.9. Statistical Analysis
3. Results
3.1. Ecute Effects of LPS on Striatum and Hippocampus
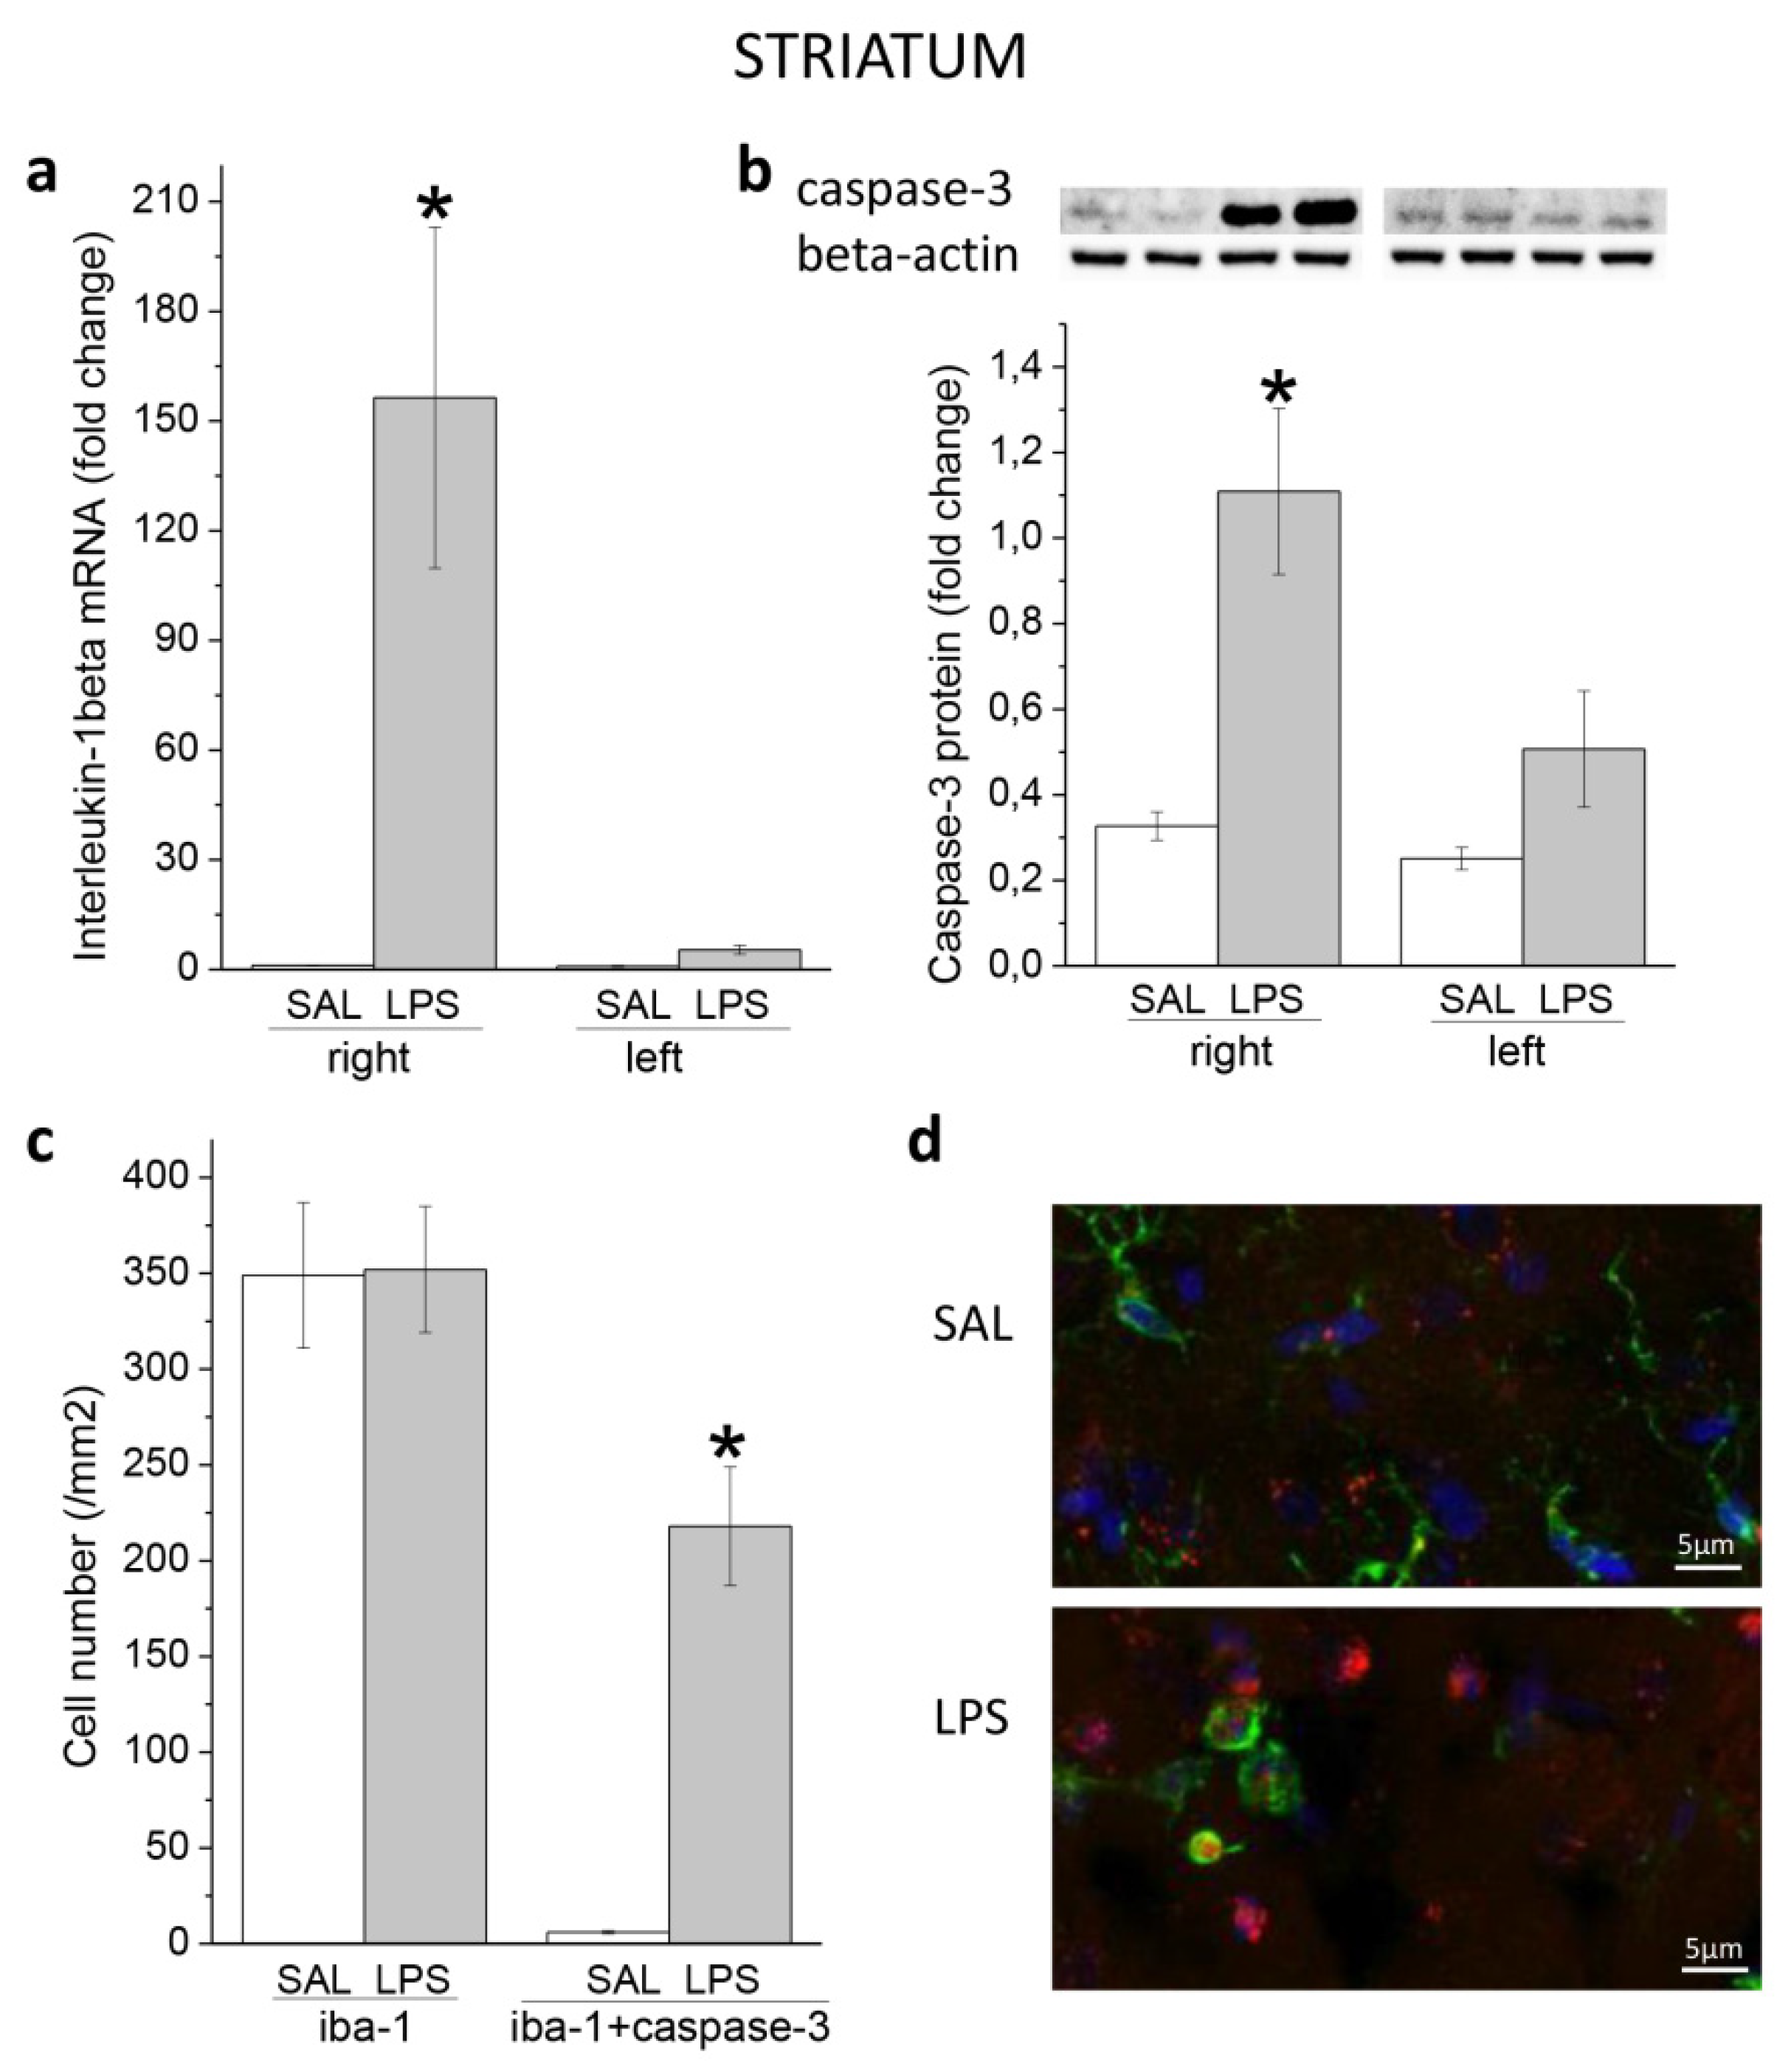
3.1.1. Striatum
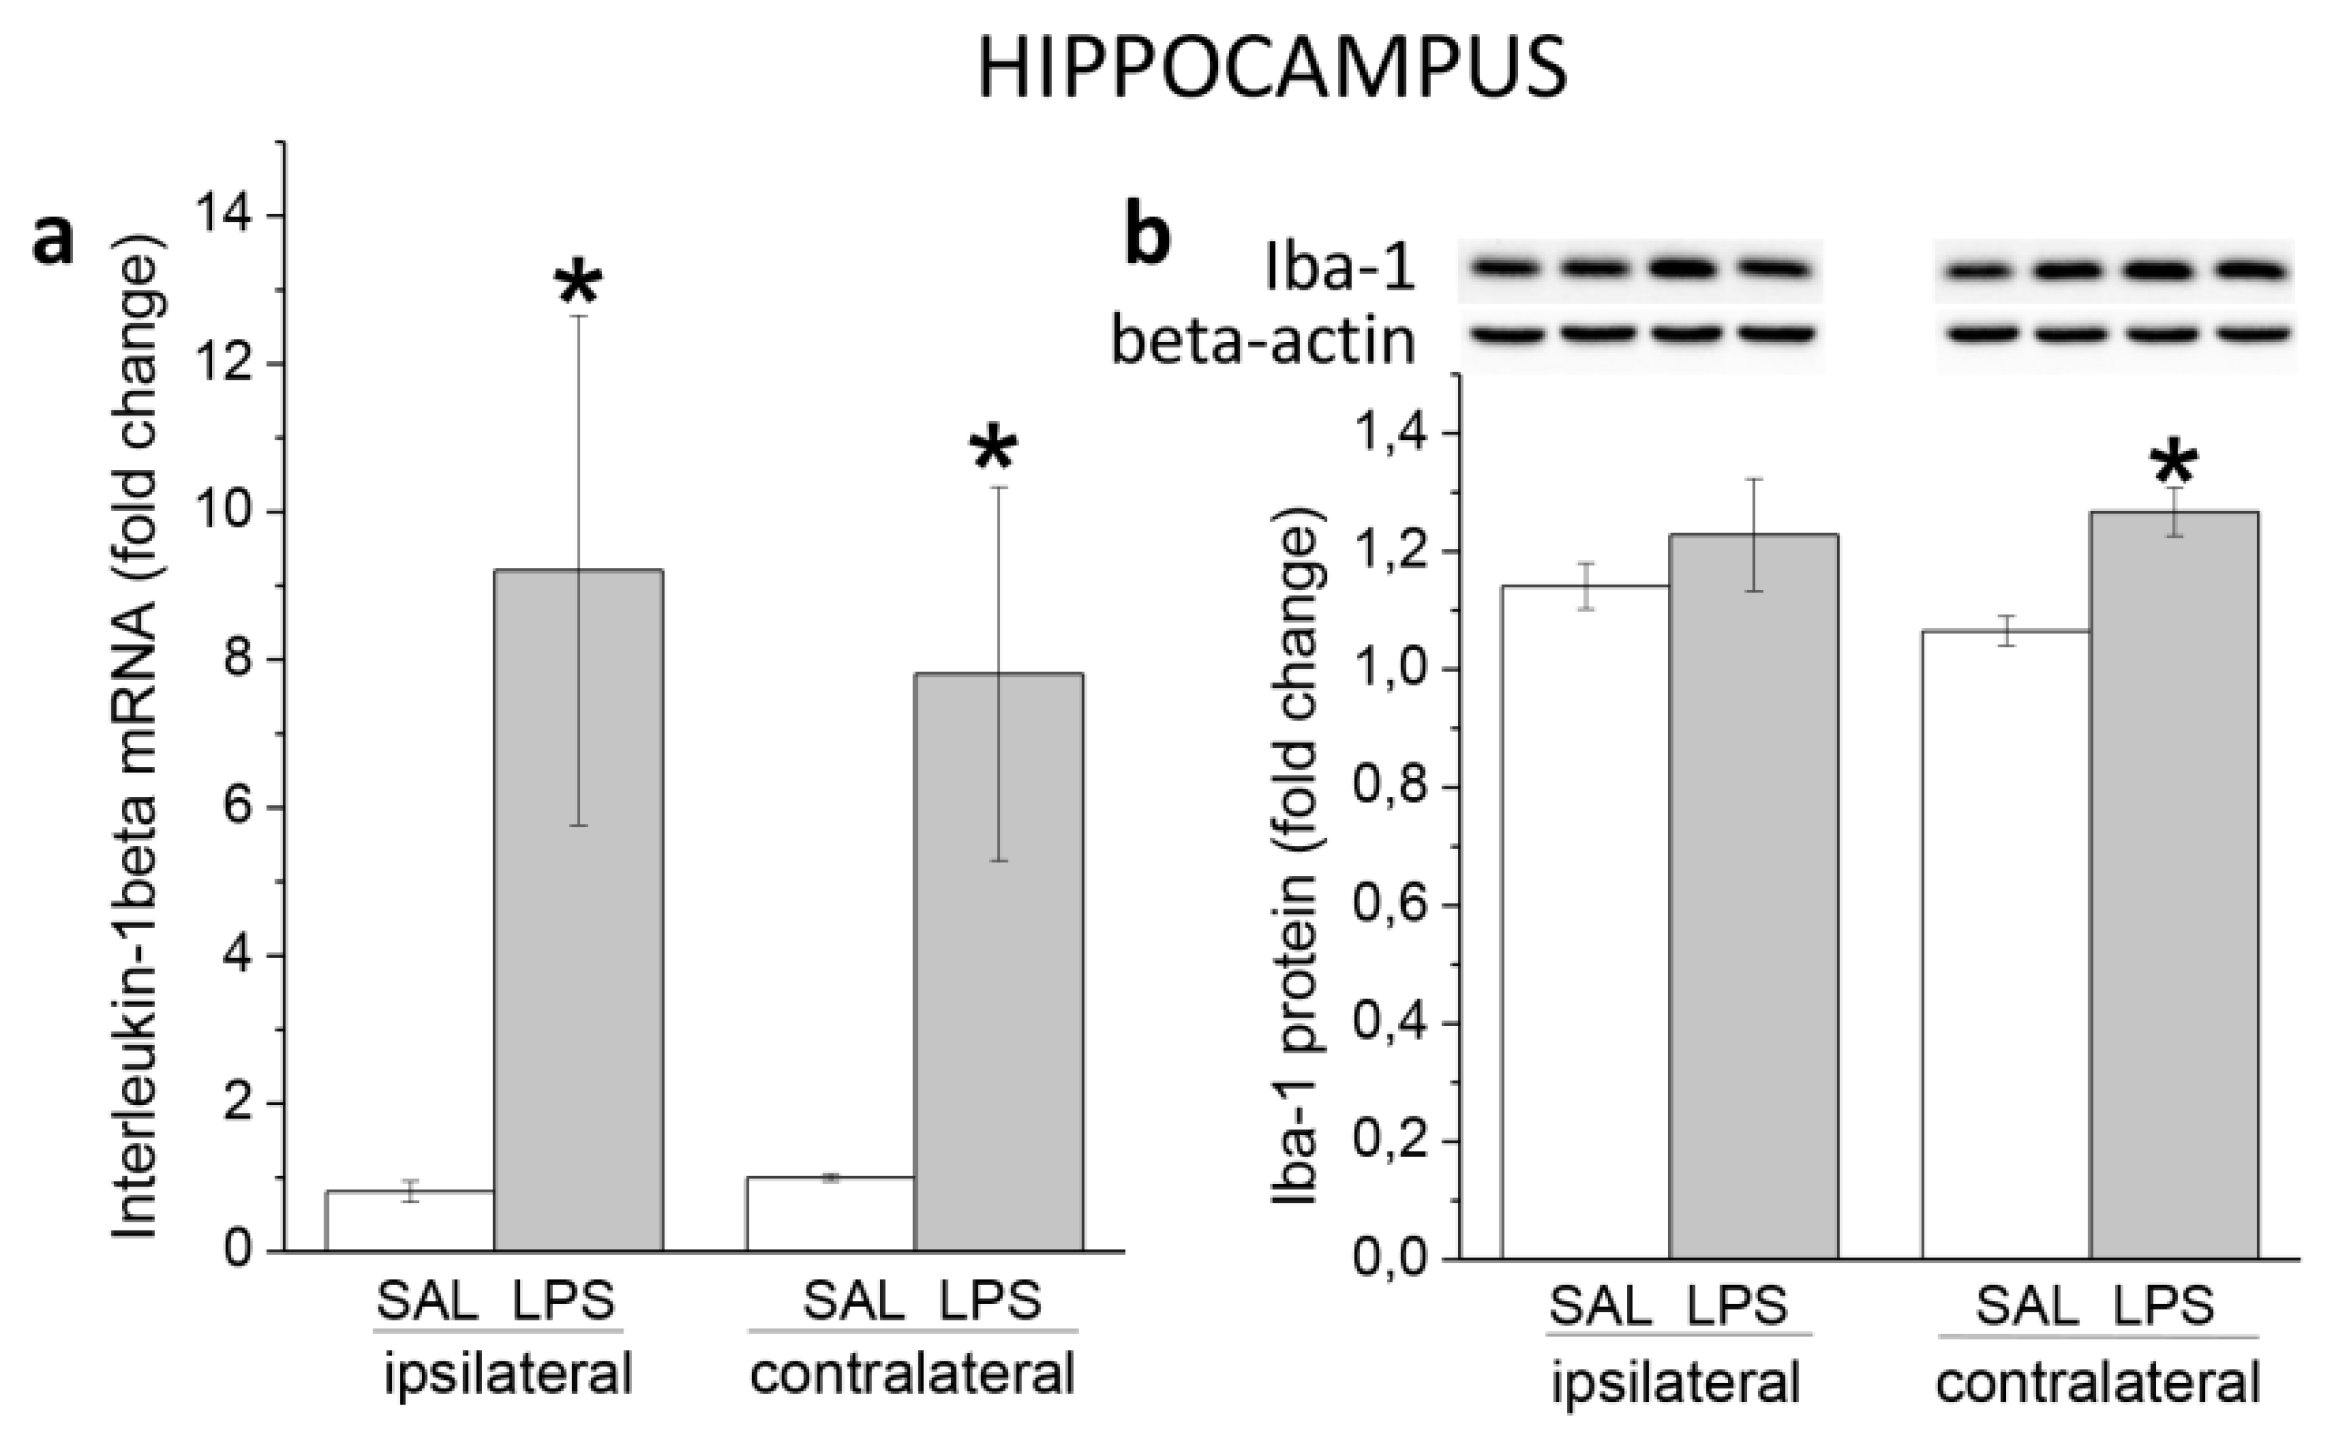
3.1.2. Hippocampus
3.2. Behavioral Effects of Intra-Striatal LPS and Pretreatment with DEX at 24 h and 3 Months
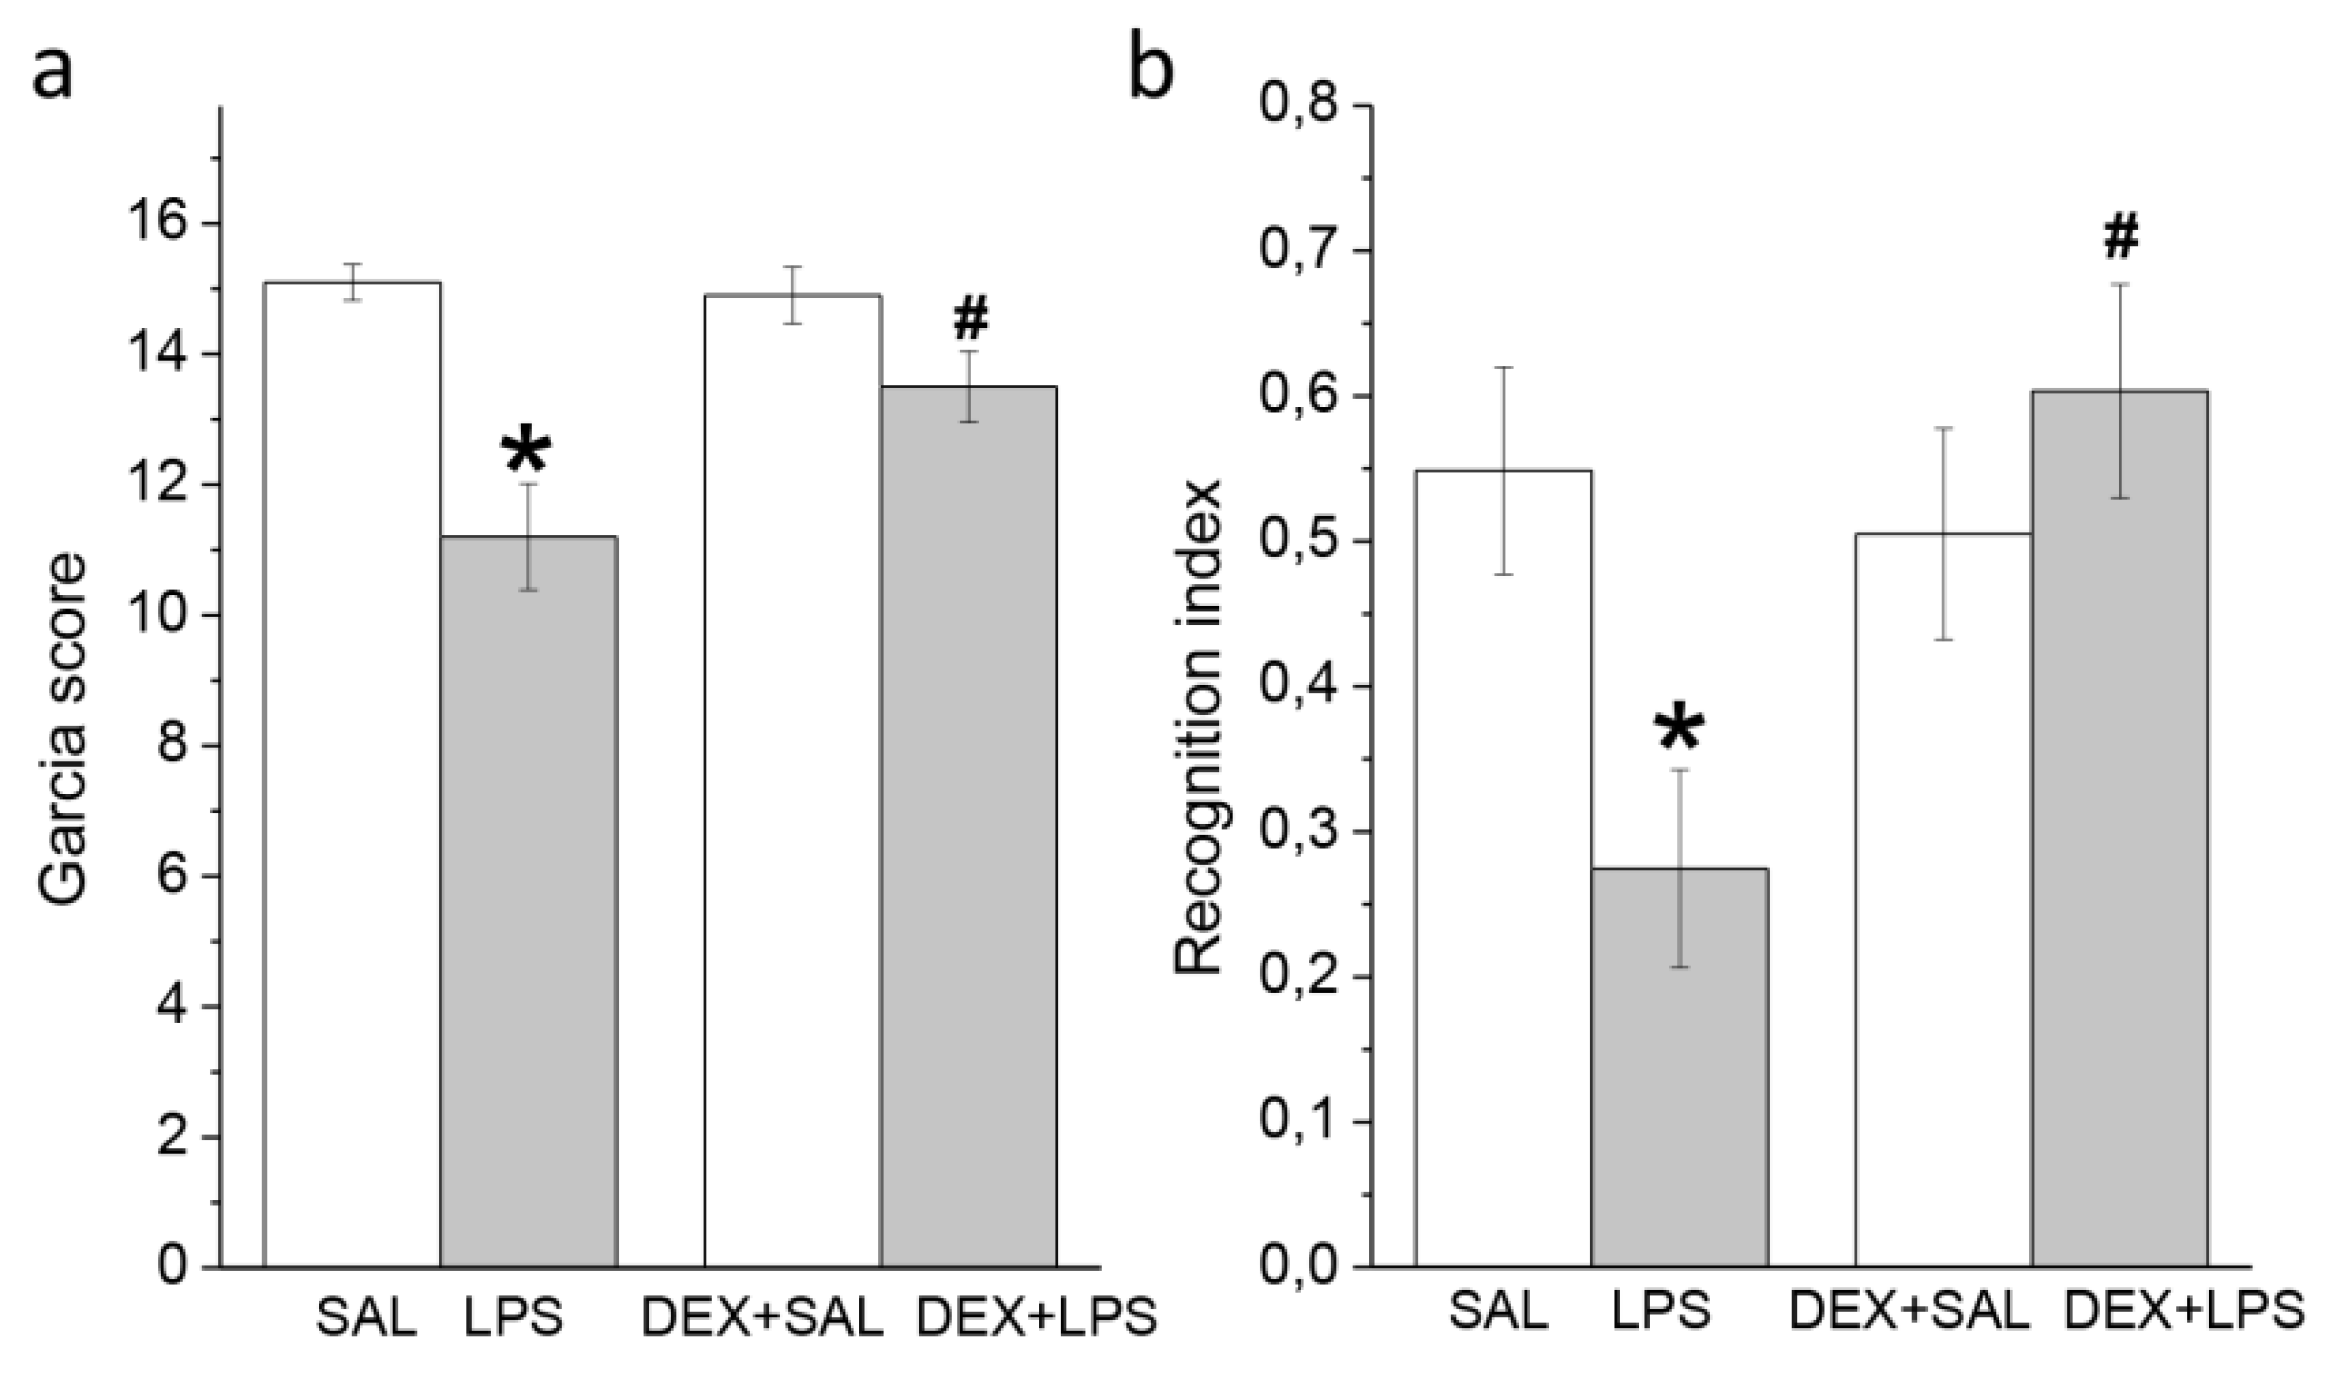
3.2.1. A Single Pretreatment with DEX Attenuated the Acute LPS-Induced Neurological Deficit
3.2.2. A Single Pretreatment with DEX Prevented LPS-Induced Long-Lasting Memory Impairment
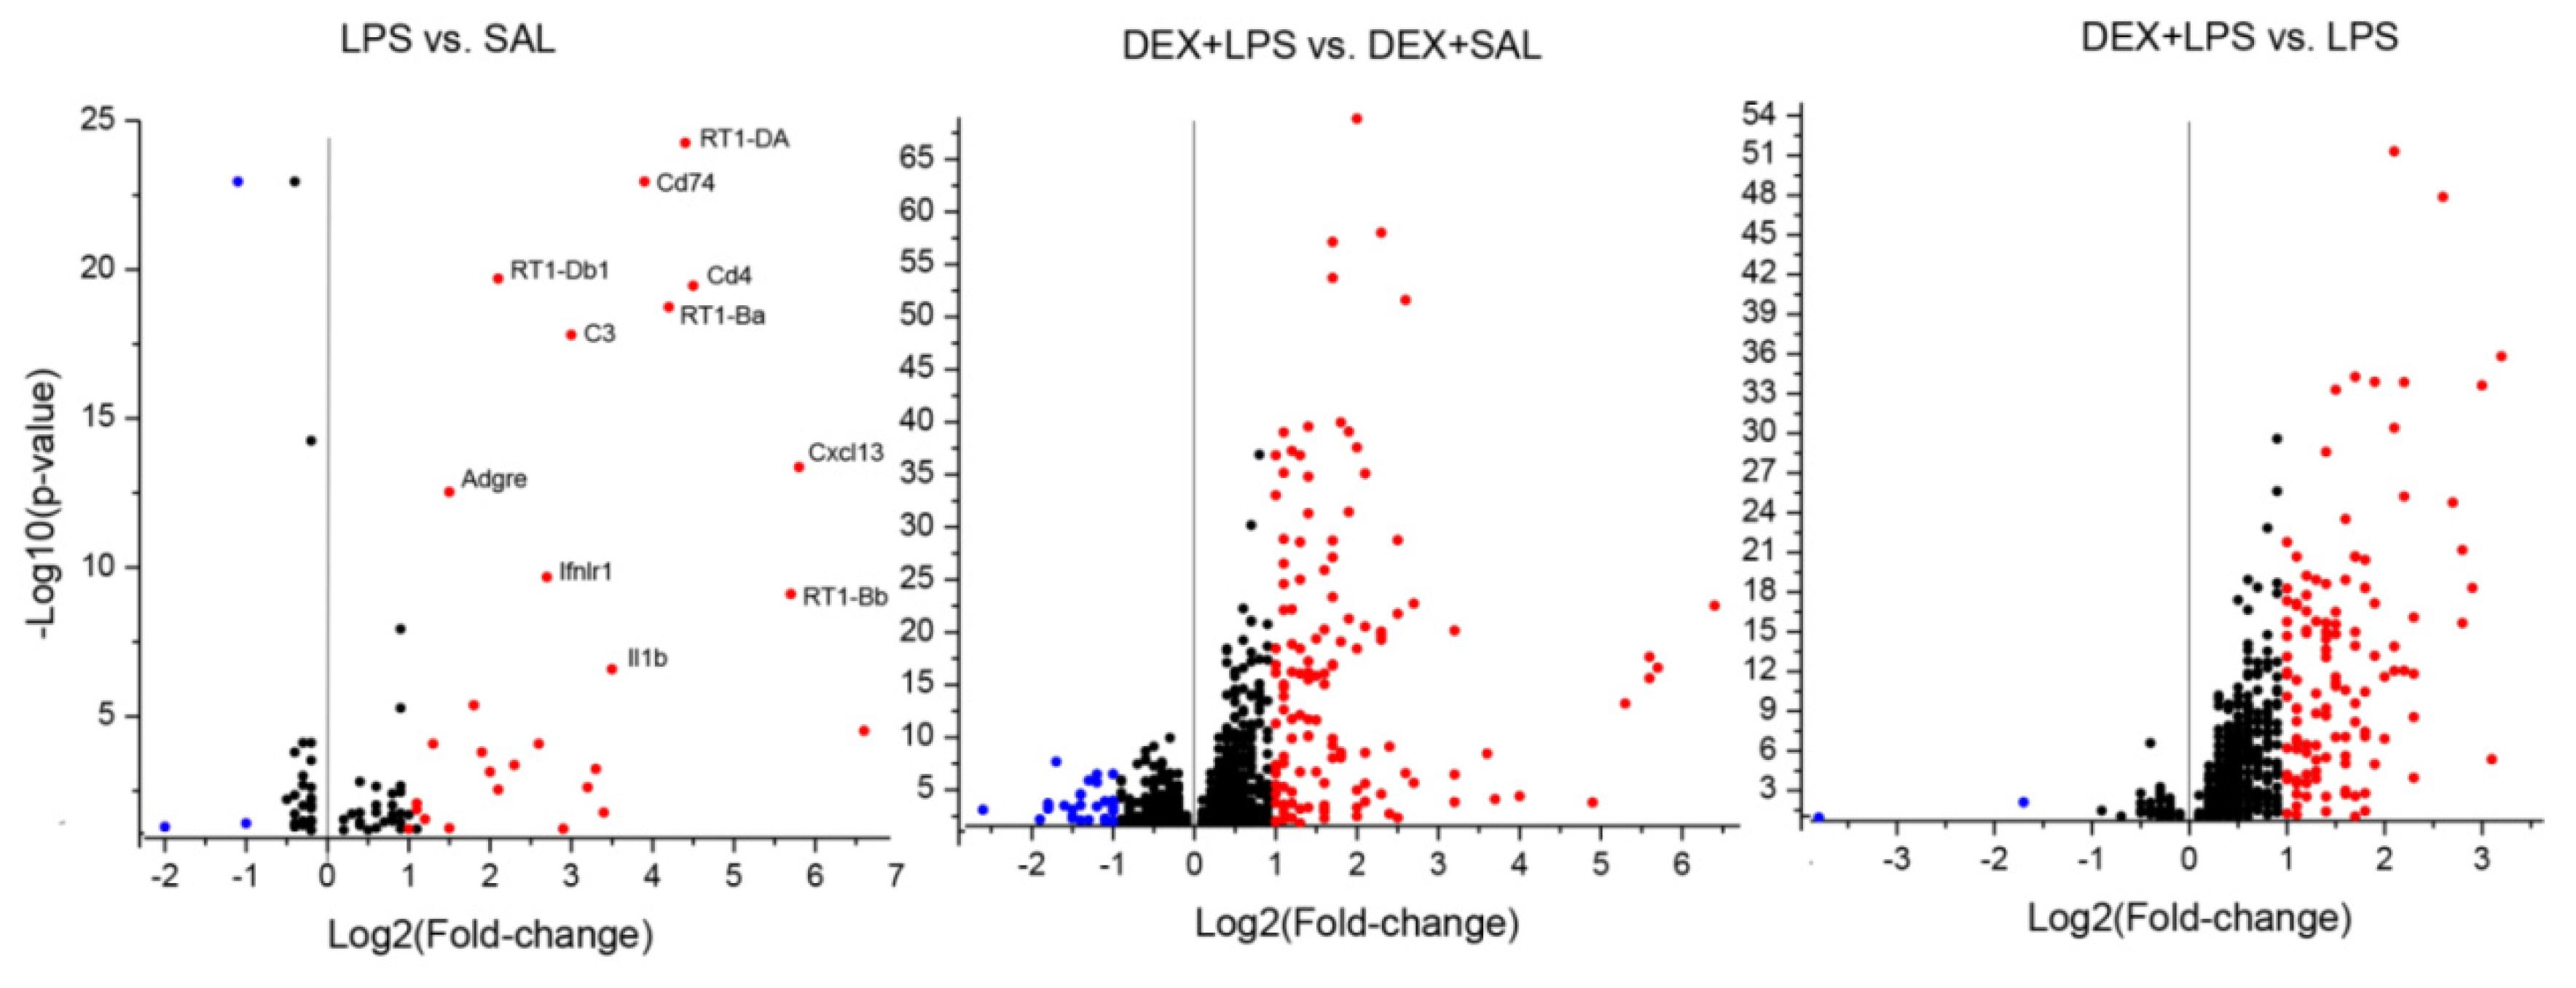
3.3. Transcriptomic Analyses
4. Discussion
4.1. Modeling of Inflammation
4.2. Acute and Delayed Behavioral Effects of LPS: Influence of DEX Pretreatment
4.3. Influence of DEX Pretreatment on Transcriptomic LPS Effects
5. Conclusion
Supplementary Materials
Author Contributions
Funding
Institutional Review Board Statement
Acknowledgments
Conflicts of Interest
References
- Öberg, M.; Fabrik, I.; Fabrikova, D.; Zehetner, N.; Härtlova, A. The role of innate immunity and inflammation in Parkinson´s disease. Scand. J. Immunol. 2021, 93, e13022. [Google Scholar] [CrossRef] [PubMed]
- Li, N.; Deng, M.; Hu, G.; Li, N.; Yuan, H.; Zhou, Y. New Insights into Microglial Mechanisms of Memory Impairment in Alzheimer’s Disease. Biomolecules 2022, 12, 1722. [Google Scholar] [CrossRef]
- McNicholas, K.; François, M.; Liu, J.-W.; Doecke, J.D.; Hecker, J.; Faunt, J.; Maddison, J.; Johns, S.; Pukala, T.L.; Rush, R.A.; et al. Salivary inflammatory biomarkers are predictive of mild cognitive impairment and Alzheimer’s disease in a feasibility study. Front. Aging Neurosci. 2022, 14, 1019296. [Google Scholar] [CrossRef] [PubMed]
- Liu, Y.; Si, Z.-Z.; Zou, C.-J.; Mei, X.; Li, X.-F.; Luo, H.; Shen, Y.; Hu, J.; Li, X.-X.; Wu, L. Targeting neuroinflammation in Alzheimer’s disease: from mechanisms to clinical applications. Neural Regen. Res. 2022, 18, 708–715. [Google Scholar] [CrossRef] [PubMed]
- Lozano, D.; Schimmel, S.J.; Acosta, S. Neuroinflammation in traumatic brain injury: A chronic response to an acute injury. Brain Circ. 2017, 3, 135–142. [Google Scholar] [CrossRef] [PubMed]
- Thiel, A.; Cechetto, D.F.; Heiss, W.-D.; Hachinski, V.; Whitehead, S.N.; S, E.; J, E.; S, S.; D, W.; J, B.; et al. Amyloid Burden, Neuroinflammation, and Links to Cognitive Decline After Ischemic Stroke. Stroke 2014, 45, 2825–2829. [Google Scholar] [CrossRef]
- Rosenberg, G.A. Extracellular matrix inflammation in vascular cognitive impairment and dementia. Clin. Sci. 2017, 131, 425–437. [Google Scholar] [CrossRef]
- Shishkina, G.T.; Kalinina, T.S.; Gulyaeva, N.V.; Lanshakov, D.A.; Dygalo, N.N. Changes in Gene Expression and Neuroinflammation in the Hippocampus after Focal Brain Ischemia: Involvement in the Long-Term Cognitive and Mental Disorders. Biochem. (Moscow) 2021, 86, 657–666. [Google Scholar] [CrossRef]
- Da Ré, C.; Souza, J.M.; Fróes, F.; Taday, J.; dos Santos, J.P.; Rodrigues, L.; Sesterheim, P.; Gonçalves, C.A.; Leite, M.C. Neuroinflammation induced by lipopolysaccharide leads to memory impairment and alterations in hippocampal leptin signaling. Behav. Brain Res. 2019, 379, 112360. [Google Scholar] [CrossRef]
- Shishkina, G.; Kalinina, T.; Lanshakov, D.; Komysheva, N.; Sukhareva, E.; Dygalo, N. P. 0127 Acute and delayed behavioral effects of lipopolysaccharide with a focus on hippocampal interleukin-1β. Eur. Neuropsychopharmacol. 2021, 53, S93. [Google Scholar] [CrossRef]
- Brown, E.S. Effects of Glucocorticoids on Mood, Memory, and the Hippocampus. Ann. New York Acad. Sci. 2009, 1179, 41–55. [Google Scholar] [CrossRef]
- Cheng, W.; Song, Y.; Liu, Y.; Sun, X.; Ren, W. Impact of Dexamethasone Preconditioning on Prevention of Development of Cognitive Impairment following Acute Inflammation. Contrast Media Mol. Imaging 2022, 2022, 1–8. [Google Scholar] [CrossRef]
- Bonow, R.H.; Aïd, S.; Zhang, Y.; Becker, K.G.; Bosetti, F. The brain expression of genes involved in inflammatory response, the ribosome, and learning and memory is altered by centrally injected lipopolysaccharide in mice. Pharmacogenomics J. 2008, 9, 116–126. [Google Scholar] [CrossRef]
- Shishkina, G.T.; Gulyaeva, N.V.; Lanshakov, D.A.; Kalinina, T.S.; Onufriev, M.V.; Moiseeva, Y.V.; Sukhareva, E.V.; Babenko, V.N.; Dygalo, N.N. Identifying the Involvement of Pro-Inflammatory Signal in Hippocampal Gene Expression Changes after Experimental Ischemia: Transcriptome-Wide Analysis. Biomedicines 2021, 9, 1840. [Google Scholar] [CrossRef]
- Ory, D.; Planas, A.; Dresselaers, T.; Gsell, W.; Postnov, A.; Celen, S.; Casteels, C.; Himmelreich, U.; Debyser, Z.; Van Laere, K.; et al. PET imaging of TSPO in a rat model of local neuroinflammation induced by intracerebral injection of lipopolysaccharide. Nucl. Med. Biol. 2015, 42, 753–761. [Google Scholar] [CrossRef]
- Sauvage, M.C.-D.; Maatouk, L.; Arnoux, I.; Pasco, M.; Diez, A.S.; Delahaye, M.; Herrero, M.T.; A Newman, T.; Calvo, C.F.; Audinat, E.; et al. Potent and multiple regulatory actions of microglial glucocorticoid receptors during CNS inflammation. Cell Death Differ. 2013, 20, 1546–1557. [Google Scholar] [CrossRef]
- Garcia, J.H.; Wagner, S.; Liu, K.-F.; Hu, X.-J.; Ho, K.-L.; Ellsworth, J.L.; Garcia, R.; Yu, J.; Kindy, M.S.; Gerriets, T.; et al. Neurological Deficit and Extent of Neuronal Necrosis Attributable to Middle Cerebral Artery Occlusion in Rats. Stroke 1995, 26, 627–635. [Google Scholar] [CrossRef]
- Bolger, A.M.; Lohse, M.; Usadel, B. Trimmomatic: A flexible trimmer for Illumina sequence data. Bioinformatics 2014, 30, 2114–2120. [Google Scholar] [CrossRef]
- Dobin, A.; Gingeras, T.R. Mapping RNA-seq Reads with STAR. Curr. Protoc. Bioinformatics 2015, 51, 11.14.1–11.14.19. [Google Scholar] [CrossRef]
- Love, M.I.; Huber, W.; Anders, S. Moderated estimation of fold change and dispersion for RNA-seq data with DESeq2. Genome Biol. 2014, 15, 550. [Google Scholar] [CrossRef]
- Huang, D.W.; Sherman, B.T.; A Lempicki, R. Systematic and integrative analysis of large gene lists using DAVID bioinformatics resources. Nat. Protoc. 2008, 4, 44–57. [Google Scholar] [CrossRef]
- Shishkina, G.T.; Bannova, A.V.; Komysheva, N.P.; Dygalo, N.N. Anxiogenic-like effect of chronic lipopolysaccharide is associated with increased expression of matrix metalloproteinase 9 in the rat amygdala. Stress 2020, 23, 708–714. [Google Scholar] [CrossRef] [PubMed]
- Batista, C.R.A.; Gomes, G.F.; Candelario-Jalil, E.; Fiebich, B.L.; De Oliveira, A.C.P. Lipopolysaccharide-Induced Neuroinflammation as a Bridge to Understand Neurodegeneration. Int. J. Mol. Sci. 2019, 20, 2293. [Google Scholar] [CrossRef]
- Dantzer, R.; O'Connor, J.C.; Freund, G.G.; Johnson, R.W.; Kelley, K.W. From inflammation to sickness and depression: when the immune system subjugates the brain. Nat. Rev. Neurosci. 2008, 9, 46–56. [Google Scholar] [CrossRef] [PubMed]
- Biesmans, S.; Meert, T.F.; Bouwknecht, J.A.; Acton, P.D.; Davoodi, N.; De Haes, P.; Kuijlaars, J.; Langlois, X.; Matthews, L.J.R.; Donck, L.V.; et al. Systemic Immune Activation Leads to Neuroinflammation and Sickness Behavior in Mice. Mediat. Inflamm. 2013, 2013, 1–14. [Google Scholar] [CrossRef]
- Choi, S.; Langenbach, R.; Bosetti, F. Genetic deletion or pharmacological inhibition of cyclooxygenase-1 attenuate lipopolysaccharide- induced inflammatory response and brain injury. FASEB J. 2007, 22, 1491–1501. [Google Scholar] [CrossRef]
- Shah, F.A.; Li, T.; Al Kury, L.T.; Zeb, A.; Khatoon, S.; Liu, G.; Yang, X.; Liu, F.; Yao, H.; Khan, A.-U.; et al. Pathological Comparisons of the Hippocampal Changes in the Transient and Permanent Middle Cerebral Artery Occlusion Rat Models. Front. Neurol. 2019, 10. [Google Scholar] [CrossRef]
- Uchida, H.; Fujita, Y.; Matsueda, M.; Umeda, M.; Matsuda, S.; Kato, H.; Kasahara, J.; Araki, T. Damage to Neurons and Oligodendrocytes in the Hippocampal CA1 Sector after Transient Focal Ischemia in Rats. Cell. Mol. Neurobiol. 2010, 30, 1125–1134. [Google Scholar] [CrossRef]
- Hoogland, I.C.; Houbolt, C.; van Westerloo, D.J.; van Gool, W.A.; van de Beek, D. Systemic inflammation and microglial activation: systematic review of animal experiments. J. Neuroinflammation 2015, 12, 114. [Google Scholar] [CrossRef]
- Burguillos, M.A.; Deierborg, T.; Kavanagh, E.; Persson, A.; Hajji, N.; Garcia-Quintanilla, A.; Cano, J.; Brundin, P.; Englund, E.; Venero, J.L.; et al. Caspase signalling controls microglia activation and neurotoxicity. Nature 2011, 472, 319–324. [Google Scholar] [CrossRef]
- McBride, D.W.; Wang, Y.; Adam, L.; Oudin, G.; Louis, J.-S.; Tang, J.; Zhang, J.H. Correlation Between Subacute Sensorimotor Deficits and Brain Edema in Rats after Surgical Brain Injury. 2016, 121, 317–321. [Google Scholar] [CrossRef] [PubMed]
- Jacovides, C.L.; Ahmed, S.; Suto, Y.; Paris, A.J.; Leone, R.; McCarry, J.; Christofidou-Solomidou, M.; Kaplan, L.J.; Smith, D.H.; Holena, D.N.; et al. An inflammatory pulmonary insult post-traumatic brain injury worsens subsequent spatial learning and neurological outcomes. J. Trauma: Inj. Infect. Crit. Care 2019, 87, 552–558. [Google Scholar] [CrossRef] [PubMed]
- Bishnoi, I.R.; Cloutier, C.J.; Tyson, C.-D.; Matic, V.M.; Kavaliers, M.; Ossenkopp, K.-P. Infection, learning, and memory: Focus on immune activation and aversive conditioning. Neurosci. Biobehav. Rev. 2022, 142, 104898. [Google Scholar] [CrossRef] [PubMed]
- Hennigan, A.; Trotter, C.; Kelly, M. Lipopolysaccharide impairs long-term potentiation and recognition memory and increases p75NTR expression in the rat dentate gyrus. Brain Res. 2007, 1130, 158–166. [Google Scholar] [CrossRef]
- Czerniawski, J.; Miyashita, T.; Lewandowski, G.; Guzowski, J.F. Systemic lipopolysaccharide administration impairs retrieval of context–object discrimination, but not spatial, memory: Evidence for selective disruption of specific hippocampus-dependent memory functions during acute neuroinflammation. Brain, Behav. Immun. 2015, 44, 159–166. [Google Scholar] [CrossRef]
- Jenkins, T.A.; Harte, M.K.; Stenson, G.; Reynolds, G.P. Neonatal lipopolysaccharide induces pathological changes in parvalbumin immunoreactivity in the hippocampus of the rat. Behav. Brain Res. 2009, 205, 355–359. [Google Scholar] [CrossRef]
- Barter, J.; Kumar, A.; Rani, A.; Colon-Perez, L.M.; Febo, M.; Foster, T.C. Differential Effect of Repeated Lipopolysaccharide Treatment and Aging on Hippocampal Function and Biomarkers of Hippocampal Senescence. Mol. Neurobiol. 2020, 57, 4045–4059. [Google Scholar] [CrossRef]
- Tchessalova, D.; Tronson, N.C. Memory deficits in males and females long after subchronic immune challenge. Neurobiol. Learn. Mem. 2019, 158, 60–72. [Google Scholar] [CrossRef]
- Qin, L.; Wu, X.; Block, M.L.; Liu, Y.; Breese, G.R.; Hong, J.-S.; Knapp, D.J.; Crews, F.T. Systemic LPS causes chronic neuroinflammation and progressive neurodegeneration. Glia 2007, 55, 453–462. [Google Scholar] [CrossRef]
- Bossù, P.; Cutuli, D.; Palladino, I.; Caporali, P.; Angelucci, F.; Laricchiuta, D.; Gelfo, F.; De Bartolo, P.; Caltagirone, C.; Petrosini, L. A single intraperitoneal injection of endotoxin in rats induces long-lasting modifications in behavior and brain protein levels of TNF-α and IL-18. J. Neuroinflammation 2012, 9, 101–101. [Google Scholar] [CrossRef]
- Tchessalova, D.; Tronson, N.C. Enduring and Sex-specific Changes in Hippocampal Gene Expression after a Subchronic Immune Challenge. Neuroscience 2020, 428, 76–89. [Google Scholar] [CrossRef]
- VanGuilder, H.D.; Bixler, G.V.; Brucklacher, R.M.; A Farley, J.; Yan, H.; Warrington, J.P.; E Sonntag, W.; Freeman, W.M. Concurrent hippocampal induction of MHC II pathway components and glial activation with advanced aging is not correlated with cognitive impairment. J. Neuroinflammation 2011, 8, 138–138. [Google Scholar] [CrossRef]
- Kawano, T.; Morikawa, A.; Imori, S.; Waki, S.; Tamura, T.; Yamanaka, D.; Yamazaki, F.; Yokoyama, M. Preventive effects of multisensory rehabilitation on development of cognitive dysfunction following systemic inflammation in aged rats. J. Anesthesia 2014, 28, 780–784. [Google Scholar] [CrossRef] [PubMed]
- Li, M.; Li, C.; Yu, H.; Cai, X.; Shen, X.; Sun, X.; Wang, J.; Zhang, Y.; Wang, C. Lentivirus-mediated interleukin-1β (IL-1β) knock-down in the hippocampus alleviates lipopolysaccharide (LPS)-induced memory deficits and anxiety- and depression-like behaviors in mice. J. Neuroinflammation 2017, 14, 1–12. [Google Scholar] [CrossRef] [PubMed]
- Kim, J.; Jeon, S.G.; Jeong, H.-R.; Park, H.; Kim, J.-I.; Hoe, H.-S. L-Type Ca2+ Channel Inhibition Rescues the LPS-Induced Neuroinflammatory Response and Impairments in Spatial Memory and Dendritic Spine Formation. Int. J. Mol. Sci. 2022, 23, 13606. [Google Scholar] [CrossRef] [PubMed]
- Pregnolato, S.; Chakkarapani, E.; Isles, A.R.; Luyt, K. Glutamate Transport and Preterm Brain Injury. Front. Physiol. 2019, 10, 417. [Google Scholar] [CrossRef]
- Dygalo, N.N.; Kalinina, T.S.; Shishkina, G.T. Stress-induced expression pattern of glutamate signaling genes associated with anhedonia. Stress 2020, 23, 700–707. [Google Scholar] [CrossRef] [PubMed]
- Kalinina, T.S.; Shishkina, G.T.; Lanshakov, D.A.; Sukhareva, E.V.; Onufriev, M.V.; Moiseeva, Y.V.; Gulyaeva, N.V.; Dygalo, N.N. Comparative Investigation of Expression of Glutamatergic and GABAergic Genes in the Rat Hippocampus after Focal Brain Ischemia and Central LPS Administration. Biochem. (Moscow) 2023, 88, 539–550. [Google Scholar] [CrossRef]
- Sun, Y.; Cheng, X.; Zhang, L.; Hu, J.; Chen, Y.; Zhan, L.; Gao, Z. The Functional and Molecular Properties, Physiological Functions, and Pathophysiological Roles of GluN2A in the Central Nervous System. Mol. Neurobiol. 2016, 54, 1008–1021. [Google Scholar] [CrossRef]
- Rossato, J.I.; Radiske, A.; Gonzalez, M.C.; Apolinário, G.; de Araújo, R.L.; Bevilaqua, L.R.; Cammarota, M. NMDARs control object recognition memory destabilization and reconsolidation. Brain Res. Bull. 2023, 197, 42–48. [Google Scholar] [CrossRef]
- Brigman, J.L.; Feyder, M.; Saksida, L.M.; Bussey, T.J.; Mishina, M.; Holmes, A. Impaired discrimination learning in mice lacking the NMDA receptor NR2A subunit. Learn. Mem. 2008, 15, 50–54. [Google Scholar] [CrossRef] [PubMed]
- Abd-Elrahman, K.S.; Ferguson, S.S.G. Noncanonical Metabotropic Glutamate Receptor 5 Signaling in Alzheimer's Disease. Annu Rev Pharmacol Toxicol. 2022, 62, 235–254. [Google Scholar] [CrossRef]
- Cortese, G.P.; Olin, A.; O'Riordan, K.; Hullinger, R.; Burger, C. Environmental enrichment improves hippocampal function in aged rats by enhancing learning and memory, LTP, and mGluR5-Homer1c activity. Neurobiol. Aging 2018, 63, 1–11. [Google Scholar] [CrossRef] [PubMed]
- Mecca, A.P.; McDonald, J.W.; Michalak, H.R.; Godek, T.A.; Harris, J.E.; Pugh, E.A.; Kemp, E.C.; Chen, M.-K.; Salardini, A.; Nabulsi, N.B.; et al. PET imaging of mGluR5 in Alzheimer’s disease. Alzheimer's Res. Ther. 2020, 12, 15–10. [Google Scholar] [CrossRef] [PubMed]
- Brothers, H.M.; Wenk, G.L.; Bardou, I.; Hopp, S.C.; Marchalant, Y.; Turner, S.M.; Mitchem, M.R.; Kigerl, K.; Kaercher, R.M. Time-Dependent Compensatory Responses to Chronic Neuroinflammation in Hippocampus and Brainstem: The Potential Role of Glutamate Neurotransmission. J. Alzheimer's Dis. Park. 2013, 3, 1–9. [Google Scholar] [CrossRef]
- Tang, S.; Wang, I.-T.J.; Yue, C.; Takano, H.; Terzic, B.; Pance, K.; Lee, J.Y.; Cui, Y.; Coulter, D.A.; Zhou, Z. Loss of CDKL5 in Glutamatergic Neurons Disrupts Hippocampal Microcircuitry and Leads to Memory Impairment in Mice. J. Neurosci. 2017, 37, 7420–7437. [Google Scholar] [CrossRef]
- Gao, Y.Z.; Wu, X.M.; Zhou, Z.Q.; Liu, P.M.; Yang, J.J.; Ji, M.H. Dysfunction of NRG1/ErbB4 Signaling in the Hippocampus Might Mediate Long-term Memory Decline After Systemic Inflammation. Mol. Neurobiol. 2023, 60, 3210–3226. [Google Scholar] [CrossRef]
- De Kloet, E.R. Why Dexamethasone Poorly Penetrates in Brain. Stress 1997, 2, 13–20. [Google Scholar] [CrossRef]
- Wang, K.; Shi, Y.; Liu, W.; Liu, S.; Sun, M.-Z. Taurine improves neuron injuries and cognitive impairment in a mouse Parkinson’s disease model through inhibition of microglial activation. NeuroToxicology 2021, 83, 129–136. [Google Scholar] [CrossRef]
- Cuong, T.T.; Yang, C.-S.; Yuk, J.-M.; Lee, H.-M.; Ko, S.-R.; Cho, B.-G.; Jo, E.-K. Glucocorticoid receptor agonist compound K regulates dectin-1-dependent inflammatory signaling through inhibition of reactive oxygen species. Life Sci. 2009, 85, 625–633. [Google Scholar] [CrossRef]
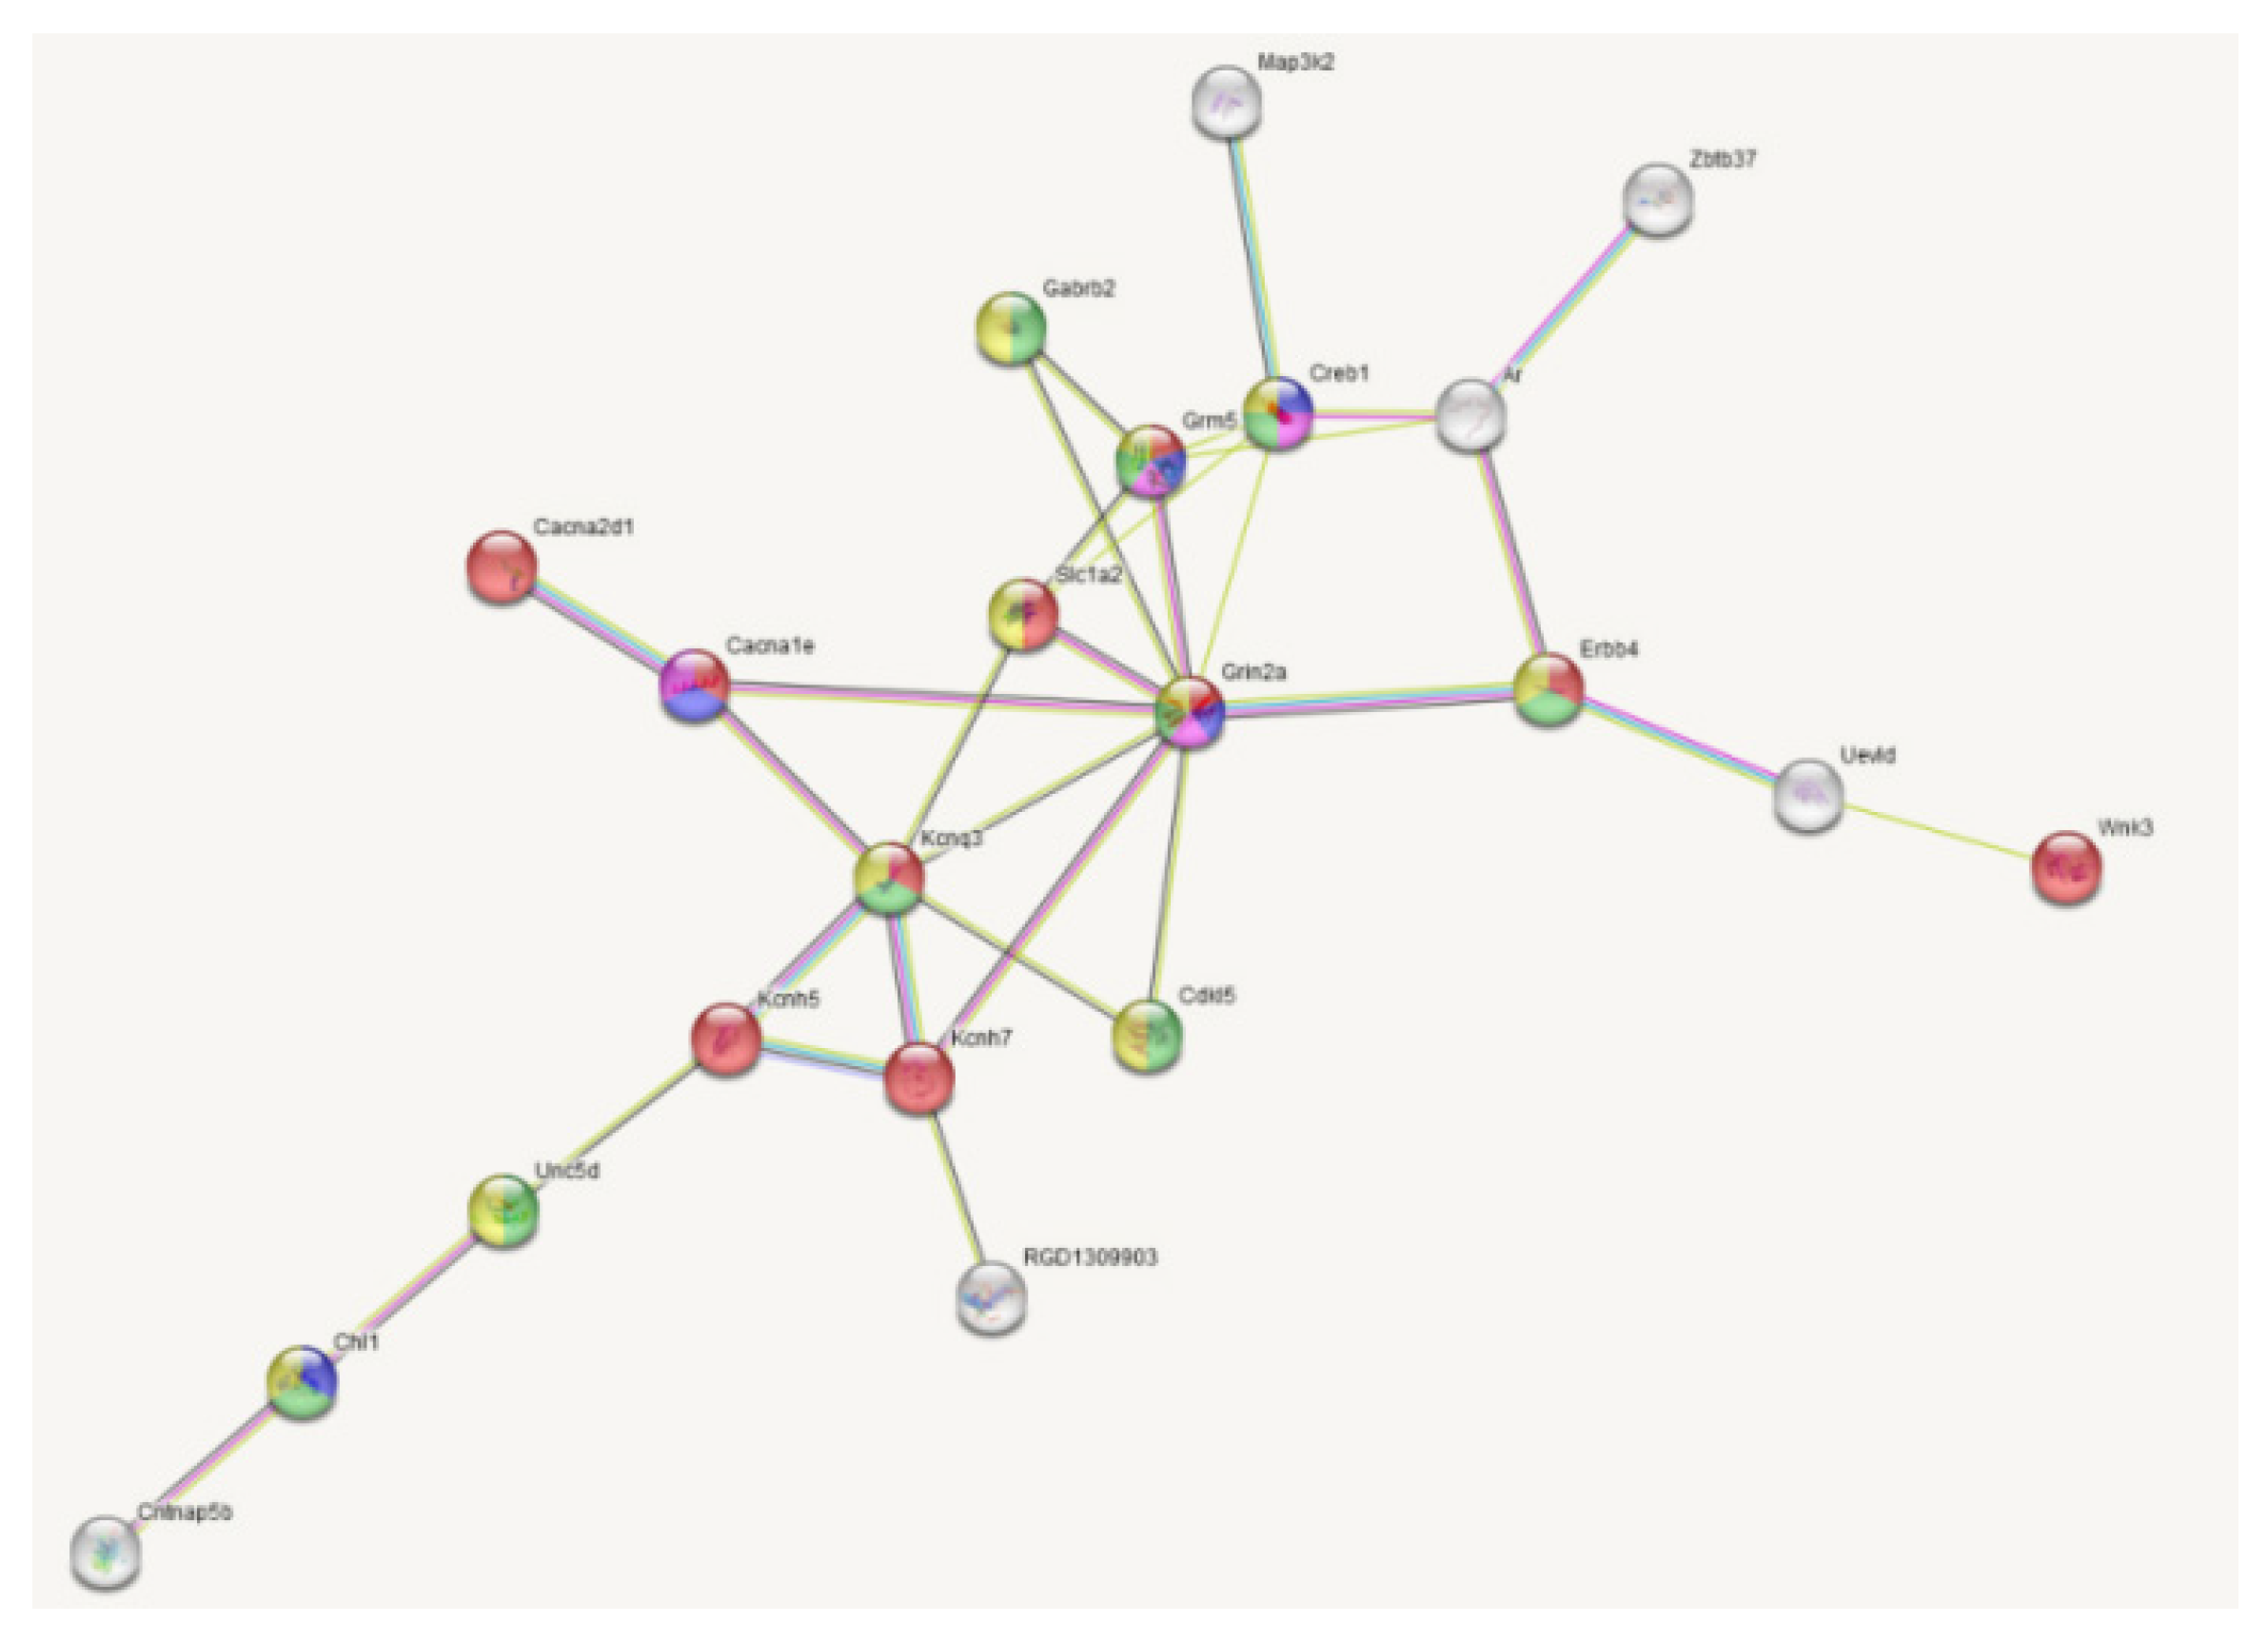
| Gene | LPS vs. SAL (33) | DEX+LPS vs. DEX+SAL (161) | Common DEGs (22) | Specific DEGs (84) |
|---|---|---|---|---|
| Cd4 | 16 | 21 | 13 | - |
| Cd74 | 11 | 14 | 8 | - |
| Ciita | 8 | 11 | 6 | - |
| Creb1 | - | 11 | - | 7 |
| Il1b | 10 | 15 | 8 | - |
| RT1-Bb | 8 | 11 | 7 | - |
| RT1-Da | 9 | 9 | 6 | - |
| Grin2a | - | 9 | - | 9 |
Disclaimer/Publisher’s Note: The statements, opinions and data contained in all publications are solely those of the individual author(s) and contributor(s) and not of MDPI and/or the editor(s). MDPI and/or the editor(s) disclaim responsibility for any injury to people or property resulting from any ideas, methods, instructions or products referred to in the content. |
© 2023 by the authors. Licensee MDPI, Basel, Switzerland. This article is an open access article distributed under the terms and conditions of the Creative Commons Attribution (CC BY) license (http://creativecommons.org/licenses/by/4.0/).


