1. Introduction
Interfacial multiphase flows play a crucial role in a wide range of industrial fields, offering opportunities for enhanced process efficiency, product quality, and environmental sustainability. Understanding and manipulating the dynamics of multiple immiscible fluids in contact at their interfaces are key challenges that require accurate numerical computations. These systems exhibit complex behaviors due to the interplay between bulk fluid coupling and surface effects, necessitating advanced modeling and simulation techniques [
1]. The ability to accurately predict and control interfacial phenomena is of paramount importance in industrial processes such as oil and gas extraction [
2], chemical reactions [
3], pharmaceutical manufacturing [
4], food processing [
5], and microfluidics [
6], among others.
Interfacial multiphase flows exhibit complex and dynamic behavior, requiring sophisticated numerical techniques for their accurate calculation and analysis. Over the years, various numerical methods have been developed to tackle the challenges associated with capturing and tracking fluid interfaces [
7].
One widely employed approach is the front-tracking method [
8,
9], which explicitly tracks the fluid interface using a moving mesh. This method accurately captures the detailed dynamics of the interface and enables precise representation of surface effects. An example of a front-tracking method is the Arbitrary Lagrangian-Eulerian (ALE) method [
10]. These methods are very good in providing an accurate description of the contact surface but often come with high computational costs.
Another approach is the fixed-mesh method, which represents the fluid interface implicitly using additional fields. The Volume of Fluid (VOF) method [
11], Phase-Field method [
12], and Level-Set method [
13] are notable examples. These methods use a fixed mesh and provide easier coupling formulations and smaller algebraic problems. However, they may sacrifice some accuracy in the description of the interface compared to front-tracking methods. In the VOF method, a mass conservation equation is solved to track the movement of the interface by computing the volume fraction of each fluid. This method is effective in capturing large-scale interface dynamics and is widely used in various industrial applications. The Phase-Field method introduces an additional scalar field to represent the interface, evolving according to a diffusion equation. This approach offers a smooth transition across the interface and is particularly useful for simulating complex interfacial phenomena such as phase separation and morphological changes. The Level-Set method evolves a scalar function called the level set function, which tracks the interface as it evolves in time. This method provides accurate interface capturing and is suitable for simulating topological changes, such as merging and breakup of droplets. Furthermore, the Immersed Boundary Method (IBM) [
14] represents the interface as a boundary immersed in a fixed grid. It uses a force-based approach to model the interaction between the fluid and the boundary, enabling the simulation of complex geometries and multiphase flows involving solid boundaries.
Continued advancements in numerical methods hold the potential for further enhancing our understanding and control of interfacial multiphase flows. Specifically, the modeling and simulation of three-dimensional (3D) interfacial multiphase flows is a critical area of research that has garnered significant attention in recent years [
1,
15,
16]. The geometric complexity and dynamic nature of the fluid interfaces demand advanced modeling techniques that can accurately resolve and track the evolving interfaces in three-dimensional space. Researchers are continuously exploring new approaches to improve conservation of mass, capture fluid interfaces, and compute interfacial surface tension. Liovic et al. [
15] developed a volume tracking method for accurate calculations of interfaces in 3D geometries. The interface geometries are approximated as piecewise planar and fully multidimensional fluxes are used in a single unsplit step to advect cell volumes. The definition of these fluxes is based on backward-trajectory remapping, ensuring reliable and precise tracking of the interfaces. To assess the performance of the 3D volume tracking scheme, Liovic et al. [
15] conducted 3D shearing flow and deformation field tests. Adelsberger et al. [
16] conducted 3D simulations of incompressible two-phase flow to investigate the behavior of rising droplets. Three different flow solvers, namely DROPS [
17], NaSt3D [
18] and OpenFOAM [
19] were utilized, each employing distinct numerical techniques. DROPS employed a finite element spatial discretization, an implicit theta scheme for time discretization, and a level set method for interface capturing. NaSt3D utilized a finite difference spatial discretization, a second-order Adams-Bashforth scheme for time discretization, and a level set method for interface capturing. Lastly, OpenFOAM employed a finite volume spatial discretization, an implicit Euler scheme for time discretization, and a VOF method for interface capturing. Metivet et al. [
1] presented a numerical framework for simulating multiphase flows using the level-set method. The discretization of the fluid equations is done using a finite element method. For the spatial discretization the method can use finite elements of high order. This choice ensures accuracy and stability in representing the spatial domain. As for the time discretization, the implicit Backward Differentiation Formulae (BDF) of arbitrary order is used. This approach allows for precise time stepping and facilitates the accurate simulation of dynamic phenomena in interfacial multiphase flows. This ongoing research aims to enhance the fidelity and predictive capabilities of computational models, enabling more accurate simulations of 3D interfacial multiphase flows, which generally suffer from volume conservation, interface sharpness, boundedness, and shape preservation.
In this study, we present a geometric formulation of the VOF method, known as PLIC (piecewise linear interface construction), specifically designed for simulating 3D interfacial multiphase flows. The PLIC-VOF method is implemented within the HiG-Flow (hierarchical grid) framework, a recently developed Computational Fluid Dynamics (CFD) software. HiG-Flow utilizes finite differences on hierarchical grids and enables the simulation of a wide range of flow types, including Newtonian, Generalized-Newtonian, and viscoelastic flows in any dimension. The modular design of the software allows for easy implementation of new techniques and methods, making it flexible and adaptable to evolving research needs. Furthermore, HiG-Flow incorporates numerical stabilization techniques to ensure accurate and stable simulations, even in the presence of complex flow phenomena, such as 3D multiphase flows. The user-friendly interface allows researchers to choose specific simulation features, such as the dimension, modules to be used, and numerical techniques, providing a customizable and efficient simulation environment.
The paper is organised as follows: in
Section 2 we present the governing equations that describe interfacial multiphase flows. Subsequently,
Section 3 describes the numerical method used to discretize the governing equations using the PLIC-VOF method. In
Section 4, we focus on the validation of the numerical algorithm through two 3D advection tests: the shearing flow and deformation field problems. Furthermore, the validation of the PLIC-VOF method is also conducted using a 3D multiphase benchmark problem involving the rising of a bubble. The paper ends with the conclusion in
Section 5.
2. Governing Equations
This study examines the characteristics of an unsteady, laminar, isothermal and incompressible two-phase flow. The flow consists of two immiscible fluid phases, with no mass transfer occurring across their interface. The governing equations for this flow are the mass conservation equation (Equation (
1)),
and the linear momentum balance equation (Equation (
2)),
where
is the velocity field of the flow,
is the density,
p the pressure,
the absolute viscosity,
the gravitational field,
the interfacial tension coefficient,
and
the curvature and the normal vector to the interface, respectively, and
is a function that takes a value of one at the interface and zero elsewhere in the domain. Equation (
2) can be written in dimensionless form as:
where the non-dimensional parameters
and
represent, respectively, the Reynolds number, which describes the ratio between inertial and viscous forces, and the Bond number (also known as the Eötvös number), which describes the ratio between gravitational force and surface tension. The parameters
g,
,
L and
represent the magnitude of the gravitational field, the characteristic density, the characteristic length scale and the characteristic viscosity, respectively.
In the VOF method, assuming the flow is incompressible, the advection of the volume fraction is modeled by the following transport equation:
The method used to model the evolution of the interface plays a fundamental role in the accuracy of the VOF method. In the HiG-Flow software, a geometric formulation was taken to solve the transport equation (Equation (
4)), where the fluid-fluid interface is reconstructed at each time step using the PLIC-VOF method. In this sense, an advection algorithm with a fractional step (split) was implemented. This technique simplifies the method and prevents the transportation of the same fluid portion twice, as happens in single-step (unsplit) methods [
20].
3. Numerical Procedure
3.1. HiG-Tree and HiG-Flow software
The HiG-Tree software is responsible for the data structure, domains, approximations and interpolations, solvers of linear and non-linear systems, used in numerical simulations in the HiG-Flow software.
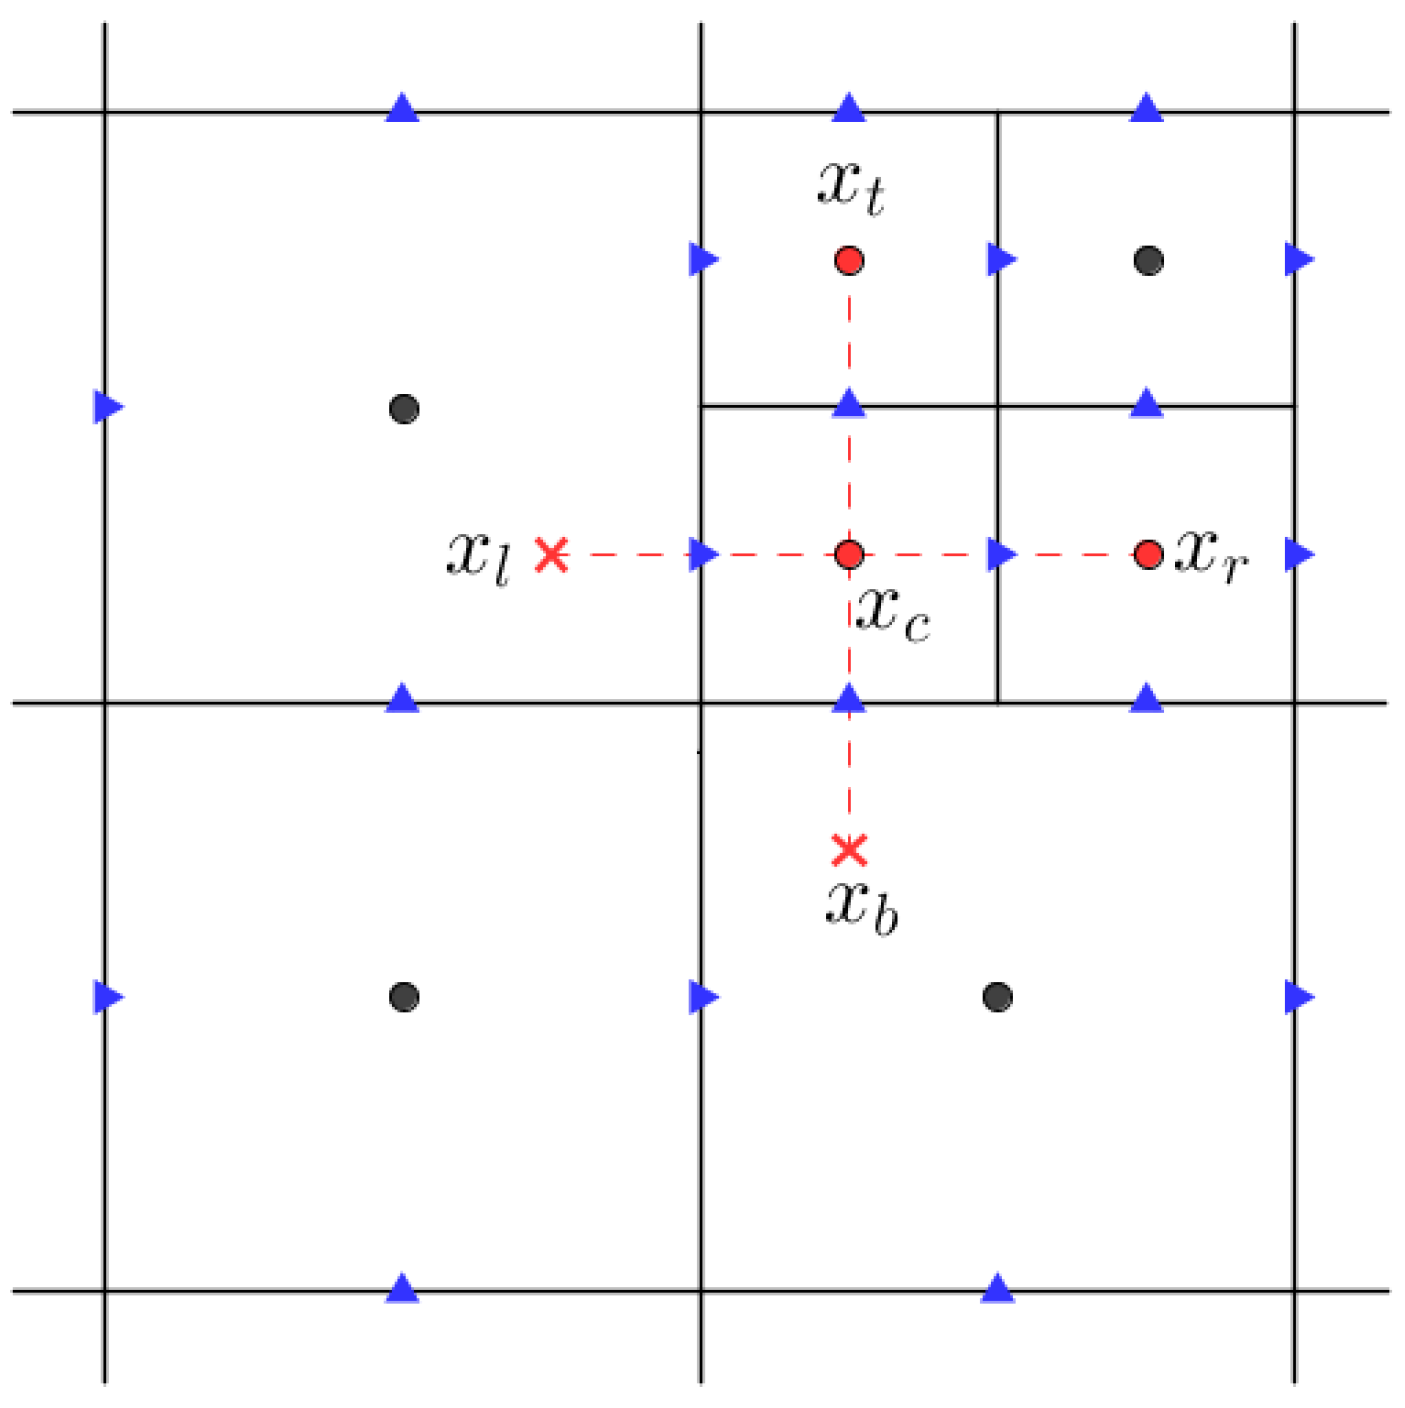
The HiG-Tree data structure is a hierarchical Cartesian mesh representation which can be constituted of elements with varying sizes. This structure is based on the recursive spatial subdivisions (refinements) of its elements, enabling their representation in an m-tree (see
Figure 1). In the HiG-Tree data structure, arbitrary mesh refinement processes can be applied at any level of the tree, generating an unstructured mesh. Classic examples of this type of mesh are the data structures
Quadtree (two-dimensional) and
Octree (three-dimensional). Although the illustration in
Figure 1 is in two dimensions, the framework is designed to be generic and can be extended to any number of dimensions.
In the module responsible for domain and subdomain partitioning, the generated domains are composed of blocks that can be complex to simulate problems in channels with intricate geometries. Each block is discretized using the HiG-Tree structure, which enables appropriate spatial refinement for the simulated problems. These domains are partitioned using the Zoltan-Trilinos library [
36,
37], which ensures a good load distribution among processes during execution. This module also allows for the storage and enumeration of properties represented in the cells and facets of the mesh.
The module for approximations and interpolations handles the estimation of properties within cells and facets. It allows for the selection of the polynomial approximation order utilized by the moving least squares (MLS) method, as described by Sousa
et al. [
32]. In terms of meshes composed of elements with different levels of refinement, numerical methods based on approximations of finite differences in Cartesian uniform meshes become limited, since they will require spatial interpolations in unknown points of the stencil, as illustrated in
Figure 2. The accuracy of this type of method heavily depends on the geometric characteristics of the mesh. The MLS method avoids this geometric dependence, using a cloud of neighboring points to the unknown to apply the interpolation.
To obtain an approximation of the second derivative of variable
u in the
x direction at point
c, a standard second-order finite difference scheme can be used. The approximation is given by the following expression:
Note that the point
on the stencil in
Figure 2 does not coincide with any point on the mesh and must be approximated by some interpolation technique on the mesh of unknowns in the neighborhood of
. In the HiG-Tree software the following interpolation is used:
where
is the set of indices for the unknowns that are in the neighborhood of
and the weights
are calculated using the MLS method. The number of neighbors
depends on how many points are needed to maintain the order of accuracy of the global approximation.
Lastly, the module designed for solving linear and non-linear systems consists of two powerful libraries that utilize parallel computation techniques for efficient solution. These libraries are specifically tailored for handling both shared and distributed memory architectures, making use of high-performance routines. These libraries are HYPRE (
High Performance Preconditioners) [
38] and PETSc (
Portable, Extensible Toolkit for Scientific Computation) [
39]. These libraries offer significant advantages in the development of parallel code, and their performance has been extensively optimized and tested in various computational fluid dynamics codes.
The HiG-Flow software is a versatile tool for numerical simulation of fluid flows in various configurations. It enables the simulation of single-phase flows of Newtonian, generalized Newtonian, and viscoelastic fluids, as well as two-phase flows of Newtonian fluids using the volume of fluid method (VOF) for interface representation. The software is designed with a modular structure, allowing for easy implementation of new techniques and methods. It provides flexibility to users, who can choose the dimensionality of the simulation, select the desired modules (e.g., monophasic, Newtonian, generalized Newtonian, viscoelastic, biphasic), and specify numerical techniques through a data input file. This user-friendly approach facilitates customization and adaptation to specific simulation requirements.
In the HiG-Flow software, the most traditional methods for temporal advancement were implemented. The explicit methods implemented are: explicit Euler, second-order TVD (total variation diminishing) Runge-Kutta (or modified Euler method), and third-order TVD Runge-Kutta. The implicit methods implemented in the system are: implicit Euler, Crank-Nicholson, and second-order Backward Differentiation Formula (BDF). To obtain the pressure and velocity fields, the incremental (second order in time) and non-incremental (first order in time) projection methods are implemented.
3.2. Discretization procedure in HiG-Flow
To obtain the pressure fields and flow velocity through the resolution of the Navier-Stokes Equations (
1) and (
3), the incremental and non-incremental projection methods proposed by Chorin [
29], in which the pressure and velocity fields are decoupled, are implemented in HiG-Flow. As stated by Lages [
30], in terms of the error arising from the pressure-velocity decoupling, it has been observed that the non-incremental version of the method exhibits first-order accuracy in time, whereas the incremental version achieves second-order accuracy in time. In this work, the incremental projection method was used to solve the equations. Therefore, discretizing Equations (
1) and (
3) by the explicit Euler method we obtain:
where
The superscripts
n and
refer to the time level and
represents the time step. The elements with superscript
are unknowns and elements with superscript
n are known.
In the incremental projection method, initially using
instead of
, an intermediate velocity is calculated,
, as follows:
Subsequently, the difference between the pressure gradients
and
is calculated to correct the intermediate velocity and, lastly, the final velocity
is obtained:
or rather,
To calculate the pressure, the divergent operator is applied on both sides of Equation (
12) and the incompressibility hypothesis, Equation (
7), is invoked, to give the Poisson equation for pressure:
Since the phenomena treated in this work involve two-phase flows, that is, they involve two fluids with different physical properties, it follows that
and
are not constant throughout the domain. Thus, the resolution of the Poisson equation for the pressure and momentum equation presents greater difficulties and requires special care. To remediate this issue, in this work, the BiCGS (BiConjugate Gradient Squared) iterative method [
40] with Block Jacobi preconditioner [
41] was used, considering the convergence tolerance on the residual norm of
.
3.3. Interface reconstruction
In the existing literature, various methods have been proposed in conjunction with the VOF technique to handle the geometric reconstruction of the interface. These methods aim to locally approximate the interface within each interfacial cell by utilizing the volume fraction as a fundamental piece of information. Traditional examples of methods for the reconstruction of interfaces are the SLIC (
Simple Line Interface Calculation) [
21], Hirt–Nichols-VOF (original VOF method) [
22] and PLIC (
Piecewise-Linear Interface Calculation) [
23]. A comparison of these methods was performed by Rudman [
24], where the PLIC method showed more consistent results. Therefore, the PLIC method was implemented in the HiG-Flow solver to represent the interface.
In the PLIC-VOF method, assuming that the volume fraction and the normal vector are known in each interfacial cell, the interface is approached by a plane defined as follows:
where
is the normal vector over the interface,
is the position of a point on the plane and
is the smallest distance from the plane to the origin of the computational cell. The distance
must be adjusted so that the volume fraction below the reconstructed plane (say,
) is equal to
f, i.e.,
Given a cell with dimension
and the normal vector,
, the fluid volume below the interface within the interfacial cell is defined as follows:
where
Equation (
16) can be simplified based on the intersection of the plane with the cell, allowing to estimate the distance from the plane to the origin of the cell and the volume of fluid below the plane. To calculate the normal vector, the second-order accurate method described by Mehta
et al. [
25] was used. In this method, the normal vector is defined as the gradient of the volume fraction (i.e.,
), where the gradient is approximated using a
stencil around each interfacial cell.
3.4. Interface advection
Following the same strategy that Puckett
et al. [
26] adopted in the two-dimensional case, in order to maintain the conservation of
f, the incompressibility condition was taken into account (i.e.,
), resulting in the following modification to the volume fraction transport equation (Equation (
4)):
or rather,
Accordingly to Rider and Kothe [
33], who also presented this strategy for the two-dimensional case, this "divergence correction" makes the local and global volume-filling constraints to be satisfied much more closely, since the discrete velocity divergences are not necessarily zero, but rather a function of the convergence tolerance used in obtaining the solutions of the linear system.
The calculation of the transport of the volume fraction is divided into three steps: first in the
x direction, then in the
y direction, and then finally, in the
z direction. Thus, three consecutive updates are needed to carry
f at each time step, i.e,
. Thus, discretizing
f implicitly on the right-hand side of Equation (
19), implicitly on the right-hand side of Equation (20) and explicitly on the right-hand side of Equation (21), leads to
where
is the volume fraction in the
cell, at time
,
u,
v and
w are the velocity components in each coordinate direction and
F,
G and
H denote the fluxes of
f in the facets of cell
. Suppose, without loss of generality, that the velocity
is positive, then the flux volume,
, is given by:
where
is the volume of fluid that must be transported to the neighboring cell.
3.5. Surface tension force and curvature
In this work, the CSF (
Continuum Surface Force) method presented by Brackbill
et al. [
27] was adopted to model the interfacial tension force described in the momentum equation (Equation (
3)). In this model, the body force is defined by:
In the VOF method, Equation (
26) is generally rewritten as:
To obtain the curvature
, the traditional height function method, described by Torrey
et al. [
28], was used. This method takes nine heights to form a stencil
,
or
around each interfacial cell, according to the orientation of the interface, where the construction of height functions is defined as follows:
for the case where the largest component of the normal vector is in the
z direction. Knowing the nine height functions, the interfacial curvature can be calculated as follows:
where the derivatives
,
,
,
and
are calculated using centered finite difference schemes.
3.6. Time-step constraint
During the geometric advection of the interface, it is necessary to consider certain constraints to ensure the proper functioning of the method. In HiG-Flow, in order to prevent the same fluid portion from being transported twice, due to the use of a fractional step advection algorithm, and to ensure that the advected fluid volume does not exceed the computational cell volume, the following condition has been imposed:
The inclusion of the interfacial tension term in the Navier-Stokes equation demands one more restriction for the time step. According to Popinet [
31], the explicit discretization of the interfacial tension term leads to a condition of temporal stability of the form:
where
and
represent the density of each fluid. According to the rationale provided by Popinet [
31], the limitation on the time step size is justified by the need to adequately capture the propagation of the fastest capillary wave within the system.
Furthermore, the CFL (
Courant–Friedrichs–Lewy) condition should be taken into account for the parabolic and hyperbolic terms on Equation (8),
and
Therefore, the time step constraint is:
4. Validation
In this section, we present the validation of the numerical results obtained using the HiG-Flow software by comparing them with the results reported in the scientific literature. The purpose is to assess the accuracy and reliability of the HiG-Flow software by evaluating its agreement with established findings. To assess the performance of the implemented interface reconstruction and advection methods, benchmark problems were simulated. These benchmark problems, namely the 3D shearing flow test and the 3D deforming field test, were chosen based on their relevance and availability in the literature, particularly in the work by Liovic
et al. [
15]. In these tests, since the velocity field is given, the sphere is not affected by the numerical dissipation of the methods used to obtain the flow velocity and pressure. In other words, the Navier-Stokes equations do not need to be solved, just the volume fraction transport equation. Therefore, it is expected that the sphere maintains its original shape at the final time of the simulation. By comparing the results obtained from the HiG-Flow simulations with the established solutions, the accuracy and fidelity of the implemented methods can be evaluated. Furthermore, the solver for the Navier-Stokes equations developed in HiG-Flow was validated using the 3D rising drop test proposed by Adelsberger
et al. [
16]. This test serves as a benchmark to assess the accuracy and performance of the solver in simulating the rising behavior of a three-dimensional droplet. Both quantitative and qualitative analyses of the results obtained from the simulations of these benchmark problems are presented in the following sections.
To quantitatively evaluate the performance of the advection algorithm implemented in HiG-Flow, the volume of fluid at the initial time
and the volume of fluid at the final time
of the simulation were compared for both the 3D shearing flow test and the 3D deforming field test. The absolute error,
, between the volumes is defined as follows:
To quantitatively evaluate the 3D rising drop test, the evolution of the bubble’s center of mass and the bubble’s rise velocity were analyzed. The evolution of the bubble’s center of mass is given by:
where
is the region of the domain filled by the bubble. By utilizing the volume fraction
f, Equation (
36) can be expressed in a different form, as follows:
where
N is the number of cells that contain a non-zero volume fraction.
Lastly, the bubble’s rise velocity is given by:
4.1. 3D shearing flow test
The 3D shearing flow test is widely used in the literature to verify the accuracy of interface advection algorithms in two-phase flows [
15,
34,
35]. In this test, a sphere is subjected to a prescribed velocity field defined by the combination of a single vortex in the
plane and laminar pipe flow in the
z direction.
To simulate this test, a sphere with a radius of 0.15 was considered, centered at the point
, in a domain with dimensions of
. The velocity field used to move the sphere within the domain is defined by:
where
,
,
and
. This velocity field generates a vortical flow, causing the initially spherical interface to take on a spiral shape. After reaching half of the total simulation time (i.e., t = 3.0), the interface reverses its trajectory and returns to its initial position at time t = 6.0, and should also reverting to its original shape.
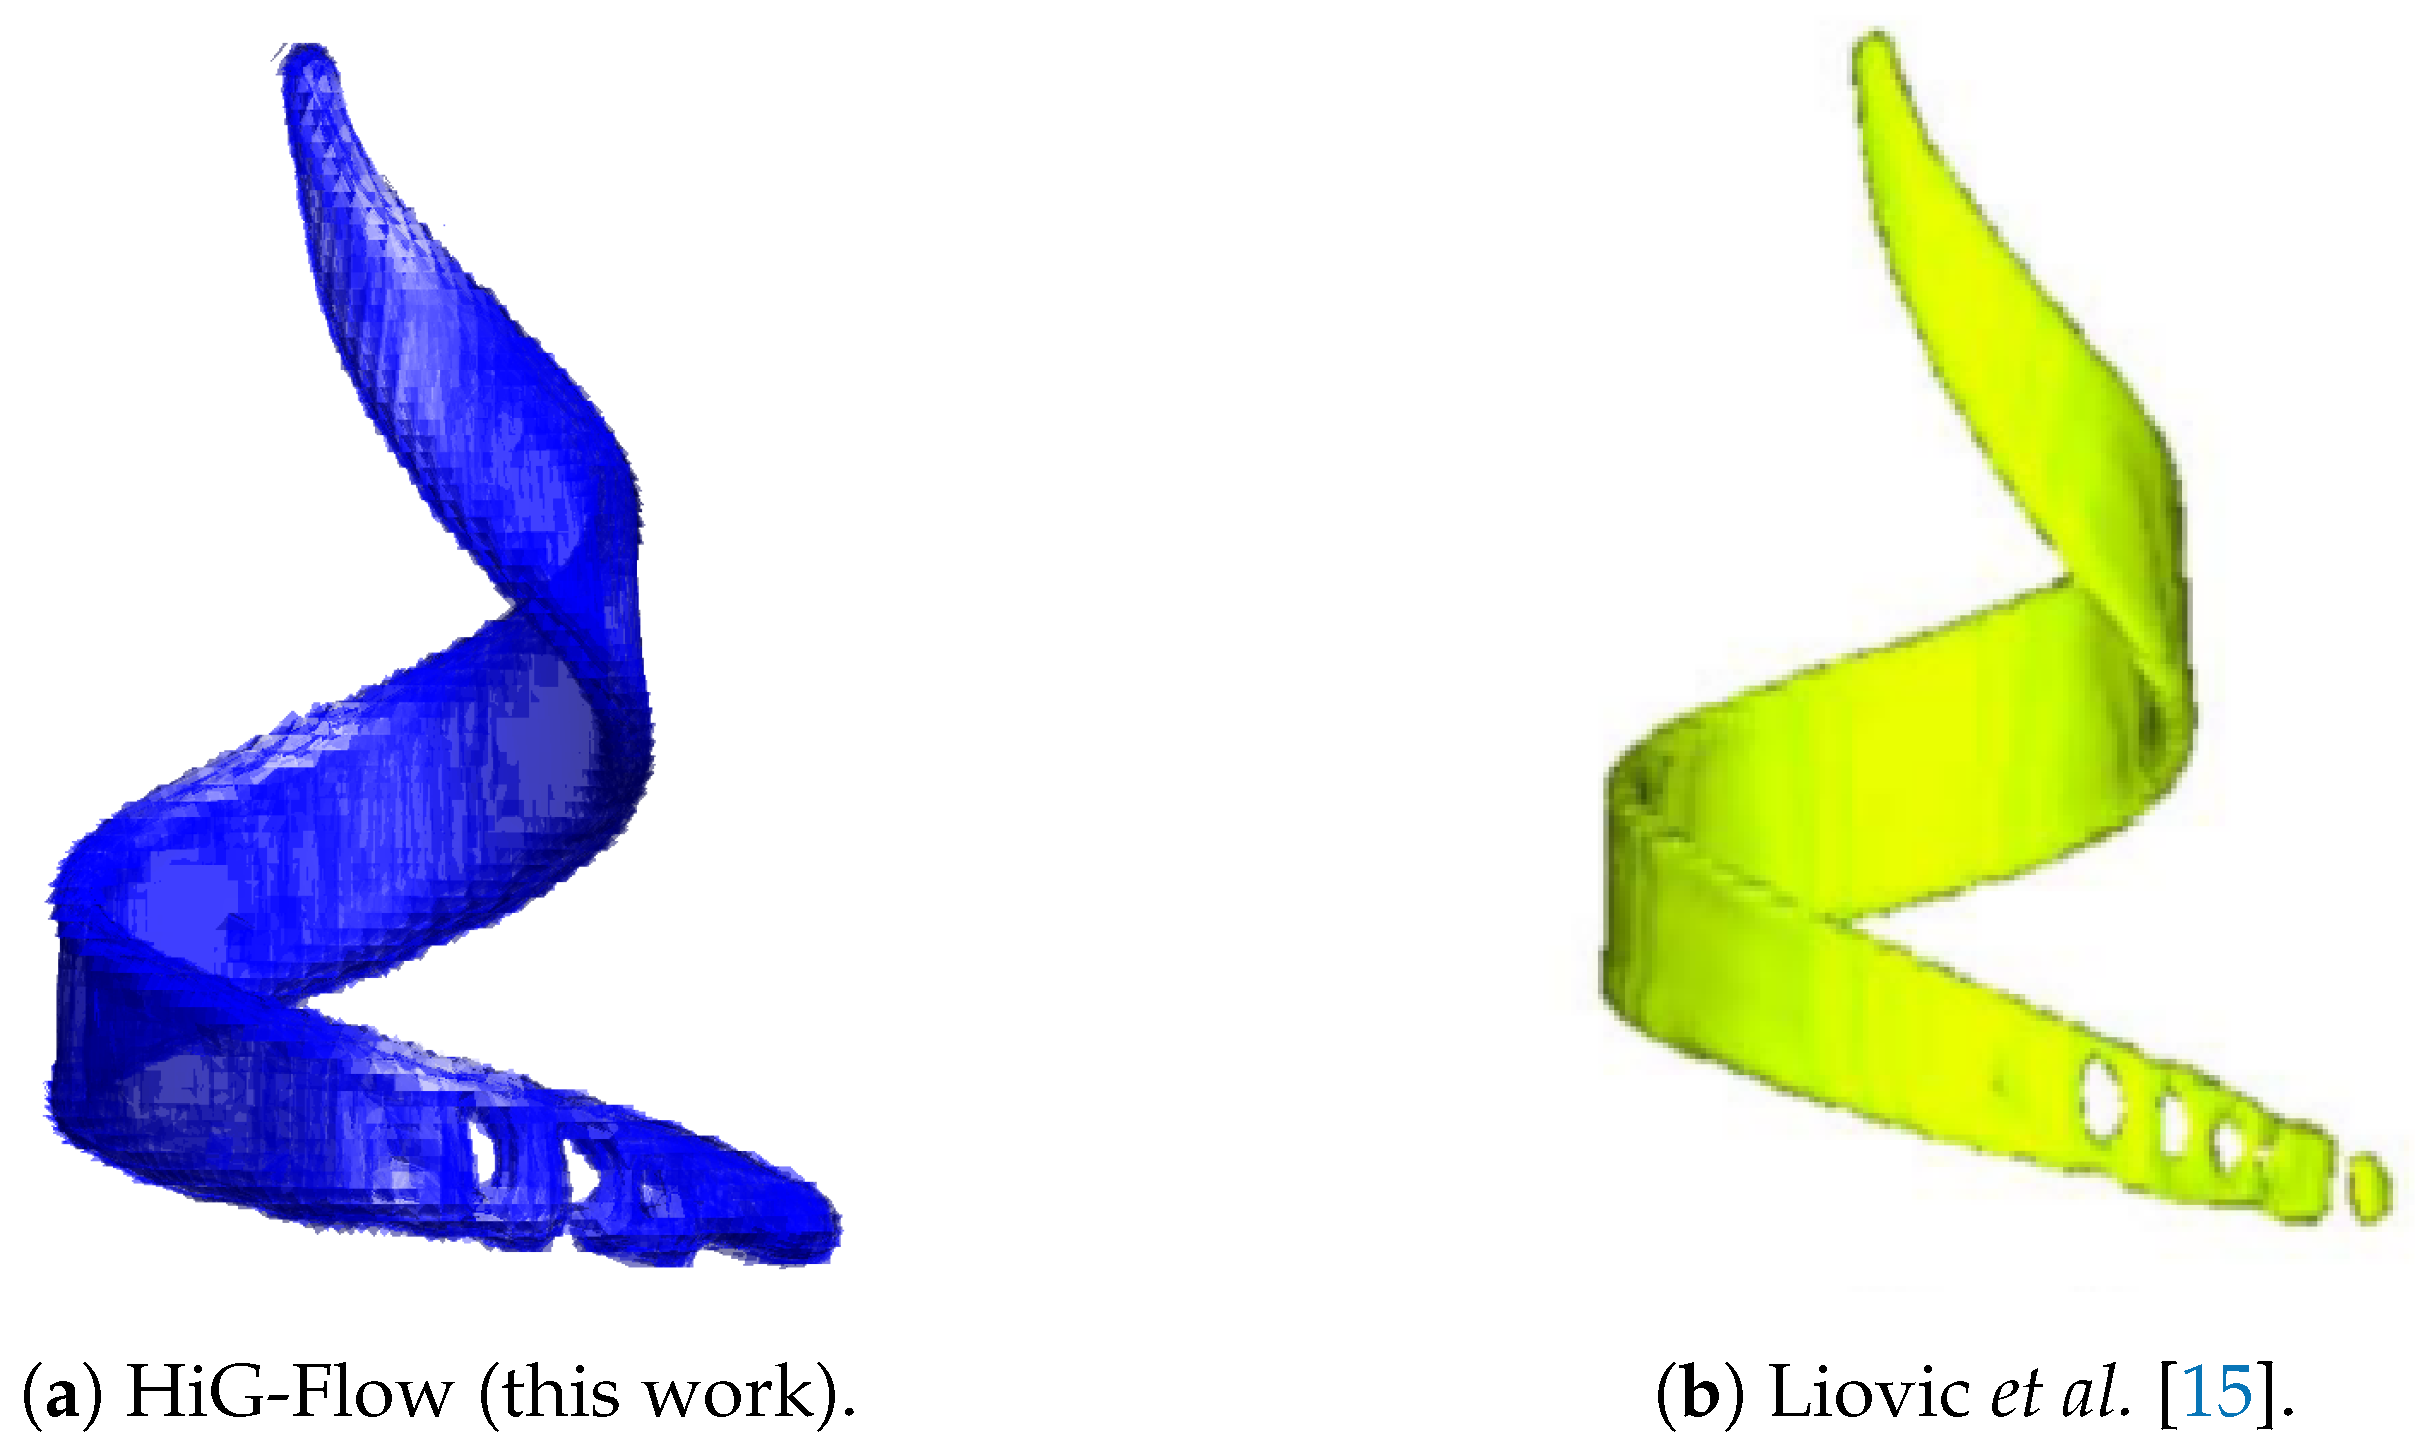
Figure 3a shows the point of maximum interface deformation in the 3D shear flow test simulated in HiG-Flow. A mesh with a resolution of
and time-step of
were used in the numerical simulations. The result obtained by HiG-Flow is compared with the findings presented by Liovic
et al. [
15], as shown in
Figure 3b, where a mesh with a resolution of
was also used. The interface shape calculated by HiG-Flow demonstrates qualitative agreement with the results obtained by Liovic
et al. [
15].
To perform a quantitative analysis of the 3D shearing flow test, the volume fraction absolute error was calculated using Equation (
35). The obtained result was then compared with the values reported in the scientific literature. This comparison is shown in
Table 1, where the HiG-Flow software showed superiority, in terms of volume fraction conservation, when compared to the results presented by Liovic
et al. [
15], Duz
et al. [
34] and Lopez
et al. [
35].
4.2. 3D deforming field test
The 3D deforming field test is also widely used in the literature to verify interface advection methods [
15,
35], as the prescribed velocity field causes the interface to assume a complex geometry during its motion. To perform this test, a sphere with a radius of 0.15 was considered, centered at the point (0.35, 0.35, 0.35), within a cubic cavity with dimensions
. The velocity field used to move the sphere within the domain is defined by:
where
.
Similarly to the 3D shearing flow test studied in
Section 4.1, the prescribed solenoidal velocity field causes the sphere to deform until reaching half of the total simulation time, and then follows a reverse trajectory, tending back to its original shape and position.
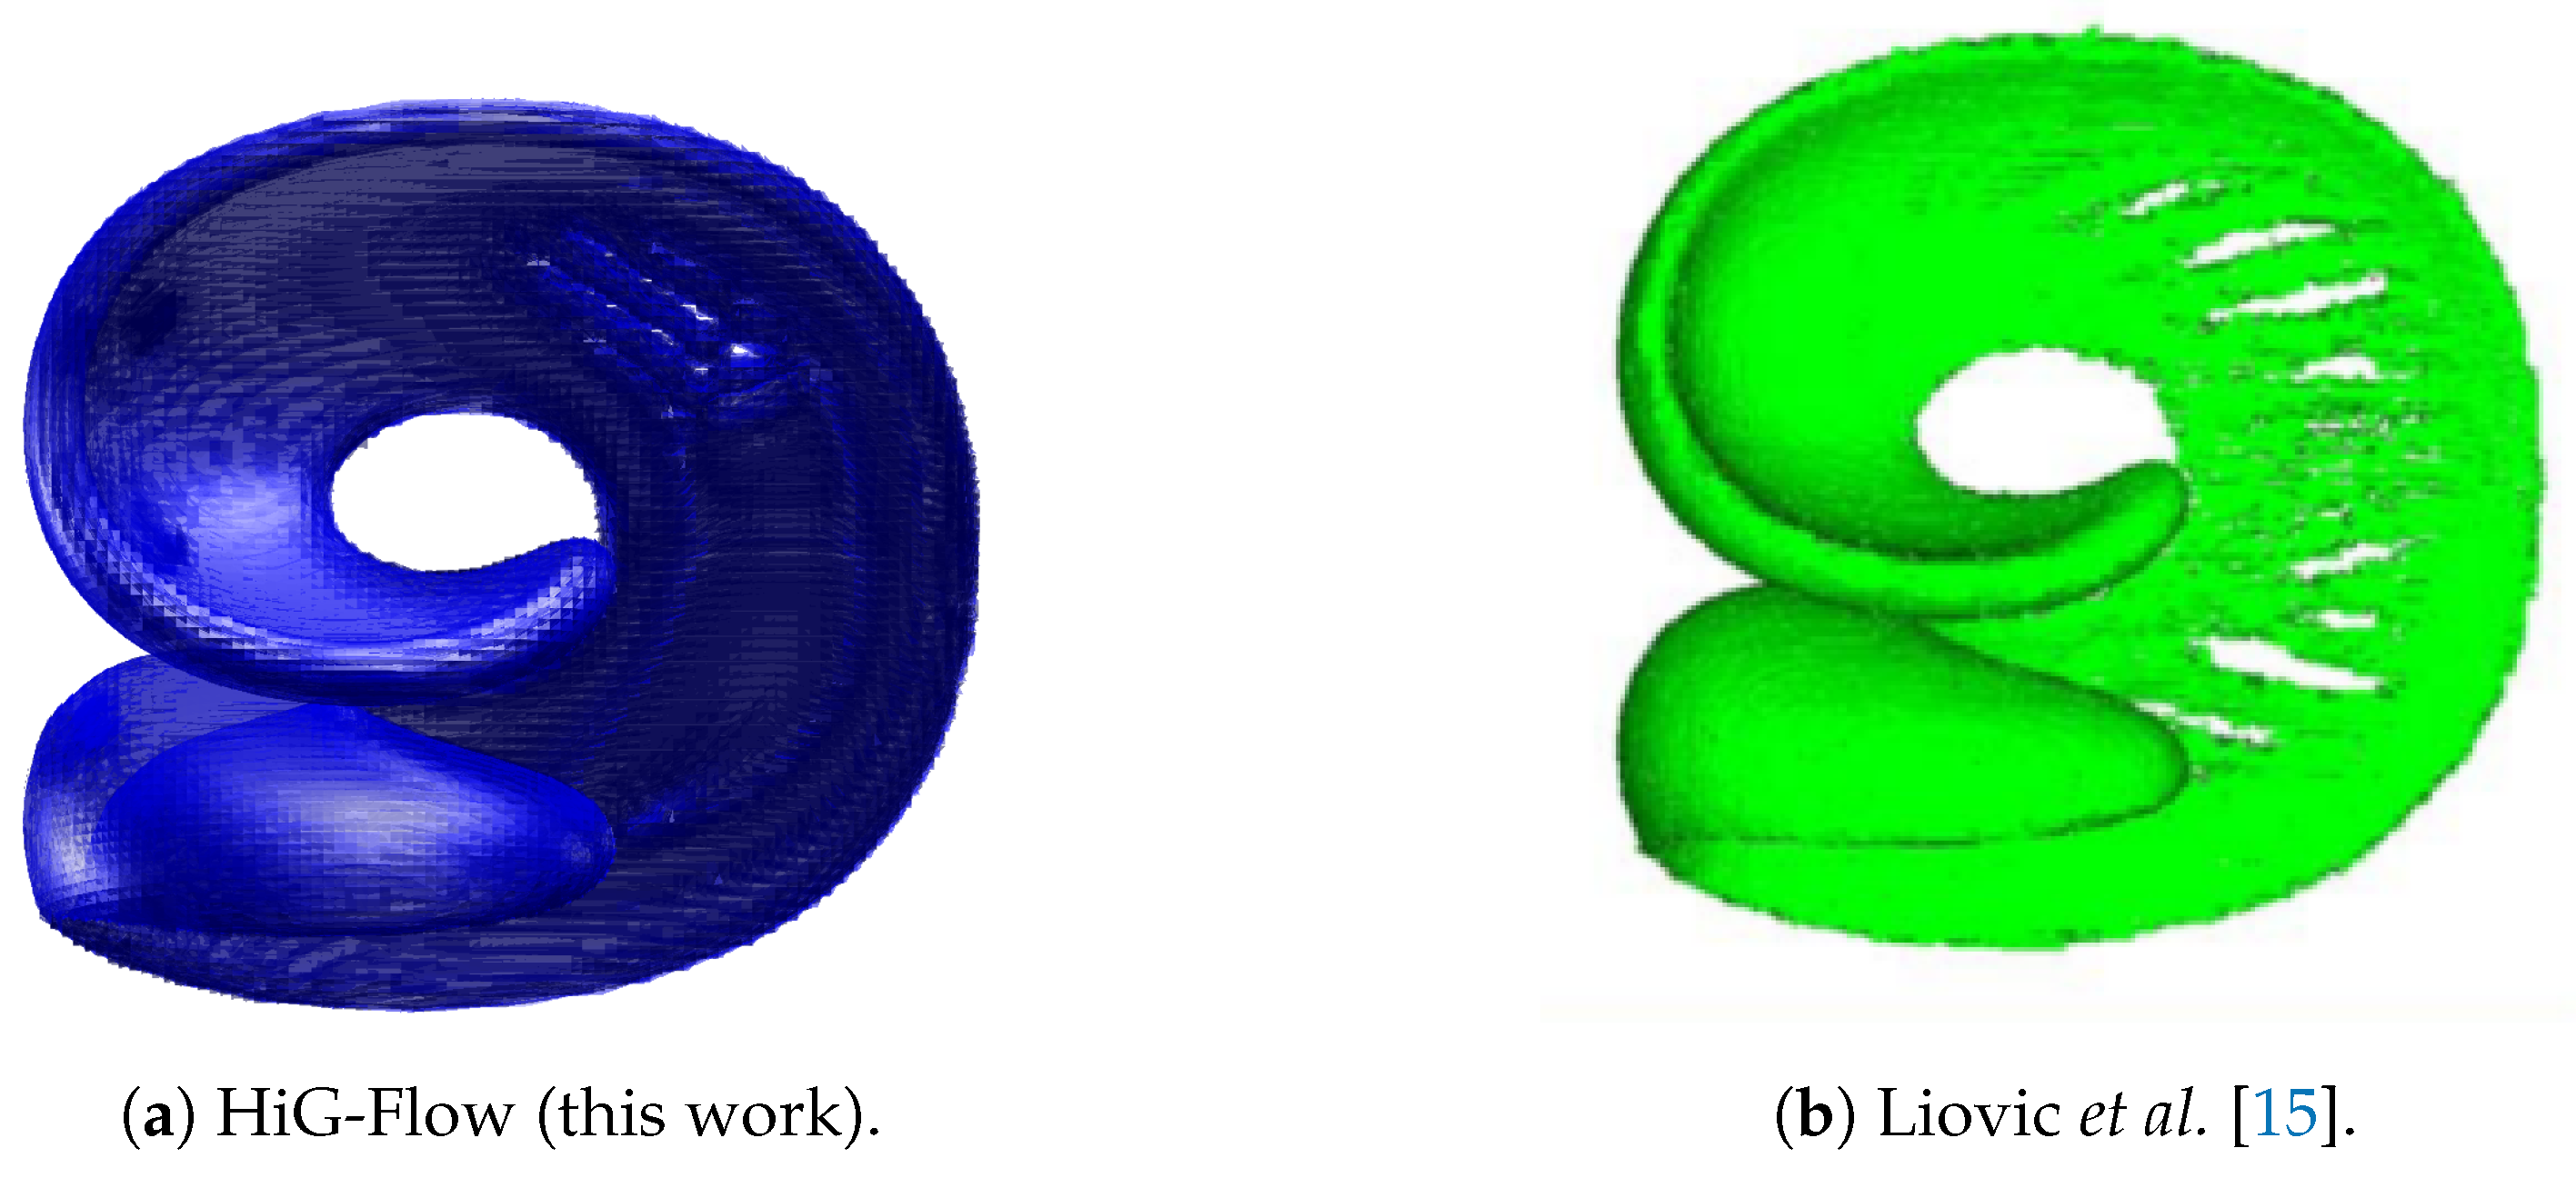
Figure 4a shows the point of maximum interface deformation in the 3D deforming field test simulated in HiG-Flow. A mesh with a resolution of
and time-step of
were used in the numerical simulations. The result is compared with the findings presented by Liovic
et al. [
15], as shown in
Figure 4b, where a mesh with a resolution of
was also used. The interface shape obtained by HiG-Flow exhibits qualitative agreement with the results obtained by Liovic
et al. [
15], with fewer regions of void volume fraction compared to their results, despite using the same level of mesh refinement.
Analogously to the previous test shown in
Section 4.1, we analyze quantitatively the results obtained here for the 3D deforming field test. For that purpose, the volume fraction absolute error was calculated using Equation (
35) in order to verify the ability of the volume tracking scheme to conserve volume. The results obtained by our newly-developed multiphase algorithm were compared with the results presented by Liovic
et al. [
15] and by Lopez
et al. [
35], as shown in
Table 2. Across all levels of mesh refinement utilized, our numerical formulation consistently yields lower errors compared to those reported in references [
15] and [
35]. These results support the methodology of developing an interface advection scheme with a divergence correction approach inside the volume fraction transport equation (see right-hand side of Equation(
18)), which leads to a closer satisfaction of both local and global volume-filling constraints.
4.3. 3D buoyancy-driven rising drop
To conclude the validation of the newly implemented numerical algorithm for simulating 3D multiphase flows, we now turn our attention to the problem of the buoyancy-driven rise of a bubble immersed in a Newtonian fluid. In this test case, we consider a bubble with a density lower than the fluid filling the column. As a result, the pressure gradient induced by gravity causes the bubble to move in the direction opposite to the gravitational field.
A bubble with a radius of
was positioned at the point
inside a tank with dimensions of
. The no-slip boundary condition was imposed on the domain walls. The simulations were performed until time reached
. A mesh size of
elements and a time-step of
was employed in the simulations. The two test cases proposed by Adelsberger
et al. [
16] were simulated. In the first case, the density and viscosity ratios between the two fluids in the tank are both equal to 10 (
). In the second case, the density ratio between the fluids is 1000 (
) and the viscosity ratio is 100 (
). In test case 1, the droplet undergoes a transformation into an ellipsoidal shape. On the other hand, in test case 2, the droplet has the potential to break up due to the lower surface tension. Test case 1 can be categorized as an ellipsoidal regime, while test case 2 falls somewhere between the skirted and dimpled ellipsoidal-cap regimes. The physical and dimensionless parameters considered for simulating these two cases are presented in
Table 3. These parameters were also used by Metivet
et. al [
1] with an high-order finite-element software, so-called FEEL.
Figure 5 illustrates a comparison of the bubble shapes at time
simulated using HiG-Flow and OpenFOAM, for the test case 1 (ellipsoidal regime). The interface shape obtained by HiG-Flow exhibits qualitative agreement with the result obtained by Adelsberger
et al. [
16] using the OpenFOAM software, where the droplet reaches a stable ellipsoidal shape at steady-state regime.
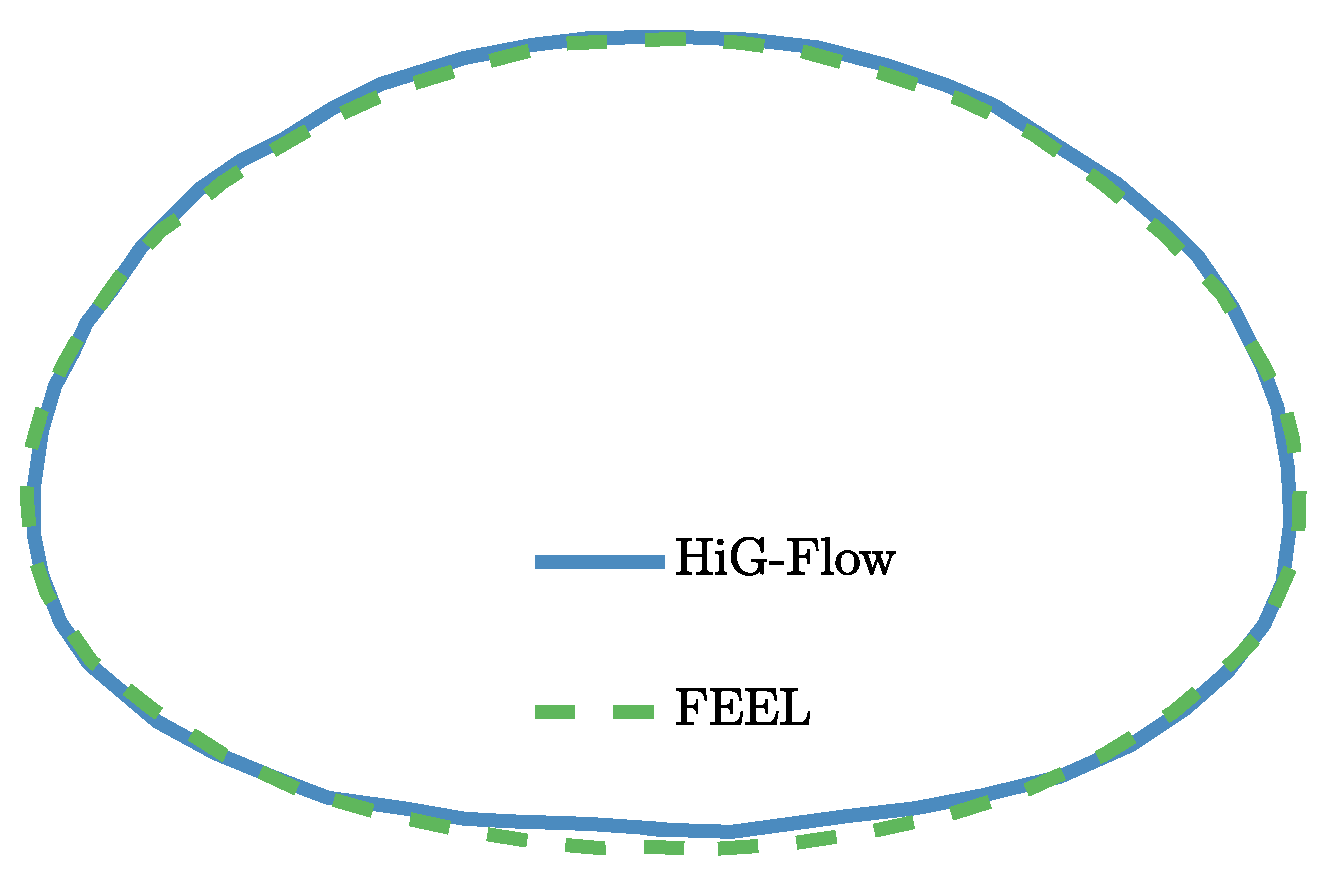
For a better comparison of the actual droplet shape,
Figure 6 illustrates the two-dimensional contour through the droplet’s center generated by the HiG-Flow (this work) and FEEL [
1] software at time
. The contour lines of HiG-Flow (blue) and FEEL (green) exhibit a close resemblance to each other, with a small difference at the bottom of the drop.
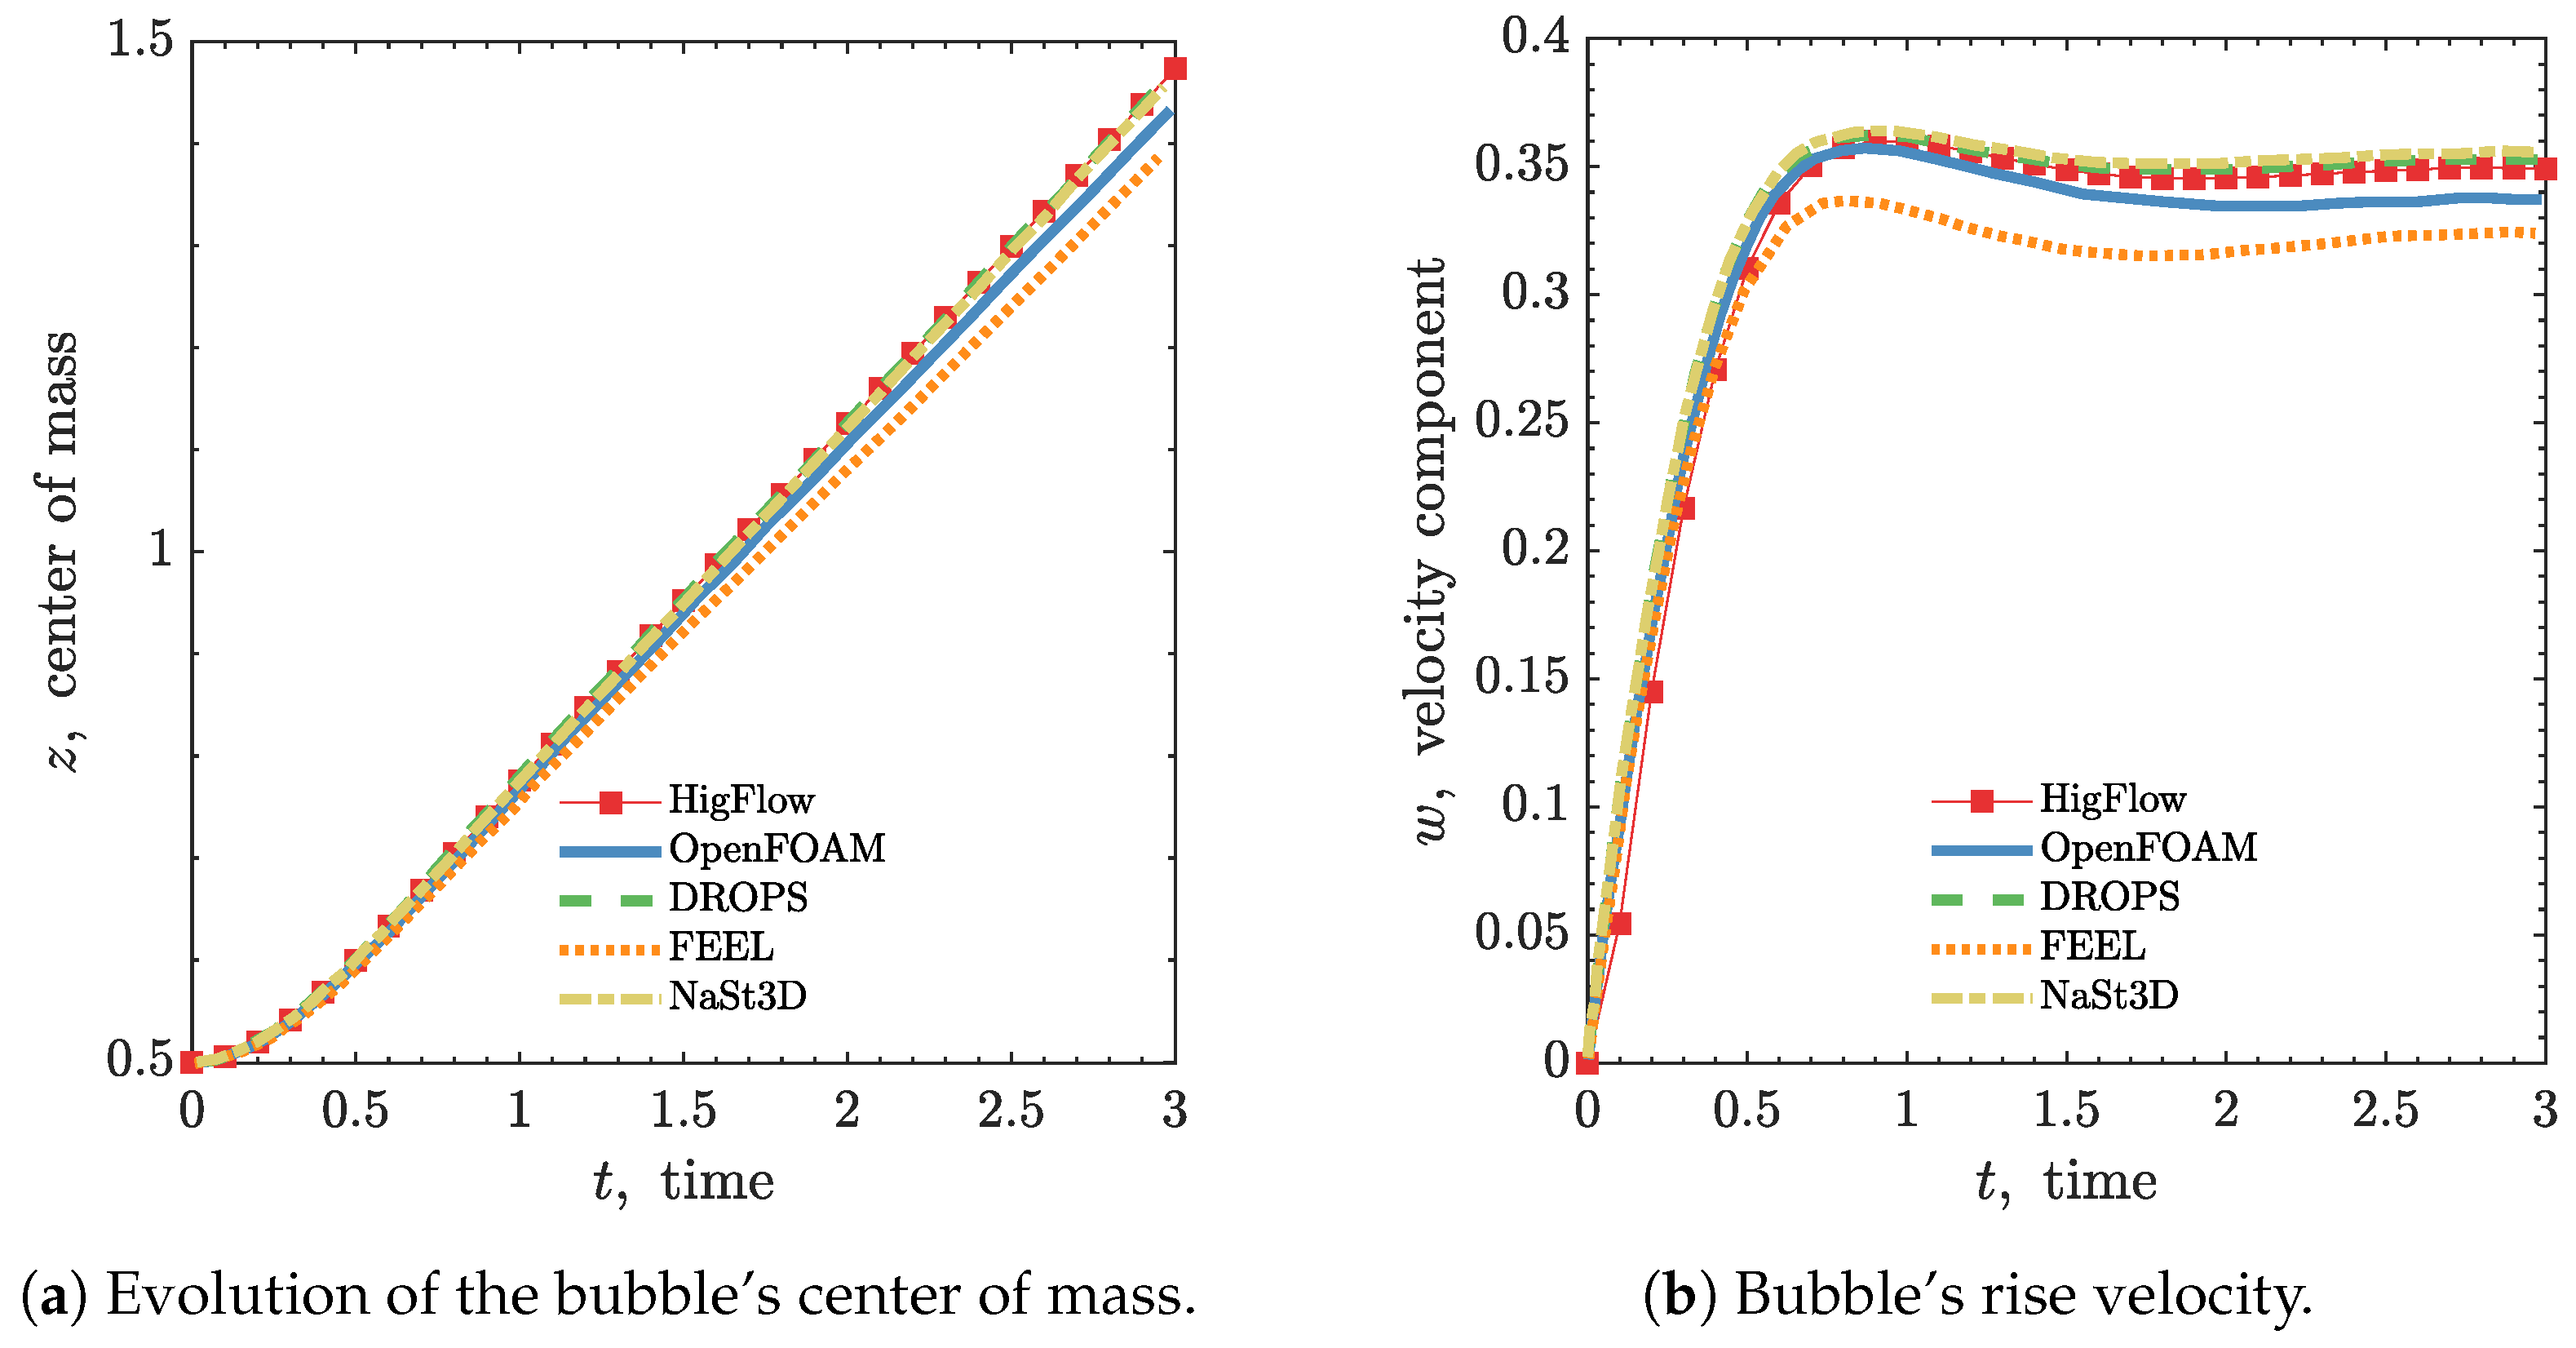
Figure 7 shows the evolution of the bubble’s center of mass and bubble’s rise velocity for test case 1. The results obtained using the newly-developed algorithm in HiG-Flow are compared to the results computed by FEEL [
1], as well as OpenFOAM, DROPS, and NaSt3D [
16]. In
Figure 7(a), at the initial stage of the simulation, up until approximately
, the drop position is nearly identical in all simulations. Afterwards, the vertical position of the droplet in OpenFOAM and FEEL software is lower than the one obtained in HiG-Flow, DROPS and NaSt3D. Our results are in excellent agreement with the findings obtained by DROPS and NaSt3D.
Figure 7(b) illustrates the rise velocity of the droplet. In the initial stages of the simulation, the vertical velocity component
of the fluid velocity gradually increases from its initial value of zero, reaching a maximum magnitude of approximately
at around
. Then, the steady-state velocity of the droplet decreases, being again in agreement with the findings obtained by DROPS and NaSt3D.
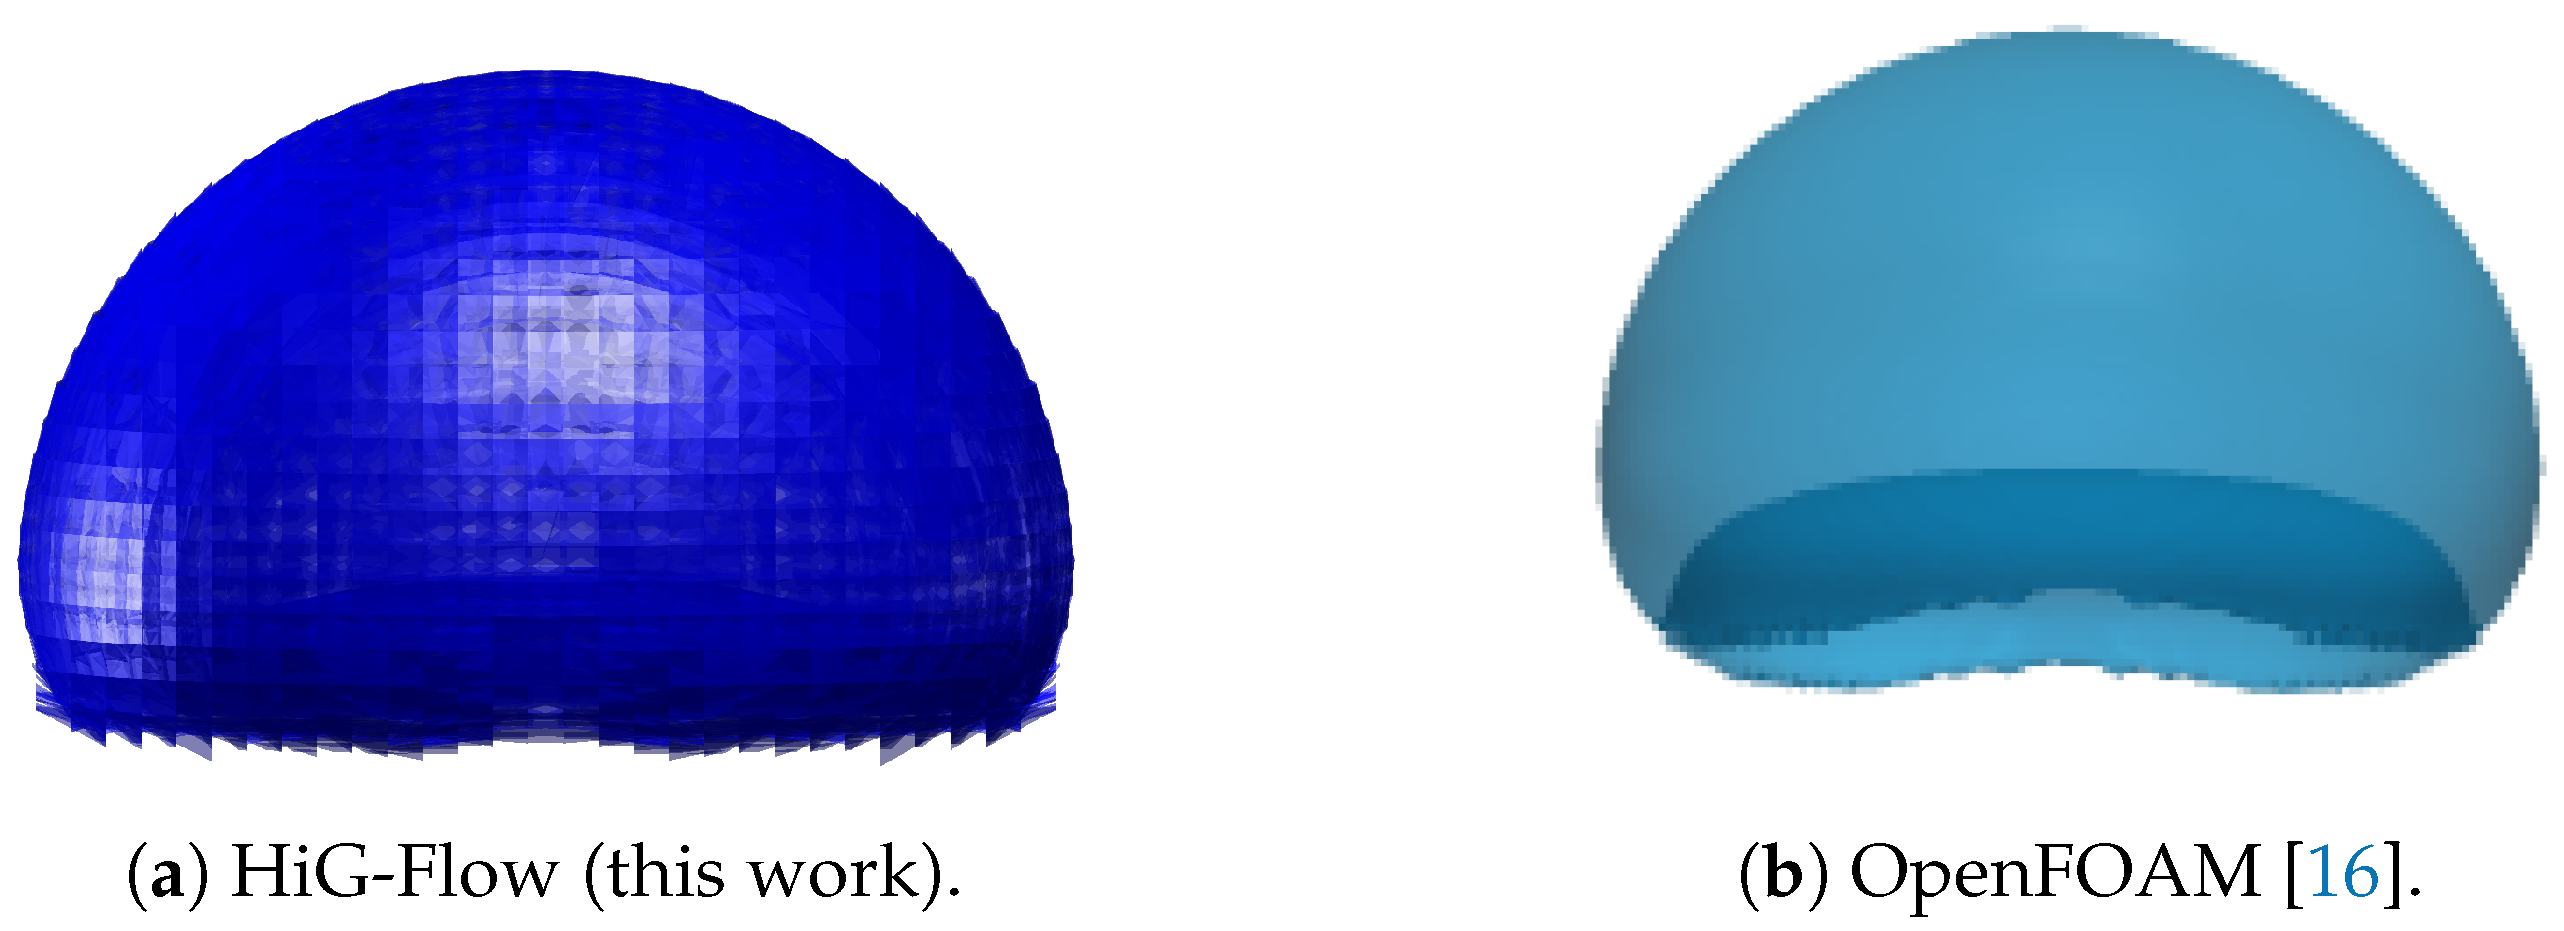
Figure 8 illustrates a comparison of the bubble shapes at time
simulated using HiG-Flow and OpenFOAM, for the test case 2 (skirted and dimpled ellipsoidal-cap regimes). Again, the interface shape obtained by HiG-Flow exhibits qualitative agreement with the result obtained by Adelsberger
et al. [
16] using the OpenFOAM software, where the droplet reaches a stable cap shape at steady-state regime. In the simulated time, our results do not indicate the presence of satellite droplets, contrary to the OpenFOAM results which predicts 8 satellite droplets as stated in Adelsberger
et al. [
16].
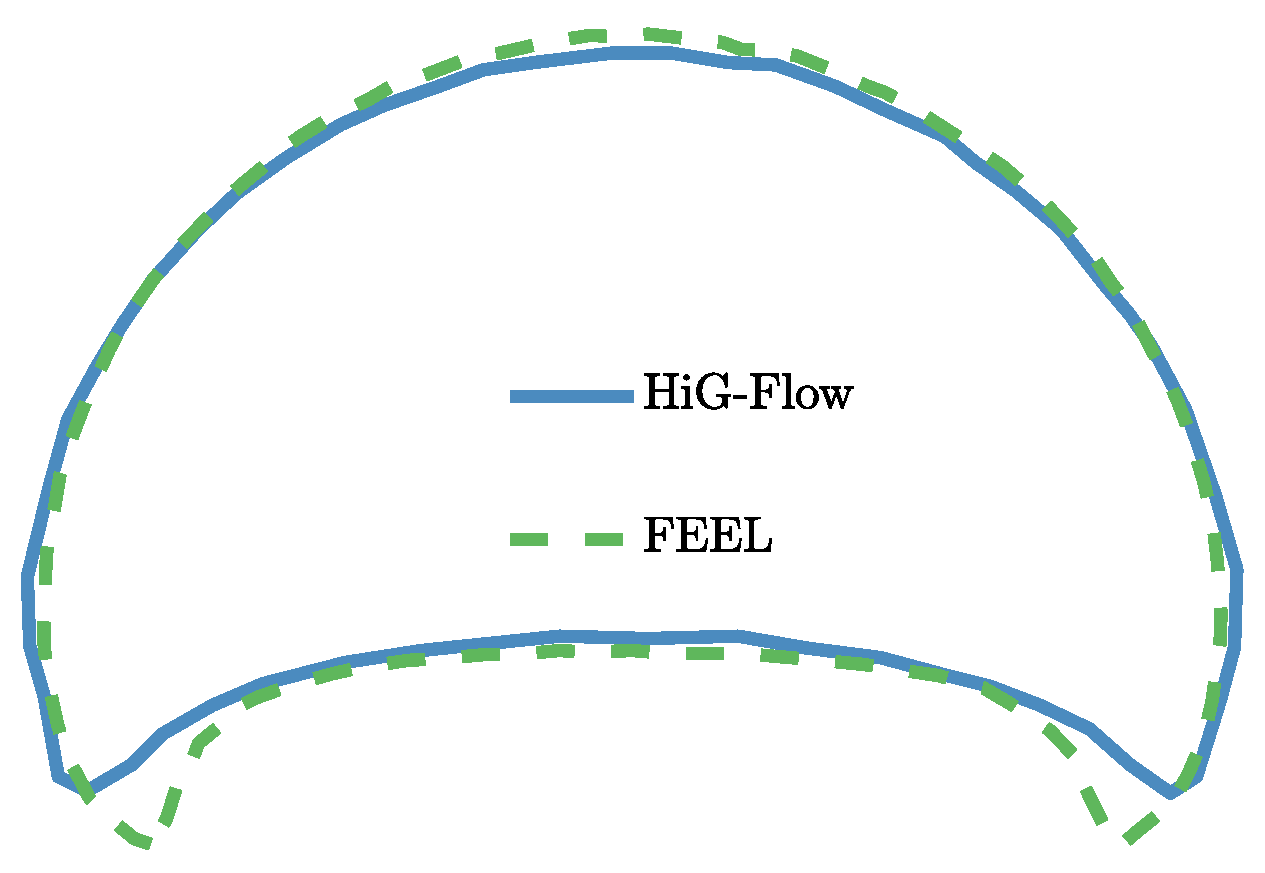
Figure 9 illustrates the comparison between two-dimensional contours through the droplet’s center generated by the HiG-Flow (this work) and FEEL [
1] software at time
. The shape of the contour lines of the bubbles obtained by both software are similar and reach a skirted format, since the surface tension is lower and the ratio between the densities and viscosities between the fluids present in the flow is higher. The differences between the two simulations are particularly noticeable along the bottom edge of the droplet, where the curvature is most pronounced. As depicted in the contour plot, the contour line in FEEL (green) appears more extended than in HiG-Flow. Furthermore, FEEL exhibits a higher contour line at the top edge of the droplet and a smaller contour line at the central part of the bottom side, when compared to that one obtained with HiG-Flow software.
Lastly,
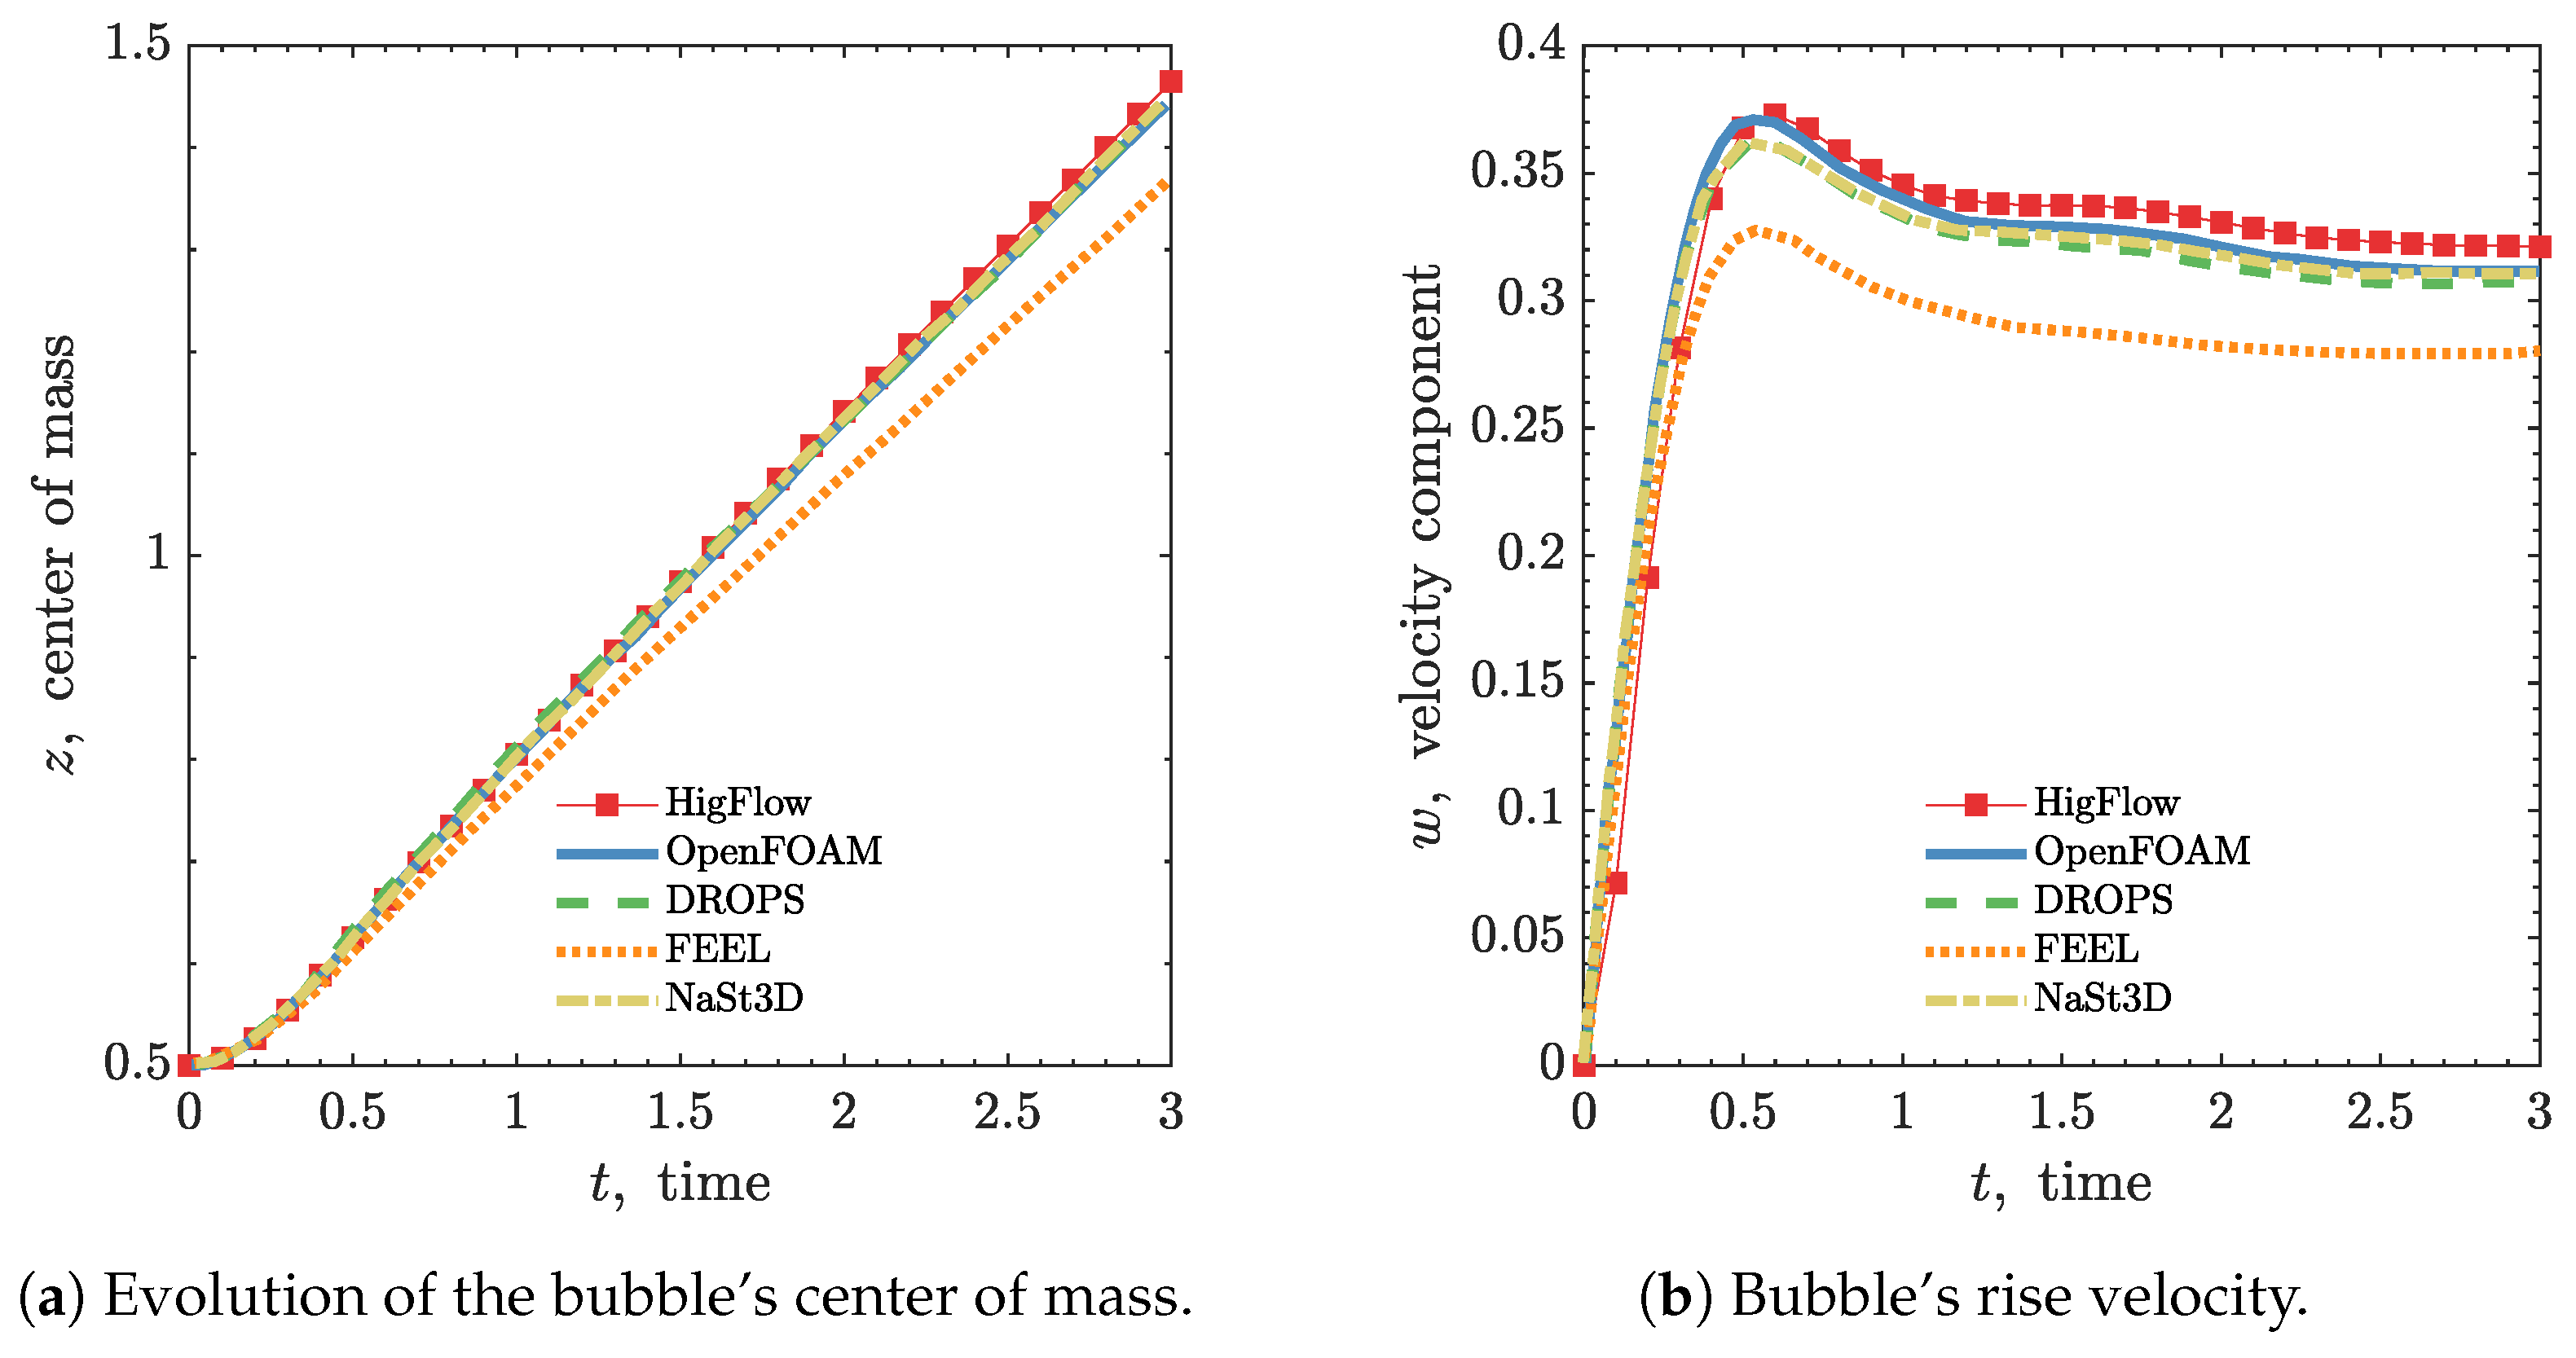
Figure 10 shows the evolution of the bubble’s center of mass and bubble’s rise velocity for test case 2. In
Figure 10(a), we show that the droplet’s position over time is similar for all the simulation time in all the flow solvers, except for the FEEL software, which can explain the differences shown in the contour plot in
Figure 9.
Figure 10(b) illustrates the rise velocity of the droplet. In the initial stages of the simulation, the vertical velocity component
of the fluid velocity gradually increases from its initial value of zero, reaching a maximum magnitude of approximately
at around
. Then, the steady-state velocity of the droplet decreases so that a final velocity of 0.32 at
is obtained using the HiG-Flow software. Our result is similar to the OpenFOAM, DROPS and NaSt3D software, which predict a final velocity of 0.31. The final velocity predicted by FEEL is approximately 0.28, showing the most significant difference compared to the velocities obtained from other software.
5. Conclusions
In conclusion, this study presents a newly developed numerical method for simulating two-phase flows of incompressible, immiscible, and isothermal Newtonian fluids. The geometric Volume of Fluid (VOF) method is employed to locate and reconstruct the interface during the dynamics of the two-phase flow. Specifically, the Piecewise-Linear Interface Calculation (PLIC) technique is implemented for three-dimensional (3D) interface transport. This technique approximates the interface in each interfacial cell using line segments. The methodology of developing an interface advection scheme with a divergence correction approach inside the volume fraction transport equation, leads to a closer satisfaction of both local and global volume-filling constraints. In addition, the continuum interfacial force (CSF) model is utilized to account for the balance of forces at the interface. Laslty, the Navier-Stokes equations are solved using meshless (possibly high-order) finite difference schemes from the HiG-Flow computational fluid dynamics software.
To validate the numerical implementation, several benchmark two-phase flows are simulated with the 3D PLIC-VOF HiG-Flow algorithm. Two standard advection numerical tests, namely the 3D shearing flow test and the 3D deforming field test, are conducted, and good agreement is observed between the 3D interface shapes obtained by the 3D PLIC-VOF HiG-Flow algorithm and those found in the scientific literature. Furthermore, the absolute error of the volume tracking advection calculation is found to be smaller than the values reported in the scientific literature for both tests, even if using coarser meshes in our calculations. Additionally, the 3D bubble rising problem is simulated for different fluid density and viscosity ratios, mimicking two different regimes, the ellipsoidal regime and the skirted and dimpled ellipsoidal-cap regime. The results obtained with the newly implemented algorithm are in good agreement with those obtained using the OpenFOAM, DROPS and NaSt3D software. The bubble’s rise velocity and center of mass evolution are computed with the 3D PLIC-VOF HiG-Flow algorithm and found to be consistent with these software.
Overall, the developed method demonstrates promising accuracy and reliability in simulating complex two-phase flows, making it a valuable tool for future fluid dynamics research. Particularly, its applicability extends to the study of complex fluid rheology, including viscoelastic fluids.
Author Contributions
Conceptualization, A.T.G.S, C.F., A.C.; methodology, A.T.G.S, C.F., A.C.; software, A.T.G.S, J.O., L.S., A.C.; validation, A.T.G.S, J.O.; formal analysis, A.T.G.S, C.F., J.O., L.S., A.C.; investigation, A.T.G.S, C.F., J.O., L.S., A.C.; writing—original draft preparation, A.T.G.S, C.F., J.O., L.S., A.C.; writing—review and editing, A.T.G.S, C.F., J.O., L.S., A.C.; project administration, C.F., L.S., A.C.; funding acquisition, C.F., L.S., A.C. All authors have read and agreed to the published version of the manuscript.
Funding
This research was financed in part by the Coordenação de Aperfeiçoamento de Pessoal de Nível Superior – Brasil (CAPES) – Finance Code 001; São Paulo Research Foundation (FAPESP) grants 2013/07375-0, 2019/07316-0 and 2023/00062-8; Fundação para a Ciência e a Tecnologia (FCT) and Centre of Mathematics (CMAT) of the University of Minho projects UIDB/00013/2020 and UIDP/00013/2020 and FCT funding contract 2022.00753.CEECIND.
Informed Consent Statement
Not applicable.
Data Availability Statement
Not applicable.
Acknowledgments
A. Castelo thanks the financial support from the São Paulo Research Foundation (FAPESP) grants 2013/07375-0, 2019/07316-0. All authors acknowledge the support by Institute of Mathematics and Computational Sciences (ICMC) at the University of Sao Paulo (USP). C. Fernandes would like to thank the financial support from the São Paulo Research Foundation (FAPESP) through grant 2023/00062-8, Fundação para a Ciência e a Tecnologia (FCT) for financial support through Centre of Mathematics (CMAT) at the University of Minho projects UIDB/00013/2020 and UIDP/00013/2020, and, would also like to thank FCT for the funding under the contract FCT/2022.00753.CEECIND. A. T. G. da Silva and J. Organista want to thanks the financial support from Coordenação de Aperfeiçoamento de Pessoal de Nível Superior – Brasil (CAPES) – Finance Code 001. Research was carried out using the computational resources of the Center for Mathematical Sciences Applied to Industry (CeMEAI) funded by FAPESP (grant 2013/07375-0).
Conflicts of Interest
The authors declare no conflict of interest.
Abbreviations
The following abbreviations are used in this manuscript:
| BDF |
Backward differentiation formula |
| BiCGS |
Biconjugate gradient squared |
| Bo |
Bond number |
| CFL |
Courant–Friedrichs–Lewy |
| CSF |
Continuum surface force |
| HiG |
Hierarchical Grid |
| HYPRE |
High Performance Preconditioners |
| MLS |
Moving least squares |
| PETSc |
Portable, Extensible Toolkit for Scientific Computation |
| PLIC |
Piecewise-linear interface calculation |
| Re |
Reynolds number |
| SLIC |
Simple line interface calculation |
| TVD |
Total variation diminishing |
| VOF |
Volume of fluid |
References
- Metivet, T.; Chabannes, V.; Ismail, M.; Prud’homme, C. High-Order Finite-Element Framework for the Efficient Simulation of Multifluid Flows. Mathematics 2018, 6, 203. [CrossRef]
- Pineda, H.; Biazussi, J.; López, F.; Oliveira, B.; Carvalho, R.D.M.; Bannwart, A.C.; Ratkovich, N. Phase distribution analysis in an Electrical Submersible Pump (ESP) inlet handling water–air two-phase flow using Computational Fluid Dynamics (CFD). Journal of Petroleum Science and Engineering 2016, 139, 49–61. [CrossRef]
- Haroun, Y.; Legendre, D.; Raynal, L. Volume of fluid method for interfacial reactive mass transfer: Application to stable liquid film. Chemical Engineering Science 2010, 65, 2896–2909. [CrossRef]
- Štěpánek, F.; Rajniak, P.; Mancinelli, C.; Chern, R.T.; Ramachandran, R. Distribution and accessibility of binder in wet granules. Powder Technology 2009, 189, 376–384. [CrossRef]
- Carciofi, B.A.M.; Prat, M.; Laurindo, J.B. Dynamics of vacuum impregnation of apples: Experimental data and simulation results using a VOF model. Journal of Food Engineering 2012, 113, 337–343. [CrossRef]
- Wörner, M. Numerical modeling of multiphase flows in microfluidics and micro process engineering: a review of methods and applications. Microfluid Nanofluid 2012, 12, 841–886. [CrossRef]
- Popinet, S. Numerical Models of Surface Tension. Annual Review of Fluid Mechanics 2018, 50, 49–75. [CrossRef]
- Unverdi, S.O.; Tryggvason, G. A front-tracking method for viscous, incompressible, multi-fluid flows. Journal of Computational Physics 1992, 100, 25–37. [CrossRef]
- Tryggvason, G.; Bunner, B.; Esmaeeli, A.; Juric, D.; Al-Rawahi, N.; Tauber, W.; Han, J.; Nas, S.; Jan, Y.-J. A front-tracking method for the computations of multiphase flow. Journal of Computational Physics 2001, 169, 708–759. [CrossRef]
- Hirt, C.W.; Amsden, A.A.; Cook, J.L. An arbitrary Lagrangian-Eulerian computing method for all flow speeds. Journal of Computational Physics 1974, 14, 227–253. [CrossRef]
- Scardovelli, R.; Zaleski, S. Direct numerical simulation of free-surface and interfacial flow. Annual Review of Fluid Mechanics 1999, 31, 567–603. [CrossRef]
- Anderson, D.M.; McFadden, G.B.; Wheeler, A.A. Diffuse-interface methods in fluid mechanics. Annual Review of Fluid Mechanics 1998, 30, 139–165 https://doi.org/10.1146/annurev.fluid.30.1.139.
- Sethian, J.A.; Smereka, P. Level set methods for fluid interfaces. Annual Review of Fluid Mechanics 2003, 35, 341–372. [CrossRef]
- Peskin, C.S. The immersed boundary method. Acta Numerica 2002, 11, 479–517. [CrossRef]
- Liovic, P.; Rudman, M.; Liow, J.-L.; Lakehal, D.; Kothe, D. A 3D unsplit-advection volume tracking algorithm with planarity-preserving interface reconstruction. Computers & Fluids 2006, 35, 1011–1032. [CrossRef]
- Adelsberger, J.; Essery, P.; Griebel, M.; Groβ, S.; Klitz, M.; Rüttgers, A. 3D incompressible two-phase flow benchmark computations for rising droplets. 11th World Congress on Computational Mechanics (WCCM XI) Proceedings 2014.
- DROPS package for simulation of two-phase flows. http://www.igpm.rwth-aachen.de/DROPS/ (accessed on 21 june 2023).
- Croce, R.; Griebel, M.; Schweitzer, M. A. Numerical simulation of bubble and droplet deformation by a level set approach with surface tension in three dimensions. International Journal for Numerical Methods in Fluids 2010, 62, 963–993. [CrossRef]
- OpenFOAM, The Open Source CFD Toolbox, User Guide Version 2.2.2. http://www.openfoam.org (accessed on 21 june 2023).
- Figueiredo, R. A. Simulação numérica de escoamentos viscoelásticos multifásicos complexos. PhD Thesis, University of São Paulo, Brazil, September 9th, 2016. [CrossRef]
- Noh, W.F., Woodward, P. (1976). SLIC (Simple Line Interface Calculation). In: van de Vooren, A.I., Zandbergen, P.J. (eds) Proceedings of the Fifth International Conference on Numerical Methods in Fluid Dynamics June 28 – July 2, 1976 Twente University, Enschede. Lecture Notes in Physics, vol 59. Springer, Berlin, Heidelberg. [CrossRef]
- Hirt, C. W.; Nichols, B. D. Volume of Fluid (VOF) method for the dynamics of free boundaries. J. Comput. Phys. 1981, 39, 201–225. [CrossRef]
- Youngs, D. L. Time-dependent multi-material flow with large fluid distortion. In Numerical Methods in Fluid Dynamics; Morton, K.W., Baines, M.J., Eds.; Academic Press: Cambridge, EUA, 1982; pp. 273–285.
- Rudman, M. Volume-tracking methods for interfacial flow calculations. Int. J. Numer. Methods in Fluids 1997, 24, 671–691. [CrossRef]
- Mehta, S.; Patel, N.; Zinjala, H.; Banerjee, J. Development of 3-D geometric PLIC-VOF solver for two-fluid flow simulation. In Proceedings of the Fortieth National Conference on Fluid Mechanics and Fluid Power, NIT Hamirpur, Himachal Pradesh, India, Date of Conference (12-14 December 2013).
- Puckett, E. G.; Almgren, A. S.; Bell, J. B.; Marcus, D. L.; Rider, W. J. A high-order projection method for tracking fluid interfaces in variable density incompressible flows. J. Comput. Phys. 1997, 130, 269–282. [CrossRef]
- Brackbill, J. U.; Kothe, D. B.; Zemach, C. A continuum method for modeling surface tension. J. Comput. Phys. 1992, 100, 335–354. [CrossRef]
- Torrey, M. D.; Cloutman, L. D.; Mjolsness, R. C.; Hirt, C. W. NASA-VOF2D: a computer program for incompressible flows with free surfaces. NASA STI/Recon Technical Report 1985, 86, 30116.
- Chorin, A. J. Numerical solution of the Navier-Stokes equations. Mathematics of Computation 1968, 22(104), 745–762. [CrossRef]
- Lages, C. F. A. Métodos numéricos para escoamentos multifásicos em malhas hierárquicas. Ph.D dissertation, University of São Paulo, Brazil, March 3rd, 2016. [CrossRef]
- Popinet, S. Numerical models of surface tension. Annual Review of Fluid Mechanics 2018, 50, 49–75. [CrossRef]
- Sousa, F. S.; Lages, C. F.; Ansoni, J. L.; Castelo, A.; Simao, A. A finite difference method with meshless interpolation for incompressible flows in non-graded tree-based grids. Journal of Computational Physics 2019, 396, 848–866. [CrossRef]
- Rider, W. J.; Kothe, D. B. Reconstructing volume tracking. Journal of Computational Physics 1998, 141(2), 112–152. [CrossRef]
- Duz, B.; Borsboom, M. J. A.; Veldman, A. E. P.; Wellens, P.; Huijsmans, R. Efficient and accurate PLIC-VOF techniques for numerical simulations of free surface water waves. In Proceedings of the 9th International Conference on Computational Fluid Dynamics - ICCFD9 2016, [ICCFD9-2016-288].
- López, J.; Zanzi, C.; Gómez, P.; Faura, F.; Hernández, J. A new volume of fluid method in three dimensions—Part II: Piecewise-planar interface reconstruction with cubic-Bézier fit. International Journal for Numerical Methods in Fluids 2008, 58(8), 923–944. [CrossRef]
- Devine, K. D.; Boman, E. G.; Riesen, L. A.; Catalyurek, U. V.; Chevalier, C. Getting started with Zoltan: A short tutorial. In Dagstuhl Seminar Proceedings; Schloss Dagstuhl-Leibniz-Zentrum für Informatik: Wadern, Germany, 2009.
- Heroux, M. A.; Bartlett, R. A.; Howle, V. E.; Hoekstra, R. J.; Hu, J. J.; Kolda, T. G.; Lehoucq, R. B.; Long, K. R.; Pawlowski, R. P.; Phipps, E. T.; Salinger, A. G.; Thornquist, H. K.; Tuminaro, R. S.; Willenbring, J. M.; Williams, A. T.; Stanley, K. S. An overview of the Trilinos project. ACM Transactions on Mathematical Software (TOMS) 2005, 31(3), 397–423. [CrossRef]
- Falgout, R. D.; Yang, U. M. hypre: A library of high performance preconditioners. Lecture Notes in Computer Science 2002; 632–641. [CrossRef]
- Balay, S.; Abhyankar, S.; Adams, M.; Brown, J.; Brune, P.; Buschelman, K.; Dalcin, L. D.; Eijkhout, V.; Gropp, W.; Kaushik, D.; Knepley, M.; May, D.; McInnes, L. Curfman; Munson, T.; Rupp, K.; Sanan, P.; Smith, B.; Zampini, S.; Zhang, H.; Zhang, H. PETSc Users Manual Revision 3.8. United States, 2017. Web. [CrossRef]
- Sonneveld, P. CGS, a fast Lanczos-type solver for nonsymmetric linear systems. SIAM Journal on Scientific and Statistical Computing 1989, 10(1), 36–52. [CrossRef]
- Anzt, H.; Dongarra, J.; Flegar, G.; Higham, N. J.; Quintana-Ortí, E. S. Adaptive precision in block-Jacobi preconditioning for iterative sparse linear system solvers. Concurrency and Computation: Practice and Experience 2019, 31(6), e4460. [CrossRef]
|
Disclaimer/Publisher’s Note: The statements, opinions and data contained in all publications are solely those of the individual author(s) and contributor(s) and not of MDPI and/or the editor(s). MDPI and/or the editor(s) disclaim responsibility for any injury to people or property resulting from any ideas, methods, instructions or products referred to in the content. |
© 2023 by the authors. Licensee MDPI, Basel, Switzerland. This article is an open access article distributed under the terms and conditions of the Creative Commons Attribution (CC BY) license (http://creativecommons.org/licenses/by/4.0/).

