Preprint
Article

Colorimetric PADs Backed by Chemometrics for Pd(II) Detection

Altmetrics

Downloads

121

Views

45

Comments

0

A peer-reviewed article of this preprint also exists.

Submitted:

04 August 2023

Posted:

08 August 2023

You are already at the latest version

Alerts
Abstract
The paper presents the development of cheap and selective Paper-based Analytical Devices (PADs) for Pd(II) determination. The PADs were obtained with an azoic ligand, (2-(tetrazolylazo)-1,8 dihydroxy naphthalene-3,6,-disulphonic acid), termed TazoC, and filter paper as the substrate. The orange TazoC-PADs interact quickly with Pd(II) solutions by forming a complex purple-blue-colored already at a very acidic pH (lower than 2). The dye complexes no other metal ions at such an acidic media, making TazoC-PADs highly selective to Pd(II) detection. Besides, at higher pH values, other cations, for example, Cu(II) and Ni(II), can interact with TazoC through the formation of stable and pink-magenta-colored complexes; however, it is possible to quantify Pd(II) also in the presence of other cations using a multivariate approach. Indeed, by applying Partial Least Square regression (PLS), the spectra of the TazoC-PADs were related to the Pd(II) concentrations both when present alone in solution and also in the presence of Cu(II) and Ni(II). The PLS models correctly predicted Pd(II) concentrations in unknown samples and tap water spiked with the metal cation.
Keywords: 
Subject: Chemistry and Materials Science  -   Analytical Chemistry

1. Introduction

Platinum-group metals, comprising palladium, platinum, rhodium, ruthenium, osmium and iridium, are extensively used in several industrial processes since their peculiar physical-chemical properties [1]. For example, these metals are often employed as efficient catalysts to synthesize drug compounds [2,3,4] Platinum-group metals are also an essential part of vehicle catalyst systems to reduce the emission of gaseous pollutants, such as nitrogen oxides, carbon monoxide and hydrocarbons [5], but consequently due to the increased numbers of cars the released concentration of Pd, Rh and Pt have rapidly increased in the environment [5,6,7,8,9,10].
Toxicological studies have indicated that Pd, in particular, being transported to biological systems, accumulates in the food chain resulting in potential health risks [11,12].
For these reasons, it is fundamental to develop analytical methods for determining Pd in environmental and biological matrices.
The most employed instrumental analytical techniques for Pd determination are atomic absorption spectrometry (AAS), inductively coupled plasma–mass spectrometry (ICP-MS), inductively coupled plasma-atomic emission spectrometry (ICP-AES) and neutron activation analysis (NAA) [13]. Most of these methods present high sensitivity but are bulky and expensive; besides, they require time-consuming sample preparation, sometimes including separation and preconcentration steps before the instrumental analysis [13,14,15].
Few works reported the application of electrochemical methods, which use mercury electrodes for palladium determination. Their application in stripping voltammetry ensures high sensitivity, low detection limits, and excellent reproducibility. However, these methods are ineffective for routine analyses due to the problems related to mercury's toxicity and disposal [16,17,18].
Significant advances have been made in the development of sensors devoted to Pd(II) detection. Despite a couple of examples where electrochemical sensors were proposed [19,20], in the majority of cases, these are fluorimetric and colorimetric [21,22,23,24].
The development of solid-substrate-based colorimetric sensors for both qualitative and quantitative determination of metal ions in water samples is one of the most interesting and promising strategies for metal ions sensing since these devices have several advantages: they are sensitive, practical, and adapt to inexperienced users.
Among colorimetric sensors, Paper-based Analytical Devices (PADs) were widely applied for environmental analyses, food controls and clinical trials due to their easy preparation and quick response advantages [25,26,27].
The capillary properties of paper provided by the cellulosic fiber network eliminate the necessity of pumping methods instead required in conventional microfluidic devices. Besides, the paper's ample availability, biodegradability, low price, and ease of surface functionalization make it an attractive substrate in sensors' development [27,28,29].
Using colored complexes is a helpful strategy for colorimetric sensing on PADs and has been applied for detecting metal ions in different matrixes [30,31,32,33].
Differently from the univariate approach, the capability of chemometrics tools to extract a vast quantity of information can improve the performances of the PADs to discriminate and classify samples or for multiple-analytes detection [27,34,35,36,37,38]. Moreover, the proper application of chemometric tools to paper-based devices increases their accuracy, reliability, and robustness, thus strengthening their potential [38].
The present work fits into this scenario; chemometric-assisted colorimetric PADs were developed for Pd(II) detection.
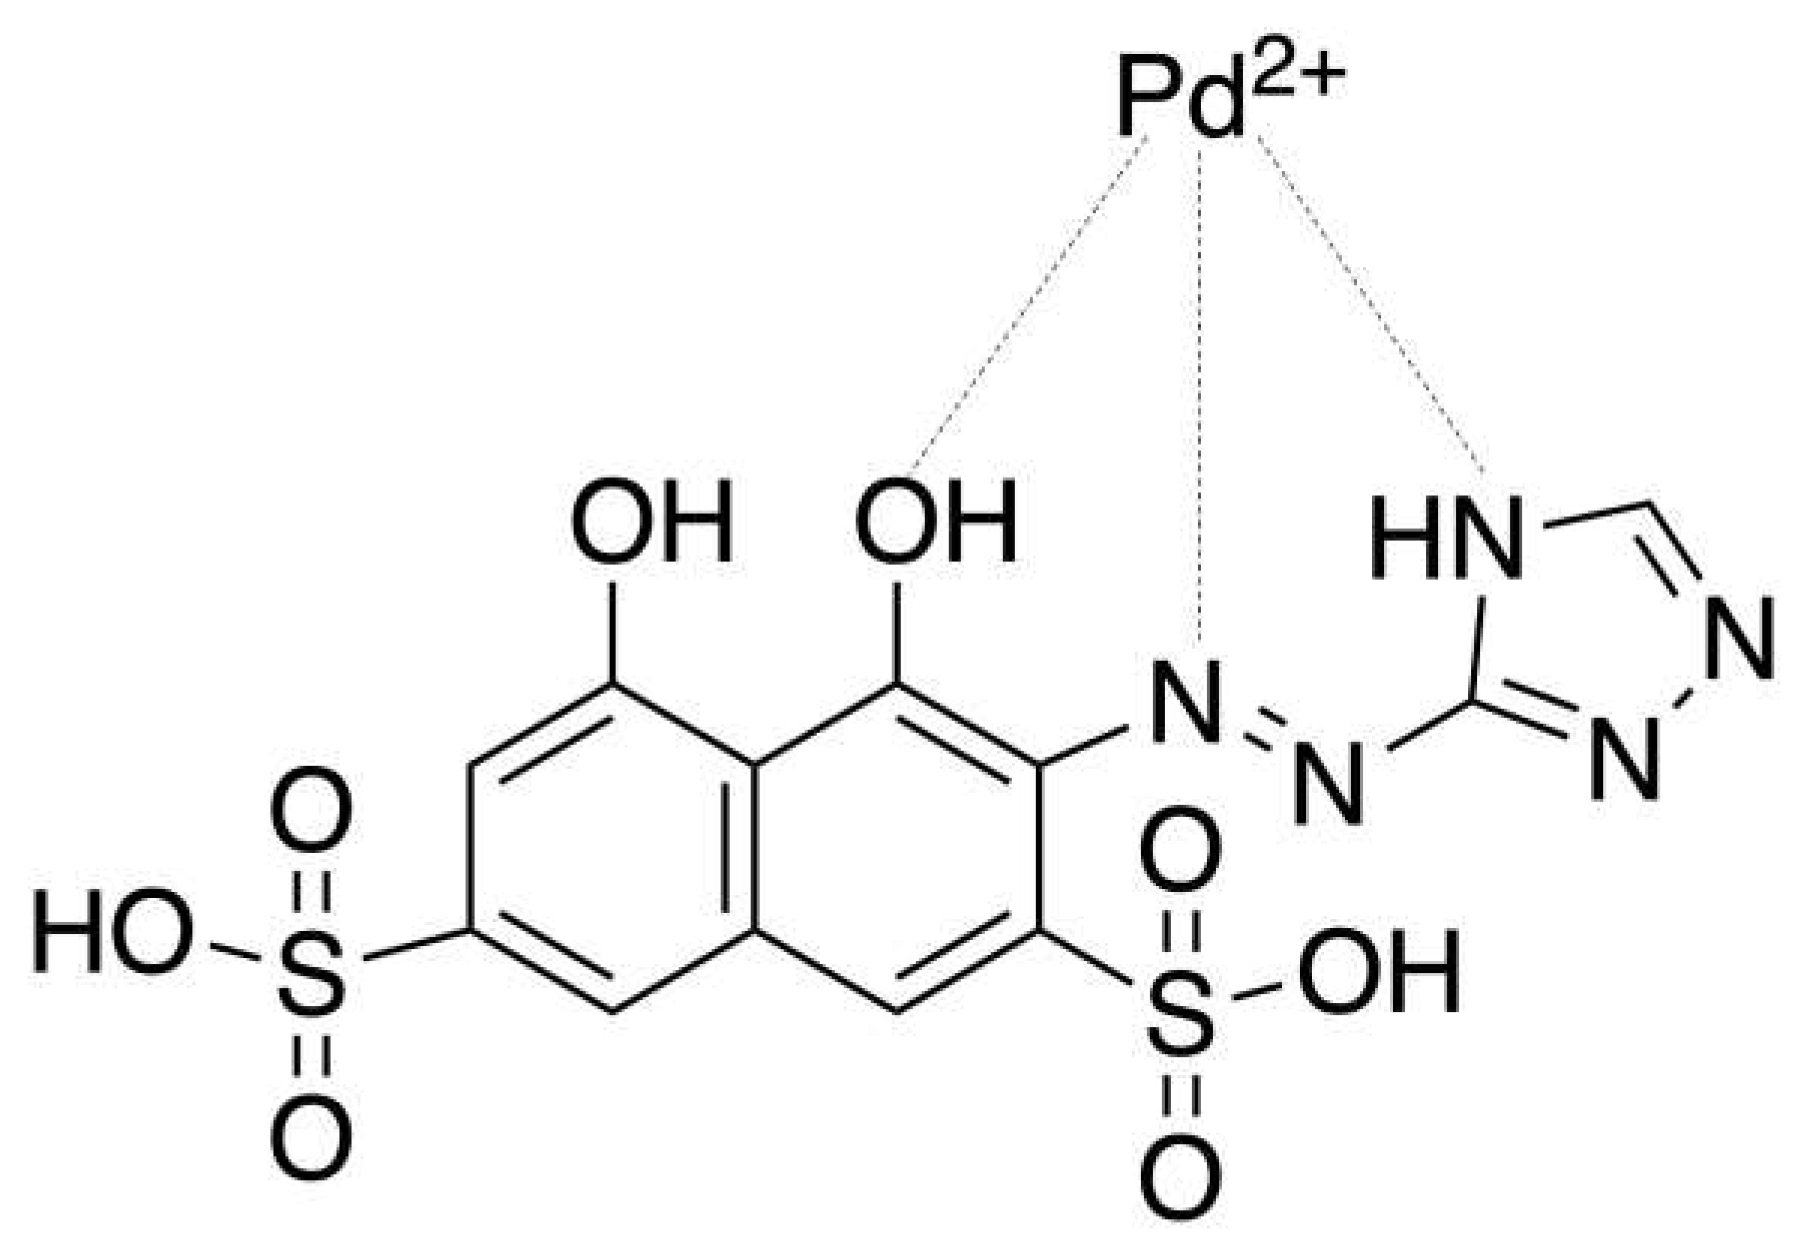
TazoC (disodium 2-[(1H-5-tetrazolyl)azo]-1,8-dihydroxynaphthalene-3,6 disulphonate, C11H6O8N6S2Na3·3 H2O), an azo dye, was chosen as the chromophore receptor. This ligand makes the solutions in which it is dissolved and the solid phases impregnated by it orange-red colored. TazoC is not commercially available, but it was already studied as a complexing ligand for several metal ions [23,39,40,41,42]; in particular, it forms a very stable complex with Pd(II), even in strongly acidic solutions. The complex Pd(II)/TazoC is purple-blue, very different from the free ligand's red-orange: this color change is the propriety used in the development of optical sensors [23]. The structure of the Pd(II)/TazoC complex is shown in Figure 1.
PADs' ability to detect Pd(II) was first studied at low pH (pH = 2) based on previous knowledge of the complex formation in aqueous solution [40]. The dye does not complex other metal ions at such an acidic media, making TazoC-based PADs highly selective to Pd(II) detection. However, at higher pH values, other cations, such as Cu(II) and Ni(II), can be complexed by TazoC; in this case, the Pd(II) quantification is still possible by applying a multivariate approach. In particular, Partial Least Square regression (PLS) modeling [43,44,45] was applied here to relate the Pd(II) concentration to the PADs' visible spectrum.

2. Materials and Methods

2.1. Reagents, materials and instruments

Cellulose filter paper Whatman grade 1 (180 μm thickness, 11 μm - particle retention, 150 sec/100 mL speed (Herzberg), and 0.25 psi wet burst, was obtained from Laboindustria S.p.A. (Arzergrande, Padova, Italy). Hydrochloric acid, sodium hydroxide, acetic acid, and sodium acetate were obtained from Merk Life Science S.r.l. (Milan, Italy); they were used to prepare the buffer solutions. Palladium standard, TraceCERT®, 1 g/L Pd in hydrochloric acid, Copper standard, TraceCERT®, 1 g/L Cu in nitric acid and Nickel standard, TraceCERT®, 1 g/L Ni in nitric acid (Merk Life Science S.r.l., Milan, Italy) were used to prepare diluted standard solutions.
TazoC was synthesized and purified according to previously described procedures [39]; its empirical formula and molecular weight (536.34 g/mol) were confirmed by elemental analysis. A 1 mM ligand stock solution was prepared by dissolving the weighted solid in ultrapure water.
Tap water samples were obtained from the drinking water supply of Pavia, Italy. Samples were collected from the lab's sink (Department of Chemistry, University of Pavia, Italy) after flushing cold water for 15 minutes; they were subsequently acidified to pH 2 with HCl.
UV/vis spectra of the PADs were recorded with a Jasco V-750 spectrophotometer equipped with an FLH-740 film holder and a homemade clip designed to make the spectrum acquisition quick and easy (see Figure 2).
The pH of the solutions was checked by a pH meter SevenMulti with an InLab Pro combined glass electrode (Mettler Toledo S.p.A.- Milan, Italy).

2.2. PADs preparation and analysis

The cellulose filter paper was cut into 2 cm-side squares using scissors. Each square, placed on a flat and clean surface, was drop-coated with 0.05 mL of 1 mM TazoC solution and left to air dry. The so-obtained PADs were immersed in 2.5 mL of aqueous metal-ion solution and kept under gentle stirring on a reciprocating shaker for 30 minutes, i.e., the time required to obtain a homogeneous and stable coloration of the PAD. The PADs were removed from the solution using plastic tweezers and left to air dry at room temperature for 2-3 min on a flat, clean surface. Subsequently, the PADs were inserted into the sample holder using plastic tweezers for the UV-vis analysis. The spectrum was registered in the wavelength range from 300 to 800 nm (bandwidth 0.2 nm, scan rate 200 nm/min) against a blank PAD wetted only with the buffer solution.

2.3. Chemometric data treatment: Partial Least Square regression (PLS)

The PLS bases have been widely described [43,44,45,46,47,48,49], so they are only brief details here. PLS is a multivariate calibration algorithm aimed to extract most of the information contained in the UV-vis spectra (X variables), which is correlated to the Pd(II) concentration (Y variable) through the so-called latent variables (LVs). Each LV is a linear combination of the spectrum's absorbances. Unlike PCA, PLS finds directions of the latent variables explaining the maximum variance and maximizing the correlation with the response. The new coordinates of each object (the UV-vis spectrum) in the space of these latent variables are called scores, whereas the contribution of each spectral variable on the latent variables is called weight or loading.
The PLS model can be written as Y = X· b and allows the concentration (Y) prediction from the measured spectrum (X). Specifically, X is the n × m matrix of input data (absorbance values) obtained from the UV-vis spectrum: n is the number of samples, and m is the number of wavelengths of the whole spectrum. Y is the n × c concentration matrix, whereas c is equal to 1 in PLS1 models (which means when one analyte at the time is determined), and b is the n × c column vector of regression coefficients, solved when the model is calibrated. Knowing b, the PLS model can predict new Y concentration values from the UV-vis spectra of samples at unknown Pd(II) content.
The PLS models were built by selecting a suitable data set (training set) obtained with standard solutions at different Pd(II) content to cover the entire experimental domain homogeneously; three PLS models were developed at three different pH values (pH 2, pH 4, and pH 5.5). The training set for each model comprised the data of three replicates of 8-point calibrations (24 rows and 103 columns, i.e., 8 concentrations per 3 replicates and the absorbance values per 103 wavelengths). Each PLS model was tested by a cross-validated procedure on the training set and then on an external test set. Independent Pd(II) solutions were prepared for this purpose; the test set matrix comprised 9 rows (3 concentrations per 3 replicates) and 103 columns (absorbance values per 103 wavelengths).
Moreover, other datasets, comprising mixtures of Pd(II) and Cu(II) at pH 4 and Pd(II), Cu(II) and Ni(II) at pH 5.5 at different metal ions content, were prepared to evaluate the robustness of the method submitted to interferent cations.
A new training set was also prepared to build the PLS model for matrix-matched Pd(II) solutions (tap water). Then three independent tap water samples were fortified with different Pd(II) concentrations and used as the test set. From the predicted concentrations, the recovery percentages were calculated.
For all PLS models, only the centering pretreatment of data was applied. The chemometric data treatment was performed by the open-source R-based software CAT (Chemometric Agile Tool) [50].
The tables with the metal ions concentrations for each dataset, the experimental and fitted Pd(II) concentrations and the graph of PLS models' performances were reported in the Supplementary Materials.

3. Results

3.1. PADs preparation and analysis

The PADs proposed here were prepared simply with filter paper. In the recent literature, similar devices were realized using different procedures of paper pattering, such as screen-printing, wax printing or laser printing, inkjet etching, photolithography and plasma treatment [51,52,53,54,55,56,57]. These techniques are expensive and sometimes require complicated procedures, making them unaffordable for limited resources laboratories. Moreover, PADs' wax-patterning needs rigorous flow control of the hydrophobic barrier into the porous matrix of the paper, causing poor homogeneity and, consequently, irreproducibility [54]. An alternative method is a paper cutting into the desired shapes and dimensions, bypassing the need to create the liquid's containment barriers [28]. Since the present study aimed to develop low-cost PADs using green materials and simple techniques, this last approach was adopted by cutting a sheet of filter paper into 2 cm-side squares.
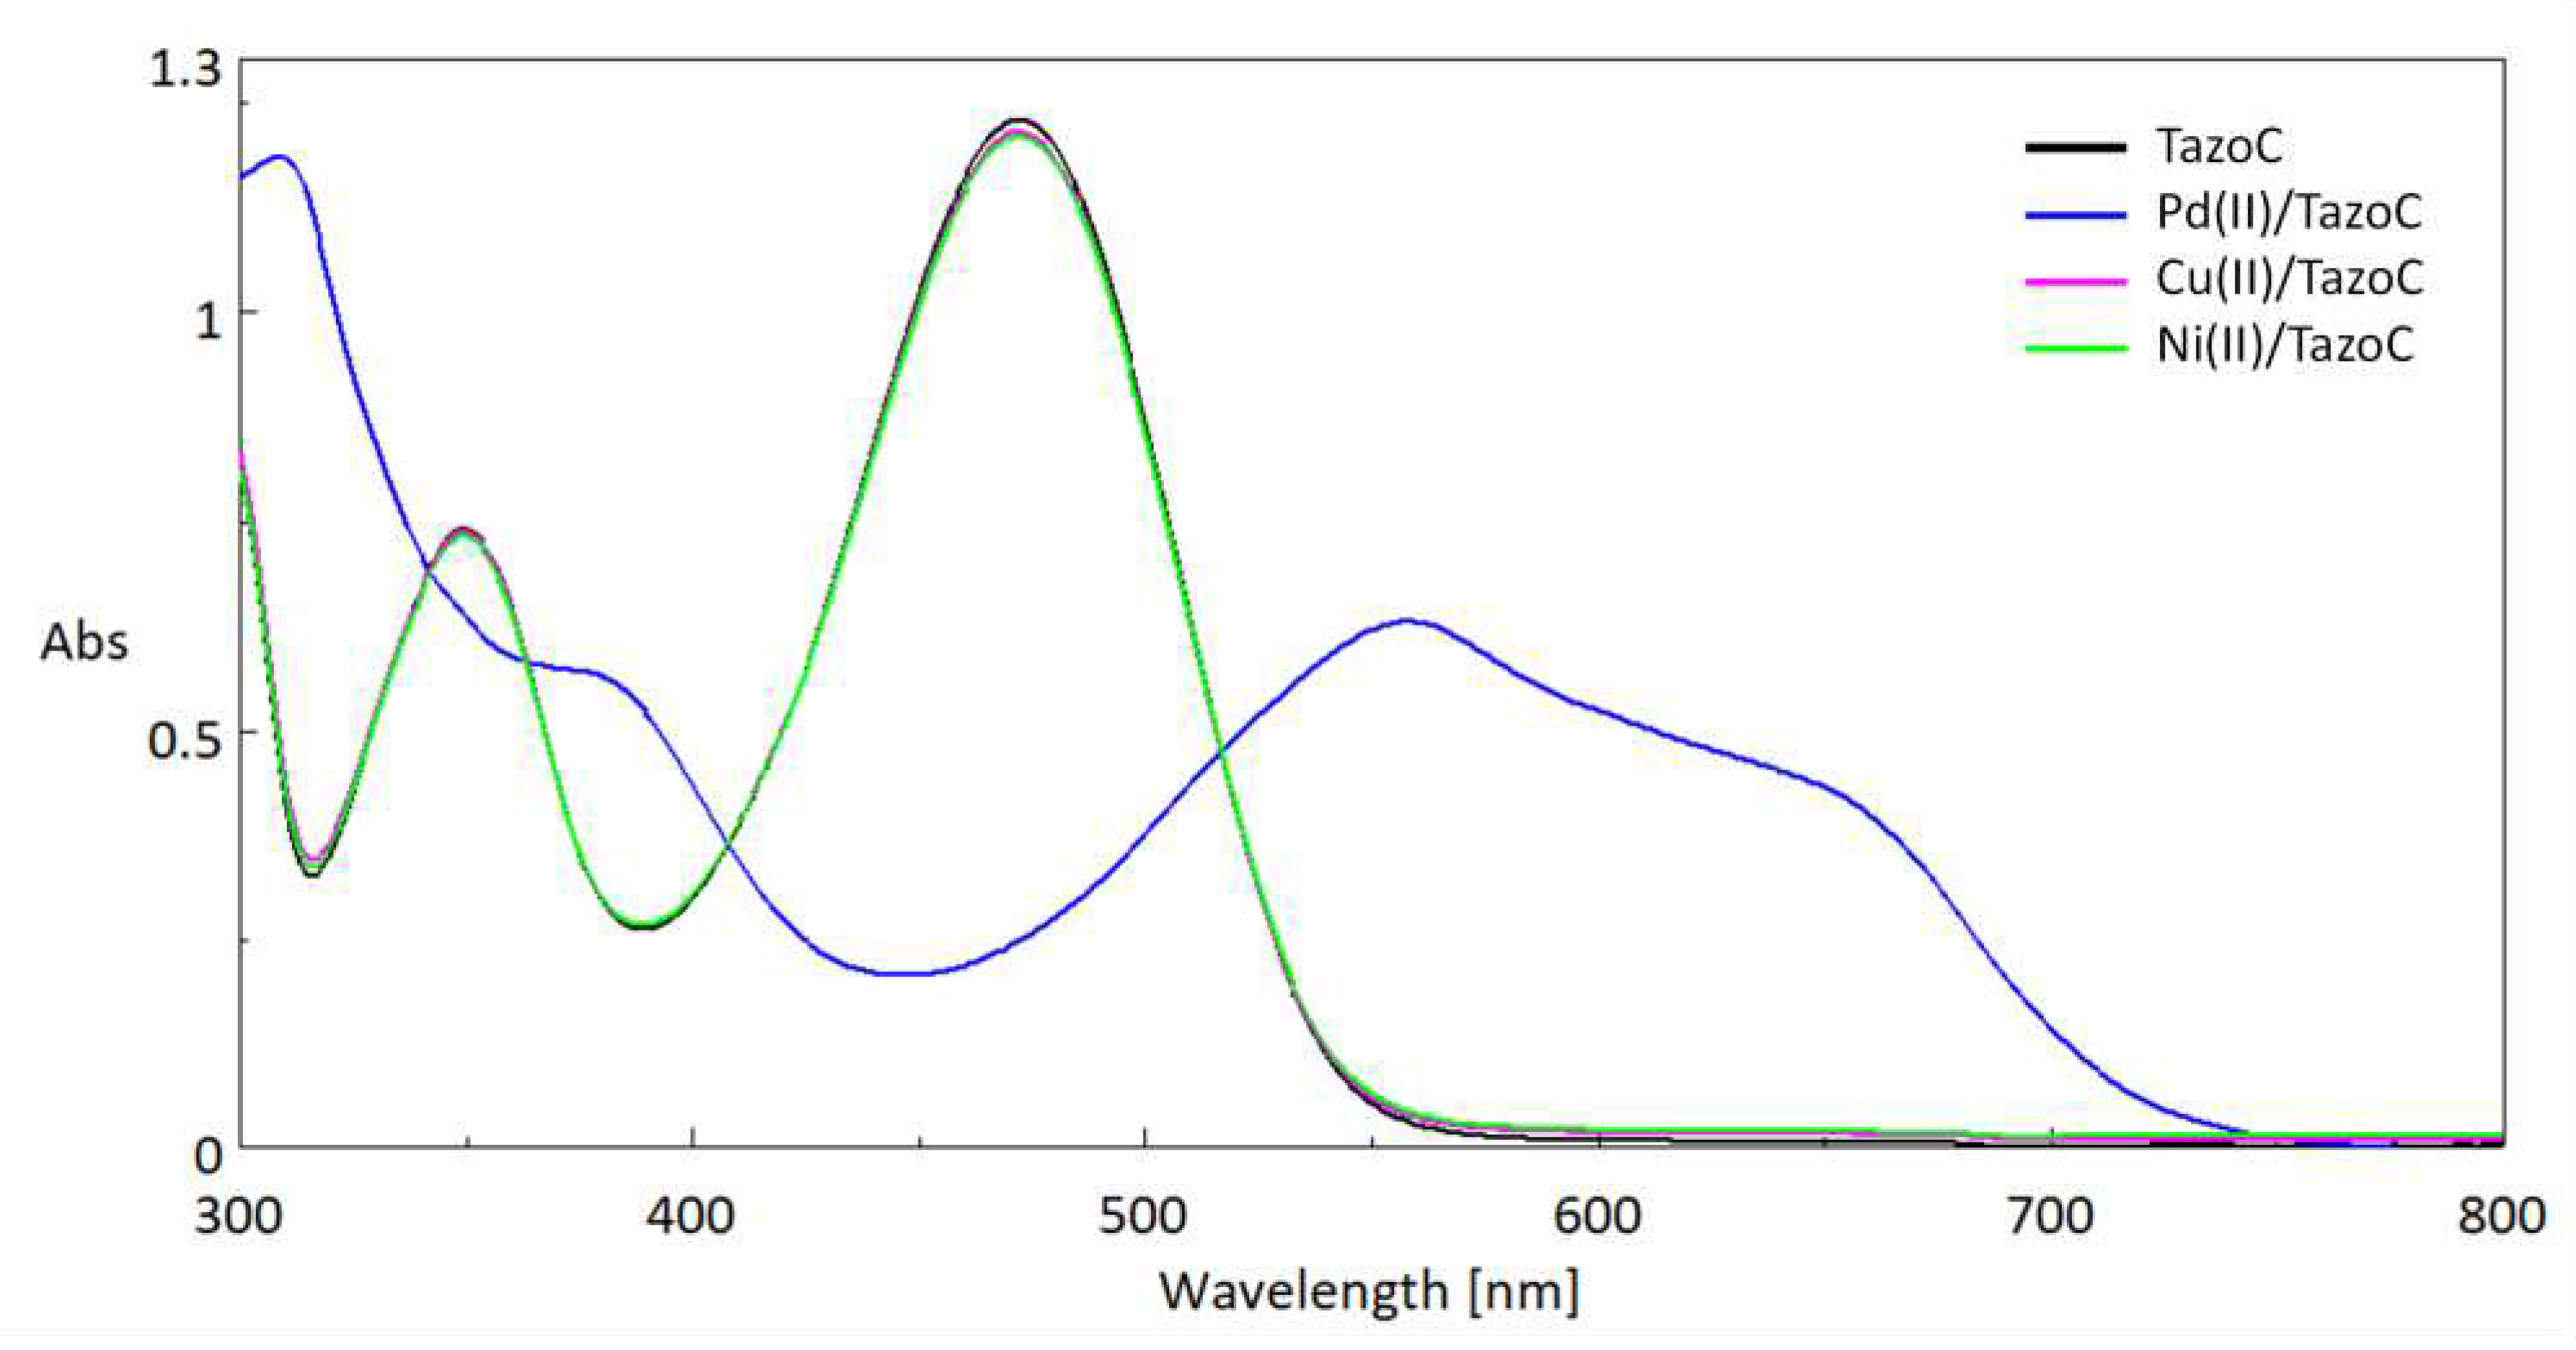
As stated in the introduction, TazoC was chosen as the chromophore receptor since it forms a purple-blue-colored stable complex with Pd(II) also in very acidic media; this property has been exploited to develop the present devices. Indeed, until pH 2, only Pd(II) forms a strong complex with TazoC, as evident in Figure 3, where the spectra of the free TazoC and the equimolar aqueous solutions of the ligand with Pd(II), Cu(II) and Ni(II) at pH 2 are reported.
The typical peak of the free ligand at about 460 nm (ε= 17333 cm-1 M-1) is in agreement with the data previously reported [40], and the spectrum does not change if other cations than Pd(II) are added at pH 2. Besides, it can be observed that the Pd(II)/TazoC spectrum presents a broad and not well-defined peak, justifying the need for a multivariate calibration tool to quantify Pd(II).
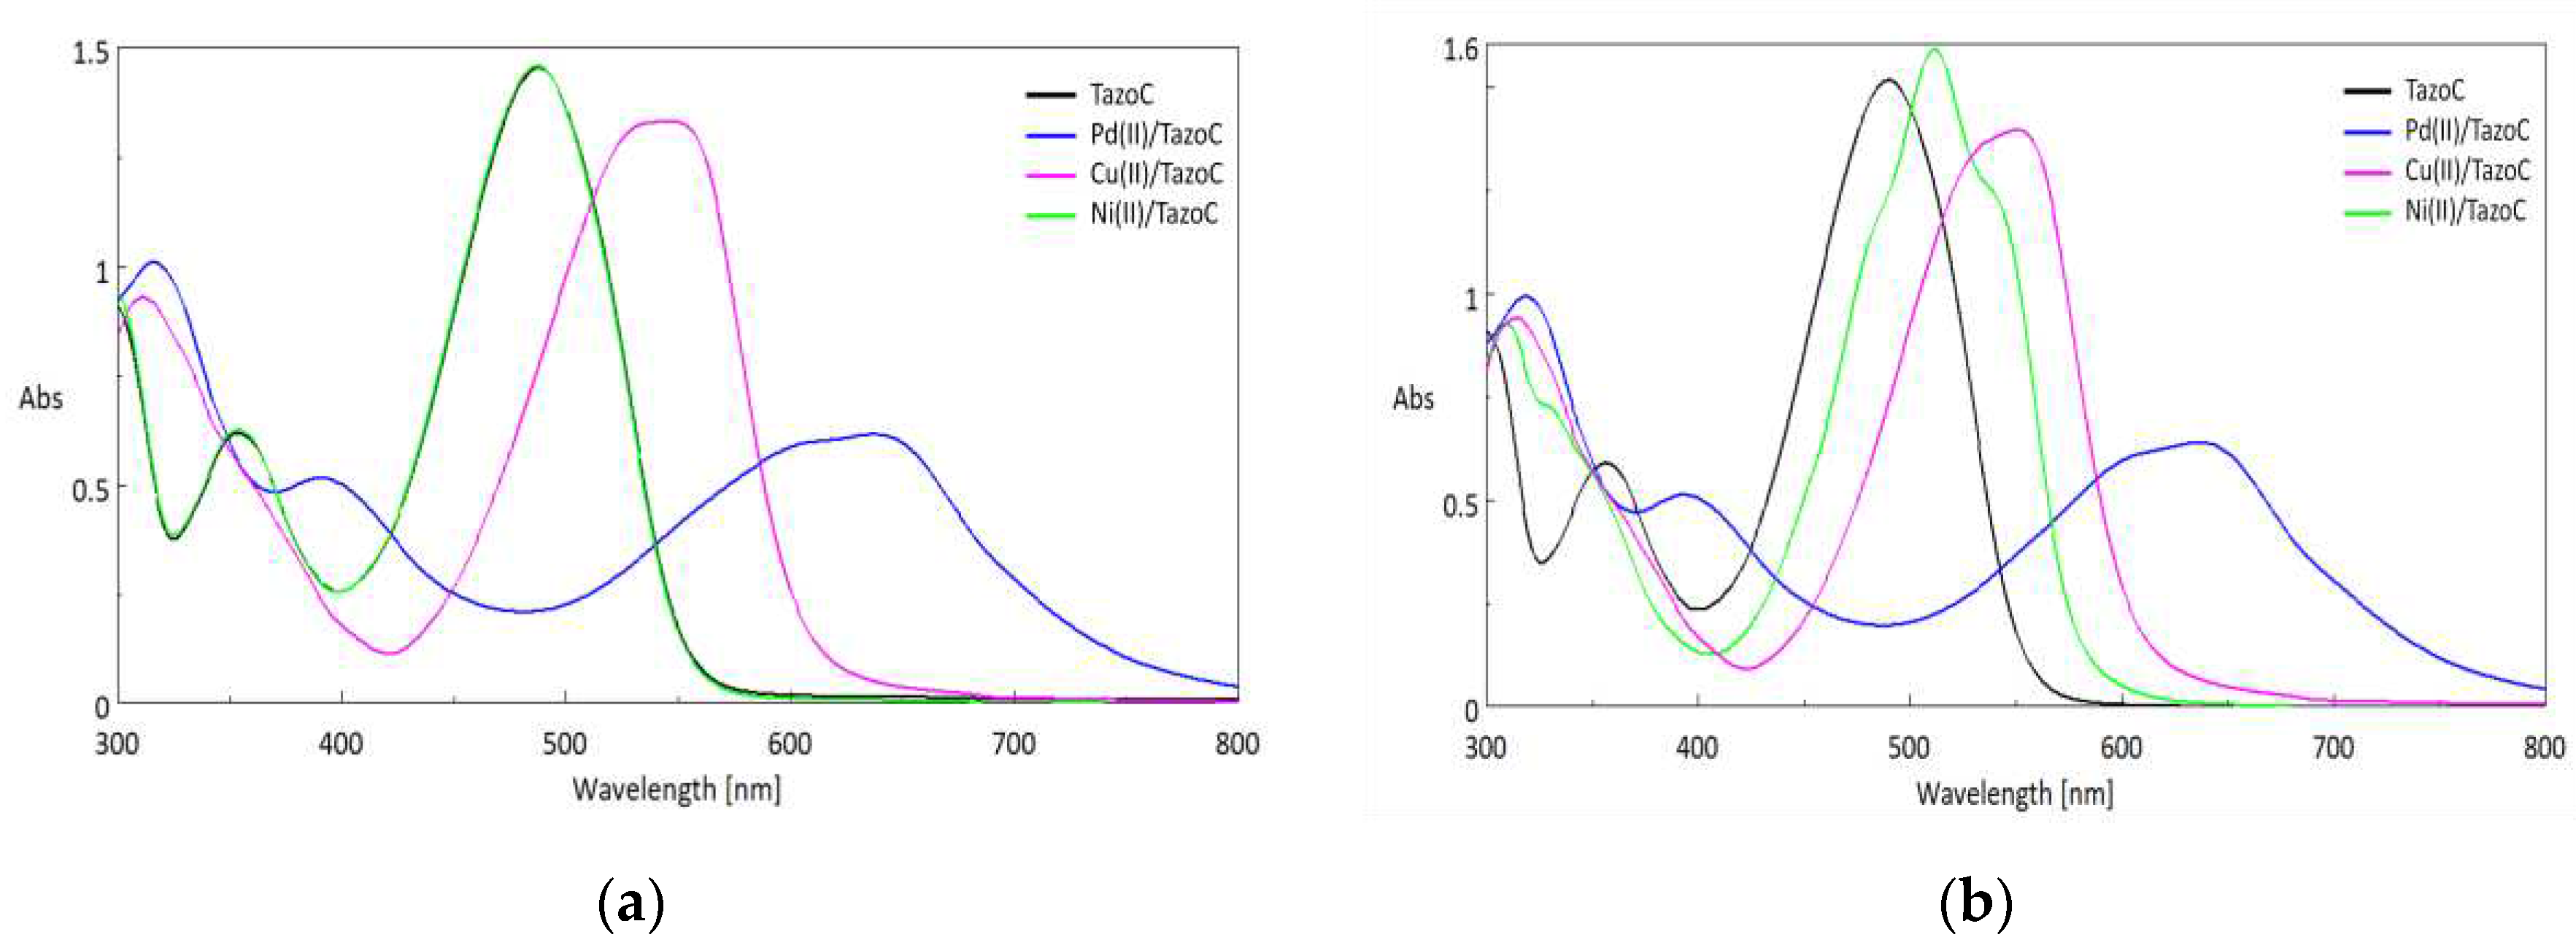
Figure 4a,b show the spectra obtained in aqueous solution at higher pH values, i.e., pH 4 and 5.5, respectively. These pH values have been chosen because they correspond to the quantitative formation of the complexes with Cu(II) and Ni(II) without starting the precipitation of the respective hydroxides.
From the spectra, it is clear that Cu(II) at pH 4 and both Cu(II) and NI(II) at pH 5.5 can cause interference with the Pd(II) determination since their peaks are partially overlapped with that of the target analyte. All the more reason, also, in this case, the use of the multivariate regression PLS is necessary to perform the quantitative analysis, especially for data treatment of the PADs' spectra.
0.05 mL of 1 mM TazoC was used to load the filter paper since this volume is enough to cover the PAD's surface entirely without obtaining overflow of the ligand. As an alternative method, the immersion of the PAD in 2.5 mL of 1mM TazoC solution was tested, but low sorption kinetic and inhomogeneity of the PAD's color were verified.
It was then necessary to decide the modality to contact the sample solution with the PADs since it could affect the color homogeneity and intensity. Two approaches were tested: drop-coating with 0.5 mL of the solution or immersion of the PAD in 2.5 mL of aqueous metal-ion solution. The better uniformity of the color was achieved with the second strategy, which was thus adopted for all experiments.
The time required to obtain uniform PAD's color and avoid the leaching of the ligand was about 30 minutes with a gentle stirring on a reciprocating shaker.
Other kinds of filter papers were tested, hoping to reduce the immersion time, but due to the analogous porosity, their use does not confer advantages.
Regarding PADs' stability, it should be highlighted that these devices are disposable; moreover, the leaching of the chromophore receptor or its complexes with the metal ions can occur if they are stored in aqueous solutions for more than 1 h, so the analysis with the PADs must be immediately performed after their preparation.
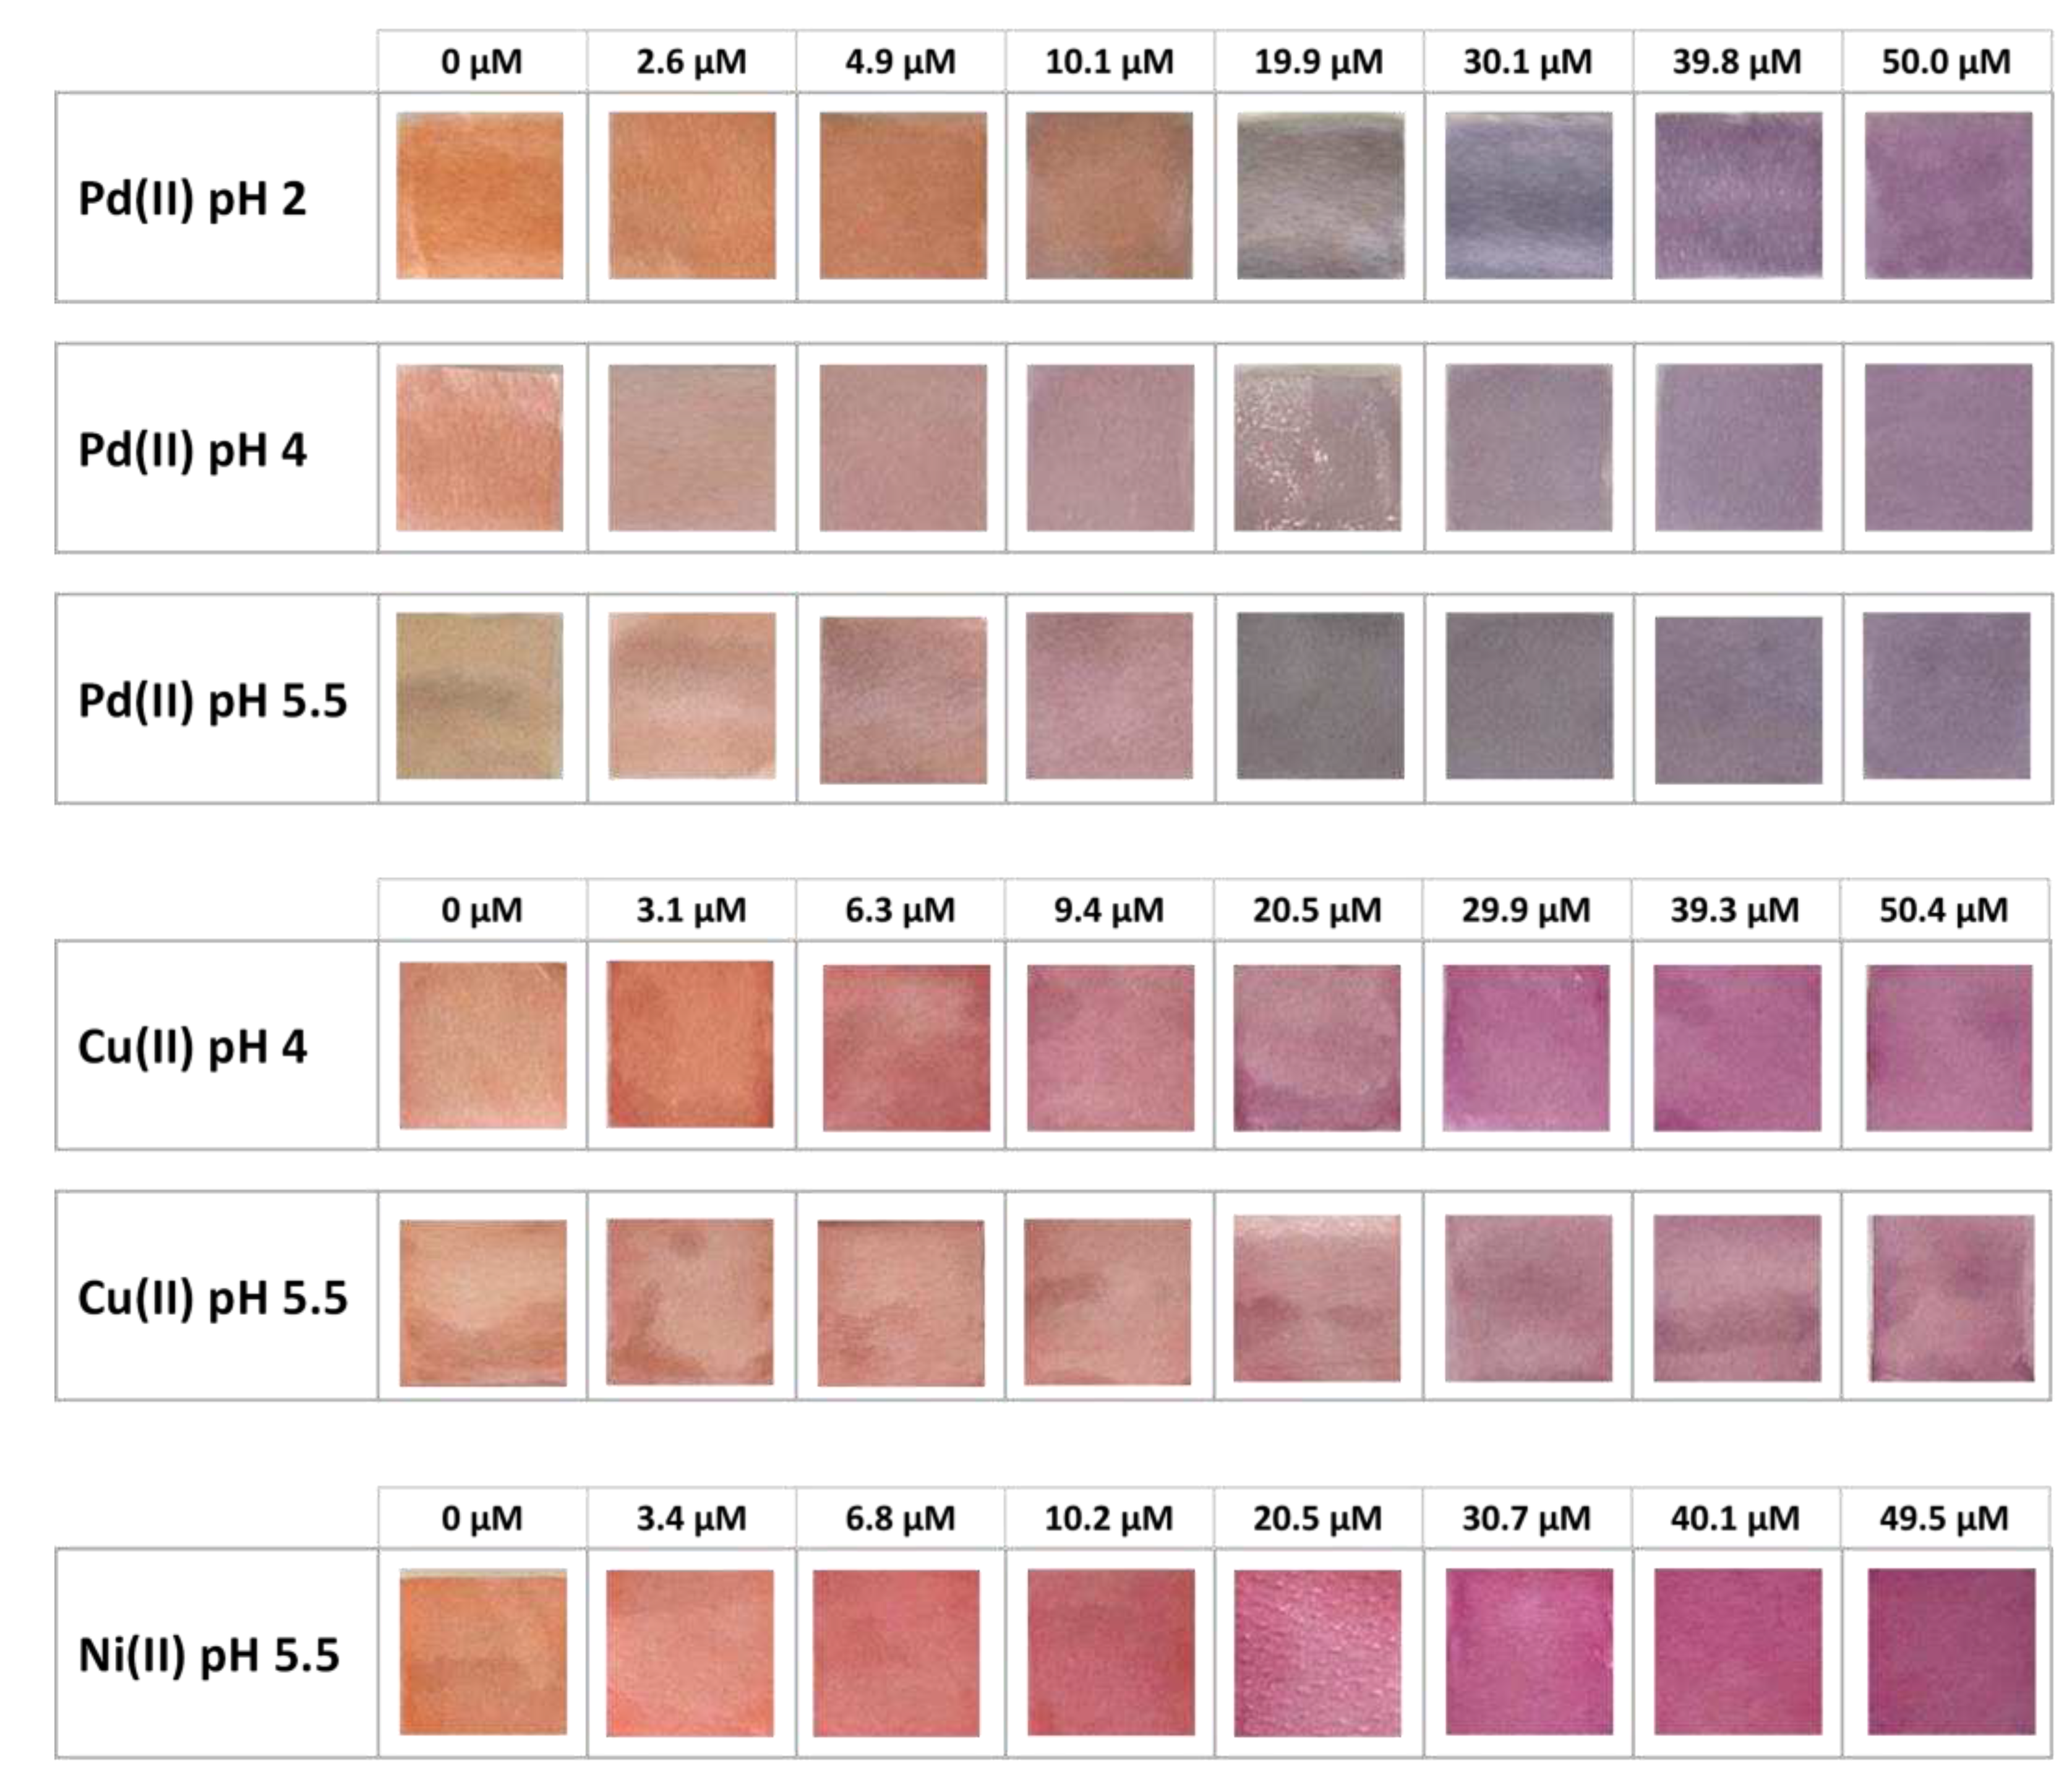
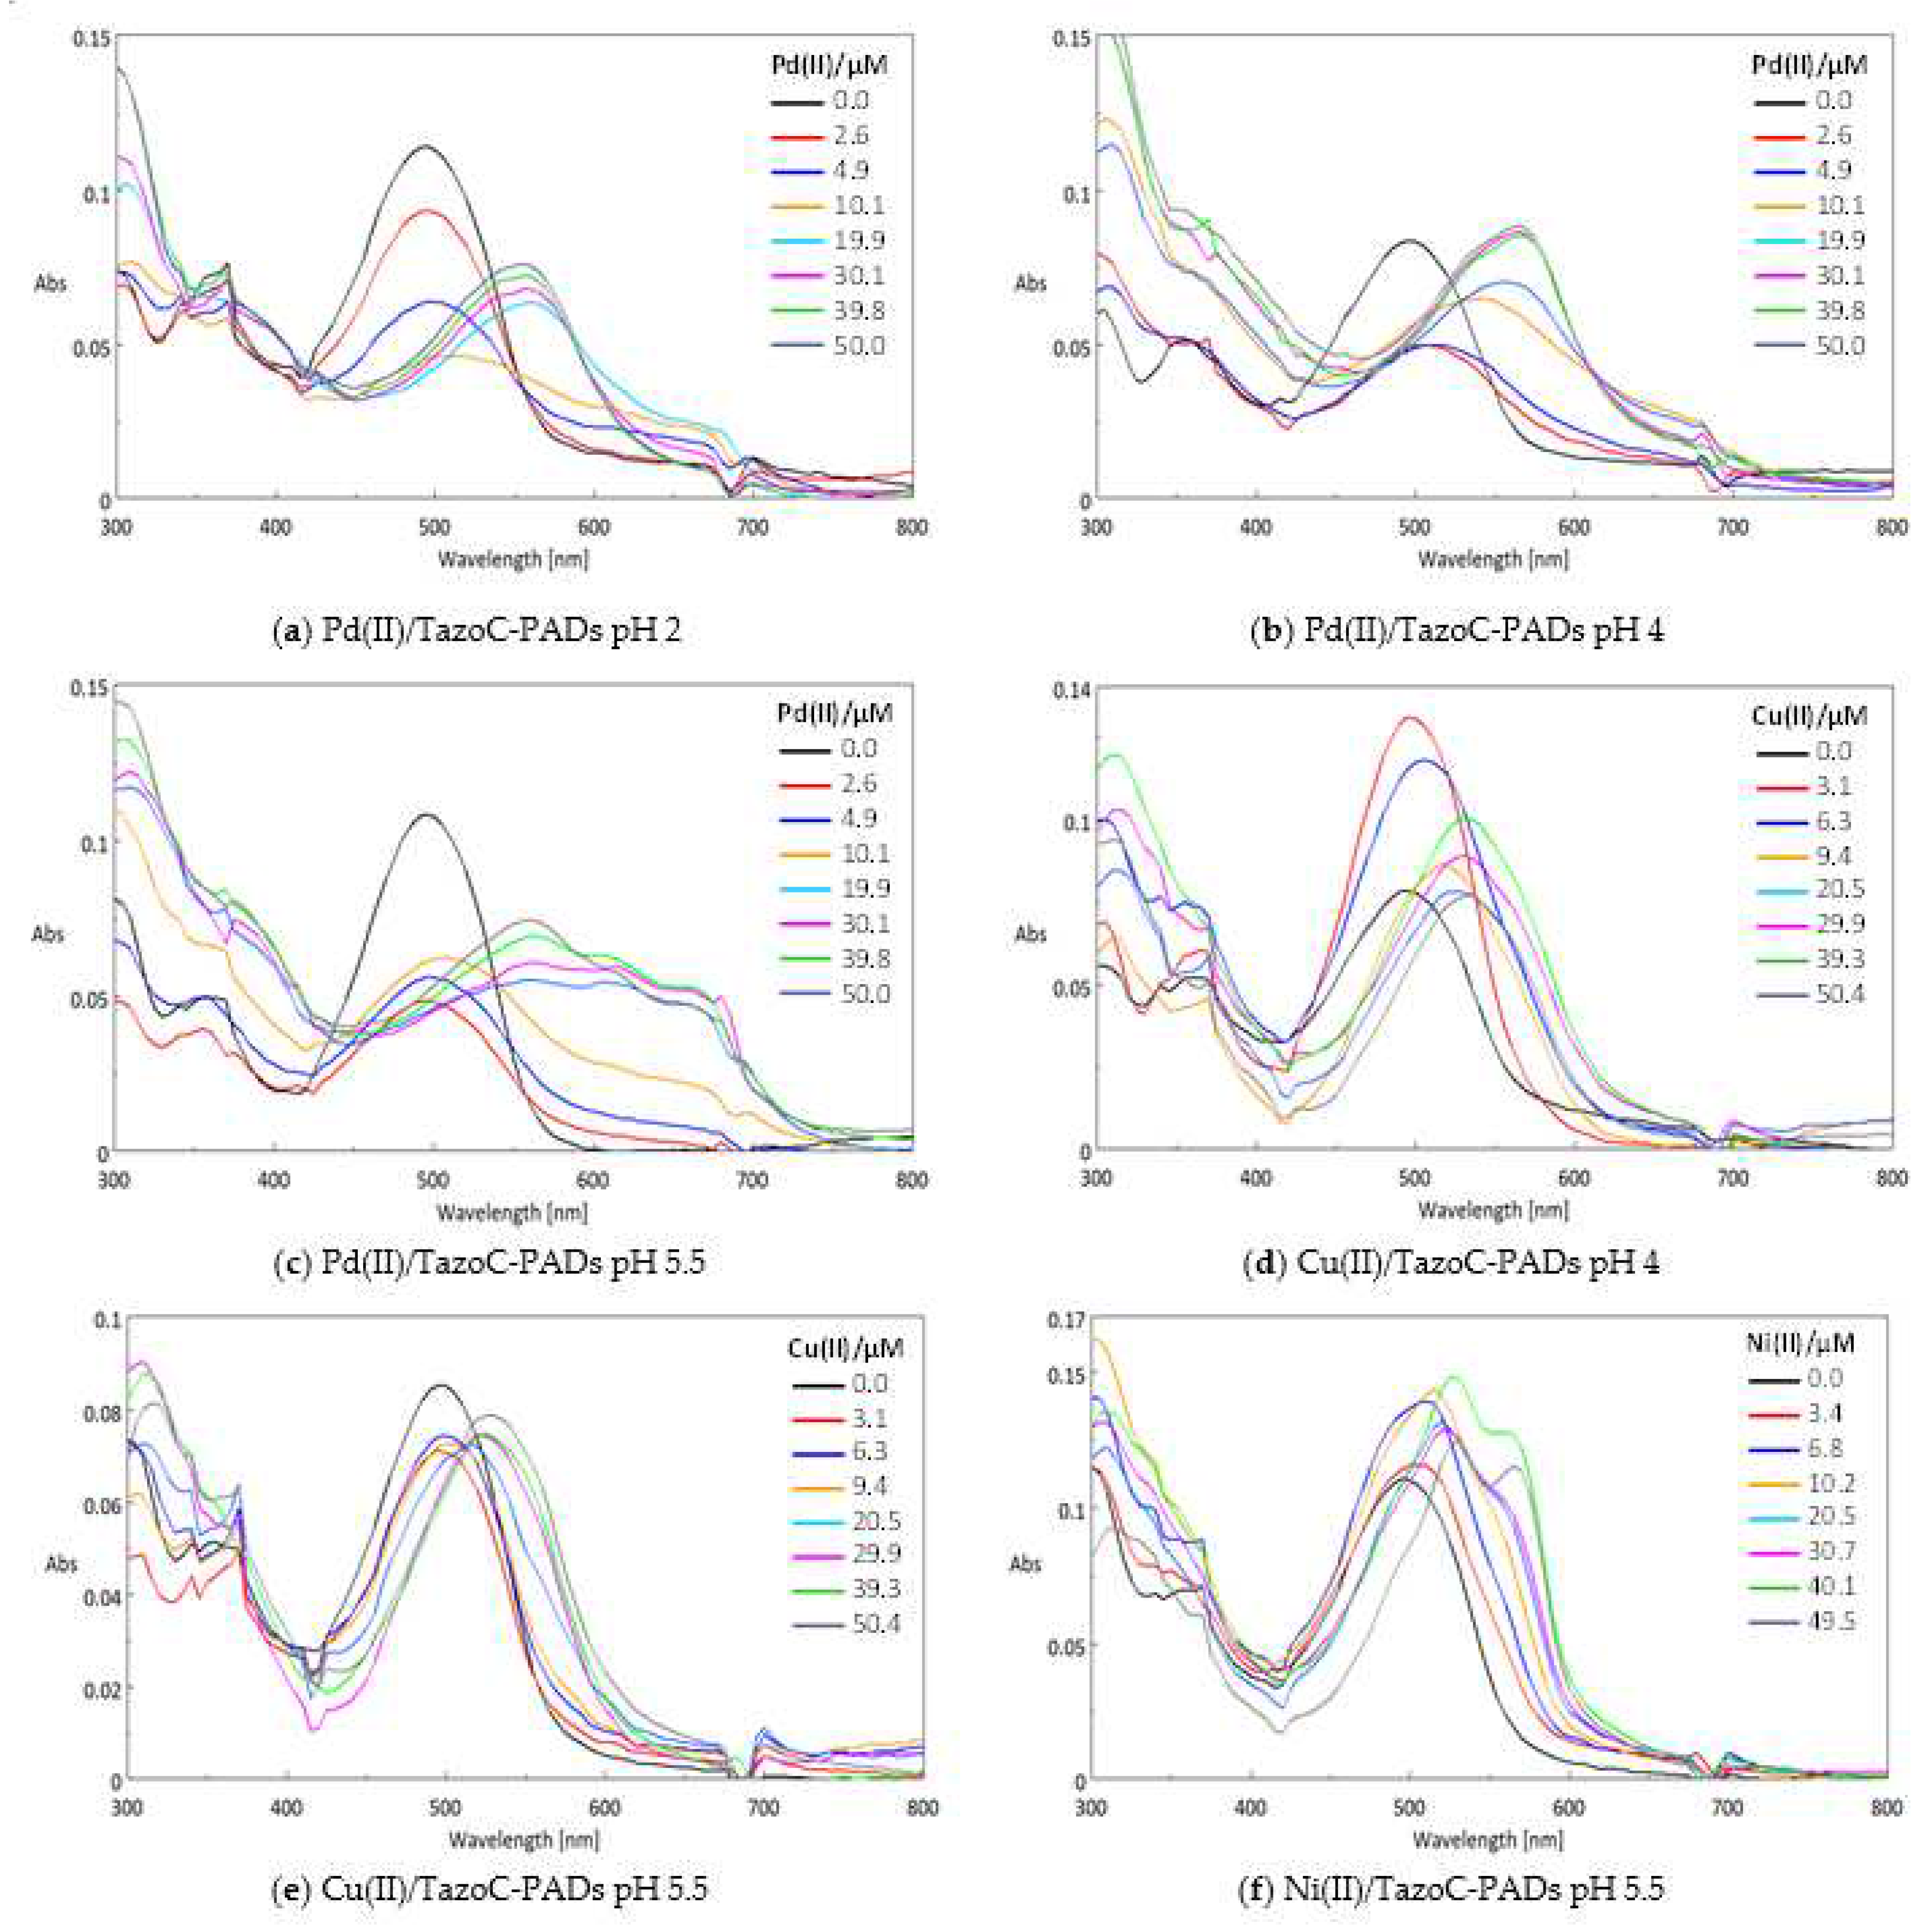
Figure 5 shows the TazoC-PADs after contact with the metal ions solutions at different concentrations and pHs, and Figure 6 shows the corresponding UV-vis spectra.

3.2. Chemometric-assisted Pd(II) determination by TazoC-PADs

As stated in the introduction and as seen in the picture of Figure 5, a progressive color change of the PADs can be observed by the naked eye at increasing Pd(II) concentration. However, the simple correlation of the color (for instance, RGB indexes) with the metal ion concentration would not be sufficiently sensitive and accurate for quantitative analysis. For this reason, the UV-vis spectra were registered, and as can be observed in Figure 6 (a-c), it cannot be possible to identify a well-defined peak related to the Pd(II)/TazoC-PAD complex; consequently, a classical univariate calibration shall not be applicable.
The Partial Least Squares regression (PLS) was selected; indeed, this multivariate technique makes it possible to correlate the entire spectrum to the analyte concentration.
Without any other data treatment, conversely applied for very disturbed spectrum (i.e., baseline correction, lines' smoothing), the PLS tool makes it possible to empathize differences among entire spectra rather than differences within the spectra (noise).
In the present research, tailored PLS models were built for the different studied media.
The first PLS model is the one related to the simplest system, i.e., Pd(II)/TazoC-PADs in aqueous solutions at pH 2 (HCl 0.01M).
This model was built with a training set comprising the data of three replicates of an 8-point calibration with the Pd(II) concentration ranging from 2.6 to 50 μM. The test set to validate and prove the model's robustness comprised three replicates of different TazoC-PADs immersed in three Pd(II) solutions (7.5, 25.2, 42.5 μM).
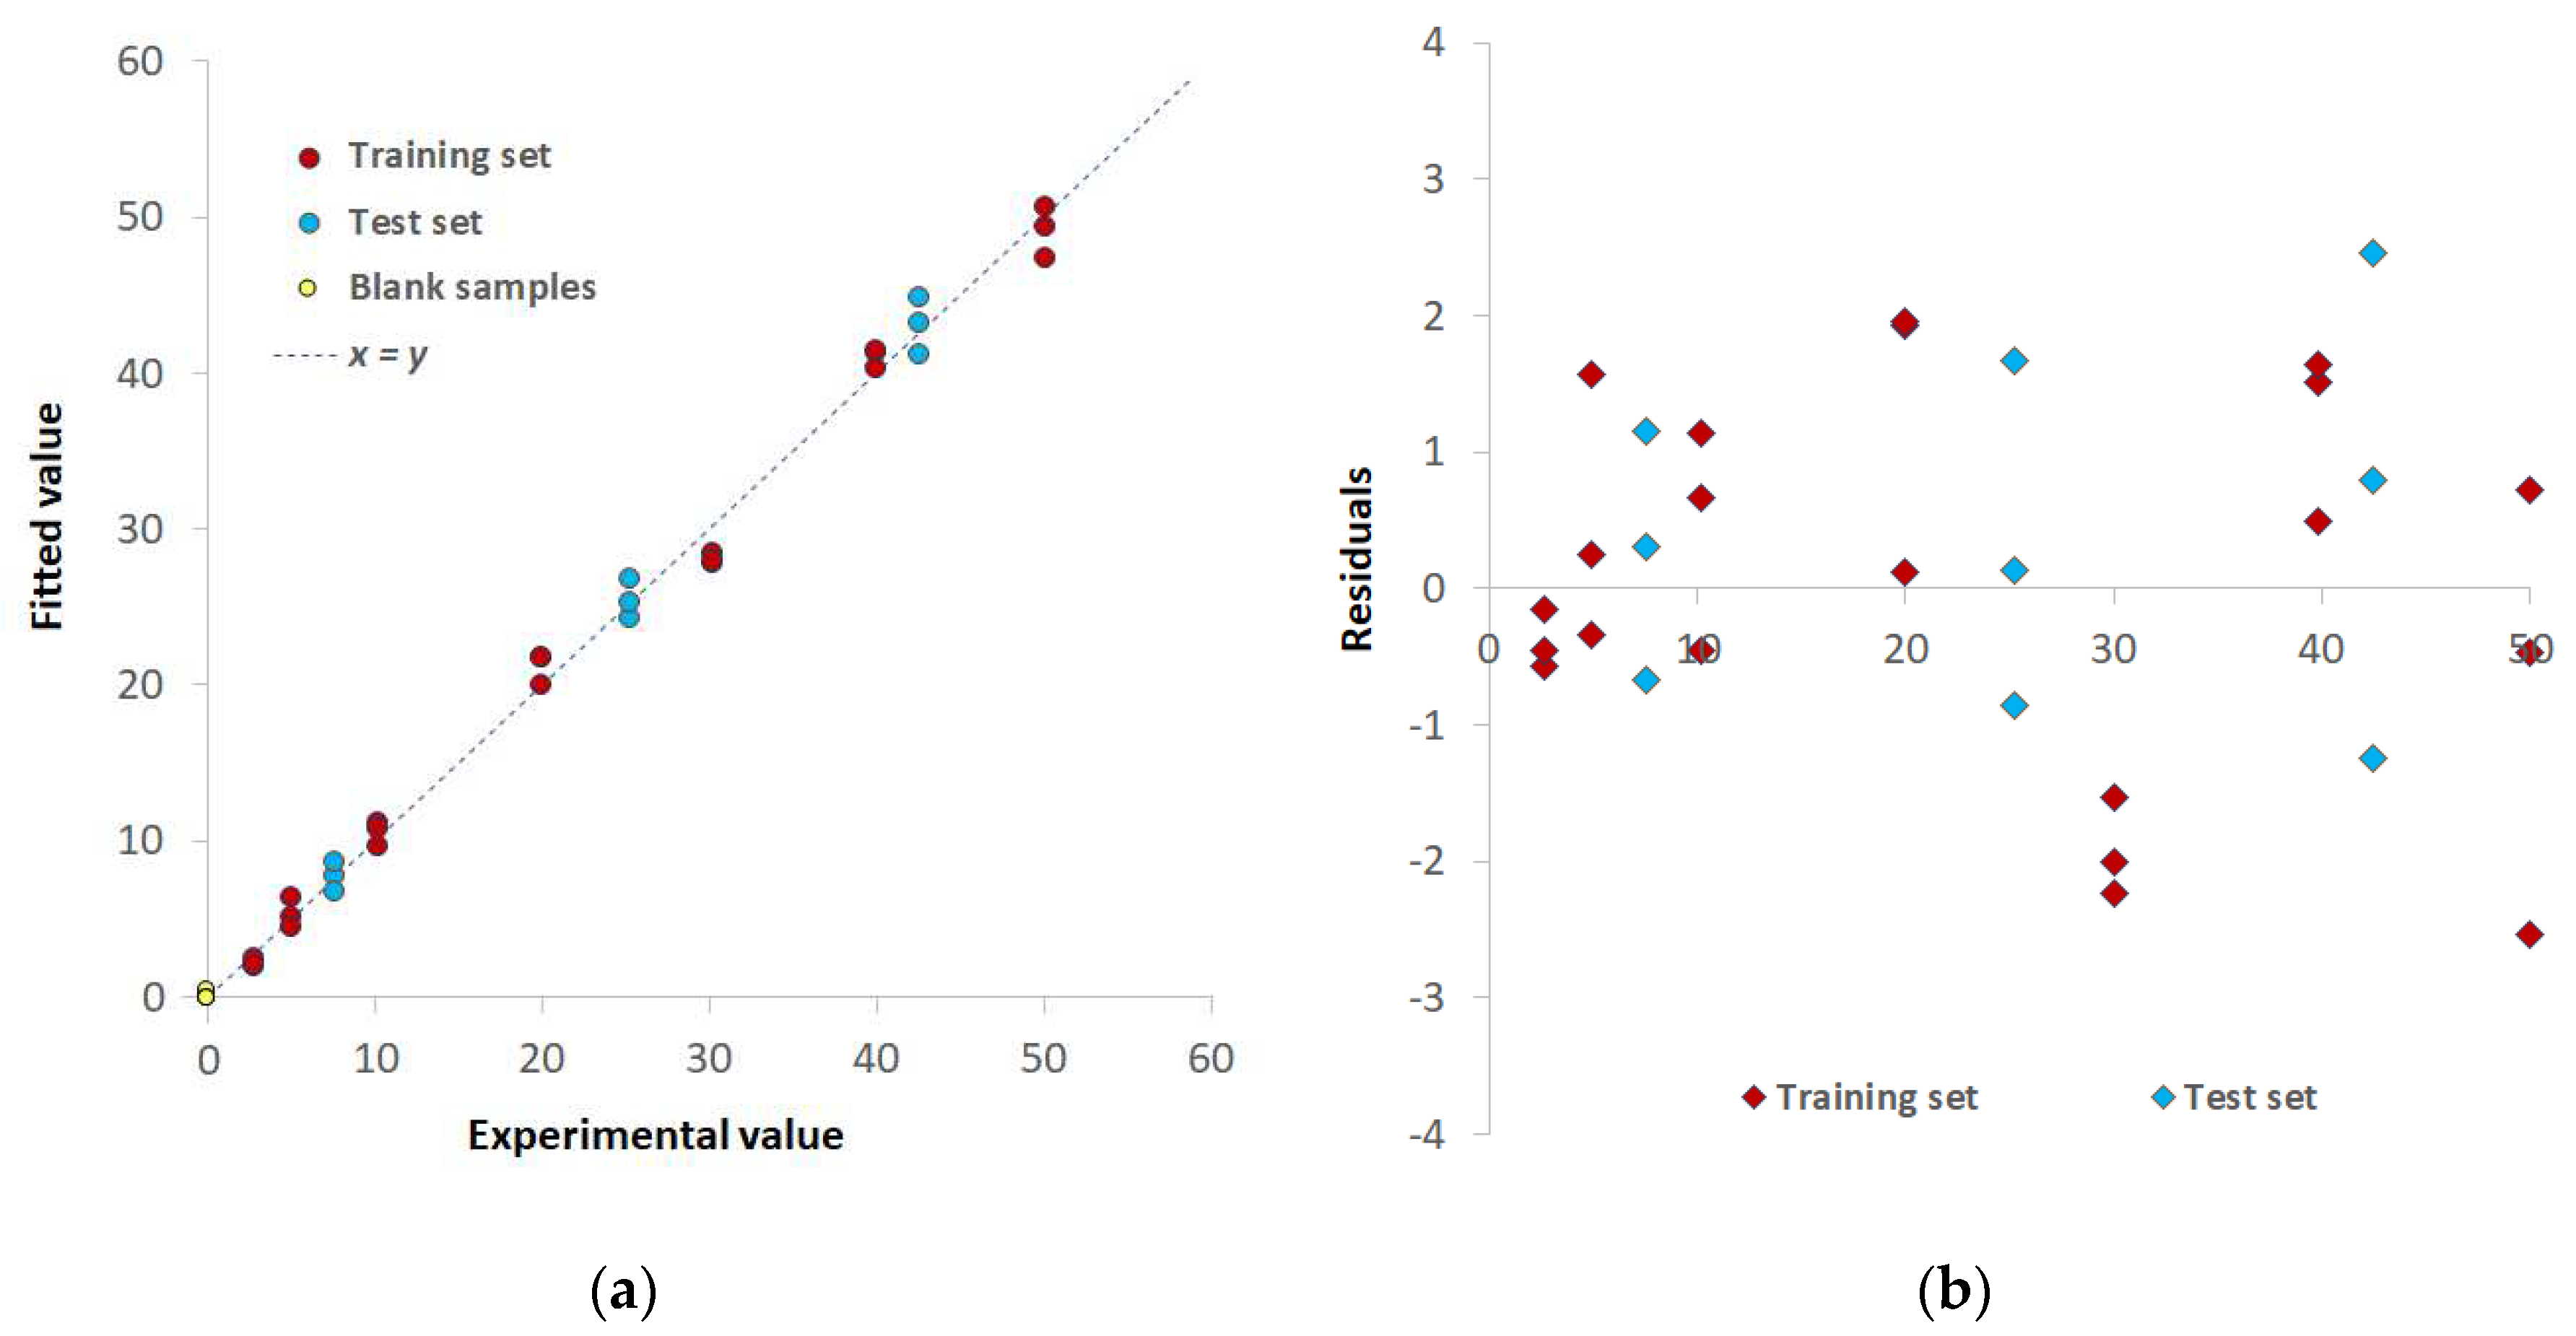
A 5-latent variables model was developed: it ensures 98.61% of explained variance in Cross-Validation (% E.V. in CV), a global Root Mean Square Error in CV (RMSECV) of 2.05 μM and, as regards the test set samples, 1.86 μM of Root Mean Square Error in Prediction (RMSEP). The model performance graph is reported in the Supplementary Material (Figure S1).
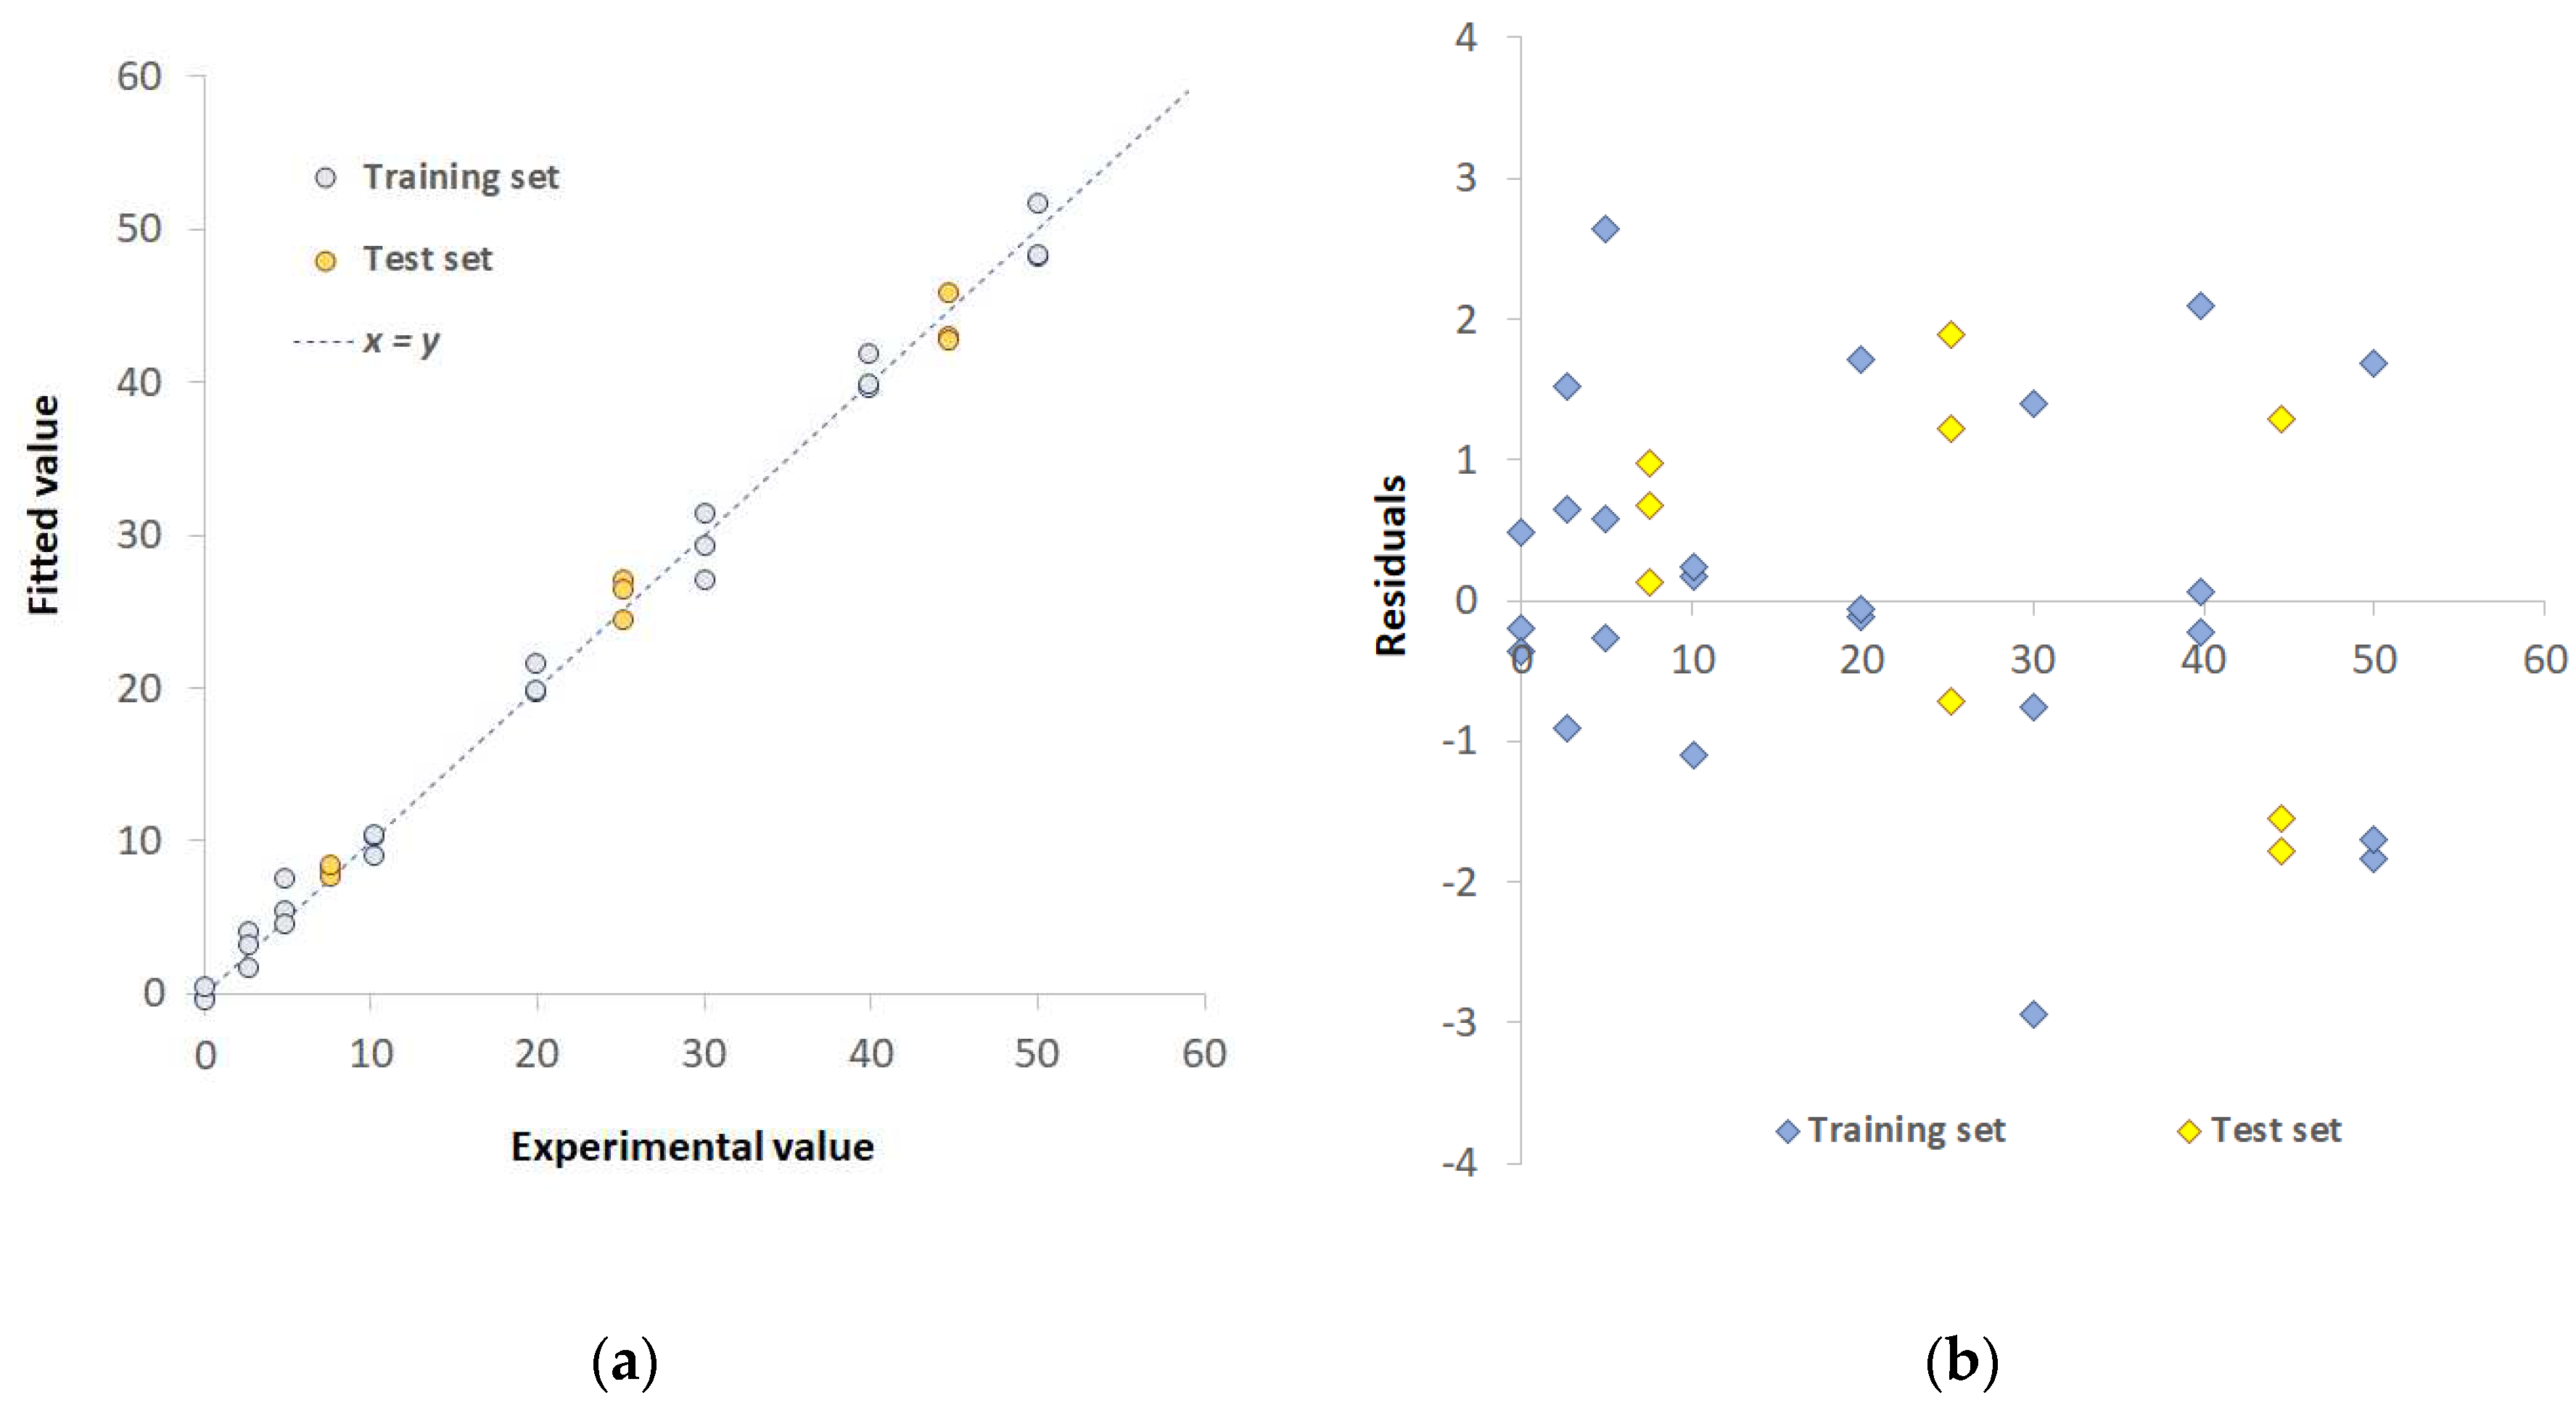
Figure 7a shows the Experimental vs. Fitted values plot for the training set (burgundy-colored points) and test set (light blue-colored points); samples are similarly distributed alongside the y=x straight line, and no significant difference in the fitting error appears. The residuals plot is reported in Figure 7b; a random distribution around 0 was observed, and a point cloud without a particular structure (the points are placed between the values -3 and 3) justifies the model's linearity and homoscedasticity assumptions.
Operational values of LOD and LOQ were also obtained by projecting in the PLS model the spectra of 10 blank samples (i.e., TazoC-PADs contacted with solutions at pH 2, without Pd(II), see the yellow-colored points in Figure 7a); the LOD and the LOQ were then computed as 3.3 times and 10 times, respectively, the standard deviation of the predicted blank concentrations. The values are reported in Table 1. This procedure is not precisely rigorous in the case of PLS, but it seems a reasonable estimate here since the predicted values are around zero at low concentrations with a very low standard deviation [23]. The authors are well aware that the correct procedure for LOD and LOQ estimates in PLS analysis is still an open question.
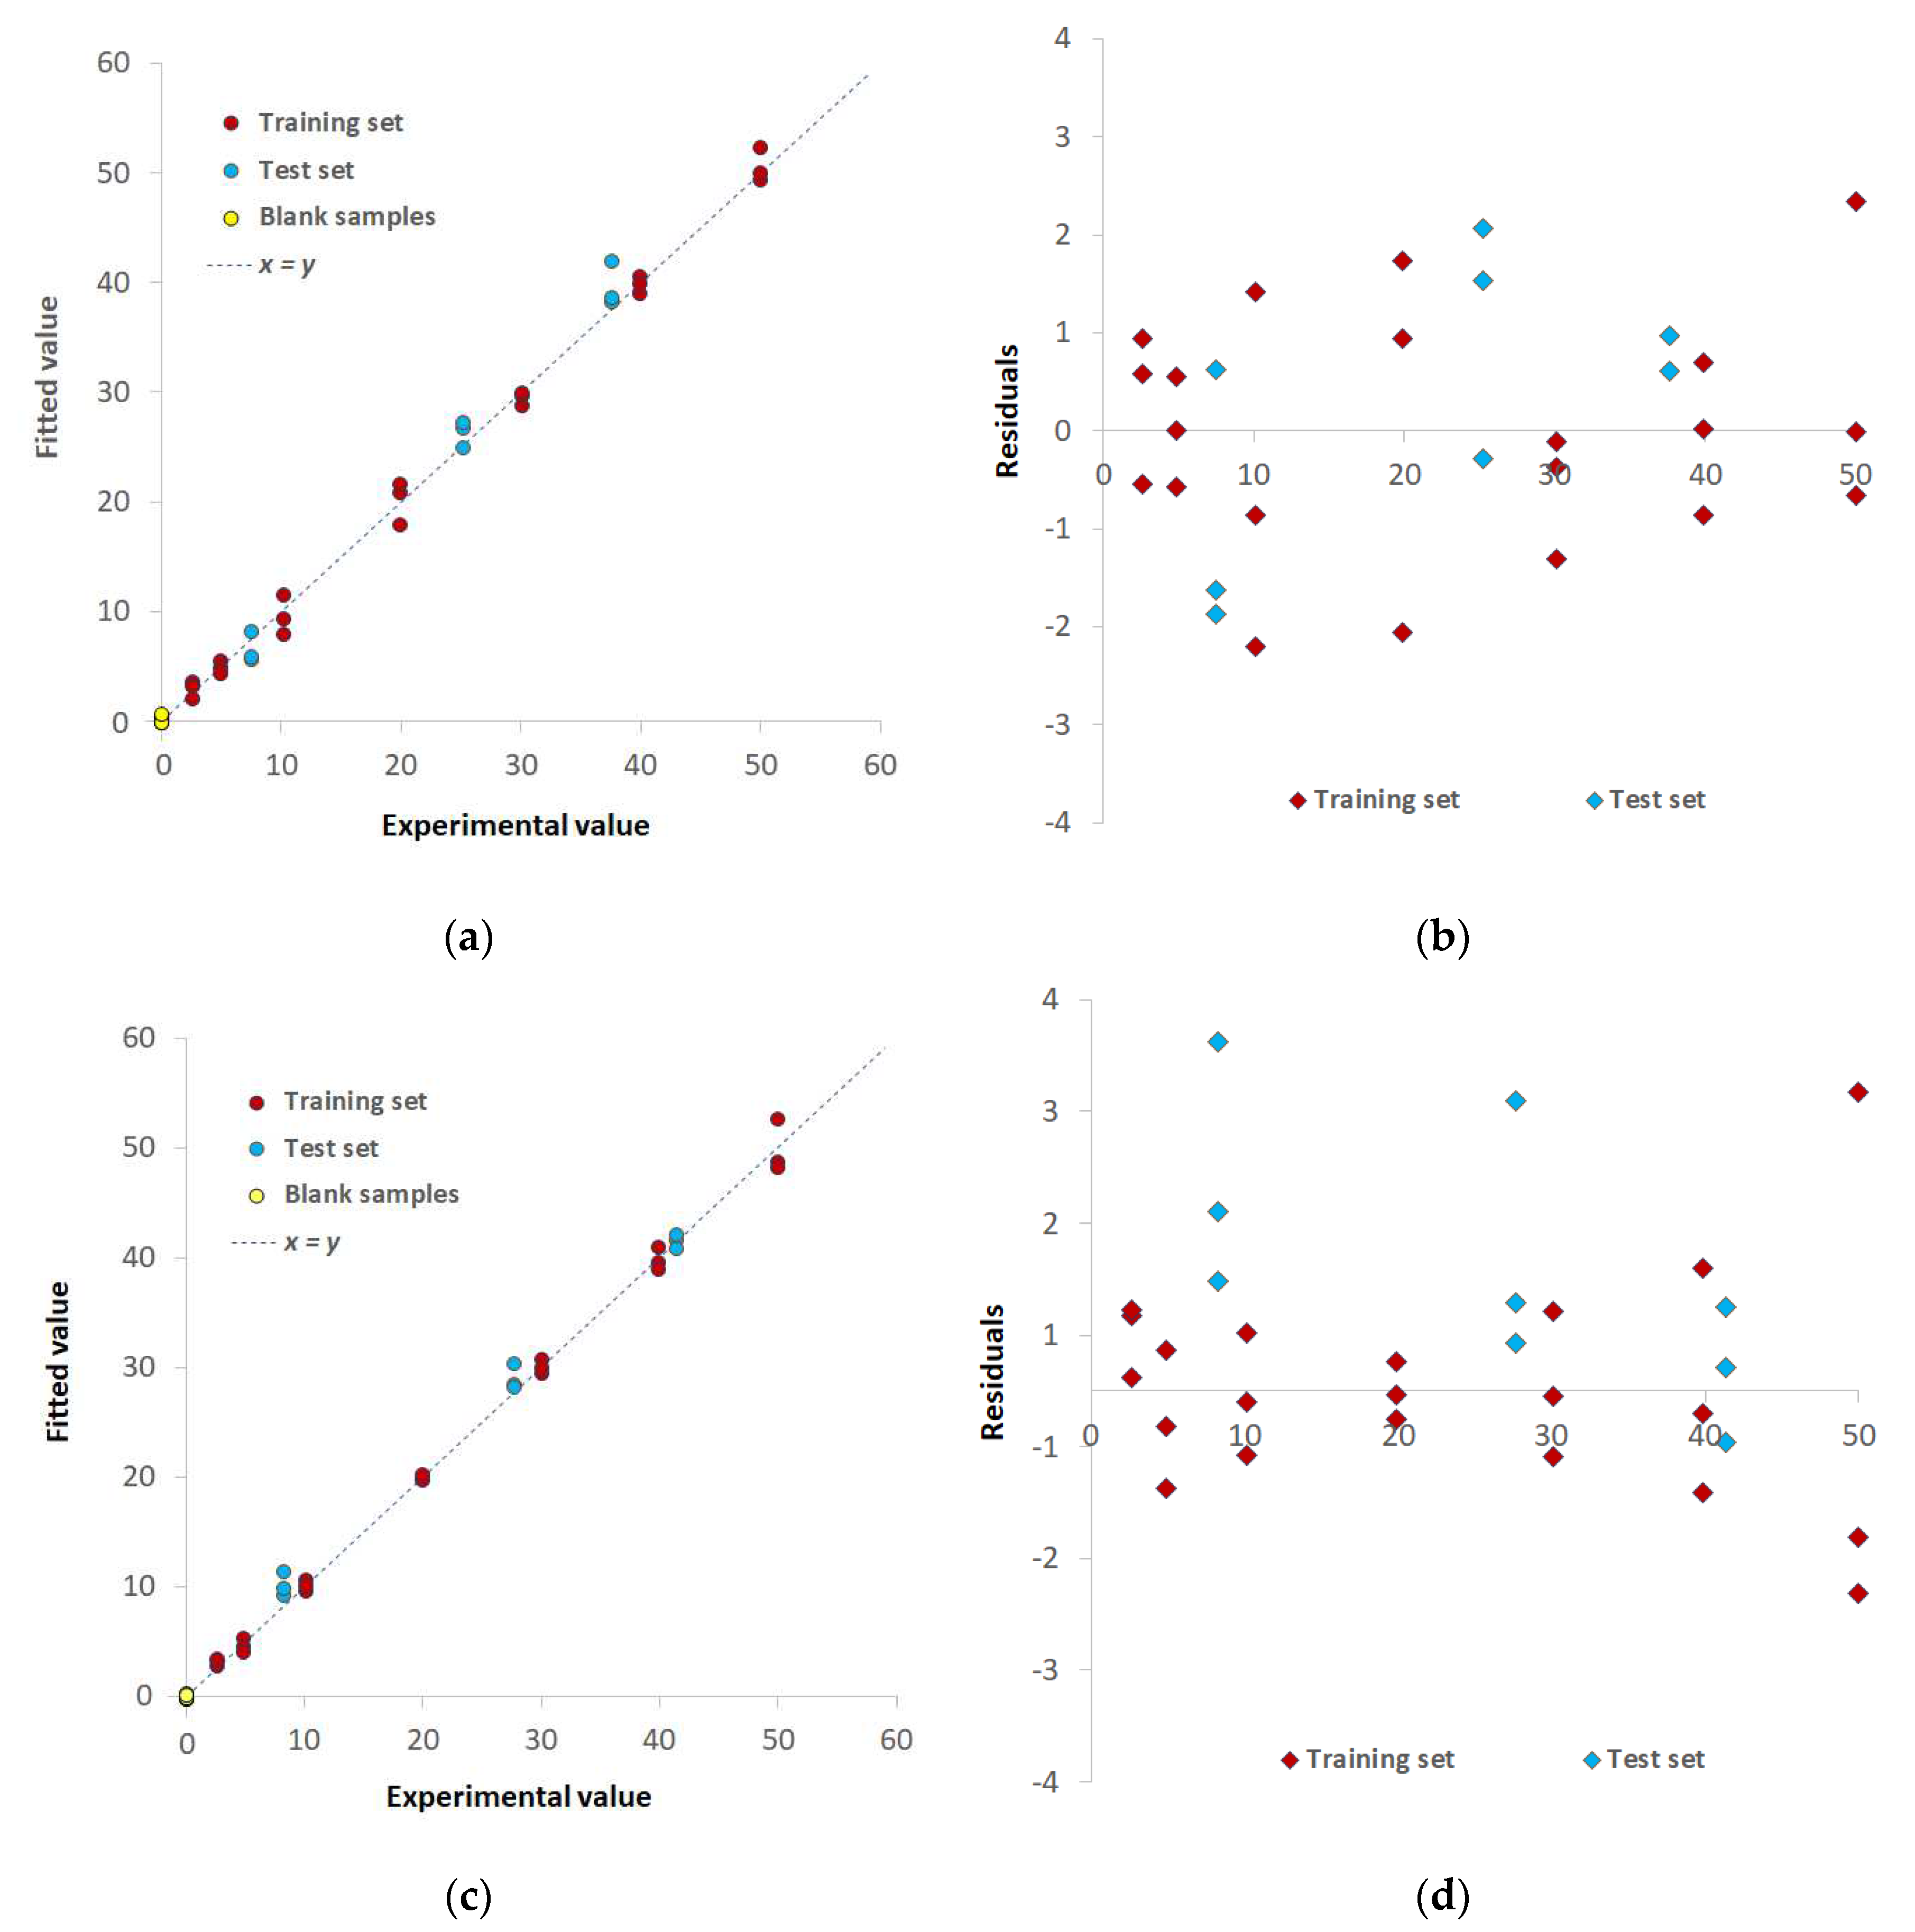
Figure 8 shows similar plots obtained for the systems Pd(II)/TazoC-PADs at pH 4 and Pd(II)/TazoC-PADs at pH 5.5.
The figures of merit and the LOD and LOQ values for all three PLS models were summarized in Table 1.
The three models' robustness and predictive ability were demonstrated; indeed, the training set and test set samples are analogously distributed alongside the y=x straight line, and no significant differences in the fitting errors arise. As expected, the operational LOD and LOQ values are similar independently of the solution pH since the quantitative formation of the Pd(II)/TazoC-PADs complex also occurs in very acidic media.
Moreover, the lowest quantifiable concentration values (LOQ) achieved were similar to or, in most cases, lower than those obtained with previously proposed test strips based on different colorimetric or fluorescent probes (see Table 2).

3.3. TazoC-PADs applications: interference tests and spiked tap waters analysis

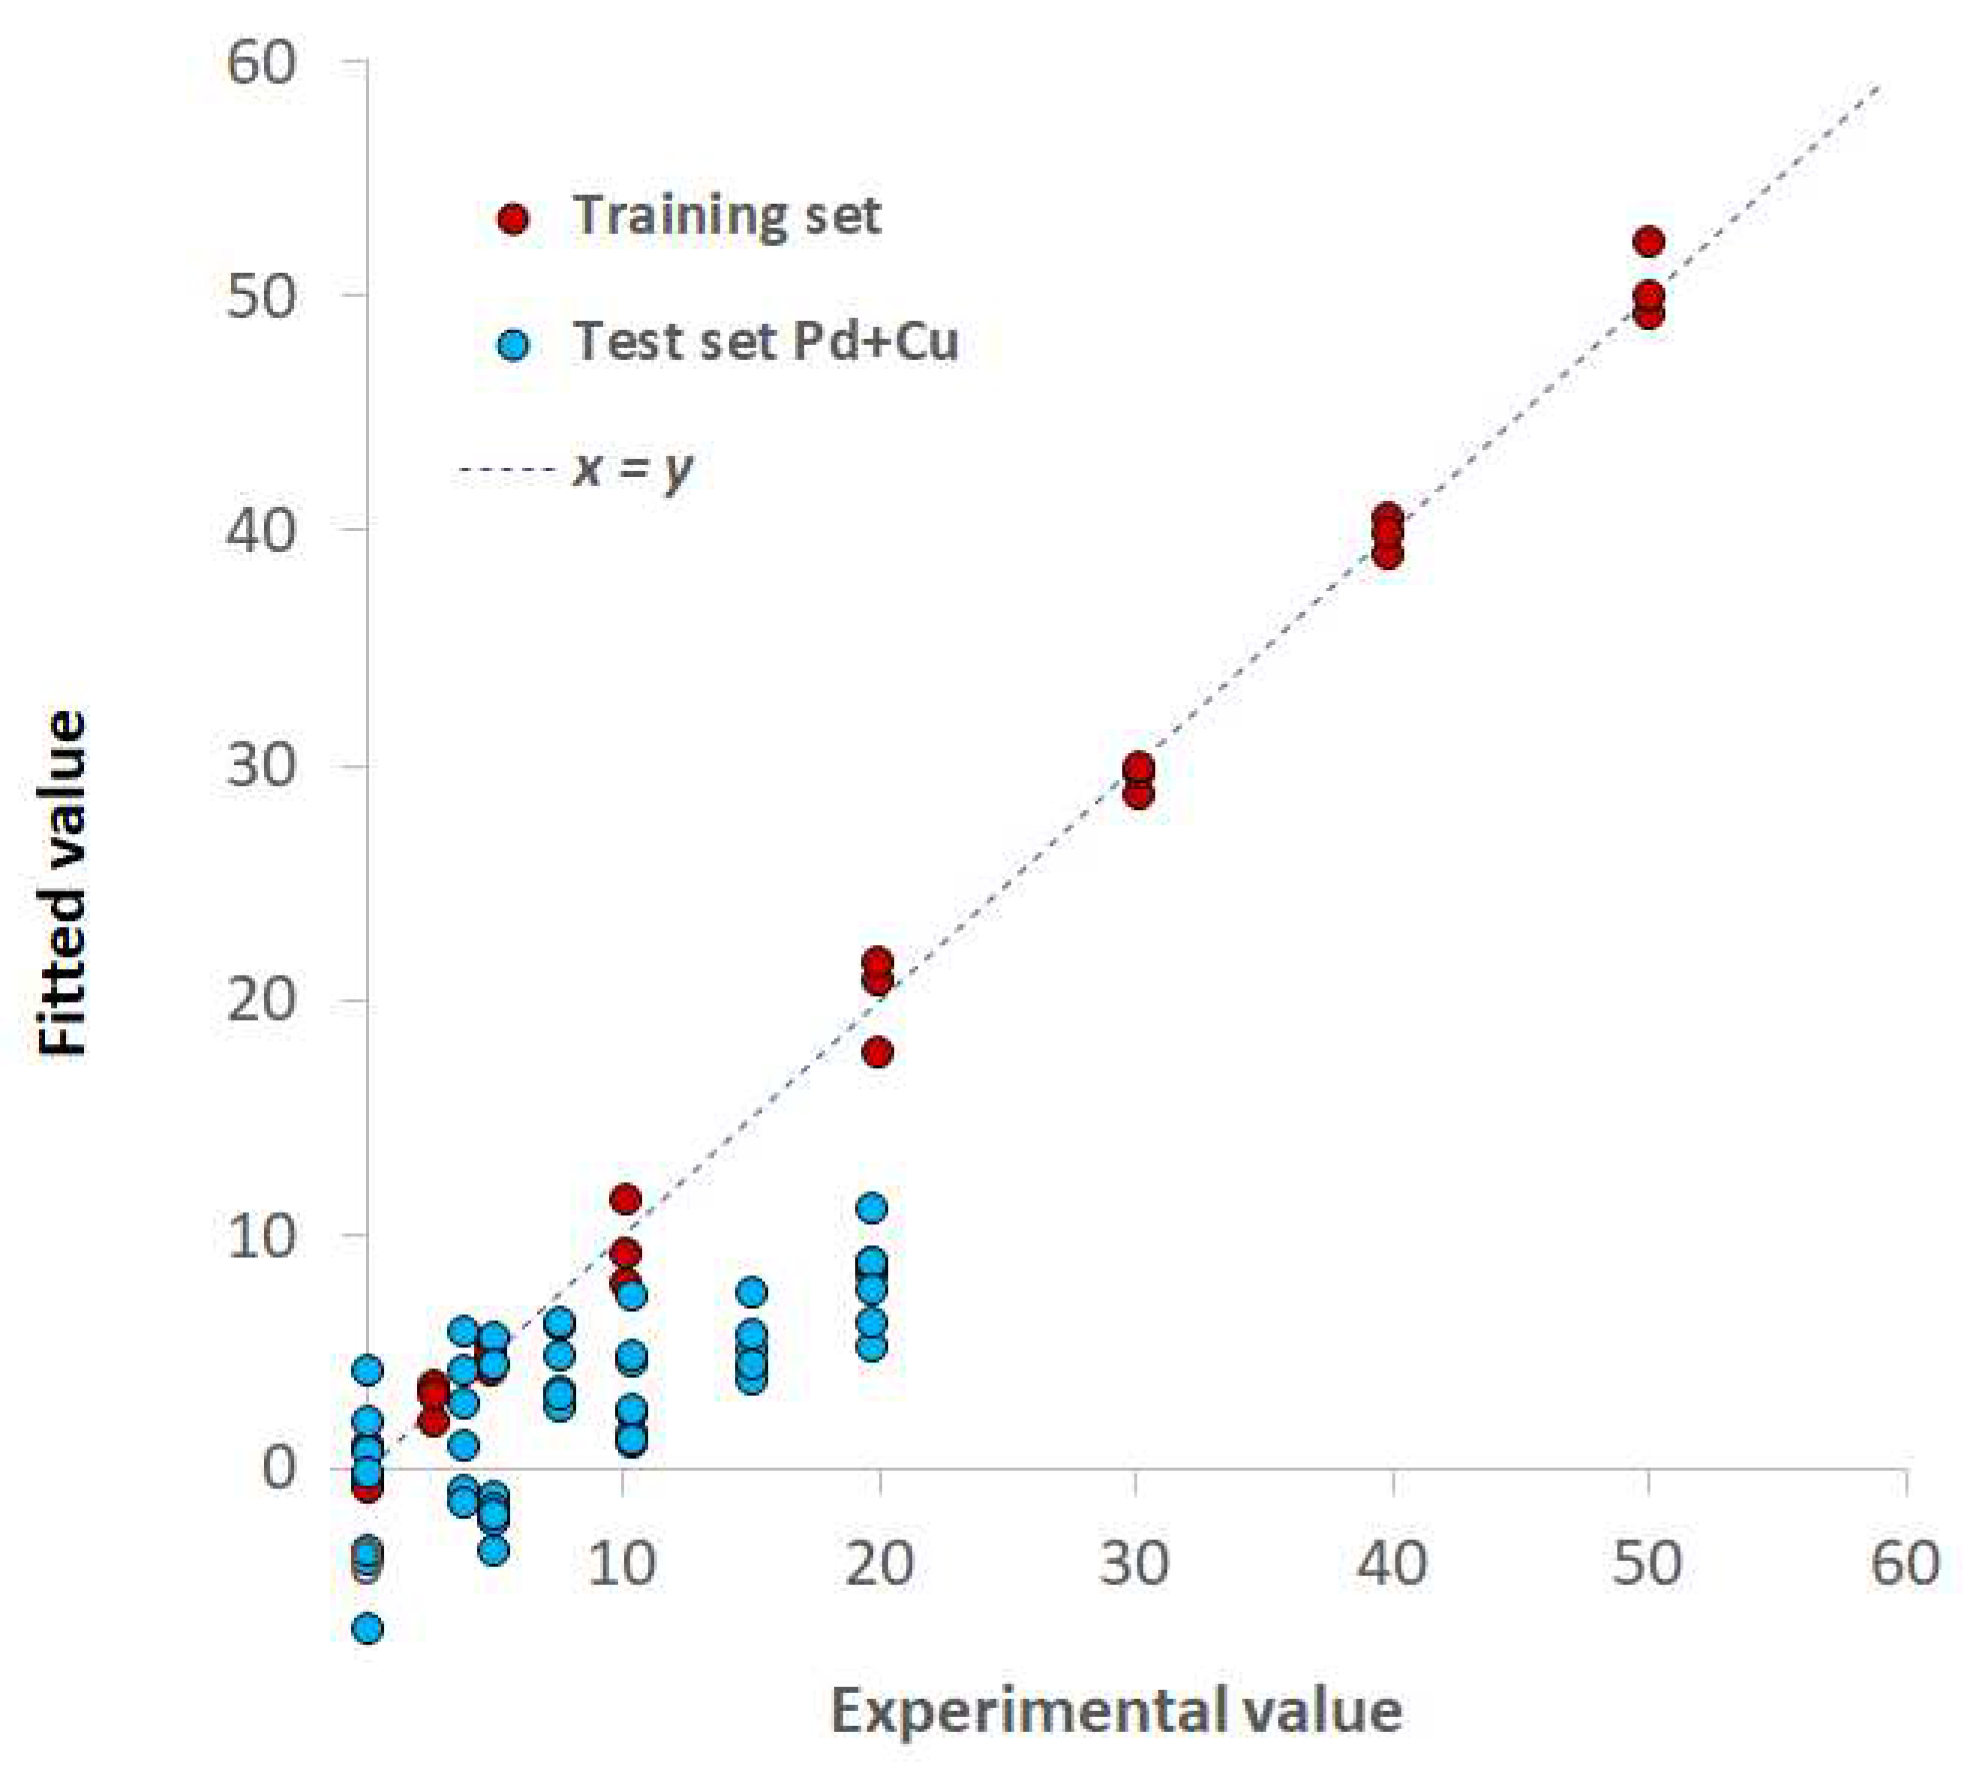
As for any analytical method subject to interference or in the presence of complex real matrices, calibration with external standards is often ineffective for analyte quantification [63,64,65]. As a demonstrative example, Figure 9 shows the PLS plot of the model Pd(II)/TazoC-PADs at pH 4, where mixtures of Pd(II) and Cu(II) at different concentrations were used as test set samples. The model failed: the Pd(II) concentrations were incorrectly predicted.
The usual strategy to overcome interferences and complex matrix problems is the application of the standard additions method or the matrix-matched calibrations [63,64]. The second approach was adopted here, developing tailored PLS models both in the case of interferents and for spiked tap water samples analysis.
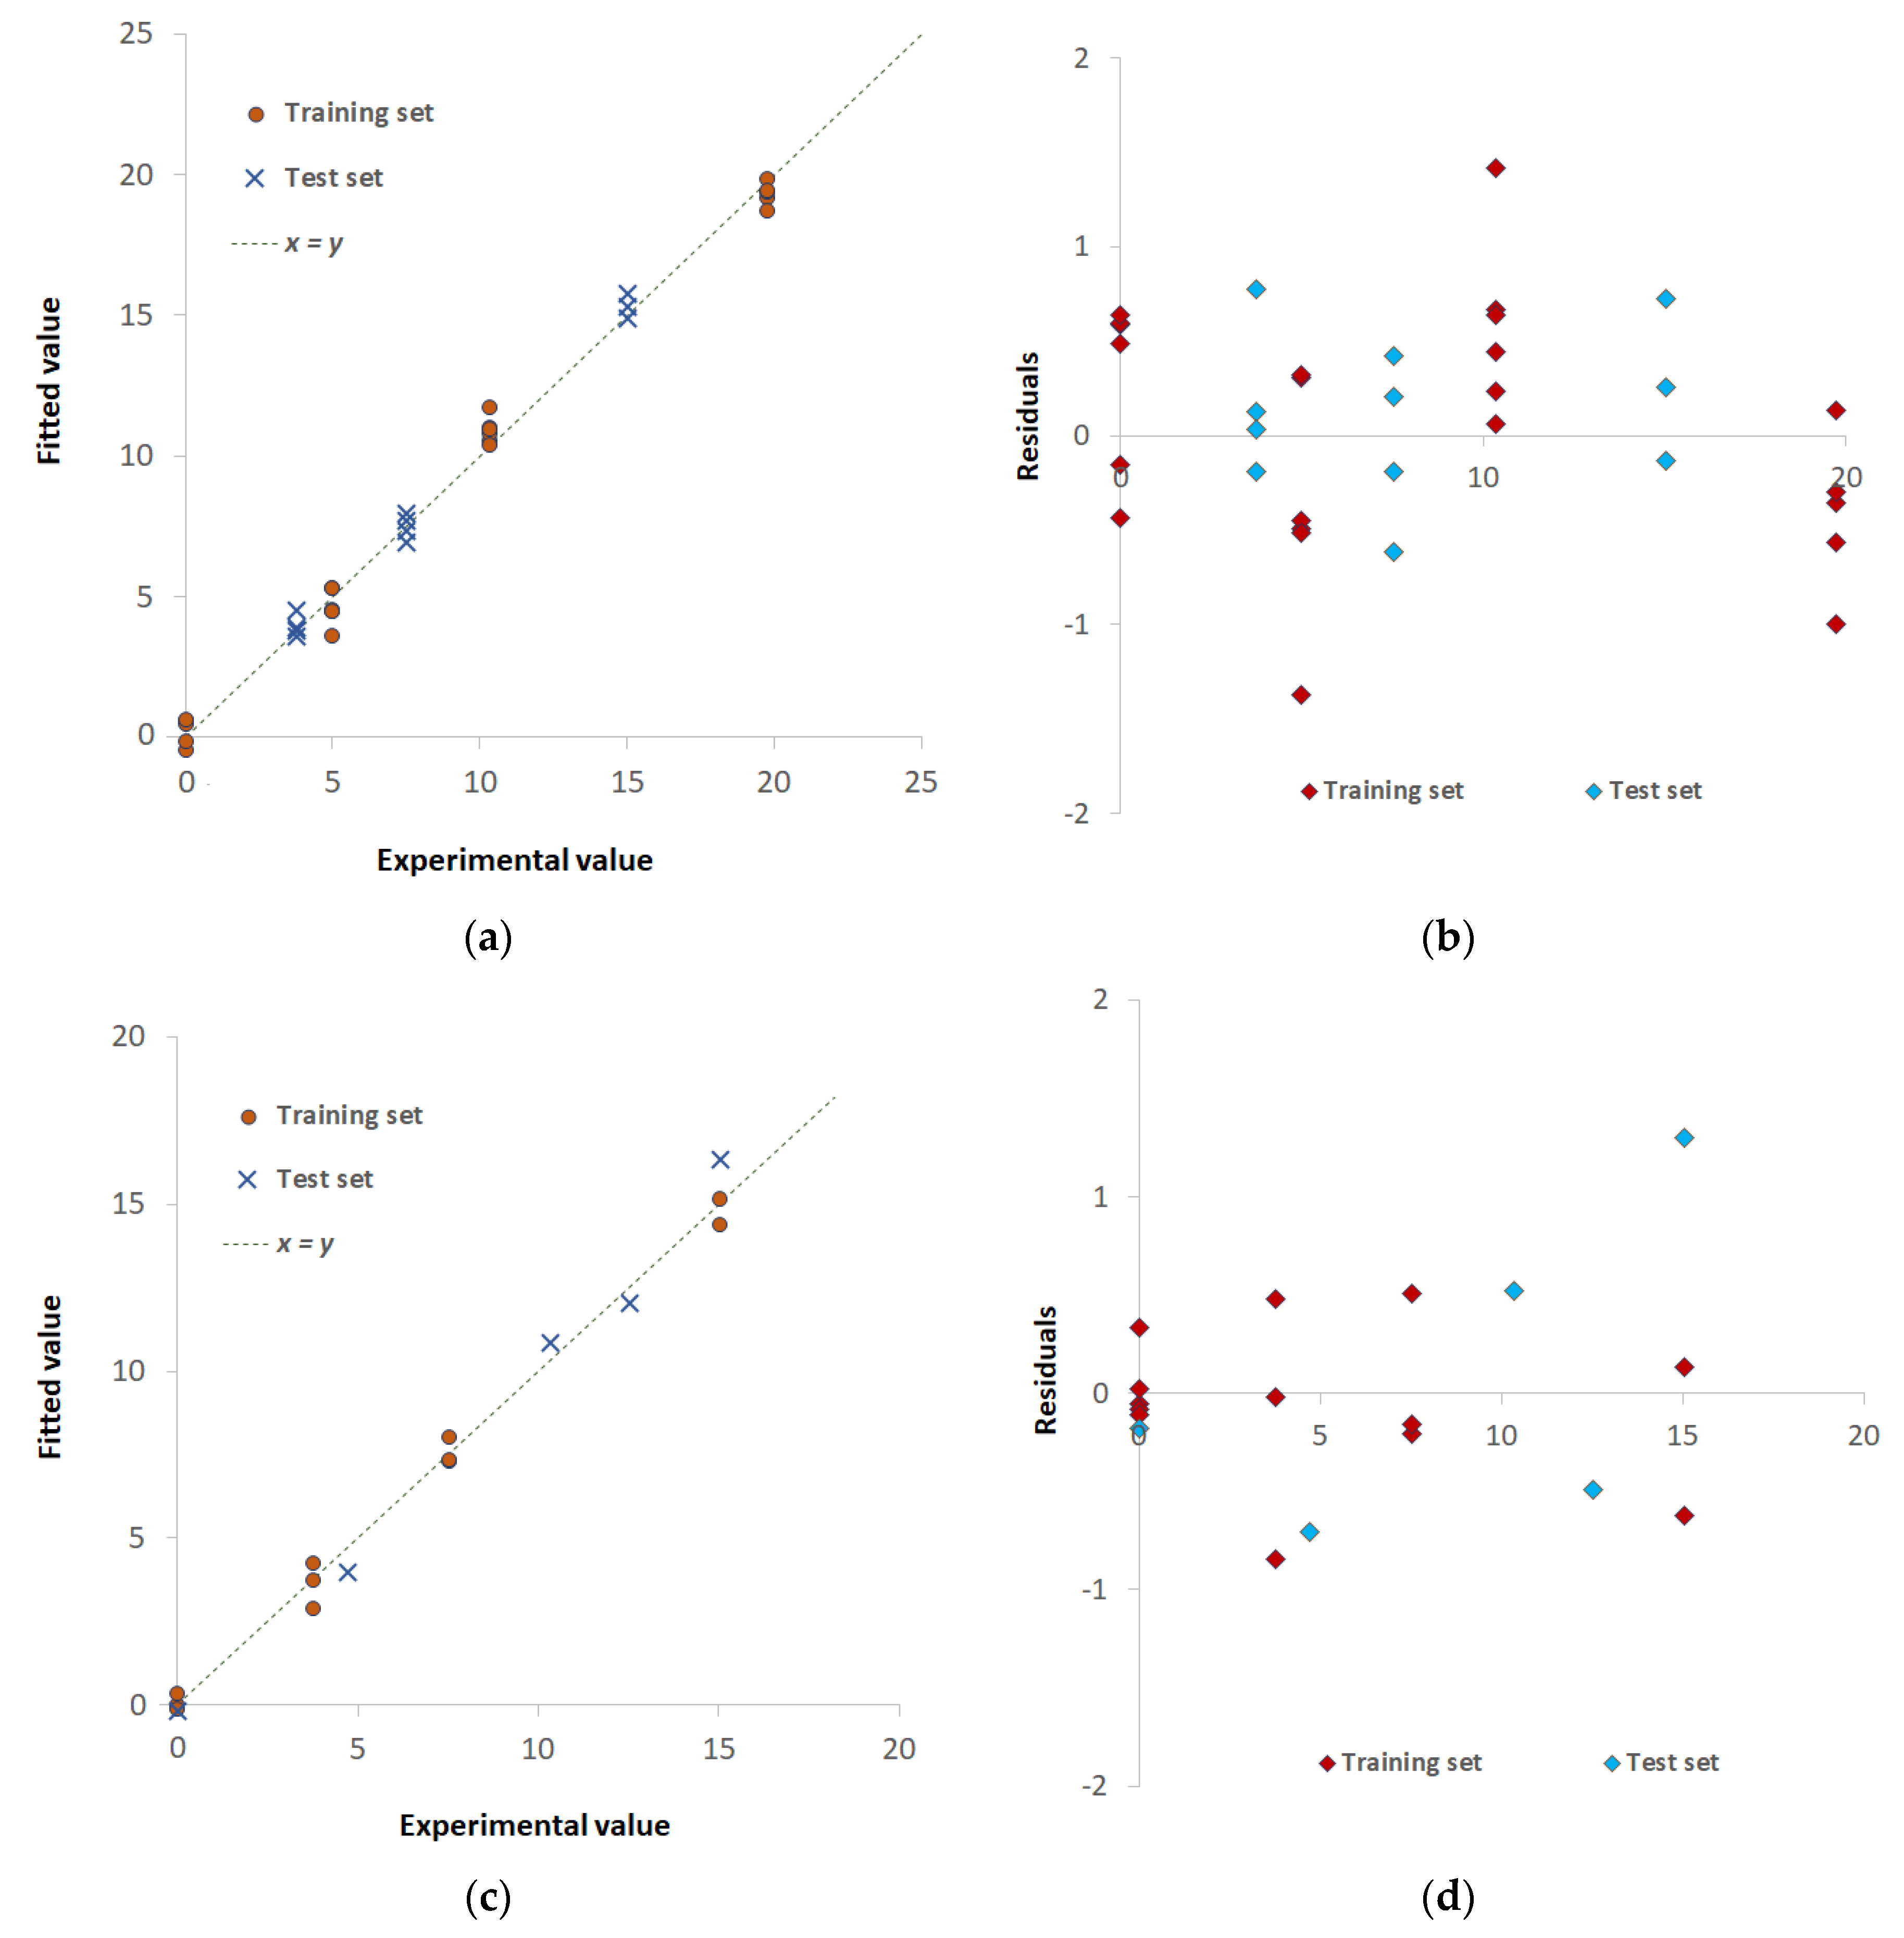
The following Figure 10 and Table 3 report the PLS plots and the figures of merits for the models named Pd(II)+Cu(II)/TazoC-PADs pH 4 and Pd(II)+Cu(II)+Ni(II)/TazoC-PADs pH 5.5. In these cases, mixtures of variable different and independent concentrations of the metal cations were considered for both training and test set samples (see Supplementary Materials).
Both PLS models proved to be adequate in predicting the Pd(II) concentrations even in the presence of interfering cations since the pretty good agreement between experimental and fitted values. The residual plots' analysis demonstrates, also in these cases, the linearity and homoscedasticity of the models as the random distribution of the points.
The applicability of the TazoC-PADs to tap water samples was verified by adopting the same approach of matrix-matched calibration used for the interference tests.
As recommended from the preservation of water samples for metals' analysis rules [66], acidification at pH < 2 must be done to avoid the precipitation of hydroxides. Accordingly, the PLS model was built using tap water samples, acidified at pH 2 and fortified with Pd(II) (model name: Pd(II)/TazoC-PADs TW). Three tap water samples were acidified and spiked with different Pd(II) concentrations (7.5, 25.2 and 44.6 µM) and used as the external dataset (3 replicates for each sample).
The PLS model's figures of merit are reported in Table 4; in Figure 11a, the Experimental vs. predicted values plot for the training set (light blue-colored points) and test set (yellow-colored points) is shown. In Figure 11b, the residual plot is reported. The recovery percentage was computed from the test set samples' predicted concentration values and reported in Table 5, together with the Pd(II) concentration values obtained by ICP-OES analysis for comparison.
The percentage of recoveries (Rc%) for each Pd(II) concentration is between 80% and 110%, i.e., the acceptable recovery range [67,68], demonstrating the suitability of the proposed method for Pd(II) determination in drinking waters. Moreover, the concentration values obtained are not significantly different from those achieved by the classical ICP-OES technique.

4. Conclusions

A cheap, selective colorimetric Paper-based Analytical Device (PADs) for Pd(II) sensing and quantification is proposed. The chromogenic receptor immobilized on filter paper is a non-commercial azo dye named TazoC (disodium 2-[(1H-5-tetrazolyl)azo]-1,8-dihydroxynaphthalene-3,6 disulphonate); it is selected because it forms a strong and stable purple-blue-colored complex with Pd(II) also in very acidic media (below pH 2).
A proper application of the chemometric tool, PLS, permitted to build spectrum/Pd(II) concentration correlation models, taking advantage of using the whole spectrum as the signal accounting for changes in shape and height of the spectrum peaks. Different tailored PLS models were developed and validated, highlighting the need to perform calibrations in the media of interest.
The lowest quantifiable concentration values achieved, of about 2.5 μM, were similar to or, in most cases, lower than those obtained with previously proposed test strips based on different colorimetric or fluorescent probes. Moreover, according to the WHO threshold limit for Pd content in drug chemicals (from 47.0 μM to 94.0 μM, i.e., from 5 mg/L to 10 mg/L) [69], and the United Nations Food and Agriculture Organization (FAO) recommended maximum level for irrigation waters of 47.0 μM (5 mg/L) [70], the lowest quantifiable Pd(II) concentration obtainable with the proposed PADs meet the requirements of WHO and FAO for palladium(II) detection in that matrixes.

Supplementary Materials

The following supporting information can be downloaded at the website of this paper posted on Preprints.org. Figure S1. PLS model Pd(II)/TazoC-PADs pH 2: Model performances; Table S1. PLS model Pd(II)/TazoC-PADs pH 2: Experimental and fitted data; Figure S2. PLS model Pd(II)/TazoC-PADs pH 4: Model performances; Table S2. PLS model Pd(II)/TazoC-PADs pH 4: Experimental and fitted data; Figure S3. PLS model Pd(II)/TazoC-PADs pH 5.5: Model performances; Table S3. PLS model Pd(II)/TazoC-PADs pH 5.5: Experimental and fitted data; Figure S4. PLS model Pd(II)+Cu(II)/TazoC-PADs pH 4: Model performances; Table S4. Pd(II)+Cu(II)/TazoC-PADs pH 4: Experimental and fitted data; Figure S5. PLS model Pd(II)+Cu(II)+Ni(II)/TazoC-PADs pH 5.5: Model performances; Table S5. Pd(II)+Cu(II)+Ni(II)/TazoC-PADs pH 5.5: Experimental and fitted data; Figure S6. PLS model Pd(II)/TazoC-PADs TW: Model performances; Table S6. PLS model Pd(II)/TazoC-PADs TW: Experimental and fitted data.

Author Contributions

Conceptualization, G.A. and L.R.M.; methodology, G.A. and L.R.M.; formal analysis, G.A., L.R.M. and M.I.; investigation, M.I..; data curation, G.A., L.R.M. and R.B.; writing—original draft preparation, G.A.; writing—review and editing, C.Z., L.R.M. and R.B.; All authors have read and agreed to the published version of the manuscript.

Funding

This research received no external funding.

Institutional Review Board Statement

Not applicable.

Informed Consent Statement

Not applicable.

Data Availability Statement

Data is contained within the article and supplementary material.

Acknowledgments

We thank MIUR for funding Camilla Zanoni's Ph.D. grants and the support from the Ministero dell'Università e della Ricerca (MUR) and the University of Pavia through the program "Dipartimenti di Eccellenza 2023–2027".

Conflicts of Interest

The authors declare no conflict of interest.

References

  1. Leśniewska, B.A.; Godlewska-Żyłkiewicz, B.; Bocca, B.; Caimi, S.; Caroli, S.; Hulanicki, A. Platinum, palladium and rhodium content in road dust, tunnel dust and common grass in Białystok area (Poland): a pilot study. Sci. Total Environ. 2004, 321, 93–104. [Google Scholar] [CrossRef] [PubMed]
  2. Tietze, L.F.; Ila, H.; Bell, H.P. Enantioselective Palladium-Catalyzed Transformations. Chem. Rev. 2004, 104, 3453–3516. [Google Scholar] [CrossRef] [PubMed]
  3. Wu, X.-F.; Neumann, H.; Beller, M. Palladium-catalyzed carbonylative coupling reactions between Ar–X and carbon nucleophiles. Chem. Soc. Rev. 2011, 40, 4986–5009. [Google Scholar] [CrossRef] [PubMed]
  4. Sore, H.F.; Galloway, W.R.J.D.; Spring, D.R. Palladium-catalysed cross-coupling of organosilicon reagents. Chem. Soc. Rev. 2011, 41, 1845–1866. [Google Scholar] [CrossRef]
  5. Pyrzńska, K. Viewpoint Monitoring of platinum in the environment. J. Environ. Monit. 2000, 2, 99N–103N. [Google Scholar] [CrossRef]
  6. Zischka, M.; Schramel, P.; Muntau, H.; Rehnert, A.; Gomez, M.G.; Stojanik, B.; Wannemaker, G.; Dams, R.; Quevauviller, P.; A Maier, E. A new certified reference material for the quality control of palladium, platinum and rhodium in road dust, BCR-723. TrAC Trends Anal. Chem. 2002, 21, 851–868. [Google Scholar] [CrossRef]
  7. Ek, K.H.; Morrison, G.M.; Rauch, S. Environmental routes for platinum group elements to biological materials—a review. Sci. Total. Environ. 2004, 334-335, 21–38. [Google Scholar] [CrossRef]
  8. Rauch, S.; Morrison, G.M. Environmental Relevance of the Platinum-Group Elements. Elements 2008, 4, 259–263. [Google Scholar] [CrossRef]
  9. Moldovan, M.; Palacios, M.; Gómez, M.; Morrison, G.; Rauch, S.; McLeod, C.; Ma, R.; Caroli, S.; Alimonti, A.; Petrucci, F.; et al. Environmental risk of particulate and soluble platinum group elements released from gasoline and diesel engine catalytic converters. Sci. Total. Environ. 2002, 296, 199–208. [Google Scholar] [CrossRef]
  10. Savignan, L.; Faucher, S.; Chéry, P.; Lespes, G. Platinum group elements contamination in soils: Review of the current state. Chemosphere 2021, 271, 129517. [Google Scholar] [CrossRef]
  11. Ravindra, K.; Bencs, L.; Van Grieken, R. Platinum group elements in the environment and their health risk. Sci. Total. Environ. 2004, 318, 1–43. [Google Scholar] [CrossRef] [PubMed]
  12. Hosseini, M.-J.; Jafarian, I.; Farahani, S.; Khodadadi, R.; Tagavi, S.H.; Naserzadeh, P.; Mohammadi-Bardbori, A.; Arghavanifard, N. New mechanistic approach of inorganic palladium toxicity: impairment in mitochondrial electron transfer. Metallomics 2016, 8, 252–259. [Google Scholar] [CrossRef] [PubMed]
  13. Angelone, M.; Nardi, E.; Pinto, V.; Cremisini, C. Analytical Methods to Determine Palladium in Environmental Matrices: A Review. 2006. [Google Scholar] [CrossRef]
  14. Bagheri, A.; Taghizadeh, M.; Behbahani, M.; Asgharinezhad, A.A.; Salarian, M.; Dehghani, A.; Ebrahimzadeh, H.; Amini, M.M. Synthesis and characterization of magnetic metal-organic framework (MOF) as a novel sorbent, and its optimization by experimental design methodology for determination of palladium in environmental samples. Talanta 2012, 99, 132–139. [Google Scholar] [CrossRef]
  15. Gomez, M.; Palacios, M. Control of interferences in the determination of Pt, Pd and Rh in airborne particulate matter by inductively coupled plasma mass spectrometry. Anal. Chim. Acta 2000, 404, 285–294. [Google Scholar] [CrossRef]
  16. Georgeva, M.; Pihlar, B. Determination of palladium by adsorptive stripping voltammetry. Fresenius J. Anal. Chem. 1997, 357, 874–880. [Google Scholar] [CrossRef]
  17. Locatelli, C. Voltammetric Peak Area as Instrumental Datum. A Possibility to Improve the Determination at Ultratrace Level Concentration of Platinum Group Metals (PGMs) and Lead. Application to Particulate Matter. Electroanalysis 2007, 19, 445–452. [Google Scholar] [CrossRef]
  18. Bobrowski, A.; Gawlicki, M.; Kapturski, P.; Mirceski, V.; Spasovski, F.; Zarębski, J. The Silver Amalgam Film Electrode in Adsorptive Stripping Voltammetric Determination of Palladium(II) as Its Dimethyldioxime Complex. Electroanalysis 2008, 21, 36–40. [Google Scholar] [CrossRef]
  19. Velmurugan, M.; Thirumalraj, B.; Chen, S.-M.; Al-Hemaid, F.M.; Ali, M.A.; Elshikh, M.S. Development of electrochemical sensor for the determination of palladium ions (Pd2+) using flexible screen printed un-modified carbon electrode. J. Colloid Interface Sci. 2017, 485, 123–128. [Google Scholar] [CrossRef]
  20. Bai, H.; Wang, S.; Liu, P.; Xiong, C.; Zhang, K.; Cao, Q. Electrochemical sensor based on in situ polymerized ion-imprinted membranes at graphene modified electrode for palladium determination. J. Electroanal. Chem. 2016, 771, 29–36. [Google Scholar] [CrossRef]
  21. Li, H.; Fan, J.; Peng, X. Colourimetric and fluorescent probes for the optical detection of palladium ions. Chem. Soc. Rev. 2013, 42, 7943–7962. [Google Scholar] [CrossRef]
  22. Balamurugan, R.; Liu, J.-H.; Liu, B.-T. A review of recent developments in fluorescent sensors for the selective detection of palladium ions. Co-ord. Chem. Rev. 2018, 376, 196–224. [Google Scholar] [CrossRef]
  23. Biesuz, R.; Nurchi, V.M.; Lachowicz, J.I.; Alberti, G. Unusual PLS application for Pd(ii) sensing in extremely acidic solutions. New J. Chem. 2018, 42, 7901–7907. [Google Scholar] [CrossRef]
  24. Kamel, R.M.; Shahat, A.; Atta, A.H.; Farag-Allah, M.M. Development of a novel and potential chemical sensor for colorimetric detection of Pd(II) or Cu(II) in E-wastes. Microchem. J. 2021, 172, 106951. [Google Scholar] [CrossRef]
  25. Xu, Y.; Liu, M.; Kong, N.; Liu, J. Lab-on-paper micro-and nano-analytical devices: Fabrication, modification, detection and emerging applications. Microchim. Acta 2016, 183, 1521–1542. [Google Scholar] [CrossRef]
  26. Ozer, T.; McMahon, C.; Henry, C.S. Advances in Paper-Based Analytical Devices. Annu. Rev. Anal. Chem. 2020, 13, 85–109. [Google Scholar] [CrossRef]
  27. Magnaghi, L.R.; Alberti, G.; Pazzi, B.M.; Zanoni, C.; Biesuz, R. A green-PAD array combined with chemometrics for pH measurements. New J. Chem. 2022, 46, 19460–19467. [Google Scholar] [CrossRef]
  28. He, Y.; Wu, Y.; Fu, J.-Z.; Wu, W.-B. Fabrication of paper-based microfluidic analysis devices: a review. RSC Adv. 2015, 5, 78109–78127. [Google Scholar] [CrossRef]
  29. Sruthi, P.S.; Balasubramanian, S.; Kumar, P.S.; Kapoor, A.; Ponnuchamy, M.; Jacob, M.M.; Prabhakar, S. Eco-friendly pH detecting paper-based analytical device: Towards process intensification. Anal. Chim. Acta 2021, 1182, 338953. [Google Scholar] [CrossRef]
  30. Mentele, M.M.; Cunningham, J.; Koehler, K.; Volckens, J.; Henry, C.S. Microfluidic Paper-Based Analytical Device for Particulate Metals. Anal. Chem. 2012, 84, 4474–4480. [Google Scholar] [CrossRef]
  31. Hossain, S.M.Z.; Brennan, J.D. β-Galactosidase-Based Colorimetric Paper Sensor for Determination of Heavy Metals. Anal. Chem. 2011, 83, 8772–8778. [Google Scholar] [CrossRef]
  32. Ariza-Avidad, M.; Salinas-Castillo, A.; Cuéllar, M.P.; Agudo-Acemel, M.; Pegalajar, M.C.; Capitán-Vallvey, L.F. Printed Disposable Colorimetric Array for Metal Ion Discrimination. Anal. Chem. 2014, 86, 8634–8641. [Google Scholar] [CrossRef] [PubMed]
  33. Morbioli, G.G.; Mazzu-Nascimento, T.; Stockton, A.M.; Carrilho, E. Technical aspects and challenges of colorimetric detection with microfluidic paper-based analytical devices (μPADs) - A review. Anal. Chim. Acta 2017, 970, 1–22. [Google Scholar] [CrossRef] [PubMed]
  34. Jiménez-Carvelo, A.M.; Salloum-Llergo, K.D.; Cuadros-Rodríguez, L.; Capitán-Vallvey, L.F.; Ramos, F. A perfect tandem: chemometric methods and microfluidic colorimetric twin sensors on paper. Beyond the traditional analytical approach. Microchem. J. 2020, 157, 104930. [Google Scholar] [CrossRef]
  35. Pazzi, B.M.; Pistoia, D.; Alberti, G. RGB-Detector: A Smart, Low-Cost Device for Reading RGB Indexes of Microfluidic Paper-Based Analytical Devices. Micromachines 2022, 13, 1585. [Google Scholar] [CrossRef]
  36. Hamedpour, V.; Postma, G.J.; Heuvel, E.v.D.; Jansen, J.J.; Suzuki, K.; Citterio, D. Chemometrics-assisted microfluidic paper-based analytical device for the determination of uric acid by silver nanoparticle plasmon resonance. Anal. Bioanal. Chem. 2018, 410, 2305–2313. [Google Scholar] [CrossRef]
  37. Shariati-Rad, M.; Irandoust, M.; Mohammadi, S. Multivariate analysis of digital images of a paper sensor by partial least squares for determination of nitrite. Chemom. Intell. Lab. Syst. 2016, 158, 48–53. [Google Scholar] [CrossRef]
  38. Ataide, V.N.; Filho, L.A.P.; Guinati, B.G.S.; Moreira, N.S.; Gonçalves, J.D.; Ribeiro, C.M.G.; Grasseschi, D.; Coltro, W.K.T.; Salles, M.O.; Paixão, T.R.L.C. Combining chemometrics and paper-based analytical devices for sensing: An overview. TrAC Trends Anal. Chem. 2023, 164. [Google Scholar] [CrossRef]
  39. Pesavento, M.; Riolo, C.; Soldi, T.; Cervo, G. Spectrophotometric study of the equilibria between lanathanum (III) and three azodyes. Ann. Chim. 1979, 69, 649–661. [Google Scholar]
  40. Pesavento, M.; Riolo, C.; Biesuz, R. Spectrophotometric Determination of Palladium(ll) with Four Water-soluble Heterocyclic Azo Dyes. Analyst 1985, 110, 801–805. [Google Scholar] [CrossRef]
  41. Pesavento, M.; Profumo, A. ChemInform Abstract: Evaluation of the Activity Coefficients of Some Sulfonated Azo Dyes and of Their Complexes with Metal Ions. ChemInform 1992, 23. [Google Scholar] [CrossRef]
  42. Pesavento, M.; Profumo, A.; Sastre, A.M. Chromatographic behaviour of trace metal ions on a strong base anion exchange resin functionalized by azo ligands. Talanta 1994, 41, 1689–1697. [Google Scholar] [CrossRef] [PubMed]
  43. Geladi, P.; Kowalski, B.R. Partial least-squares regression: a tutorial. Anal. Chim. Acta 1986, 185, 1–17. [Google Scholar] [CrossRef]
  44. Wold, S.; Sjöström, M.; Eriksson, L. PLS-regression: a basic tool of chemometrics. Chemom. Intell. Lab. Syst. 2001, 58(2), 109–130. [Google Scholar] [CrossRef]
  45. Haenlein, M.; Kaplan, A.M. A Beginner's Guide to Partial Least Squares Analysis. Understand. Stat. 2004, 3(4), 283–297. [Google Scholar] [CrossRef]
  46. Hassaninejad-Darzi, S.K.; Torkamanzadeh, M. Simultaneous UV-Vis spectrophotometric quantification of ternary basic dye mixtures by partial least squares and artificial neural networks. Water Sci. Technol. 2016, 74, 2497–2504. [Google Scholar] [CrossRef]
  47. Magnaghi, L.R.; Alberti, G.; Pazzi, B.M.; Zanoni, C.; Biesuz, R. A green-PAD array combined with chemometrics for pH measurements. New J. Chem. 2022, 46, 19460–19467. [Google Scholar] [CrossRef]
  48. Magnaghi, L.R.; Capone, F.; Zanoni, C.; Alberti, G.; Quadrelli, P.; Biesuz, R. Colorimetric Sensor Array for Monitoring, Modelling and Comparing Spoilage Processes of Different Meat and Fish Foods. Foods 2020, 9, 684. [Google Scholar] [CrossRef]
  49. Alberti, G.; Re, S.; Tivelli, A.M.C.; Biesuz, R. Smart sensory materials for divalent cations: a dithizone immobilized membrane for optical analysis. Anal. 2016, 141, 6140–6148. [Google Scholar] [CrossRef]
  50. Leardi, R.; Melzi, C.; Polotti, G. CAT (Chemometric Agile Tool). Available online: http://www.gruppochemiometria.it/index.php/software/19-download-the-rbased-chemometric-software (accessed on 3 July 2023).
  51. Younas, M.; Maryam, A.; Khan, M.; Nawaz, A.A.; Jaffery, S.H.I.; Anwar, M.N.; Ali, L. Parametric analysis of wax printing technique for fabricating microfluidic paper-based analytic devices (µPAD) for milk adulteration analysis. Microfluid. Nanofluidics 2019, 23, 1–10. [Google Scholar] [CrossRef]
  52. Lu, Y.; Shi, W.; Qin, J.; Lin, B. Fabrication and Characterization of Paper-Based Microfluidics Prepared in Nitrocellulose Membrane By Wax Printing. Anal. Chem. 2009, 82, 329–335. [Google Scholar] [CrossRef]
  53. Dungchai, W.; Chailapakul, O.; Henry, C.S. A low-cost, simple, and rapid fabrication method for paper-based microfluidics using wax screen-printing. Anal. 2010, 136, 77–82. [Google Scholar] [CrossRef] [PubMed]
  54. Ghosh, R.; Gopalakrishnan, S.; Savitha, R.; Renganathan, T.; Pushpavanam, S. Fabrication of laser printed microfluidic paper-based analytical devices (LP-µPADs) for point-of-care applications. Sci. Rep. 2019, 9, 7896. [Google Scholar] [CrossRef] [PubMed]
  55. Abe, K.; Kotera, K.; Suzuki, K.; Citterio, D. Inkjet-printed paper fluidic immuno-chemical sensing device. Anal. Bioanal. Chem. 2010, 398(2), 885–893. [Google Scholar] [CrossRef] [PubMed]
  56. Klasner, S.A.; Price, A.K.; Hoeman, K.W.; Wilson, R.S.; Bell, K.J.; Culbertson, C.T. Paper-based microfluidic devices for analysis of clinically relevant analytes present in urine and saliva. Anal. Bioanal. Chem. 2010, 397, 1821–1829. [Google Scholar] [CrossRef]
  57. Li, X.; Tian, J.; Nguyen, T.; Shen, W. Paper-Based Microfluidic Devices by Plasma Treatment. Anal. Chem. 2008, 80, 9131–9134. [Google Scholar] [CrossRef] [PubMed]
  58. Wang, M.; Liu, X.; Lu, H.; Wang, H.; Qin, Z. Highly selective and reversible chemosensor for Pd2+ detected by fluorescence, colorimetry, and test paper. ACS Appl. Mater. Interfaces 2015, 7(2), 1284–1289. [Google Scholar] [CrossRef]
  59. Yang, L.; Wang, C.; Chang, G.; Ren, X. Facile synthesis of new coumarin-based colorimetric and fluorescent chemosensors: Highly efficient and selective detection of Pd2+ in aqueous solutions. Sensors Actuators B: Chem. 2017, 240, 212–219. [Google Scholar] [CrossRef]
  60. Chen, T.; Wei, T.; Zhang, Z.; Chen, Y.; Qiang, J.; Wang, F.; Chen, X. Highly sensitive and selective ESIPT-based fluorescent probes for detection of Pd2+ with large Stocks shifts. Dye. Pigment. 2017, 140, 392–398. [Google Scholar] [CrossRef]
  61. Dong, Z.; Chen, W.; Li, H.; Dai, Y.; Zheng, T.; Zhang, H.; Xu, H.; Lu, H. A dual-functional colorimetric and “on-off” fluorescent probe based on purine derivative for detecting Pd2+ and Cu2+: Application as test strips. Inorg. Chem. Commun. 2020, 116, 107915. [Google Scholar] [CrossRef]
  62. Zhou, W.; Gao, Q.; Liu, D.; Li, C.; Liu, S.; Xia, K.; Han, B.; Zhou, C. A single molecular sensor for selective and differential colorimetric/ratiometric detection of Cu2+ and Pd2+ in 100% aqueous solution. Spectrochim. Acta Part A: Mol. Biomol. Spectrosc. 2020, 237, 118365. [Google Scholar] [CrossRef]
  63. Cuadros-Rodrı́guez, L.; Gámiz-Gracia, L.; Almansa-López, E.; Laso-Sánchez, J. Calibration in chemical measurement processes: I. A metrological approach. TrAC Trends Anal. Chem. 2001, 20, 195–206. [Google Scholar] [CrossRef]
  64. Cuadros-Rodrı́guez, L.; Gámiz-Gracia, L.; Almansa-López, E.M.; Bosque-Sendra, J.M. Calibration in chemical measurement processes. II. A methodological approach. TrAC Trends Anal. Chem. 2001, 20, 620–636. [Google Scholar] [CrossRef]
  65. Pino, L.K.; Searle, B.C.; Yang, H.-Y.; Hoofnagle, A.N.; Noble, W.S.; MacCoss, M.J. Matrix-Matched Calibration Curves for Assessing Analytical Figures of Merit in Quantitative Proteomics. J. Proteome Res. 2020, 19, 1147–1153. [Google Scholar] [CrossRef]
  66. Standard Methods Committee of the American Public Health Association, American Water Works Association, and Water Environment Federation. 3030 preliminary treatment of samples In: Standard Methods For the Examination of Water and Wastewater. Lipps WC, Baxter TE, Braun-Howland E, editors. Washington DC: APHA Press. [CrossRef]
  67. Huber, L. Validation and Qualification in Analytical Laboratories, 2nd ed.; CRC Press: New York, NY, USA, 2007. [Google Scholar] [CrossRef]
  68. González, A.G.; Herrador, M.A.; Asuero, A.G. Intra-laboratory assessment of method accuracy (trueness and precision) by using validation standards. Talanta 2010, 82, 1995–1998. [Google Scholar] [CrossRef]
  69. Melber, Christine, Keller, Detlef, Mangelsdorf, Inge & International Programme on Chemical Safety. (2002). Palladium. World Health Organization. https://apps.who.int/iris/handle/10665/42401. (accessed on 3 July 2023).
  70. Standard Methods Committee of the American Public Health Association, American Water Works Association, and Water Environment Federation. 3500-pd palladium In: Standard Methods For the Examination of Water and Wastewater. Lipps WC, Baxter TE, Braun-Howland E, editors. Washington DC: APHA Press. [CrossRef]
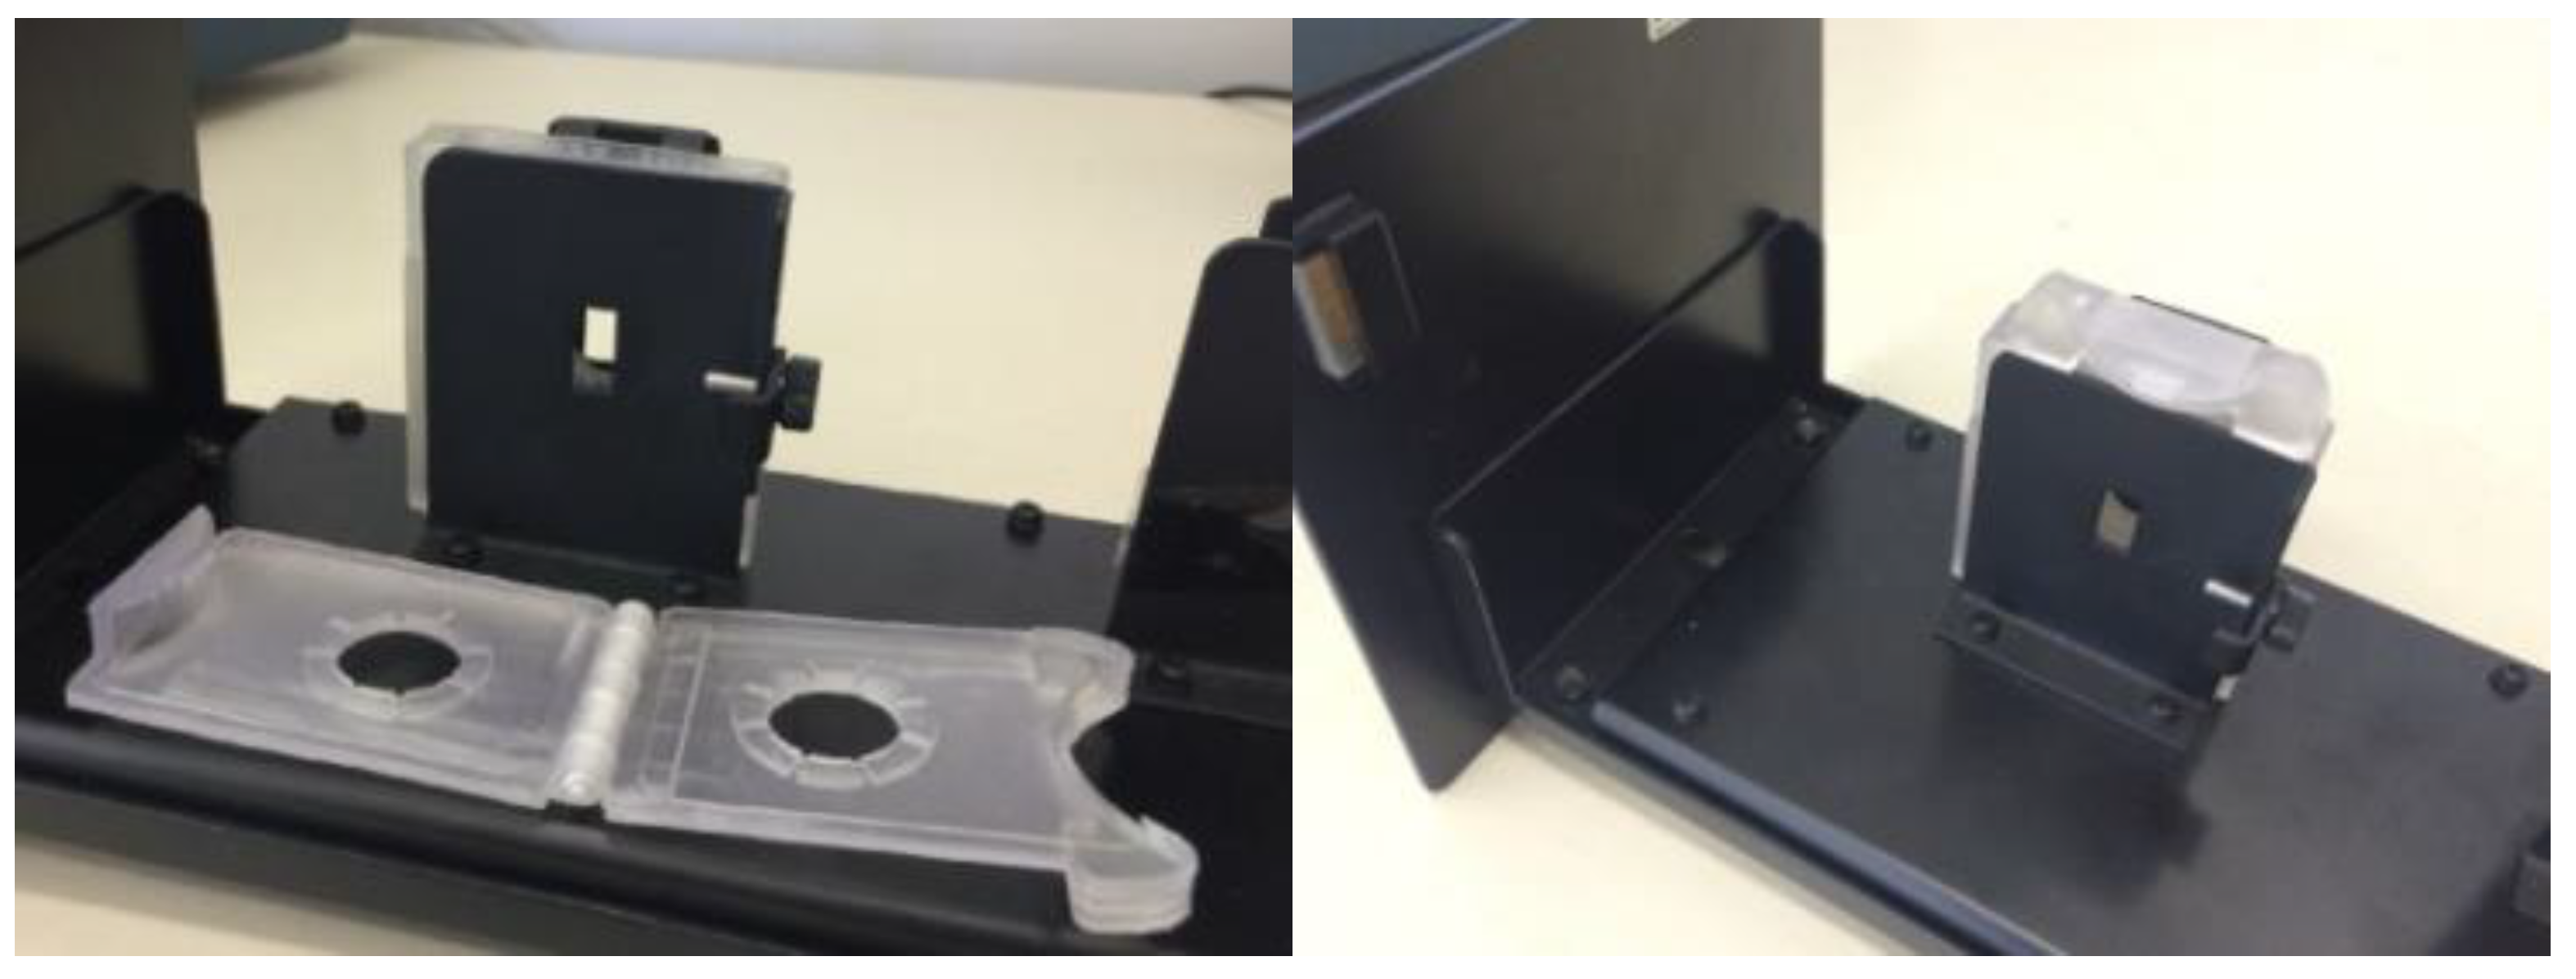
Figure 1. Structure of the 1:1 complex Pd(II)/TazoC.
Preprints 81587 g001
Figure 2. The homemade clip customized to the FLH-740 Film Holder of the Jasco V-750 UV-vis spectrophotometer.
Preprints 81587 g002
Figure 3. UV-vis spectra in aqueous solutions at pH 2 (HCl 0.01M) of 75 μM Tazo C (black line); 75 μM mM TazoC and 75 μM Pd(II) (blue line); 75 μM TazoC and 75 μM Cu(II) (pink line); 75 μM TazoC and 75 μM Ni(II) (green line).
Preprints 81587 g003
Figure 4. UV-vis spectra in aqueous solutions of 75 μM Tazo C (black line); 75 μM mM TazoC and 75 μM Pd(II) (blue line); 75 μM TazoC and 75 μM Cu(II) (pink line); 75 μM TazoC and 75 μM Ni(II) (green line), (a) acetate buffer pH 4, (b) acetate buffer pH 5.5.
Preprints 81587 g004
Figure 5. TazoC-PADs after immersion in Pd(II), Cu(II) and Ni(II) solutions at different concentrations and pHs.
Preprints 81587 g005
Figure 6. Spectra of TazoC-PADs after immersion in Pd(II), Cu(II) and Ni(II) solutions at different concentrations and pHs. The images of the PADs are shown in Fig. 5.
Preprints 81587 g006
Figure 7. PLS model for Pd(II)/TazoC-PADs at pH 2 (a) Experimental values vs. Fitted values plot for the training set (burgundy-colored points) and test set (light blue-colored points) and blank samples (yellow-colored points); (b) residuals for the training set (burgundy-colored points) and test set (light blue-colored points).
Preprints 81587 g007
Figure 8. PLS models for Pd(II)/TazoC-PADs at pH 4 and Pd(II)/TazoC-PADs at pH 5.5 (a) and (c) Experimental vs. Fitted values plot for the training set (burgundy-colored points), test set (light blue-colored points) and blank samples (yellow-colored points); (b) and (d) residuals for the training set (burgundy-colored points) and test set (light blue-colored points). Datasets composition, fitted values and graphs of the models' performances are reported in the Supplementary Materials.
Preprints 81587 g008
Figure 9. PLS model for Pd(II)/TazoC-PADs at pH 4 Experimental values vs. Fitted values plot for the training set (burgundy-colored points) and Pd(II)/Cu(II) mixtures as test set samples (light blue-colored points).
Preprints 81587 g009
Figure 10. PLS models for Pd(II)+Cu(II)/TazoC-PADs at pH 4 and Pd(II)+Cu(II)+Ni(II)/TazoC-PADs at pH 5.5 (a) and (c) Experimental vs. Fitted values plot for the training set (burgundy-colored points) and test set (light blue-colored points); (b) and (d) residuals for the training set (burgundy-colored points) and test set (light blue-colored points). Datasets composition, fitted values and graphs of the models' performances are reported in the Supplementary Materials.
Preprints 81587 g010
Figure 11. PLS model Pd(II)/TazoC-PADs TW (a) Experimental values vs. Fitted values plot for the training set (light blue-colored points) and test set (yellow-colored points); (b) residuals for the training set (light blue-colored points) and test set (yellow-colored points). Datasets composition, fitted values and graphs of the model's performances are reported in the Supplementary Materials.
Preprints 81587 g011
Table 1. Number of latent variables (LVs), % explained variance in cross-validation (%Exp. Var. CV), Root Mean Square Error in CV (RMSECV), Root Mean Square Error in prediction (RMSEP), the correlation coefficient of the regression (r2), the limit of detection (LOD) and the limit of quantification (LOQ) for the three PLS models of Figure 8.
Pd(II)/TazoC-PADs
pH 2
Pd(II)/TazoC-PADs pH 4 Pd(II)/TazoC-PADs pH 5.5
Training set LVs 5 8 8
%Exp.Var. CV 98.61 96.92 98.02
RMSECV (μM) 2.05 3.08 2.45
r2 model 0.994 0.996 0.997
Test set RMSEP (μM) 1.86 1.92 1.55
r2 prediction 0.994 0.991 0.995
Blank samples LOD (μM) 0.8 0.8 0.7
LOQ (μM) 2.3 2.4 2.0
Table 2. Comparison of the LOQ values obtained with different test strips for Pd(II) sensing.
Sensor LOQ (μM) Reference
Rhodamine B-based test papers 2.5 [58]
Coumarin-based test papers 10 [59]
2-(2′-hydroxyphenyl)benzothiazole-based test papers 4.7 [60]
PTAID-based test papers1 100 [61]
SAS-IMIs-based test silica plates2 10 [62]
TazoC-based test papers3 2-2.4 This work
1 Purine derivative-based fluorescent probe (PTAID)-based test papers. 2 Salicylaldehyde bis-Schiff-base probe (SAS) decorated with imidazolium ionic liquid moieties (IMIs) at both ends adsorbed onto silica-gel-based thin layer chromatography (TLC) plates. 3 (2-(tetrazolylazo)-1,8 dihydroxy naphthalene-3,6,-disulphonic acid (TazoC)-based test papers.
Table 3. Number of latent variables (LVs), % explained variance in cross-validation (%Exp. Var. CV), Root Mean Square Error in CV (RMSECV), Root Mean Square Error in prediction (RMSEP), and the correlation coefficient of the regression (r2), for the PLS models of Figure 10.
Pd(II)+Cu(II)/TazoC-PADs
pH 4
Pd(II)+Cu(II)+Ni(II)/TazoC-PADs pH 5.5
Training set LVs 8 7
%Exp.Var. CV 93.07 74.2
RMSECV (μM) 1.92 2.33
r2 model 0.992 0.995
Test set RMSEP (μM) 1.41 0.86
r2 prediction 0.993 0.990
Table 4. Number of latent variables (LVs), % explained variance in cross-validation (%Exp. Var. CV), Root Mean Square Error in CV (RMSECV), Root Mean Square Error in prediction (RMSEP), and the correlation coefficient of the regression (r2), for the PLS model Pd(II)/TazoC-PADs TW.
Pd(II)/TazoC-PADs TW
Training set LVs 5
%Exp.Var. CV 98.73
RMSECV (μM) 1.96
r2 model 0.995
Test set RMSEP (μM) 2.06
r2 prediction 0.992
Table 5. Recovery test. The number in parenthesis is the standard deviation (n=3).
Pd(II) added
(μM)
Pd(II) foundICP-OES
(µM)
Pd(II) foundTazoC-PADs
(µM)
Rc% E%
7.5 7.4(3) 8.1(5) 108 8
25.2 25.0(4) 26(1) 103 3
44.6 45.2(7) 44(2) 98 -2
Disclaimer/Publisher’s Note: The statements, opinions and data contained in all publications are solely those of the individual author(s) and contributor(s) and not of MDPI and/or the editor(s). MDPI and/or the editor(s) disclaim responsibility for any injury to people or property resulting from any ideas, methods, instructions or products referred to in the content.
Copyright: This open access article is published under a Creative Commons CC BY 4.0 license, which permit the free download, distribution, and reuse, provided that the author and preprint are cited in any reuse.
Prerpints.org logo

Preprints.org is a free preprint server supported by MDPI in Basel, Switzerland.

Subscribe

© 2024 MDPI (Basel, Switzerland) unless otherwise stated