
Submitted:
07 September 2023
Posted:
08 September 2023
Read the latest preprint version here
Abstract
The paper considers the issues of structural stability, electronic properties, and phonon dispersion of the cubic, tetragonal, and monoclinic phases of ZrO2. It was found that the monoclinic phase of zirconium dioxide is the most stable among the other two phases in terms of total energy, lowest enthalpy, highest entropy, and other thermodynamic values. The smallest negative modes were found for m-ZrO2. An analysis of the electronic properties showed that during the m–t phase transformation of ZrO2, the Fermi level first shifts by 0.125 eV towards higher energies, and then decreases by 0.08 eV in the t–c cross section. The band gap for c-ZrO2, t-ZrO2, and m-ZrO2 is 5.140 eV, 5.898 eV, and 5.288 eV, respectively. Calculations based on the analysis of the influence of doping 3.23, 6.67, 10.35 and 16.15 mol. %Y2O3 on the m-ZrO2 structure showed that the enthalpy of m-YSZ decreases linearly, which accompanies further stabilization of monoclinic ZrO2 and an increase in their defectiveness. In this case, the position of the Fermi level changes abruptly, and the energy gap decreases. It has been established that not only for pure systems, including those doped with Y2O3, the main contribution to the formation of the conduction band is made by the p-states of electrons. An analysis of the mechanism of water adsorption on the surface of t-ZrO2 (101) and t-YSZ (101) showed that H2O on unstabilized t-ZrO2 (101) is adsorbed dissociatively with an energy of -1.22 eV, as well as by the method of molecular chemisorption with an energy of -0.69 eV and the formation of a hydrogen bond with a bond length of 1.01 Å. In the case of t-YSZ (101), water is molecularly adsorbed onto the surface with an energy of -1.84 eV. Dissociative adsorption of water occurs at an energy of -1.23 eV, near the yttrium atom.
Keywords:
zirconia
; stability
; yttrium-stabilized zirconia
; energy convertion
; phase transition
; Fermi level shift
; water adsorption on the surface
1. Introduction
With the ongoing threat of the energy crisis and global warming caused by the increase in the use of fossil energy, the search for sustainable and environmentally friendly sources of energy is one of the most urgent challenges of human civilization in the 21st century [1,2], since it is known that the continued use of fossil fuels in the world threatens our energy supply and creates a huge burden on the environment. Research on the use of sustainable green energy represents one of the ways to mitigate the growing threat of global environmental problems and the energy crisis, which is very intense and active around the world. Solar panels and wind turbines have become familiar to us. However, new advances in nanotechnology and materials science make it possible to collect energy from other sources and will allow and implement the creative idea of Nikola Tesla about "Getting an electric current from the air" Recently, scientists and engineers have been working on the creation of innovative devices for converting humidity into electricity, which will expand the range of known renewable energy sources due to a new source of atmospheric humidity (galvanic converters that convert air humidity into electricity). That is, such devices are capable of collecting electricity from atmospheric humidity and supplying electrical current, similar to how solar panels capture sunlight and generate electricity.
Zirconium ceramics have been extensively studied in recent years because of their excellent electrical, optical and mechanical properties. They are also biocompatible and have a wide range of biomedical applications. Tetragonal phase yttria stabilized zirconia (Y-TZP) has been used in various medical applications since the 1980s, particularly for dental crowns [2]. In addition, bulk materials and nanocomposites based on ZrO2 are used in electrochemical cells because of their high oxide ion conductivity and catalytic activity, low thermal conductivity and mechanical/chemical stability, as well as compatibility with electrolytes, which makes them from a structural point of view [3,4].
One of the most remarkable properties of ceramics based on zirconia is the presence of three crystalline forms with different properties [5,6,7,8,9]. There are the most stable monoclinic (mineral baddeleyite; m-ZrO2), metastable tetragonal (medium temperature) and unstable cubic structure of zirconium dioxide (high temperature). High-pressure induced zirconium phases in the form of brookite (orthorhombic-I) and cotunnite (orthorhombic-II) are also known [10,11]. Pure zirconium dioxide undergoes a phase transformation from monoclinic to tetragonal (about 1173°C), and then to cubic (about 2370°C), accompanied by a change in volume and, accordingly, their strength [12,13,14]. For the application of zirconia in advanced zirconia ion-conducting ceramic devices, it is important that the stabilized material has an adequate level of conductivity and the desired mechanical-chemical stability in both oxidizing and reducing atmospheres. Obtaining a stable material from zirconia is difficult due to a noticeable change in volume during the phase transition. Stabilization of zirconium dioxide is achieved by replacing some Zr4+ ions with larger ions in the crystal lattice [15,16,17]. For example, numerous studies have shown that doping with polyvalent oxides, including certain concentrations of yttrium oxide, stabilizes the high-temperature cubic and tetragonal phases of ZrO2 at room temperature. This also leads to an increase in the concentration of oxygen vacancies and oxygen-ion conductivity, which makes it possible to use stabilized ZrO2 as an electrolyte in fuel cells [17]). The ionic conductivity of ZrO2 strongly depends on the phase modification and the content of stabilizing additives in the system, which is also evidenced by the phase diagram given in [18]. At the same time, it is difficult to study experimentally single crystals of pure ZrO2 grown from a melt, they exhibit phase transformations upon cooling, therefore, their doped structures (for example, yttrium-doped structure ZrO2, YSZ) are usually studied. However, the surface chemistry of YSZ is much more complex than that of the purest ZrO2. In another work, Kobayashi et al. [19] found that YSZ decomposes slowly at about 250°C due to the t-m transformation. This t-m transformation is accompanied by microcracking and loss of material strength in a humid atmosphere. This t-m transformation also occurs due to the presence of water or a humid environment in zirconia-based ceramic materials, which is called low-temperature degradation or aging of ZrO2 crystals. Over the past couple of decades, a large amount of work has been done on this topic, including many hypotheses and discussions, and the most reliable hypothesis on the YSZ topic is based on filling oxygen vacancies that were present in the matrix to maintain a stable t-YSZ phase. Thus, filling these O-vacancies with water radicals, either O2 or OH, destabilizes the YSZ phase. However, the YSZ stabilization mechanism itself is not fully understood, and it is still the subject of much debate. Therefore, theoretical research and modeling of the properties of bulk and 2D materials based on ZrO2 and YSZ is necessary as a starting point for a good understanding of their fundamental properties. On the other hand, aspects of the shift of the Fermi level after doping of yttrium oxide in ZrO2, and the effect of doping on their stabilization are still not sufficiently understood due to the difficulty of detecting them in the experiment.
2. Ab-initio simulation details
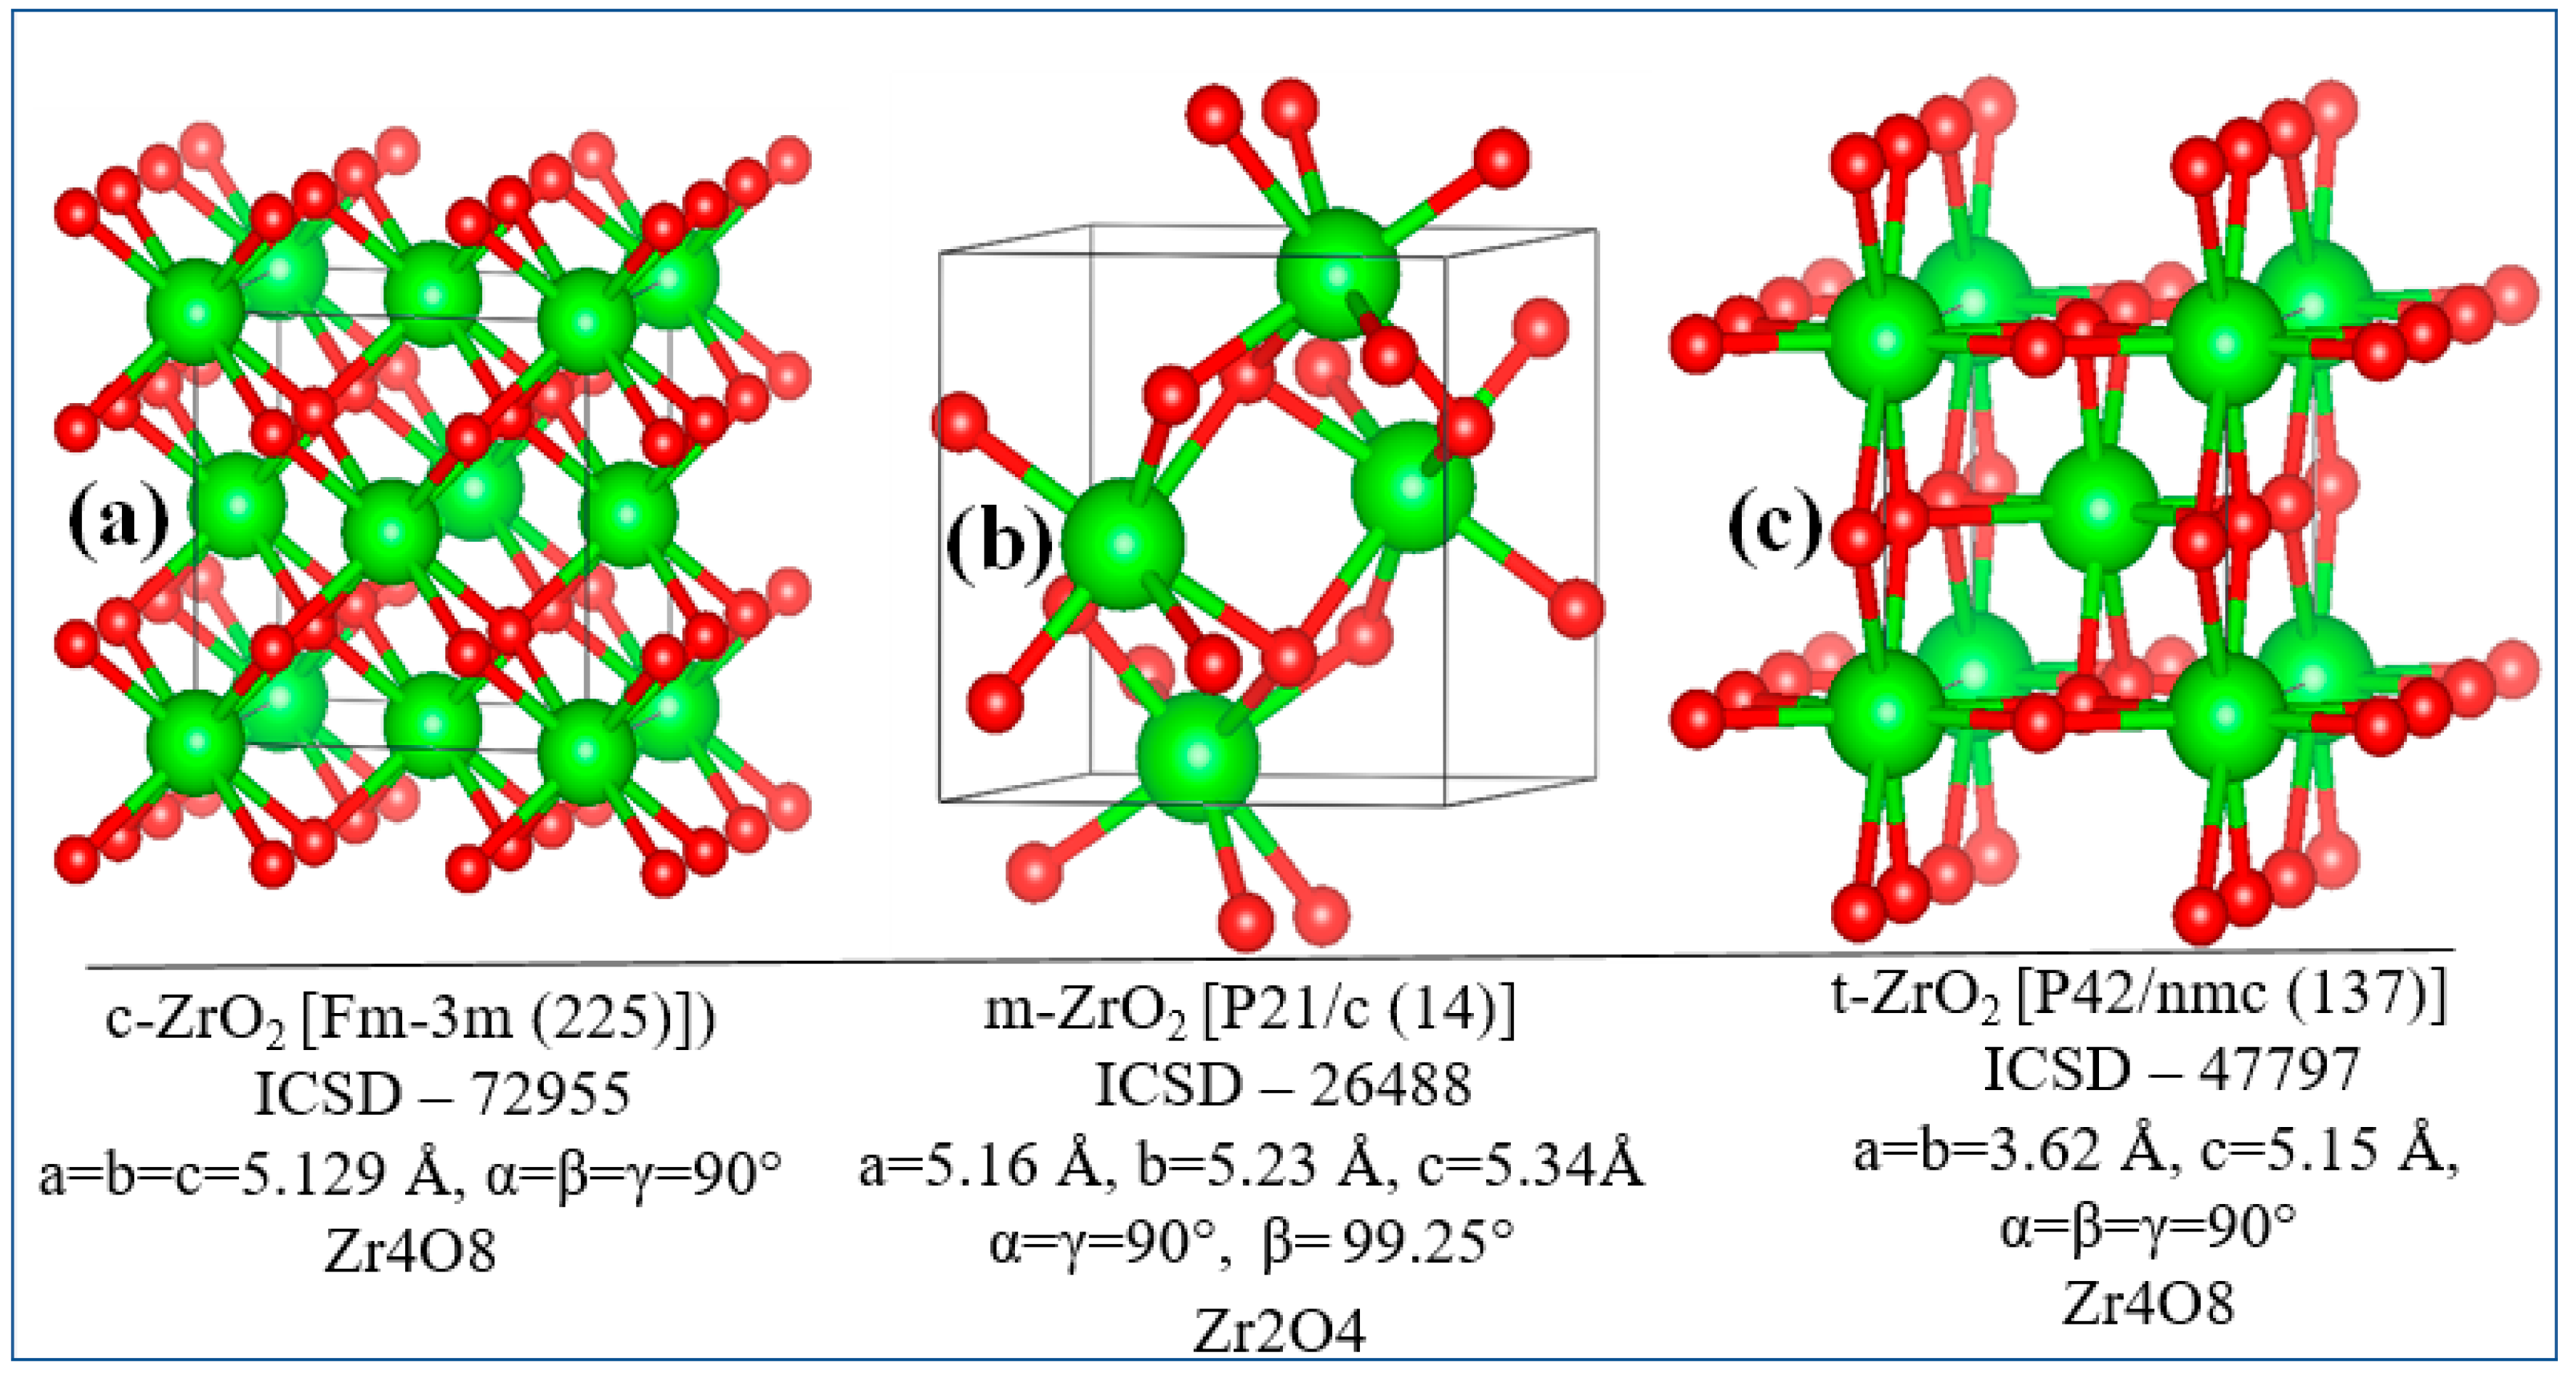
Ab initio calculations were carried out on the basis of the density functional theory [20]. All three modifications of ZrO2 (Fig. 1(a-c)) were first relaxed using the GGA functionals (PBE) [21] and strictly bounded normalized potential (SCAN) [22]. To obtain the most accurate value of the ground state energy, the total energy was calculated in terms of the GGA exchange correlation potential, and SCAN was used to correctly estimate the lattice parameters. The calculations were carried out using the Vienna Ab-initio Simulation Package (VASP 6.4.2) [23]. By comparing the total energy in the unit cell, the stability of the three phases of ZrO2 was evaluated, and then a supercell with a size of 2x2x2 was created to simulate the effect of 3.23, 6.67, 10.34, and 16.15 mol% Y2O3 on the stability of ZrO2 in order to investigate doped-induced phase transitions of zirconium dioxide and evaluate the effect of Y2O3 doping on the position of the Fermi level, as well as the stability of this ZrO2.
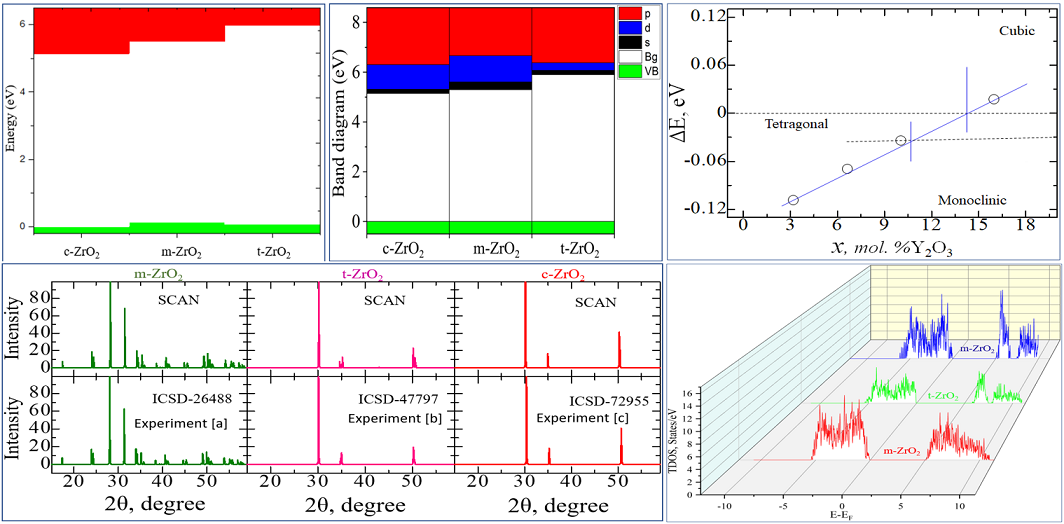
Figure 1.
Crystal lattice models: a) cubic, b) monoclinic and c) tetragonal phase of ZrO2.
For yttrium oxide doping, some Y2O3 formula units were replaced by ZrO2 in a 2x2x2 supercell, with one oxygen vacancy created in each substitution. A schematic description of the generation of YSZ - structures is made according to the scheme:
This can be thought of as combining x ZrO2 formula units with k Y2O3 formula units arranged in an initial lattice of x + k ZrO2 units, resulting in the formation of m oxygen defects. Based on this, we determine the percentage of vacancy equal to the percentage of yttrium units in the final structure. Thus, our calculations were implemented for 4 different concentrations of Y2O3 doping (Table 1), which were refined using formula 1.
Vacancies were taken into account by removing one O atom with each subsequent substitution of 2 Y3+ ions in the Zr4+ position. The atomic orbitals O (2s, 2p), Zr (4d, 5s) and Y (4s 4p 4d 5s) were considered as valence electrons, while the remaining electrons were considered as nucleus electrons and remained frozen. The PAW method has been used to describe the interaction between valence electrons and electrons in the nucleus. The cutoff of the kinetic energy was fixed at the level of 600 eV, and all calculations were carried out taking into account spin-polarized effects. Orbital analyzes were performed by summing the contributions of individual atomic varieties in the unit cell and showing the contributions of the main atoms at the meeting point of the valence band and the conduction band.
3. Results and discussion
3.1. Structural, electronic and phonon properties of ZrO2
At the first step of the study, the geometry of pure ZrO2 phases was optimized using the VASP package. To find the optimal value of the cutoff energy (ENCUT) and the appropriate number of k-points in the Brillouin zone, we tested the convergence of the total unit cell energy as a function of ENCUT and KPOINTS. The results of the convergence test for the number of k-points for the ZrO2 cubic phase are shown in Figure 2, performed to build a k-point grid with a starting value of ENCUT = 1.3*ENMAX. Based on the results, it can be concluded that a 4x4x4 k-point grid with the Monkhrost-Pack scheme is optimally suited for the geometric relaxation of ZrO2. However, when calculating the electronic structure of these compounds, the number of k-points was at least doubled in order to obtain the most accurate density of states (DOS).
Similar tests were carried out to establish the cutoff energy, from which it can be seen that the choice of ENCUT = 600 eV is suitable for modeling ZrO2, and further increase in this energy only increases the calculation time without affecting its accuracy (Figure 3). Therefore, all further calculations were carried out at 600 eV. Similar convergence tests have also been carried out for the tetragonal and monoclinic phase of ZrO2 using the GGA potential, which are also consistent with the results for the cubic phase.
Table 2 compares the calculated values of the lattice parameters of the ZrO2 phase with the results from the literature.
According to the results given in Table 2, it can be seen that as the transition from a high-temperature phase to a lower-temperature phase, lattice distortion leads to a displacement of O ions in the c direction by a value of dz, expressed in relative units. As a result of distortion in the tetragonal phase, all Zr-O bonds will become nonequivalent. According to Table 2, the SCAN functionality describes the geometry much better than the standard GGA-PBE. Since the SCAN exchange-correlation functional describes the structural properties well, we decided to use this functional further when describing the geometry of other systems. The X-ray diffraction patterns of the initial structures obtained by us after their final relaxing are compared with the data from the literature, from which it can be seen that the results obtained by us are in good agreement with the experimental data, except for an imperceptible difference in the position of the X-ray peaks depending on the Bregg angles for the tetragonal system (Figure 4).
Table 3 compares the total energy calculated by the GGA method for the monoclinic, tetragonal, and cubic ZrO2 phases, from which it can be seen that m-ZrO2 is the most stable phase in terms of energy values compared to other phases, that is, the monoclinic ZrO2 phase with space group P21/ c is the most stable at low temperatures.
Next, using the Phonopy code in the VASP package, we simulated the thermodynamic properties and phonon spectra of the ZrO2 phase for a more detailed discussion of the structural stability of the ZrO2 monoclinic phase. Figure 5 shows the change in the entropy of the unit cells of the ZrO2 phase as a function of temperature.
According to Figure 5, as the transition from the monoclinic to the tetragonal and cubic phases, the entropy of these compounds decreases, which corresponds to the criterion of inverse dependence of enthalpy or direct dependence of the entropy and stability of solid systems [28]. This pattern can also be clearly observed after analyzing the pattern of phonon frequencies of the three phases of ZrO2 (Figure 6 (a-c)) from which it is clearly seen that the monoclinic phase has the smallest negative modes than the other two phases.
Figure 7(a-c) shows the temperature dependence of free energy, entropy and heat capacity for m-ZrO2, t-ZrO2 and m-ZrO2.
Рисунoк 7.
Temperature dependence of free energy, entropy and heat capacity for: m-ZrO2 (a), t-ZrO2 (b), and m-ZrO2 (c).
Рисунoк 7.
Temperature dependence of free energy, entropy and heat capacity for: m-ZrO2 (a), t-ZrO2 (b), and m-ZrO2 (c).
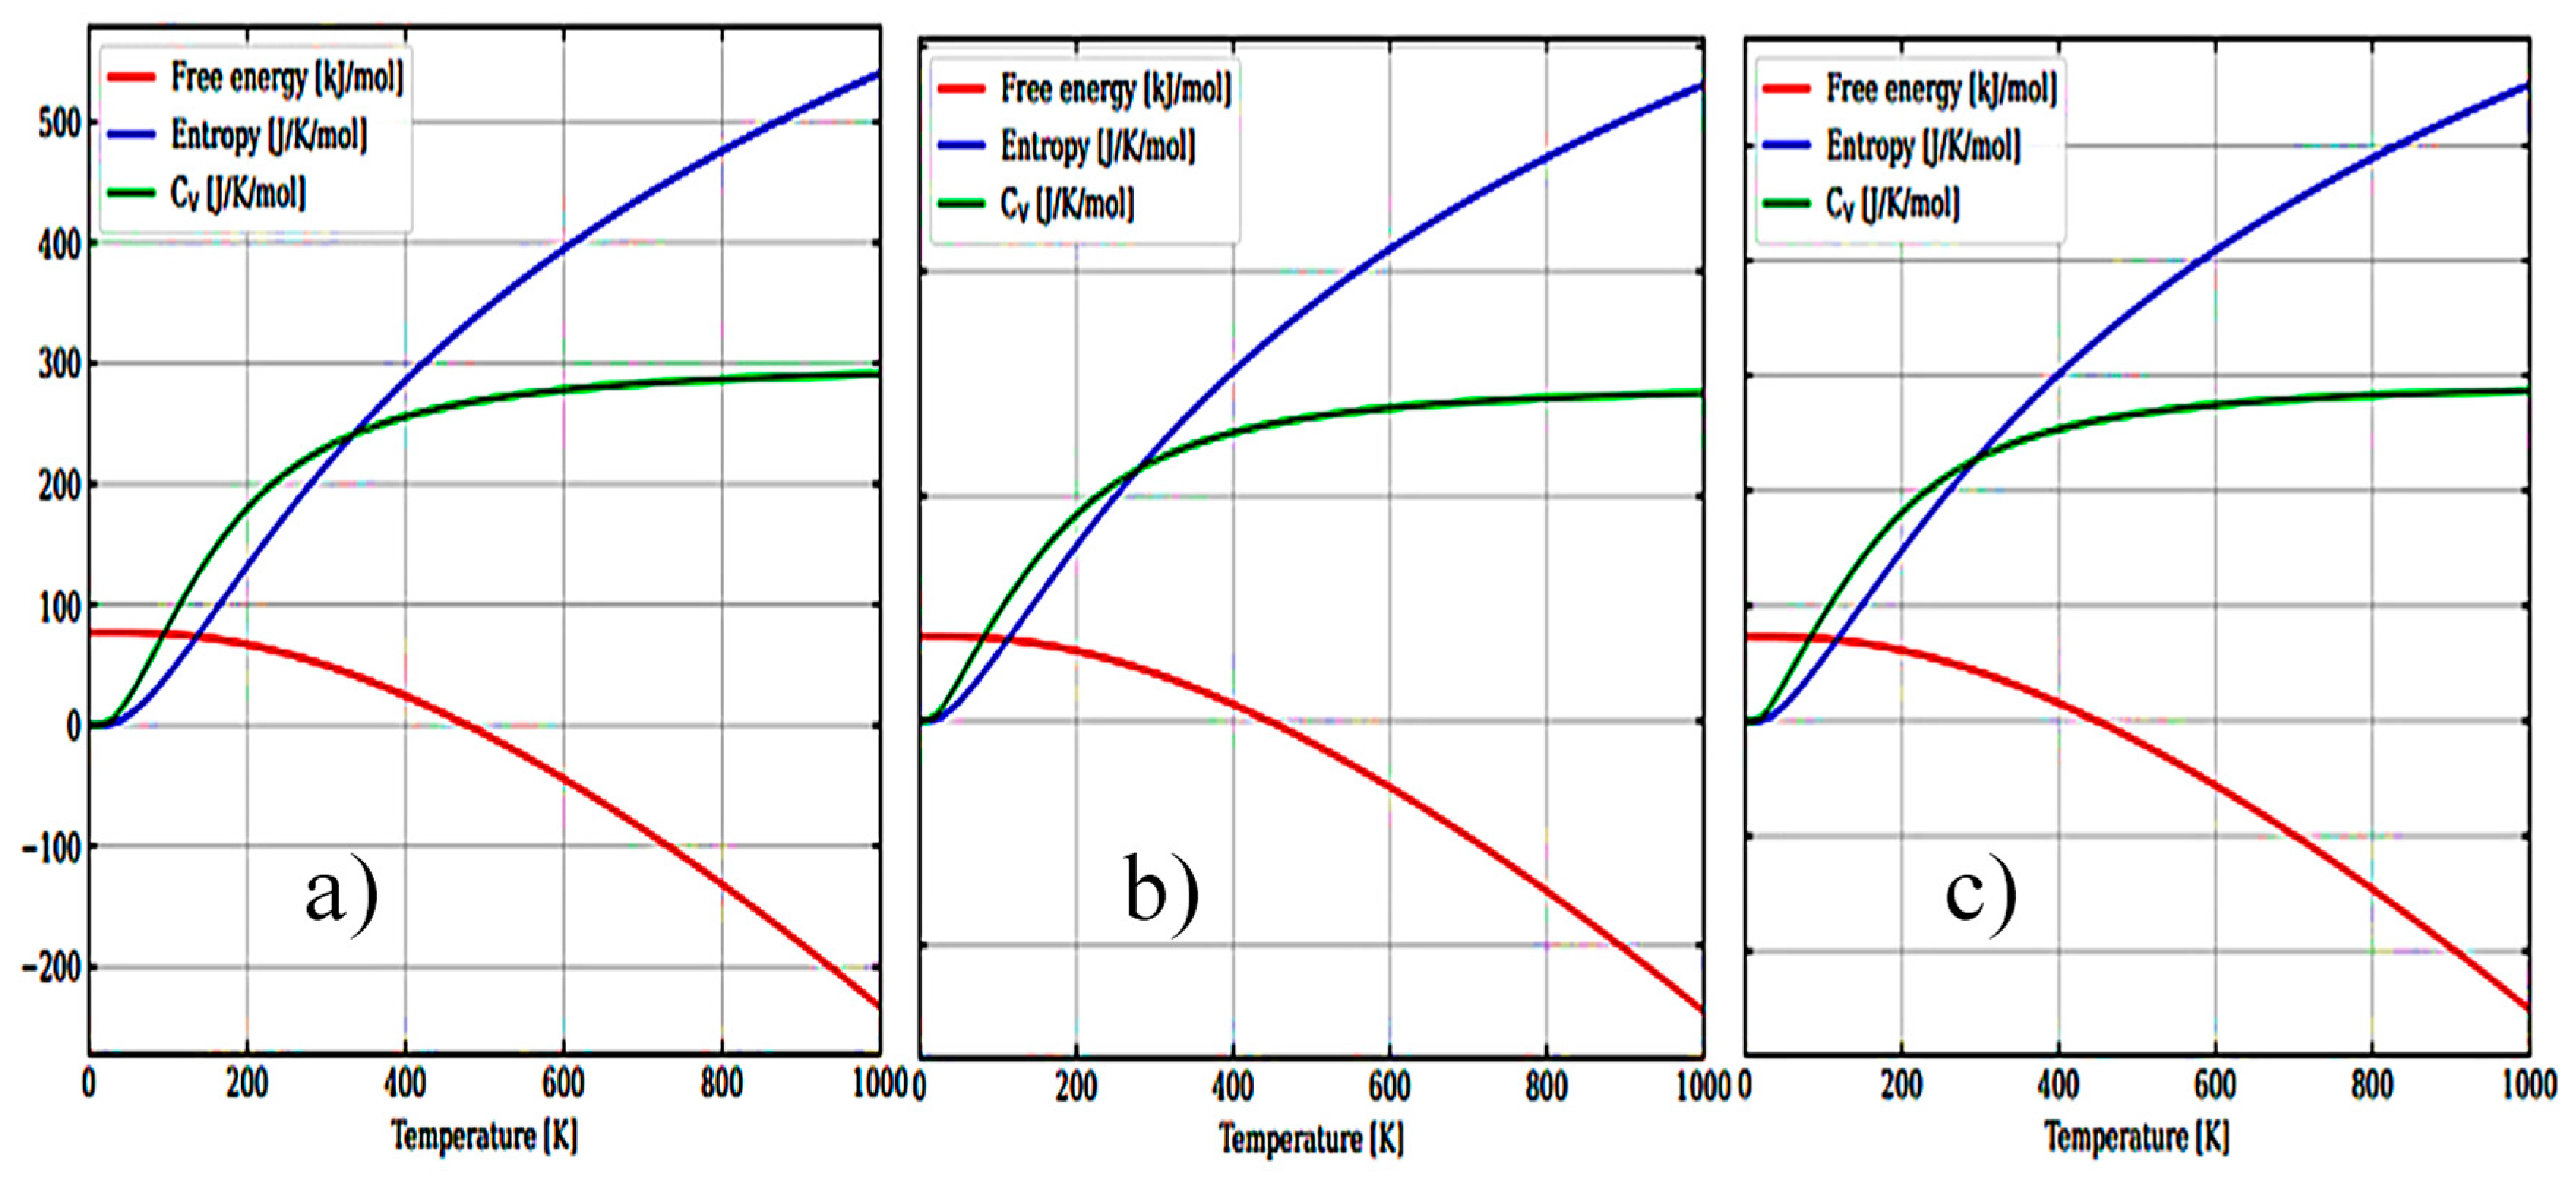
The results of calculations of the density of phonon states are shown in Figure 7 (a-c) indicate that as the transition from the monoclinic to the tetragonal and cubic phases, the density of electronic states increases, and they also correspond well with the results given in Figure 6 and confirm the monoclinic phase as the most stable among other ZrO2 phases. This is also confirmed by the result of the Energy/Volume diagram shown in Figure 8 and is in good agreement with literature data [29]. Therefore, for further stabilization by doping with Y2O3, the choice of the monoclinic phase is appropriate.
Next, using the well-optimized structures of the three phases of ZrO2, we studied the electronic properties of these systems. Using the GGA, SCAN functionals and the HSE06 hybrid functional, the band gap values of these systems were found (Table 4), their orbital structure was analyzed, and the change in the position of the Fermi level in these systems was modeled.
According to the results presented in Table 3, the GGA and SCAN functionals showed a rather small band gap compared to the HSE06 hybrid functional [31], which traditionally overcomes underestimation of the band gap well. Given the suitability of HSE06 for estimating the band gap energy, we further used this particular hybrid functional to describe all problems related to the electronic properties of the systems under study.
Next, using the ZrO2 structures relaxed using the SCAN functional, calculations were made of the density of available electronic states at the Fermi level (Figure 9), which is crucial for interpreting the electronic properties of ZrO2 and the transport characteristics of electronic devices based on it.
According to Figure 9, the density of electronic states for c-ZrO2 is slightly overestimated compared to other phases. Moreover, secondary energy gaps are observed in the energy diagram of the tetragonal and cubic phases. Also, this gap increases with the transition from the tetragonal to the cubic phase.
Рисунoк 10.
Conduction (red) - and valence (green)-band change for c-ZrO2, t-ZrO2, m-ZrO2. Position of the Fermi level corresponds to the maximum of the valence band at each of the sites.
Рисунoк 10.
Conduction (red) - and valence (green)-band change for c-ZrO2, t-ZrO2, m-ZrO2. Position of the Fermi level corresponds to the maximum of the valence band at each of the sites.
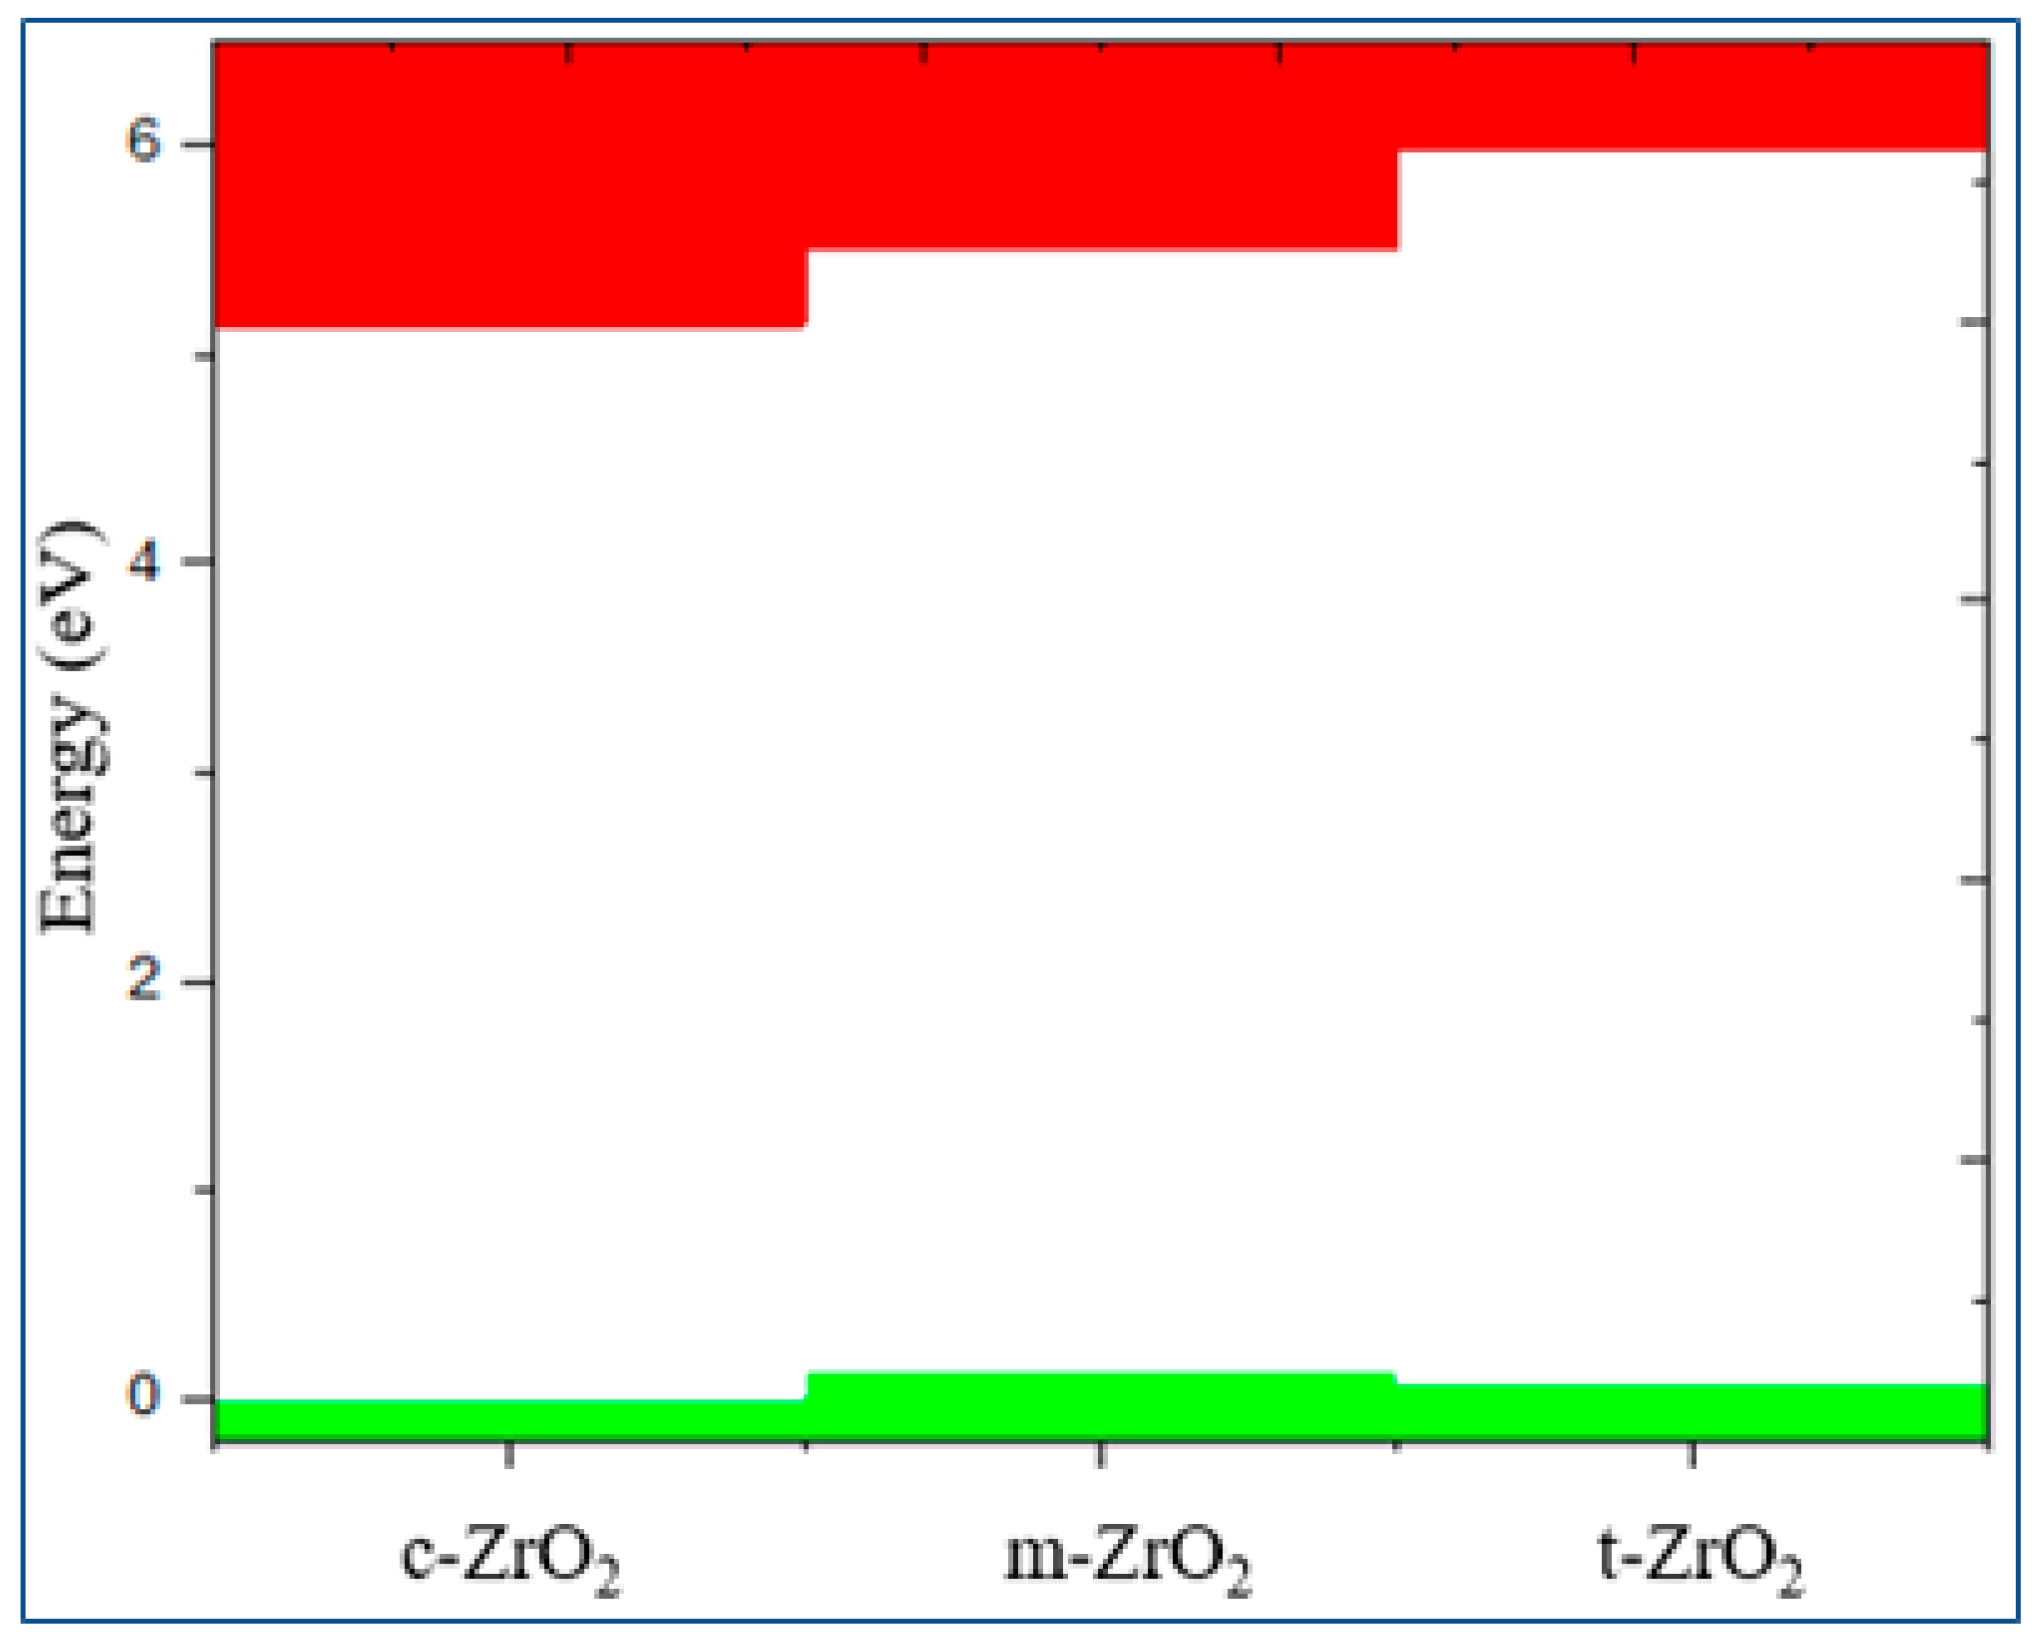
Next, we determined the position of the Fermi level in ZrO2 crystals and the shift of this level during their phase transformation. As can be seen from Figure 10, if the position of the Fermi level (maximum of the valence band) for the monoclinic phase is taken as the reference point, then during the m-t phase transformation of ZrO2, this level first drops by 0.125 eV towards lower energies and then descends again in the t-c section by 0.08 eV. This is also observed in detail from the results of the summarized bands for the orbital analysis, which are shown in Figure 11 for the three phases of ZrO2.
It can be seen from Figure 11 that as we move from the monoclinic to the tetragonal and cubic phase, the contribution of the p orbitals becomes more significant in CB, and the s orbitals make a small contribution, while the d state shows a different trend. It is assumed that this behavior may be associated with a change in the crystal field and covalence of ZrO2 during the phase transformation.
3.2. Stabilization of m-ZrO2 and electronic properties of YSZ
After the final preparation of YSZ - structures (according to the scheme proposed in formula 1 and table 1), geometric optimization was carried out and Y2O3 - doped ZrO2 supercells were relaxed using the GGA and SCAN functionals. Table 5 shows the geometric parameters of the ZrO2 and YSZ supercells at various Y2O3 concentrations after relaxation using the SCAN functional.
According to the results shown in Table 5, it can be seen that the doping of yttrium oxide, namely the concentration of more than 14 mol. %Y2O3 stabilizes the monoclinic phase of zirconia to a cubic phase. However, in this case, the lattice parameters of Y2O3 - doped structures change non-linearly. Figure 12 shows the volume vibration of ZrO2 lattices as a function of Y2O3 concentration (x).
According to Figure 13, with increasing doping concentration, the energy difference between the monoclinic phase with the tetragonal and cubic decreases, which indicates the possibility of doping-induced phase transitions of zirconium dioxide in the indicated Y2O3 doping concentration ranges.
Having obtained the optimized structures, we calculated the energy of formation (Ef) and enthalpy energy of formation (ΔH) for ZrO2 and YSZ, as well as the energy of formation of a vacancy (Edf) for YSZ using the following formulas:
where Etot is the total energy of the system, Etot (x) is the total energy of individual components, and δ is the number of vacancies (defects) in the crystal. The calculated values of Ef and Edf per atom are given in Table 6.
On fig. Figure 14 shows a diagram of the dependence of the change in the enthalpy of formation of YSZ on the concentration of Y2O3, calculated by formula 4, from which it is clearly seen that doping with Y2O3 reduces the enthalpy and leads to the stabilization of zirconium dioxide. The empirical formula obtained by the least squares method says that the enthalpy of formation energy decreases linearly according to the law ΔH = -1.0407x + 63.532, where x is the concentration of Y2O3 in YSZ.
Thus, as the concentration of Y2O3 increases, the number of oxygen vacancies in YSZ increases, and the growth of these O vacancies is considered as a stabilizing mechanism for the monoclinic phase of zirconia, as evidenced by a decrease in the enthalpy of formation. The numerical value of the enthalpy formation energy is shown in Table 6.
Figure 15 shows the nature of the change in Ef and Edf from the concentration of yttrium oxide, from which the regularity of their linear decrease is clearly visible.
Next, calculations were carried out to study the electronic structure of Y2O3 stabilized ZrO2 supercells to reveal in detail the effects of doping on their density of states, Fermi energy behavior, and orbital states. Figure 16 shows plots of the change in the density of electronic states YSZ for all doping concentrations of Y2O3.
According to the results presented in Figure 16, it can be seen that after Y2O3 doping in TDOS structures, no new energy states arise due to the introduction of defects, that is, it does not lead to a change, except for the band gap shift, which can be considered in detail after orbital analysis (Figure 17) and estimates of the shift of the Fermi level (Figure 18). The band gap is 4.71 eV, 4.92 eV, 4.75 eV, and 4.72 eV, respectively, for ZrO2 with dopid 3.23, 6.67, 10.34, and 16.15 mol% Y2O3.
According to Figure 18, after doping with 3.23 mol% Y2O3 in pure m-ZrO2, the Fermi level drops by 0.067 eV and then shifts by 0.007 eV towards the conduction band when doped with 6.67 mol% Y2O3. Then, at a doping concentration of 10.34 mol%, it still rises by 0.01 eV, being 0.017 eV higher than in the case of 3.23 mol% Y2O3. However, after doping with 16.15 mol% Y2O3, it drops to 0.012 eV. According to the PDOS diagram, one can interpret and observe the step pattern of the conduction band with the contribution of s-, p- and d-orbitals. Understanding these features make it possible to tune the Fermi energies in the band structure for specific tasks in modern materials science and instrumentation. The results obtained will help to interpret some of the features of the electronic properties of ZrO2 and solid materials [32,33,34,35,36,37,38,39,40,41,42,43,44,45,46,47,48], and also complement the base of scientific work carried out in the field of using biocompatible zirconium dioxide crystals and ceramics for generating green energy. The data can be used in the design of moisture-to-electricity converters and the creation of solid oxide fuels. cells based on ZrO2 .
4. Conclusion
The phase transition of zirconia caused by yttrium doping leads to the stabilization of zirconia, which is widely used in many applications. Our calculations have shown that ab initio research methods are able to describe the mechanism of phase transitions of materials under the action of doping. That is, this approach can be applied to study the effect of doping on other properties that are difficult to observe experimentally. Also, using ab initio calculations, one can well describe the effect of doping on the behavior of the Fermi level in crystals. This result confirms the possibility of predicting the effect of doping on other physical properties of the system within the framework of the density functional theory. Thus, the calculations showed that the presence of oxygen vacancies plays an important role in the phase transition and stabilization of ZrO2. The results obtained enrich the data bank to improve understanding of the phase transitions of zirconium dioxide, and can also be used to correct the parameters of theoretical calculations to describe other properties of zirconium dioxide, which are still beyond the scope of quantum chemical modeling.
Funding
The research leading to these results has received funding from the European Union’s Horizon 2020 research and innovation programme under the Marie Sklodowvska-Curie grant agreement 871284 project SSHARE.
References
- Chu, S., Cui, Y., & Liu, N. (2016). The path towards sustainable energy. Nature Materials, 16(1), 16–22. [CrossRef]
- Chu, S., & Majumdar, A. (2012). Opportunities and challenges for a sustainable energy future. Nature, 488(7411), 294–303. [CrossRef]
- Shen, D., Xiao, M., Zou, G., Liu, L., Duley, W. W., & Zhou, Y. N. (2018). Self-Powered Wearable Electronics Based on Moisture Enabled Electricity Generation. Advanced Materials, 30(18), 1705925. [CrossRef]
- Shao, C., Ji, B., Xu, T., Gao, J., Gao, X., Xiao, Y., Zhao, Y., Chen, N., Jiang, L., & Qu, L. (2019). Large-Scale Production of Flexible, High-Voltage Hydroelectric Films Based on Solid Oxides. ACS Applied Materials and Interfaces, 11(34), 30927–30935. [CrossRef]
- Yashima, M., Ohtake, K., Arashi, H., Kakihana, M., & Yoshimura, M. (1993). Determination of cubic-tetragonal phase boundary in Zr1− XYX O2− X/2 solid solutions by Raman spectroscopy. Journal of applied physics, 74(12), 7603-7605.
- Yashima, M., Sasaki, S., Kakihana, M., Yamaguchi, Y. A. S. U. O., Arashi, H. A. R. U. O., & Yoshimura, M. A. S. A. H. I. R. O. (1994). Oxygen-induced structural change of the tetragonal phase around the tetragonal–cubic phase boundary in ZrO2–YO1. 5 solid solutions. Acta Crystallographica Section B: Structural Science, 50(6), 663-672. [CrossRef]
- Yashima, M., Kakihana, M., & Yoshimura, M. (1996). Metastable-stable phase diagrams in the zirconia-containing systems utilized in solid-oxide fuel cell application. Solid State Ionics, 86, 1131-1149. [CrossRef]
- Yashima, M., Ohtake, K., Kakihana, M., Arashi, H., & Yoshimura, M. (1996). Determination of tetragonal-cubic phase boundary of Zr1− XRXO2− X2 (R= Nd, Sm, Y, Er and Yb) by Raman scattering. Journal of Physics and Chemistry of Solids, 57(1), 17-24. [CrossRef]
- Yashima, M., Ishizawa, N., & Yoshimura, M. (1993). High-Temperature X-ray Study of the Cubic-Tetragonal Diffusionless Phase Transition in the ZrO2─ ErO1. 5 System: I, Phase Change between Two Forms of a Tetragonal Phase, t′-ZrO2 and t ″-ZrO2, in the Compositionally Homogeneous 14 mol% ErO1. 5-ZrO2. Journal of the American Ceramic Society, 76(3), 641-648. [CrossRef]
- Leger, J. M., Tomaszewski, P. E., Atouf, A., & Pereira, A. S. (1993). Pressure-induced structural phase transitions in zirconia under high pressure. Physical Review B, 47(21), 14075. [CrossRef]
- Liu, L. G. (1980). New high pressure phases of ZrO2 and HfO2. Journal of Physics and Chemistry of Solids, 41(4), 331-334. [CrossRef]
- Yashima, M., Mitsuhashi, T., Takashina, H., Kakihana, M., Ikegami, T., & Yoshimura, M. (1995). Tetragonal—monoclinic phase transition enthalpy and temperature of ZrO2-CeO2 solid solutions. Journal of the American Ceramic Society, 78(8), 2225-2228. [CrossRef]
- Du, Y., Jin, Z., & Huang, P. (1991). Thermodynamic Assessment of the ZrO2─ YO1. 5 System. Journal of the American Ceramic Society, 74(7), 1569-1577. [CrossRef]
- Yashima, M., Hirose, T., Katano, S., Suzuki, Y., Kakihana, M., & Yoshimura, M. (1995). Structural changes of ZrO 2-CeO 2 solid solutions around the monoclinic-tetragonal phase boundary. Physical Review B, 51(13), 8018. [CrossRef]
- Clearfield, A. (1964). Crystalline hydrous zirconia. Inorganic Chemistry, 3(1), 146-148. [CrossRef]
- Doroshkevich, A. S., Nabiev, A. A., Pawlukojć, A., Doroshkevich, N. V., Rahmonov, K. R., Khamzin, E. K., ... & Ibrahim, M. A. (2019). Frequency modulation of the Raman spectrum at the interface DNA-ZrO 2 nanoparticles. Egyptian Journal of Chemistry, 62(2), 13-20. [CrossRef]
- Kvist, in: Physics of Electrolytes, Vol. 1, ed. J. Hladik (Academic Press, London, 1972) p. 319.
- Lughi, V., & Sergo, V. (2010). Low temperature degradation-aging-of zirconia: A critical review of the relevant aspects in dentistry. Dental materials, 26(8), 807-820. [CrossRef]
- Kobayashi, K., Kuwajima, H., & Masaki, T. (1981). Phase change and mechanical properties of ZrO2-Y2O3 solid electrolyte after ageing. Solid State Ionics, 3, 489-493. [CrossRef]
- Hohenberg, P., & Kohn, W. (1964). Inhomogeneous electron gas. Physical review, 136(3B), B864. [CrossRef]
- Perdew, J. P., Burke, K., & Ernzerhof, M. (1996). Generalized gradient approximation made simple. Physical review letters, 77(18), 3865. [CrossRef]
- Sun, J., Ruzsinszky, A., & Perdew, J. P. (2015). Strongly constrained and appropriately normed semilocal density functional. Physical review letters, 115(3), 036402. [CrossRef]
- Kresse G, Furthmuller J. Efficiency of ab-initio total energy calculations for metals and semiconductors using a plane-wave basis set. Comput. Mater. Sci. 1996; 6:15–50. [CrossRef]
- Howard, C. J., Hill, R. J., & Reichert, B. E. (1988). Structures of ZrO2 polymorphs at room temperature by high-resolution neutron powder diffraction. Acta Crystallographica Section B: Structural Science, 44(2), 116-120. [CrossRef]
- Teufer, G. (1962). The crystal structure of tetragonal ZrO2. Acta Crystallographica, 15(11), 1187-1187. [CrossRef]
- Martin, U., Boysen, H., & Frey, F. (1993). Neutron powder investigation of tetragonal and cubic stabilized zirconia, TZP and CSZ, at temperatures up to 1400 K. Acta Crystallographica Section B: Structural Science, 49(3), 403-413. [CrossRef]
- Martin, U., Boysen, H., & Frey, F. (1993). Neutron powder investigation of tetragonal and cubic stabilized zirconia, TZP and CSZ, at temperatures up to 1400 K. Acta Crystallographica Section B: Structural Science, 49(3), 403-413. [CrossRef]
- Pascal, R., & Pross, A. (2015). Stability and its manifestation in the chemical and biological worlds. Chemical Communications, 51(90), 16160-16165. [CrossRef]
- Teter, D. M., Gibbs, G. V., Boisen Jr, M. B., Allan, D. C., & Teter, M. P. (1995). First-principles study of several hypothetical silica framework structures. Physical Review B, 52(11), 8064.
- Heyd, J., Scuseria, G. E., & Ernzerhof, M. (2003). Hybrid functionals based on a screened Coulomb potential. The Journal of chemical physics, 118(18), 8207-8215. [CrossRef]
- Verma P, Truhlar D. HLE16: A Local Kohn-Sham Gradient Approximation with Good Performance for Semiconductor Band Gaps and Molecular Excitation Energies. J. Phys. Chem. Lett. 2017;8:380–87. [CrossRef]
- Asgerov, E.B.; Beskrovnyy, A.I.; Doroshkevich, N.V.; Mita, C.; Mardare, D.M.; Chicea, D.; Lazar, M.D.; Tatarinova, A.A.; Lyubchyk, S.I.; Lyubchyk, S.B.; Lyubchyk, A.I.; Doroshkevich, A.S. Reversible Martensitic Phase Transition in Yttrium-Stabilized ZrO2 Nanopowders by Adsorption of Water, Nanomaterials 2022, 12, 3, 435. [CrossRef]
- Nematov, D. D., Kholmurodov, K. T., Husenzoda, M. A, Lyubchyk, A., & Burhonzoda, A. S. (2022). Molecular Adsorption of H2O on TiO2 and TiO2: Y Surfaces. Journal of Human, Earth, and Future, 3(2), 213-222. [CrossRef]
- Nematov D. Influence of Iodine Doping on the Structural and Electronic Properties of CsSnBr3. International Journal of Applied Physics 2022; 7:36-47.
- Nematov D, Kholmurodov K, Yuldasheva D, Rakhmonov K, Khojakhonov I. Ab-initio Study of Structural and Electronic Properties of Perovskite Nanocrystals of the CsSn[Br1−xIx]3 Family. HighTech and Innovation Journal 2022; 3:140-50. [CrossRef]
- Davlatshoevich D.N. Investigation Optical Properties of the Orthorhombic System CsSnBr3-xIx: Application for Solar Cells and Optoelectronic Devices. Journal of Human, Earth, and Future, 2021; 2, 404-411. [CrossRef]
- Davlatshoevich N. D, Ashur K, Saidali B.A, Kholmirzo Kh, Lyubchyk A, Ibrahim M. Investigation of structural and optoelectronic properties of N-doped hexagonal phases of TiO2 (TiO2-xNx) nanoparticles with DFT realization: Optimization of the band gap and optical properties for visible-light absorption and photovoltaic applications. Biointerface Research in Applied Chemistry 2022; 12:3836-48.
- Nematov D, Burhonzoda A, Khusenov M. First Principles Analysis of Crystal Structure, Electronic and Optical Properties of CsSnI3–xBrx Perovskite for Photoelectric Applications. J. Surf. Invest. 2021; 15:532–533. [CrossRef]
- Nematov, D.D. Kh.T. Kholmurodov, S.Aliona, K. Faizulloev, V.Gnatovskaya,T. Kudzoev, “A DFT Study of Structure, Electronic and Optical Properties of Se-Doped Kesterite Cu2ZnSnS4 (CZTSSe),” Letters in Applied NanoBioScience, 2022, 12(3), p. 67.
- Nematov D, Makhsudov B, Kholmurodov Kh, Yarov M. Optimization Optoelectronic Properties ZnxCd1-xTe System for Solar Cell Application: Theoretical and Experimental Study. Biointerface Research in Applied Chemistry 2023; 13:90. [CrossRef]
- Nematov, D., Burhonzoda, A., Khusenov, M., Kholmurodov, K., Doroshkevych, A., Doroshkevych, N., ... & Ibrahim, M. (2019). Molecular dynamics simulations of the DNA radiation damage and conformation behavior on a zirconium dioxide surface. Egyptian Journal of Chemistry, 62(The First International Conference on Molecular Modeling and Spectroscopy 19-22 February, 2019), 149-161. [CrossRef]
- Nematov, D. D., Burhonzoda, A. S., Khusenov, M. A., Kholmurodov, K. T., & Ibrahim, M. A. (2019). The quantum-chemistry calculations of electronic structure of boron nitride nanocrystals with density Functional theory realization. Egyptian Journal of Chemistry, 62(The First International Conference on Molecular Modeling and Spectroscopy 19-22 February, 2019), 21-27. [CrossRef]
- Nizomov Z, Asozoda M, Nematov D. Characteristics of Nanoparticles in Aqueous Solutions of Acetates and Sulfates of Single and Doubly Charged Cations. Arabian Journal for Science and Engineering 2022, 47, 1-7. [CrossRef]
- Danilenko, I., Gorban, O., Maksimchuk, P., Viagin, O., Malyukin, Yu., Gorban S., Volkova, G., Glasunova, V., Guadalupe Mendez-Medrano, M., Colbeau-Justin, Ch., Konstantinova, T., Lyubchyk, S. Photocatalytic activity of ZnO nanopowders: The role of production techniques in the formation of structural defects. Catalysis Today 2019, 328, 99–104. [CrossRef]
- Danilenko, I., Gorban, O., da Costa Zaragoza de Oliveira Pedro, P.M, Viegas, J., Shapovalova, O., Akhozov, L., Konstantinova, T., Lyubchyk S., Photocatalytic Composite Nanomaterial and Engineering Solution for Inactivation of Airborne Bacteria, Topics in Catalysis 2021, 64, 772–779. [CrossRef]
- Dilshod, N., Kholmirzo, K., Aliona, S., Kahramon, F., Viktoriya, G., & Tamerlan, K. (2023). On the Optical Properties of the Cu2ZnSn [S1− xSex] 4 System in the IR Range. Trends in Sciences, 20(2), 4058-4058. [CrossRef]
- Petrov, E. G., Shevchenko, Y. V., Snitsarev, V., Gorbach, V.V., Ragulya, A. V., Lyubchik, S. Features of superexchange nonresonant tunneling conductance in anchored molecular wires, AIP Advances 2019, 9, 115120. [CrossRef]
Figure 2.
Total energy of the c-ZrO2 unit cell as a function of the number of k-points (in the condition ENCUT=1.3*ENMAX).
Figure 2.
Total energy of the c-ZrO2 unit cell as a function of the number of k-points (in the condition ENCUT=1.3*ENMAX).
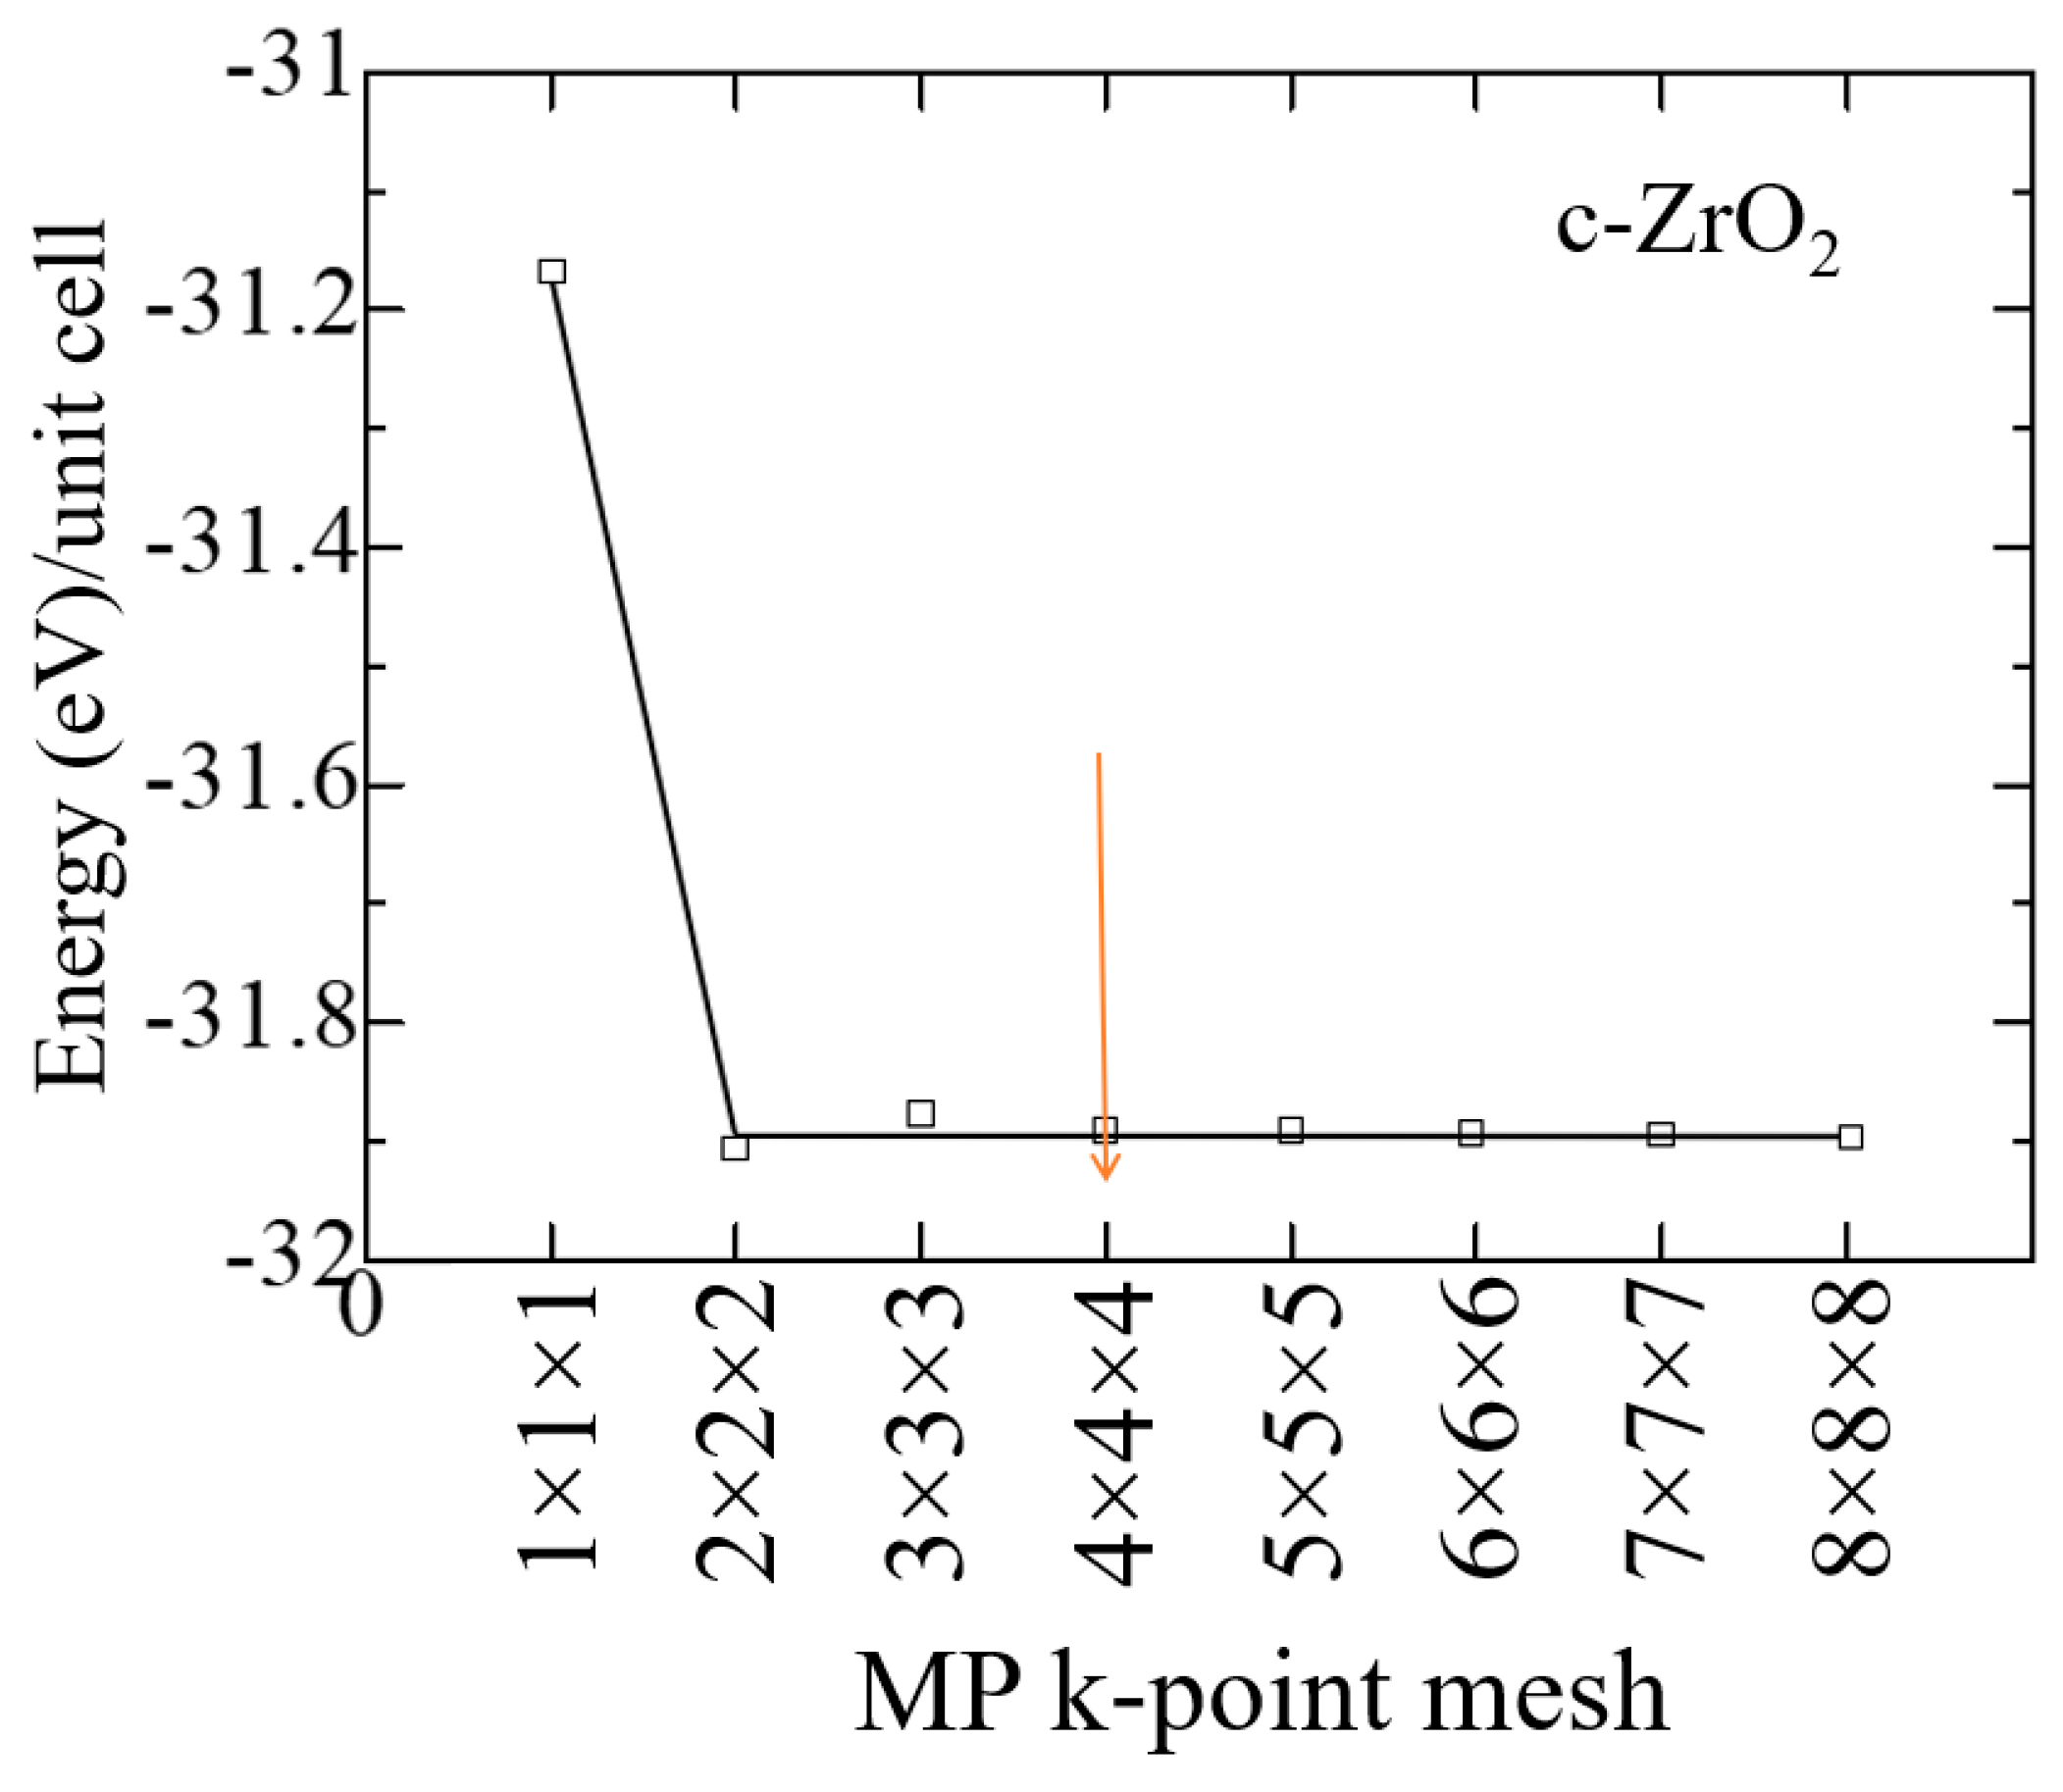
Figure 3.
Total energy of the c-ZrO2 unit cell versus cutoff energy (4 × 4 × 4 k-points).
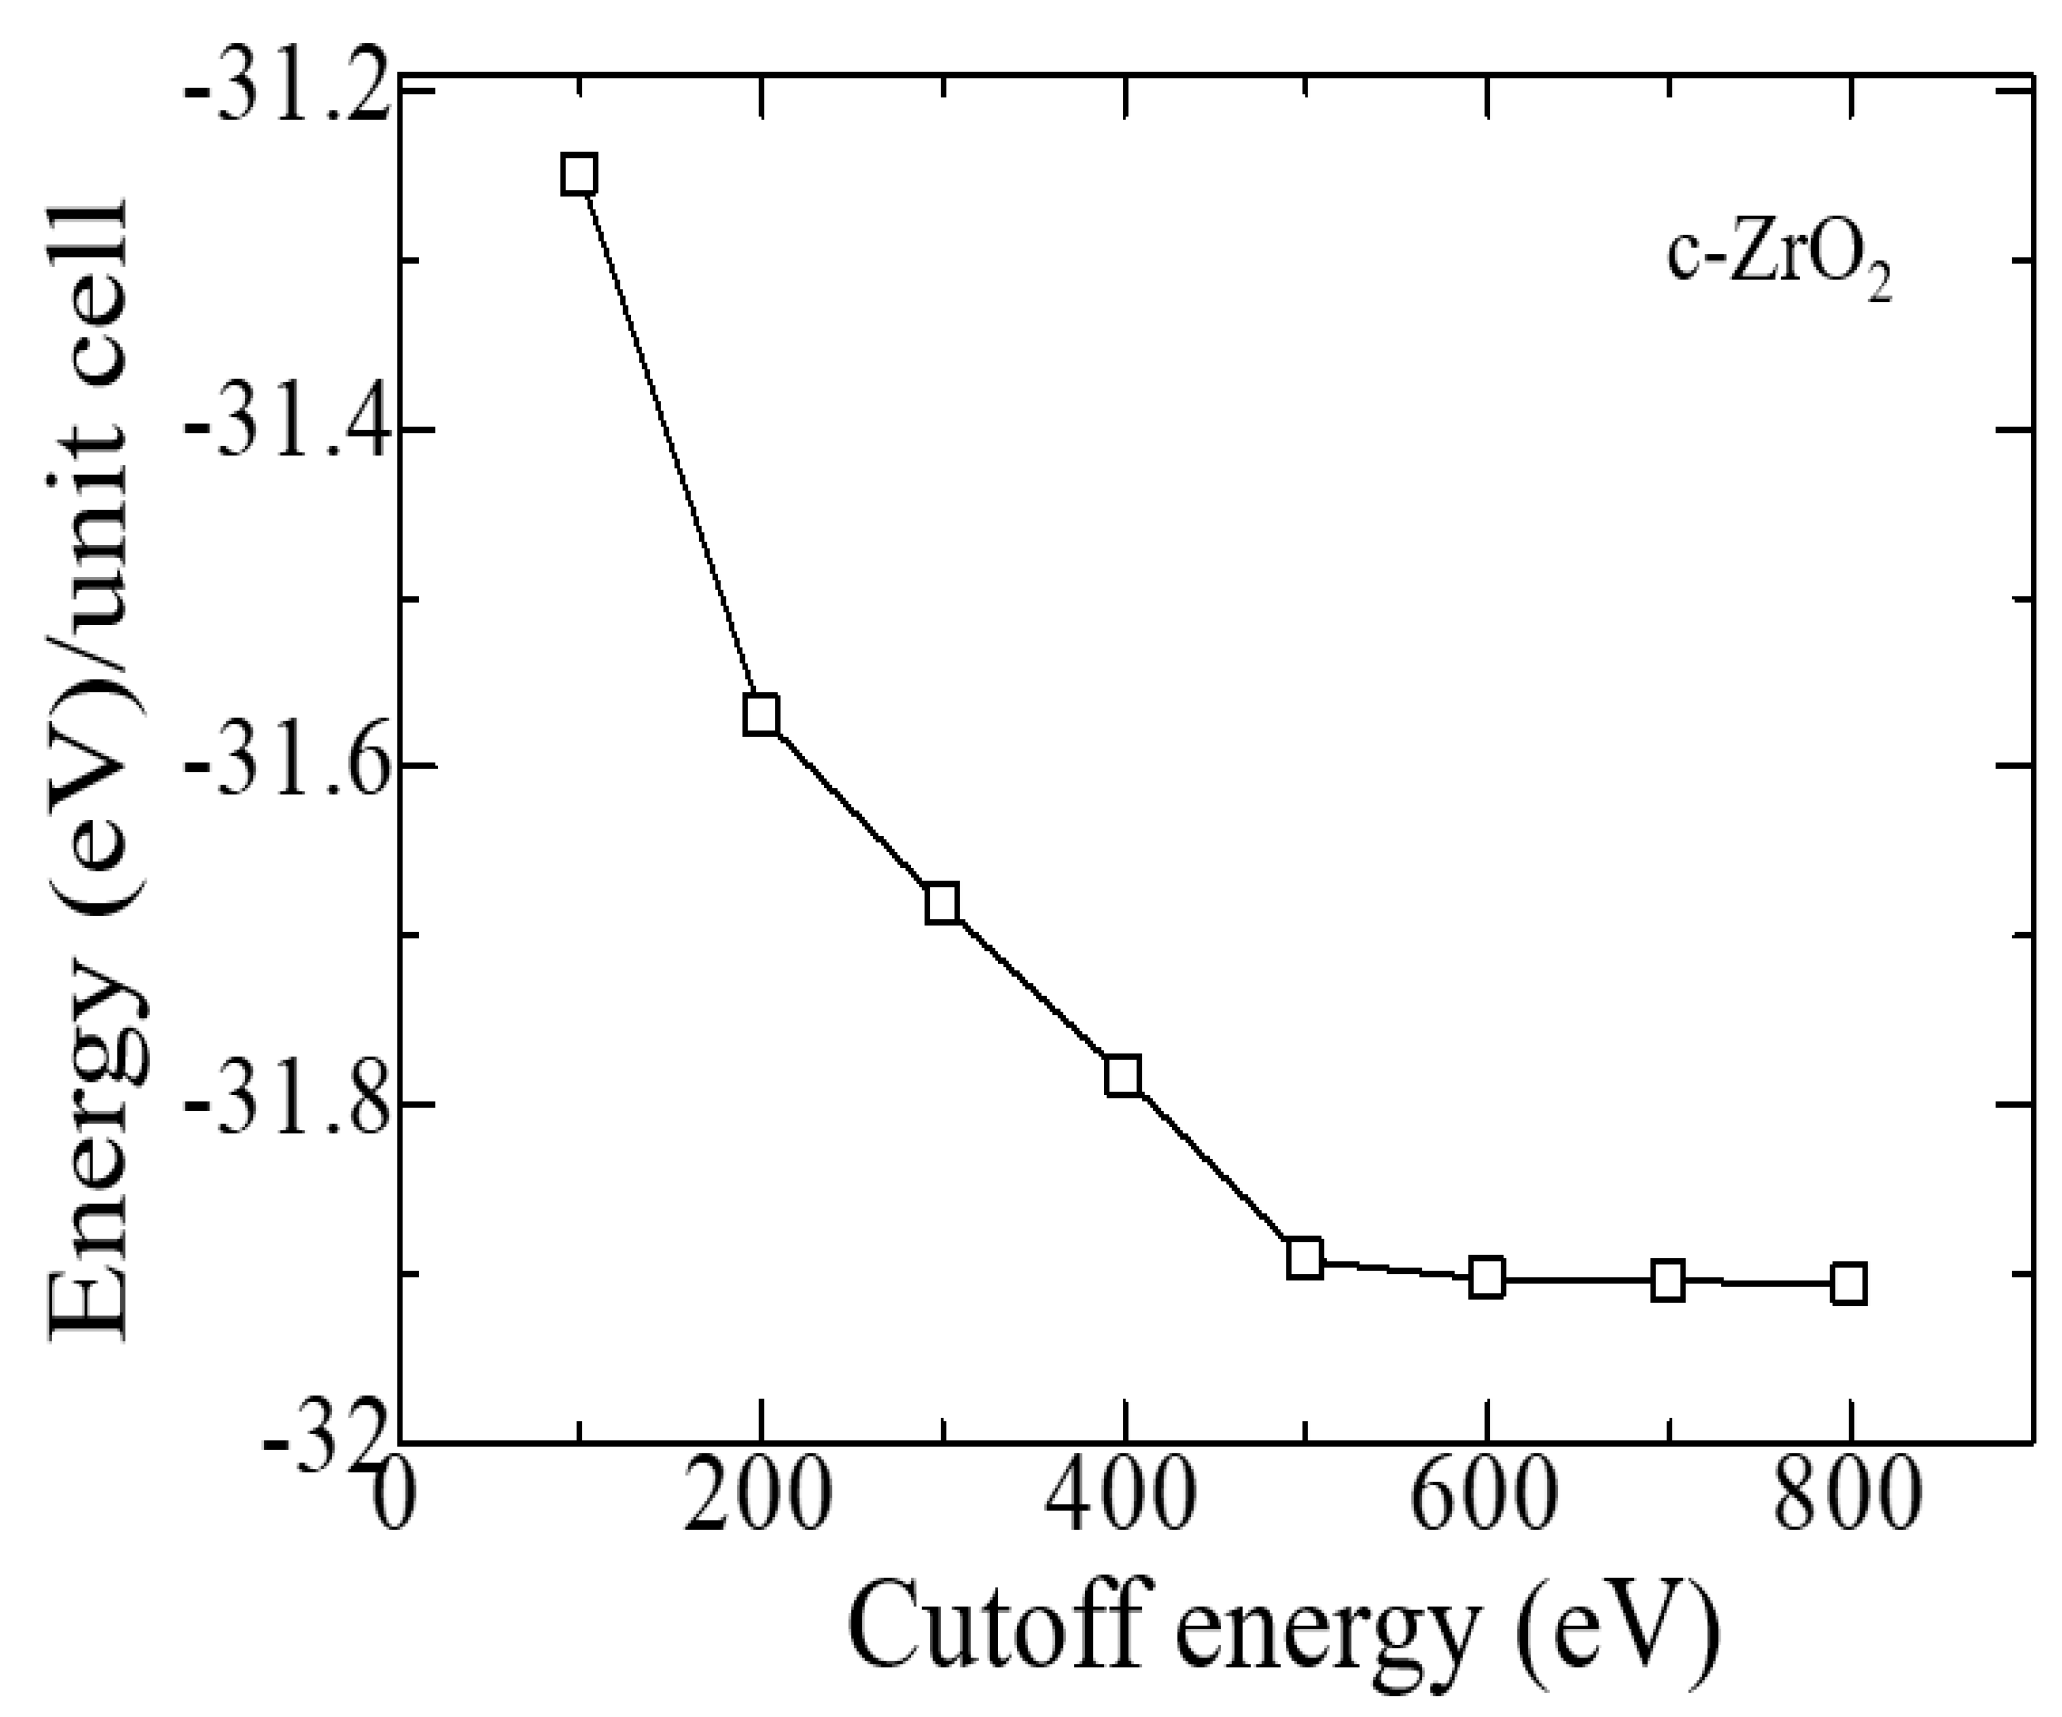
Figure 4.
Comparison of experimental and calculated (SCAN) X-ray diffraction patterns of m-ZrO2, t-ZrO2, and c-ZrO2.
Figure 4.
Comparison of experimental and calculated (SCAN) X-ray diffraction patterns of m-ZrO2, t-ZrO2, and c-ZrO2.

Figure 5.
Entropy as a function of absolute temperature per unit cell c-ZrO2, t-ZrO2, m-ZrO2.
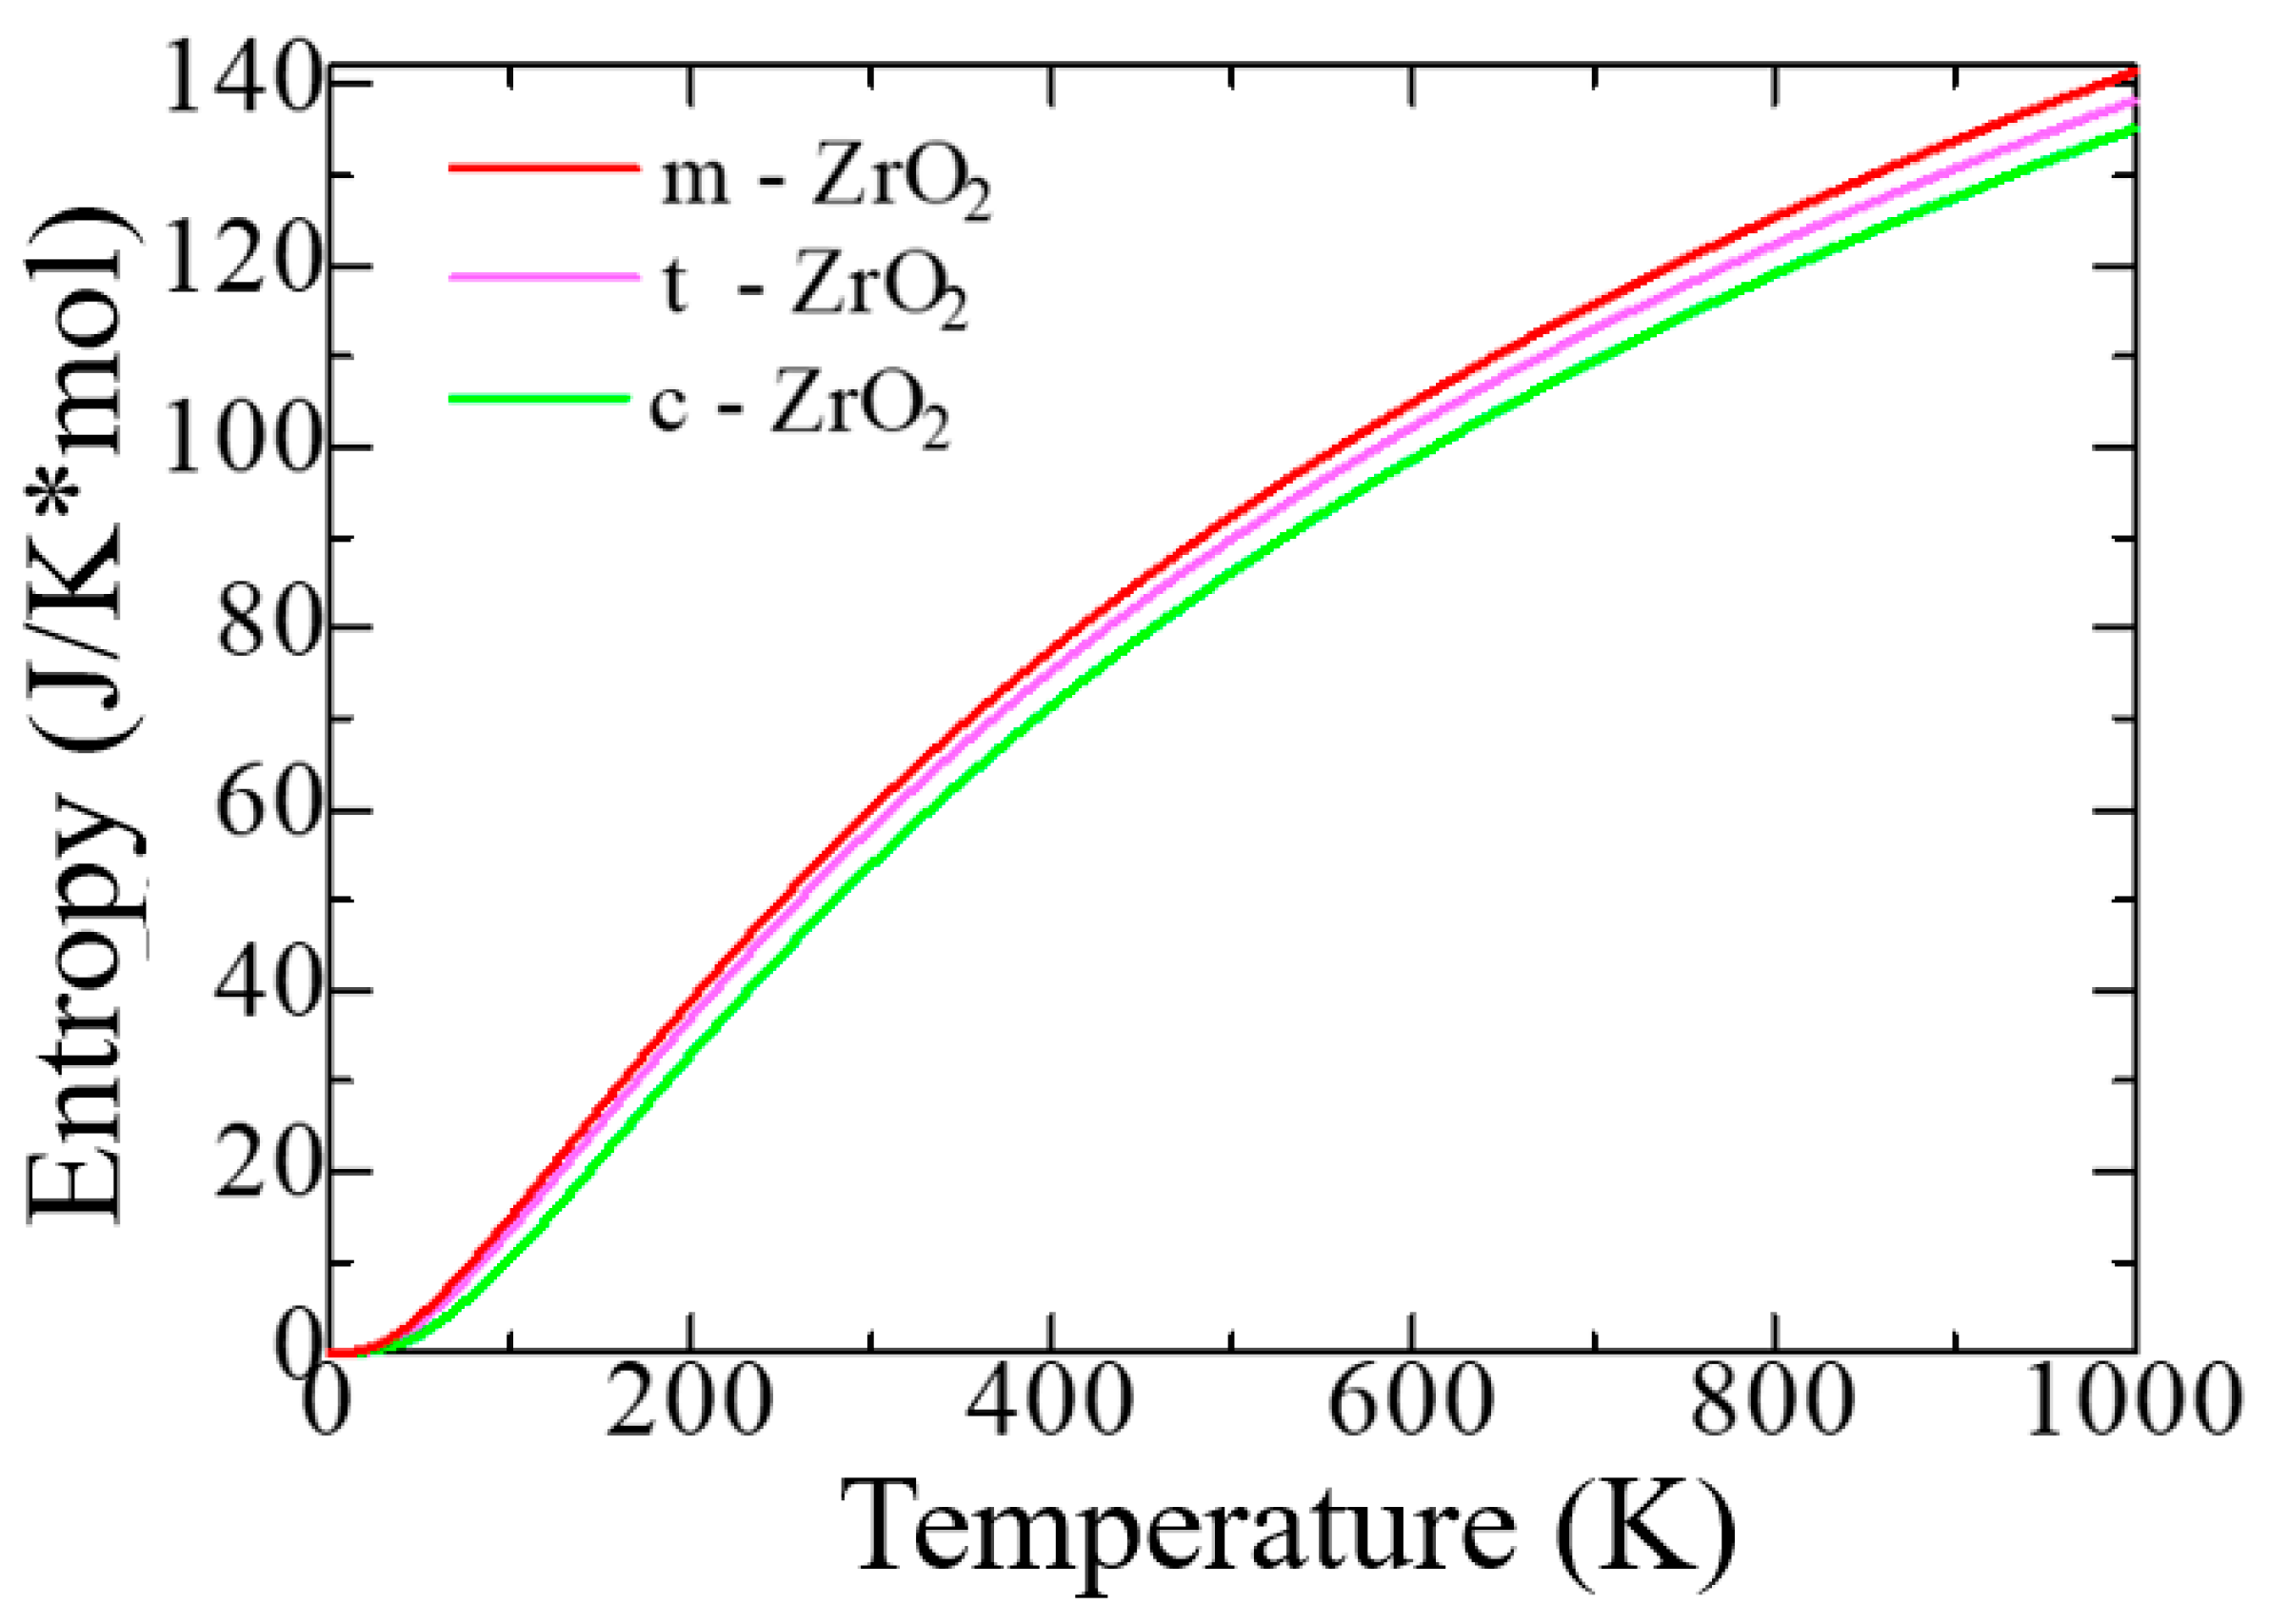
Figure 6.
Phonon dispersion relations of (a) monoclinic, (b) tetragonal, and (c) cubic ZrO2 at 0 K.
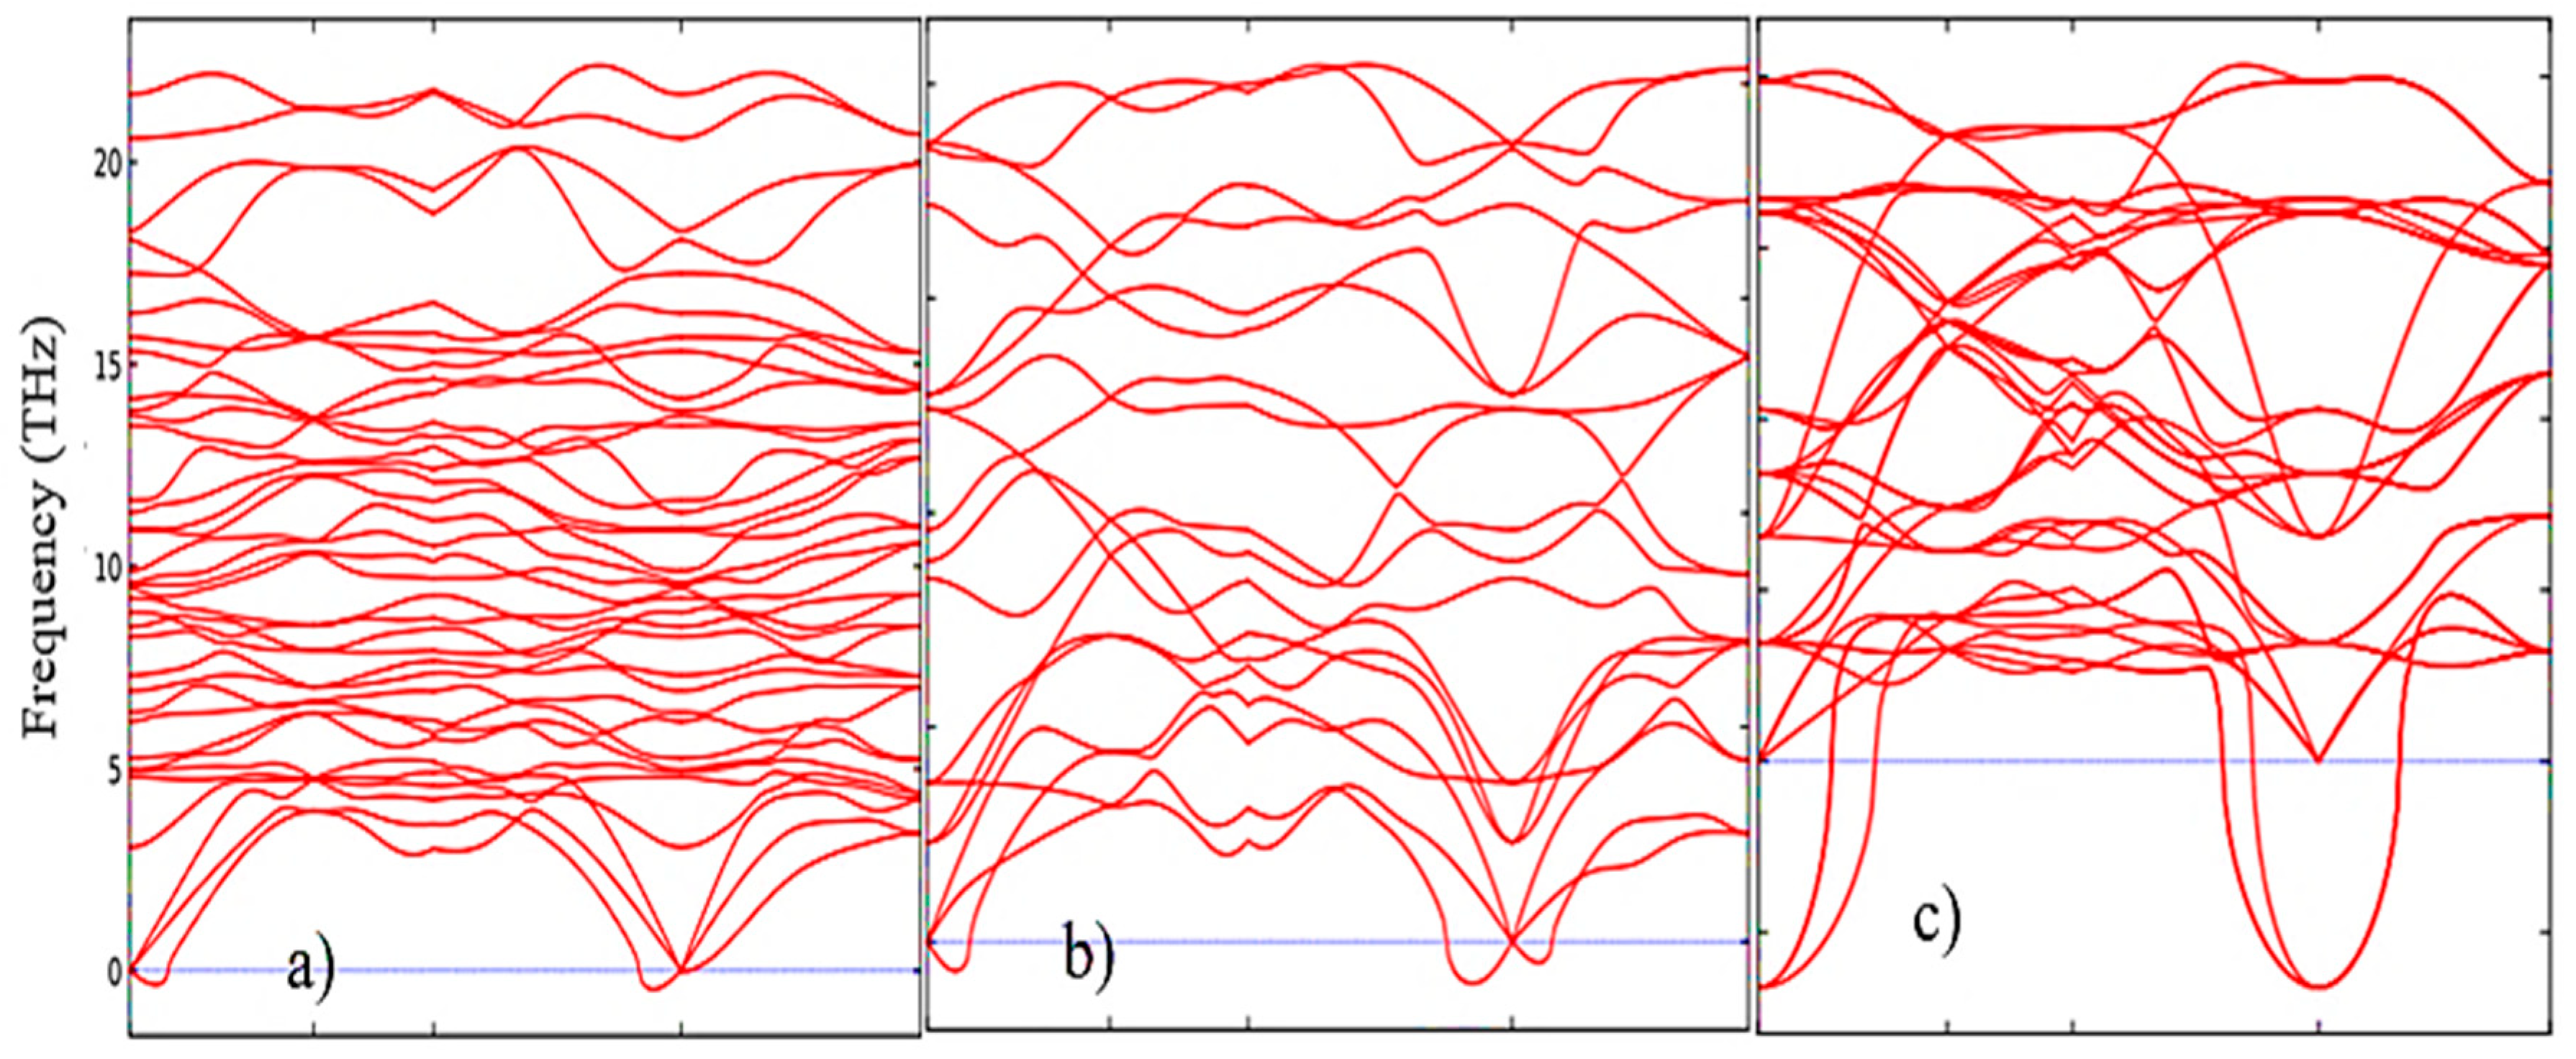
Figure 7.
Phonon density of states for (a) m-ZrO2, (b) t-ZrO2, and (c) m-ZrO2.
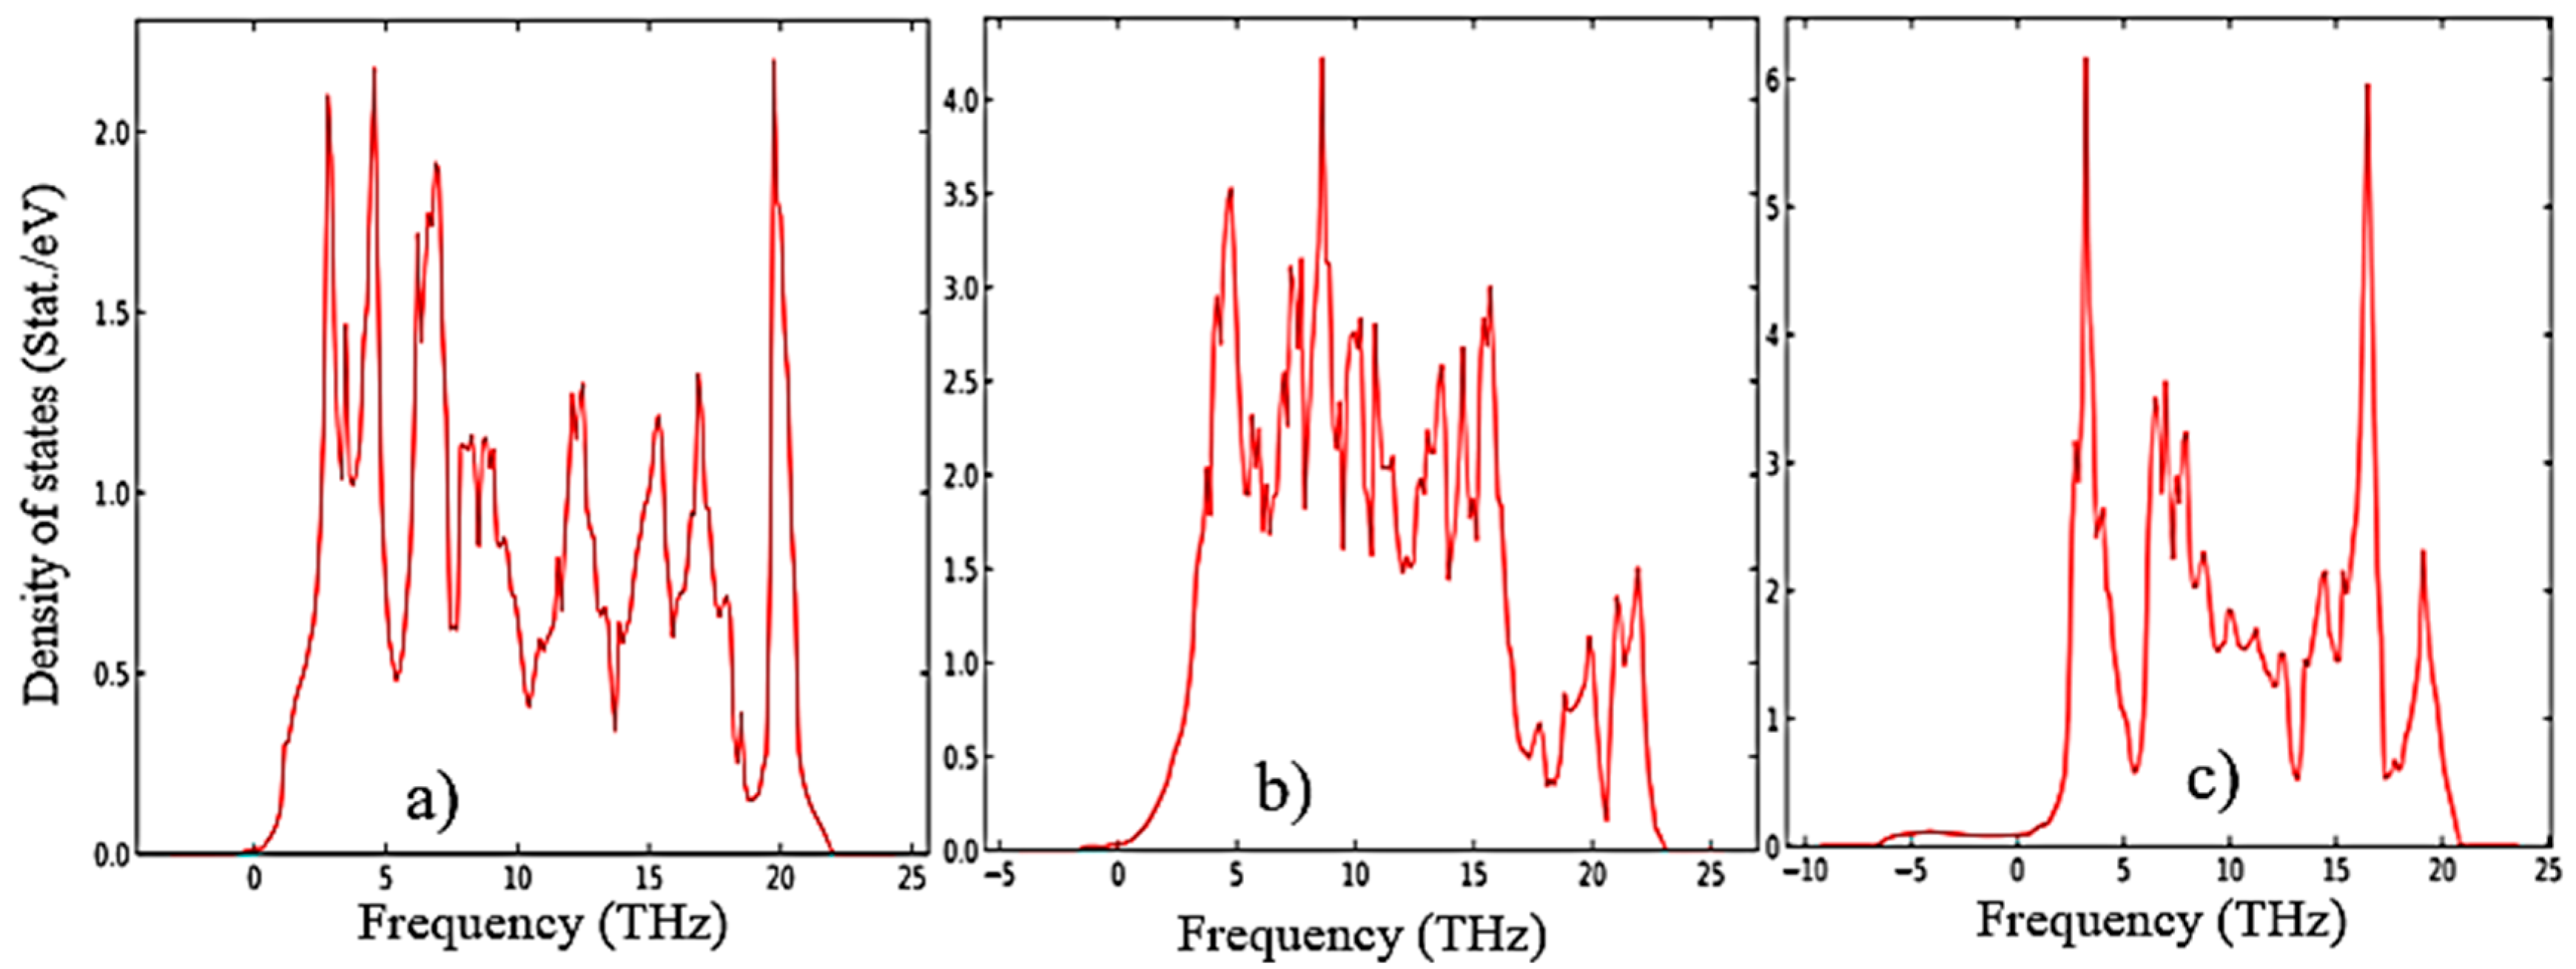
Figure 8.
Total energy as a function of volume for m-ZrO2 (a), t-ZrO2 (b), and m-ZrO2 (c).
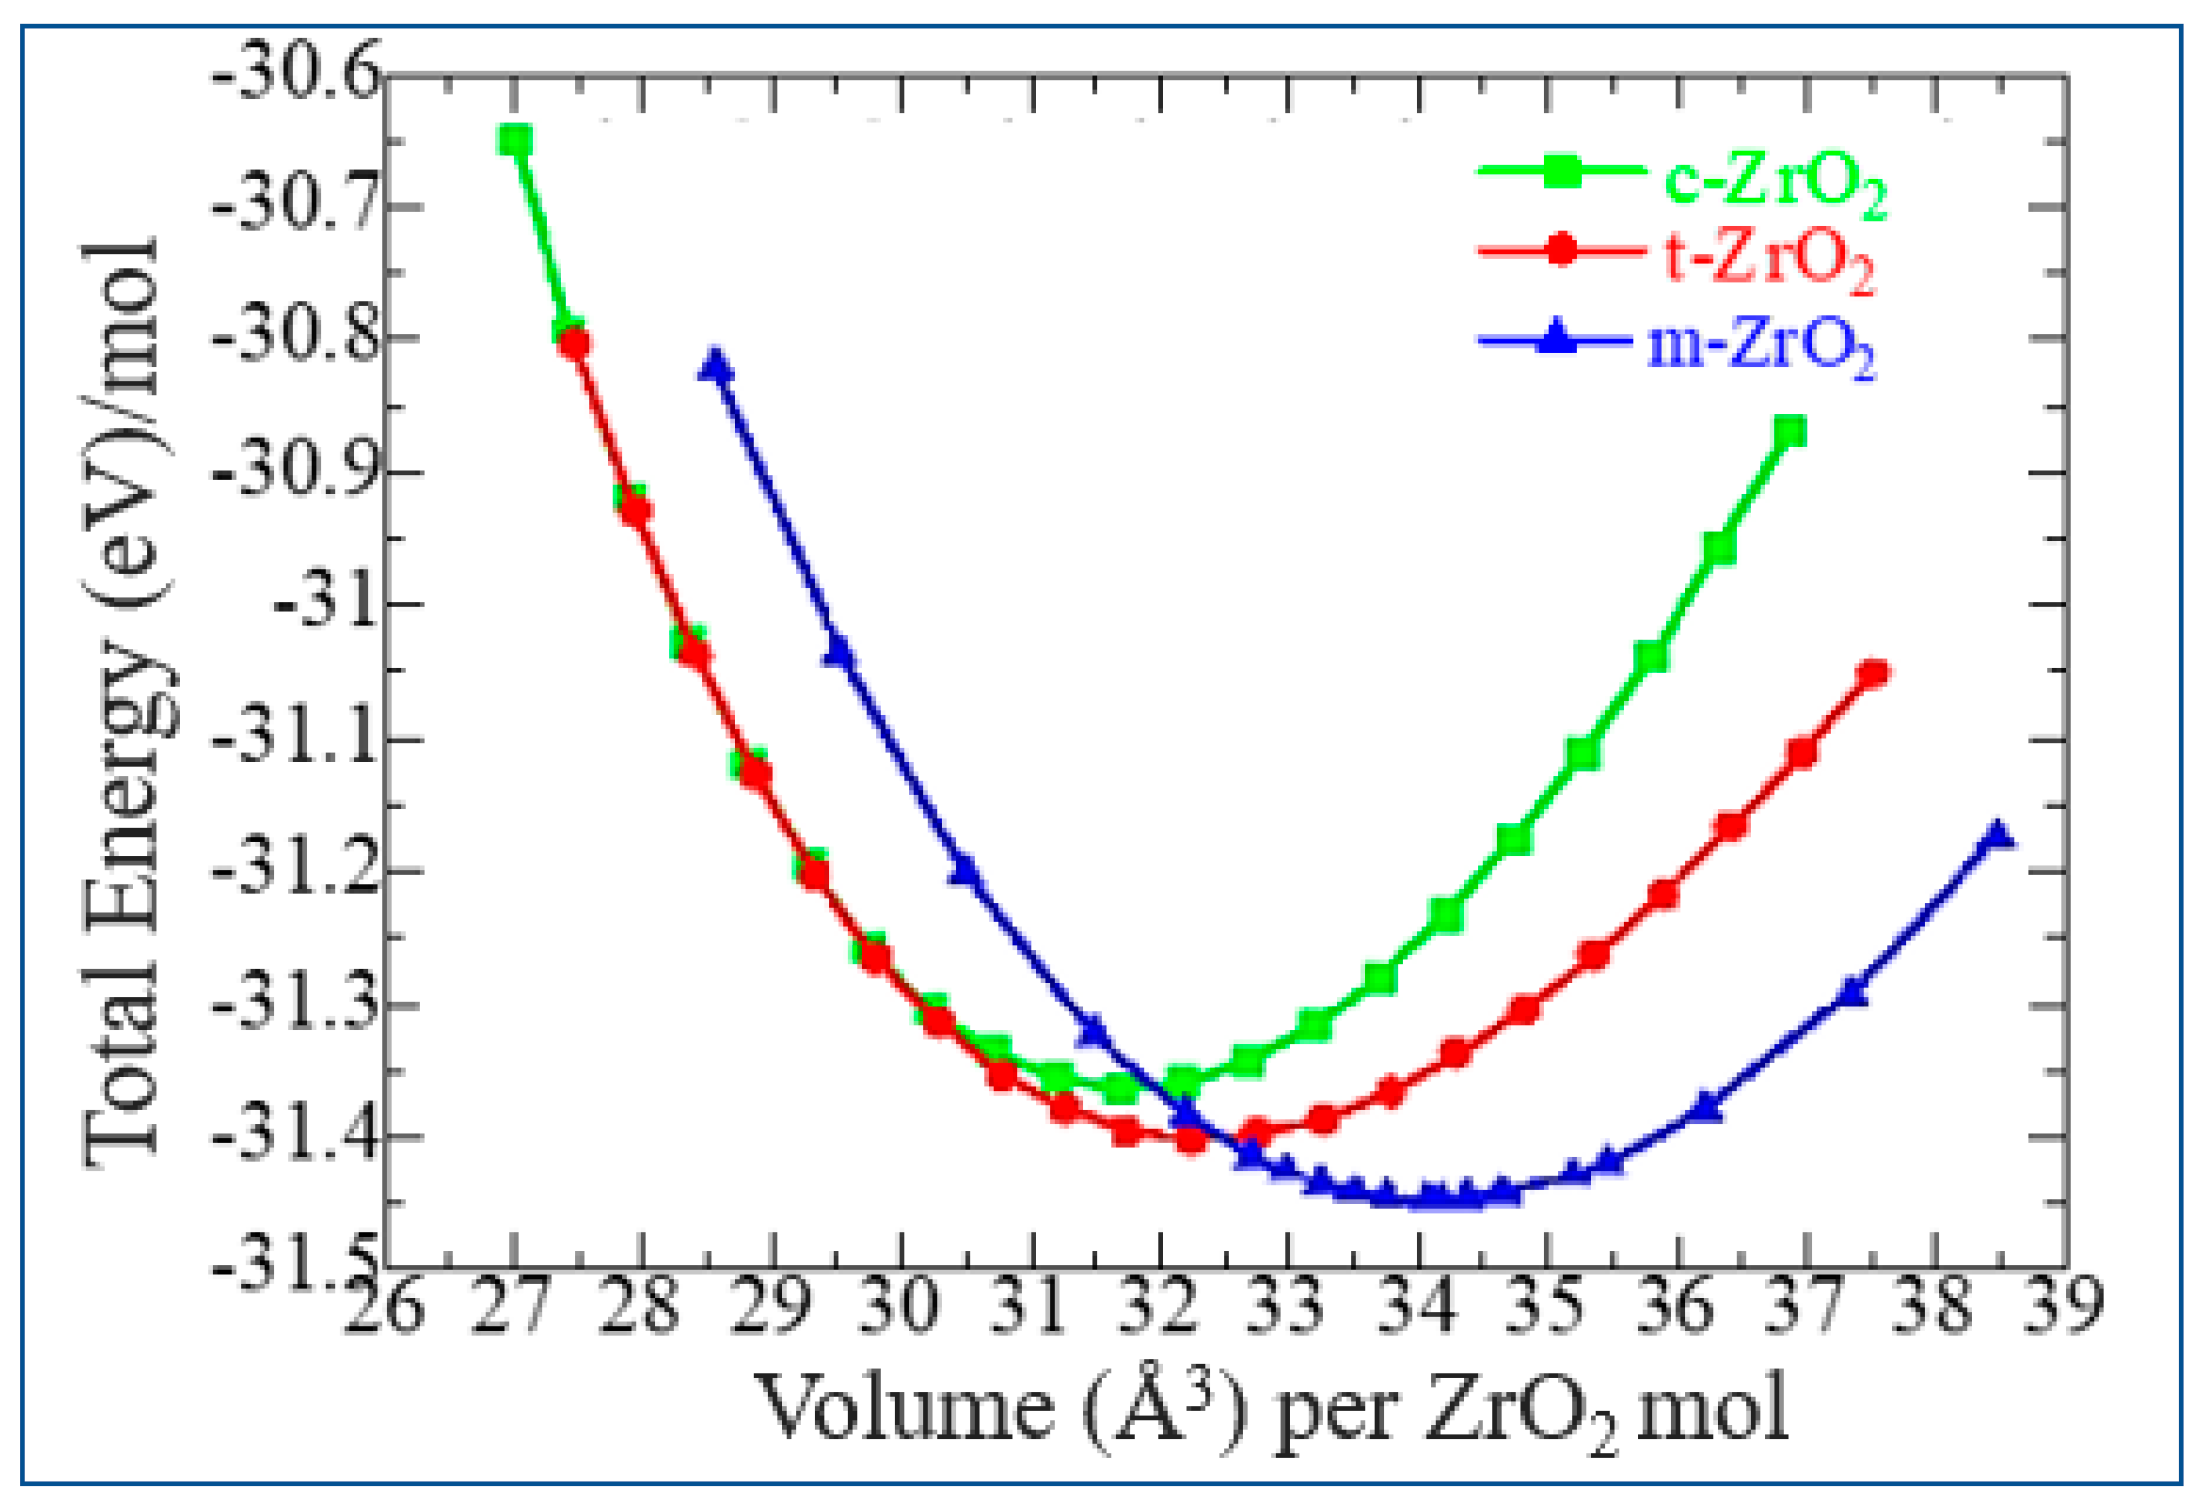
Figure 9.
Total density of electron states (TDOS) of monoclinic, tetragonal, and cubic ZrO2.
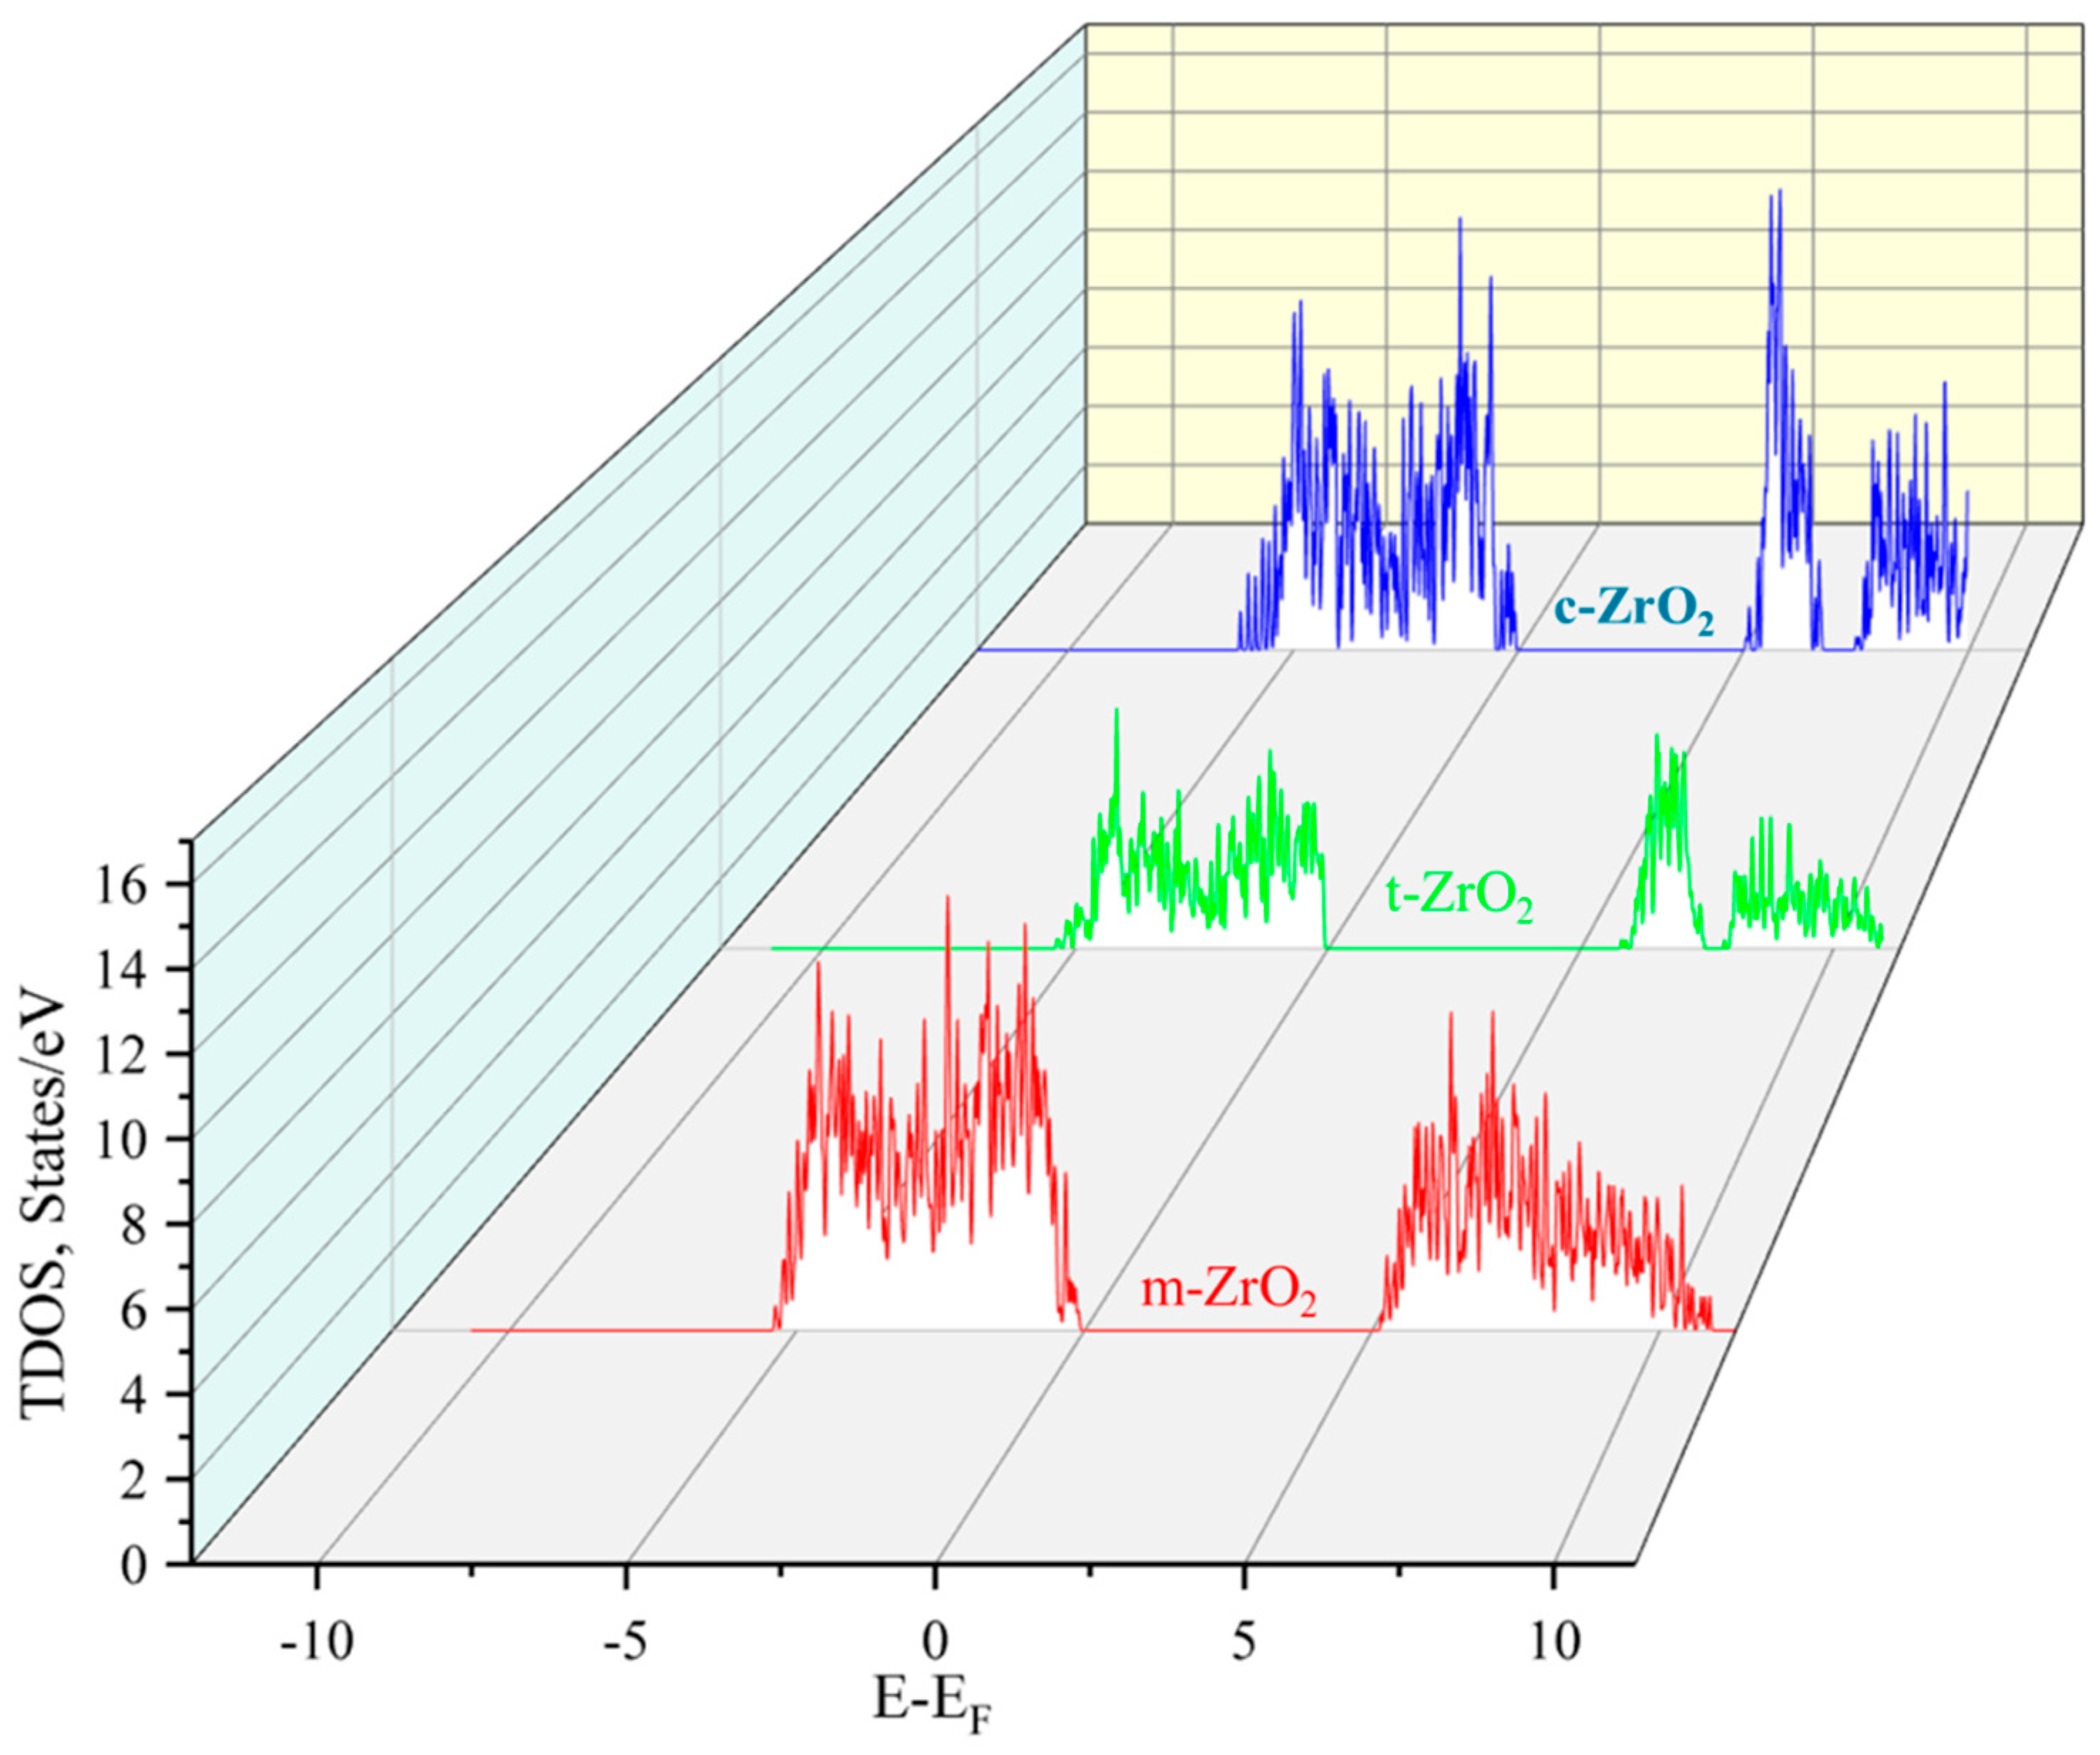
Figure 11.
Composite PDOS diagram showing the main contributions of s-, p- and d-orbitals to the states that form the CB bottom for c-ZrO2, t-ZrO2, m-ZrO2. Top of VB (green), scaled to zero.
Figure 11.
Composite PDOS diagram showing the main contributions of s-, p- and d-orbitals to the states that form the CB bottom for c-ZrO2, t-ZrO2, m-ZrO2. Top of VB (green), scaled to zero.
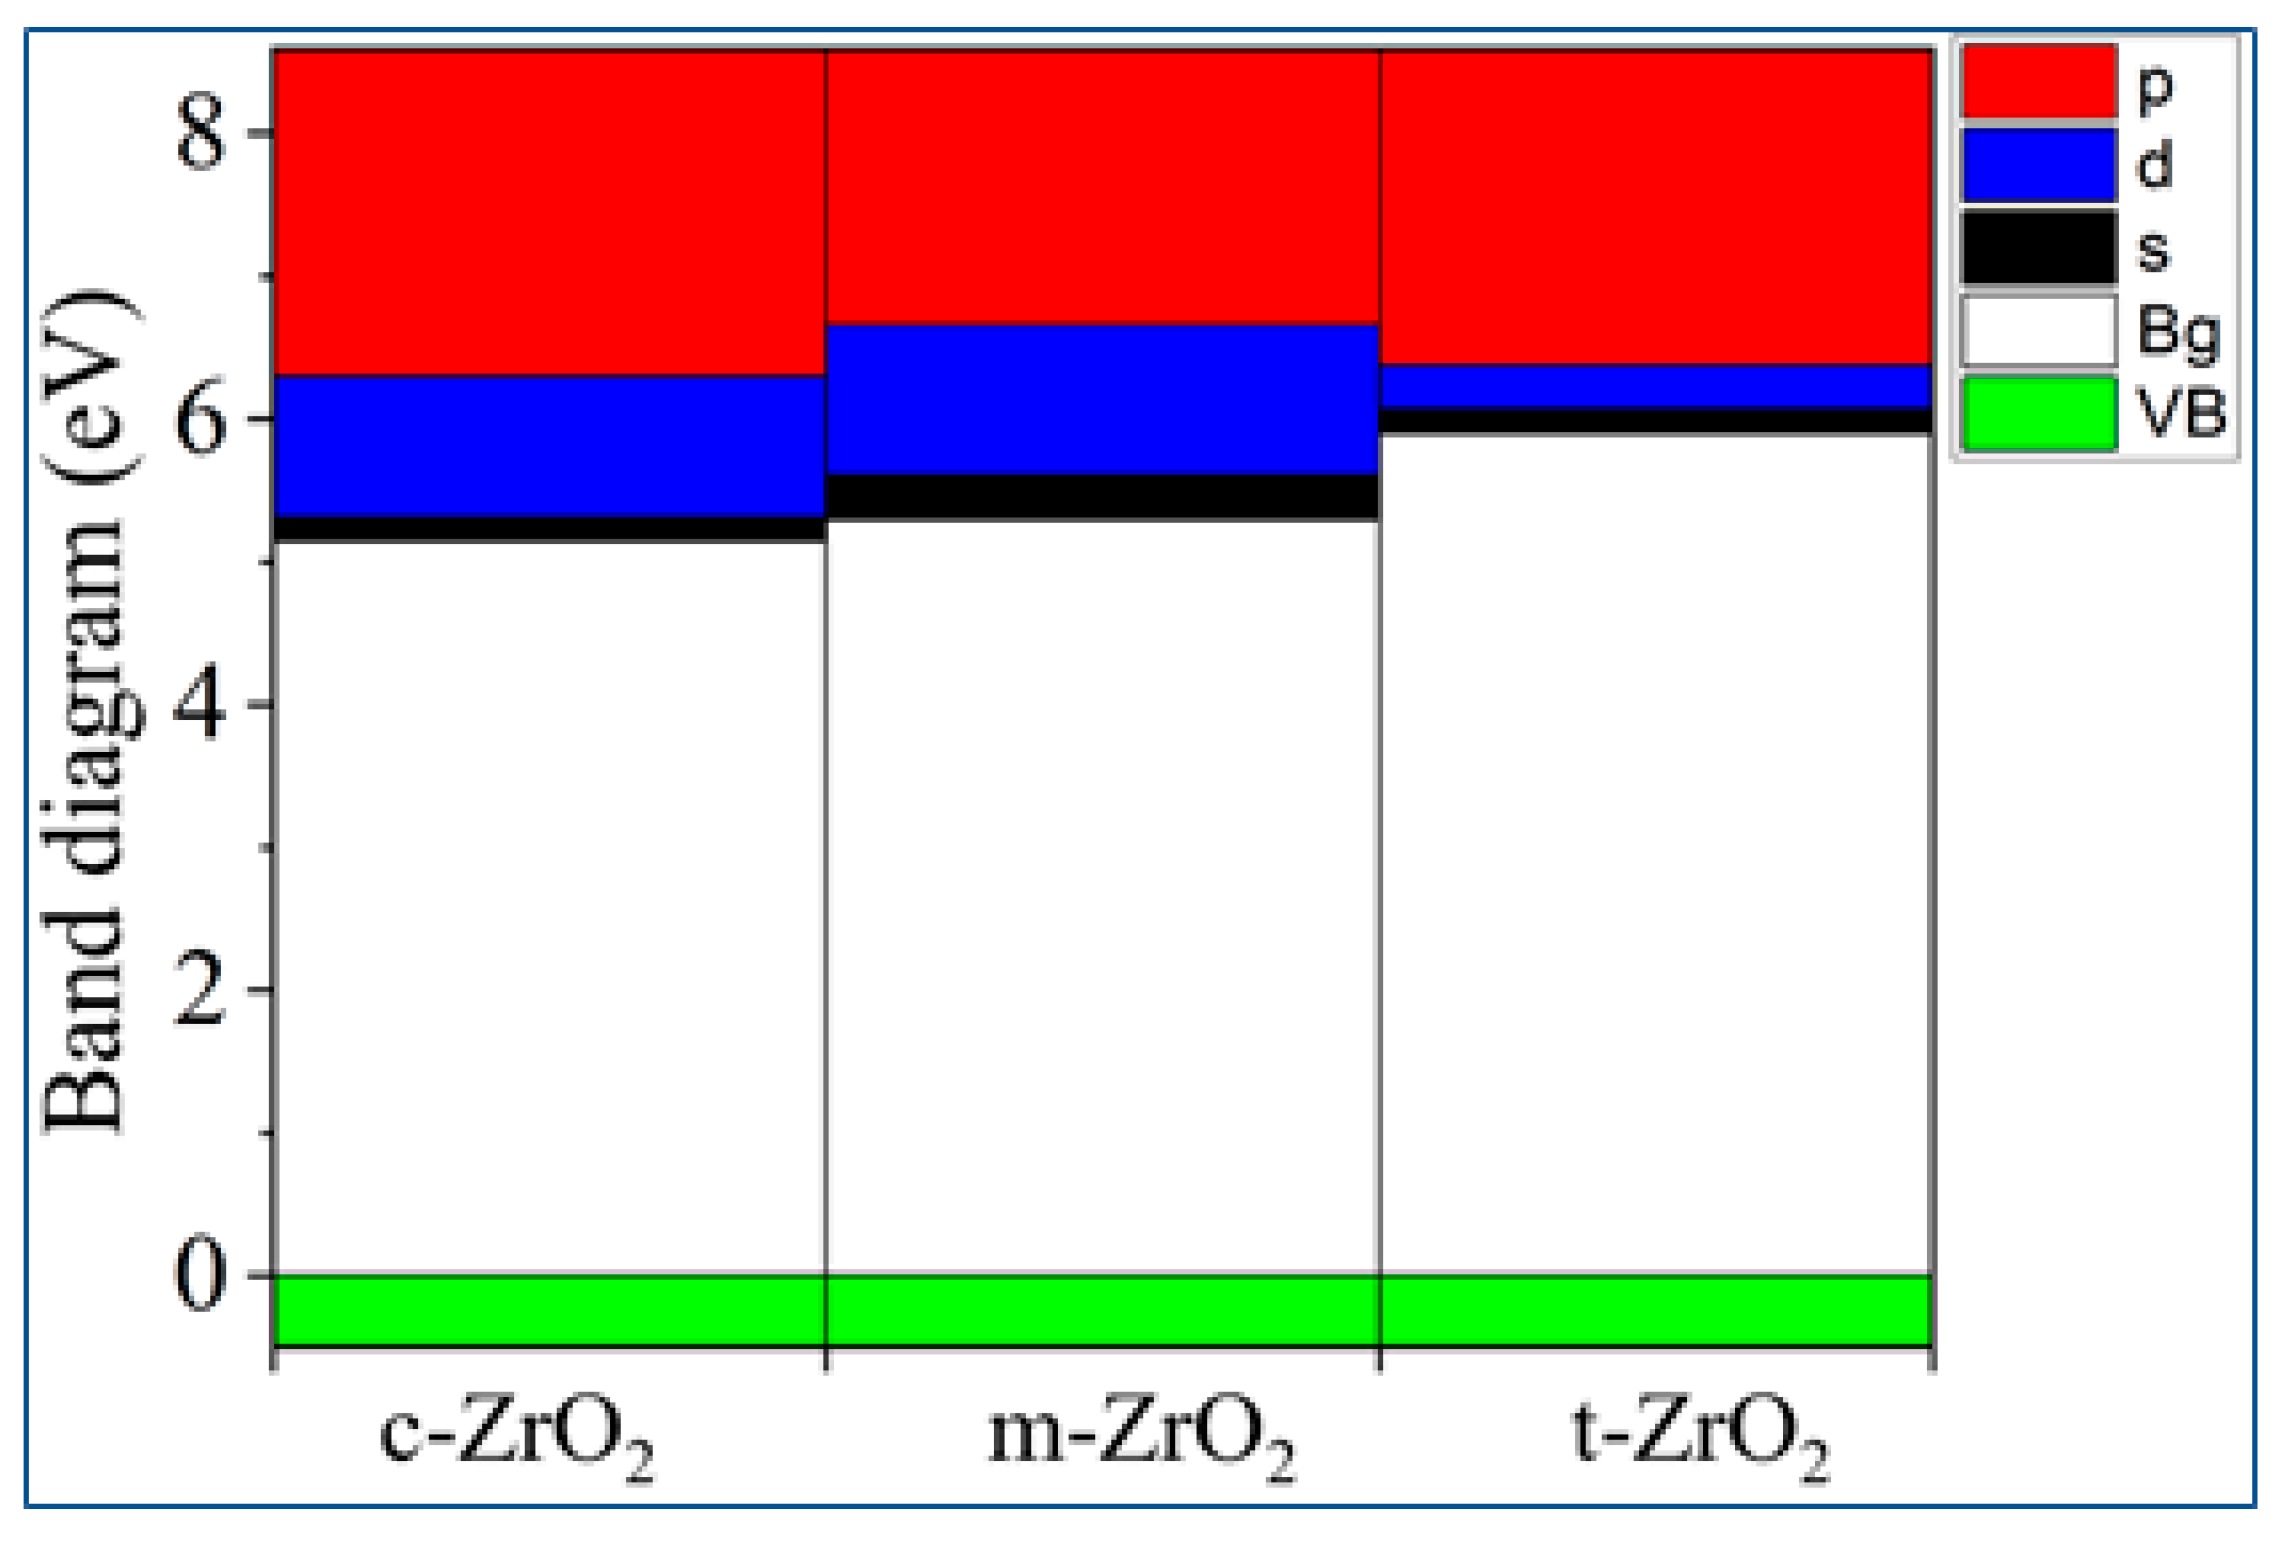
Figure 12.
Vibrations of ZrO2 volume as a function of Y2O3 concentration.
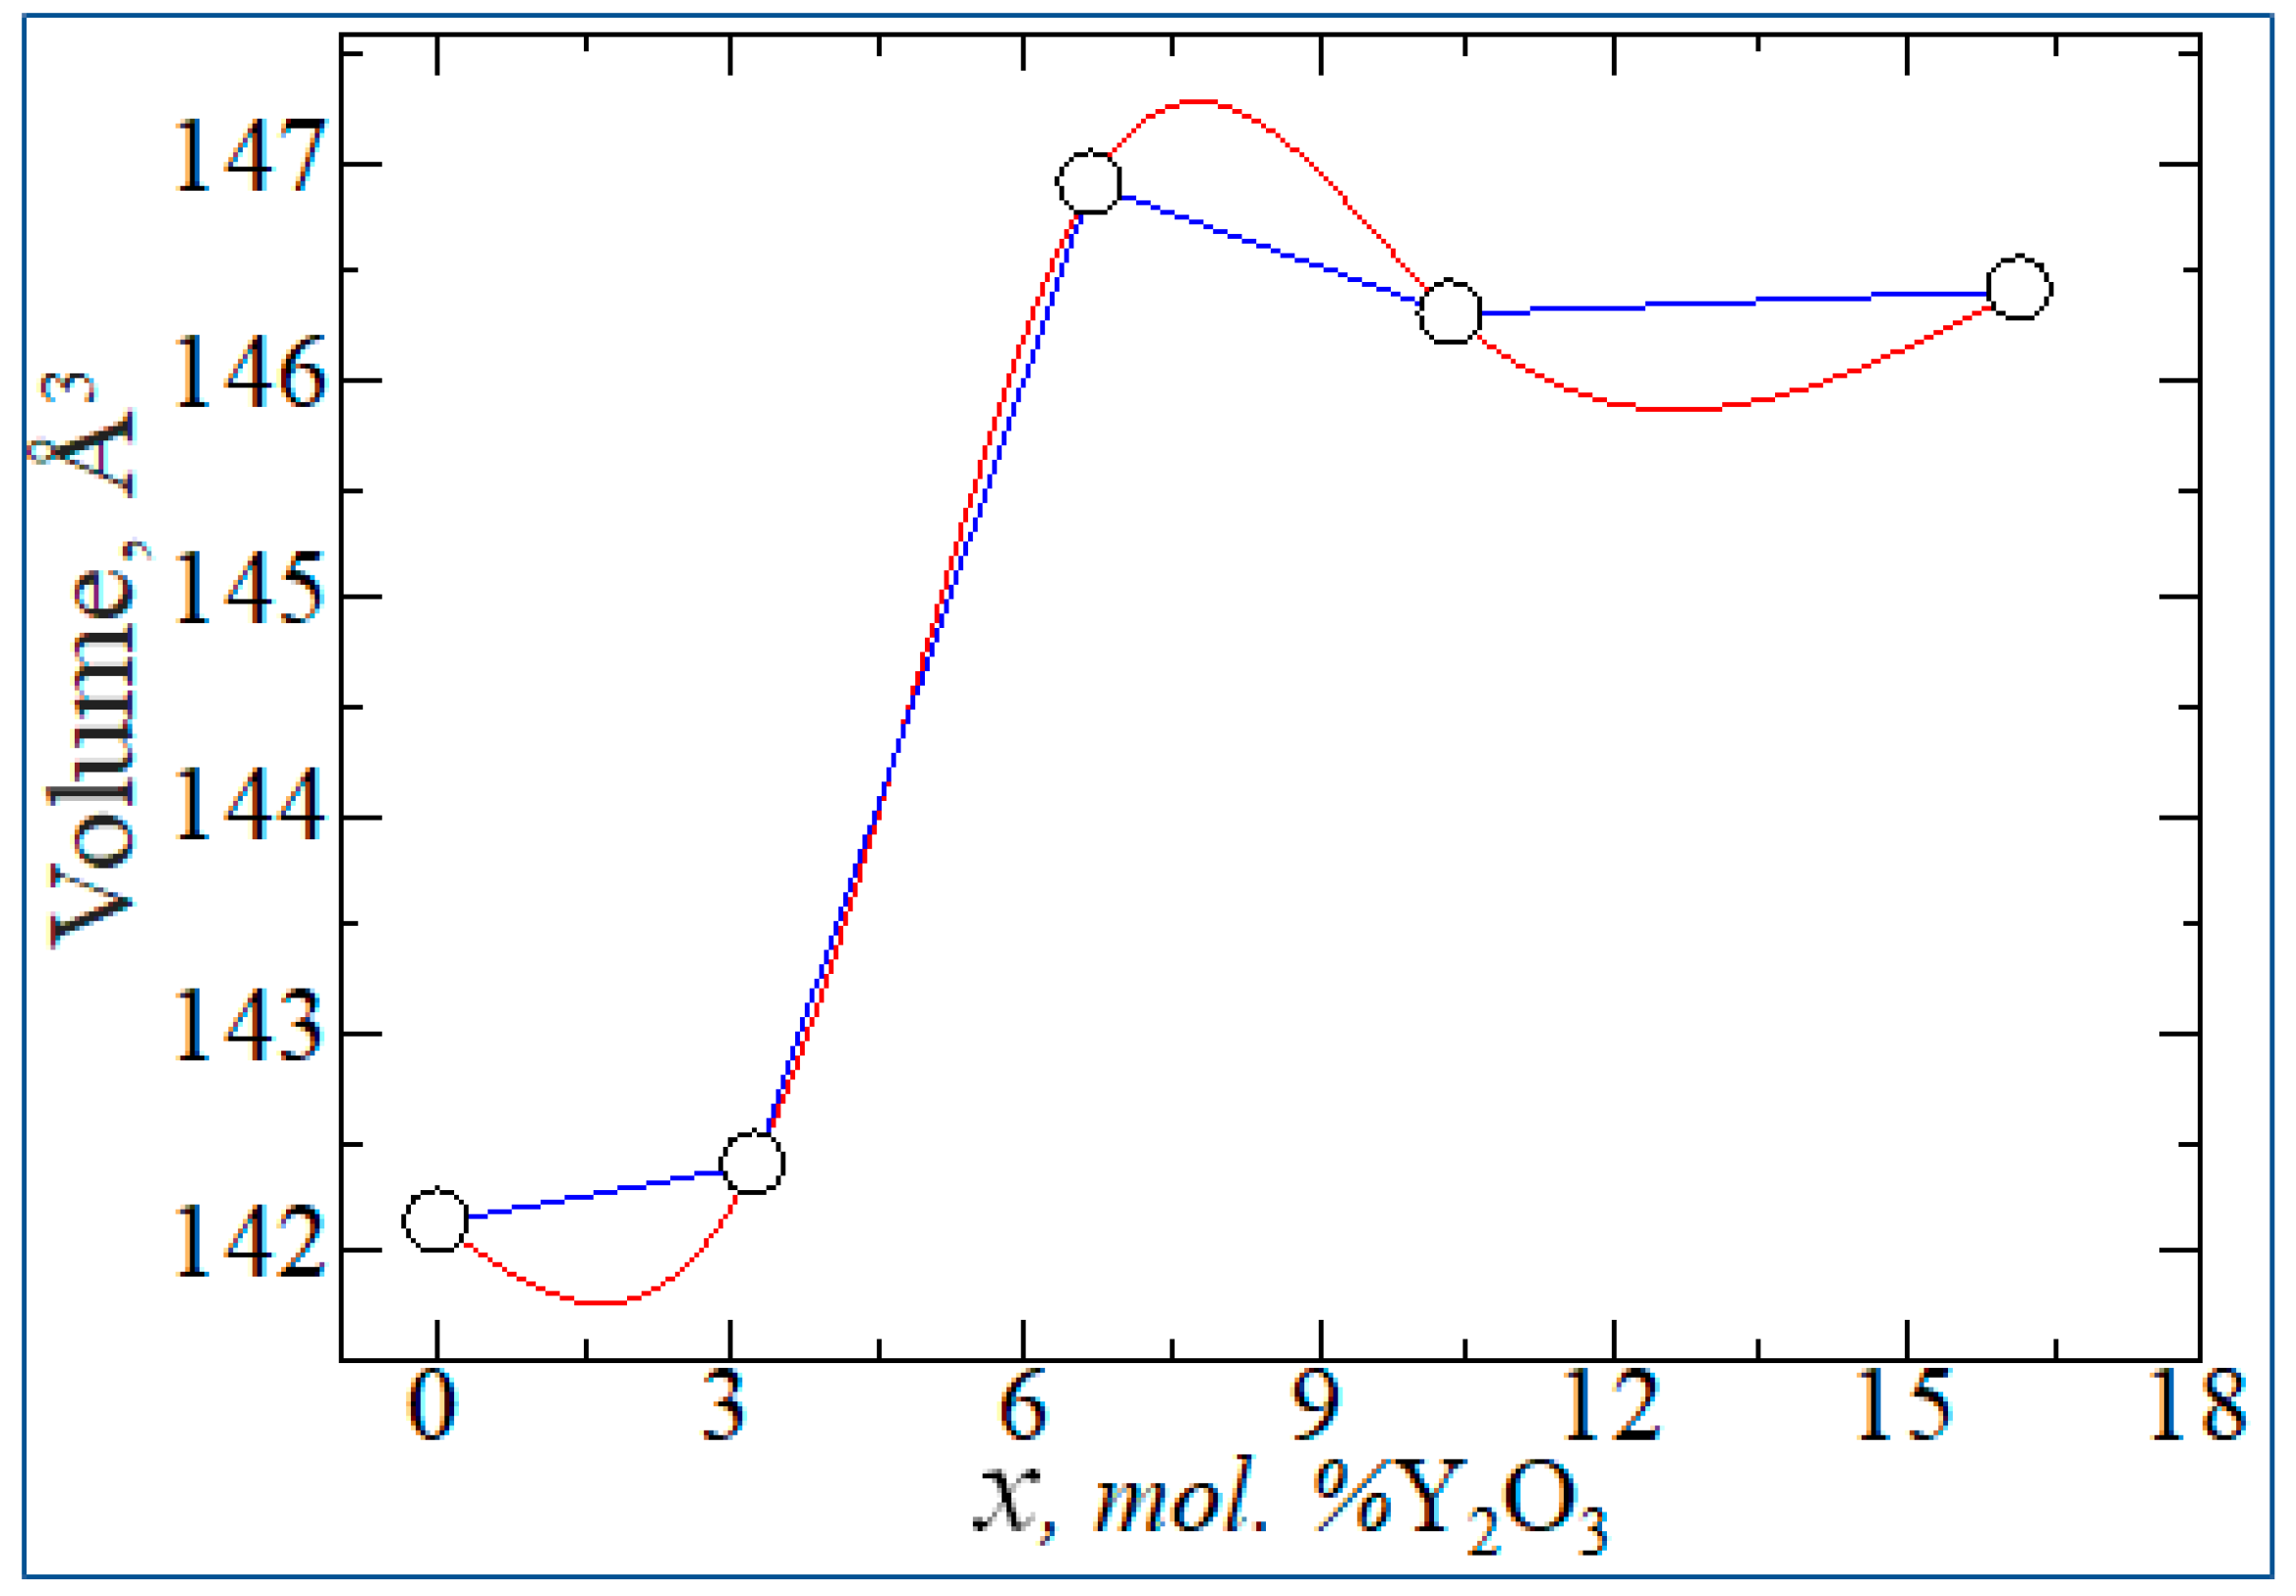
Figure 13.
Total energy difference between unit cell phases of ZrO2 as a function of Y2O3 doping concentration.
Figure 13.
Total energy difference between unit cell phases of ZrO2 as a function of Y2O3 doping concentration.
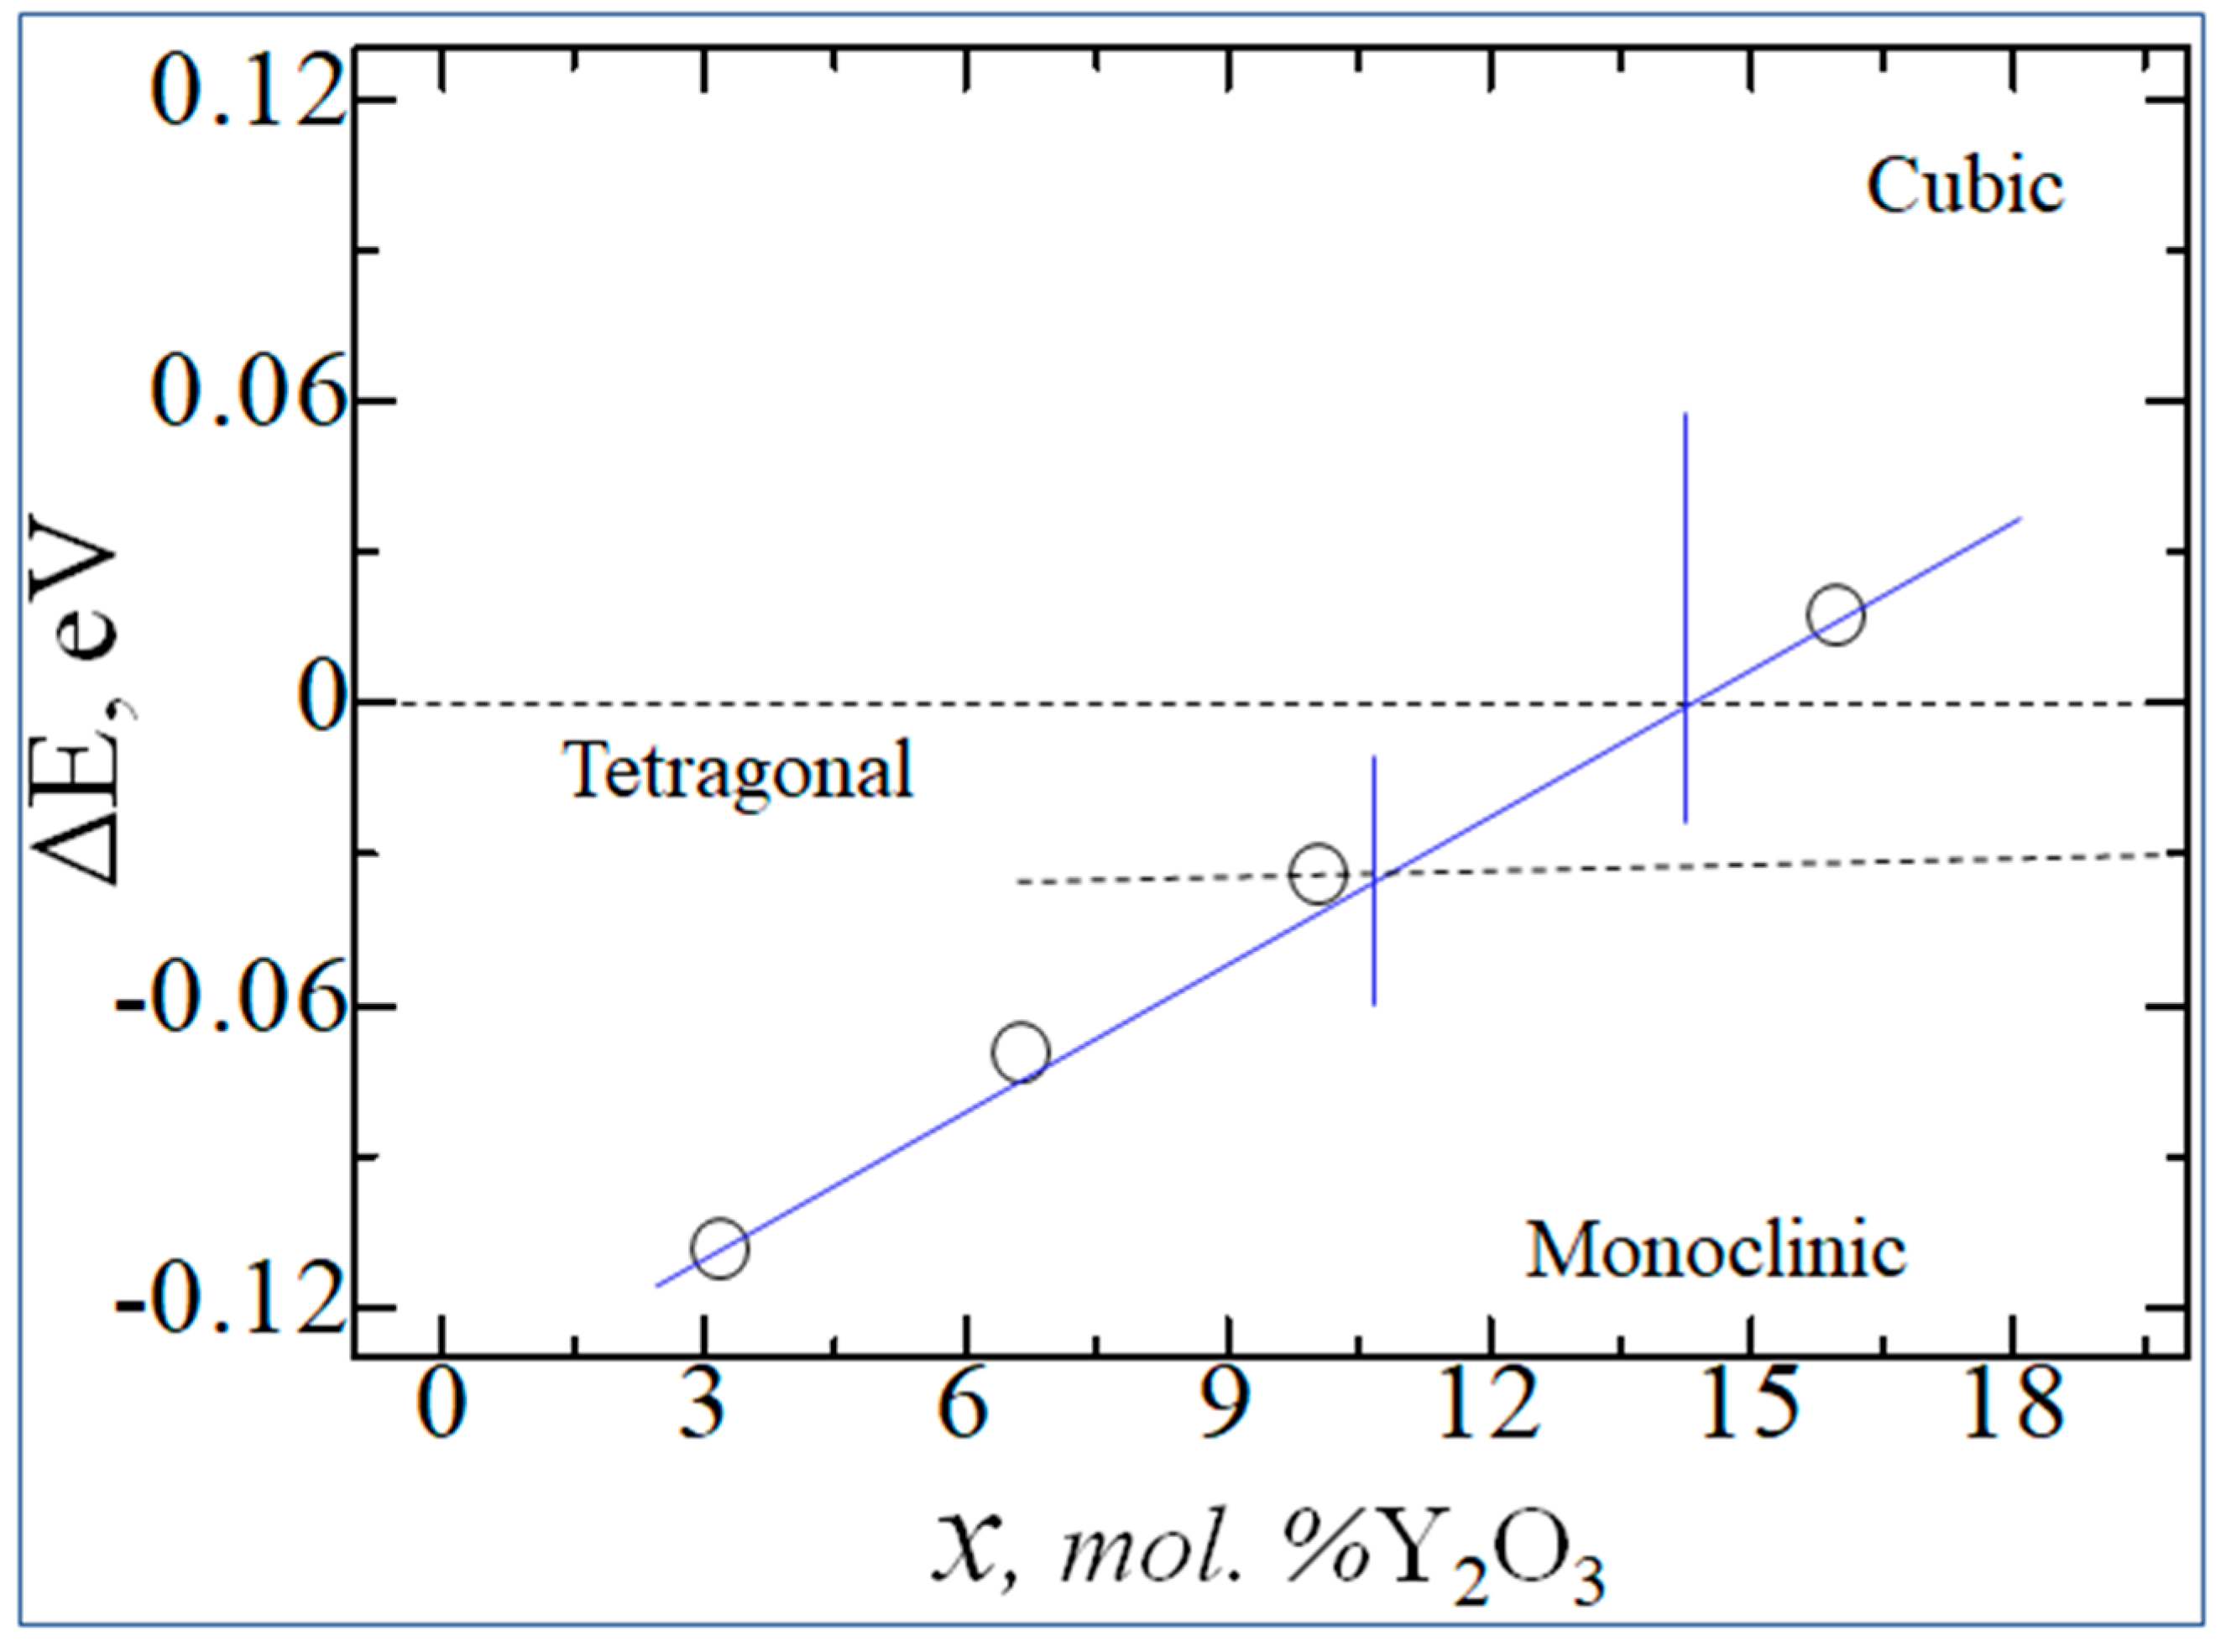
Figure 14.
Enthalpy formation energy for YSZ as a function of Y2O3 concentration.
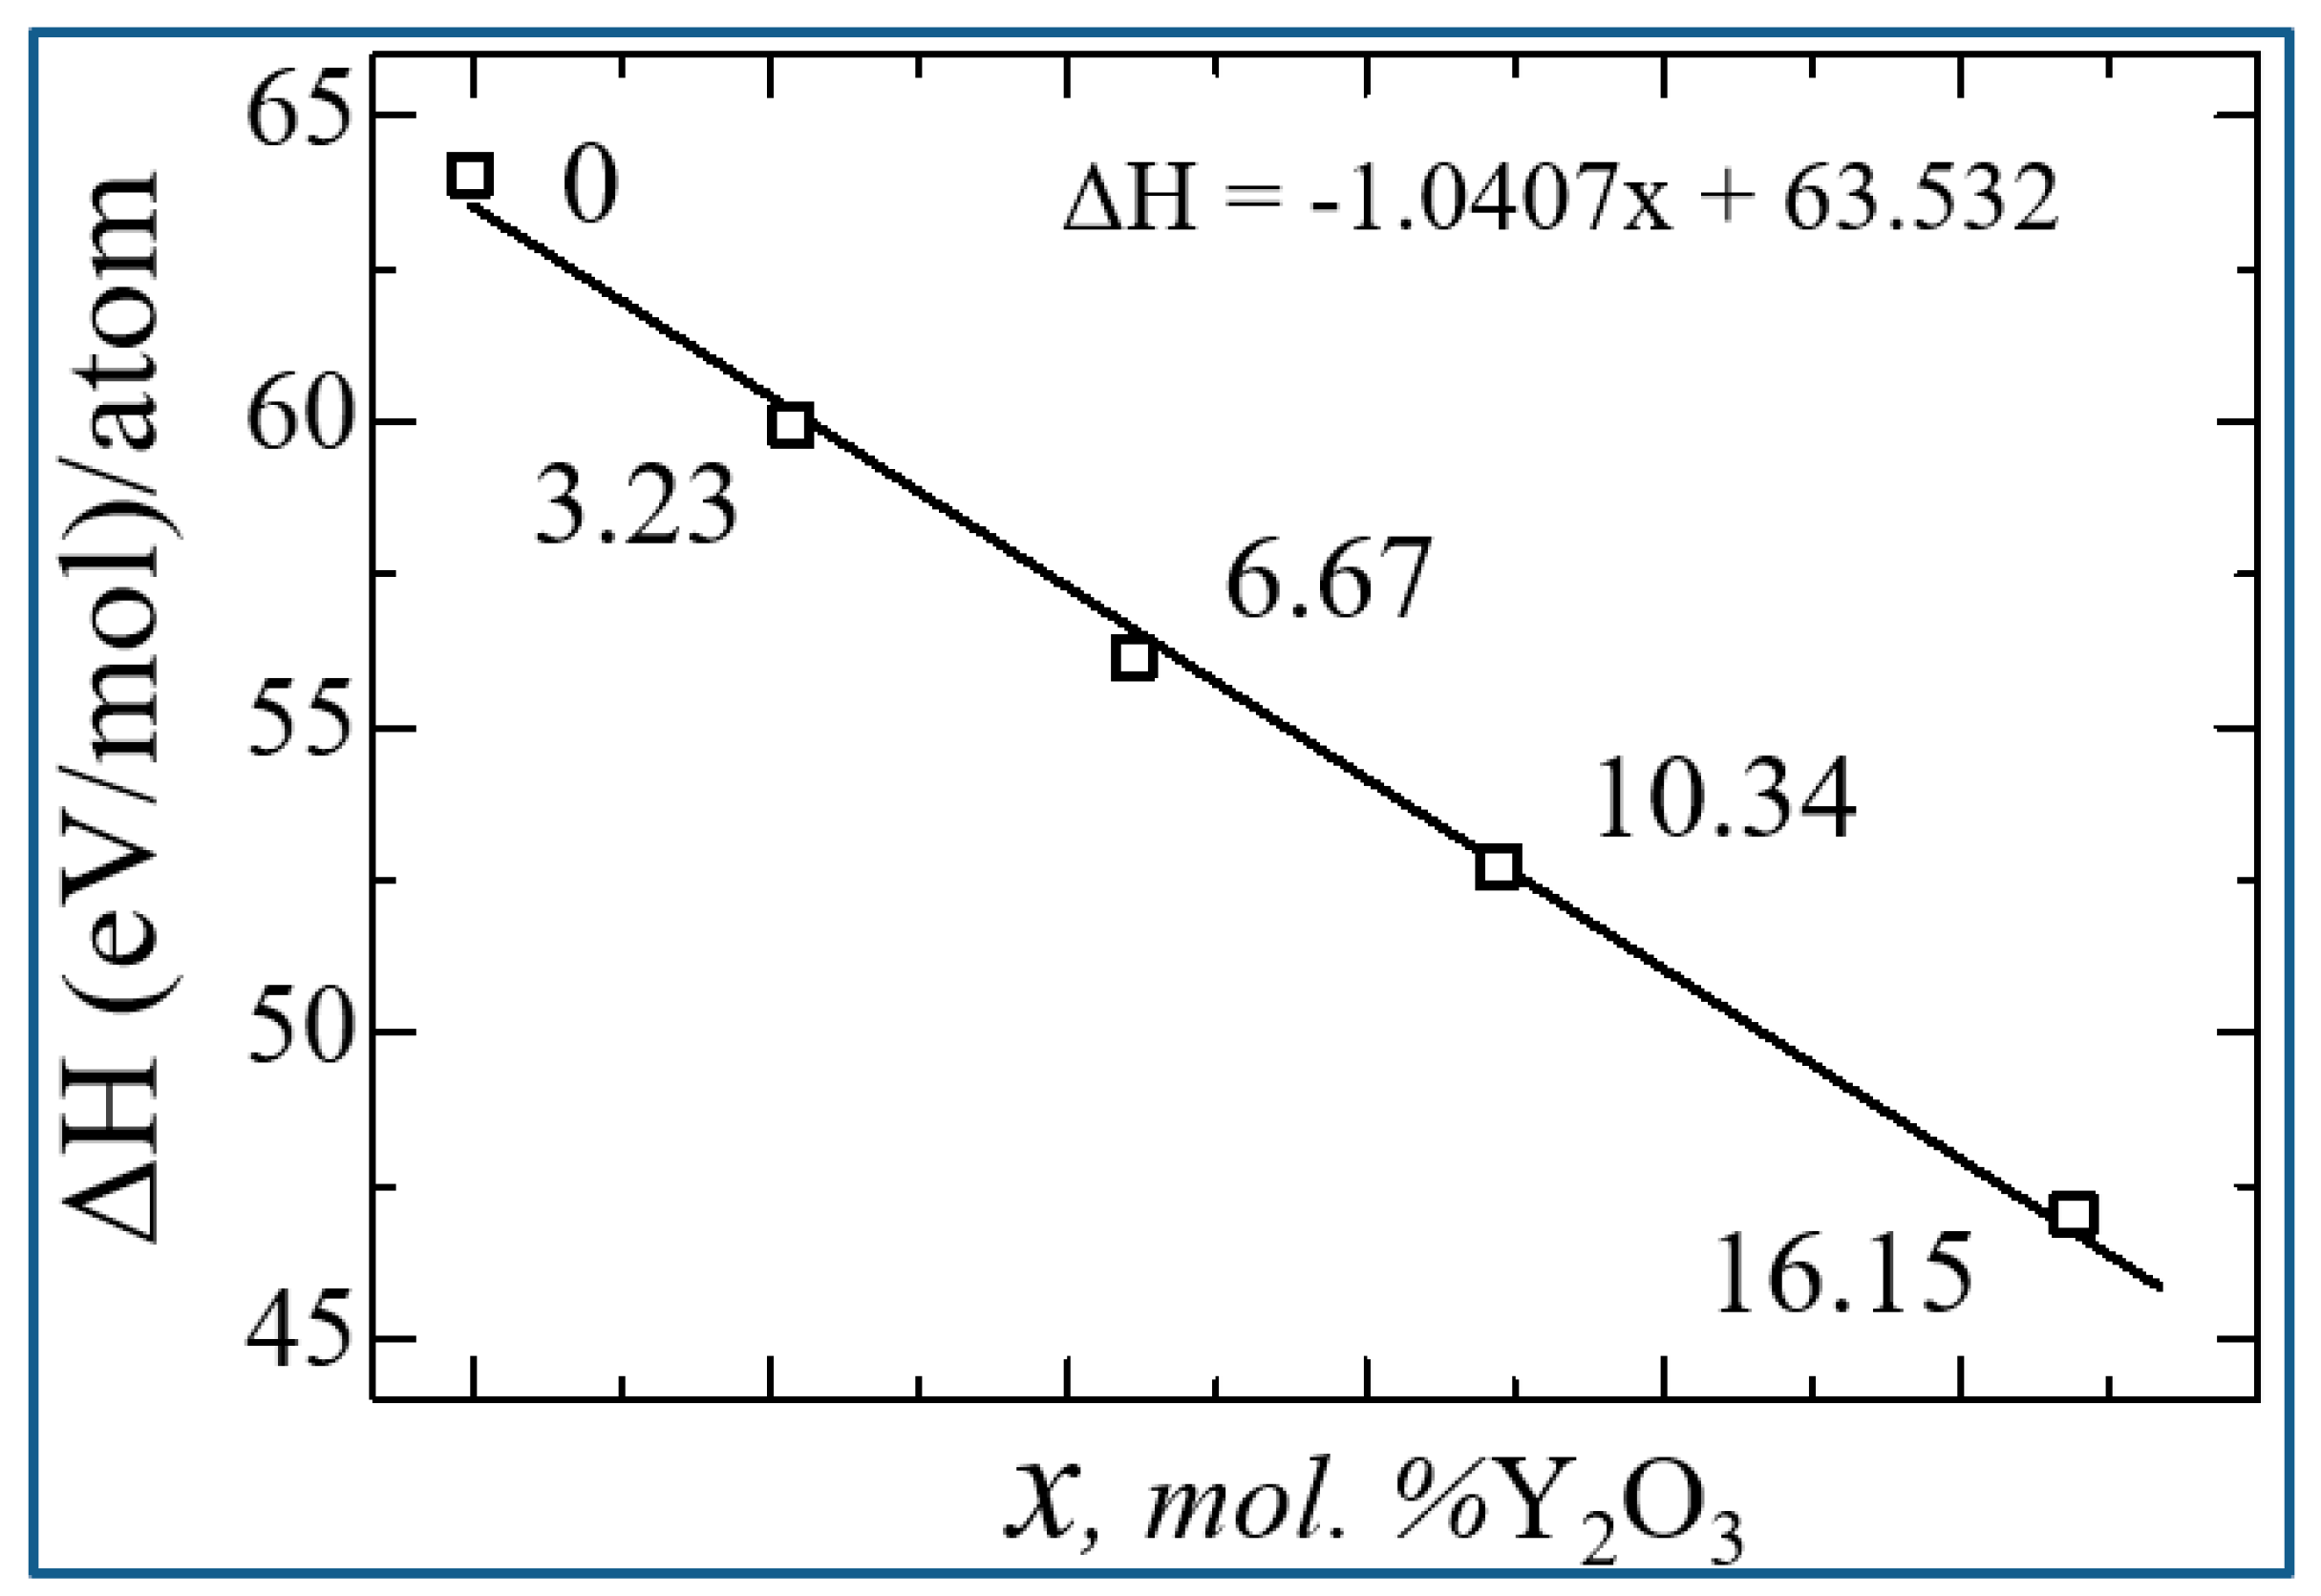
Figure 15.
Energy of formation (a) and energy of formation of an oxygen vacancy (b) for YSZ as a function of Y2O3 concentration.
Figure 15.
Energy of formation (a) and energy of formation of an oxygen vacancy (b) for YSZ as a function of Y2O3 concentration.
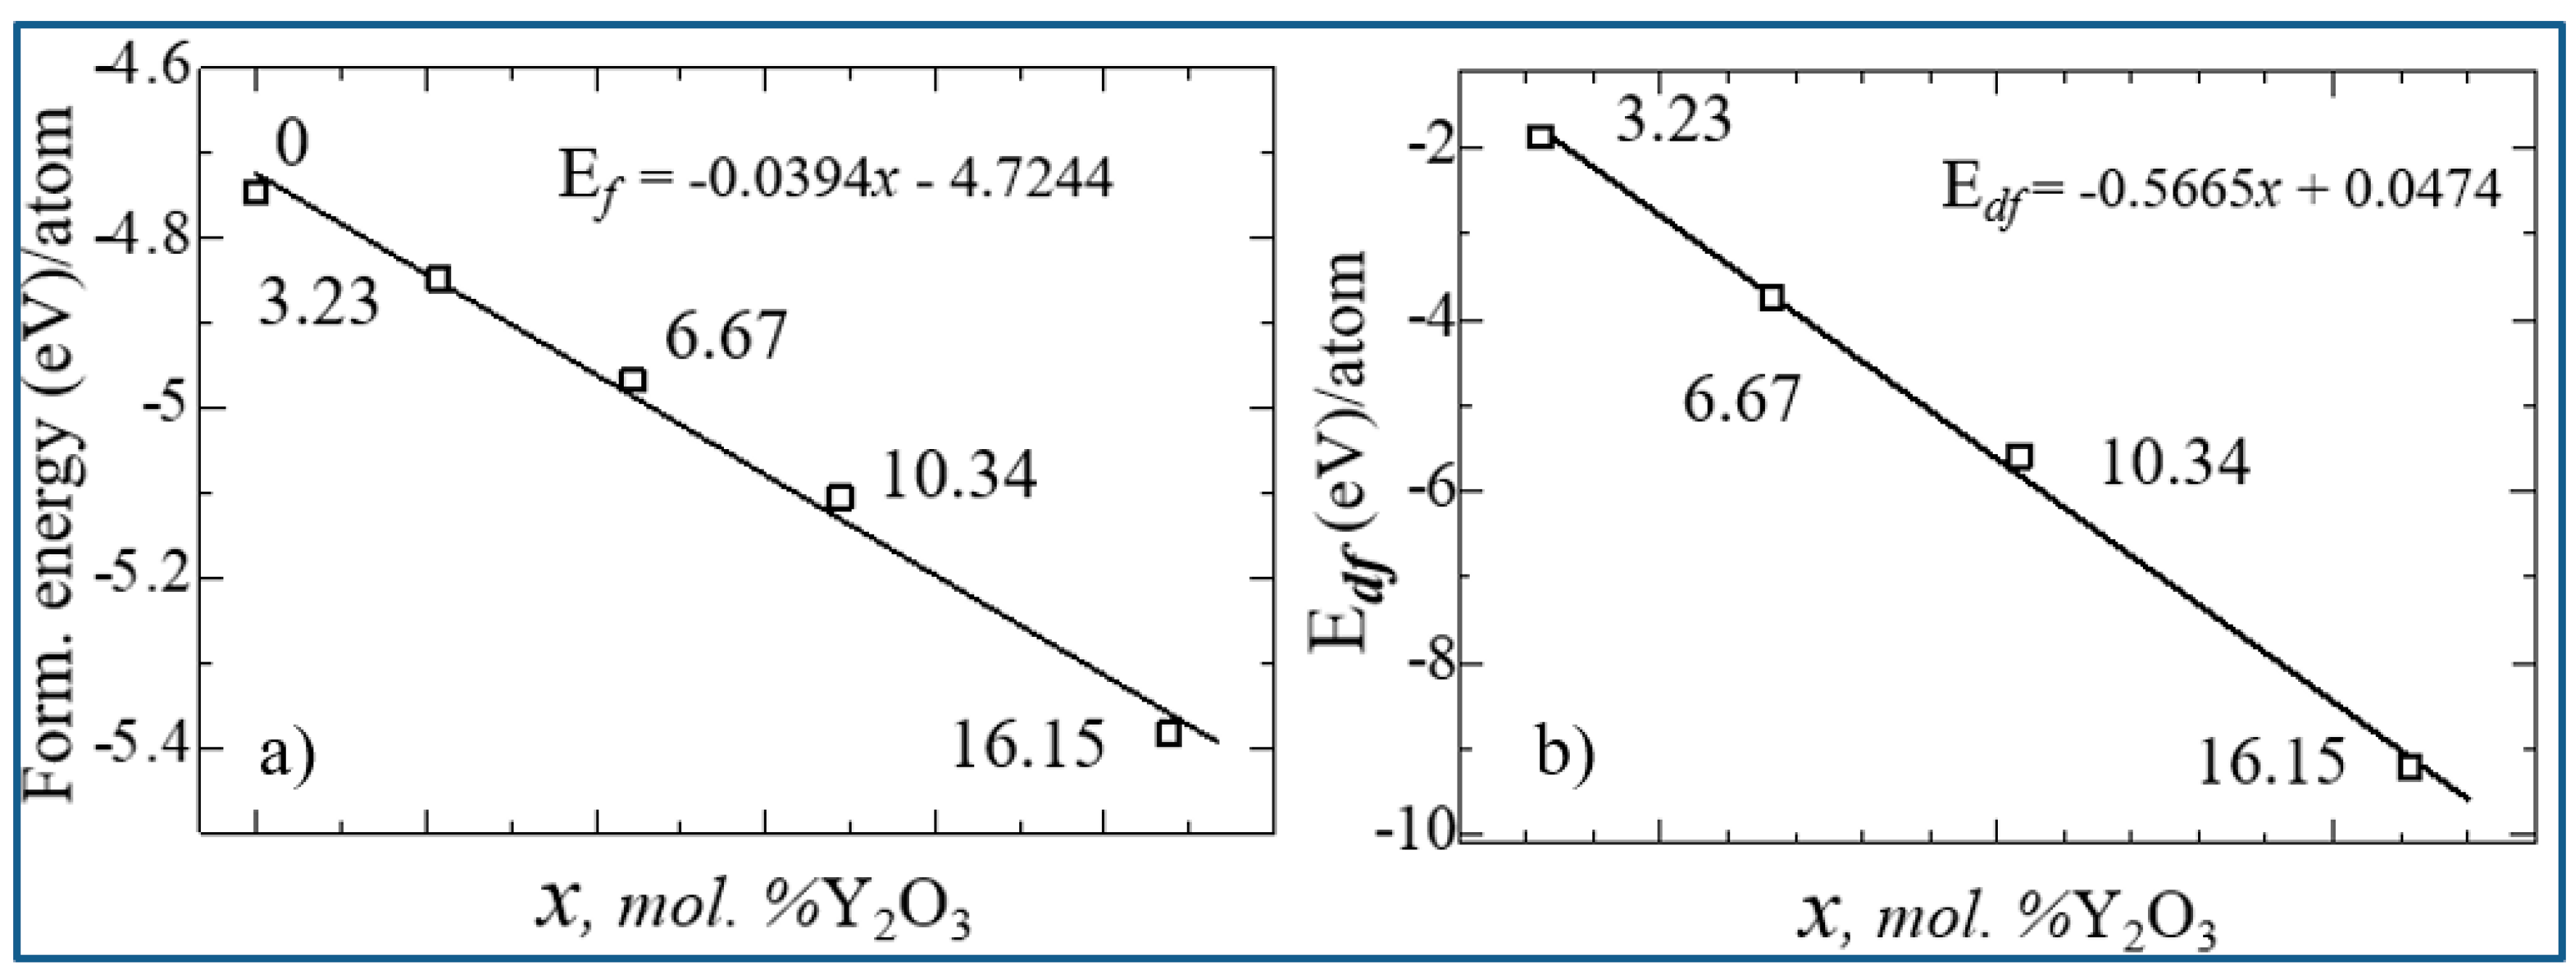
Figure 16.
Total electron density of states (TDOS) for ZrO2 doped with 3.23, 6.67, 10.34, and 16.15 mol% Y2O3.
Figure 16.
Total electron density of states (TDOS) for ZrO2 doped with 3.23, 6.67, 10.34, and 16.15 mol% Y2O3.
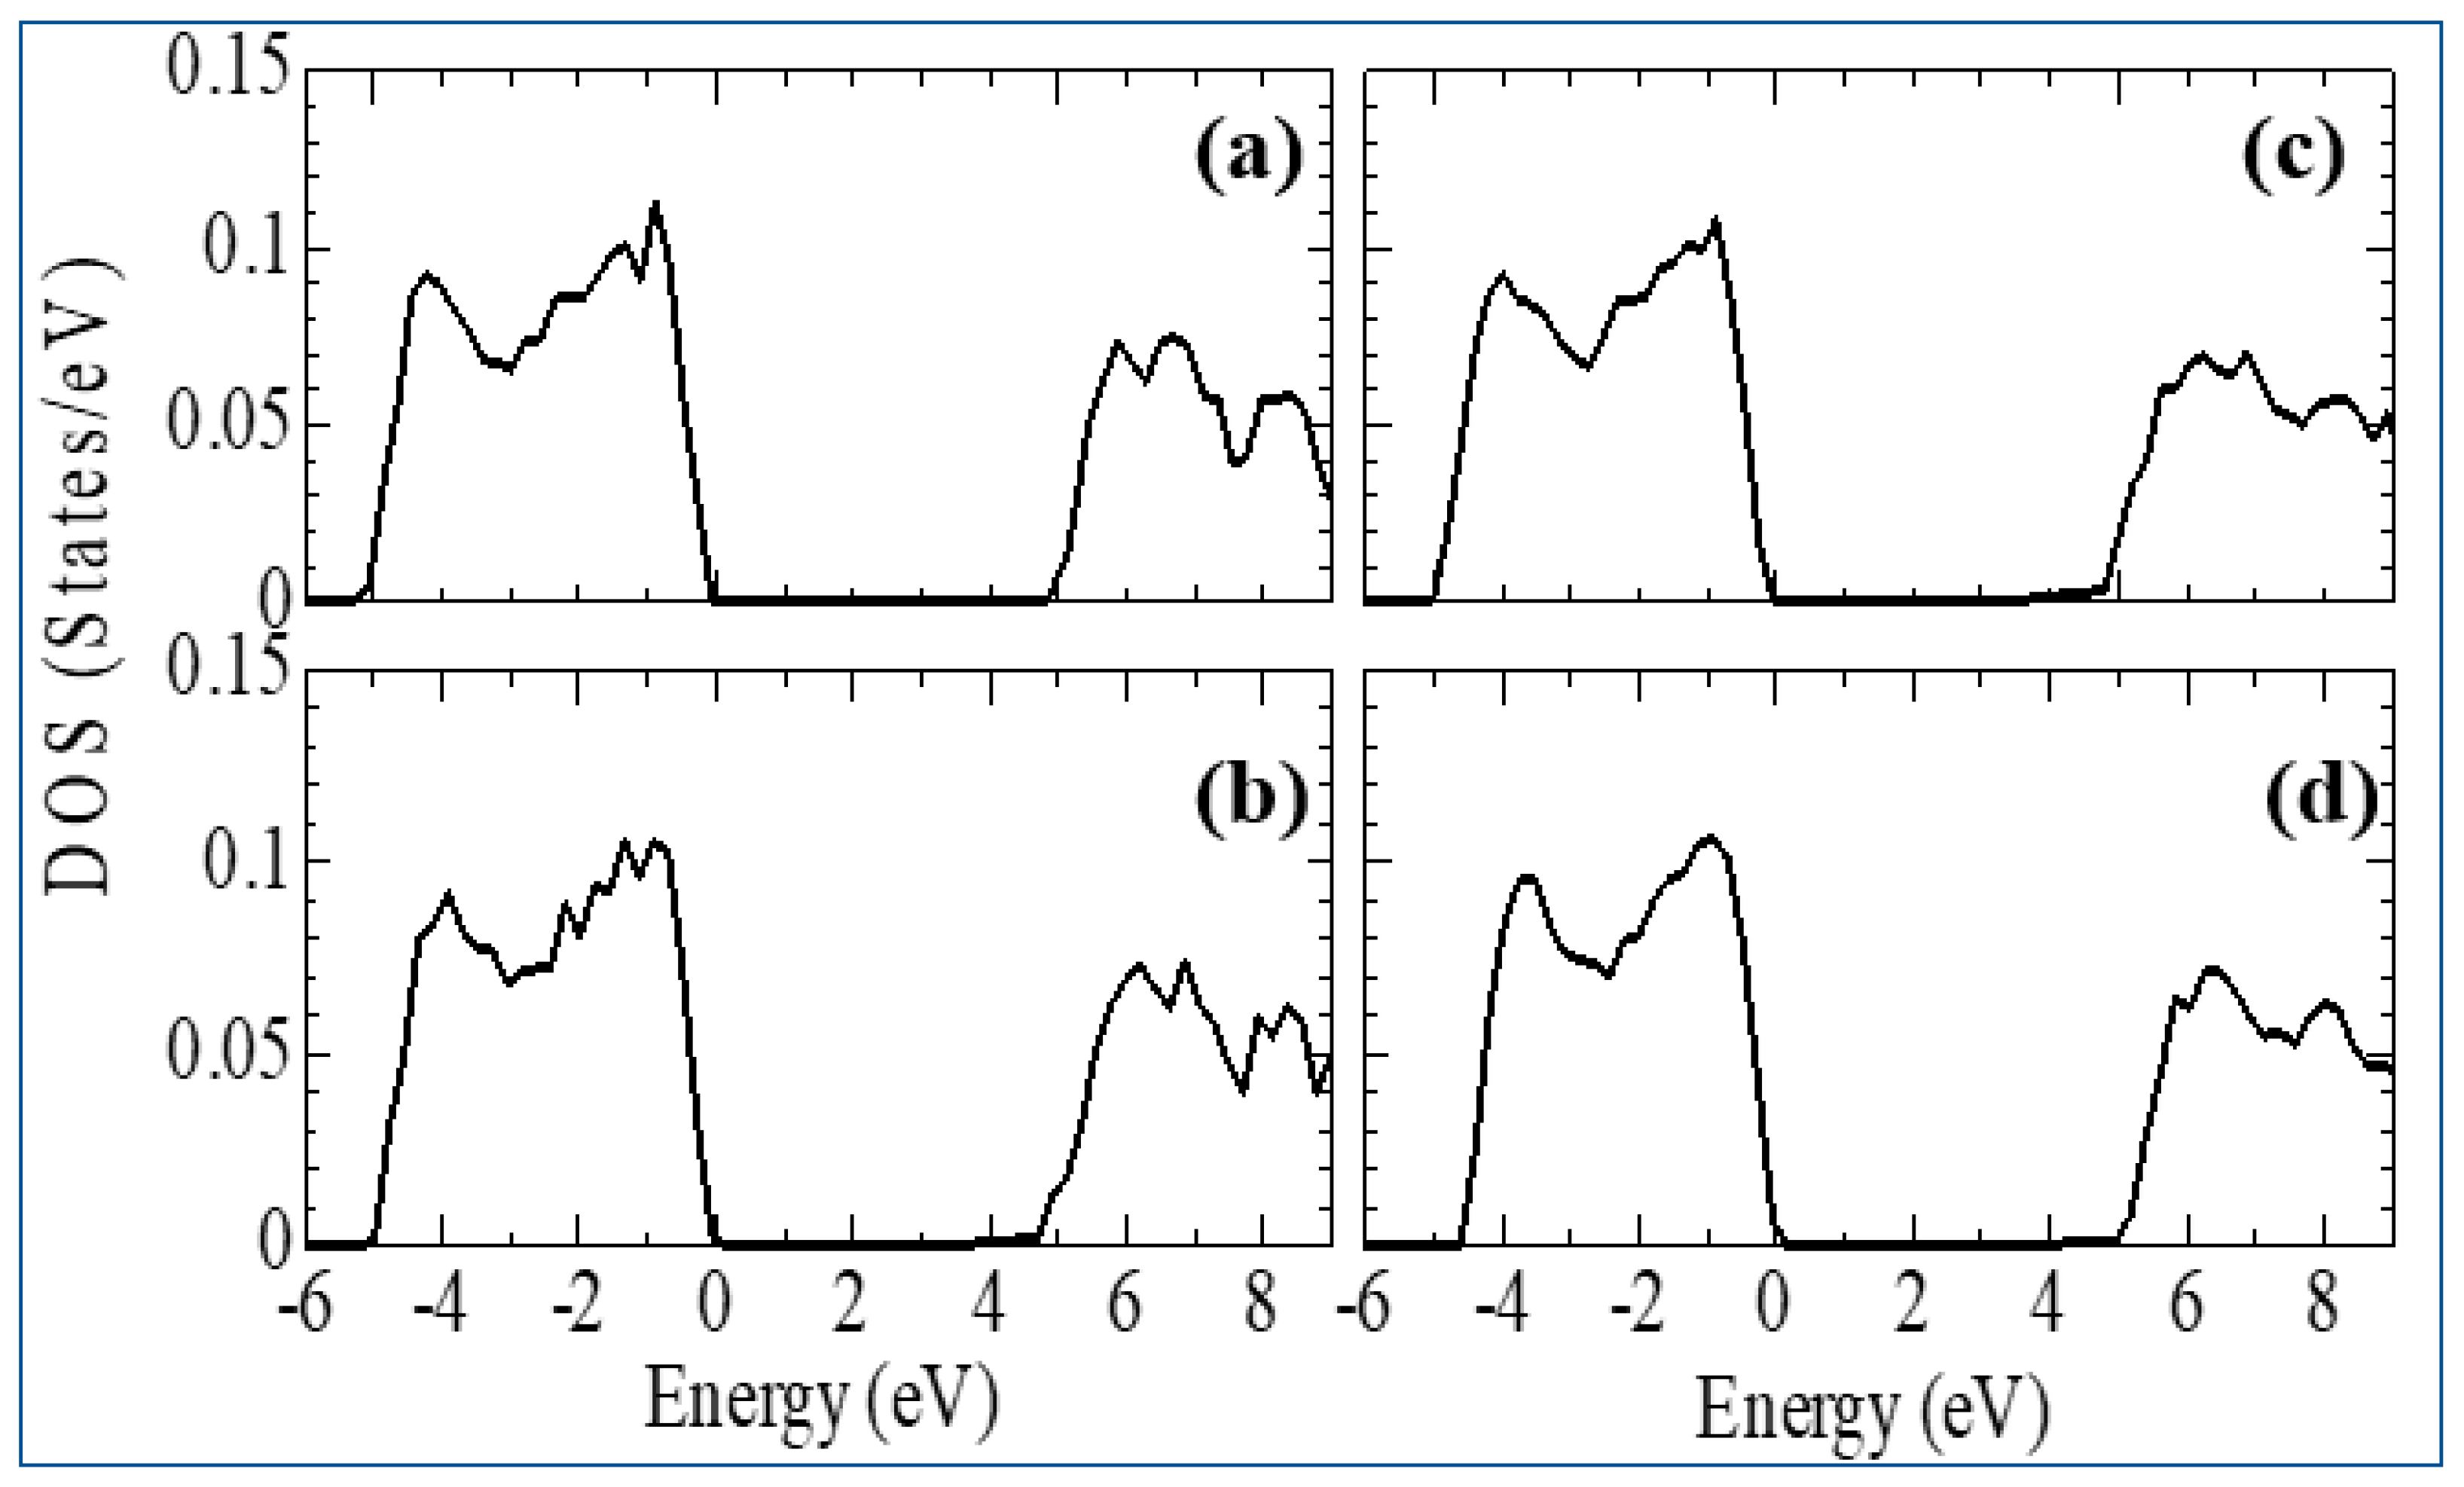
Figure 17.
Composite PDOS diagram demonstrating the main contributions of s-, p- and d-orbitals to the states forming the CB bottom for ZrO2 doped with 3.23, 6.67, 10.34 and 16.15 mol% Y2O3. Top of VB (green), scaled to zero.
Figure 17.
Composite PDOS diagram demonstrating the main contributions of s-, p- and d-orbitals to the states forming the CB bottom for ZrO2 doped with 3.23, 6.67, 10.34 and 16.15 mol% Y2O3. Top of VB (green), scaled to zero.

Figure 18.
Conduction (red) - and valence (green)-band change for ZrO2 doped with 3.23, 6.67, 10.34 and 16.15 mol% Y2O3. The position of the Fermi level corresponds to the maximum of the valence band at each of the sites.
Figure 18.
Conduction (red) - and valence (green)-band change for ZrO2 doped with 3.23, 6.67, 10.34 and 16.15 mol% Y2O3. The position of the Fermi level corresponds to the maximum of the valence band at each of the sites.
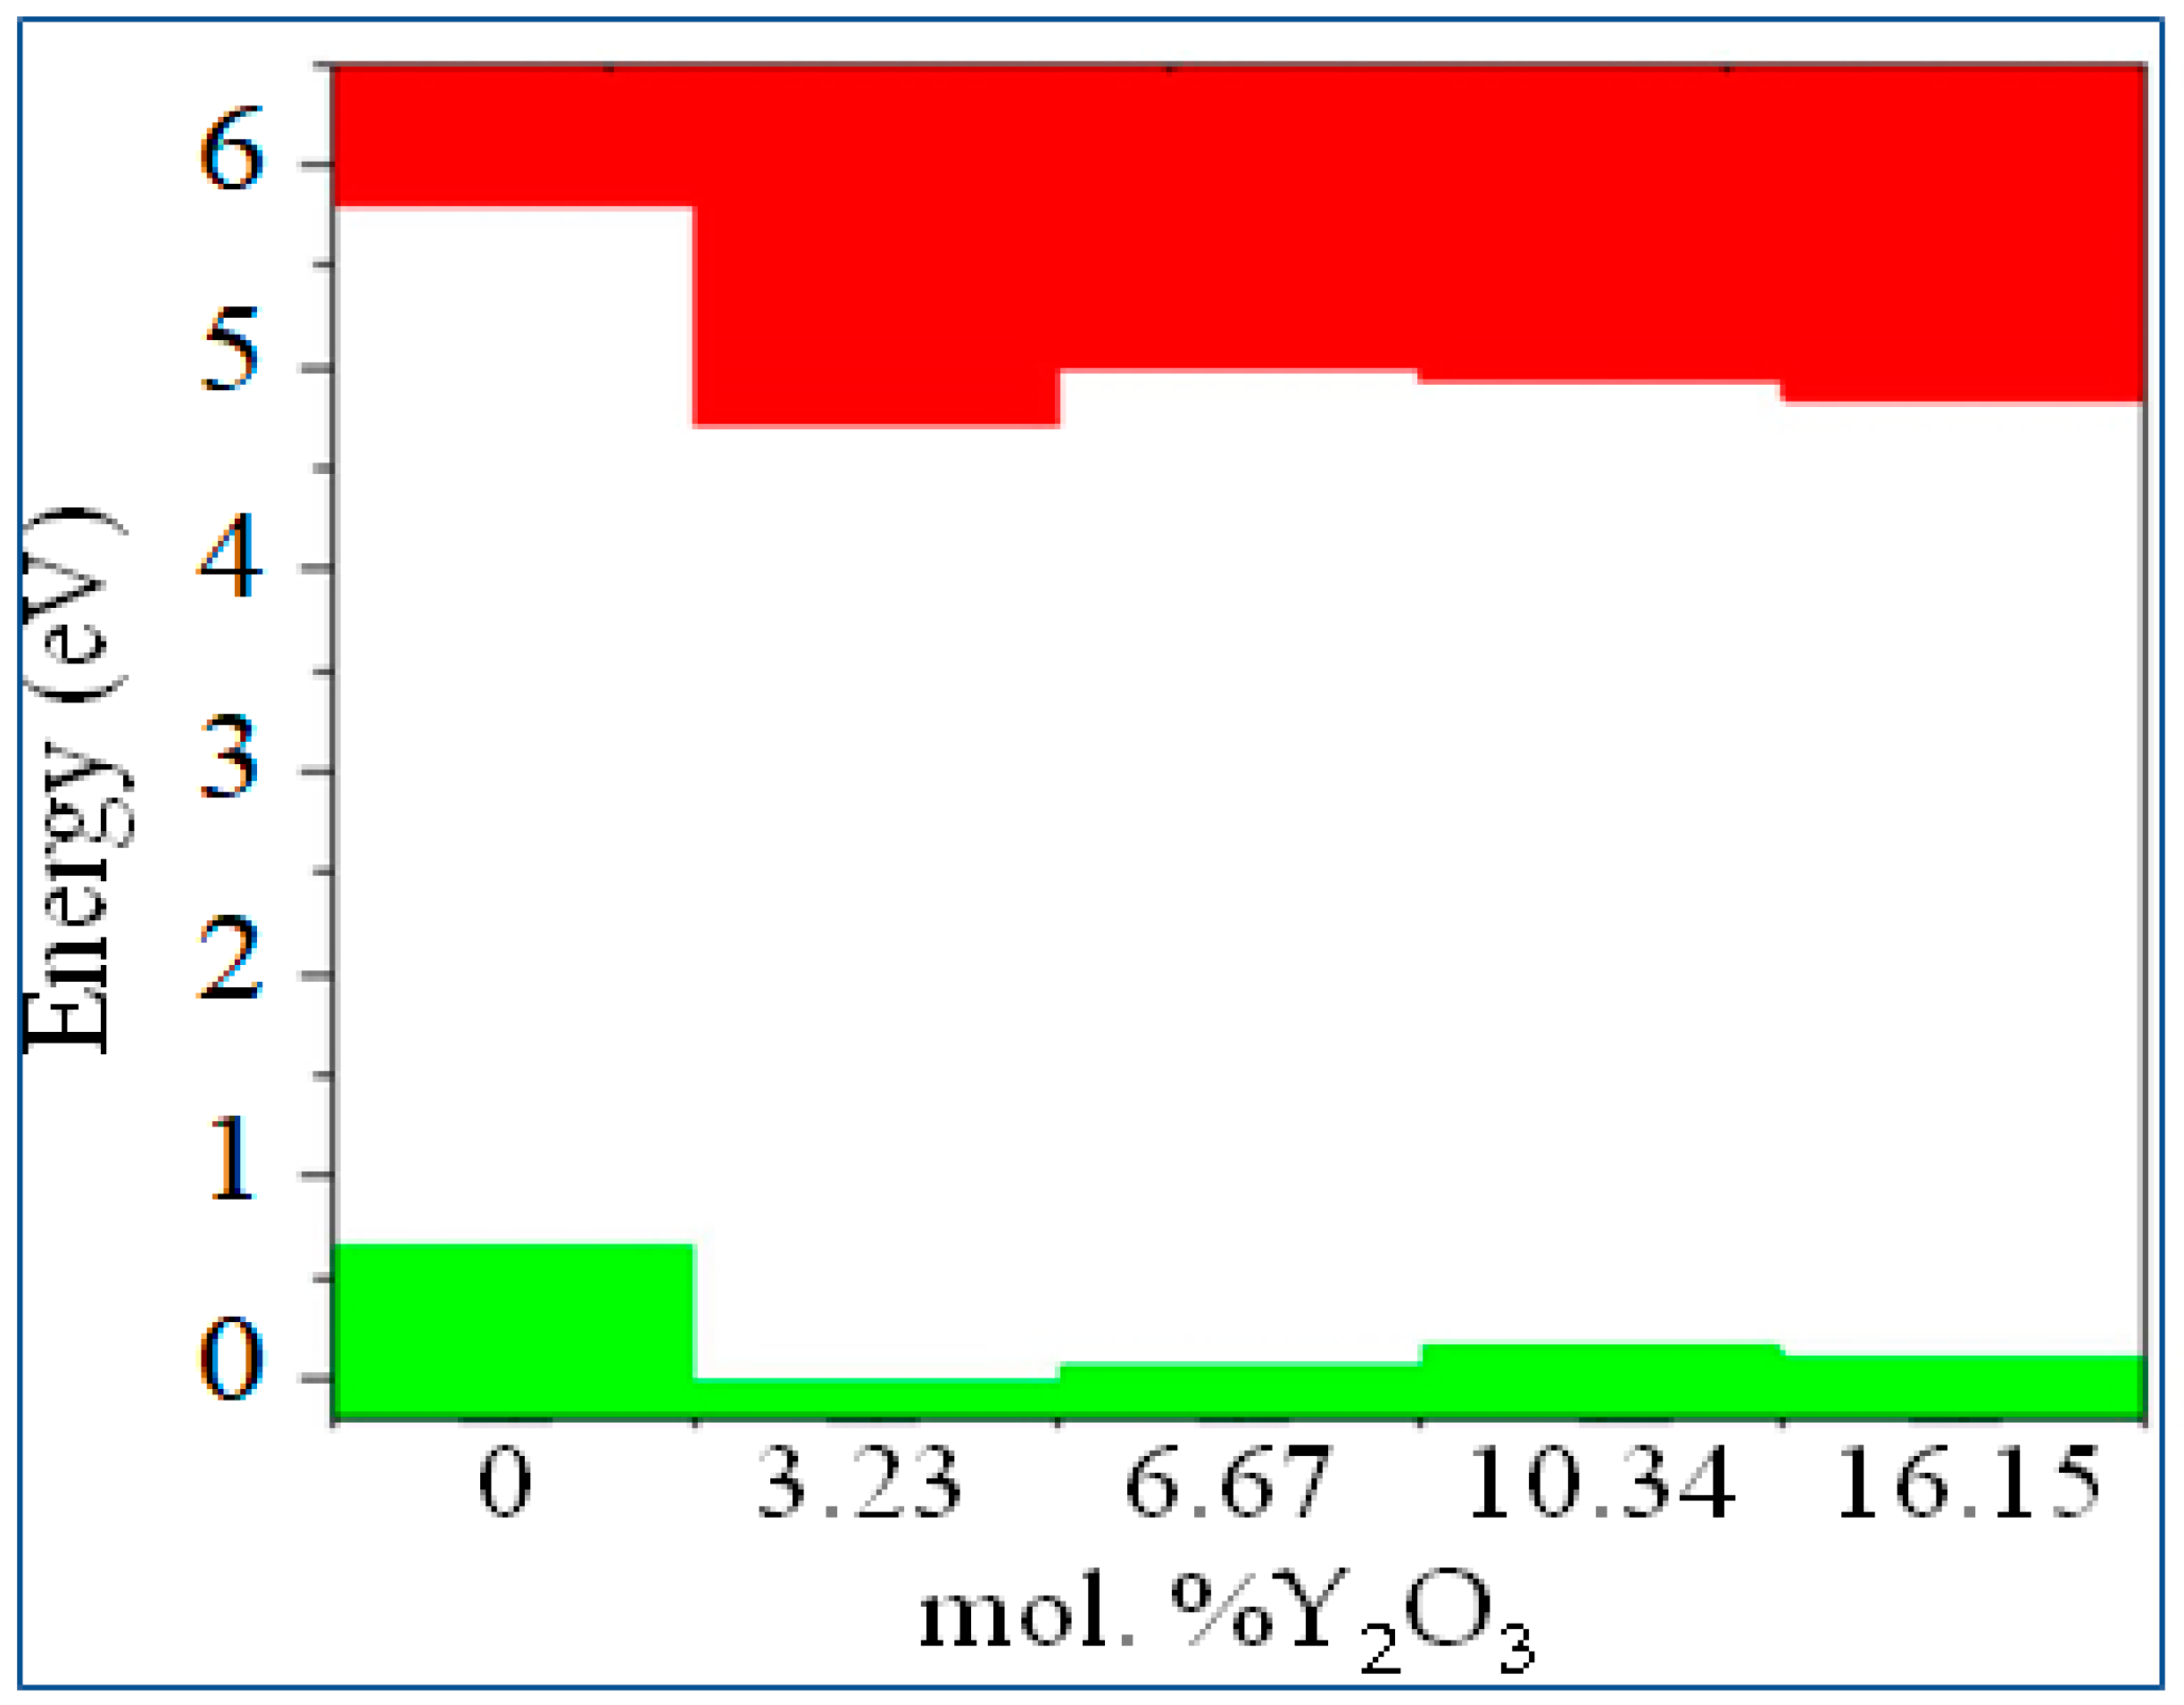

Table 1.
Number of Zr, Y, O ions and oxygen vacancy for various mol. % Y2O3.
| mol. %Y2O3 | Zr | Y | O | O vacancy | System |
| 0 | 32 | 0 | 64 | 0 | Zr32O64 |
| 3.23 | 30 | 2 | 63 | 1 | Zr30Y2O63 |
| 6.67 | 28 | 4 | 62 | 2 | Zr28Y4O62 |
| 10.35 | 26 | 6 | 61 | 3 | Zr26Y6O61 |
| 16.15 | 22 | 10 | 59 | 5 | Zr22Y10O59 |
Table 2.
Relaxed parameters of the ZrO2 phase (The calculated results are compared with experimental and previous theoretical results).
Table 2.
Relaxed parameters of the ZrO2 phase (The calculated results are compared with experimental and previous theoretical results).
| Lattice constants | This work | Exp. | ||
|---|---|---|---|---|
| GGA | SCAN | |||
| m-ZrO2 [P2_1/c] | a (Å) | 5.191 | 5.115 | 5.0950 [24] |
| b (Å) | 5.245 | 5.239 | 5.2116 [24] | |
| c (Å) | 5.202 | 5.304 | 5.3173 [24] | |
| β◦ | 99.639 | 99.110 | 99.230 [24] | |
| V (Å3) | 144.410 | 139.400 | 140.88 [24] | |
| t-ZrO2 [P4_2/nmc] | a=b (Å) | 3.593 | 3.622 | 3.6 4[25] |
| с (Å) | 5.193 | 5.275 | 5.27 [25] | |
| c/a | 1.445 | 1.456 | 1.45 [25] | |
| V (Å3) | 67.05 | 69.214 | 69.83 [25] | |
| dz | 0.012 | 0.013 | 0.046 [25] | |
| c-ZrO2 [Fm-3m] | a=b=c (Å) | 5.075 | 5.12 | 5.129 [26,27] |
| V(Å3) | 130.709 | 134.06 | 134.9 [26,27] | |
Table 3.
GGA- calculated total electronic energies of c-ZrO2, t-ZrO2, m-ZrO2 unit cells.
| System | Energy | ΔE |
| m-ZrO2 | -28.7947 | 0 |
| t-ZrO2 | -28.6885 | 0.106 |
| c-ZrO2 | -28.5865 | 0.201 |
Table 4.
Calculated and experimental band gap of c-ZrO2, t-ZrO2, m-ZrO2 in eV.
| System | This work | Experiment [30] | ||
| GGA | SCAN | HSE06 | ||
| m-ZrO2 | 3.9 | 3.8 | 5.288 | 5.78 |
| t-ZrO2 | 4.42 | 4.37 | 5.898 | 5.83 |
| c-ZrO2 | 4.03 | 3.93 | 5.140 | 6.10 |
Table 5.
Lattice parameters of 2x2x2 supercells of ZrO2 and YSZ at various Y2O3 concentrations.
| System | Lattice parameters | Phase | |||||
| a (Å) | b (Å) | c (Å) | α (◦) | β (◦) | γ (◦) | ||
| 0 | 10.23 | 10.478 | 10.608 | 90 | 99.64 | 90.00 | m - YSZ |
| 3.23 mol. %Y2O3 | 10.274 | 10.524 | 10.536 | 90.21 | 98.84 | 89.94 | m - YSZ |
| 6.67 mol. %Y2O3 | 10.512 | 10.544 | 10.603 | 89.90 | 90.12 | 89.62 | t - YSZ |
| 10.35 mol. %Y2O3 | 10.529 | 10.541 | 10.546 | 89.98 | 90.09 | 90.08 | t - YSZ |
| 16.15 mol. %Y2O3 | 10.540 | 10.541 | 10.543 | 90.08 | 90.00 | 90.02 | c - YSZ |
Table 6.
GGA-calculated values of enthalpy (ΔН) and formation energy (Еf) for ZrO2 and YSZ. Oxygen vacancy formation energy (Еdf) for YSZ.
Table 6.
GGA-calculated values of enthalpy (ΔН) and formation energy (Еf) for ZrO2 and YSZ. Oxygen vacancy formation energy (Еdf) for YSZ.
| System | ΔН | Еf | Еdf |
| 0 | 64.02917222 | -4.747216667 | 0 |
| 3.23 mol. %Y2O3 | 59.91124404 | -4.848422632 | -1.874577368 |
| 6.67 mol. %Y2O3 | 56.13271879 | -4.967857447 | -3.739875532 |
| 10.35 mol. %Y2O3 | 52.7041267 | -5.106527419 | -5.596013441 |
| 16.15 mol. %Y2O3 | 47.00229139 | -5.384704945 | -9.220196154 |
Disclaimer/Publisher’s Note: The statements, opinions and data contained in all publications are solely those of the individual author(s) and contributor(s) and not of MDPI and/or the editor(s). MDPI and/or the editor(s) disclaim responsibility for any injury to people or property resulting from any ideas, methods, instructions or products referred to in the content. |
© 2023 by the authors. Licensee MDPI, Basel, Switzerland. This article is an open access article distributed under the terms and conditions of the Creative Commons Attribution (CC BY) license (http://creativecommons.org/licenses/by/4.0/).
Copyright: This open access article is published under a Creative Commons CC BY 4.0 license, which permit the free download, distribution, and reuse, provided that the author and preprint are cited in any reuse.


