You are currently viewing a beta version of our website. If you spot anything unusual, kindly let us know.
Preprint
Article
Optimized Power Management Approach for Photovoltaic Systems with Hybrid Battery-Supercapacitor Storage
Altmetrics
Downloads
176
Views
52
Comments
0
A peer-reviewed article of this preprint also exists.
This version is not peer-reviewed
Abstract
The paper addresses the ongoing and continuous interest in photovoltaic energy systems (PESs). In this context, the study focuses on an isolated photovoltaic system with hybrid bat-tery-supercapacitor storage (HBSS). The integration of supercapacitors (SCs) in this system is of particular importance because of their high specific power density. In photovoltaic (PV) systems, multi-storage systems use two or more energy storage technologies to enhance system perfor-mance and flexibility. When batteries and supercapacitors are combined in a PV system, their benefits are maximized and offer a more reliable, efficient, and cost-effective energy storage op-tion. In addition, effective multi-storage power management in a PV system needs a solid grasp of the energy storage technologies, load power demand profiles, and the whole system architecture. In this work, battery-supercapacitor storage system (HBSS) is established by combining batteries and supercapacitors. The primary objective is to devise a novel management algorithm that ef-fectively controls the different power sources. The algorithm's purpose is to regulate the charge and discharge cycles of the HBSS, ensuring that the state of charge (SOC) of both batteries and supercapacitors remains within the desired range. The proposed management algorithm is de-signed to be simple, efficient, and light on computational resources. It efficiently handles the energy flow within the HBSS, optimizing the usage of both batteries and supercapacitors based on real-time conditions and energy demands. By maintaining the SOC of these energy storage components within the specified limits, the proposed method ensures their longevity and max-imizes their performance. Simulation results obtained from applying the management strategy are found to be satisfactory. These results show that the proposed algorithm maintains the SOC of batteries and supercapacitors within the desired range, leading to improved energy management and enhanced system efficiency.
Keywords:
Subject: Engineering - Electrical and Electronic Engineering
1. Introduction
In remote areas the adoption of renewable energy systems is rising [1--5]. In order to keep the source energy and the charge demand in an optimal power balance, the energy storage system is essential [6, 7]. In photovoltaic (PV) systems, energy storage is used to store excess solar energy produced during the day so that it can be used at a later time when the sun is not shining or when electricity demand is high. There are several types of energy storage technologies that can be used in photovoltaic (PV) systems, including batteries, supercapacitors, Flywheels, pumped hydroelectric storage, thermal energy storage and fuel cells. Batteries are the most widely used storage technology for PV systems, as they are relatively inexpensive and can be easily installed in residential and commercial settings. Supercapacitors, also known as ultracapacitors, store electrical energy as an electrostatic charge. They have a high-power density, meaning they can charge and discharge quickly, making them well-suited for applications that require high power output. While supercapacitors have some advantages over batteries, such as faster charging times and longer lifetimes under certain conditions; they also have some limitations that may make them less practical for some PV system applications. The different drawbacks are low energy density, high cost, limited lifespan, voltage limitations and leakage current [8, 9].
The best combination will be determined by the system requirements and the resources at hand. It will be determined by various criteria, including the system's precise requirements, the available budget, and the tradeoffs between the advantages and downsides of each technology. The combination of batteries and supercapacitors has various advantages. Batteries can store significant quantities of energy for extended periods of time, but supercapacitors may discharge fast and give high-power bursts for brief periods of time. This combination has the potential to assist balance the load on the PV system, particularly during high energy demand periods. When a PV system produces extra energy, the batteries may be charged and when power demand is high, the stored energy in the batteries can be released. However, Batteries have a limited discharge rate and are susceptible to voltage loss during high-power demands. Supercapacitors, however, discharge fast, giving extra power to meet high power demands, and they can also maintain a constant voltage output during periods of high-power demand. Combining batteries and supercapacitors has the added benefit of extending the life span of both power sources. Supercapacitors can absorb high power bursts, lowering battery burden and reducing battery cycling. This helps preventing battery damage, increasing their life span. Supercapacitors are more costly than batteries, but they are capable of reducing the capacity required for the battery system. However, there are some potential disadvantages, such as higher costs, complex control systems, maintenance issues, safety concerns, and limited scalability.
Power management of multi-storage in a PV system is a crucial aspect to ensure that the different energy storage technologies work together effectively and efficiently. Additionally, continuous monitoring of the SOC ensures that the storage systems operate within their optimal range, by ensuring optimized utilization and maximum system efficiency. Power management of photovoltaic (PV) systems with multi storage technologies has been the subject of several research papers [10-19]. The power management of PV systems with multi storage technologies involves controlling the power flow between different energy storage technologies, such as batteries and supercapacitors, while also ensuring that the load is supplied. The goal is to optimize the use of each storage technology and maximize the overall system efficiency.
The purpose of this study is to introduce a management power control which permits the control of the charge and discharge process of storage. The application is demonstrated in Berjaya an area with a significant potential for solar irradiation, using four different day patterns. The validity and usefulness of the suggested power management approach are shown in this study through simulation results. On a real-time simulator (RT Lab), a number of experimental tests were carried out to assess the suggested control algorithms.
2. Biometrical study on storage in renewable energies
The integration of biometrics in renewable energy's storage of freshen handed security, improved use reexperience, and increased efficiency in managing renewable energy systems. A research has been made based on different keywords (energy storage, renewable energy, batteries, photovoltaic, Figure 1 visually depicts the network of relationships between terms, represented by lines connecting one term to another. This figure illustrates the clusters associated with different aspects of renewable energy research. Notably, recent developments in the field are prominently related to storage systems, photovoltaic, hybrid renewable energies, and electric vehicle charging. This figure can be a reference for future researchers to identify relevant themes within the renewable energy domain. The findings reveal a total of 741 items related to renewable energy. These items are organized into six distinct clusters as follows:
- Cluster 1 (Red) - Contains 234 items.
- Cluster 2 (Green) - Contains 192 items.
- Cluster 3 (Blue) - Contains 158 items.
- Cluster 4 (Yellow) - Contains 82 items.
- Cluster 5 (Purple) - Contains 65 items.
- Cluster 6 (Cyan) - Contains 11 items.
Each cluster represents a group of related terms, and a colored circle is assigned to each term within the clusters. The size of the circles is proportional to the frequency of occurrence of the terms in the titles and abstracts. Larger circles and letters indicate more frequent appearances of the terms.
- 3.
- Proposed PV hybridstoragesystem
PV panels, a DC/DC converter, and (batteries/supercapacitors)storage system are all components of the system under study (Figure 1). Long-term energy storage is possible with battery technology. Supercapacitors can quickly absorb current variation, lowering the risk to the batteries. The voltage of the solar panels can be raised by connecting a boost converter to them. Due to the connection of supercapacitors and batteries to the DC bus, electrical power from the PV panels, batteries, and supercapacitors can all be used to power the load simultaneously.
3. CONTROLLER DESIGN
3.1. Photovoltaic pannel modeling
The electrical current is [6,20-25]:

Where: Iph, Id and IRsh are respectively photo-current, diode-current and shunt resistance current.
Various tests (Experimental and simulations) have been performed in order to identify the different PV panel characteristics (Figure 3) under threedistinct solar irradiation and ambient temperatre levels: low, médium and high as point edout in Table 1. The established experimental bench is high lighted in Figure 4
3.2. Battery modeling
The following model (Figure 5) has been employed in our work using various voltage and chargestateequations [1,7].
In this study, a 12 V-100 Ah battery is used as a storage device as shown in Figure 6. Identification is performed to determine the battery impedance (ZBatt).
The phase shift of these two signals gives the impedance ZBatt. And then internal resistance RBatt, and the capacitive reactance XBatt
With: ƒ the frequency, (Hz)
The different calculated results are:
RBatt=0.795 Ω, XBatt=0.07 Ω and CBatt=44.96 mF
All of these identified variables were included in simulation models to establish realistic mathematical models that were as near to the experiment as possible.Figure 7 shows the different curves obtained while proceeding to the identification of the battery. It shows that there exsit a phase shift of 3 degrees between voltage and current (voltage is lagging)
3.3. Supercapacacitors model
Different models for simulating a supercapacitor (SC) have been putforth in theliterature [26 - 36]. The corresponding electric circuit with two RC branches (Figure 8) is the model utilized in our research.
There are two branches to it. The supercapacitor's immediate behavior during quick charge and discharge cycles with in seconds is defined by the R1C1 branch [8, 9]. The slugg is hbranch is the second branch R2C2. The model [8] is described by the equations below:

The SC's pack voltage and current are represented as Usc and Isc, respectively. The fundamental supercapacitor voltage and current are Vsc and isc, respectively.
The secondary capacity C2's secondary voltage V2 is determined by:

Q2 is the instantaneous charge of C2, we have:

The current i1 in the main capacitor C1 is given as:

There are threemain techniques to characterize a supercapacitor as listed in Table 3 shown below:
Galvanostatic charge-discharge cycling, potentiation charge-discharge cycling, and constant current charge-discharge cycling are just a few of the methods that can be used to describe supercapacitors. The exact properties of the supercapacitor being tested and the data needed for the application determine the technique to use. Charge-discharge cycling was employed in this study to evaluate the supercapacitor (Figure 9). Table 4 displays the various supercapacitor's researched parameters.
During charge and for a current of 10A, we obtain the following response (Figure 10). The resistance R1 is the cause of the drop in the load voltage at the initial moment. C1 is determined directly from the constant current load characteristic of the cell: 𝐶1 = I/((ΔV)/(Δt))=10/((20-2)/((300-10)))=161F.
The different identified parameters are given in Table 5.
Proposed Power management control
Two DC/DC convertersthat are set up as buck-boostconverters are employedbythepowermanagementsystem, whichalsoemploys a powerflow control method. Tomakesurethesystemrunssmoothly and effectively, theseconvertersregulatetheflowofpower. These are the load powerrequirements:
Where ∆P is the powerd emand variation
It is worth mentioning that the proposed energy management strategy has eleven different modes and this increases the HESS system reliability and reduces the stress applied on the batteries.
5. Simulation results
The studied system is simulated under MATLAB/Simulink to verify the suggested control and energy management technique. The simulation's findings have been presented and analyzed. Themeasuredprofilesof solar irradiationand ambienttemperatureare respectivelygiven in Figure 12 and Figure 13. DC bus voltagetrackswellitsreference (Figure 14).Voltage battery and supercapacitor are represented in Figure 15.
Itisshown in Figure 16, battery SOC ismaintainedbetween 82.85%and 90% whilesupercapacitor SOC varies between 58.05and 90 %.Figure 17 shown below points out the battery and supercapacitor currents. The different resulting modes are given in the Figure 18. The battery, supercapacitor and the PV powers are simultaneously depicted in Figure 19. The power per day of all power sources corresponding to four distinct days are shown in Figure 20. The reference load power and the sum of power developed by all the power sources are respectively shown in Figure 21. The zoom of this last mentioned figure for four distinct days is shown in Figure 22.
6. Real-Time simulation
On a real-time simulator (RT Lab), a number of experimental tests were carried out to assess the suggested control algorithms. The system parameters remained the same as those used in the MATLAB/Simulink numerical simulation. A host PC, a real-time digital simulator (OP5700), an HIL controller, an OP8660 data collection interface, and a digital oscilloscope make up the real-time simulation bench (Figure 23).
Figure 24 shows the different obtained modes when the energy management strategy is run using the RT LAB real time simulation platform. The scheduled modes from 1 to 11 are highlighted to demonstrate the efficacy of the suggested management.
Battery and supercapacitorvoltagesand theircorresponding zooms are highlighted in Figure 25. TheSOCofbothsupercapacitor and battery are shown in Figure 26. The zoom in thesame figure confirmsthattheSOCofthepreviosulymentionnedpowersourcesiskeptwithinsafelimitsduringallthesimulationperiod.
The battery and supercapacitor currents are shown in Figure 27. It can be seen that the battery is used during low and medium power demands. However, during fast and peak load demands, the supercapacitor is used ecause of its rapid transient dynamics.
Figure 28 shows the reference DC bus voltage, its reference and a zoomthe aforementioned quantity. It can be seen clearly that VDCfollows precisely its reference. Note also that the voltage ripple band is small and tolerable.
The power developed by each energy source is shown separately in Figure 29. As shown in Figure 30, the load power equals the developed power. Out of Figure 31, one can notice that the hybrid energy storage system produces a power that is equivalent to the total demand with a little excess as illustrated in the different subfigures of Figure 31 illustrated below:
5. Conclusion
This paper discusses an energy management strategy for multi storage (Battery/SC) applied in photovoltaic system has been proposed. The used control technique is based on current regulation of two energy sourcesthrought the use ofproportional integral (PI)regulators. Thefindingswereverifiedbysimulationwith MATLAB/Simulink, and theywerealsoputtothe test in real-time withthe RT LAB simulationplatform.This means that the control used is efficient and allows the flow of energy appropriately and this ensure good and optimal system operation. The power management techniques covered in this paper enable the system to operate as effectively as possible with high photovoltaic system performance, regardless of the weather conditions.As a further work, it is planned to apply intelligent control methods to extend the lifespan of energy sources while ensuring their efficient and optimal utilization.
Funding
This work is funded by the Deanship of Scientific Research, Taif University.
Acknowledgments
The researchers would like to acknowledge the Deanship of Scientific Research, Taif University for funding this work.
Conflicts of Interest
The authors declare no conflict of interest.
References
- Amrouche, S.O.; Rekioua, D.; Rekioua, T.; Bacha, S. Overview of energy storage in renewable energy systems. International Journal of Hydrogen Energy 2016, 41, 20914–20927. [Google Scholar] [CrossRef]
- Kamarzaman, N.A.; Tan, C.W. A comprehensive review of maximum power point tracking algorithms for photovoltaic systems. Renewable and Sustainable Energy Reviews 2014, 37, 585–598. [Google Scholar] [CrossRef]
- Elgendy, J.-M.A.; Zahawi, B.; Atkinson, D.J. Assessment of Perturb and Observe MPPT Algorithm Implementation Techniques for PV Pumping Applications. IEEE Transactions on Sustainable Energy 2012, 3, 21–33. [Google Scholar] [CrossRef]
- Rekioua, D. Hybrid Renewable Energy Systems Overview. Green Energy and Technology 2020, 1–37. [Google Scholar]
- Attia, H. Fuzzy Logic Controller Effectiveness Evaluation through Comparative Memberships for Photovoltaic Maximum Power Point Tracking Function. International Journal of Power Electronics and Drive Systems (IJPEDS) 2018, 9, 1147–1156. [Google Scholar] [CrossRef]
- Rekioua, D.; Matagne, E. Optimization of Photovoltaic Power Systems, Modelization, Simulation and Control. 2012, Edition Springer.
- Lalouni, S.; Rekioua, D. Optimal control of a grid connected photovoltaic system with constant switching frequency. Energy Procedia 36, 189–199. [CrossRef]
- Oubelaid, A.; Taib, N.; Rekioua, T.; Bajaj, M.; Yadav, A.; Shouran, M.; Kamel, S. Secure Power Management Strategy for Direct Torque Controlled Fuel cell/Supercapacitor Electric Vehicles. Frontiers in Energy Research 1425. [CrossRef]
- Oubelaid, A.; Alharbi, H.; Humayd, A.S.B.; Taib, N.; Rekioua, T.; Ghoneim, S.S.M. Fuzzy-Energy-Management-Based Intelligent Direct Torque Control for a Battery—Supercapacitor Electric Vehicle. Sustainability 2022, 14, 8407. [Google Scholar] [CrossRef]
- Kumar, R.N. Energy Management system for Hybrid RES with Hybrid Cascaded Multilevel inverter. International Journal of Electrical and Computer Engineering (IJECE) 2014, 4, 24–30. [Google Scholar] [CrossRef]
- Dursun, E.; Kilic, O. Comparative evaluation of different power management strategies of a stand-alone PV/Wind/PEMFC hybrid power system. Electrical Power and Energy Systems 2012, 34, 81–89. [Google Scholar] [CrossRef]
- Bratcu, A.I.; Munteanu, I.; Bacha, S.; Raison, B. Maximum power point tracking of grid-connected photovoltaic arrays by using extremum seeking control. Journal of Control Engineering and Applied Informatics 2008, 10, 3–12. [Google Scholar]
- Mebarki, N.; Rekioua, T.; Mokrani, Z.; Rekioua, D. Supervisor control for stand-alone photovoltaic/ hydrogen/ battery bank system to supply energy to an electric vehicle. International Journal of Hydrogen Energy 2015, 40, 13777–13788. [Google Scholar] [CrossRef]
- Belaid, S.; Rekioua, D.; Oubelaid, A.; Ziane, D.; Rekioua, T. A power management control and optimization of a wind turbine with battery storage system. Journal of Energy Storage 45, 103613. [CrossRef]
- Singh, S.N.; Snehlata, N. Intelligent home energy management by fuzzy adaptive control model for solar (PV)-grid/dg power system in india. International Journal of Power Control Signal and Computation (IJPCSC) 2011, 2, 61–66. [Google Scholar]
- Hajizadeh, A.; Golkar, M.A. Intelligent power management strategy of hybrid distributed generation system. Electrical Power and Energy Systems 2007, 29, 783–795. [Google Scholar] [CrossRef]
- Rekioua, D.; Rekioua, T. , DSP-controlled direct torque control of induction machines based on modulated hysteresis control. Proceedings of the International Conference on Microelectronics, 2009, 5418603, 378–381. [Google Scholar]
- Sumarmad, K.A.A.; Sulaiman, N.; Wahab, N.I.A.; Hizam, H. Microgrid Energy Management, System Based on Fuzzy Logic an. d Monitoring Platform for Data Analysis. Energies 2022, 15, 4125. [Google Scholar]
- Rekioua, D. Power Electronics in Hybrid Renewable Energies Systems. Green Energy and Technology 2020, 39–77. [Google Scholar]
- Mohammedi, A.; Rekioua, D.; Rekioua, T.; Bacha, S. Valve Regulated Lead Acid battery behavior in a renewable energy system under an ideal Mediterranean climate. Int Journal Hydrogen Energy 2016, 41, 20928–20938. [Google Scholar] [CrossRef]
- Soulatiantork, P. Performance comparison of a two PV module experimental setup using a modified MPPT algorithm under real outdoor conditions. Solar Energy 2018, 169, 401–410. [Google Scholar] [CrossRef]
- Rekioua, D.; Matagne, E. Modeling of solar irradiance and cells In: Optimization of Photovoltaic Power Systems. Green Energy and Technology. Springer, London. 2012.
- Smida, M.B.; Sakly, A. Fuzzy logic control of a hybrid renewable energy system: A comparative study. Wind Engineering 2021, 45, 793–806. [Google Scholar] [CrossRef]
- Rekioua, D. , Energy Management for PV Installations. Advances in Renewable Energies and Power Technologies 2018, 1, 349–369. [Google Scholar]
- Guerra, M.I.S.; de Araujo, F.M.U.; Dhimish, M.; Vieira, R.G. Assessing maximum power point tracking intelligent techniques on a pv system with a buck–boost converter. Energies 2021, 14, 7453. [Google Scholar] [CrossRef]
- Zubieta, L.; Bonert, R. Characterization of double-layercapacitors (DLCs) for power electronics applications. IEEE Transactions on Industry Applications 2000, 36, 199–205. [Google Scholar] [CrossRef]
- Zhang, L.; Hu, X.; Wang, Z.; Sun, F.; Dorrell, D.G. A review of supercapacitor modeling, estimation, and applications: A control/management perspective. Renewable and Sustainable Energy Reviews 2018, 81, 1868–1878. [Google Scholar] [CrossRef]
- Hassani, H.; Zaouche, F.; Rekioua, D.; Belaid, S.; Rekioua, T.; Bacha, S. Feasibility of a standalone photovoltaic/battery system with hydrogen production. Journal of Energy Storage 2020, 31, 101644. [Google Scholar] [CrossRef]
- Elbaset, A.A.; Abdelwahab, S.A.M.; Ibrahim, H.A.; Eid, M.A.E. Performance Analysis of Photovoltaic Systems with Energy Storage Systems. book chapter, Renewable and Green Energy, Springer, 19. 20 January.
- Elbaset, A.A.; Abdelwahab, S.A.M.; Ibrahim, H.A.; Eid, M.A.E. The Performance Analysis of a PV System with Battery-Supercapacitor Hybrid Energy Storage System. book chapter, Renewable and Green Energy, Springer, 19. 20 January.
- Yousef, A.M.; Abo-Elyousr, F.K.; Elnozohy, A.; Moayed, M.; Saad, A.; Mohamed, A. Fractional Order PI Control in Hybrid Renewable Power Generation System to Three Phase Grid Connection. International Journal on Electrical Engineering and Informatics 2020, 12. [Google Scholar] [CrossRef]
- Elnozahy, A.; Yousef, A.M.; Abo, F.K. , Moayed Mohamed and Saad A. Mohamed Abdelwahab," Performance improvement of hybrid renewable energy sources connected to the grid using artificial neural network and sliding mode control. Journal of Power Electronics, Springer, 21. 20 March.
- Saleh, B.; Yousef, A.M.; Abo-Elyousr, F.K.; Mohamed, M. , Saad A. Mohamed Abdelwahab and Ahmed Elnozahy,"Performance Analysis of Maximum Power Point Tracking for Two Techniques with Direct Control of Photovoltaic Grid -Connected Systems", Energy Sources, Part A: Recovery, Utilization, and Environmental Effects, pp. 1–23, 12 Mar 2021.
- Elnozahy, A.; Yousef, A.M.; Ghoneim, S.S.M.; Abdelwahab, S.A.M.; Mohamed, M.; Abo, F.K. Optimal Economic and Environmental Indices for Hybrid PV/ Wind.Based Battery Storage System. Journal of Electrical Engineering & Technology, The Korean Institute of Electrical Engineers 2021 Springer, pp. 2847–2862, 2021.
- Eid, M.A.E.; Elbaset, A.A.; Ibrahim, H.A.; Abdelwahab, S.A.M. ; Modelling, Simulation of MPPT Using Perturb and Observe and Incremental Conductance techniques For Stand-Alone PV Systems. 2019 21st International Middle East Power Systems Conference (MEPCON), 2019. [Google Scholar]
- Abdelwahab, S.A.M.; Hamada, A.M.; Abdellatif, W.S.E. Comparative Analysis of the Modified Perturb & Observe with Different MPPT Techniques for PV Grid Connected Systems. International Journal of Renewable Energy Research-IJRER 2020, 10, 156–164. [Google Scholar]
Figure 1.
Network visualisation of renewable energy keyword.
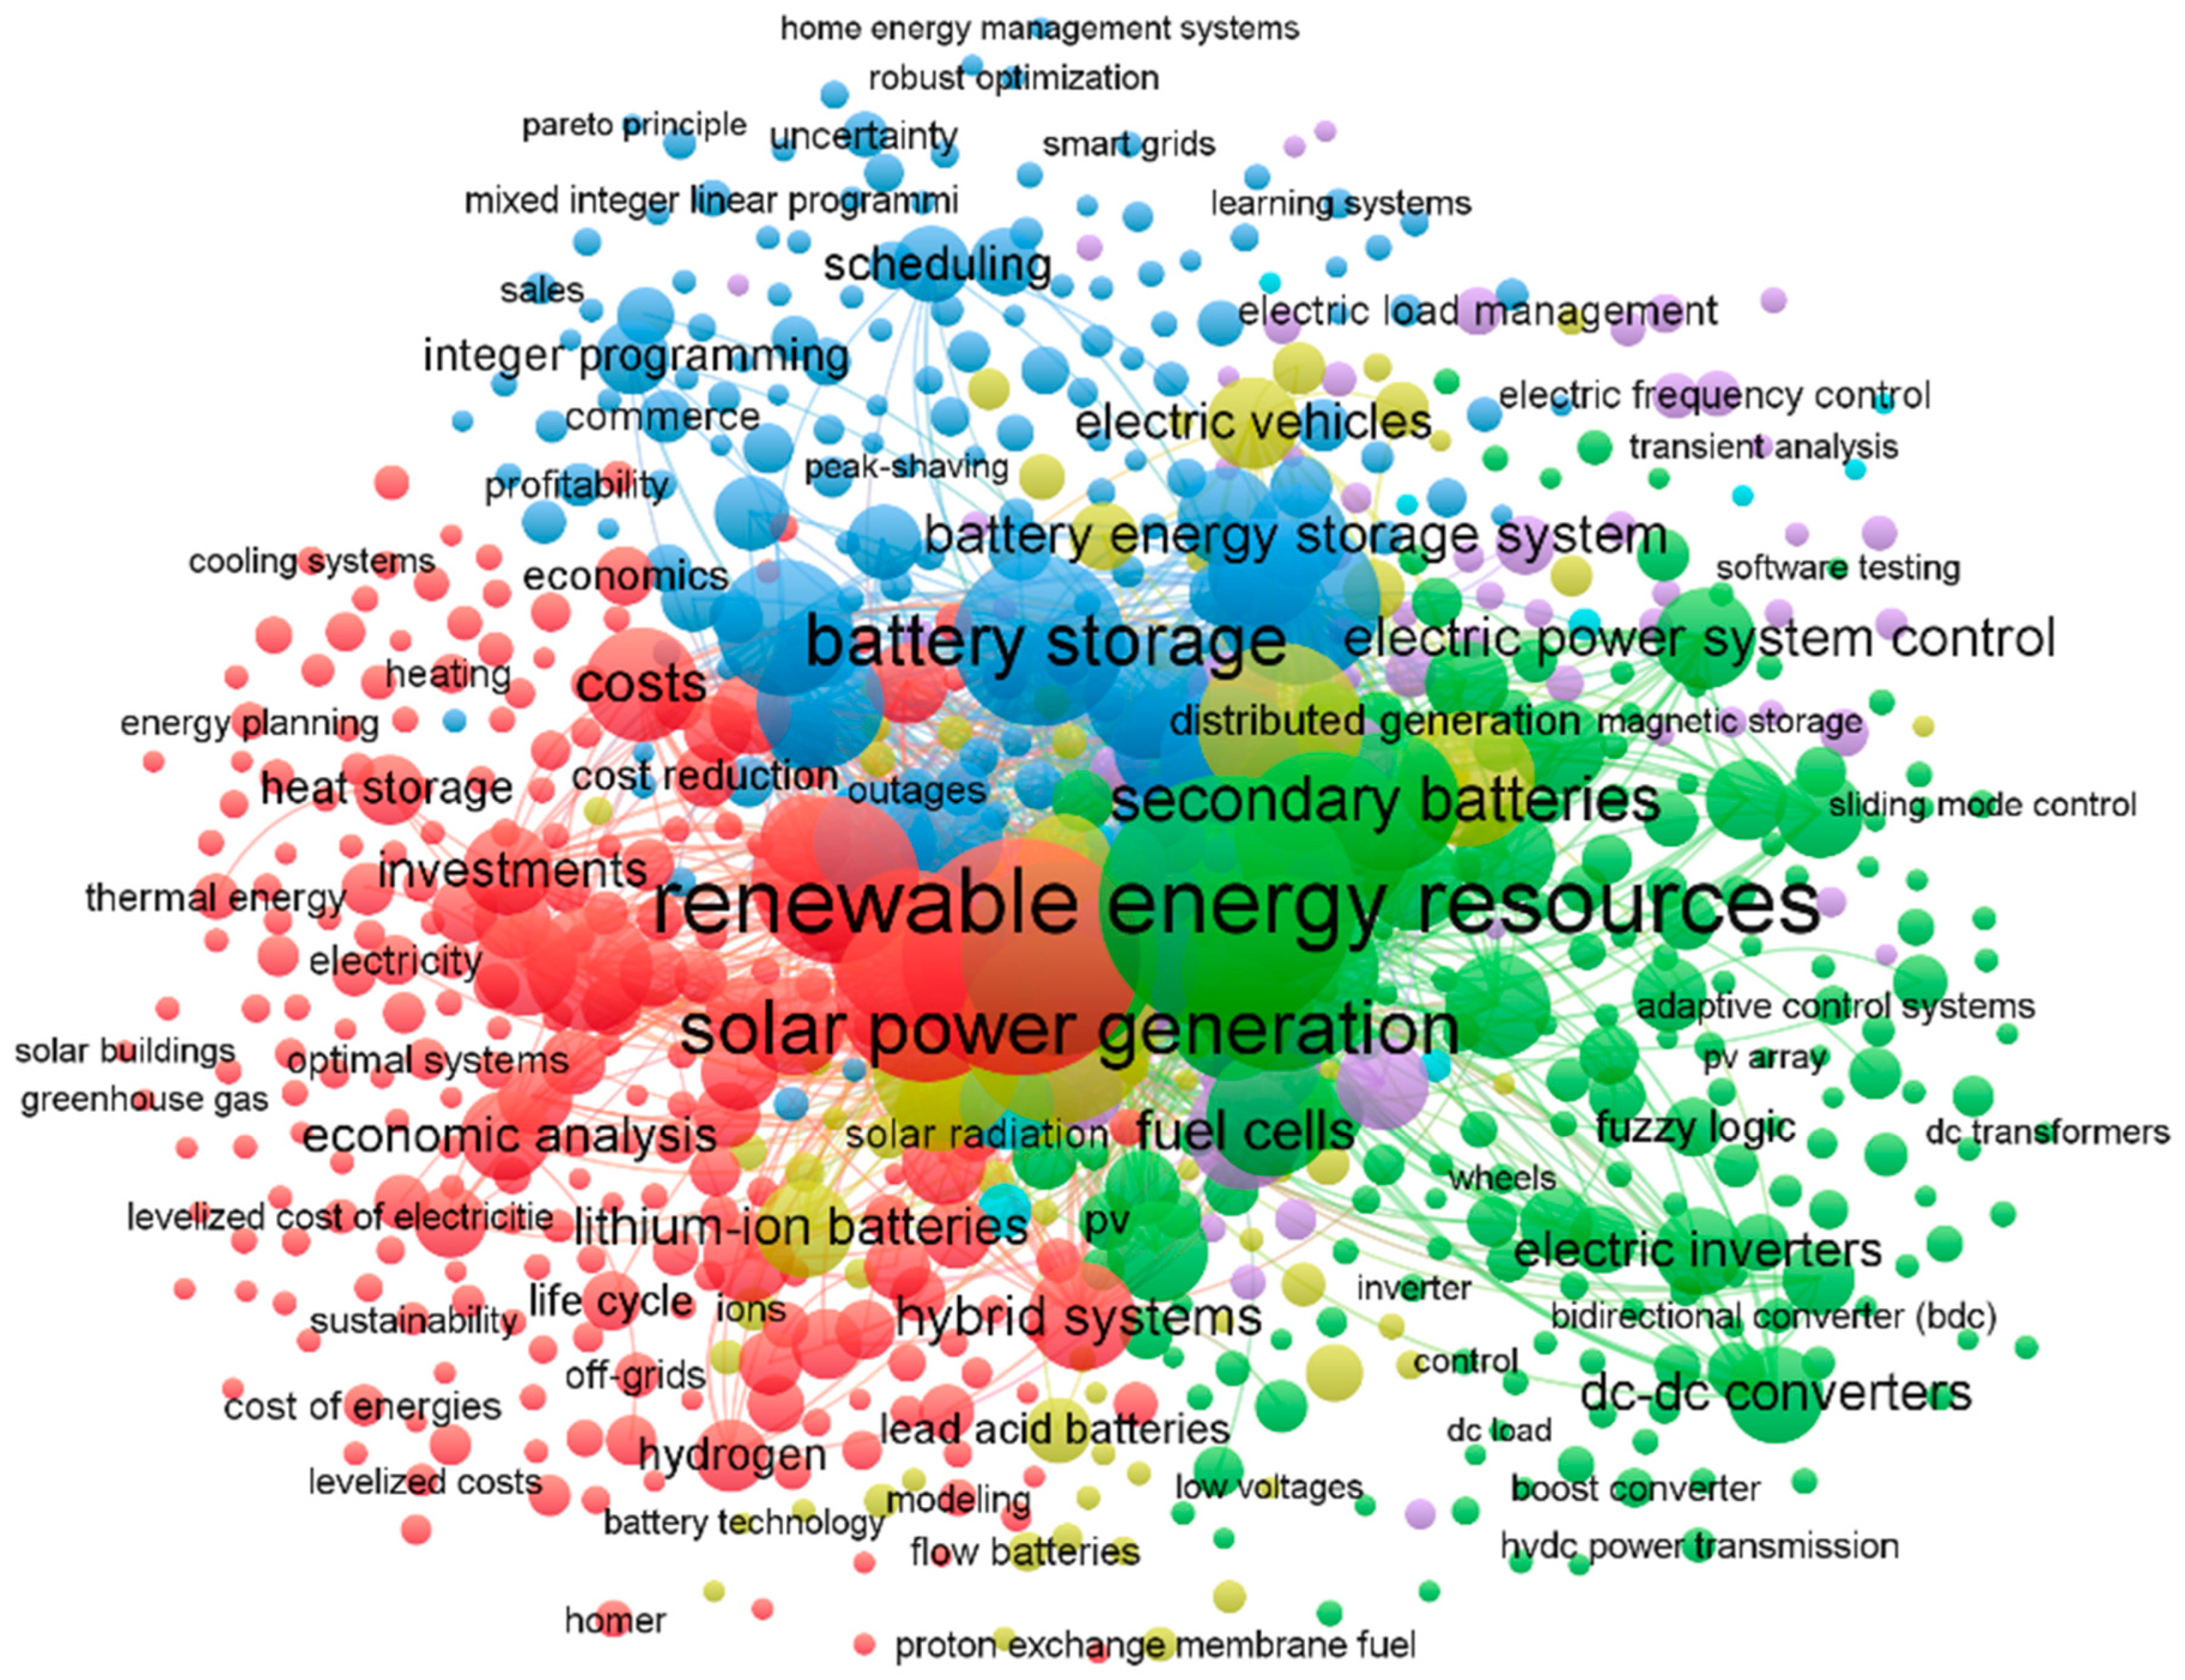
Figure 2.
Proposed PV based hybrid storage scheme.
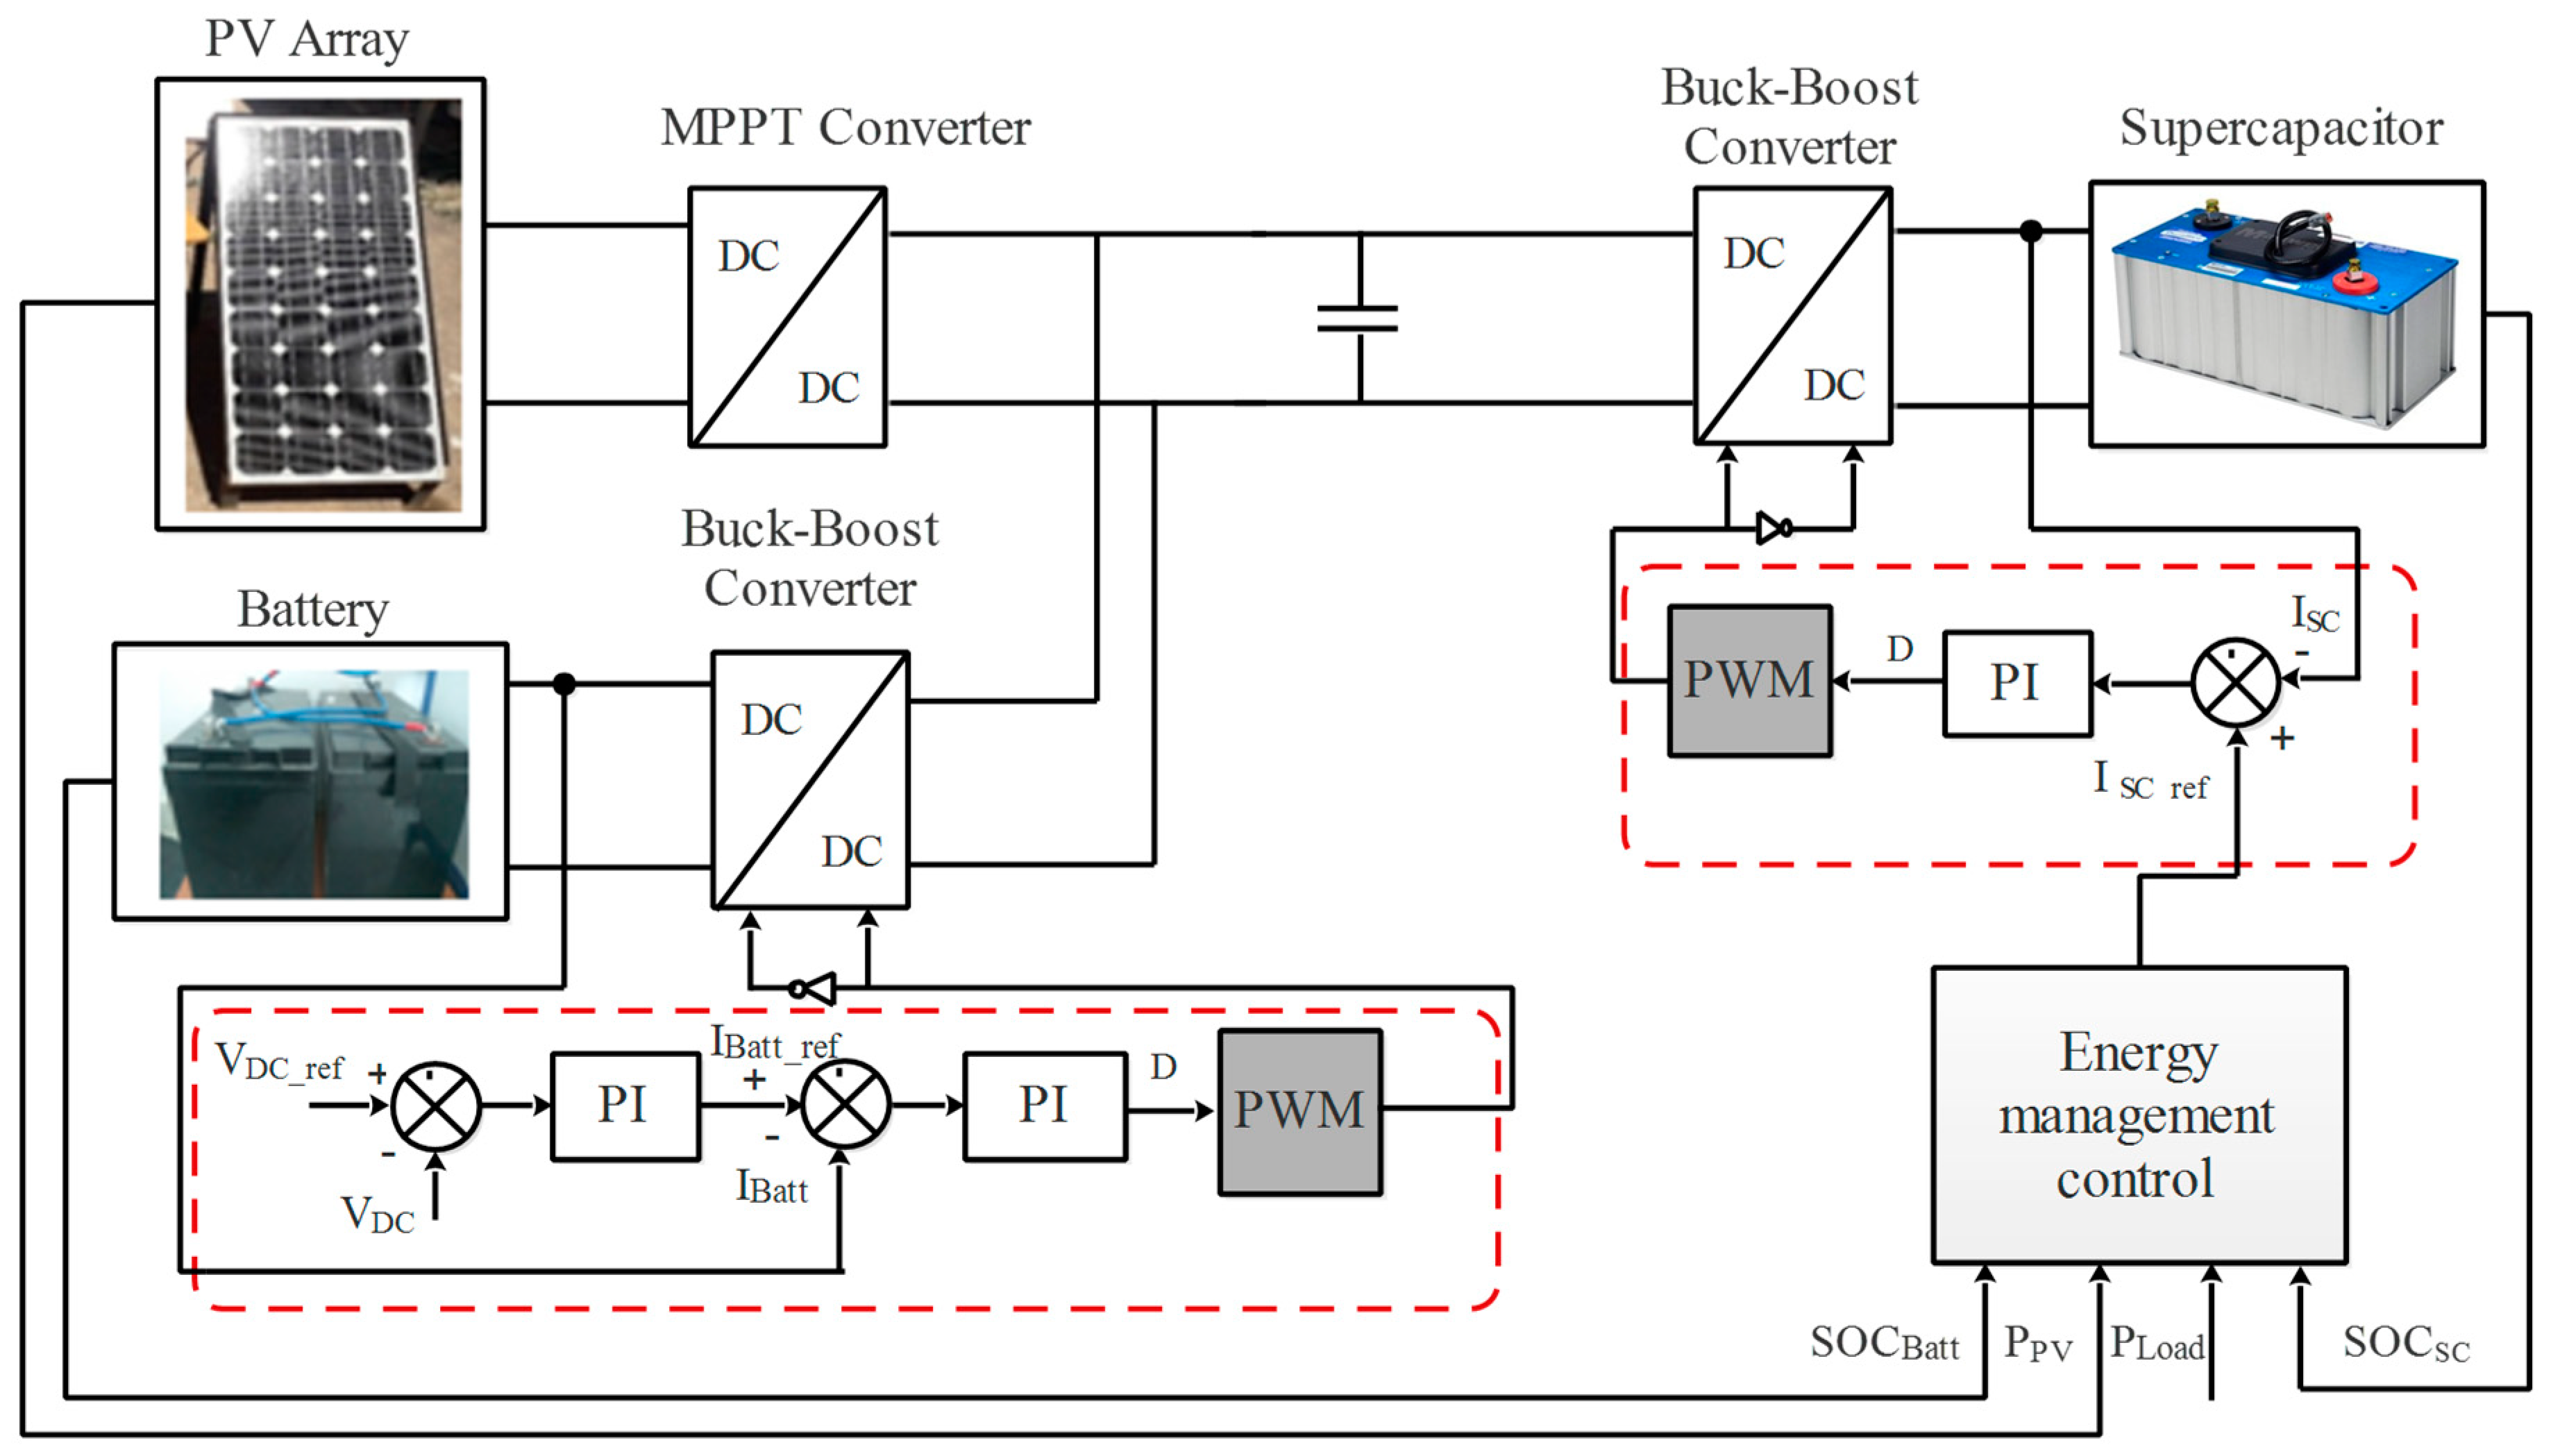
Figure 3.
Experimental test bench.
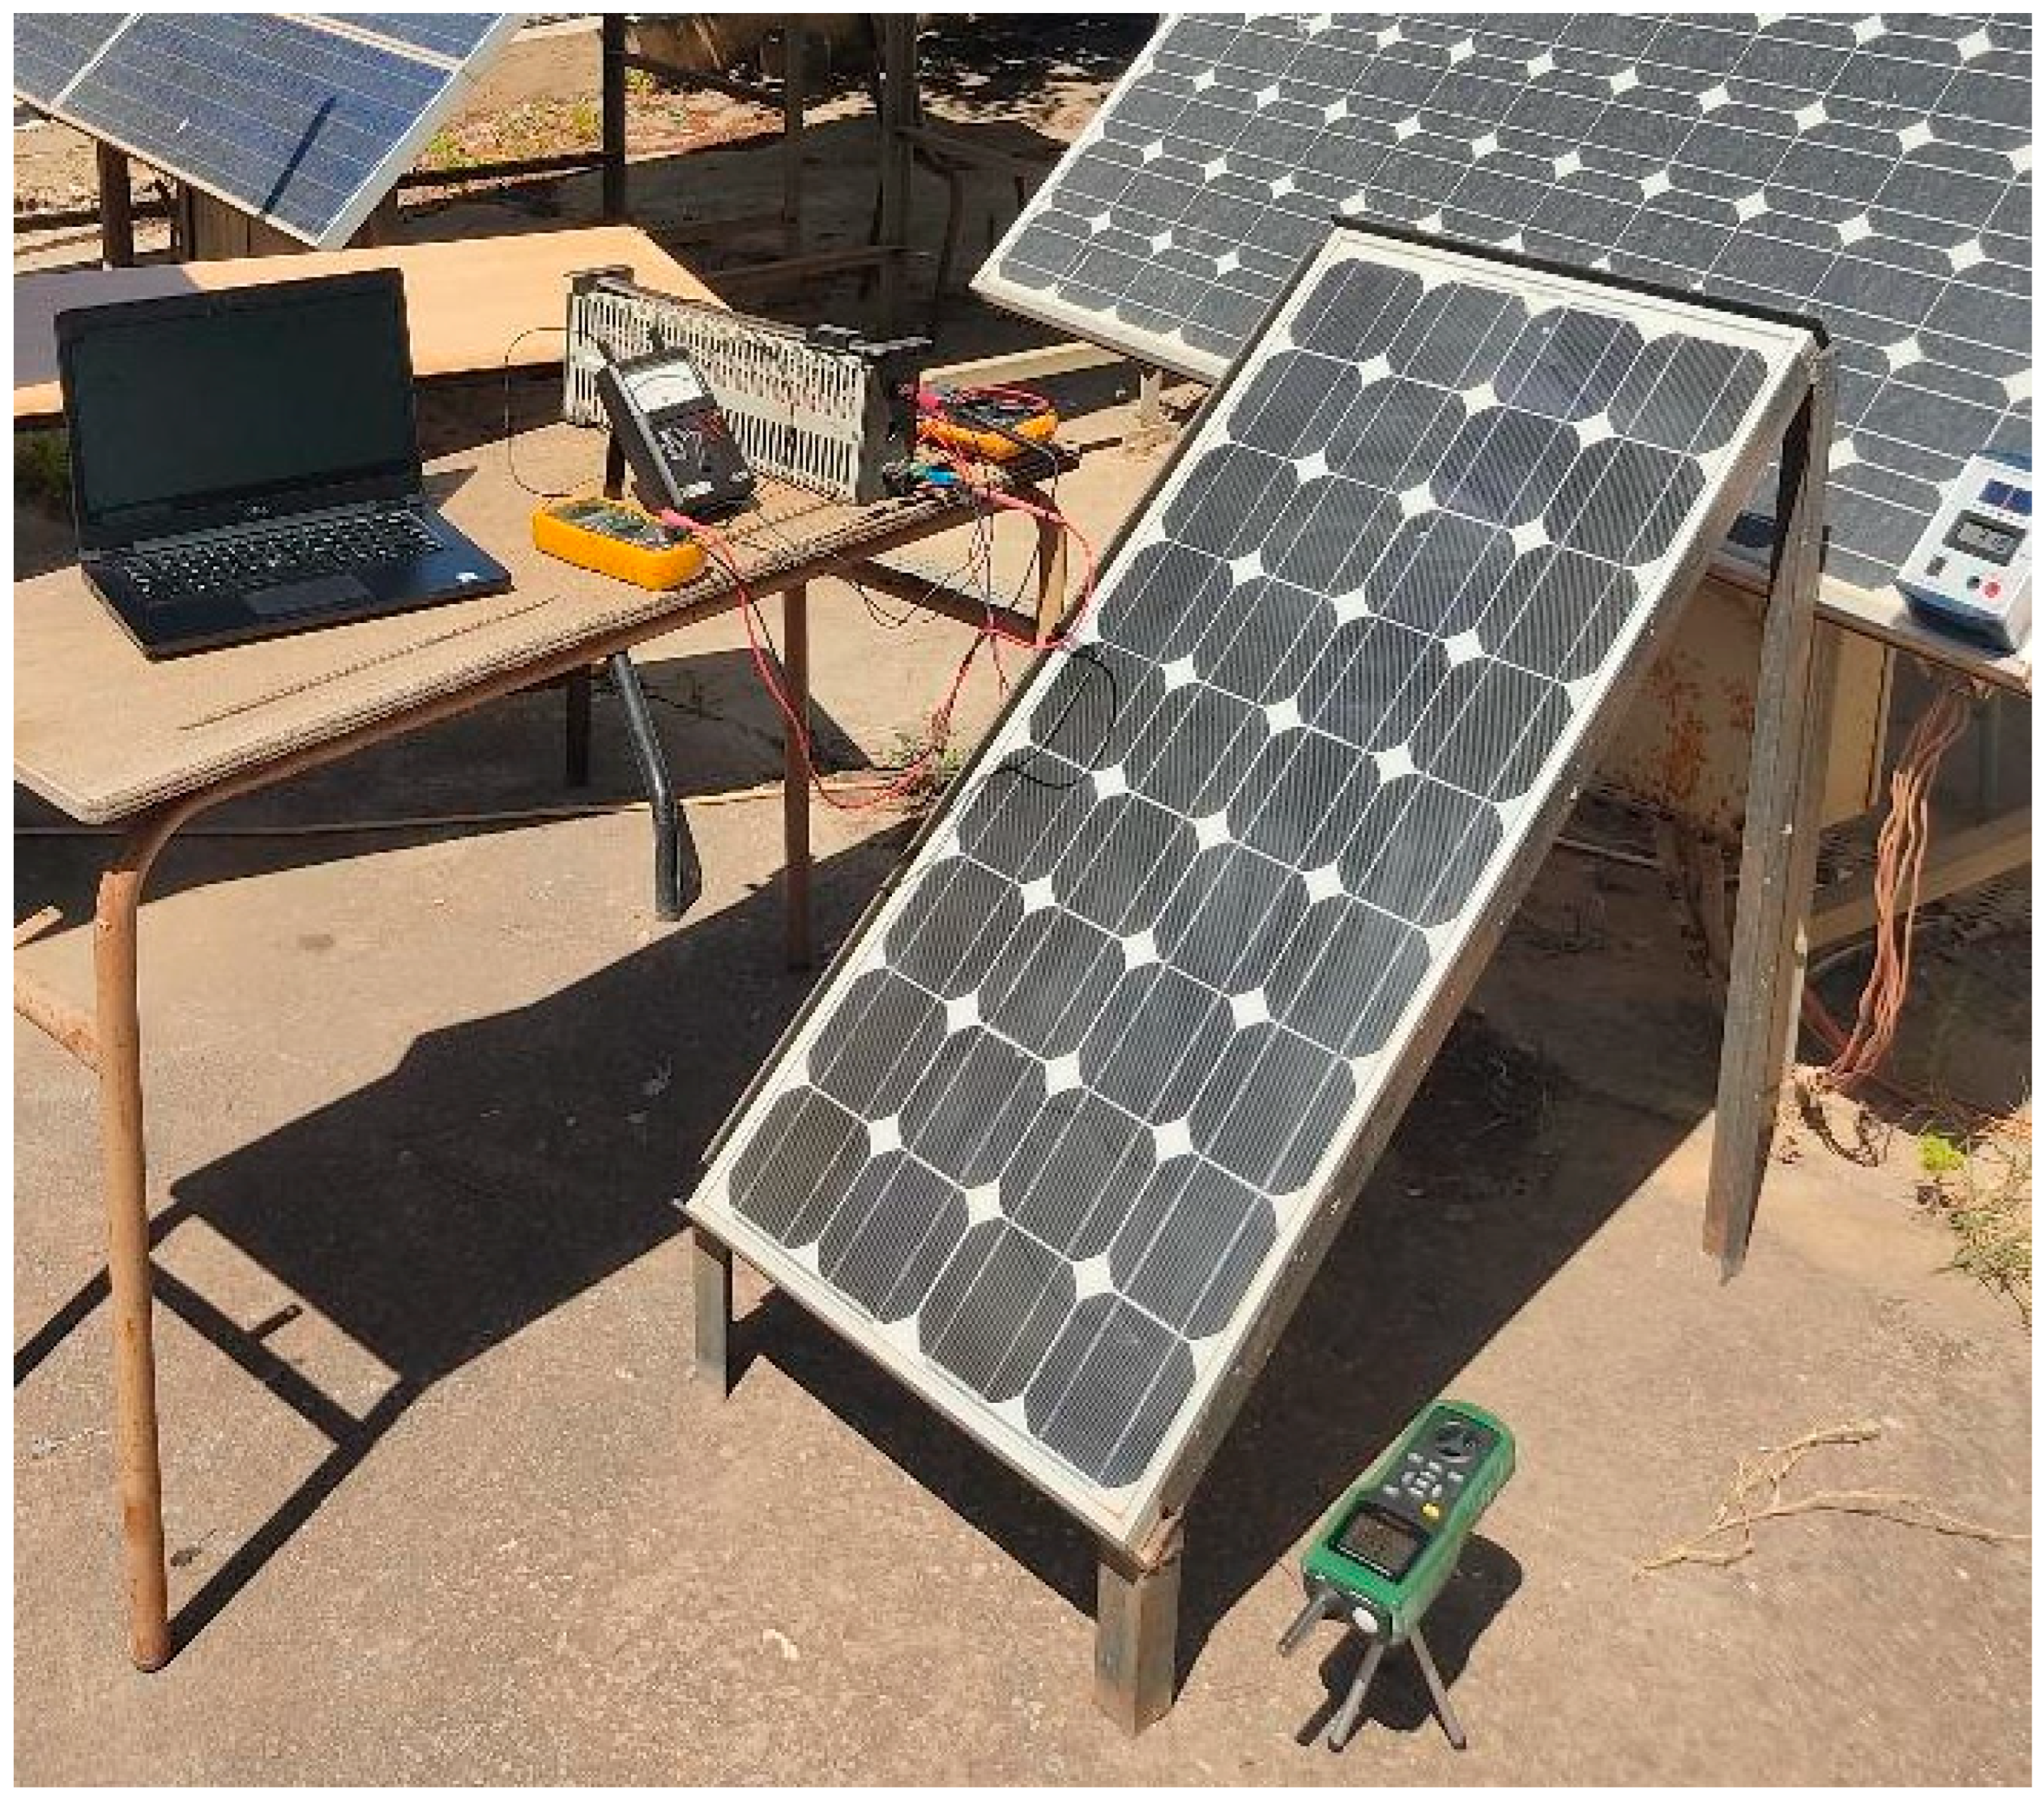
Figure 4.
Electricalcharacteristics.
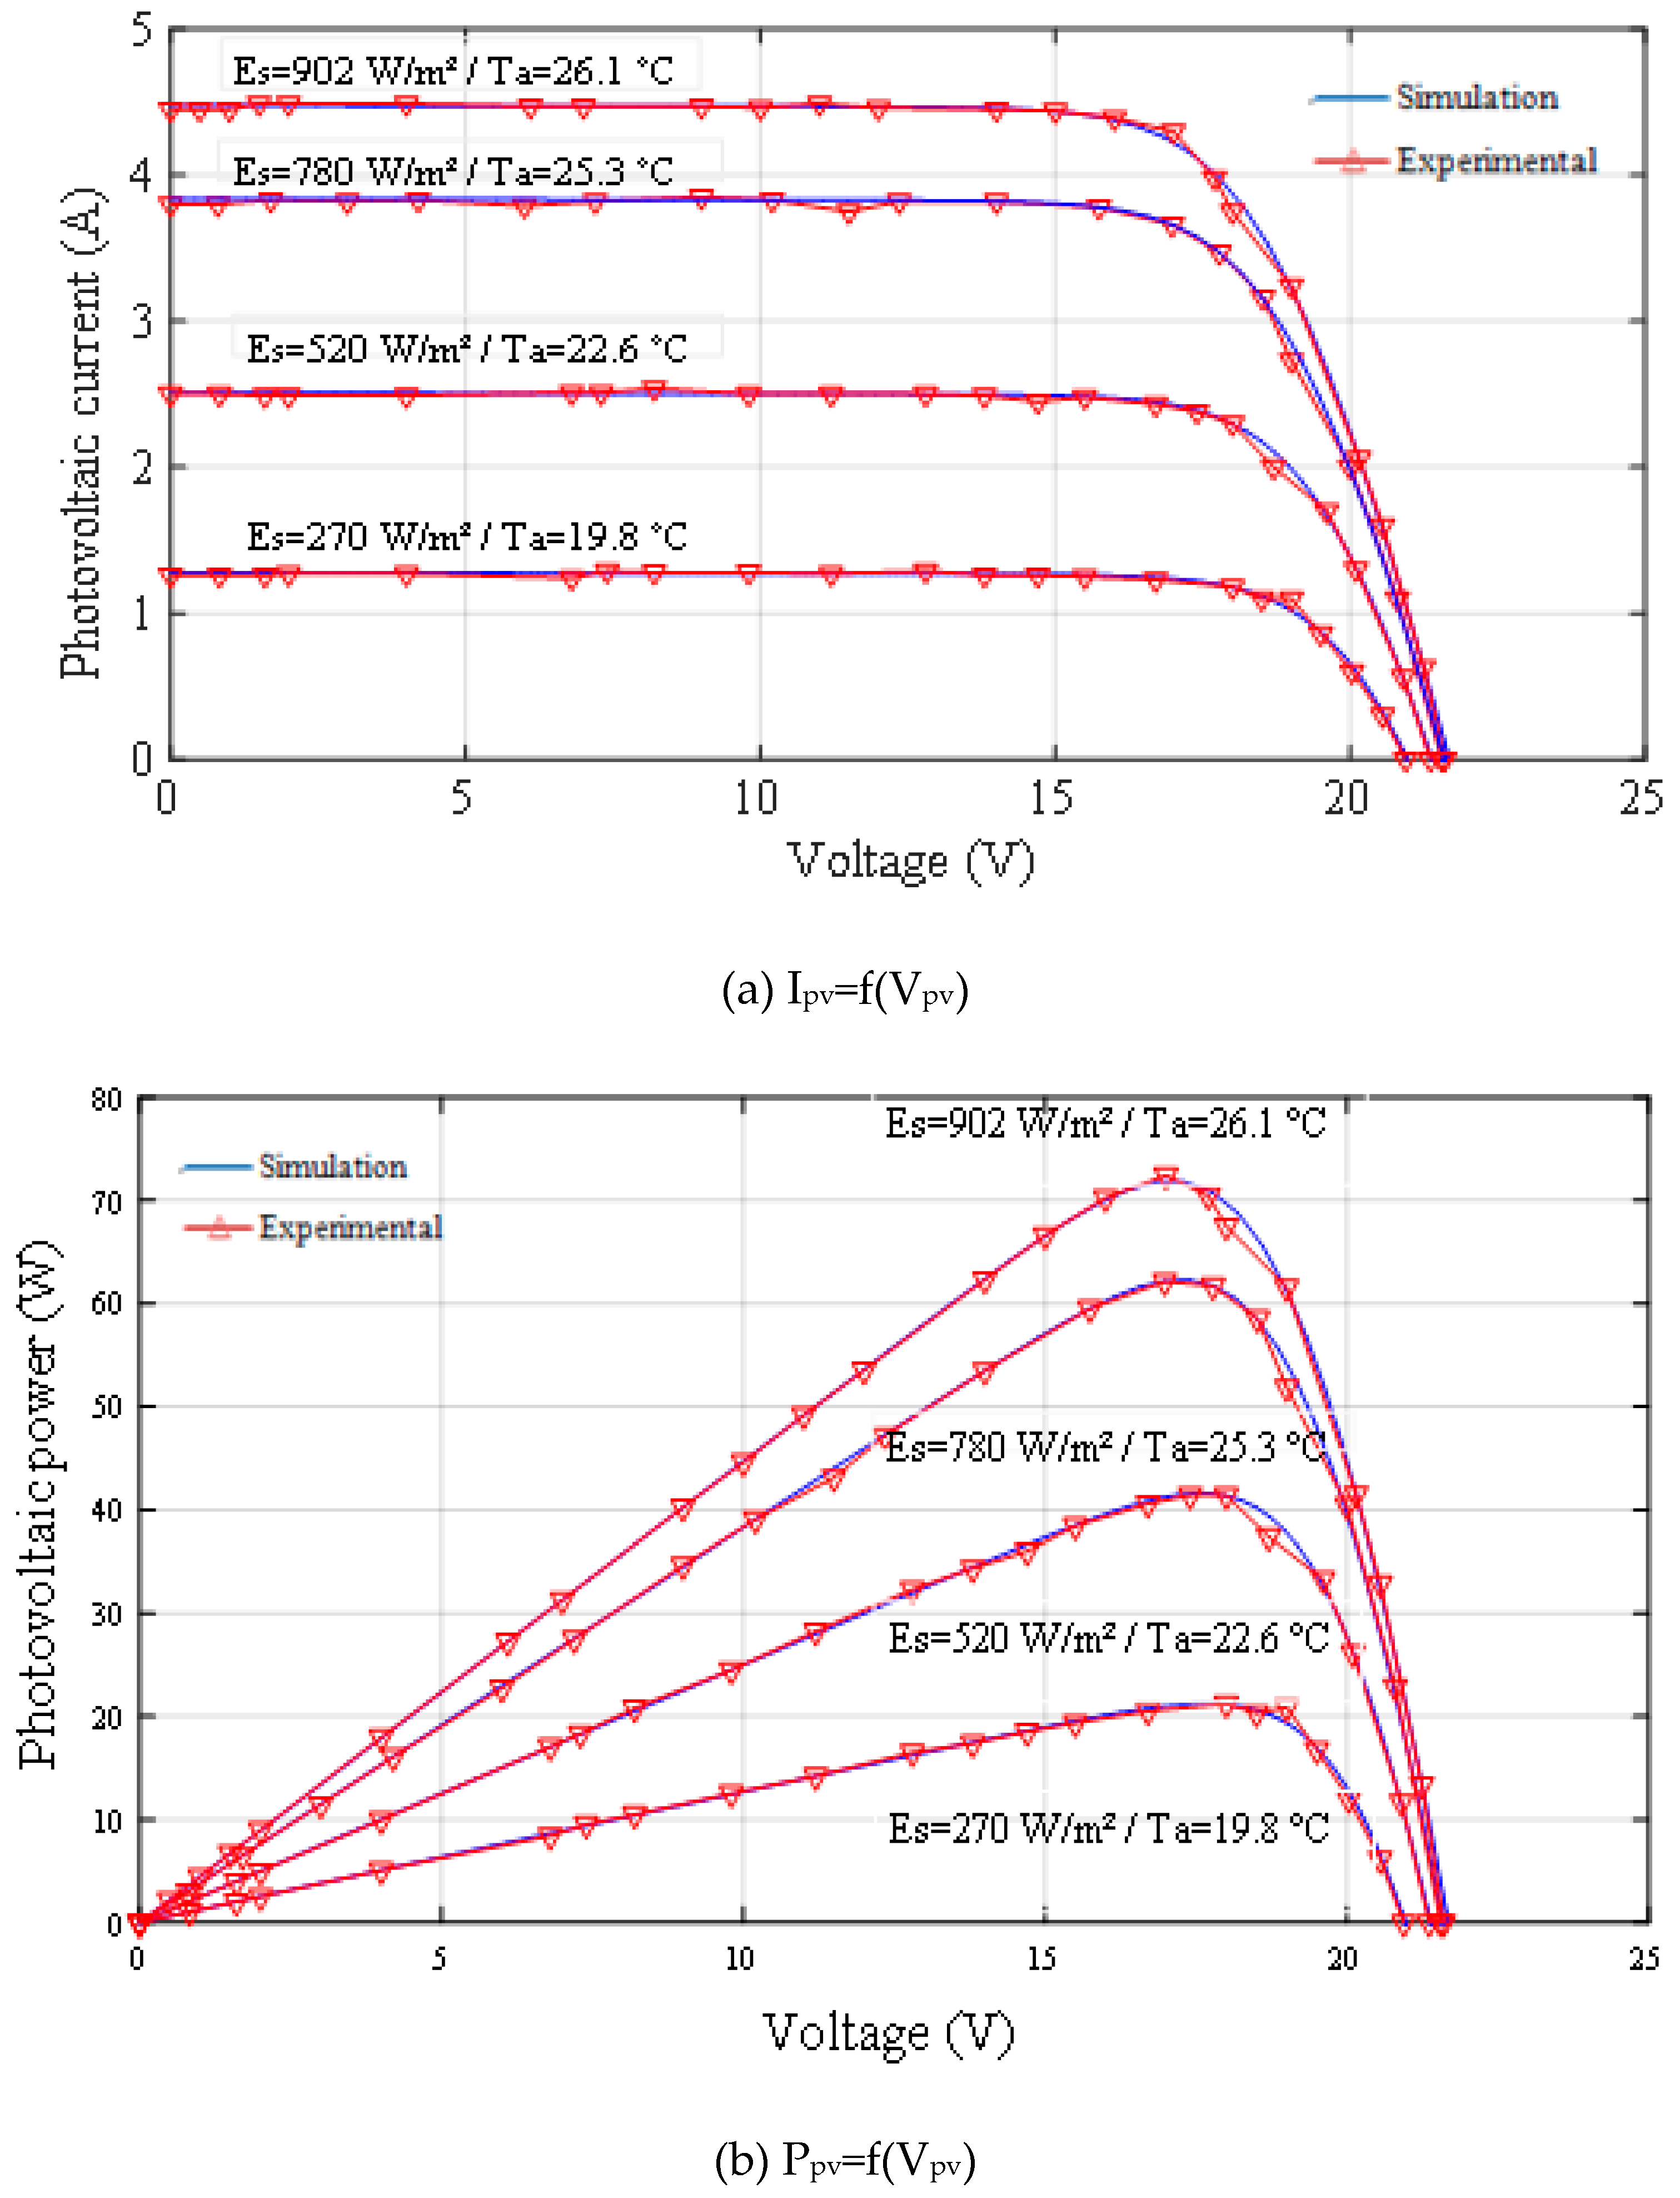
Figure 5.
R-C model of the battery.
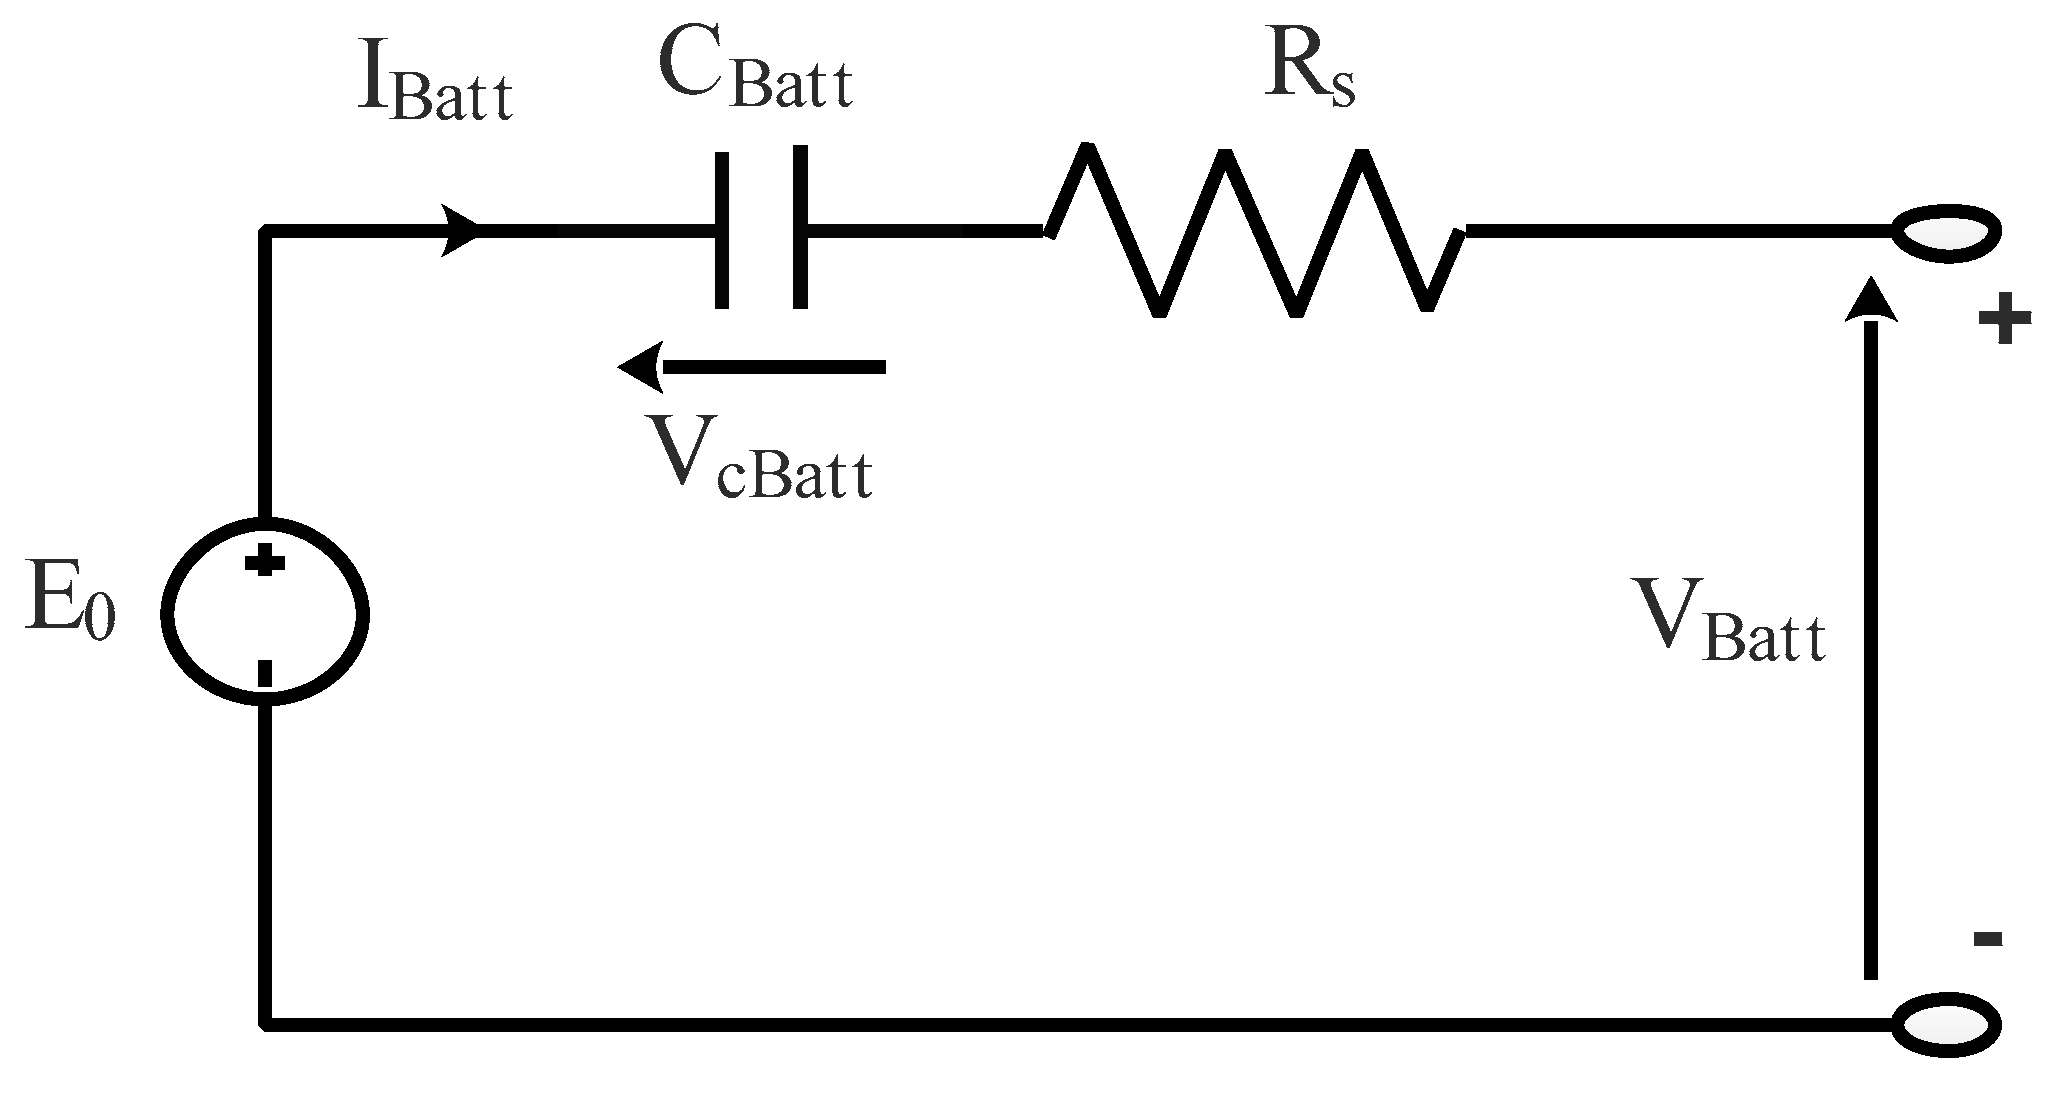
Figure 6.
Battery identification test bench.
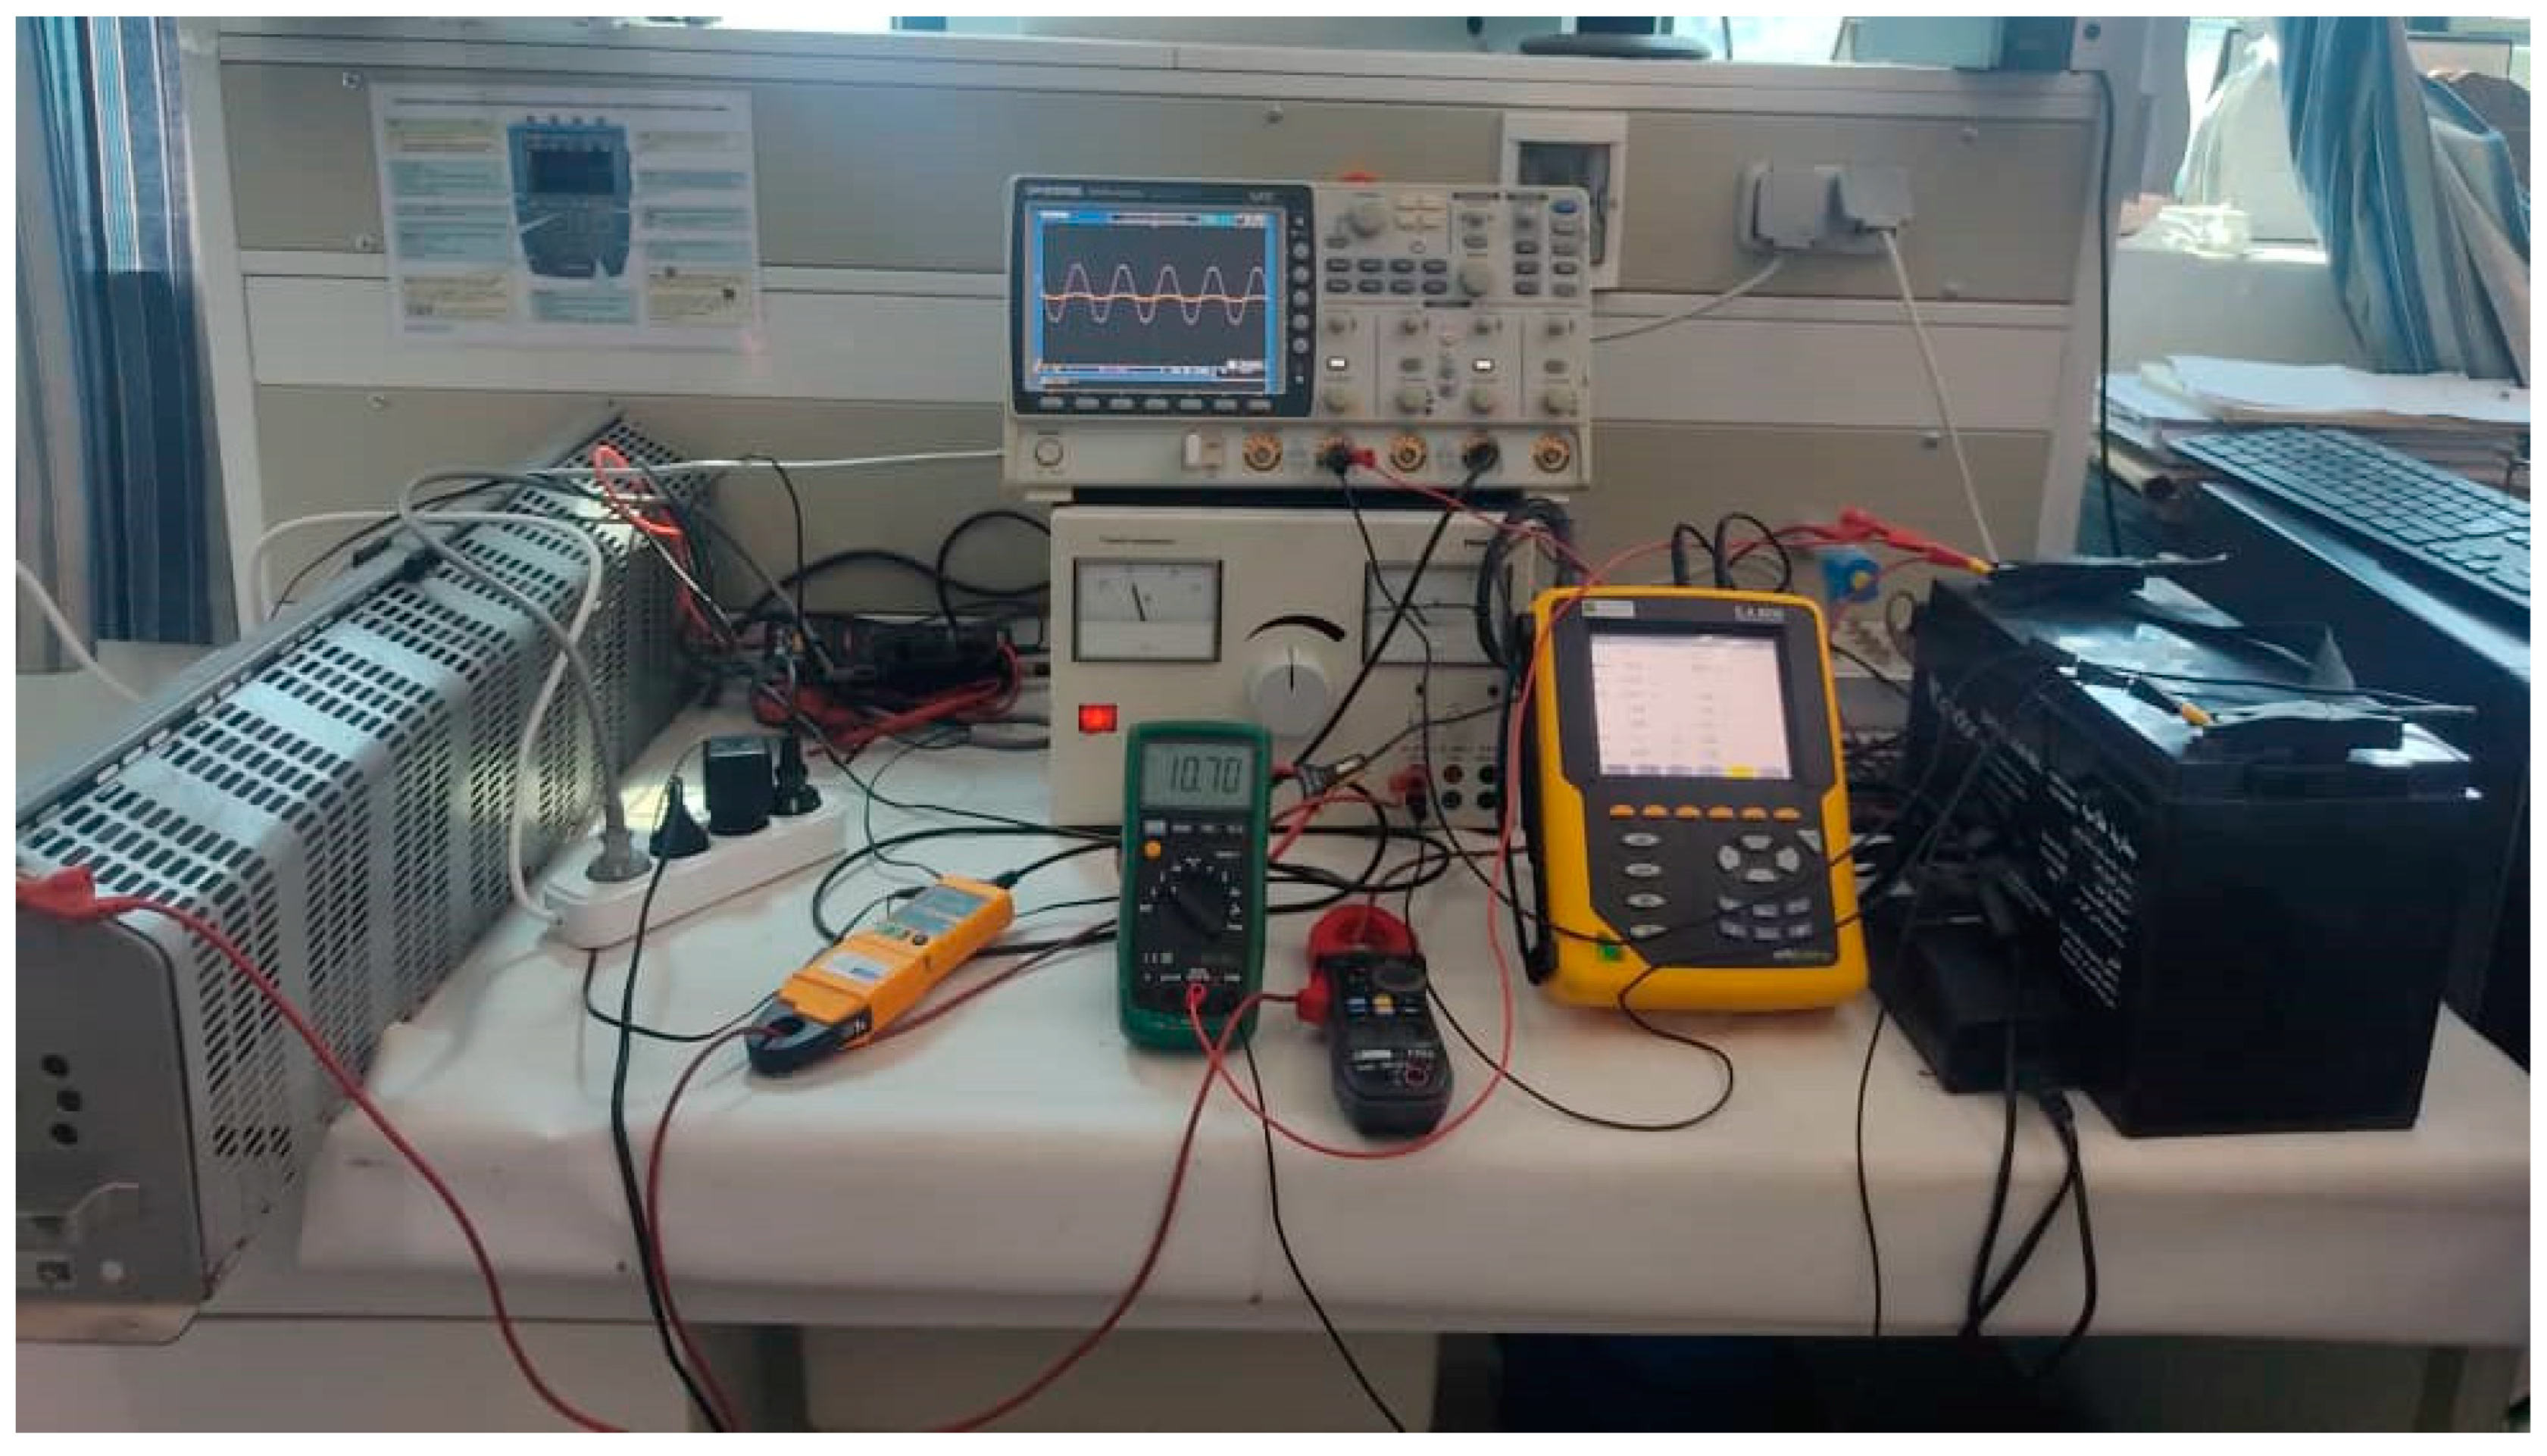
Figure 7.
Batetry voltage and current curves.
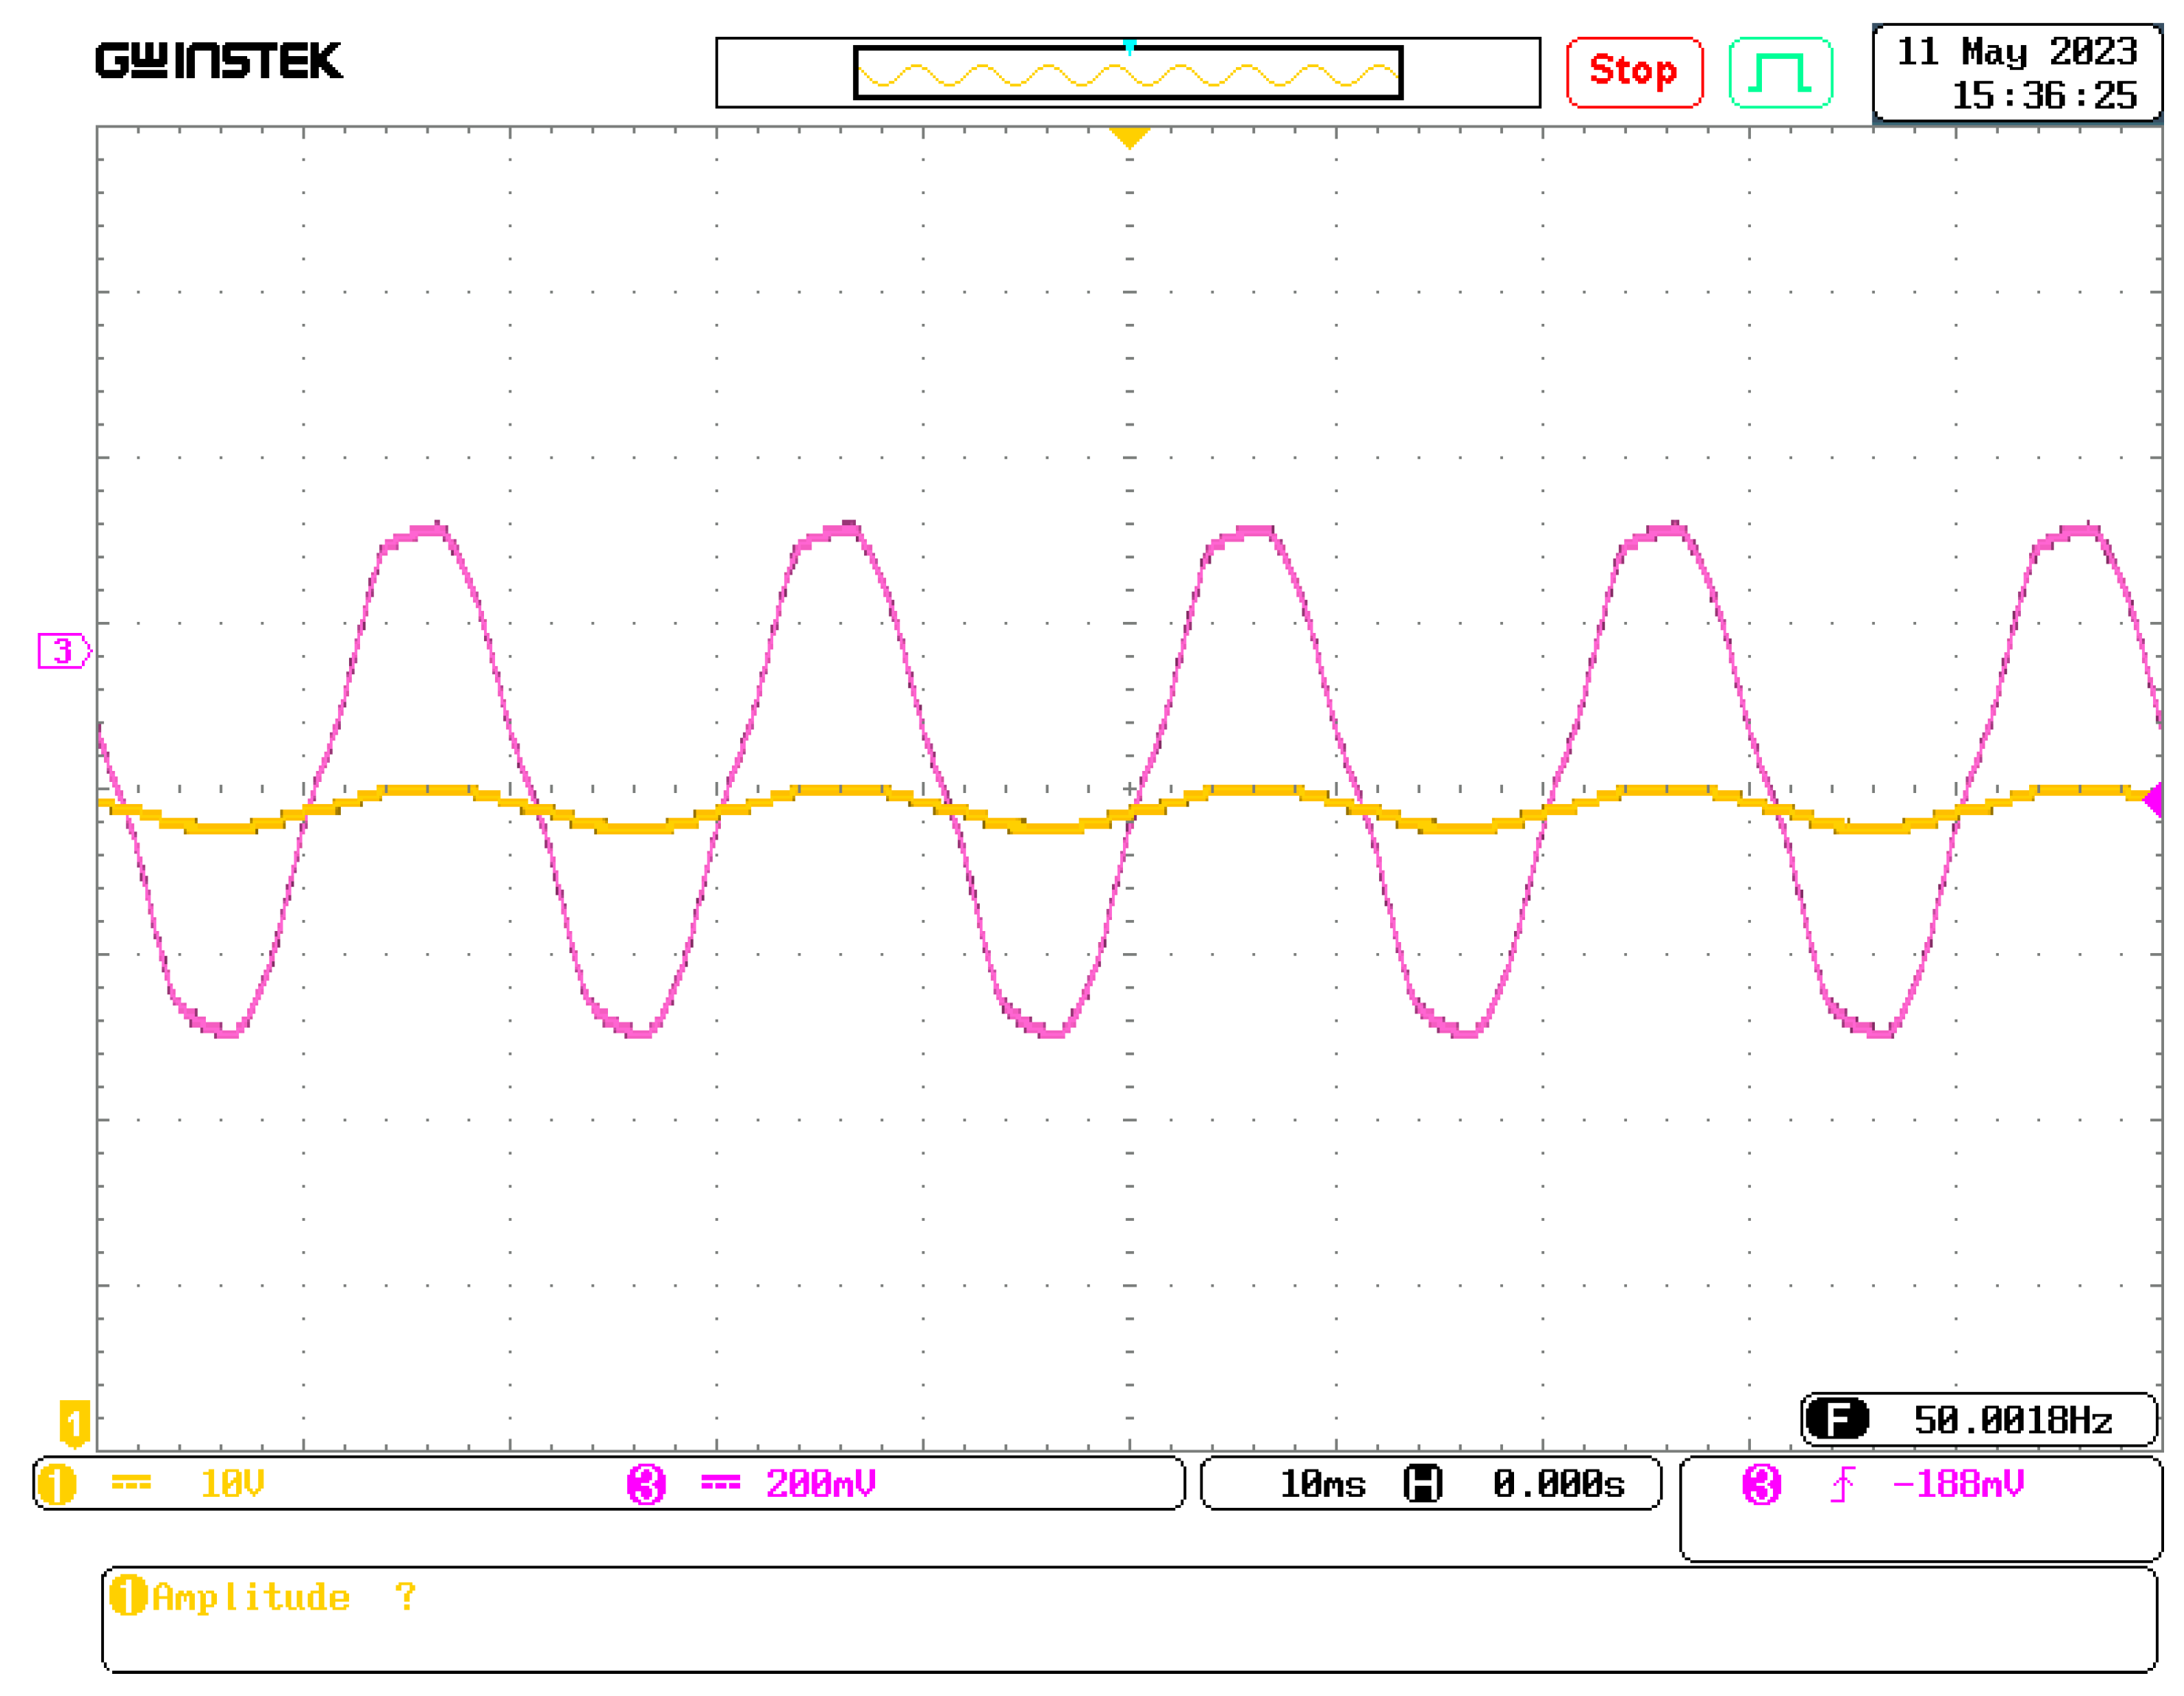
Figure 8.
SC model.
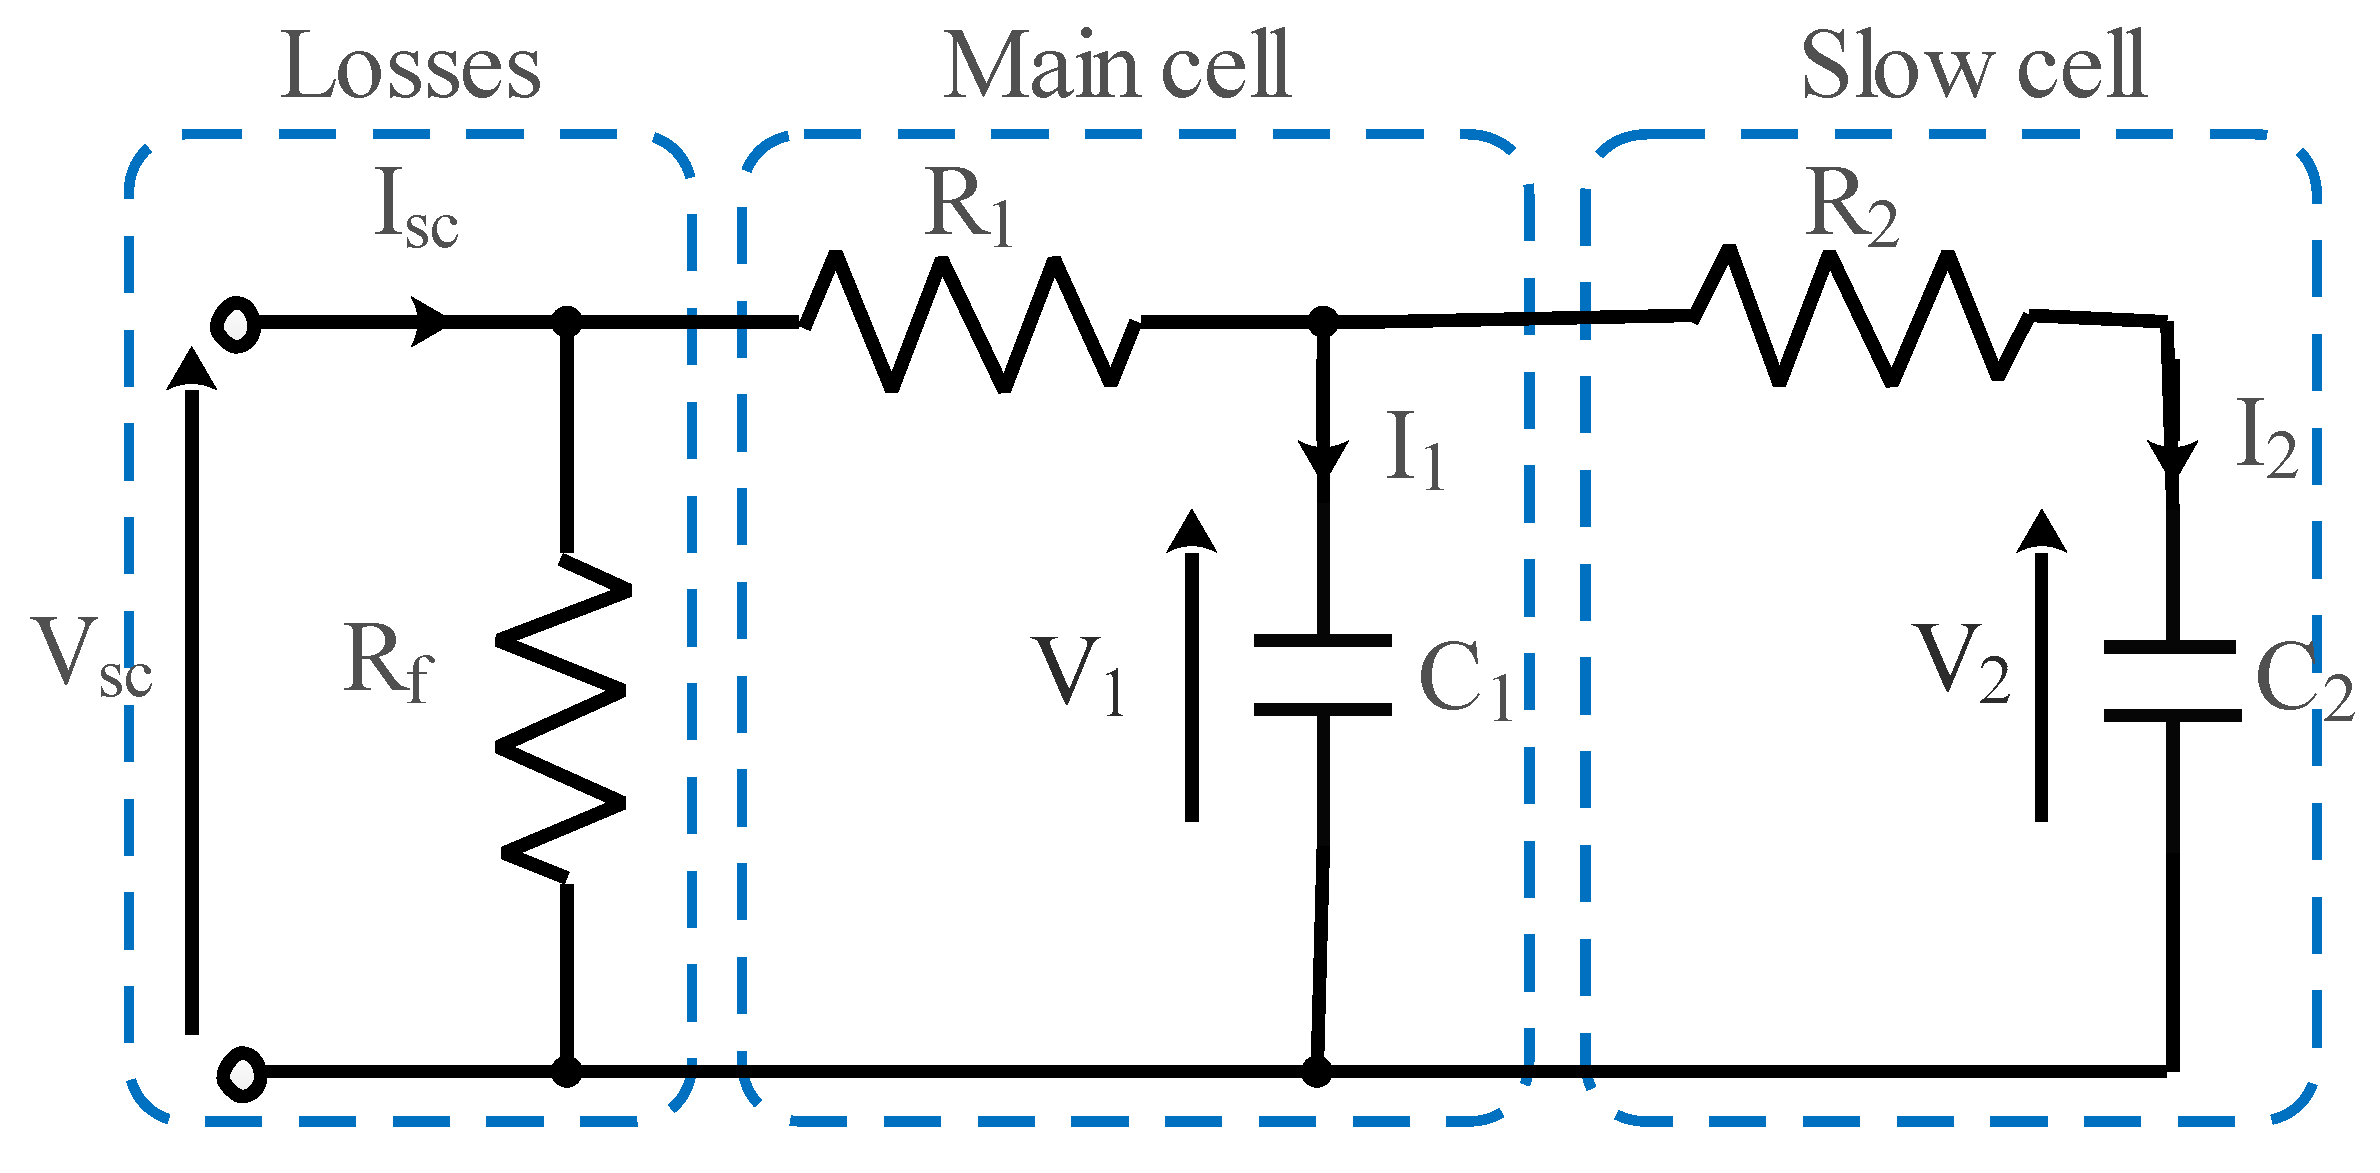
Figure 9.
Supercapacitor identification test bench.
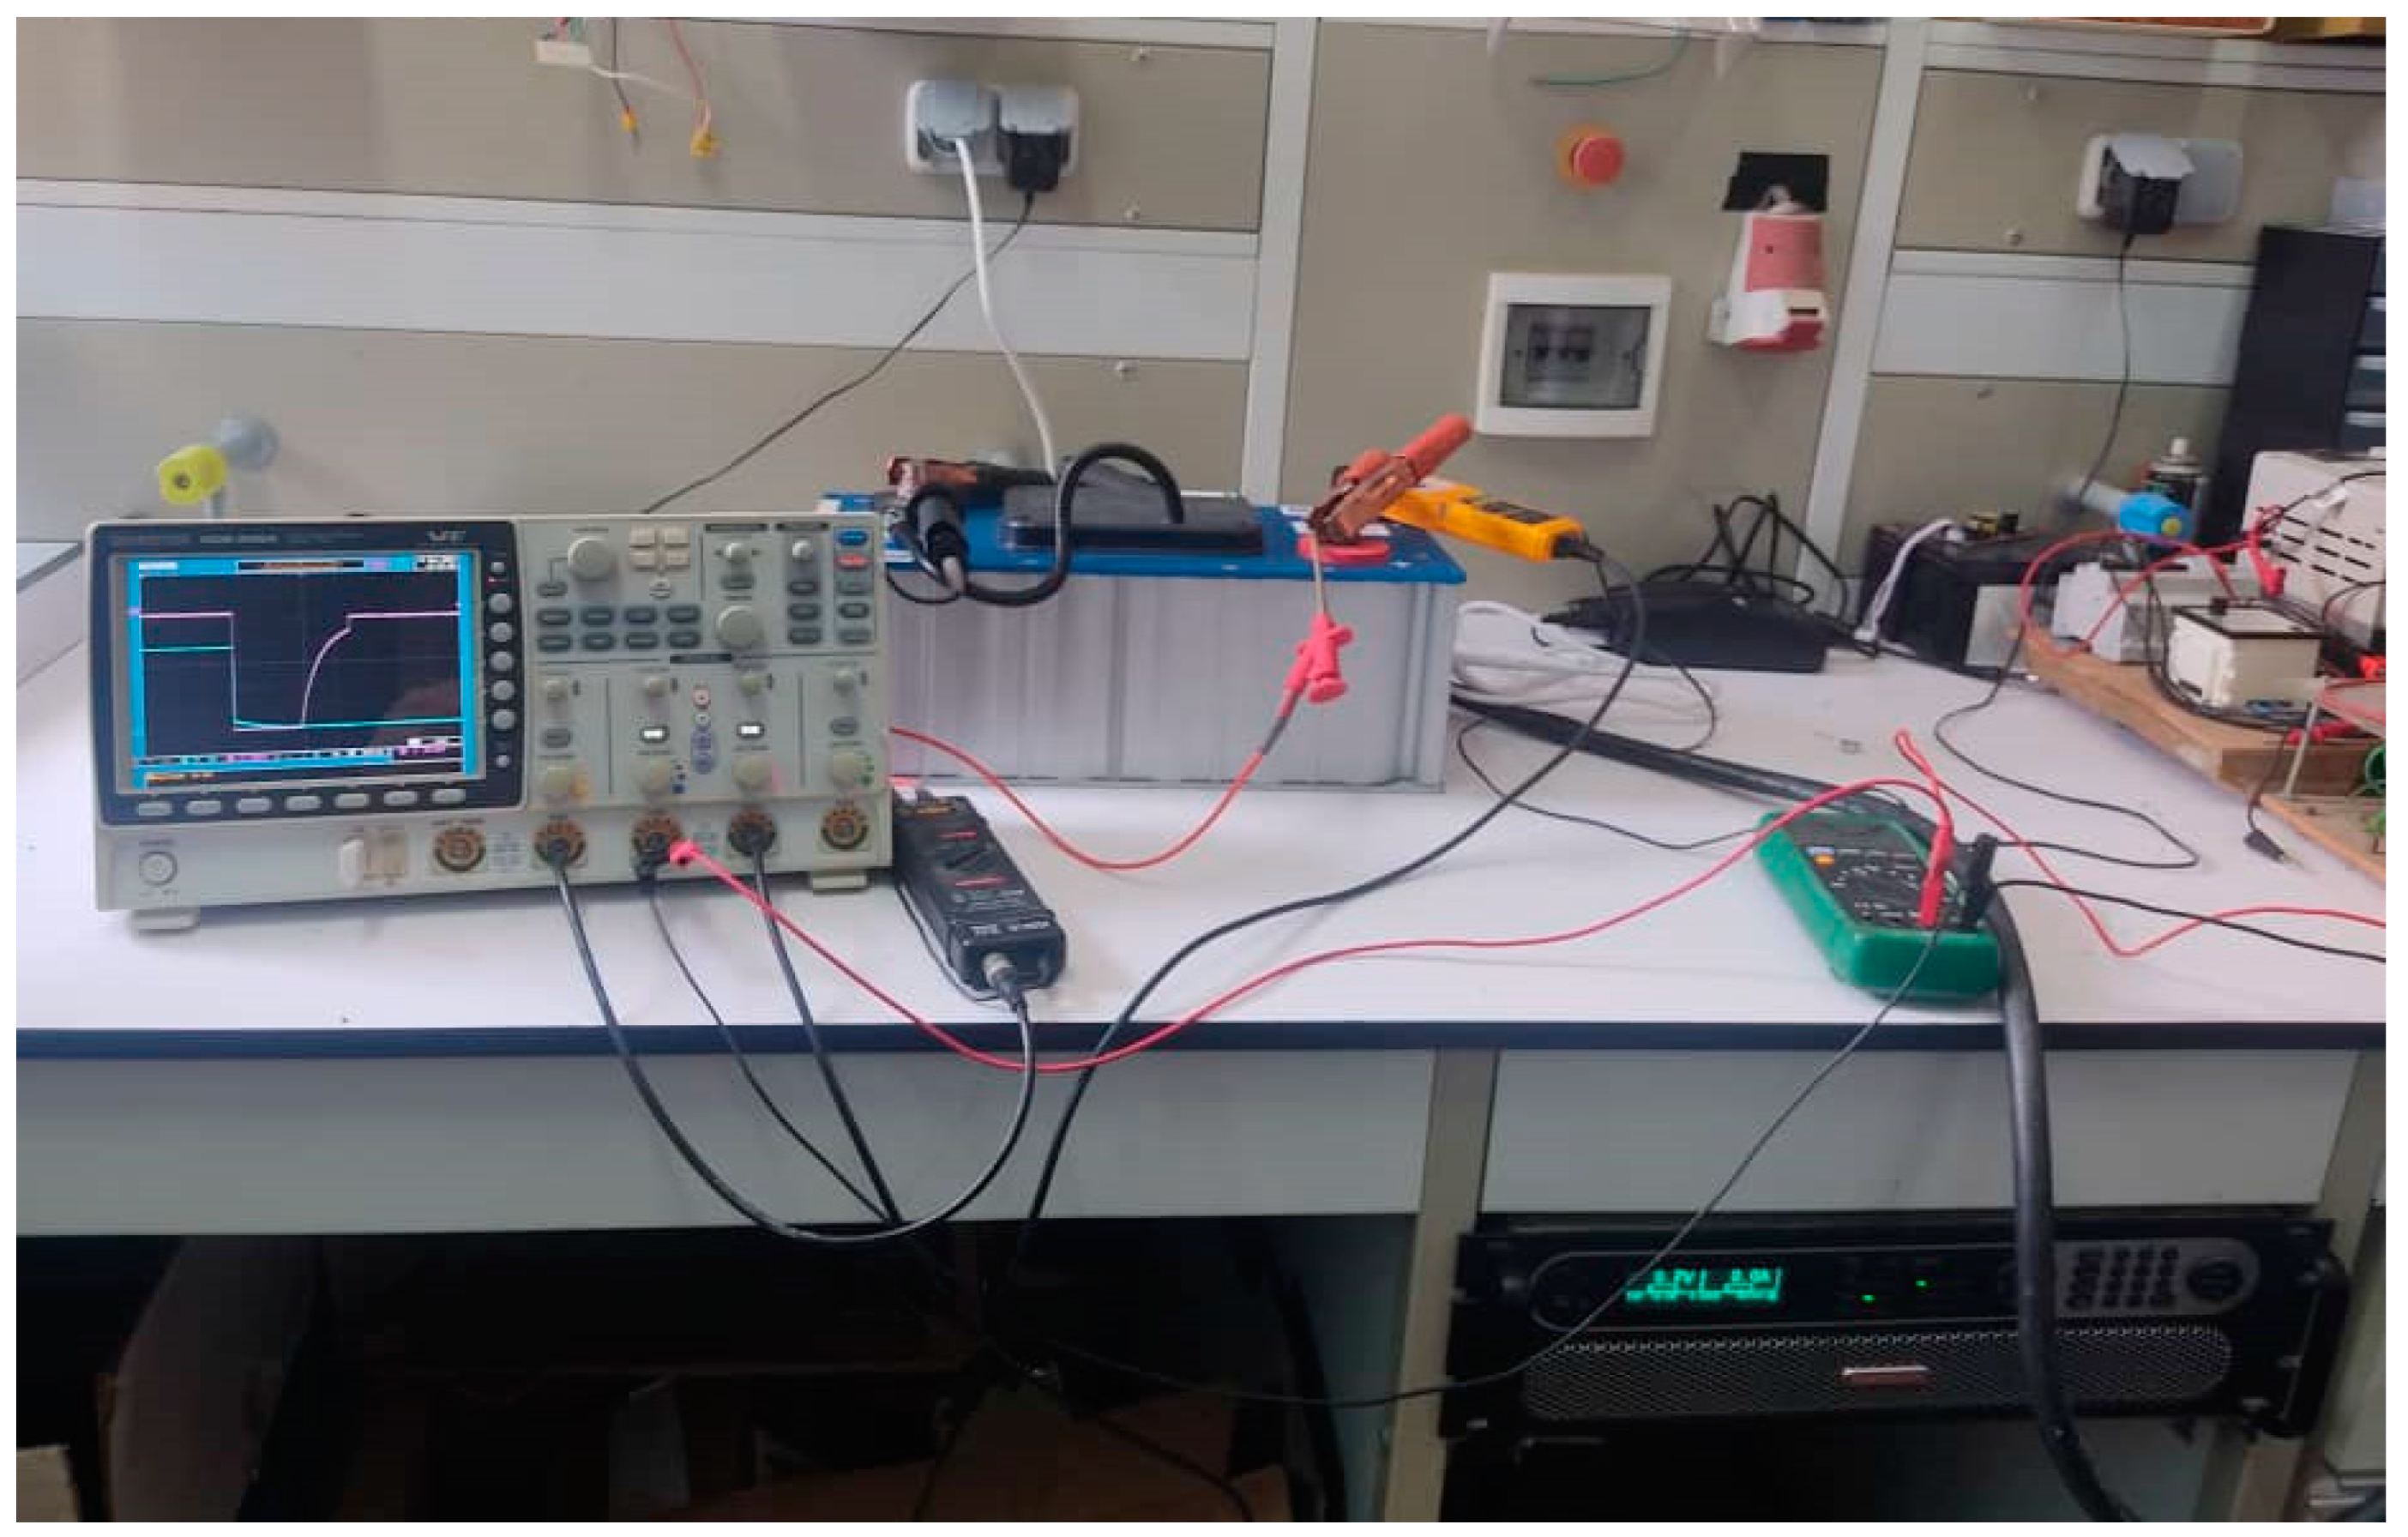
Figure 10.
Tests under charge and discharge.
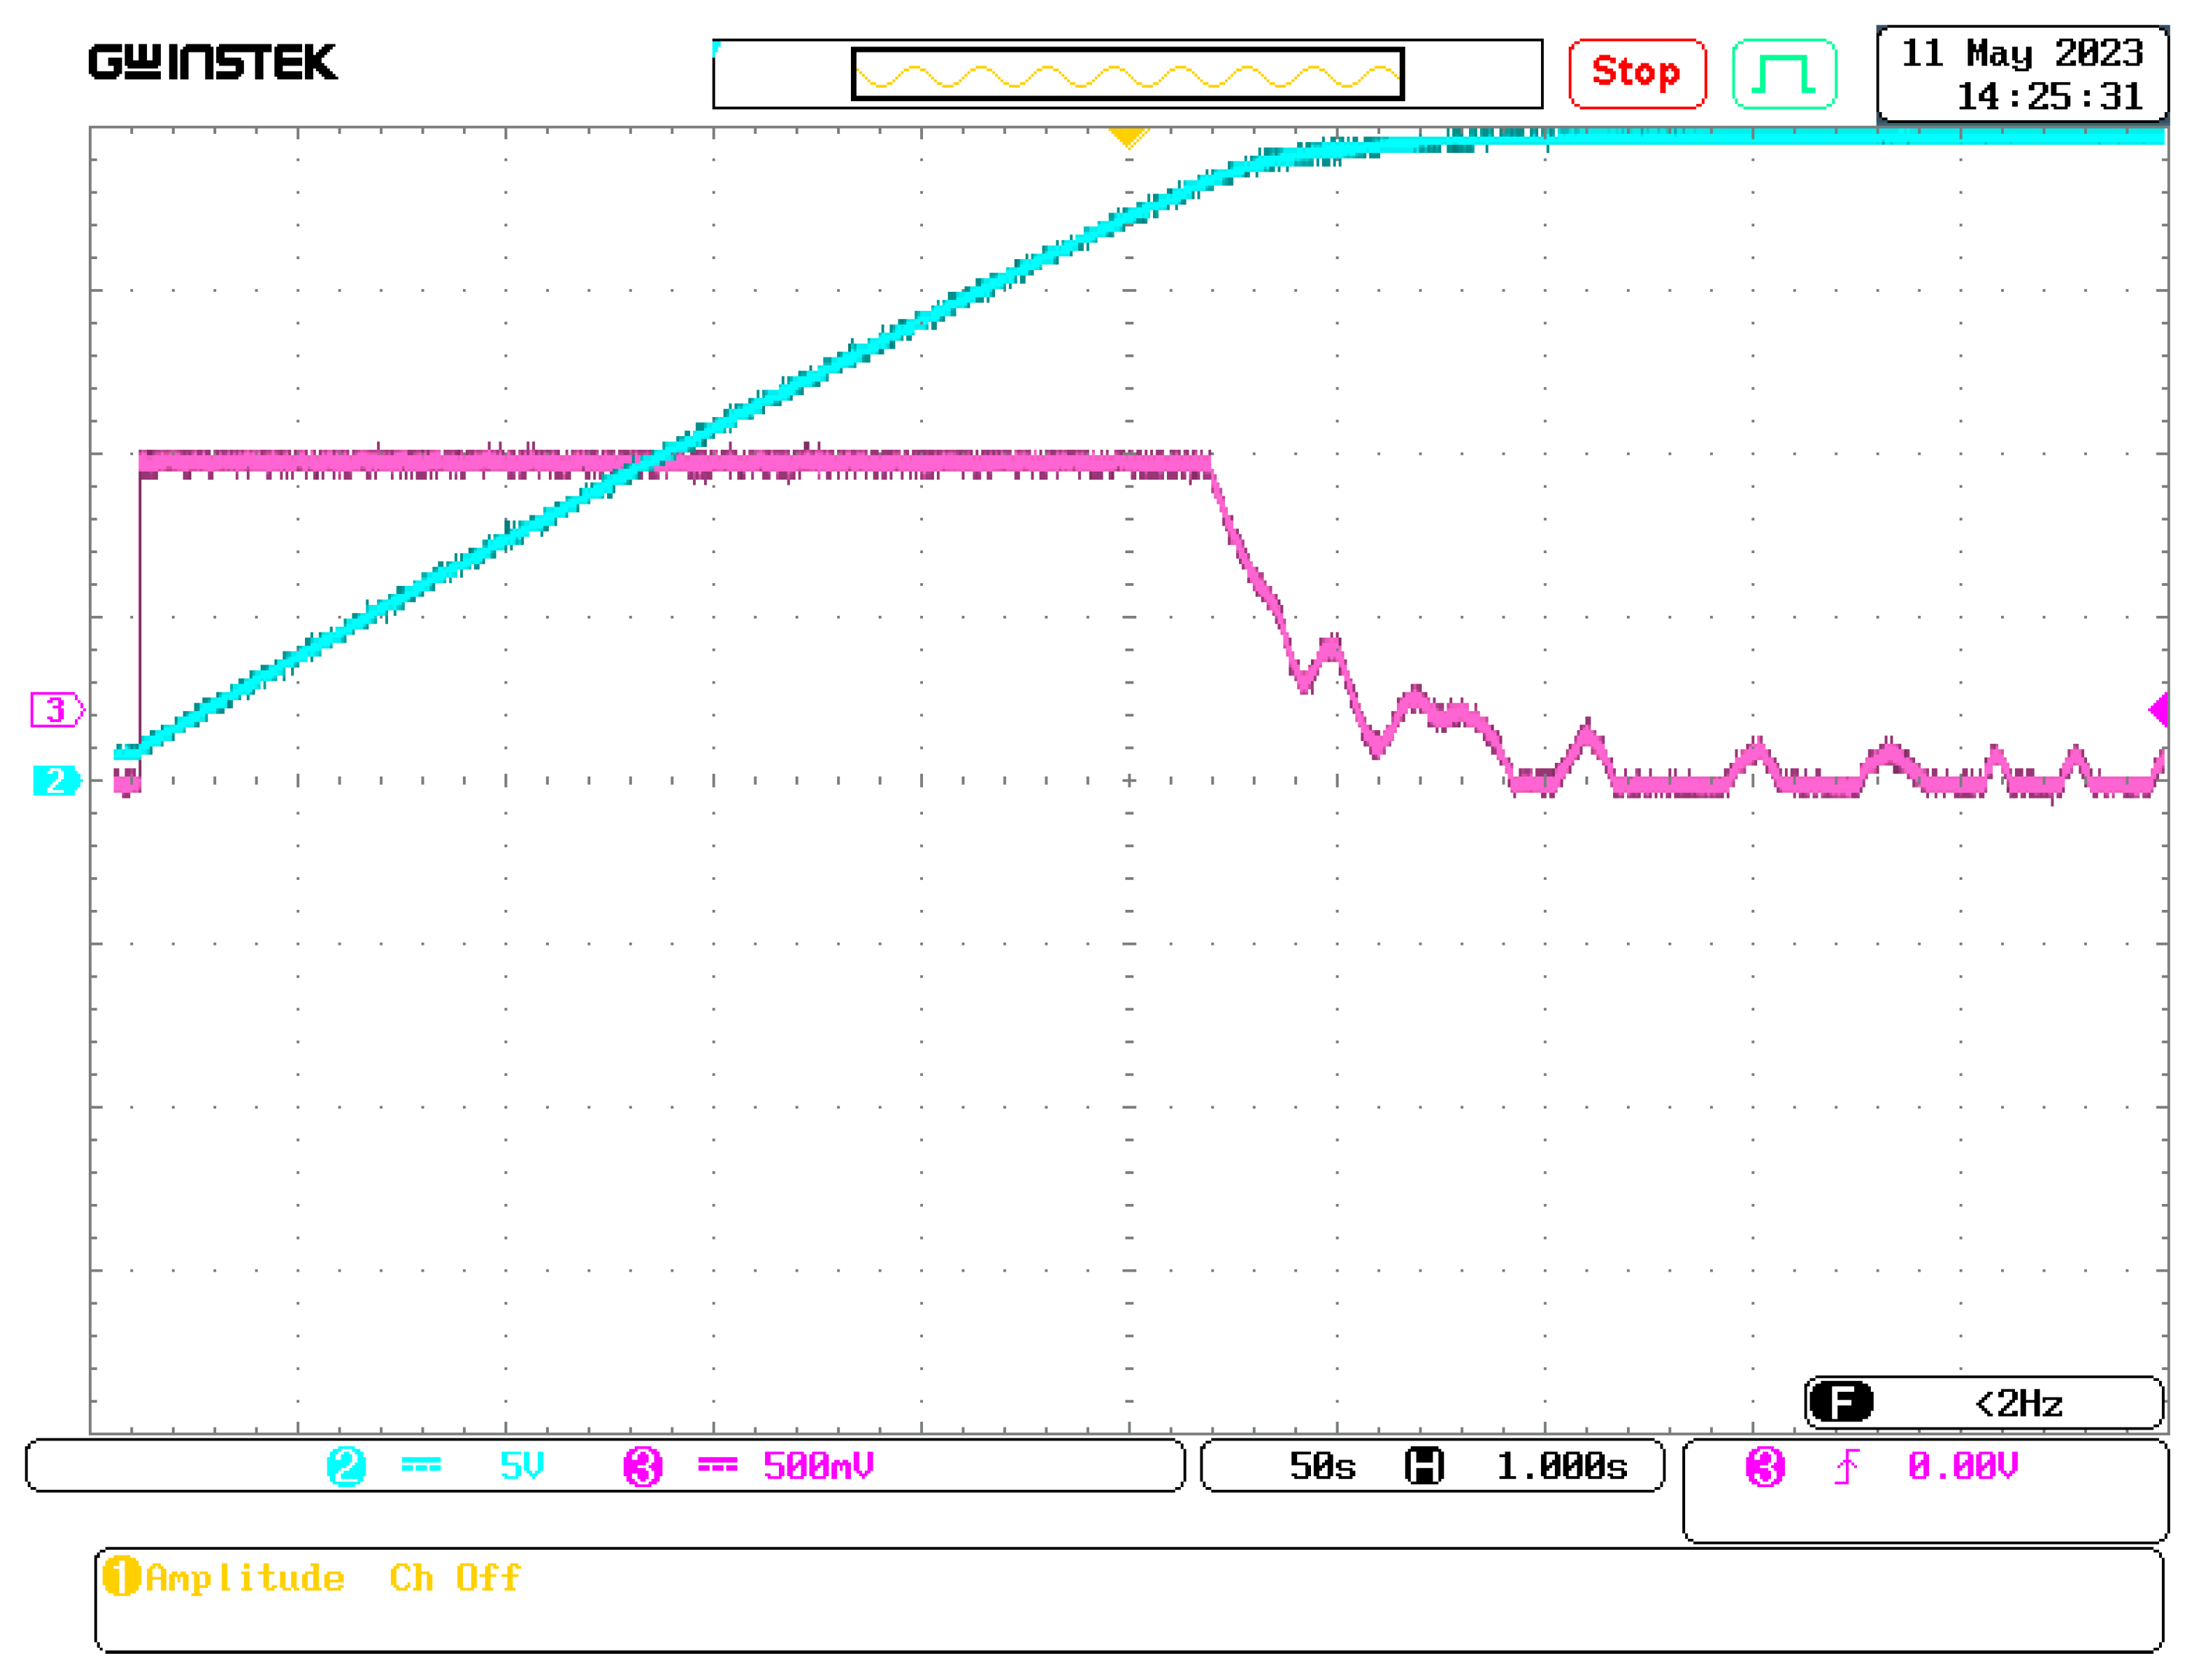
Figure 11.
Photovoltaic system energy management flowchart.
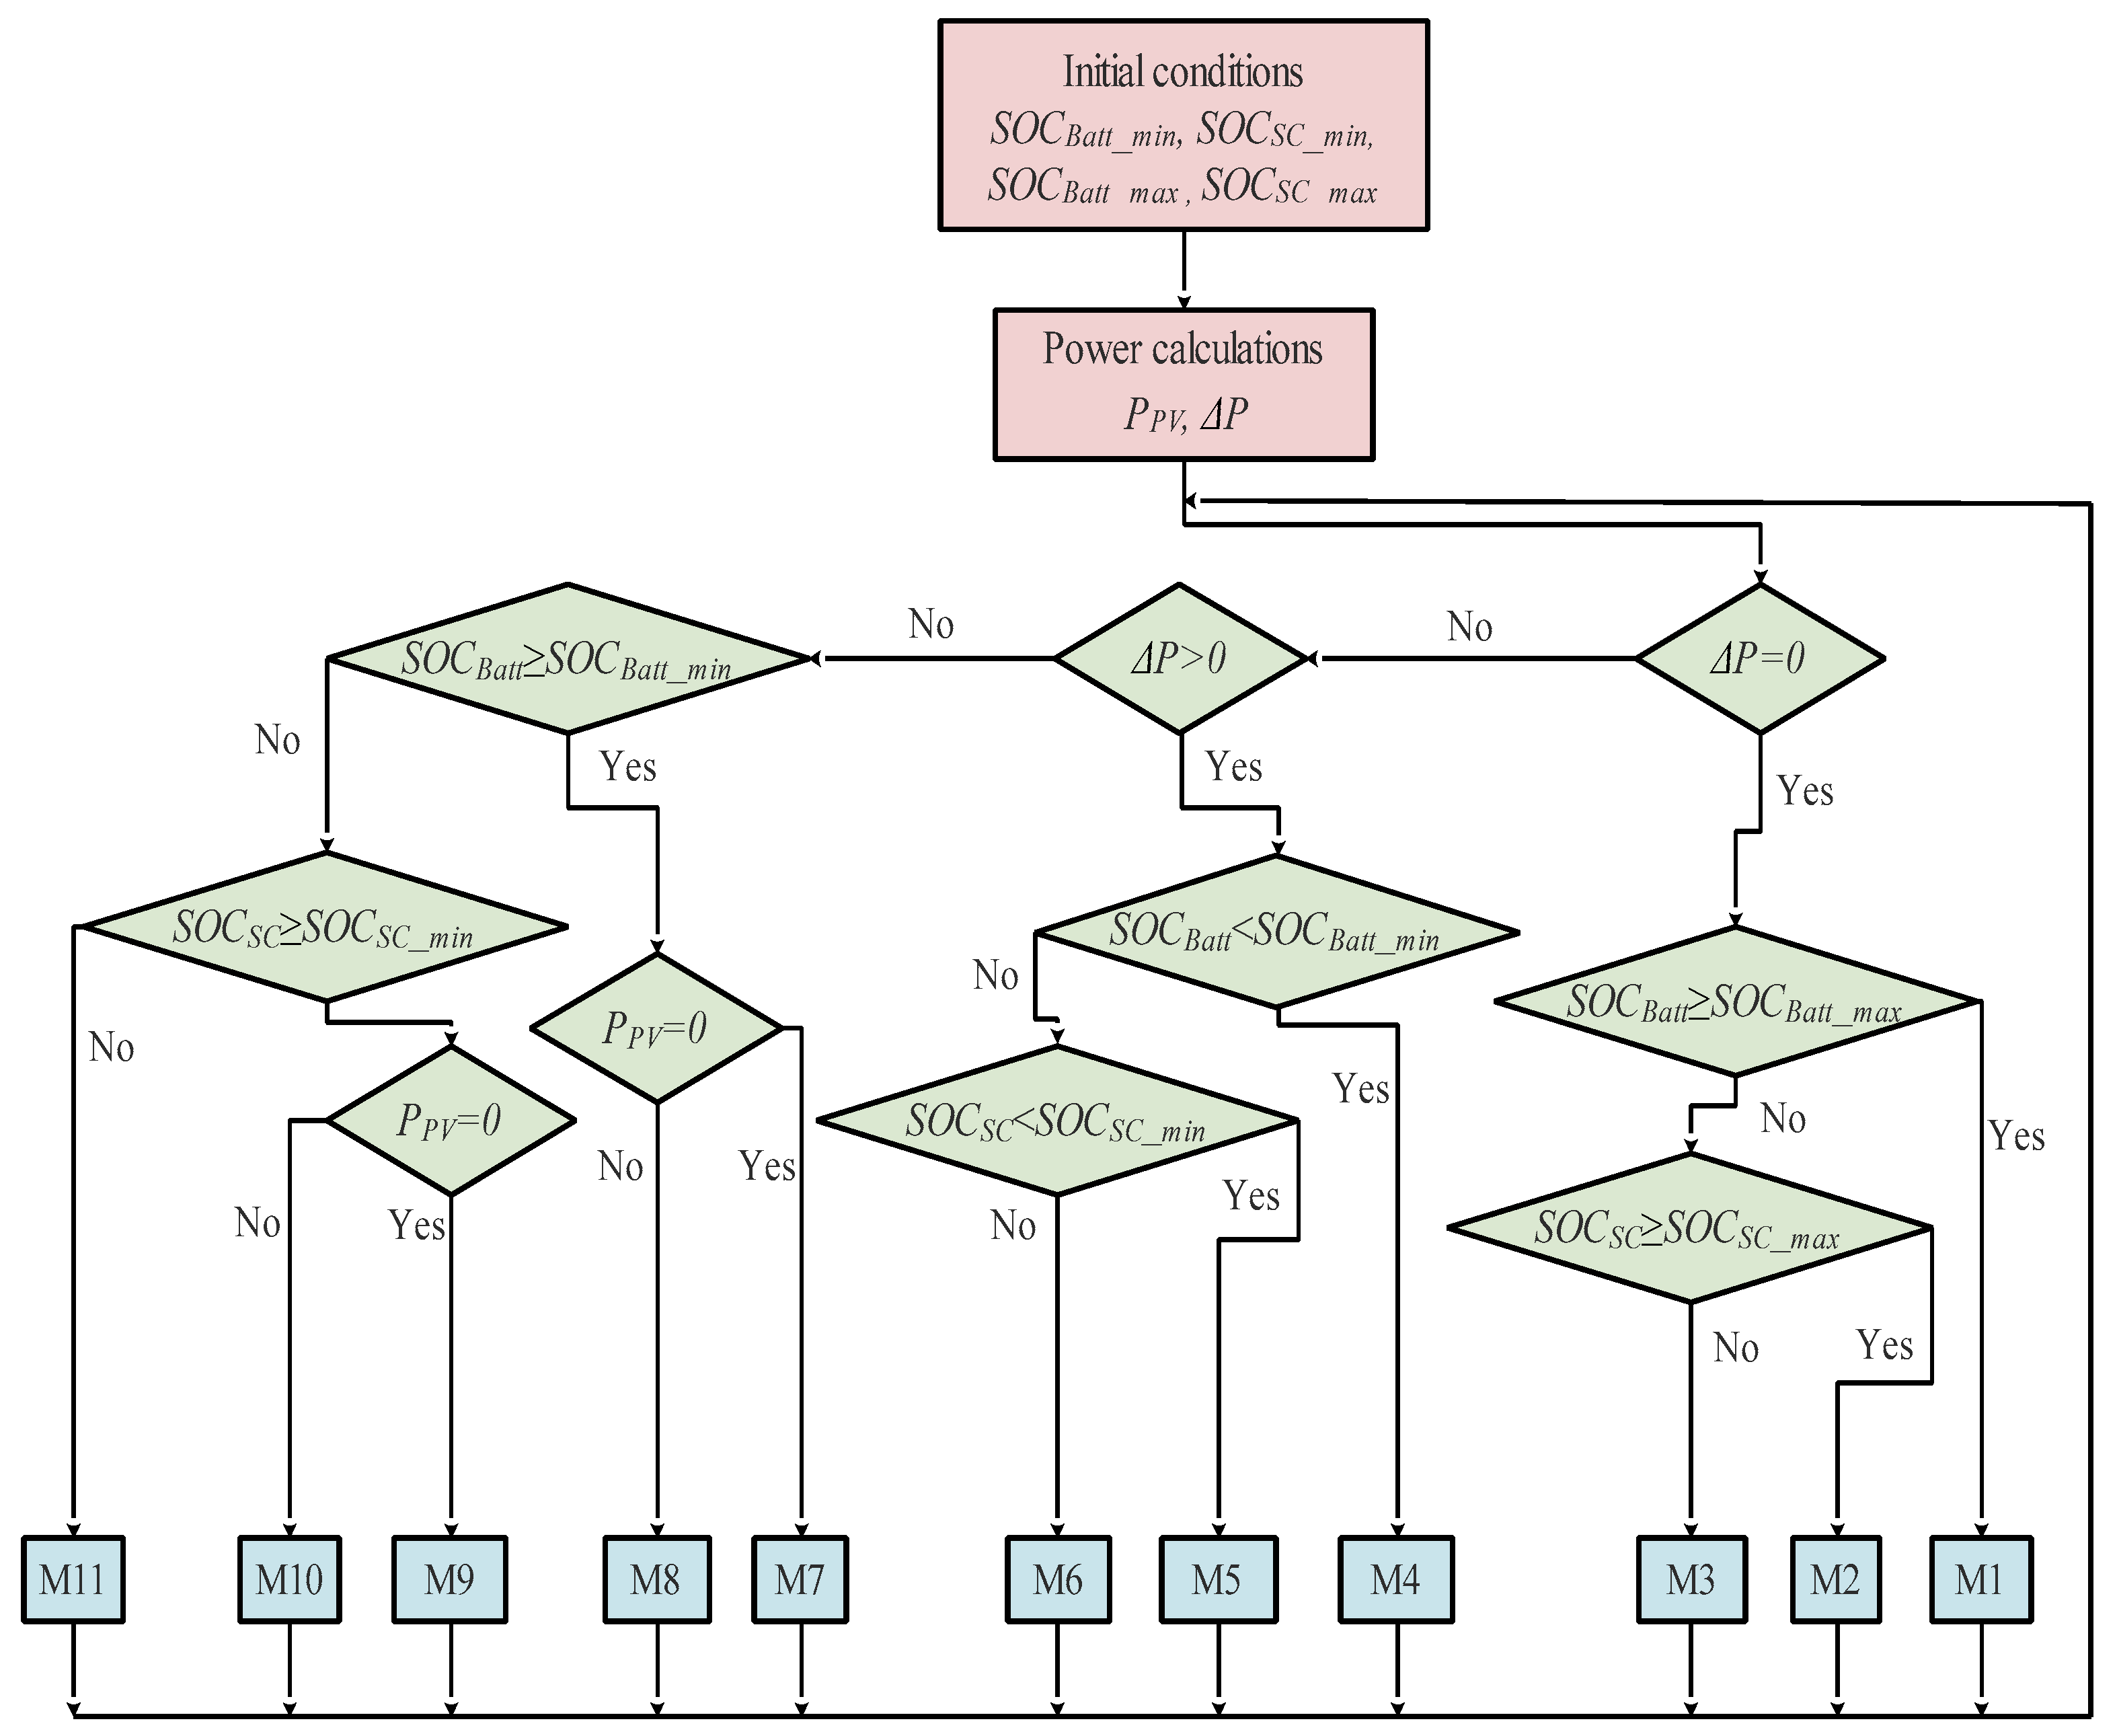
Figure 12.
Measured solar irradiance.
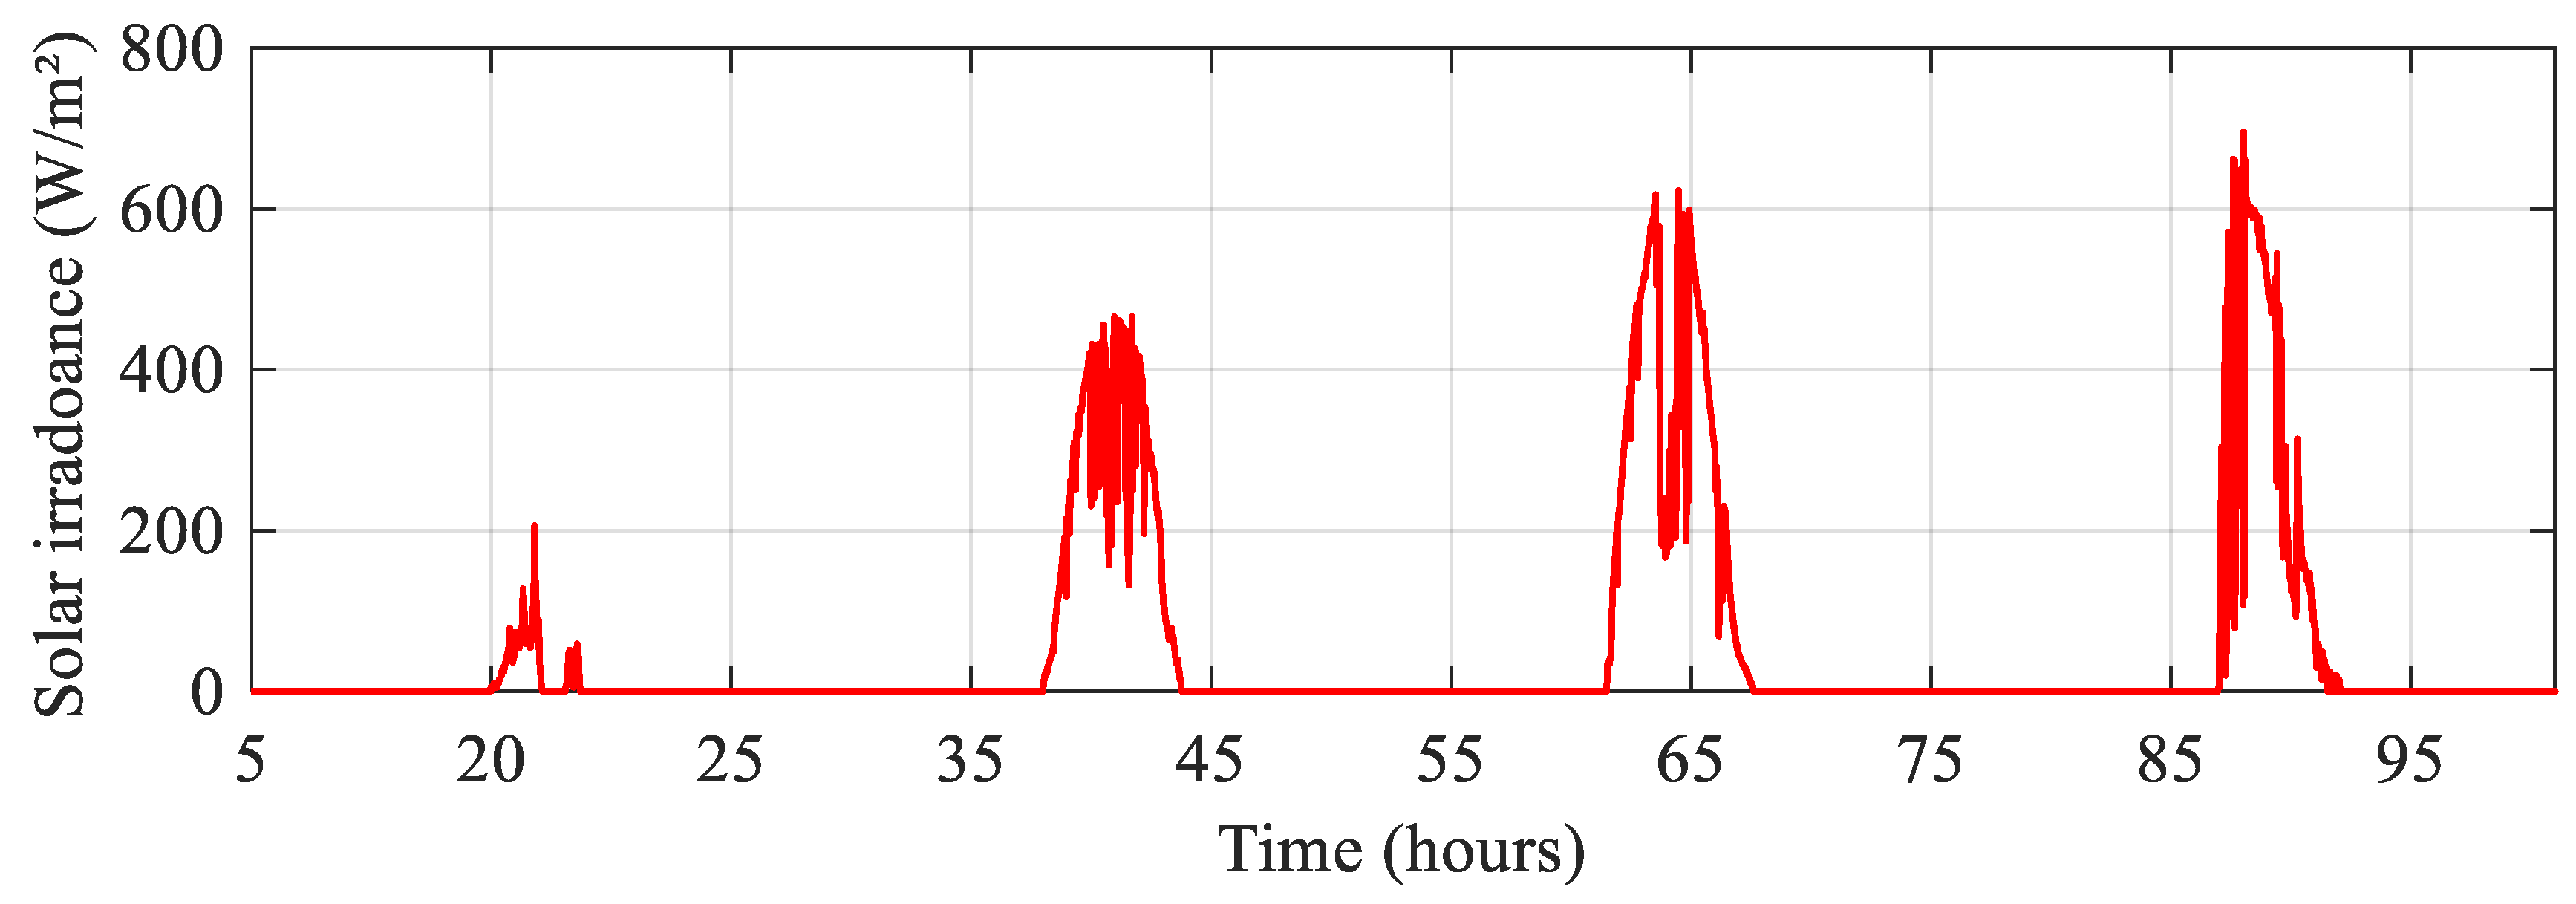
Figure 13.
Ambient temperature.
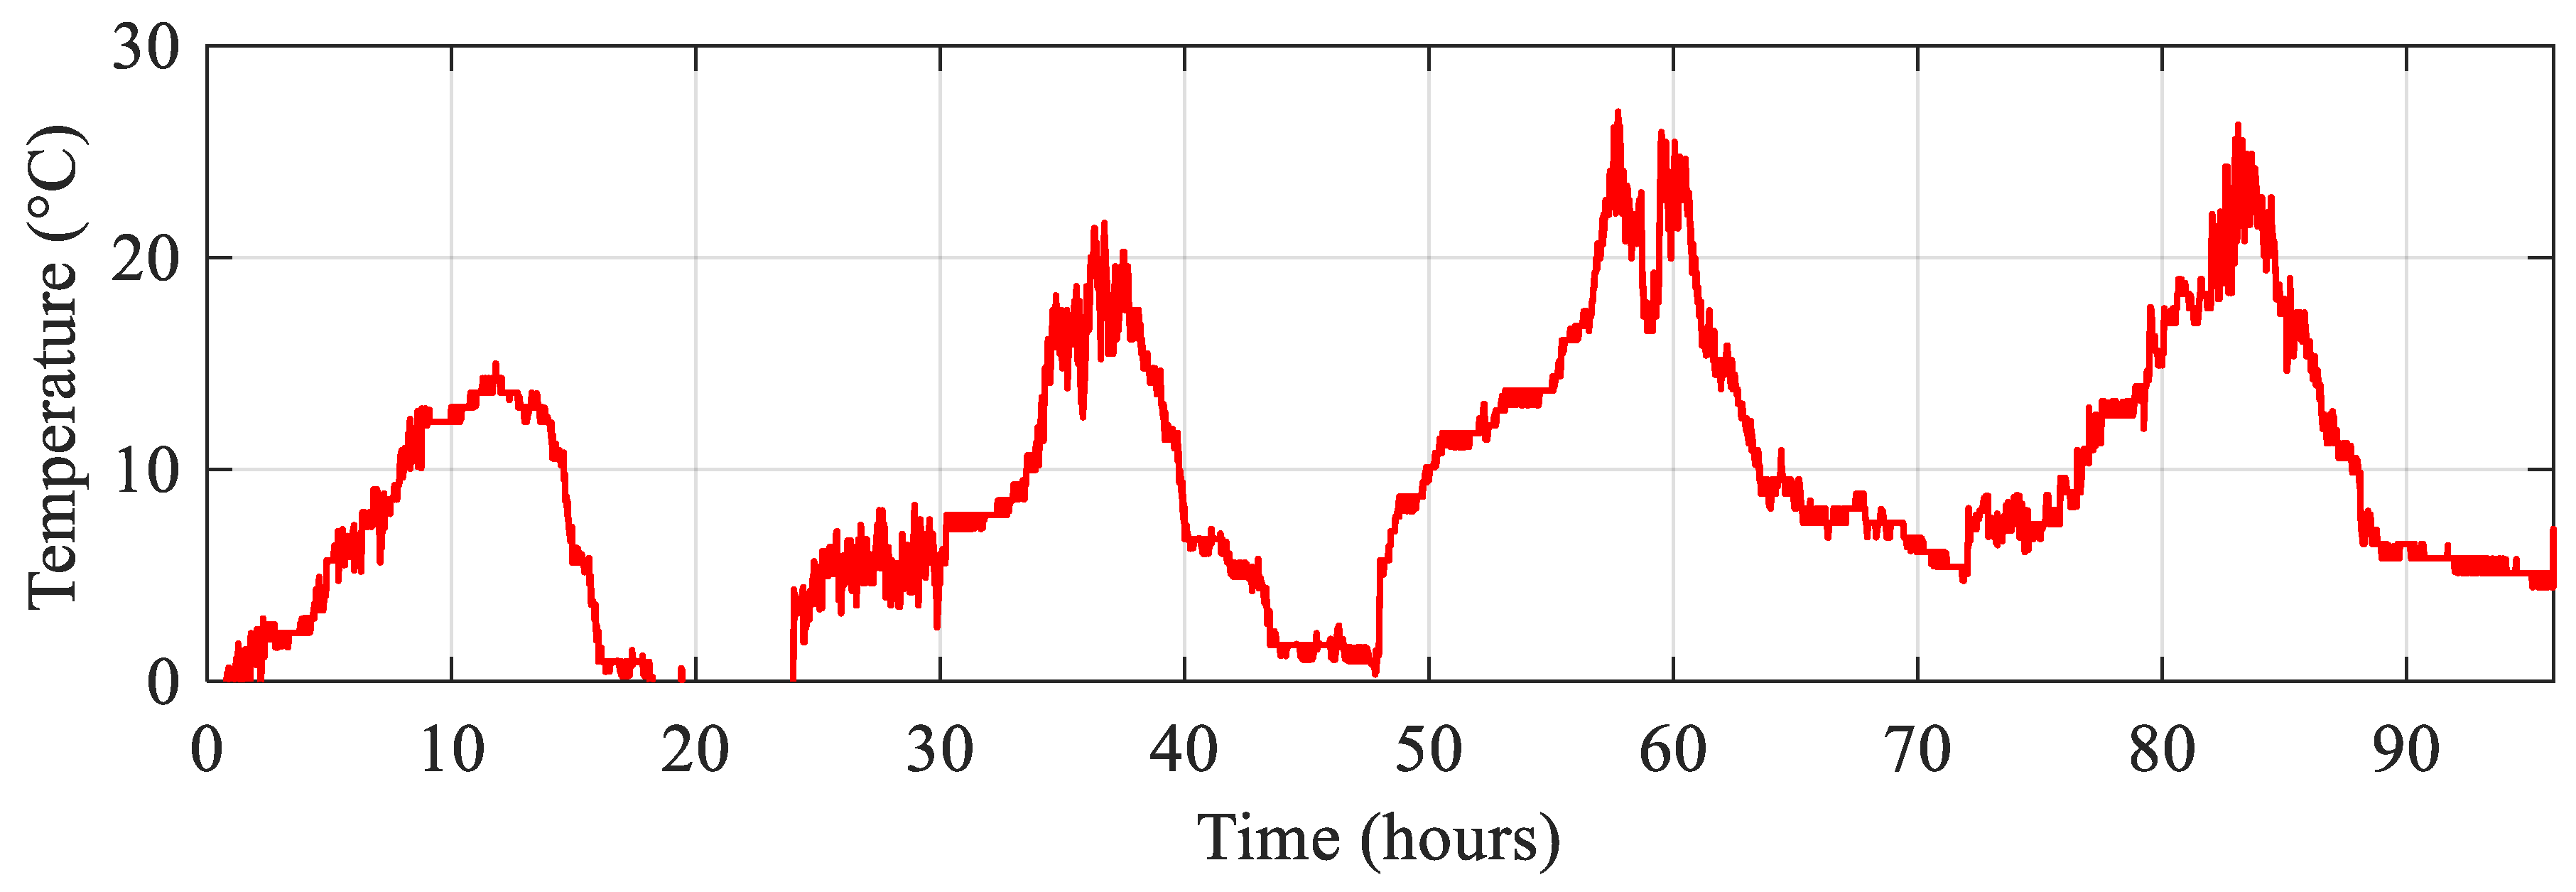
Figure 14.
DC bus voltage.
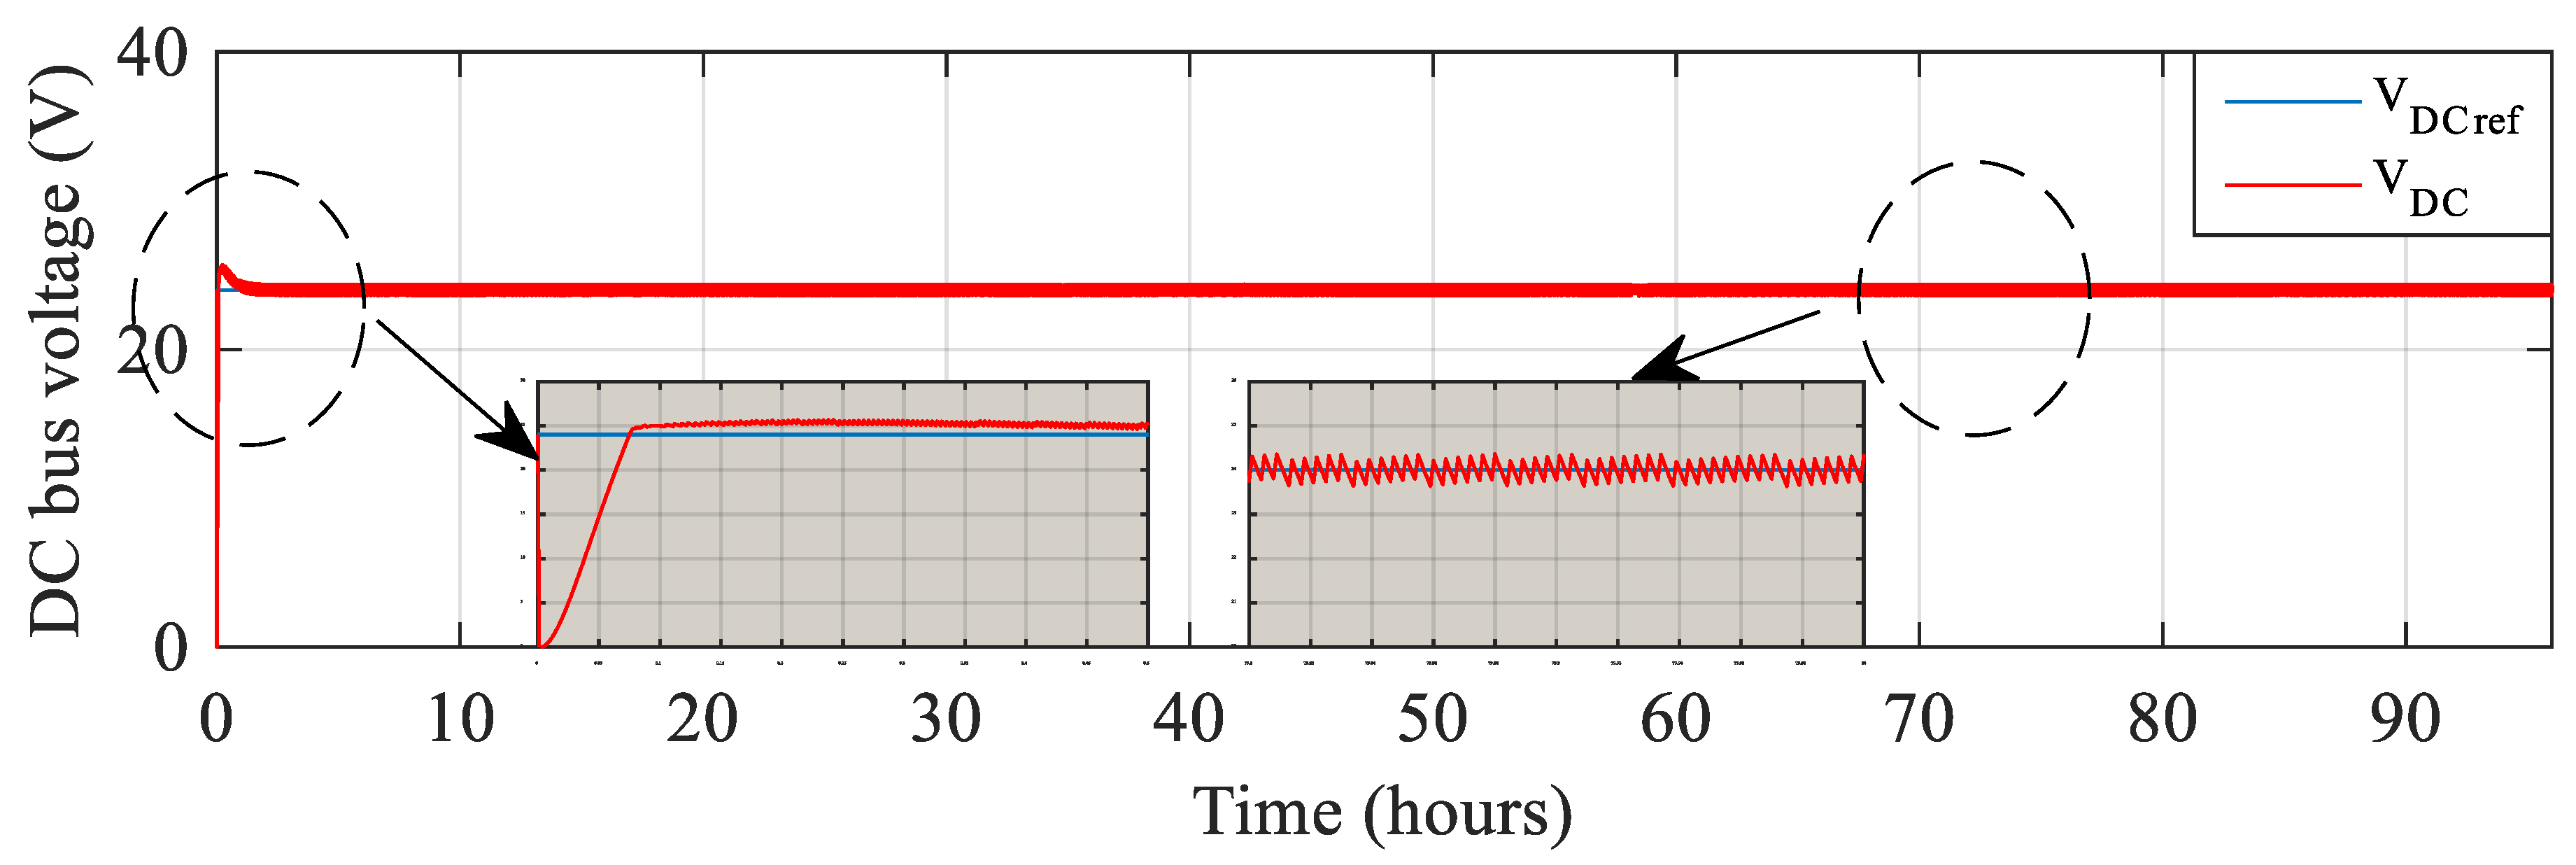
Figure 15.
Voltage battery and supercapacitor.
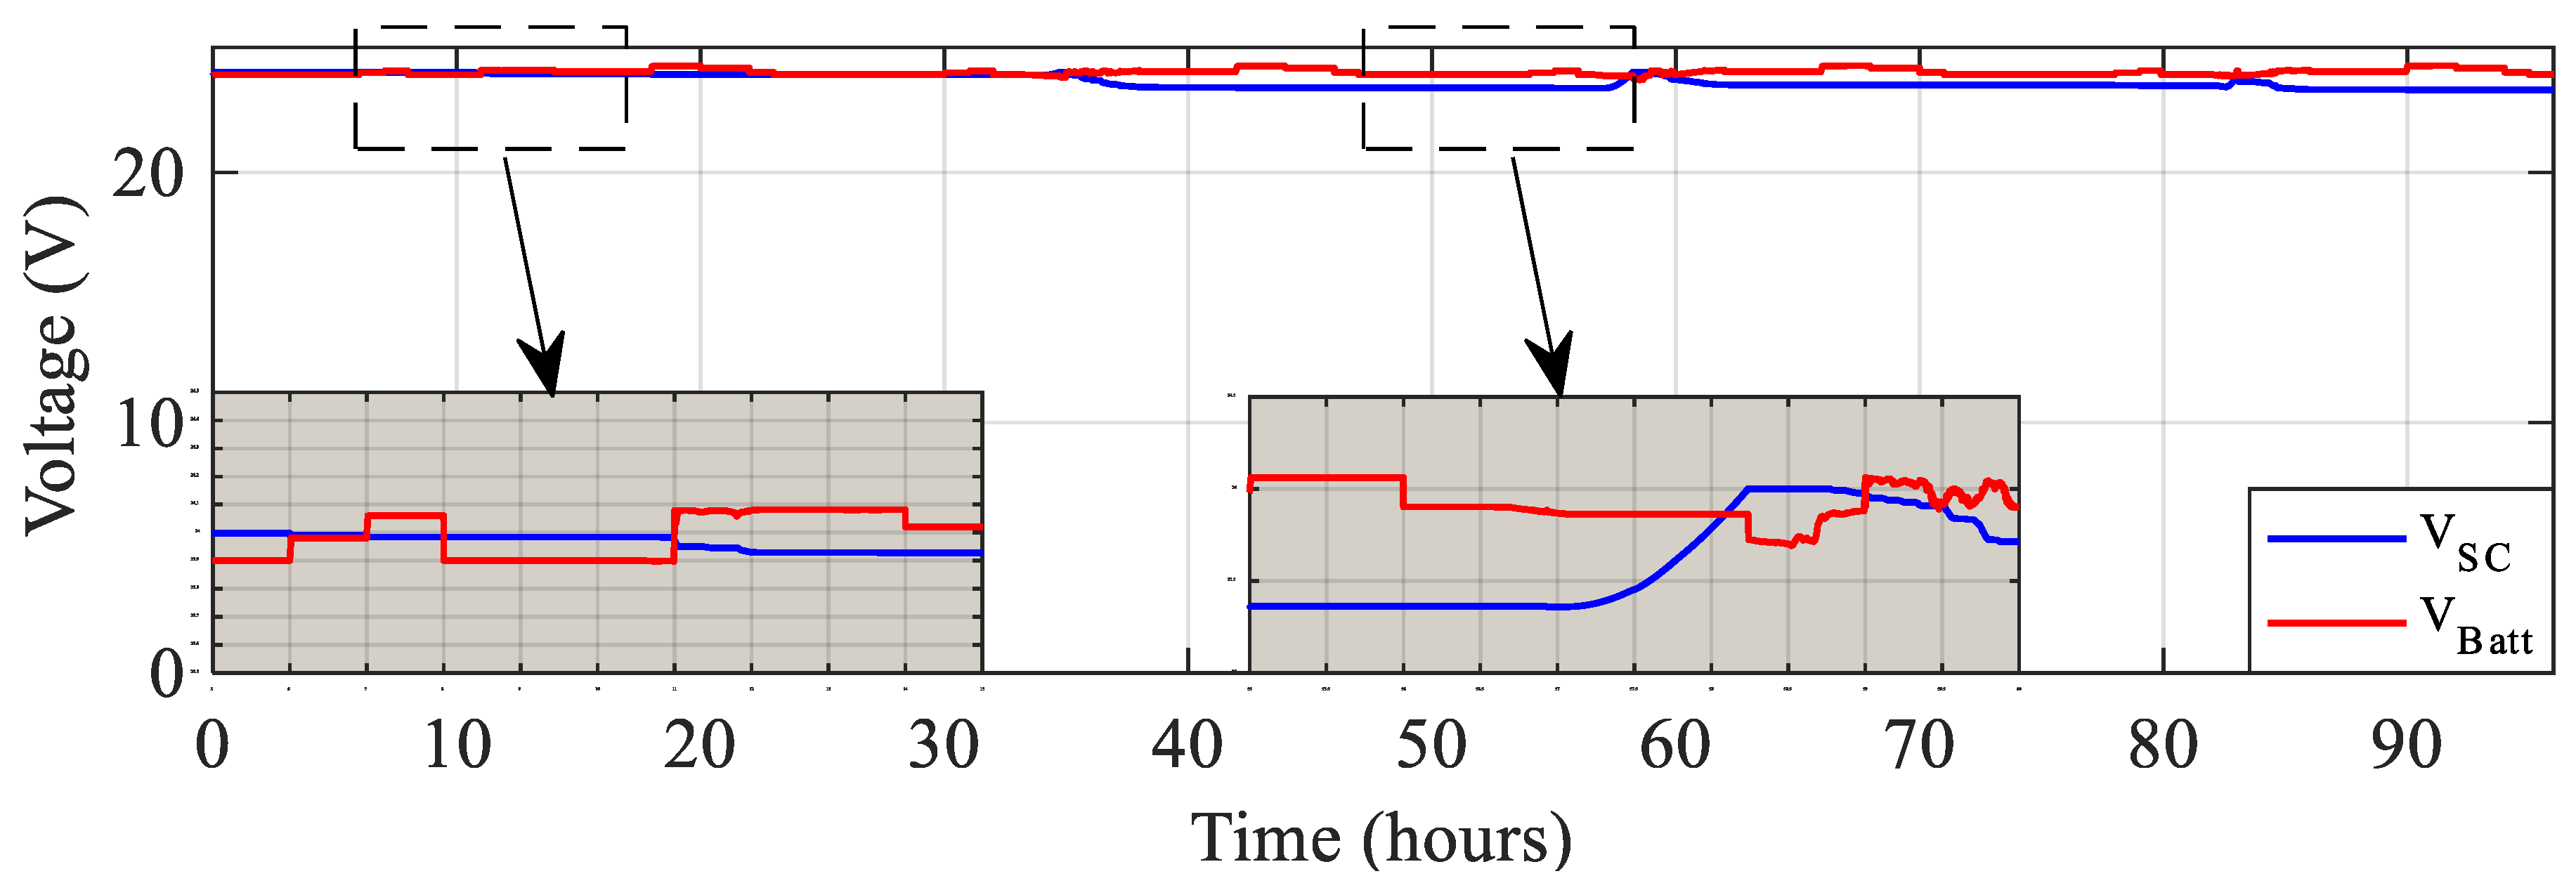
Figure 16.
Battery and supercapacitorSOC.
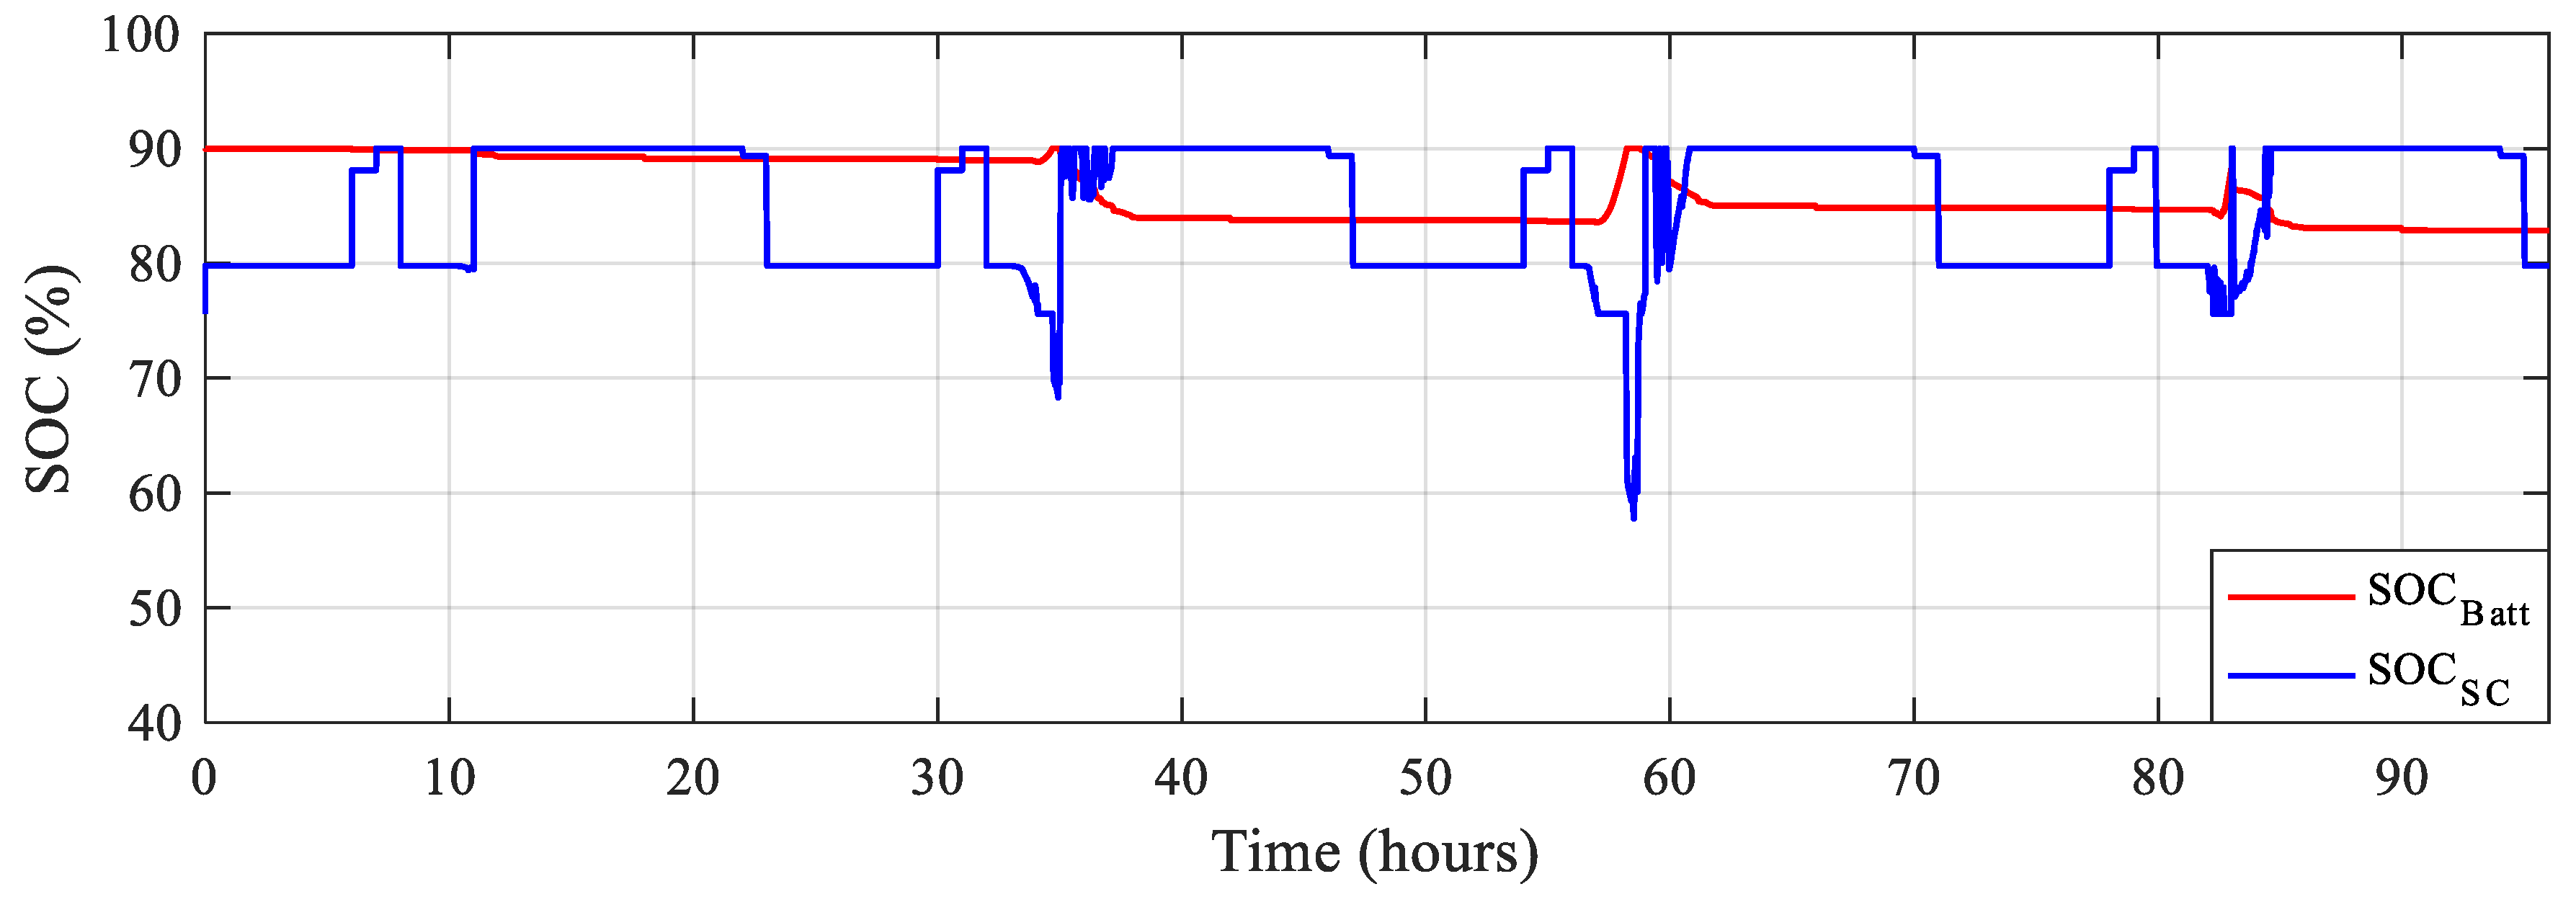
Figure 17.
Battery and supercapacitor currents.
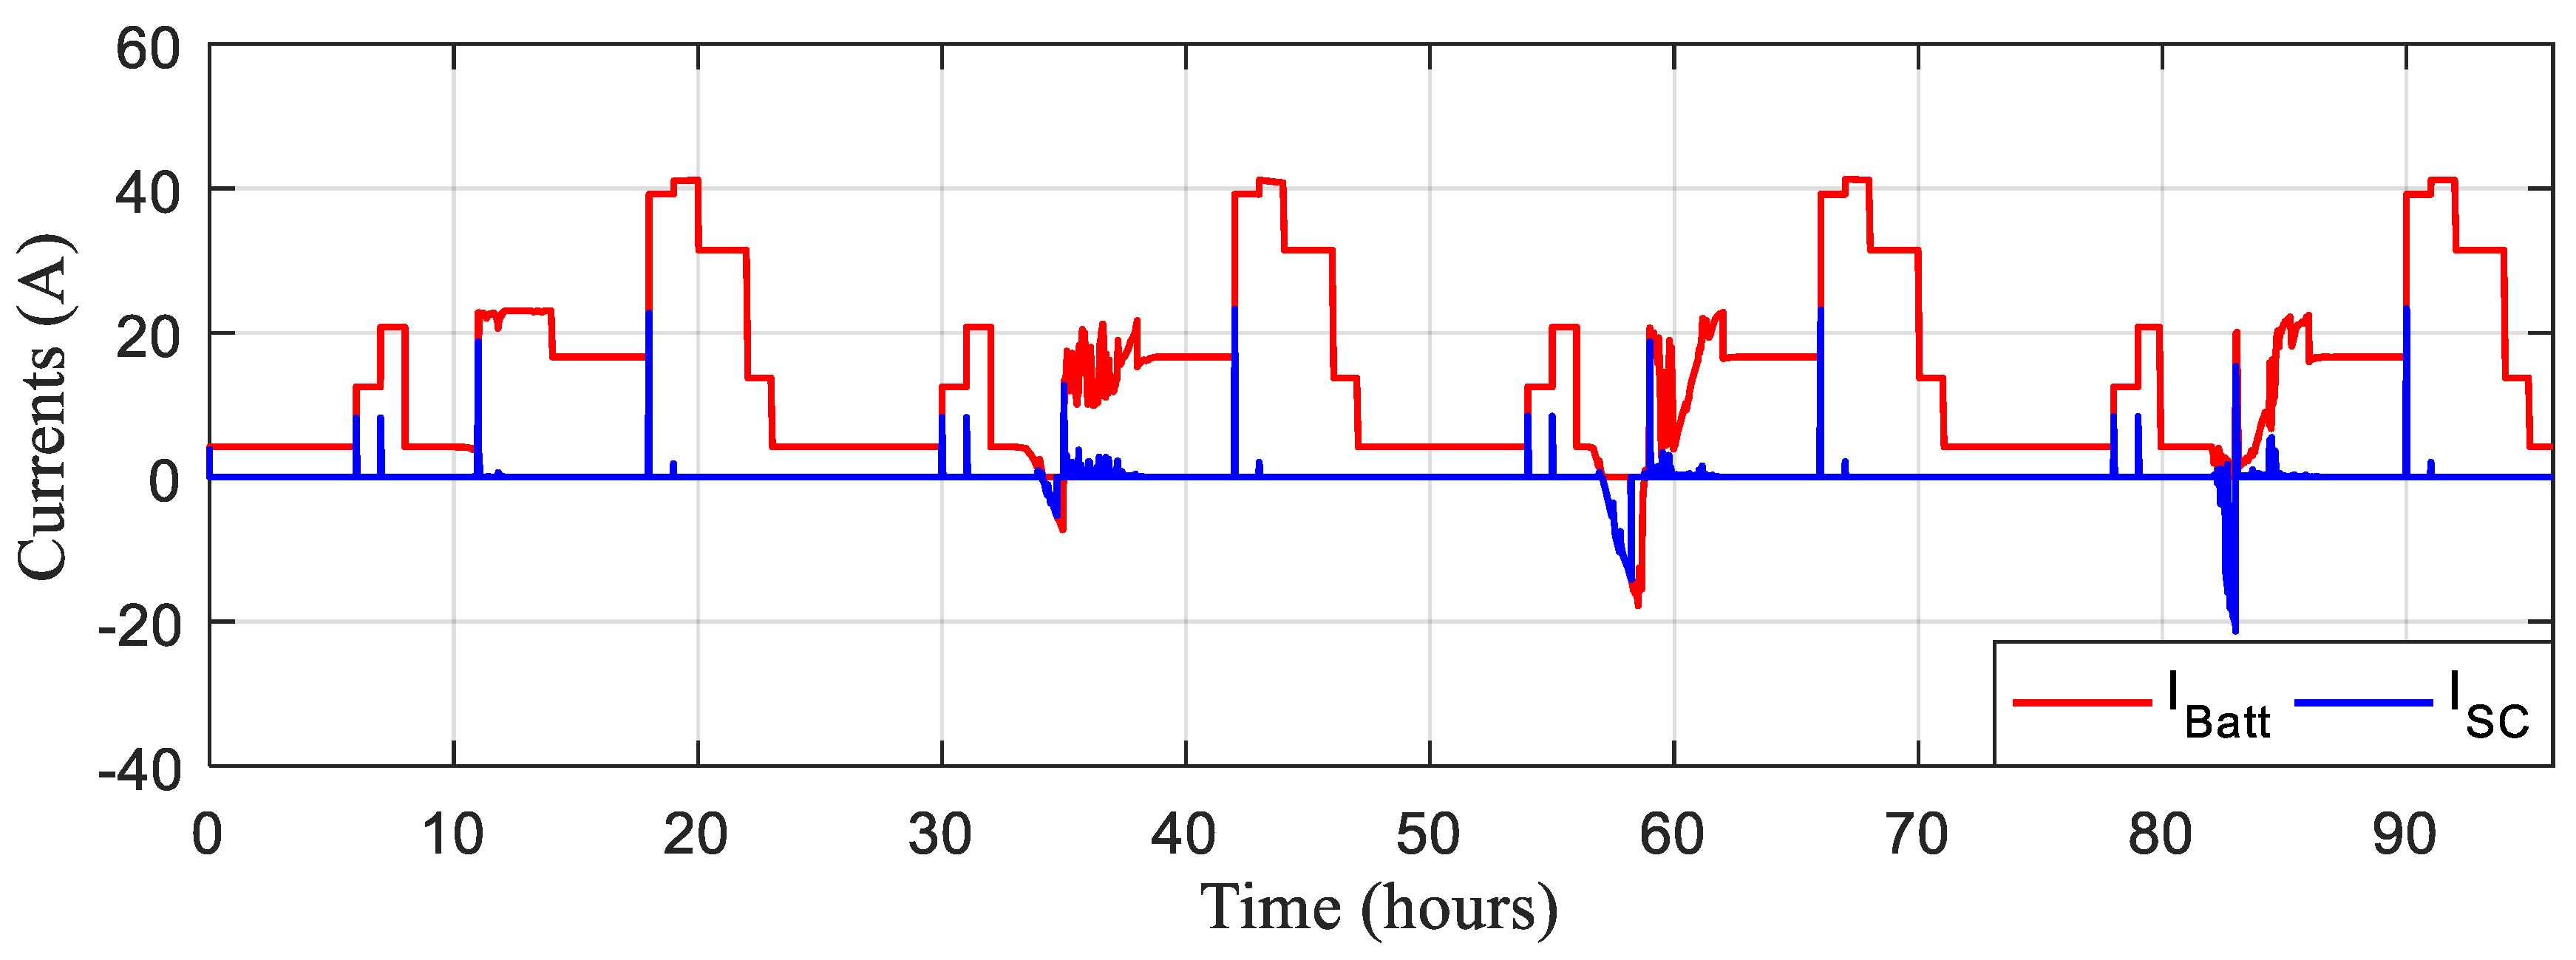
Figure 18.
Differentobtainedmodes.
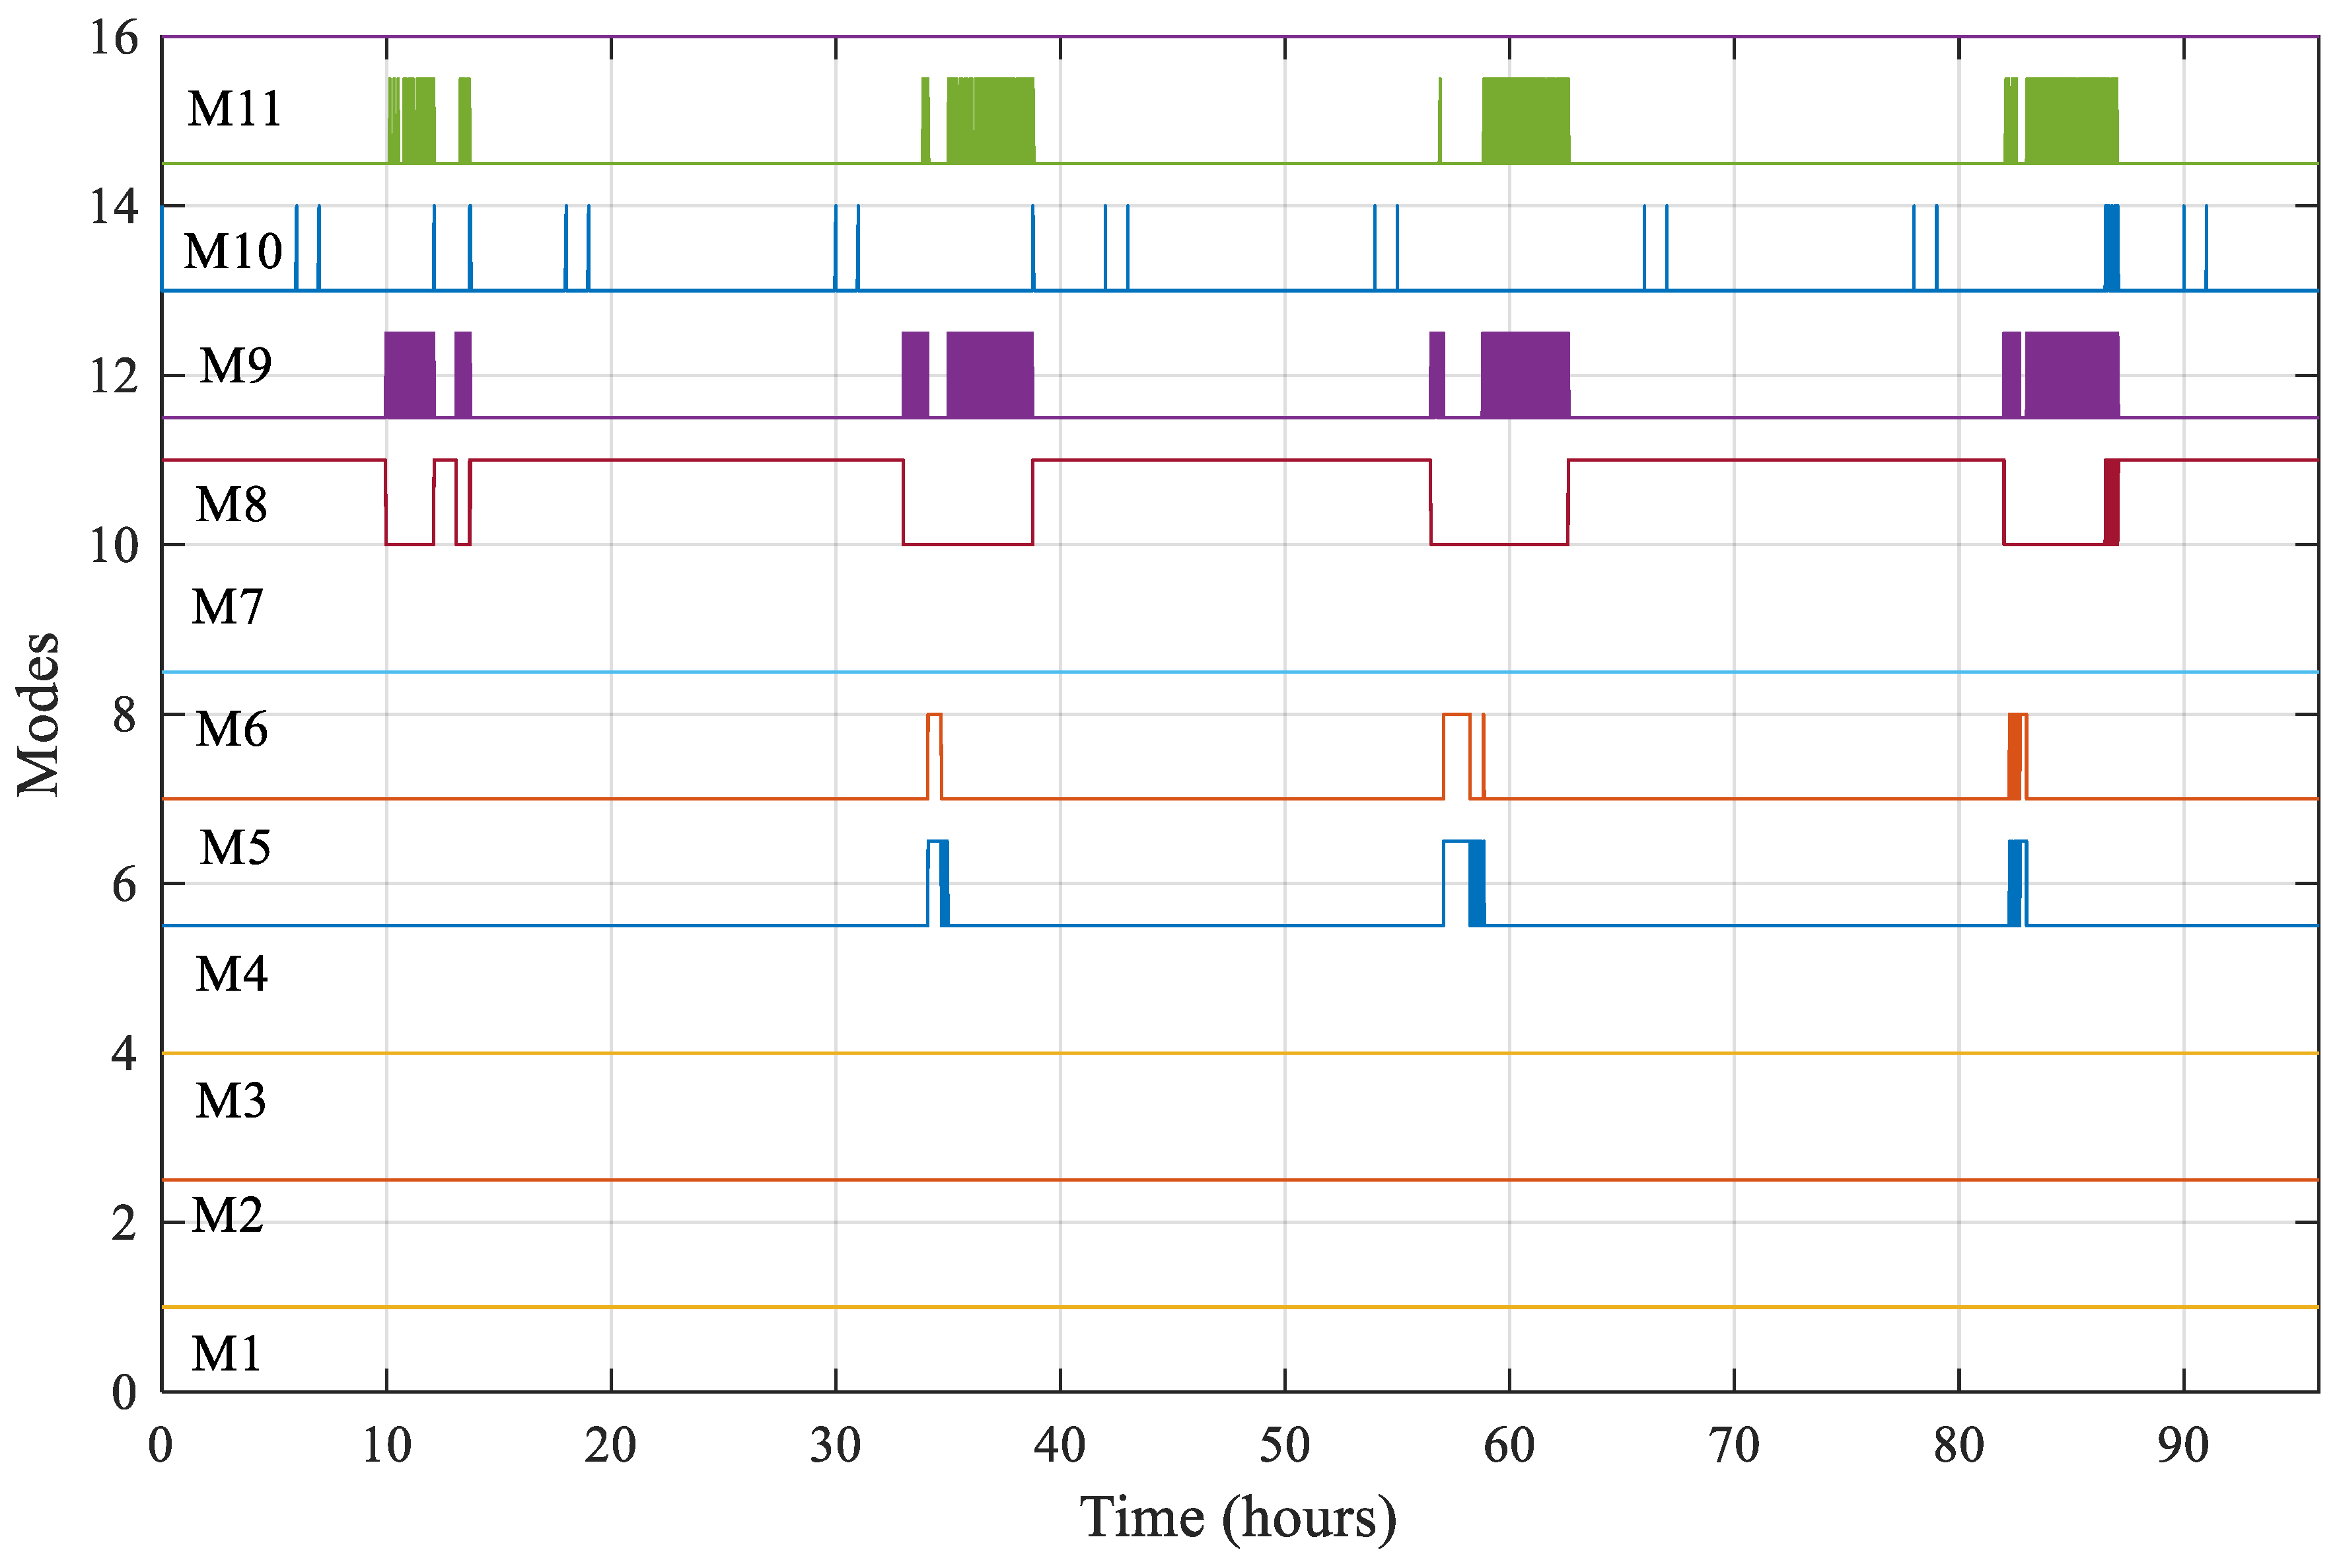
Figure 19.
The different powers.

Figure 20.
Powers per day with the different modes.
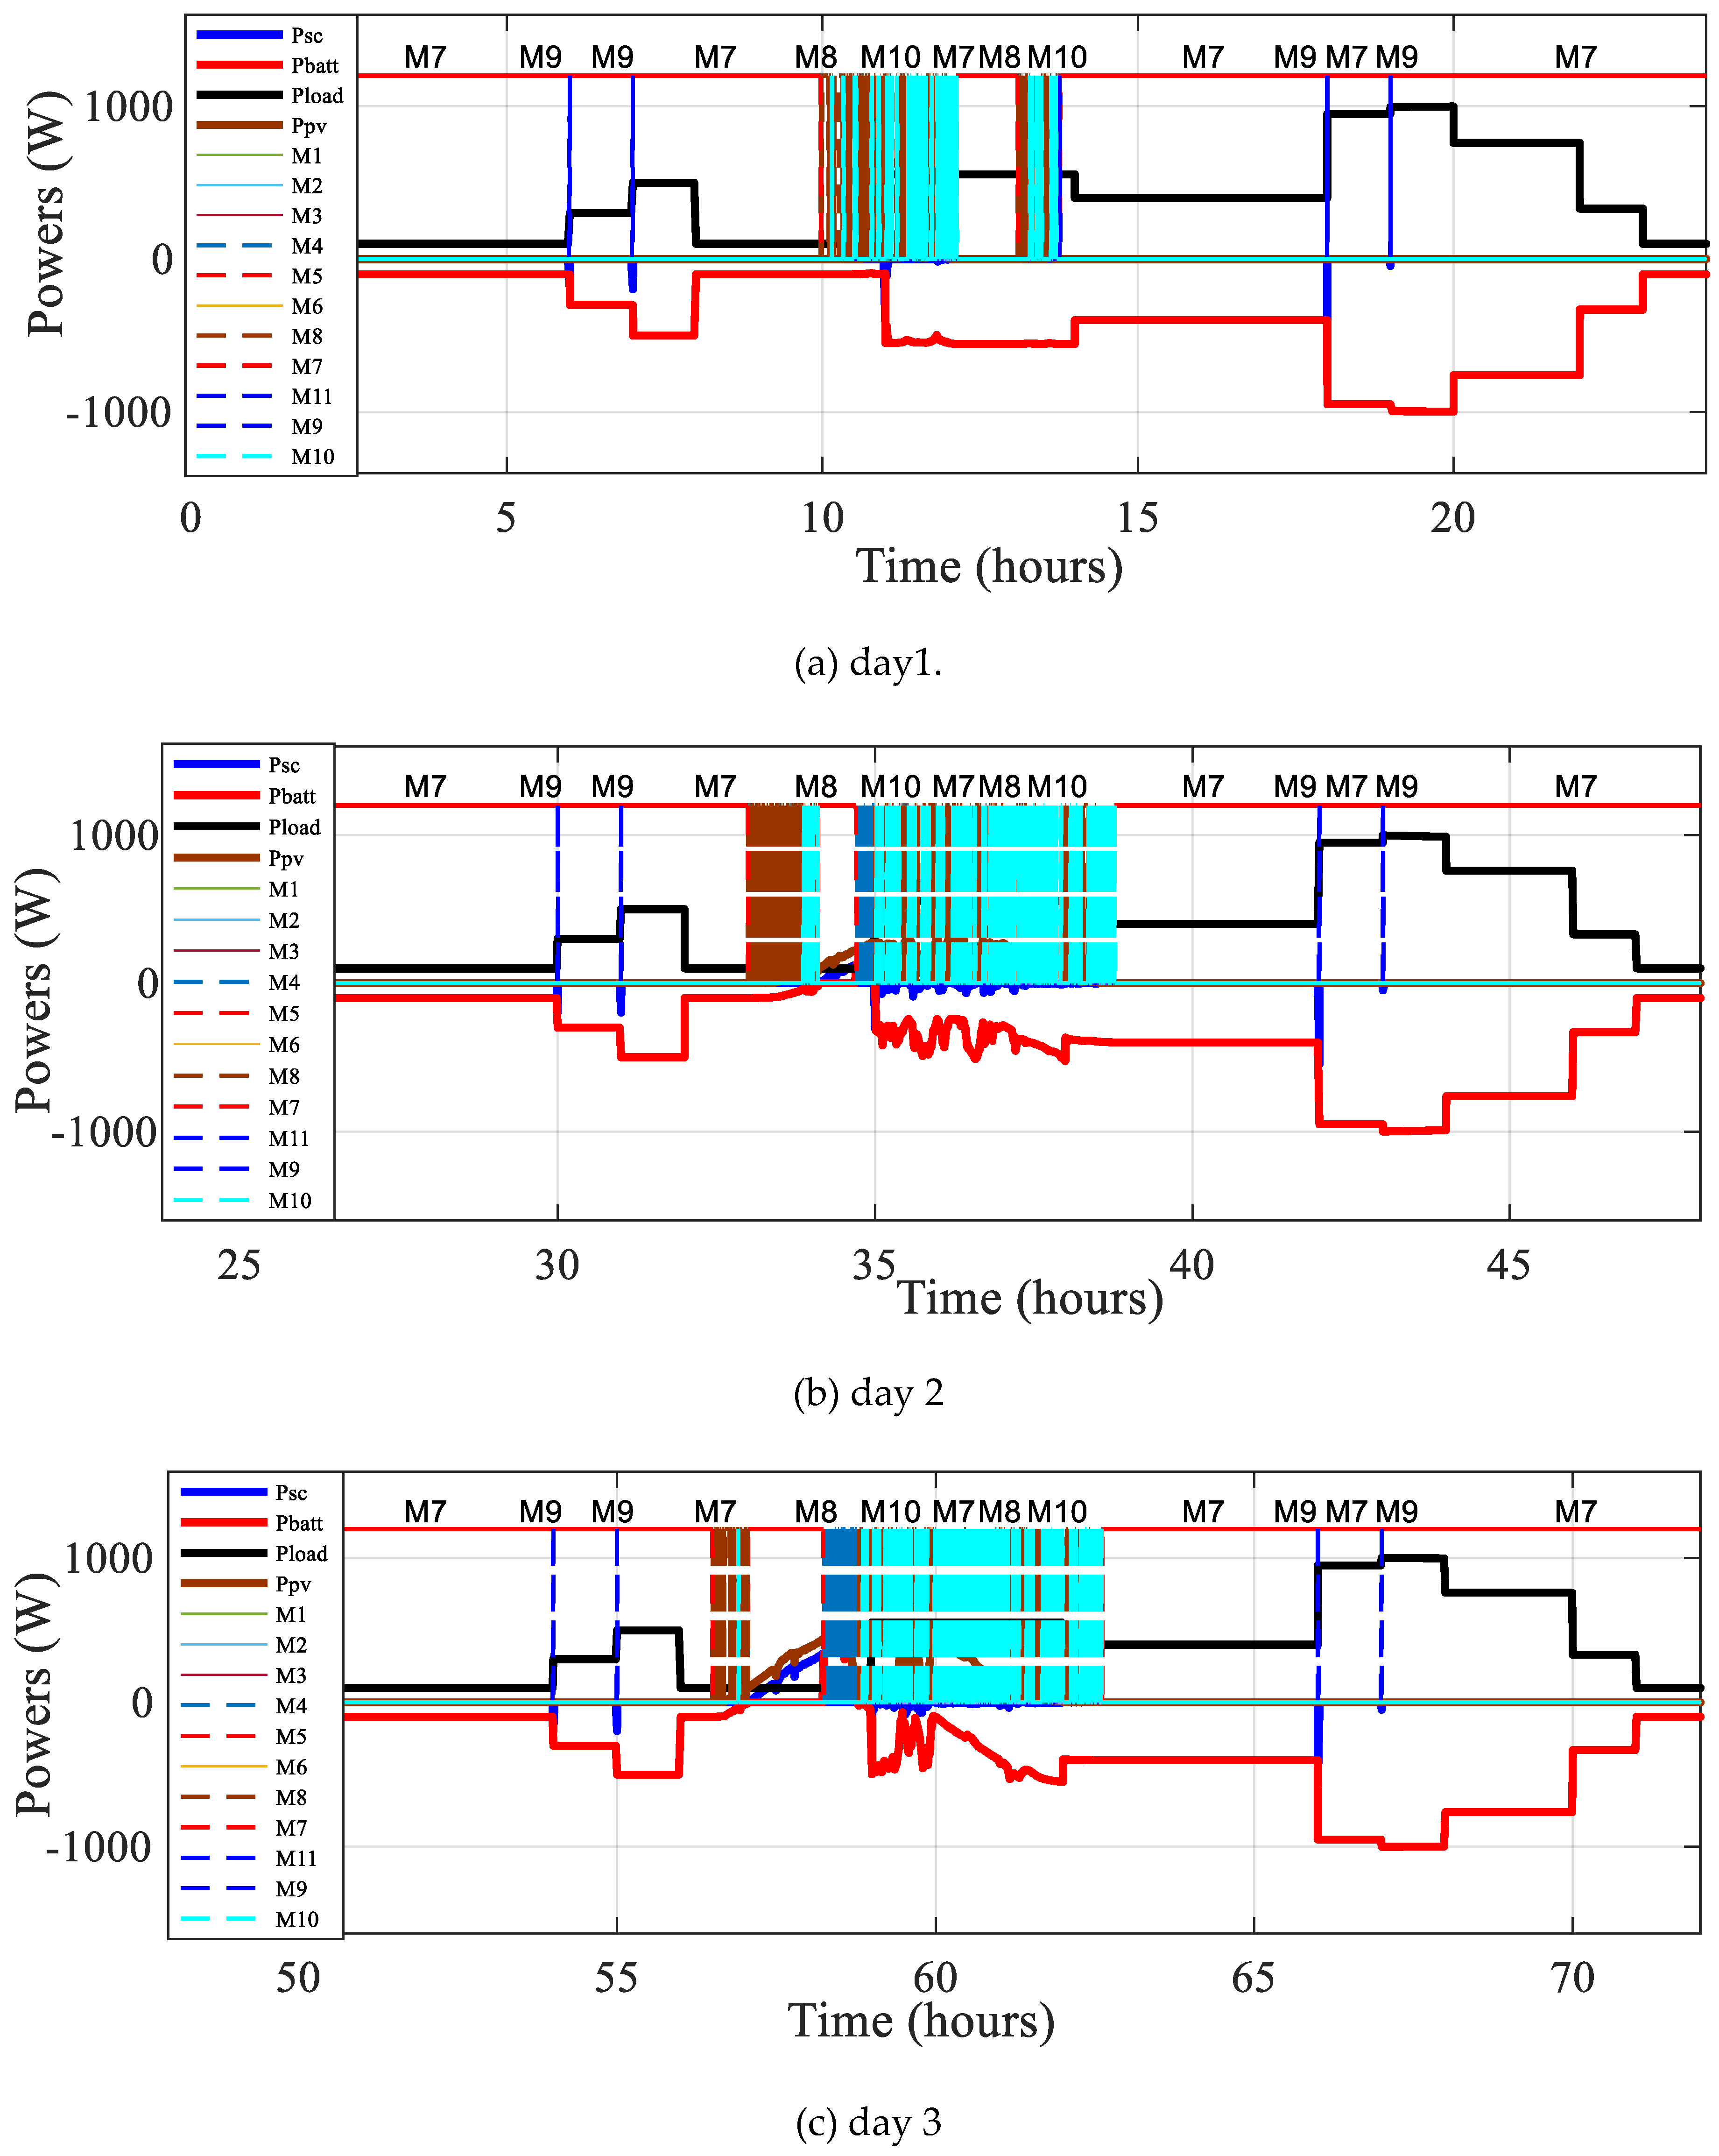
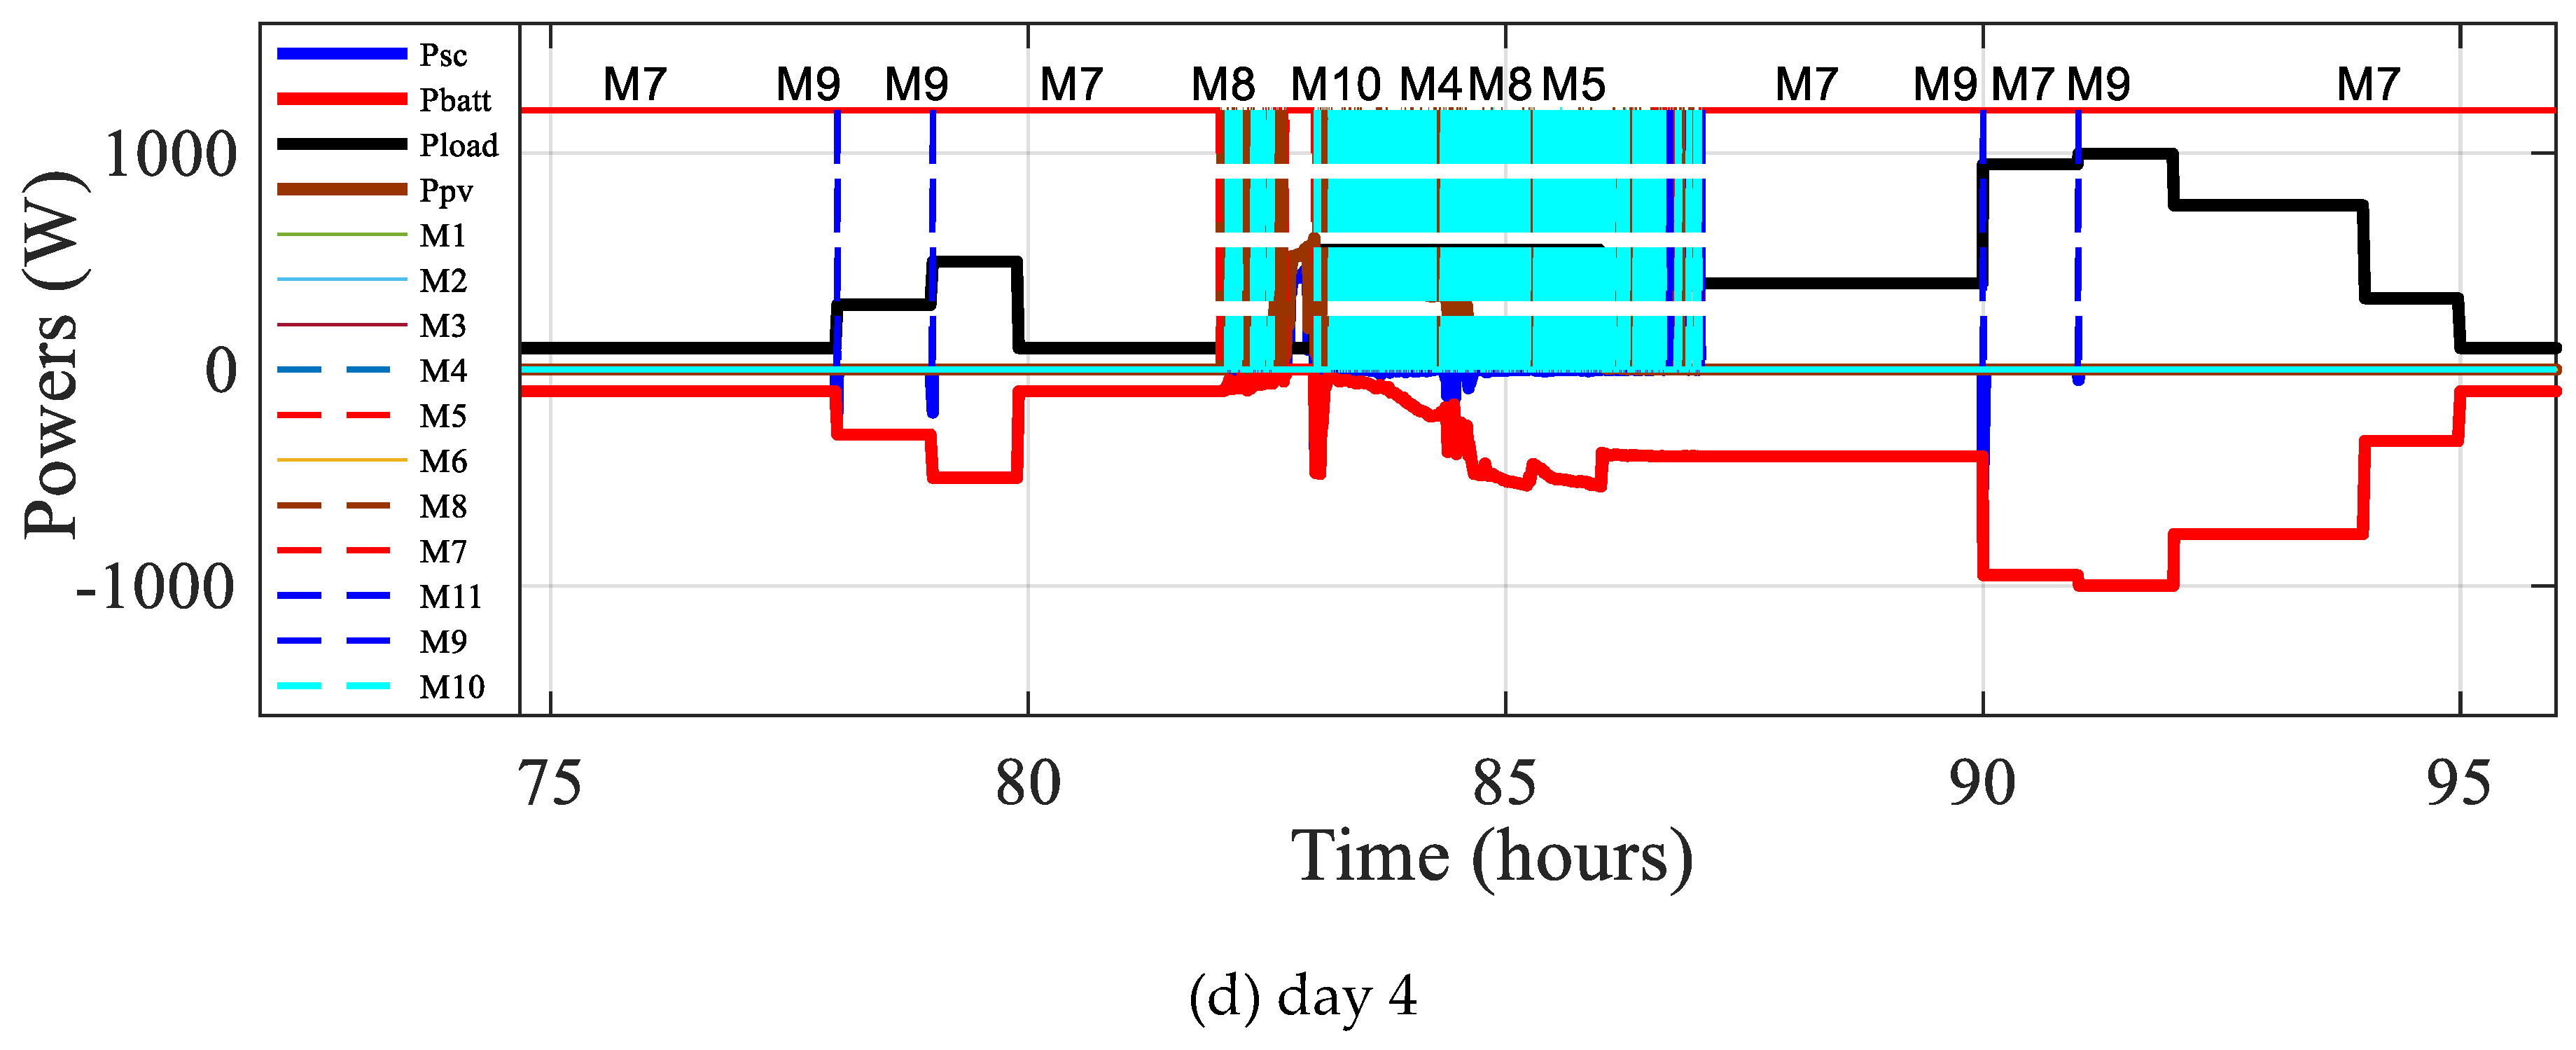
Figure 21.
Calculated Ploadcal and developped Ploadload power.

Figure 22.
Zoomson calculated and developped load power.
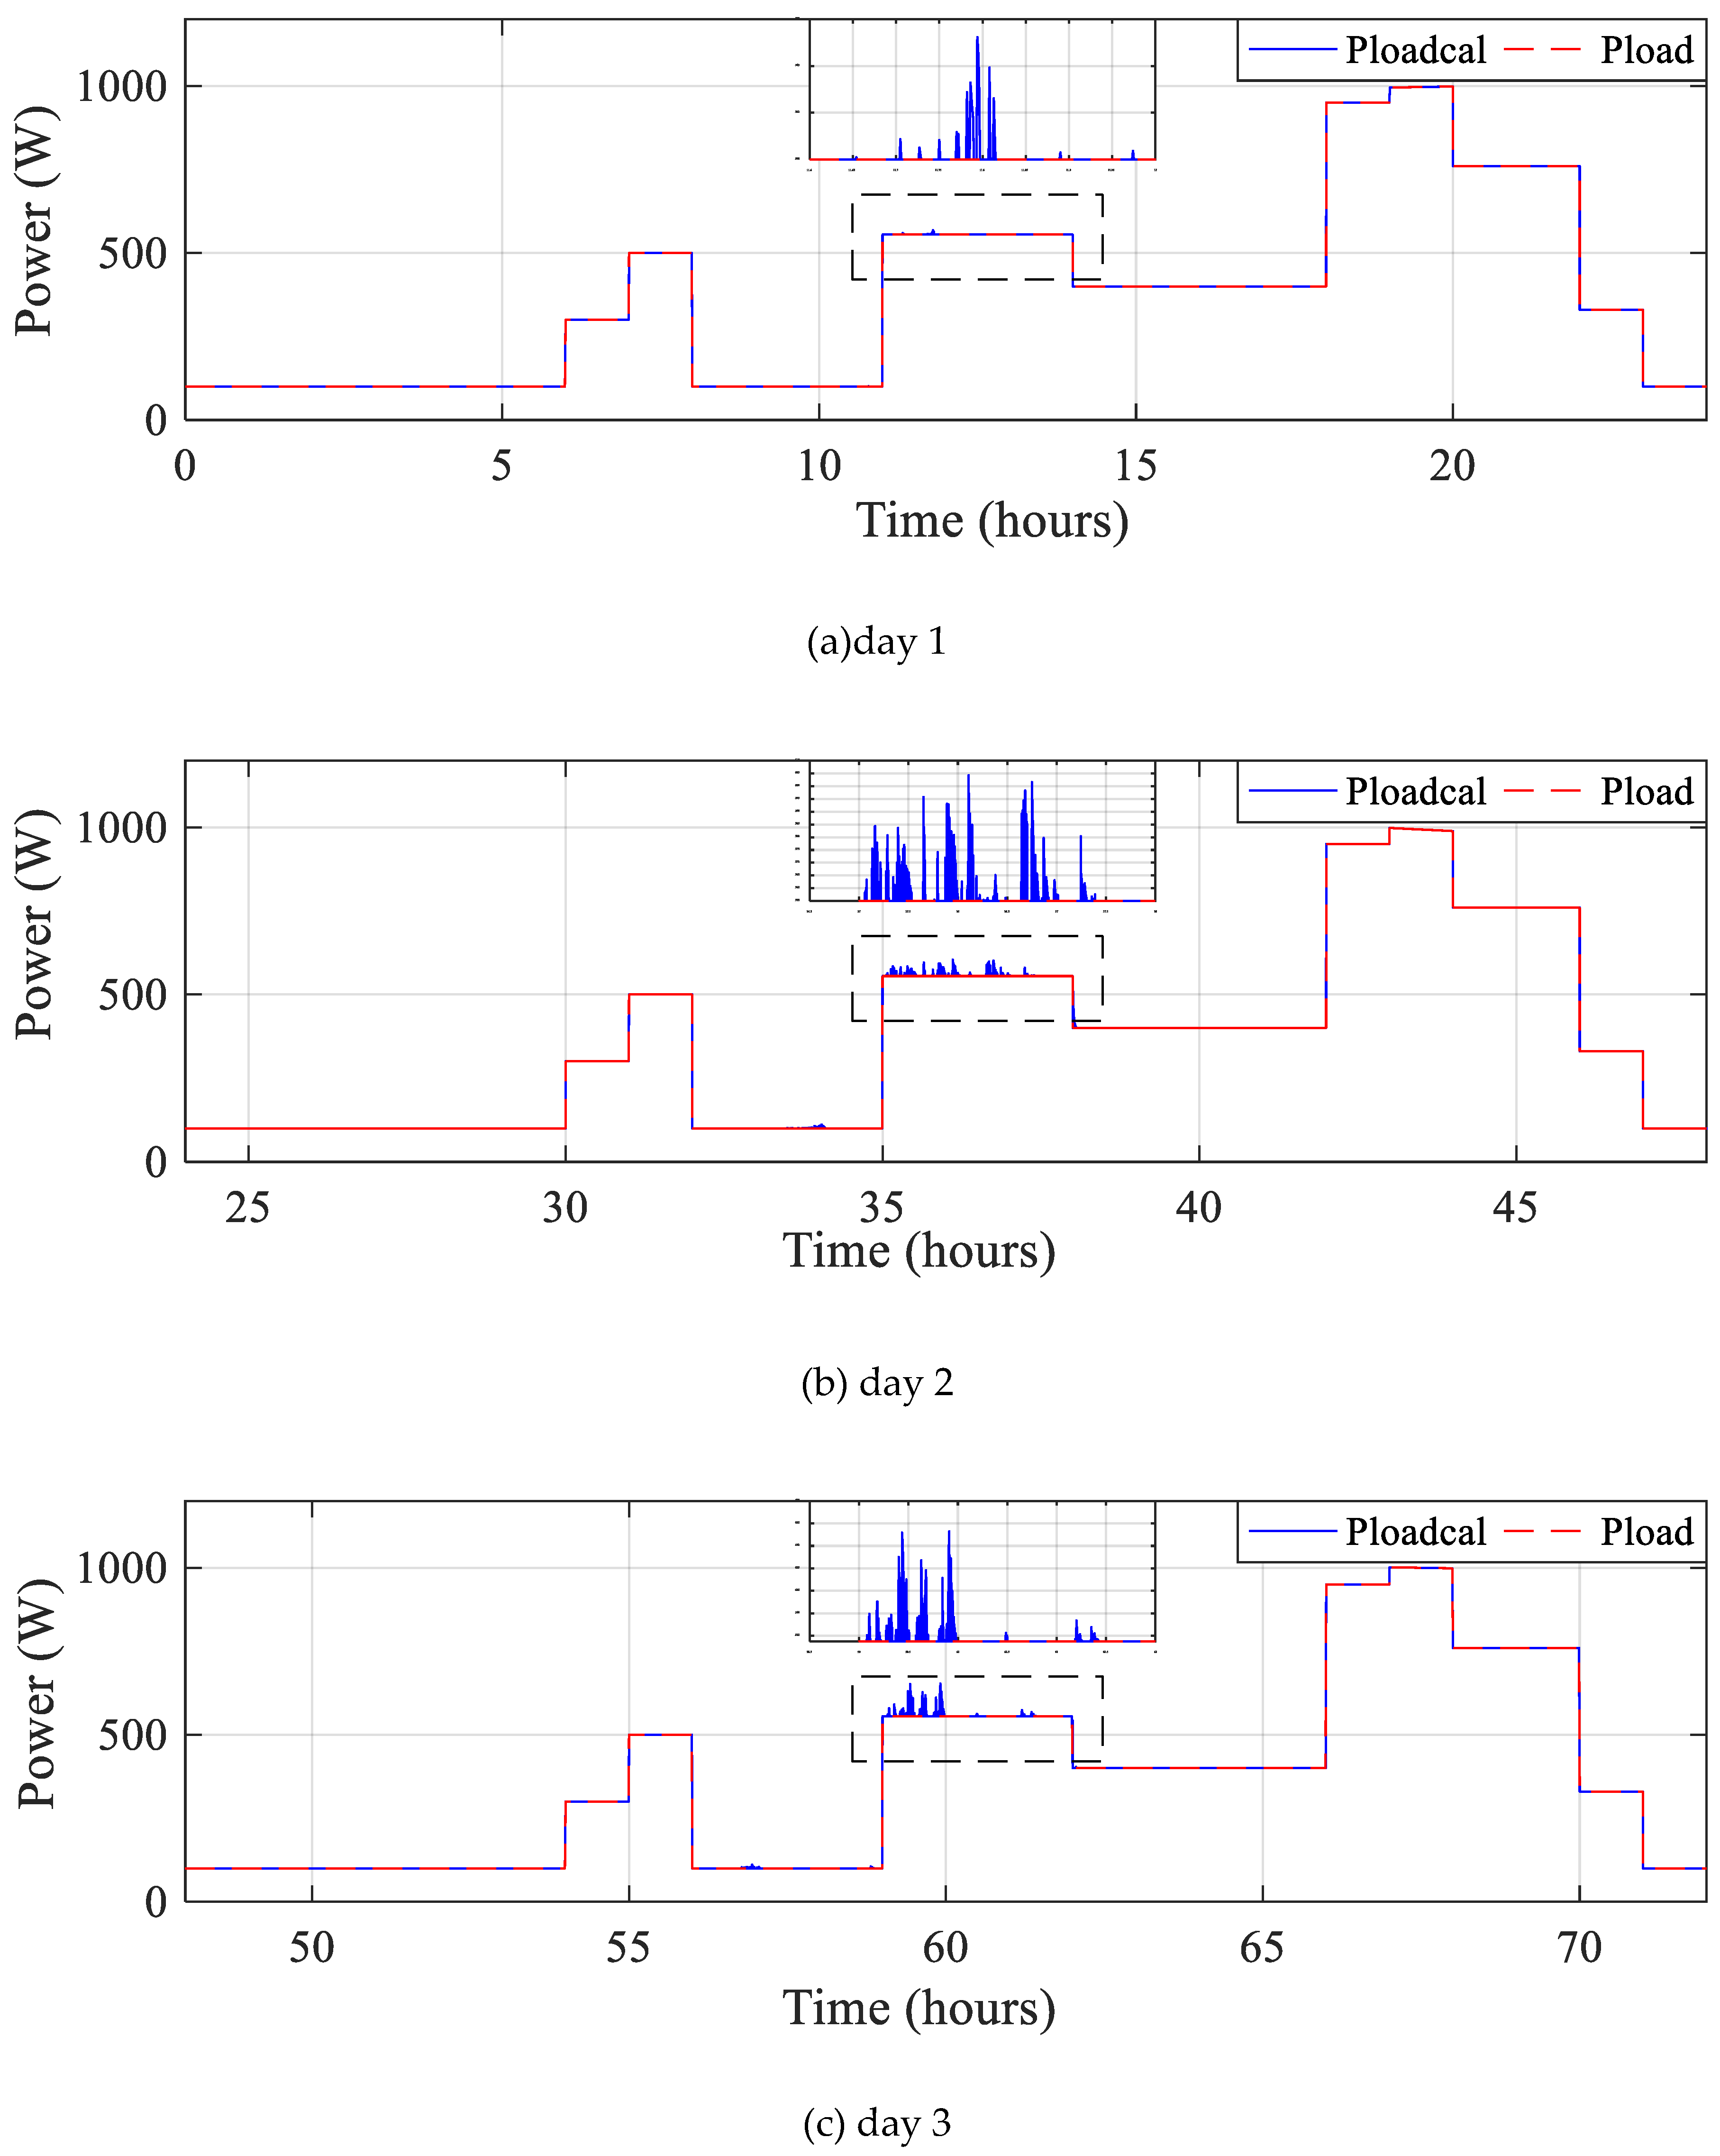
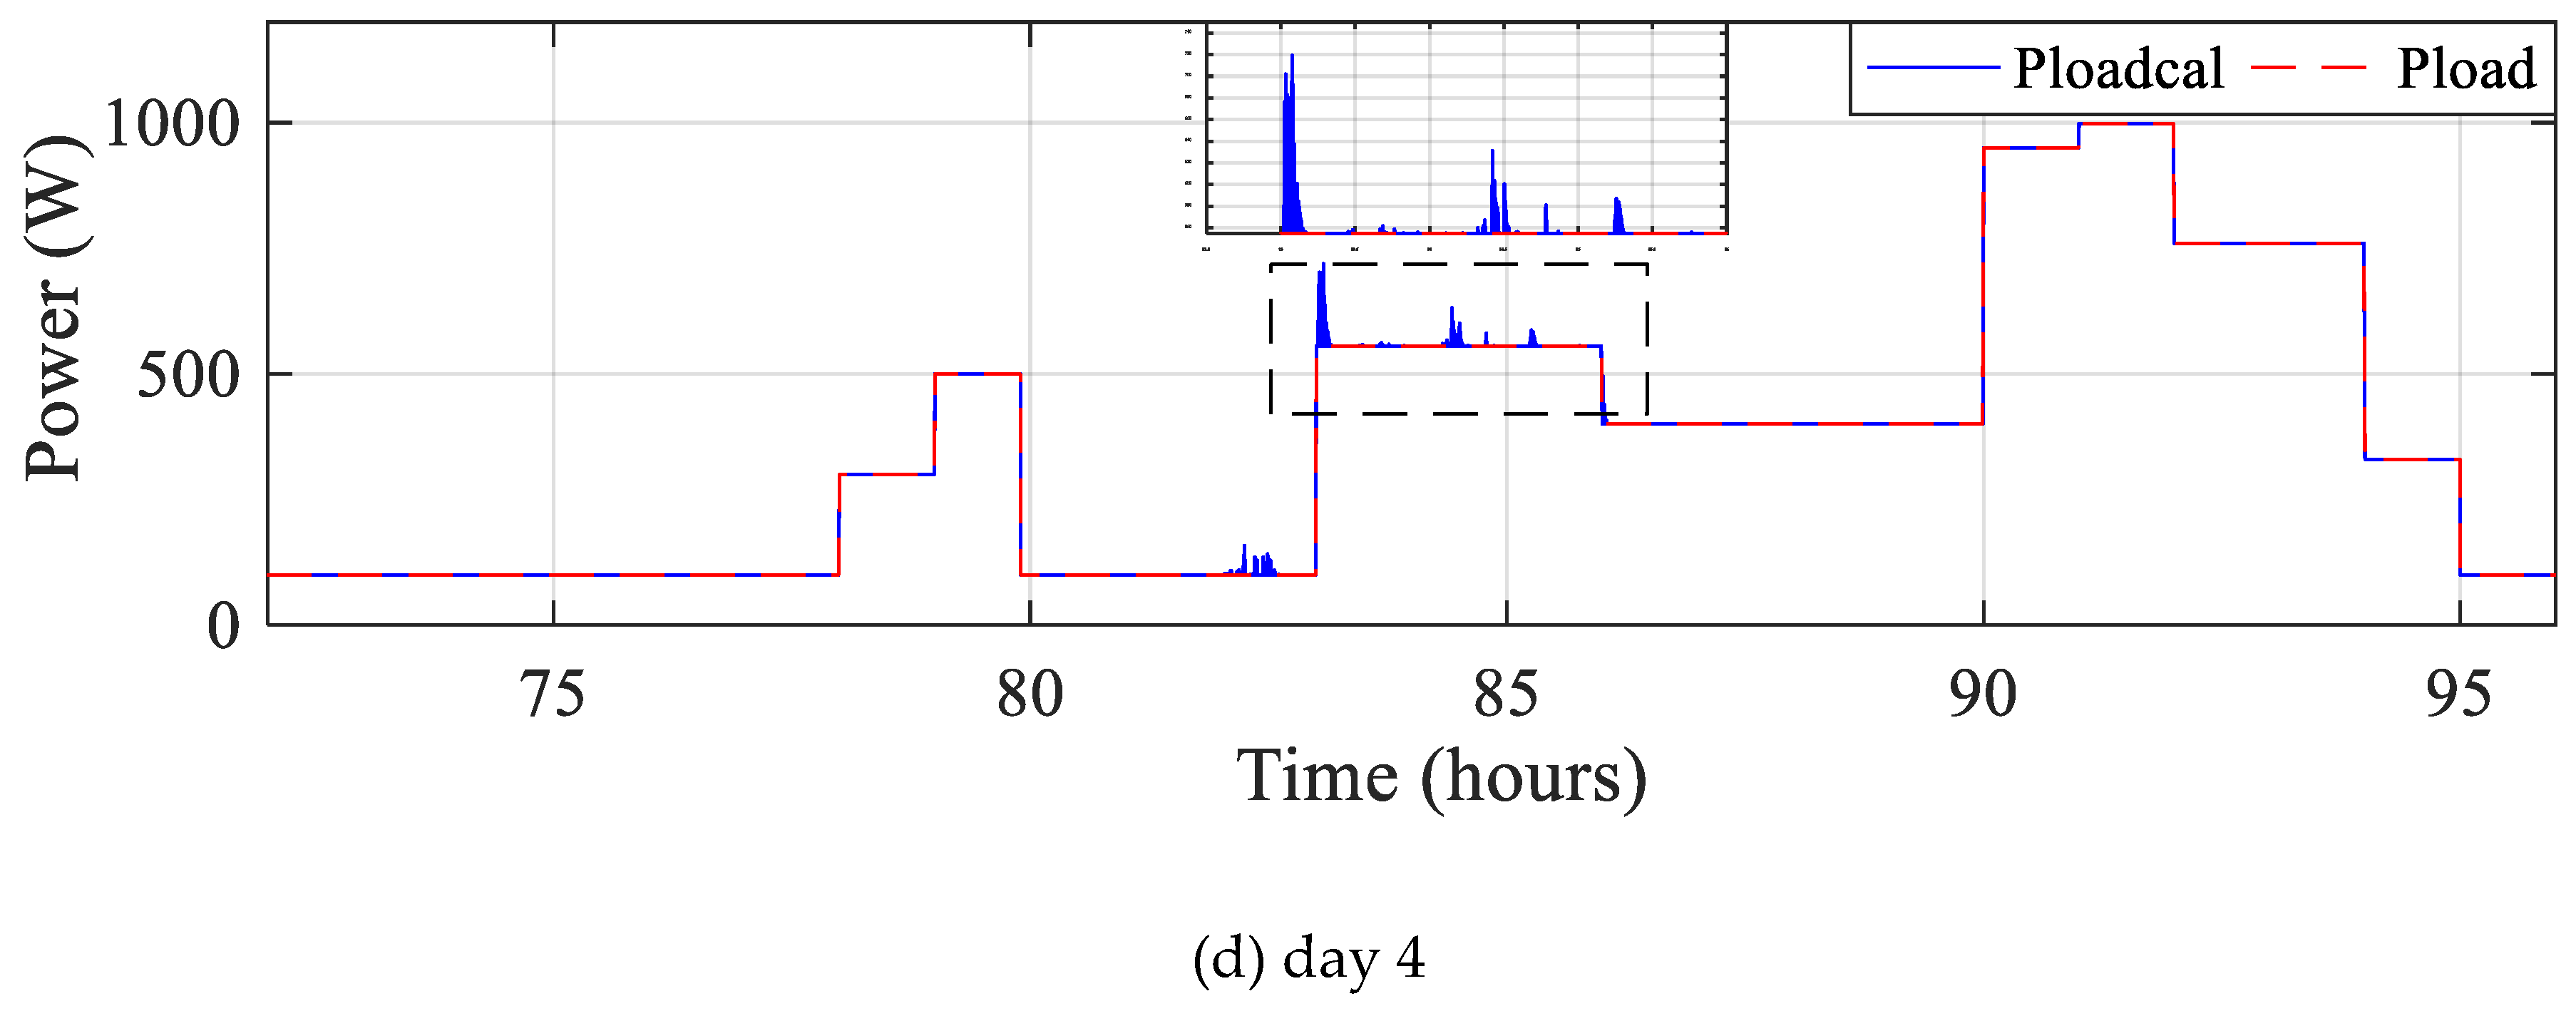
Figure 23.
RT Lab real-time simulator work bench.
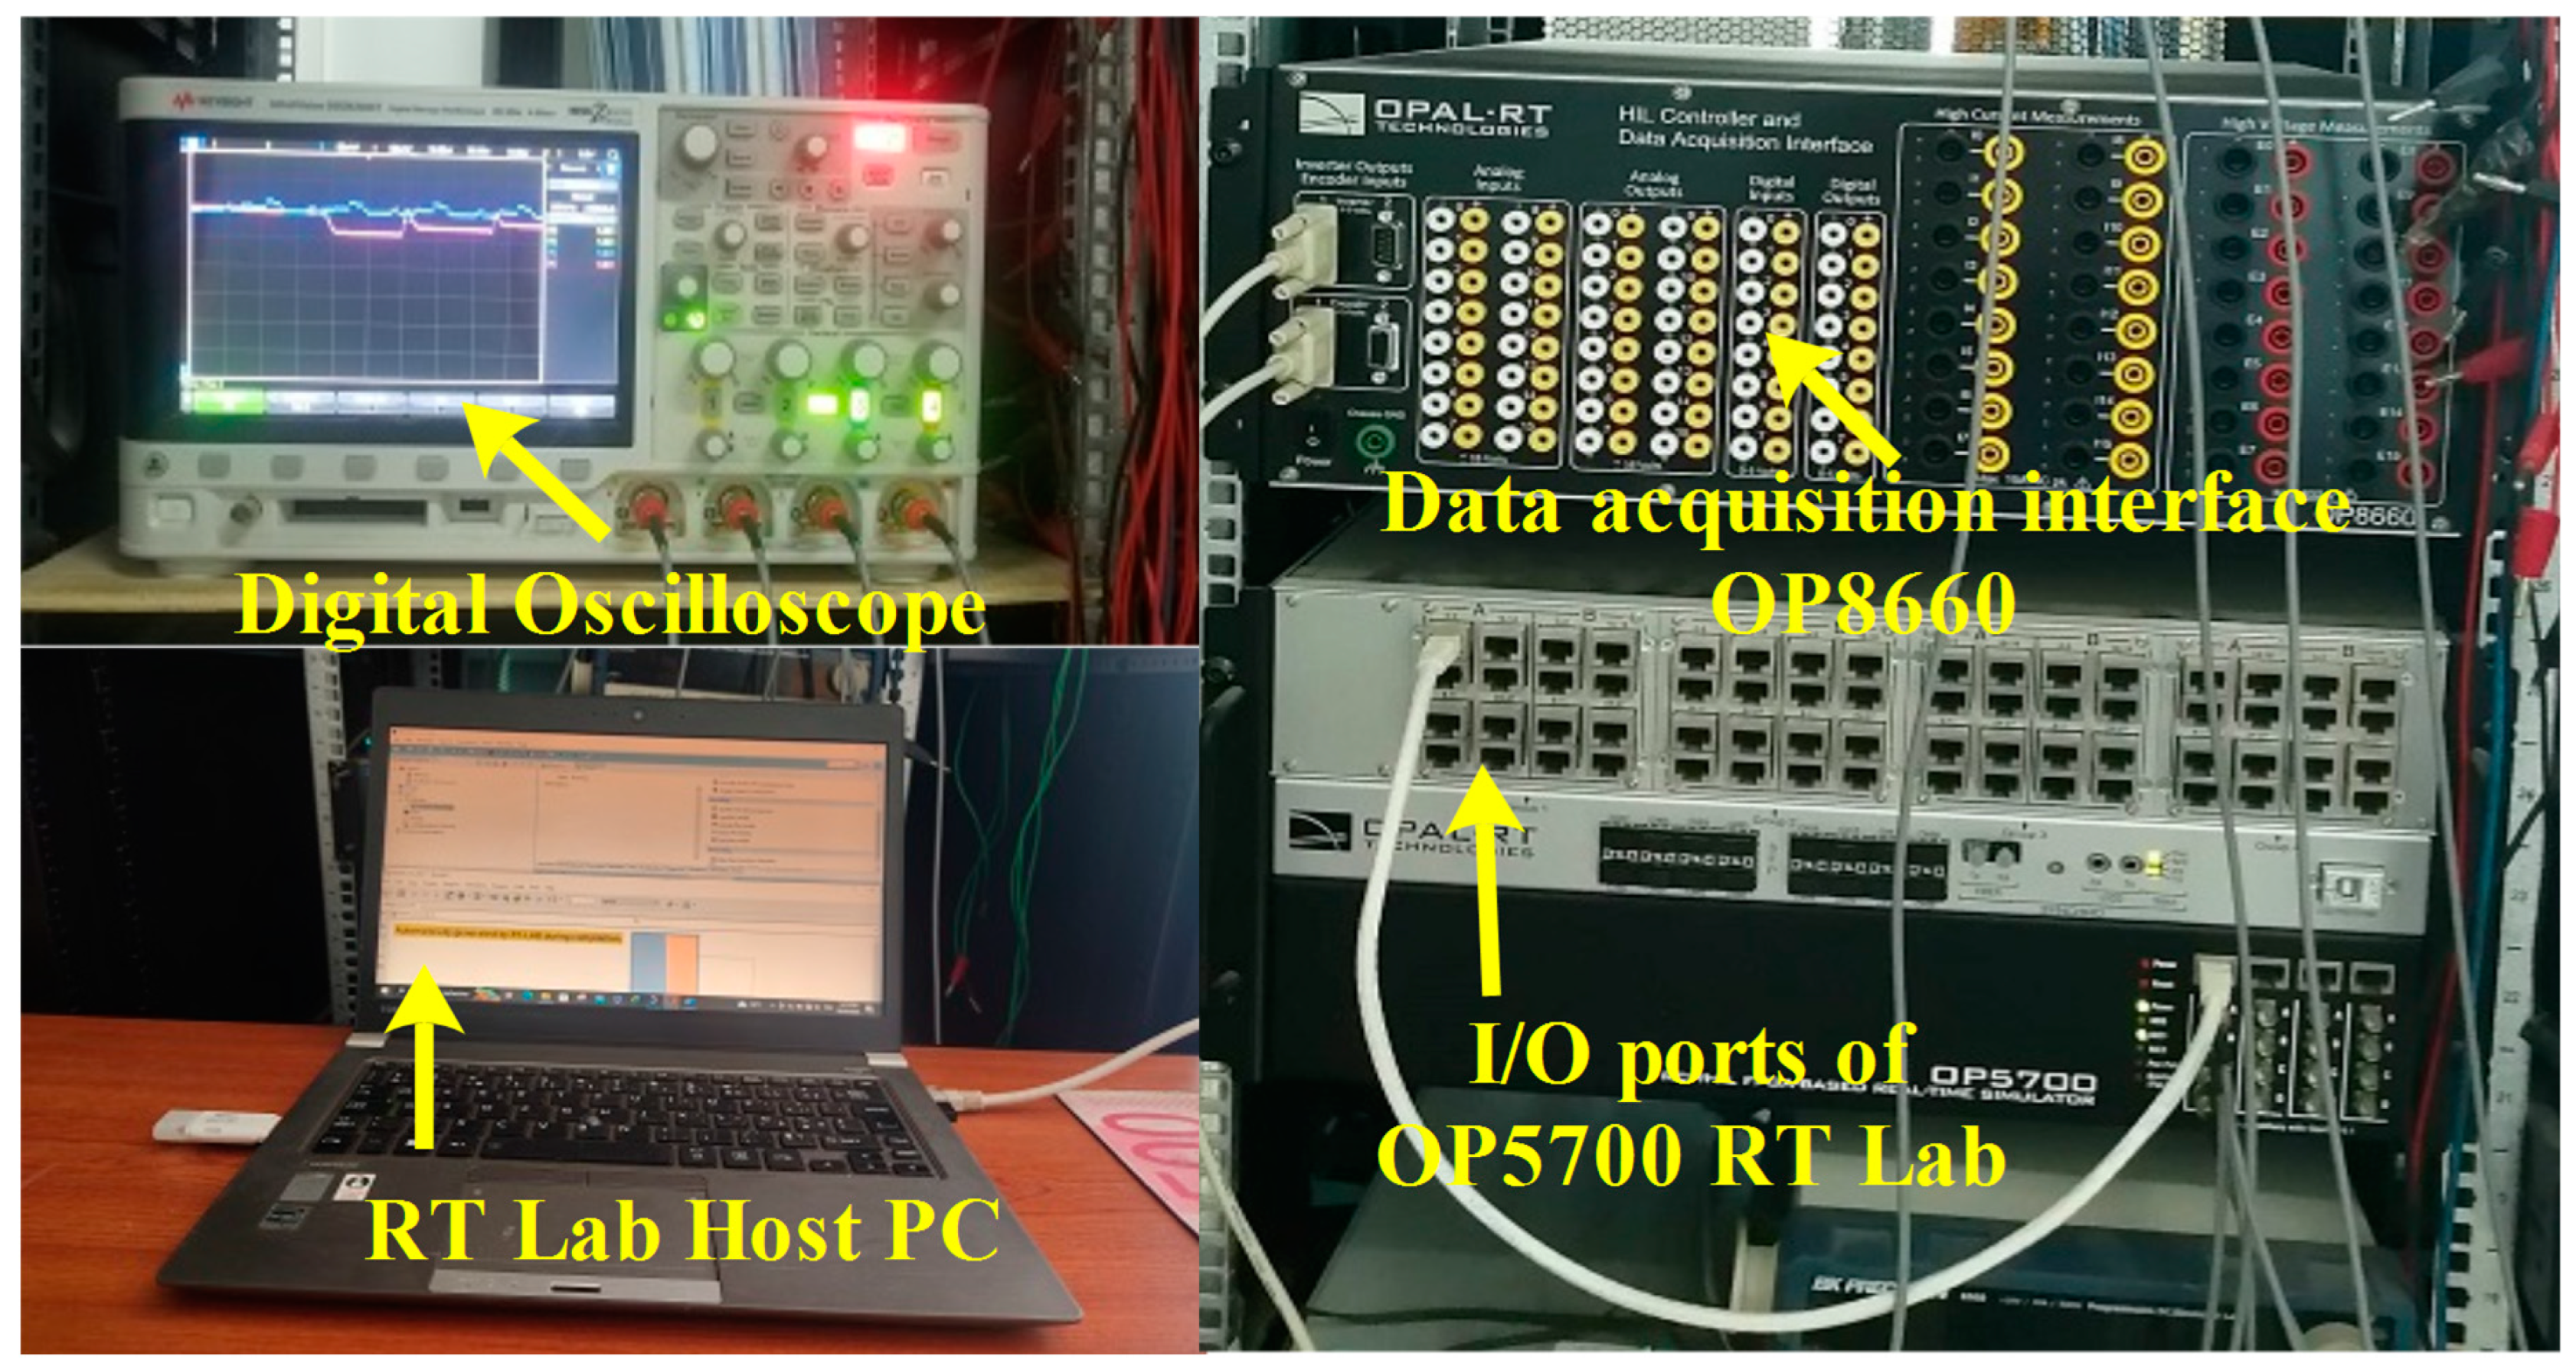
Figure 24.
Differentmodesobtained in RTlab.
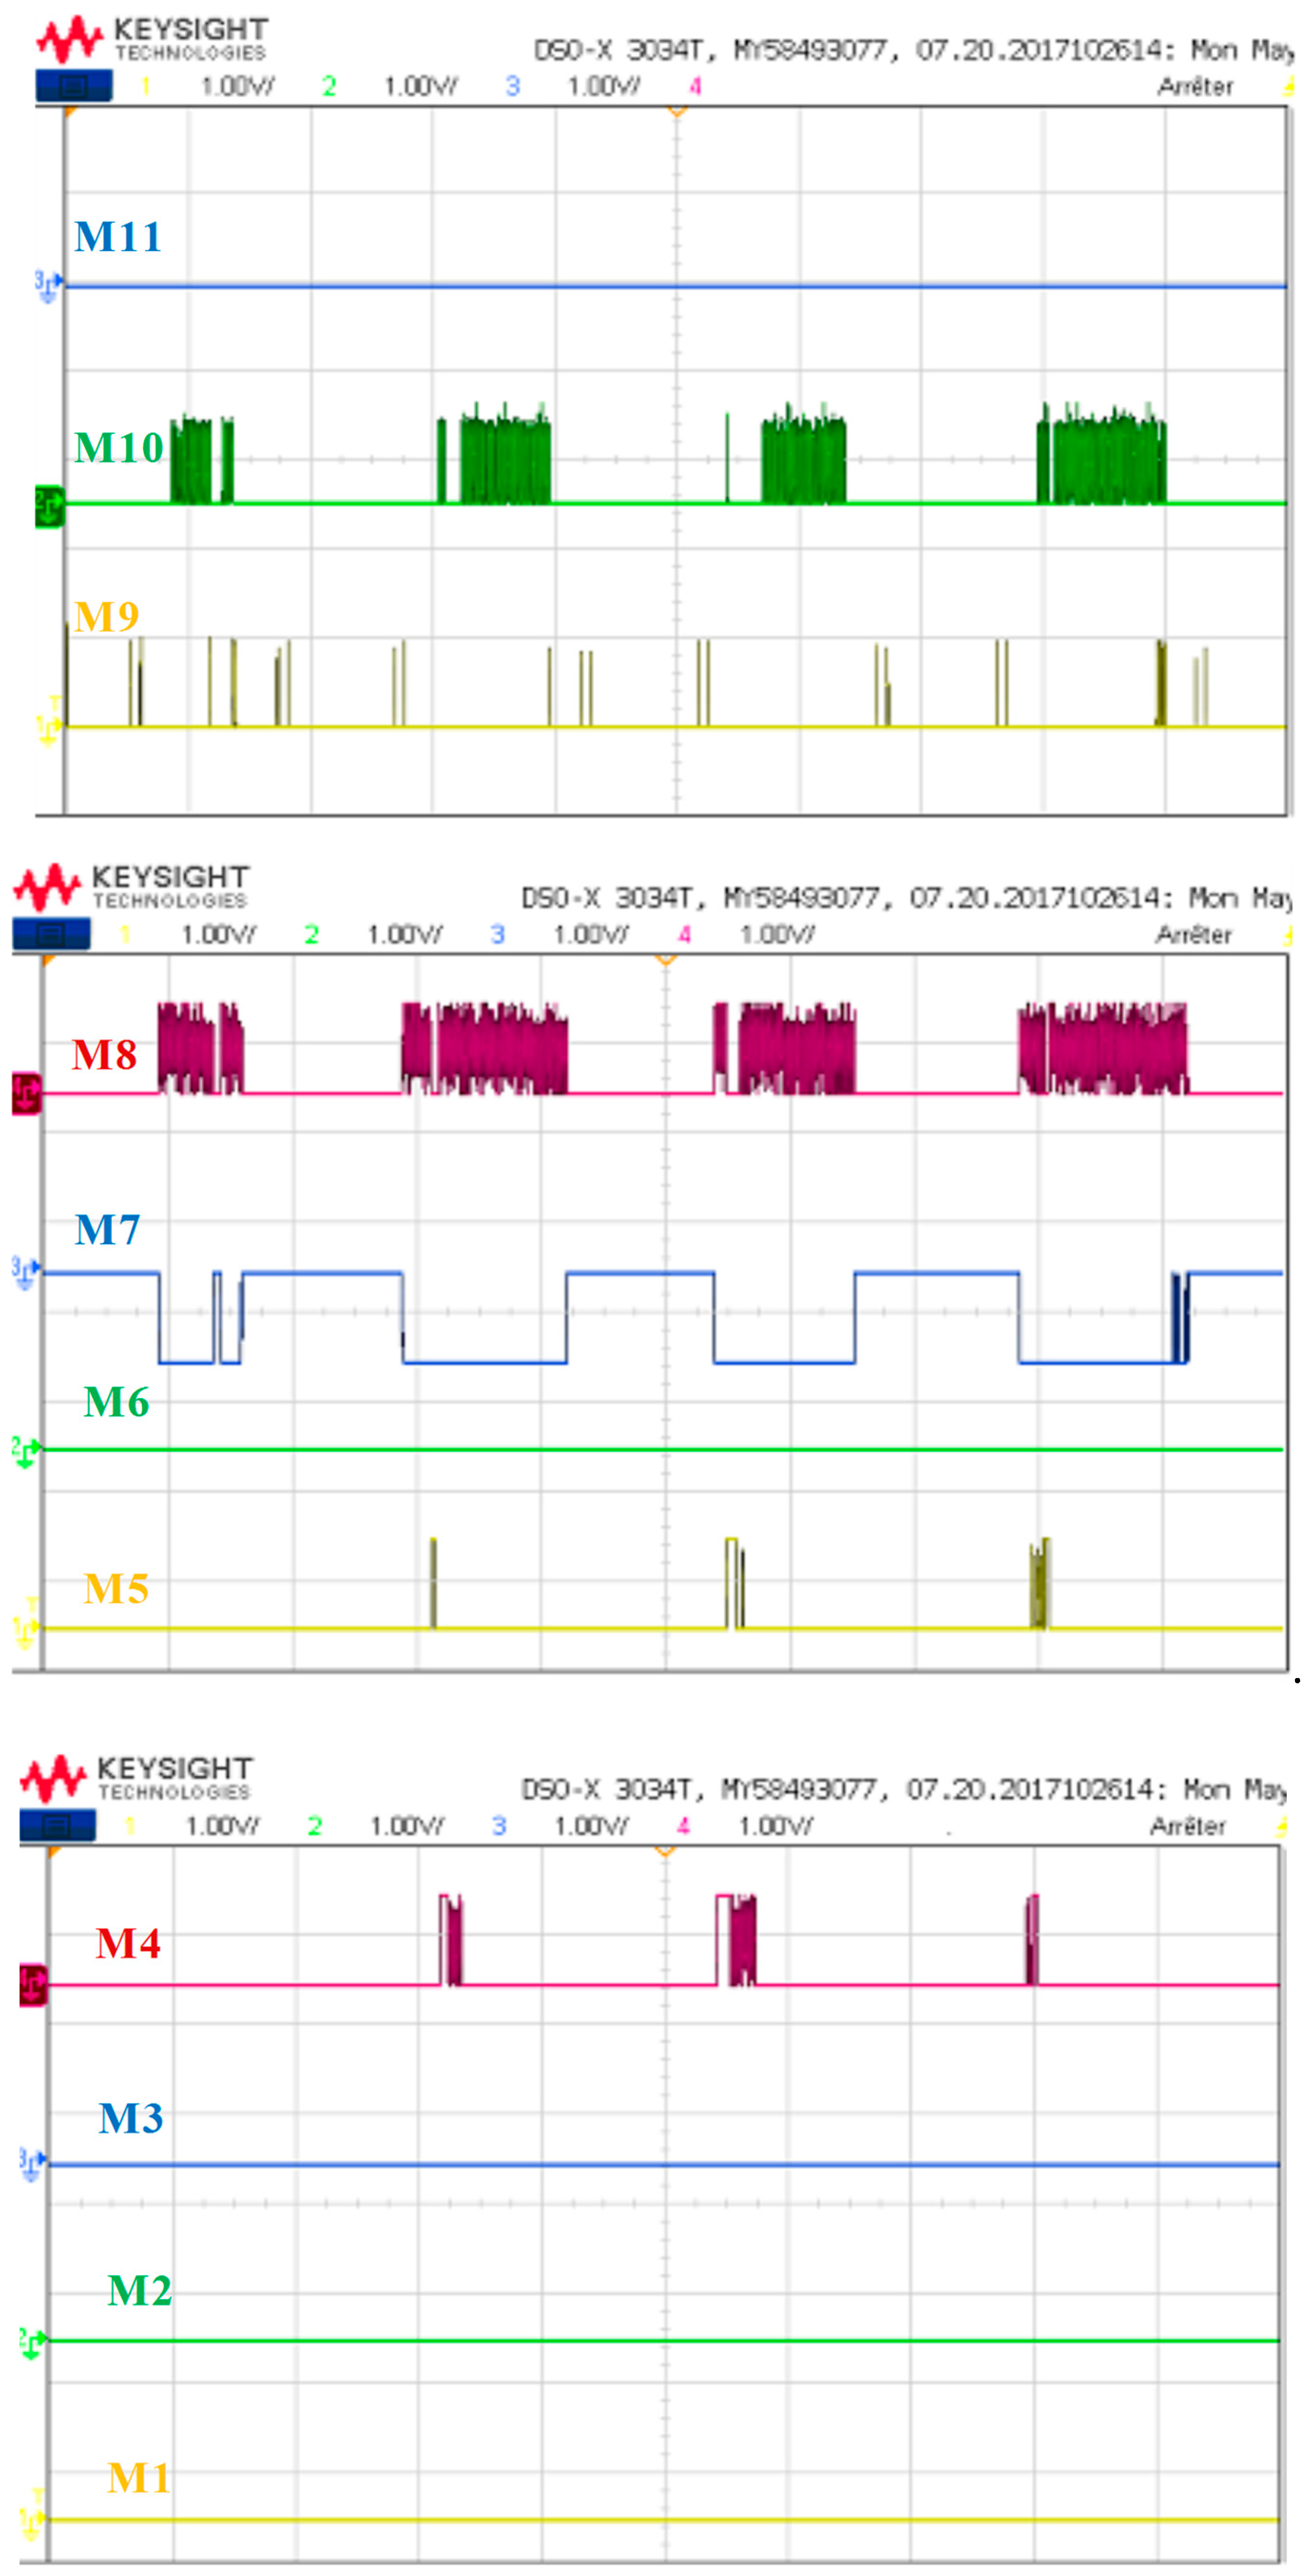
Figure 25.
Batteryvoltage.
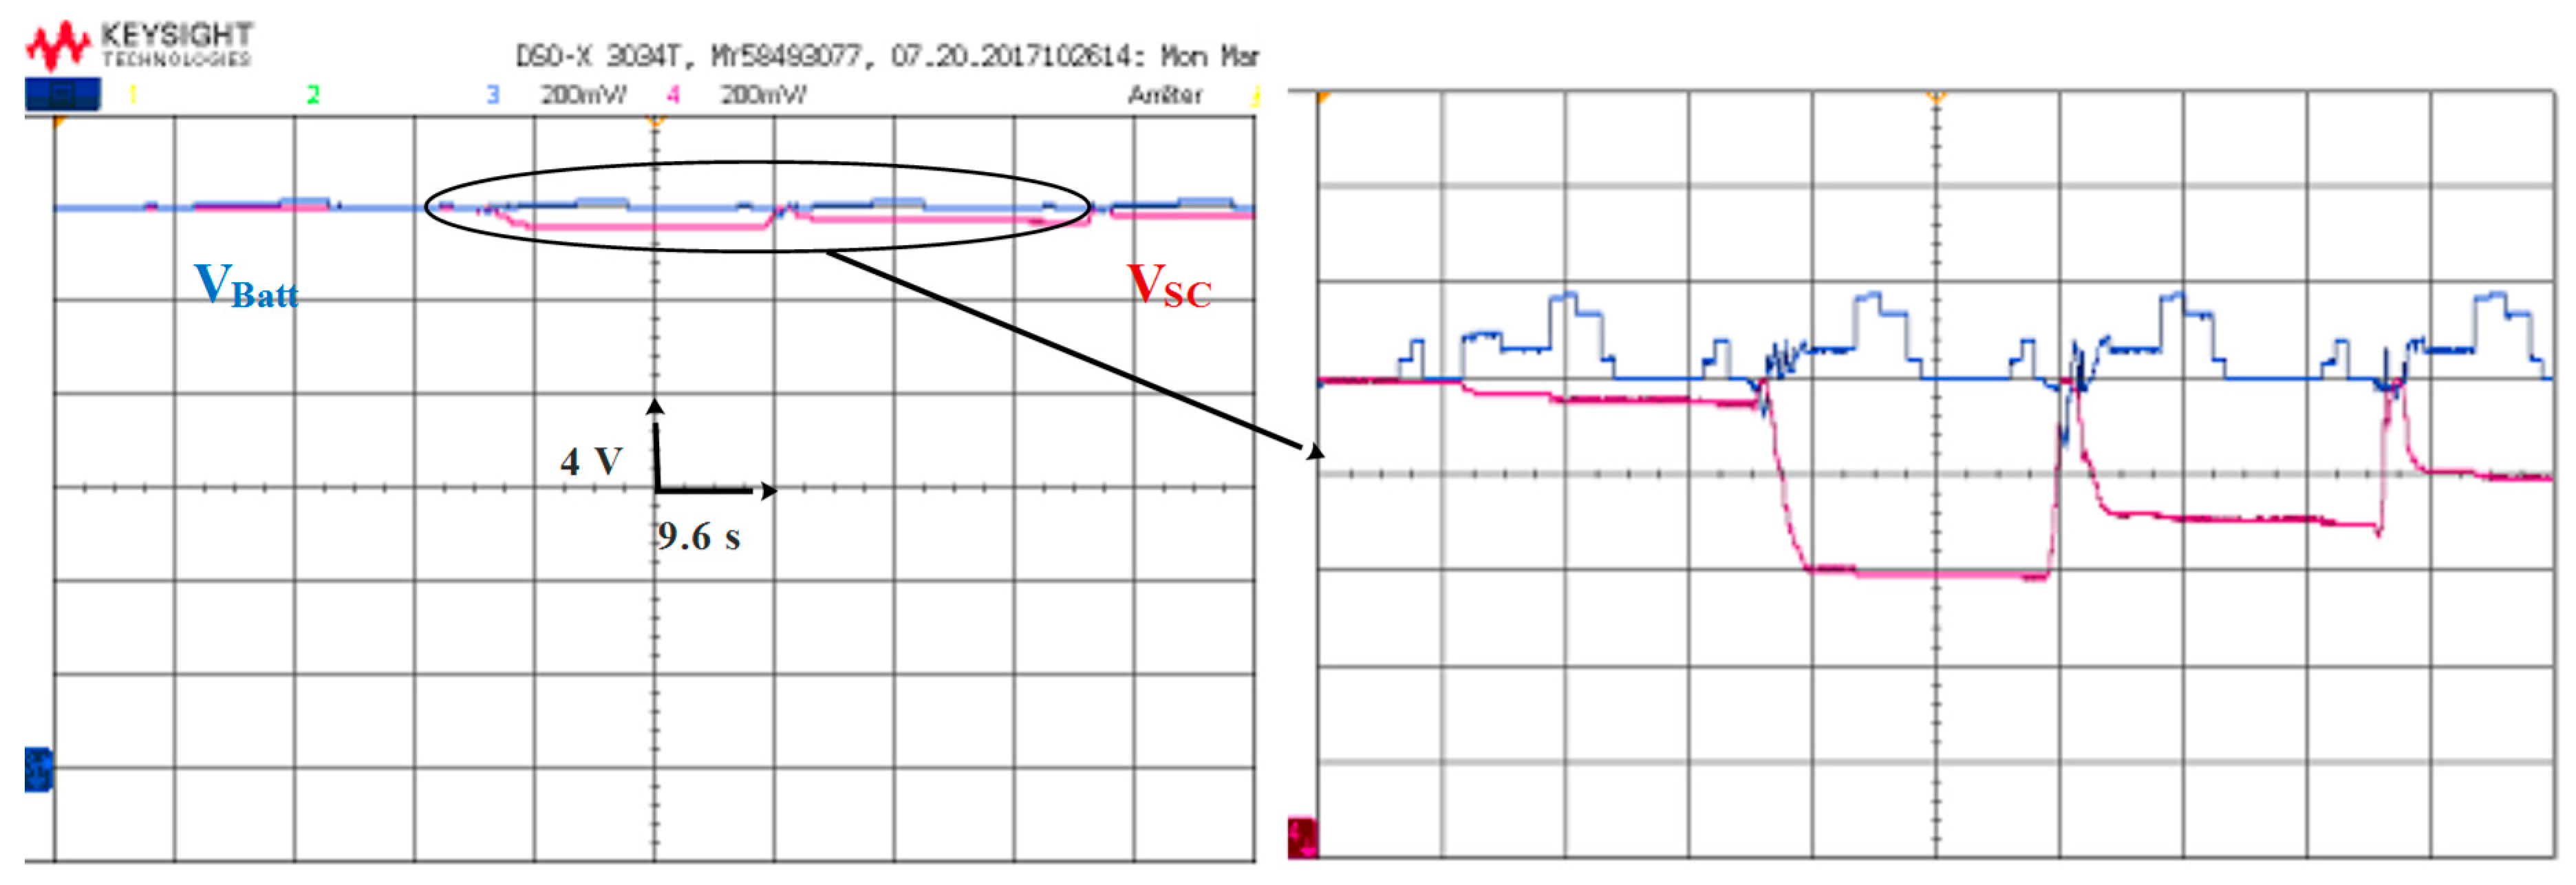
Figure 26.
Battery-supercapacitor SOC and their zoom.
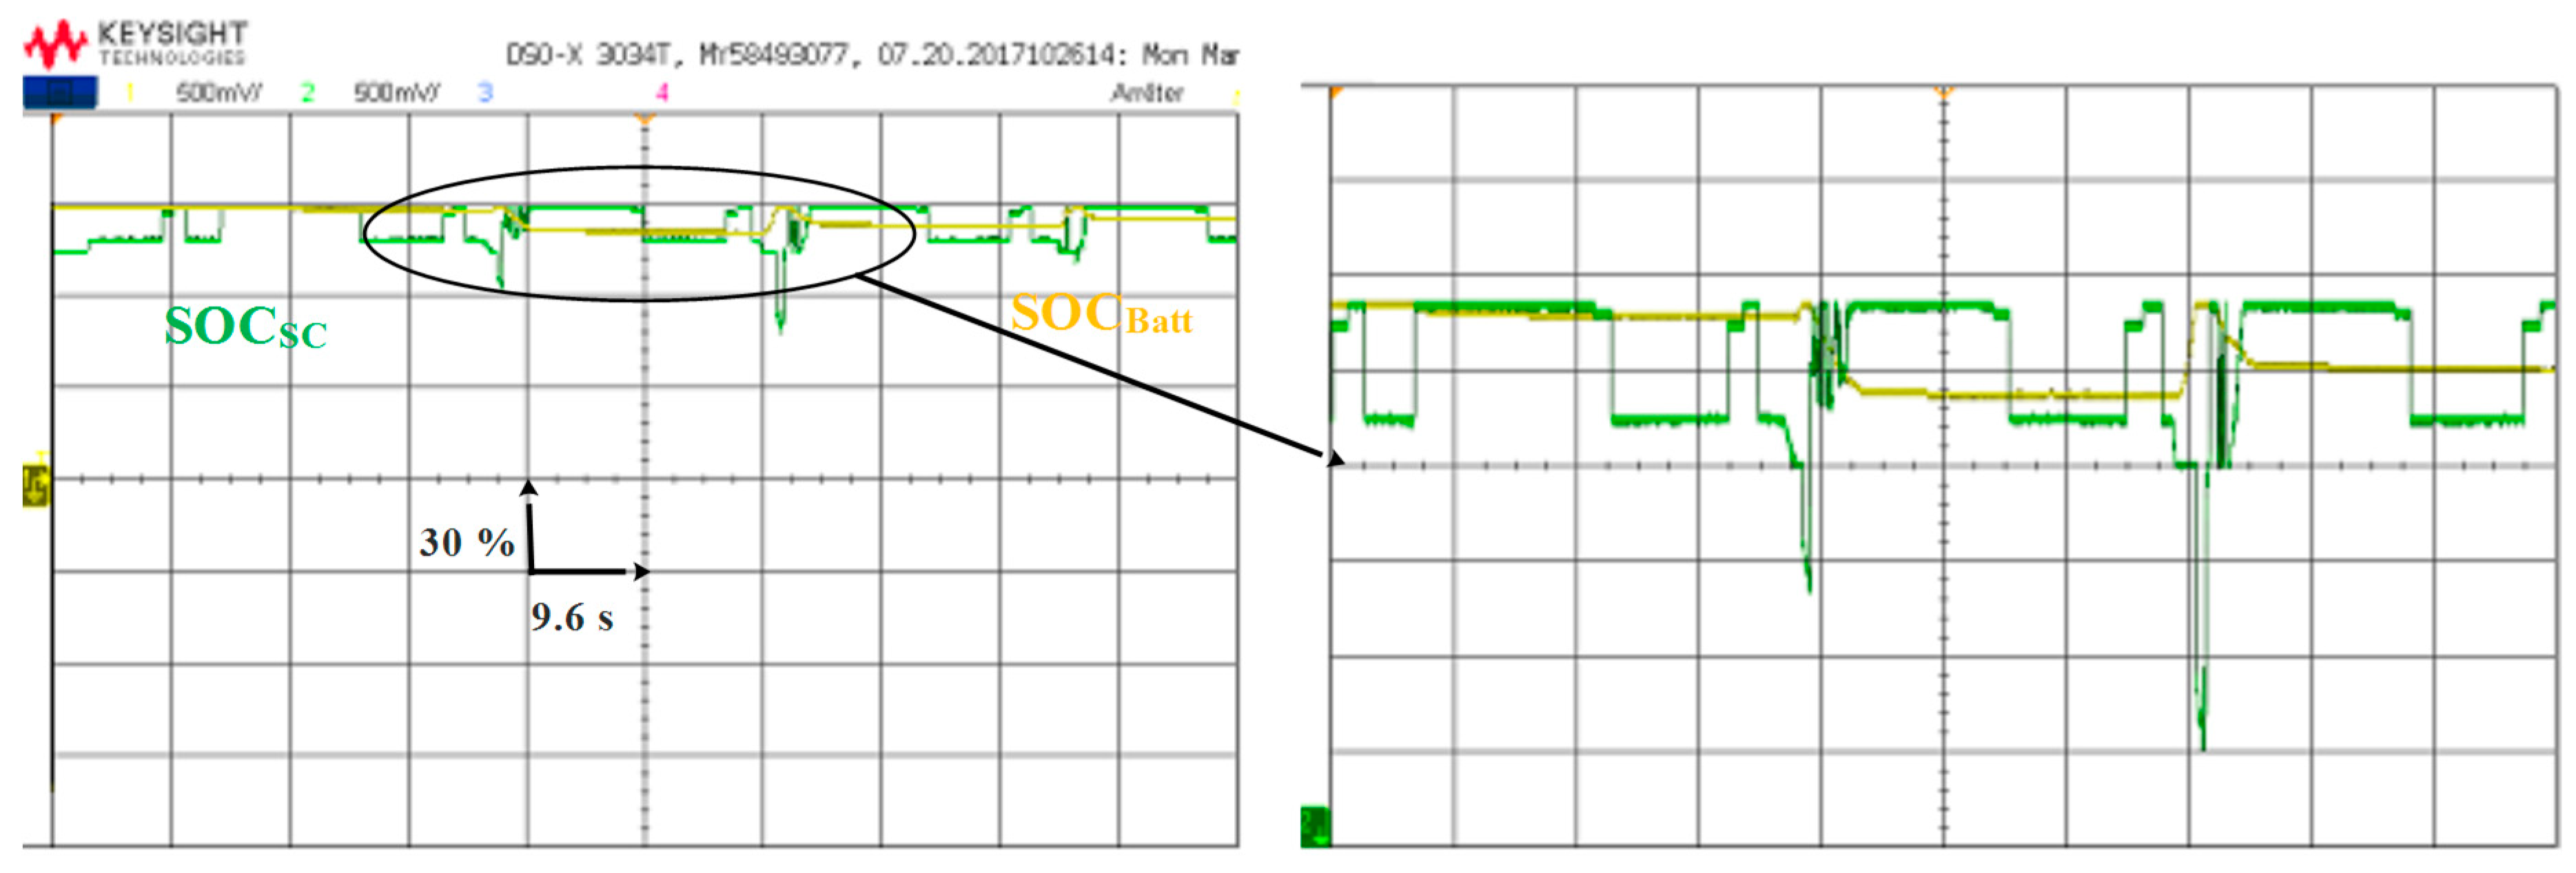
Figure 27.
Battery-supercapacitor currents.
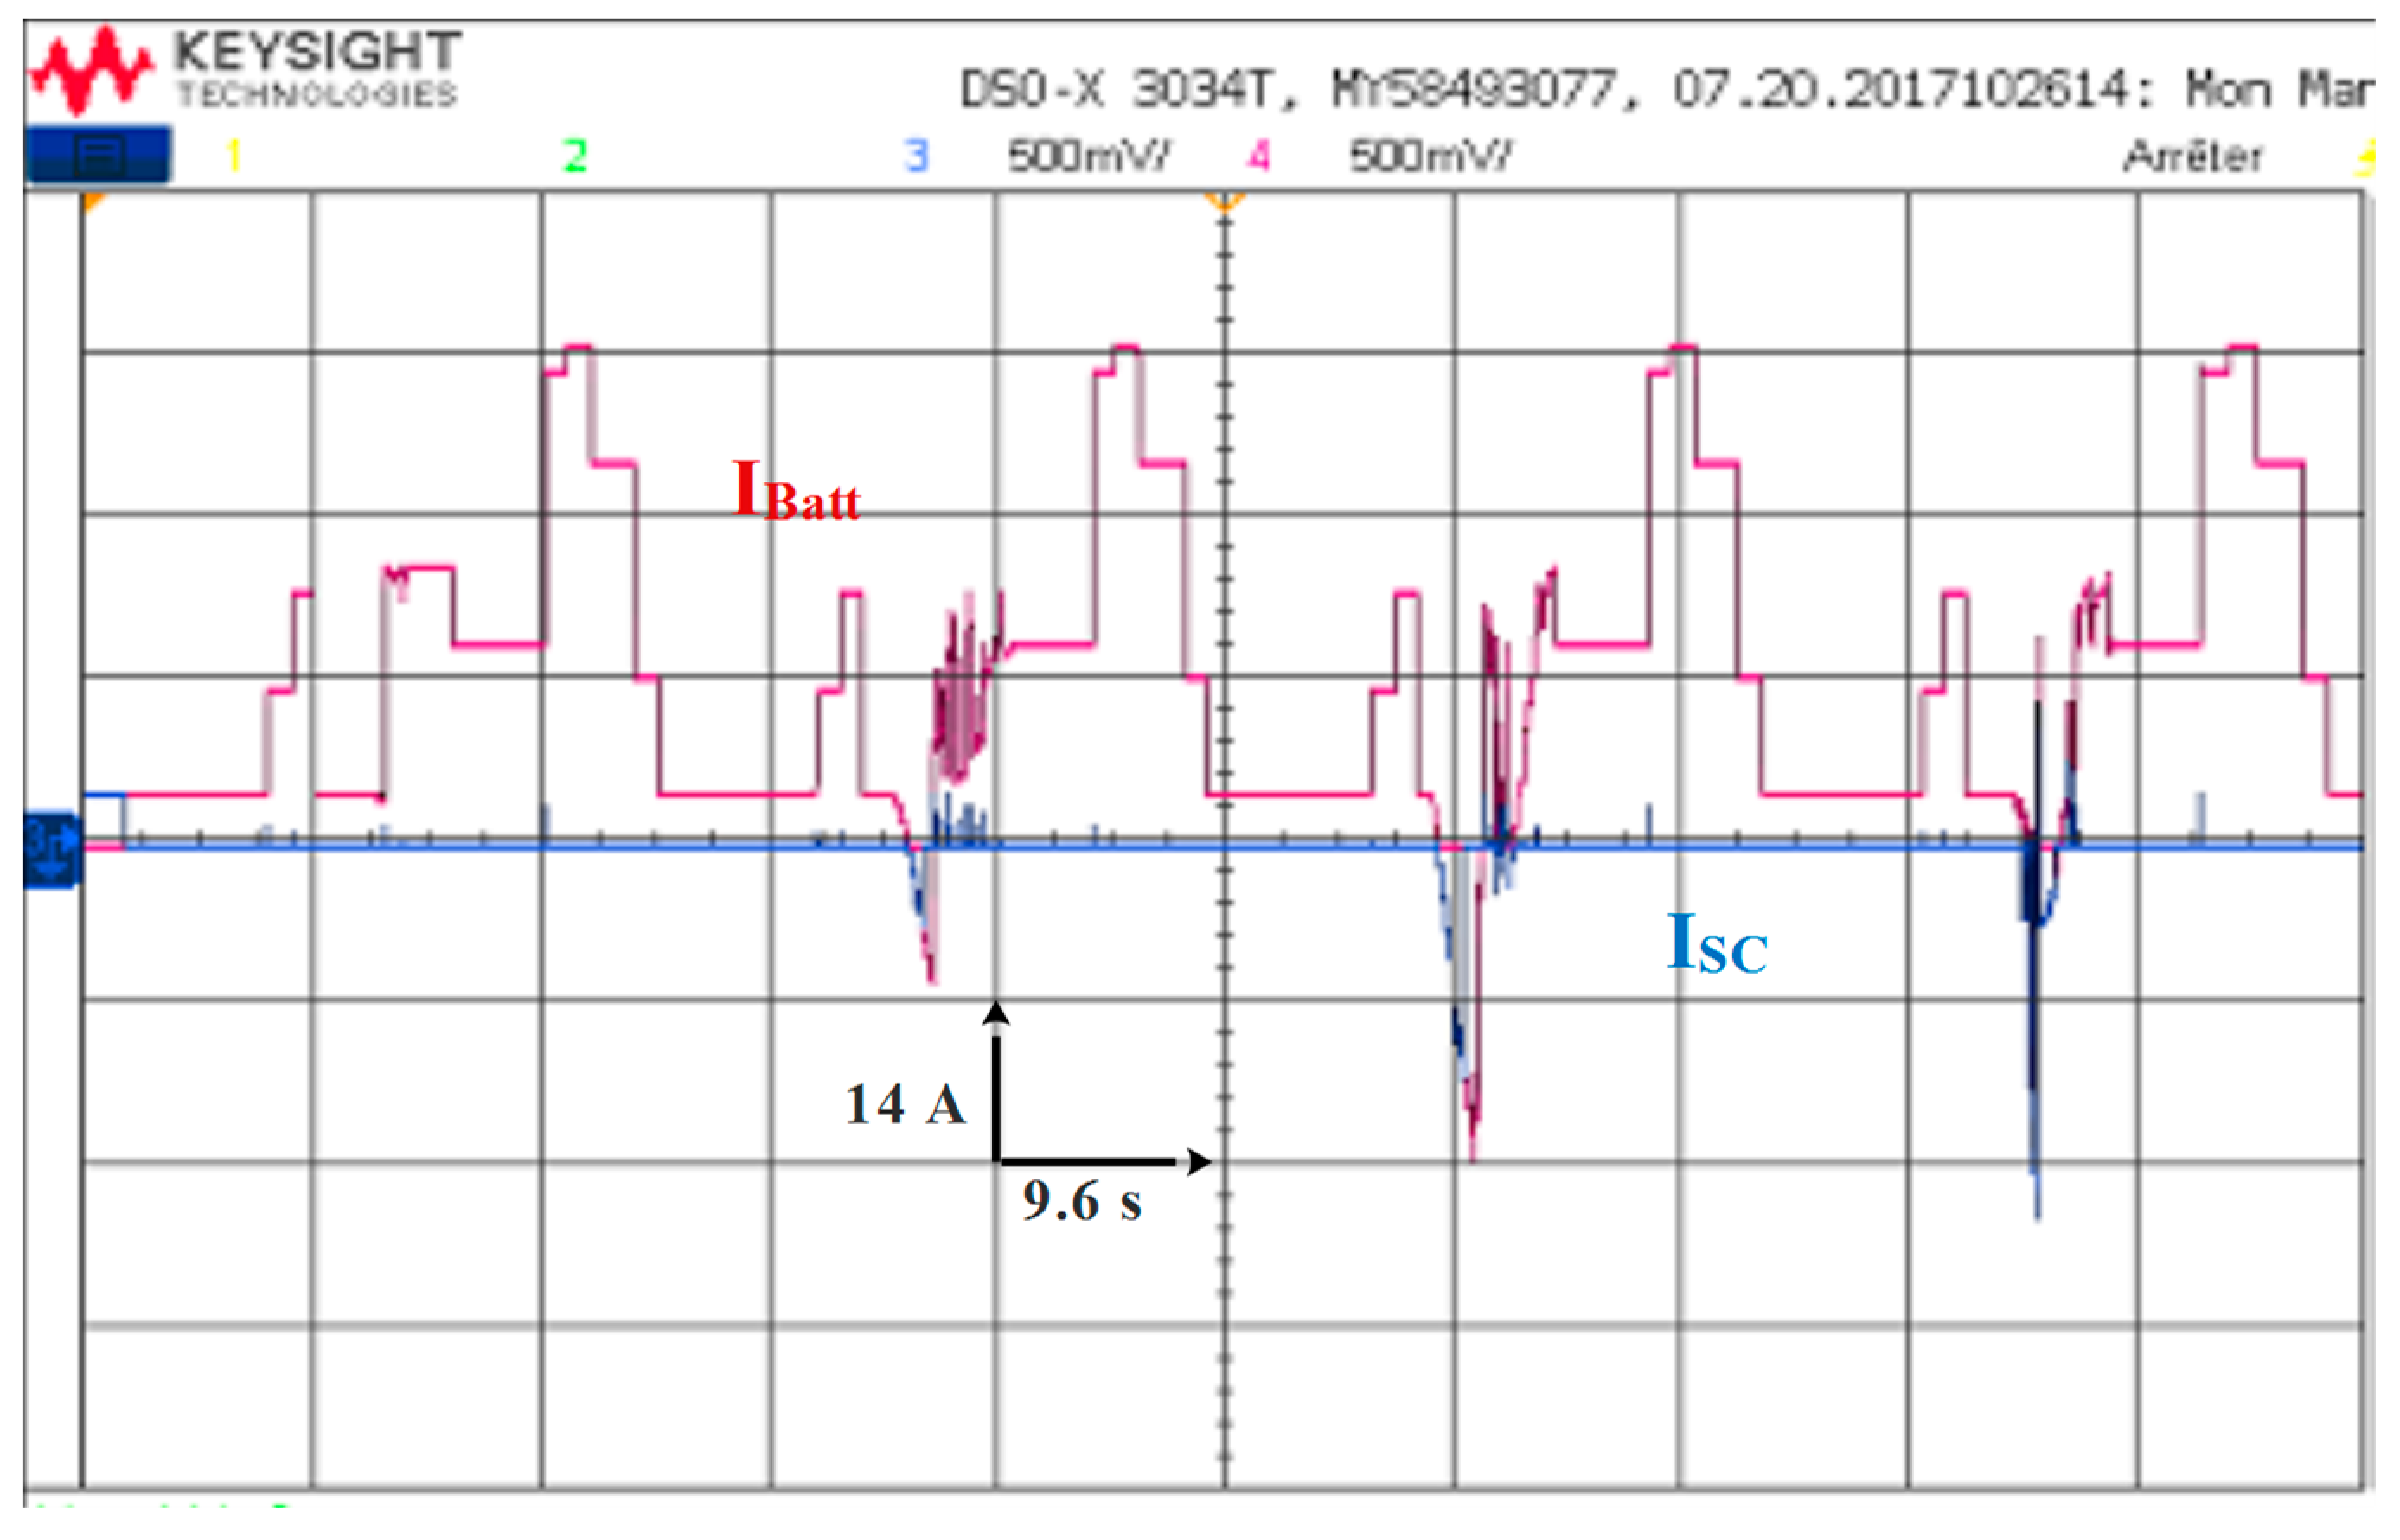
Figure 28.
DC bus voltage and its zoom.
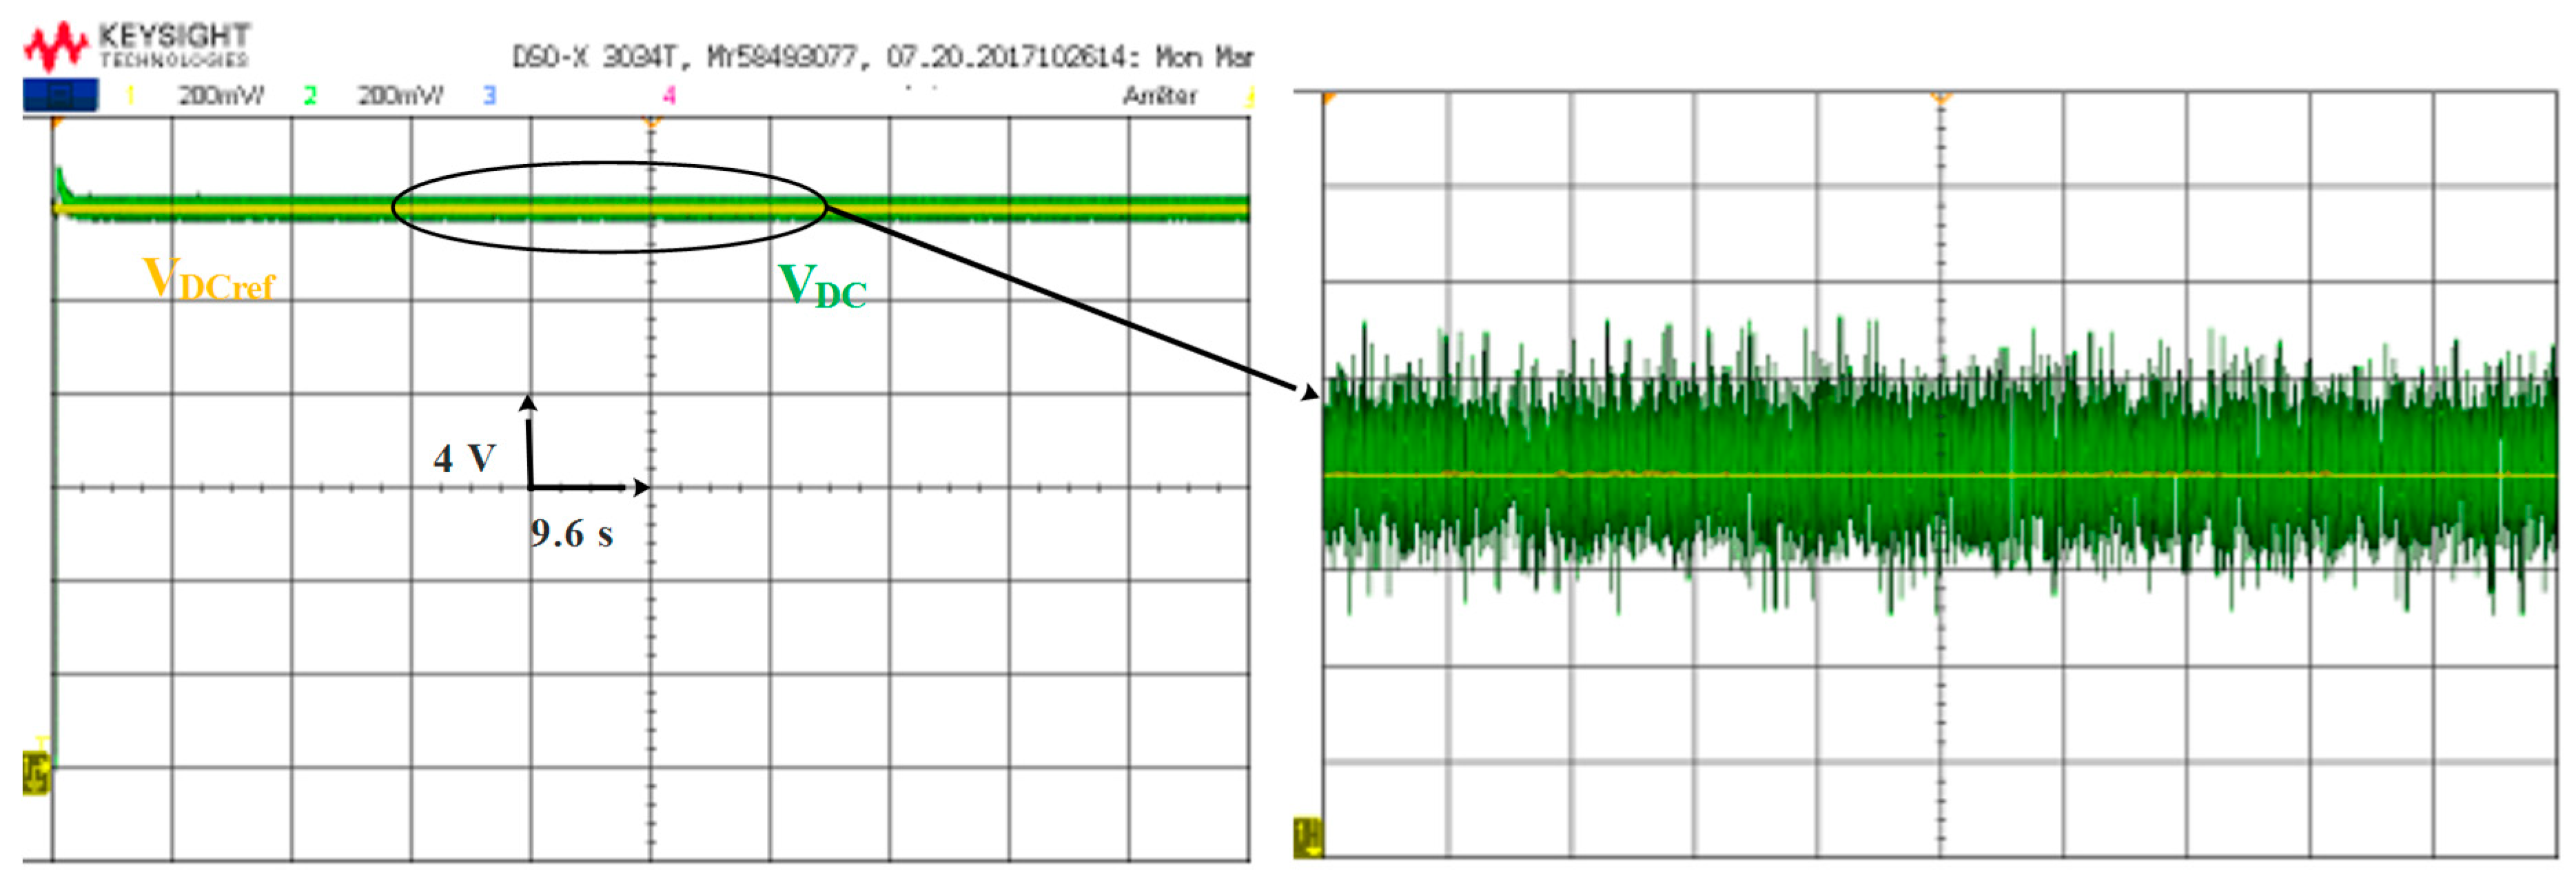
Figure 29.
Different energy sources powers.
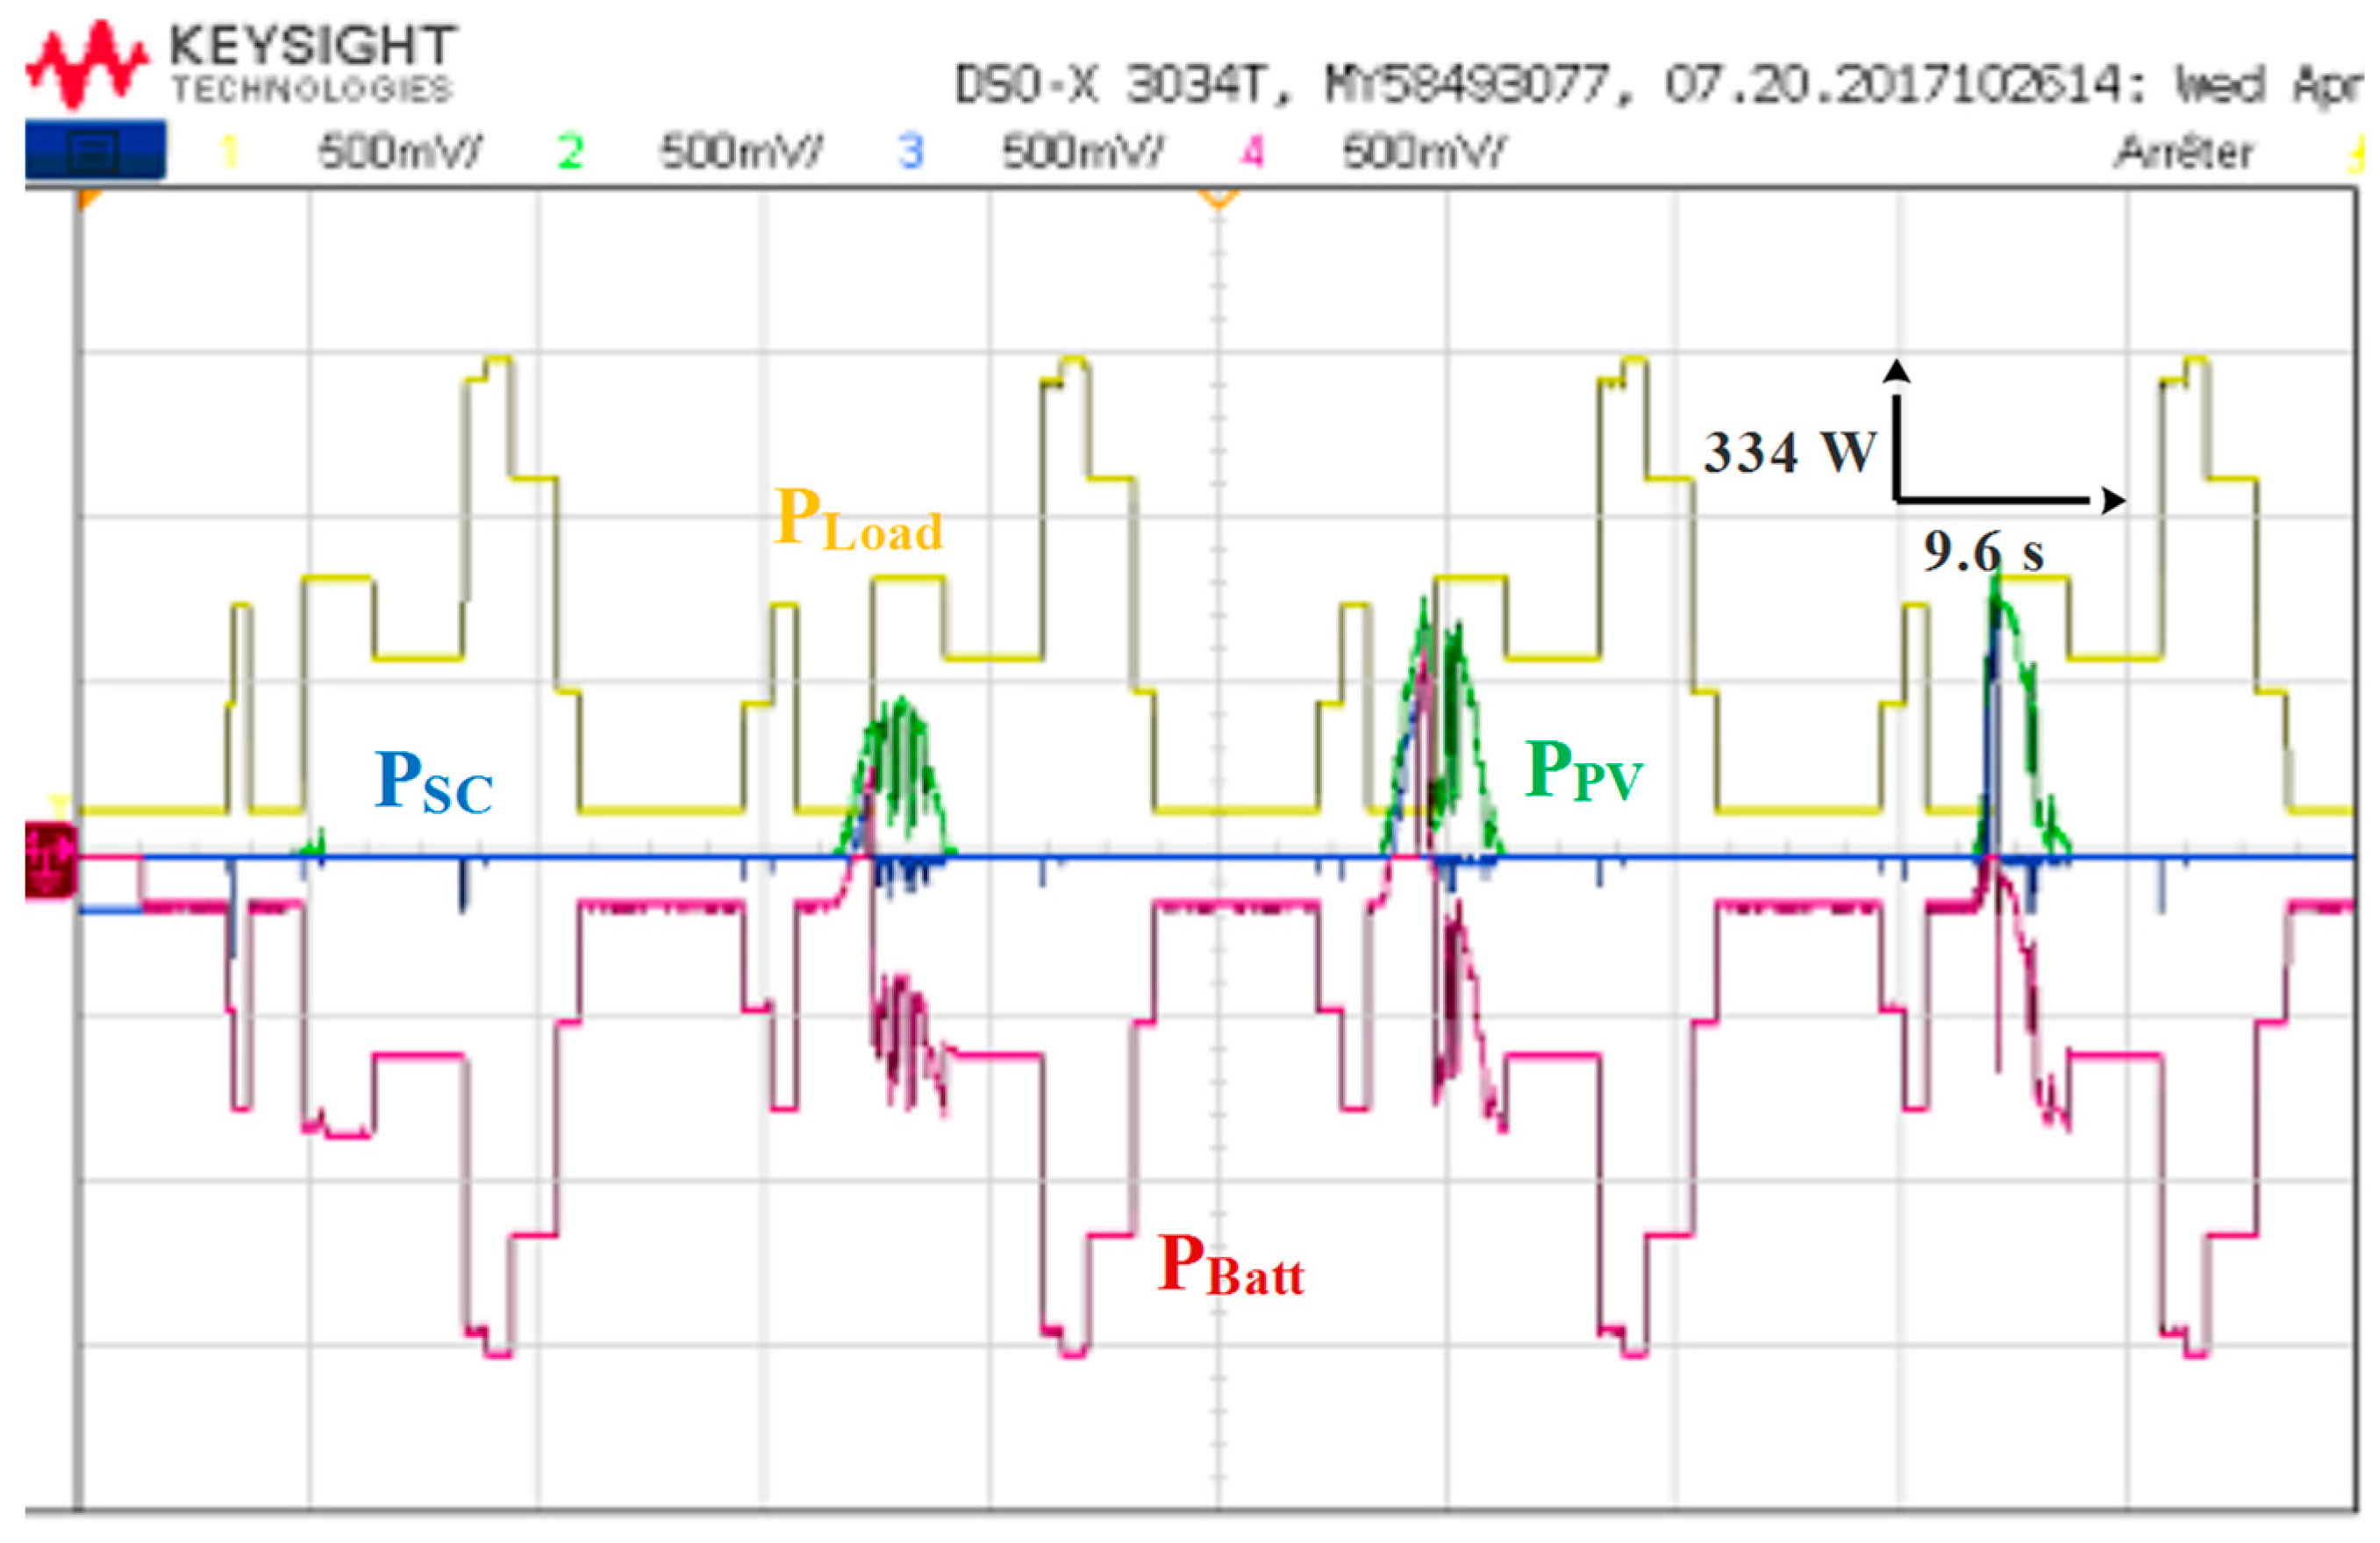
Figure 30.
Total developped power and desired one.
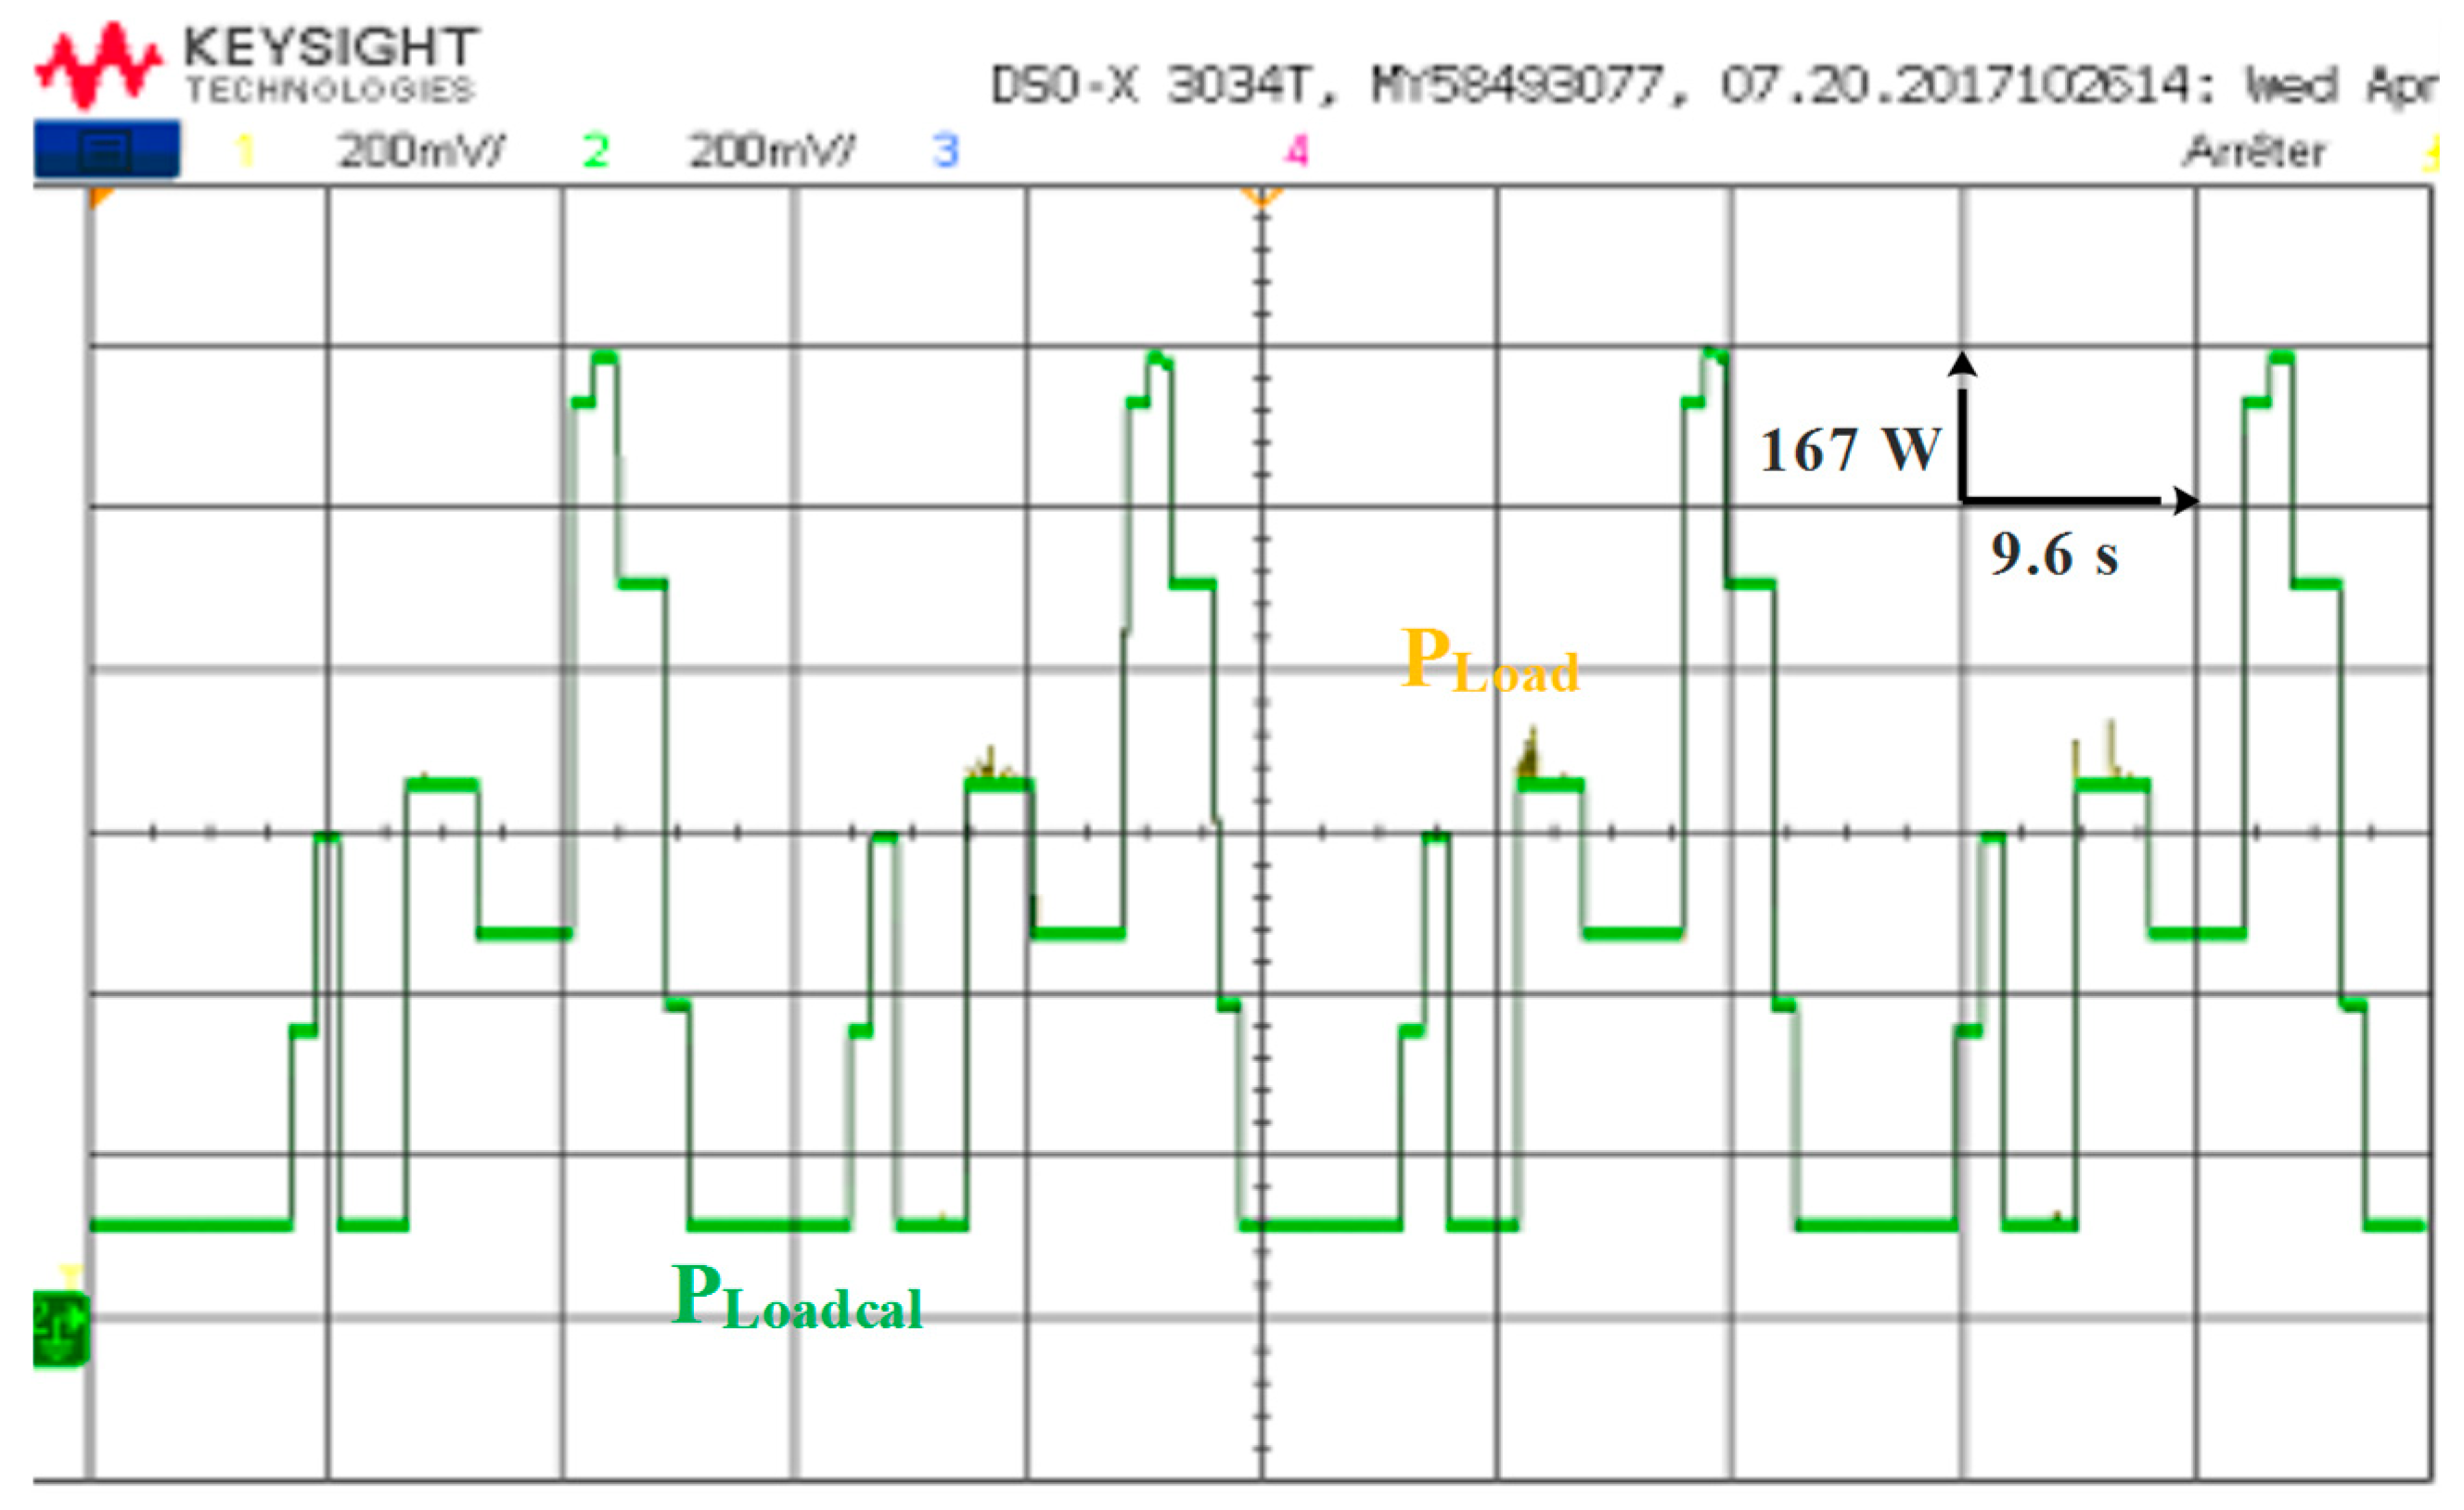
Figure 31.
Zooms on calculated and developped load power in RTlab.
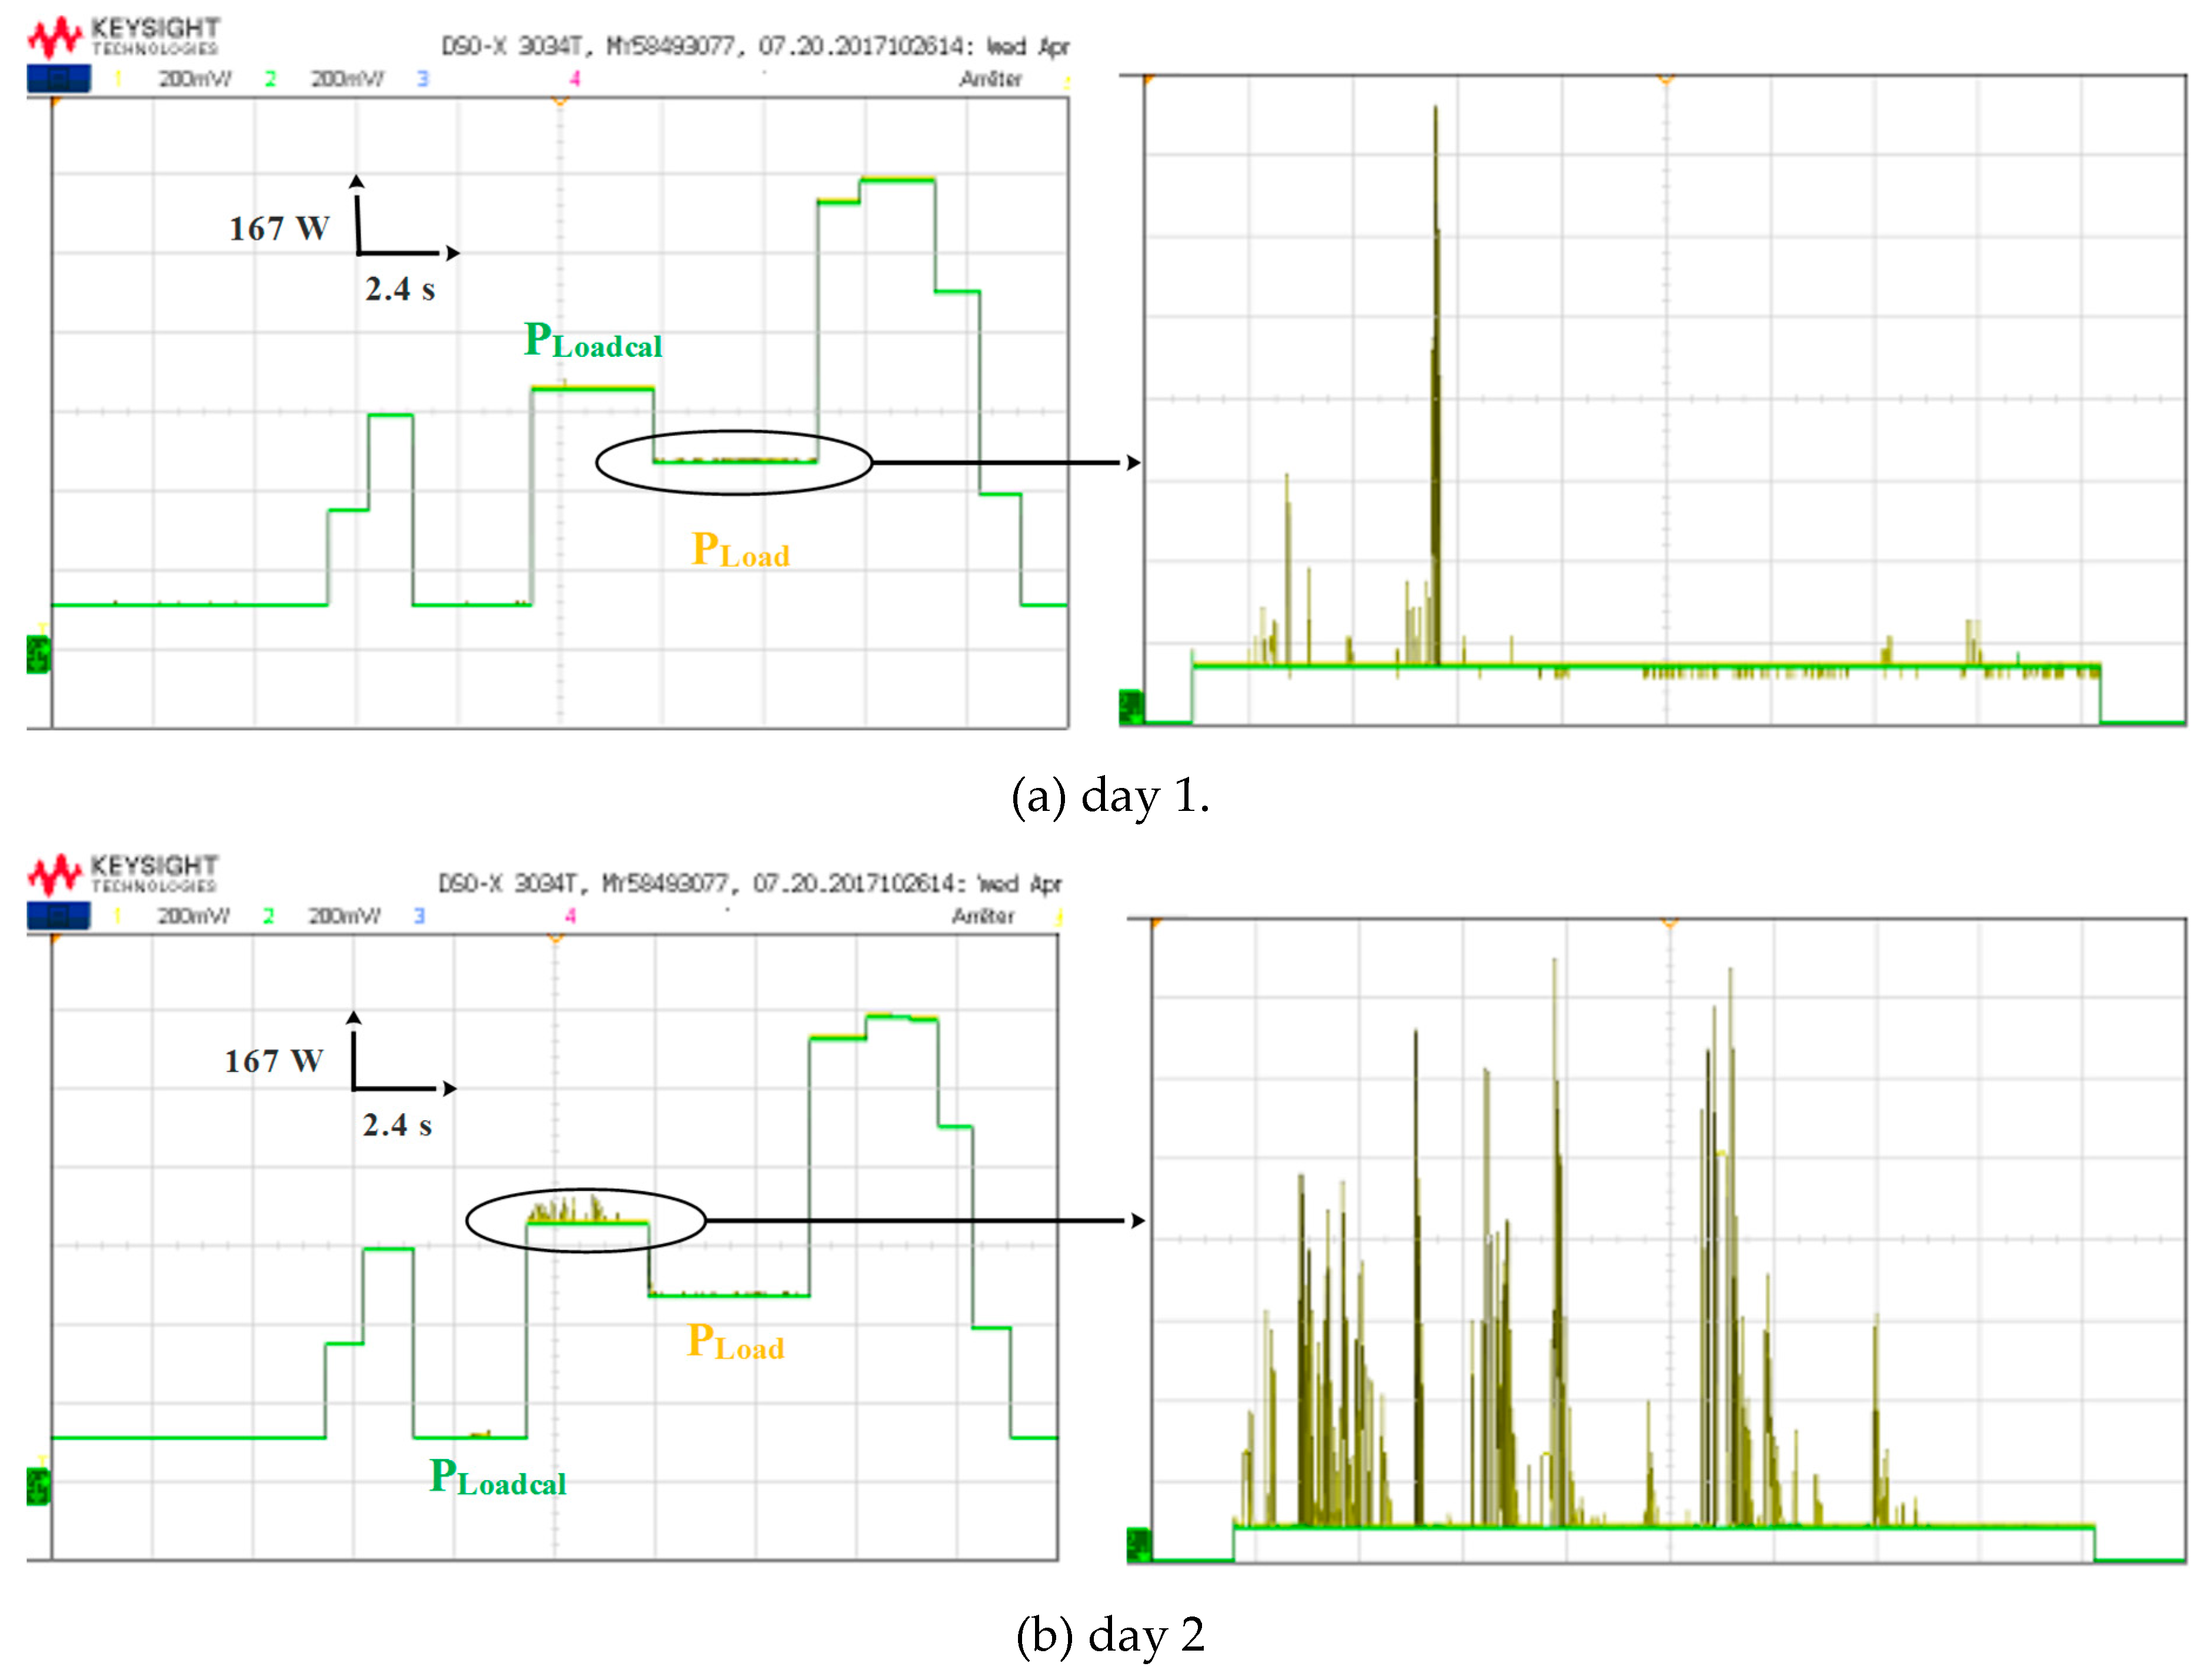
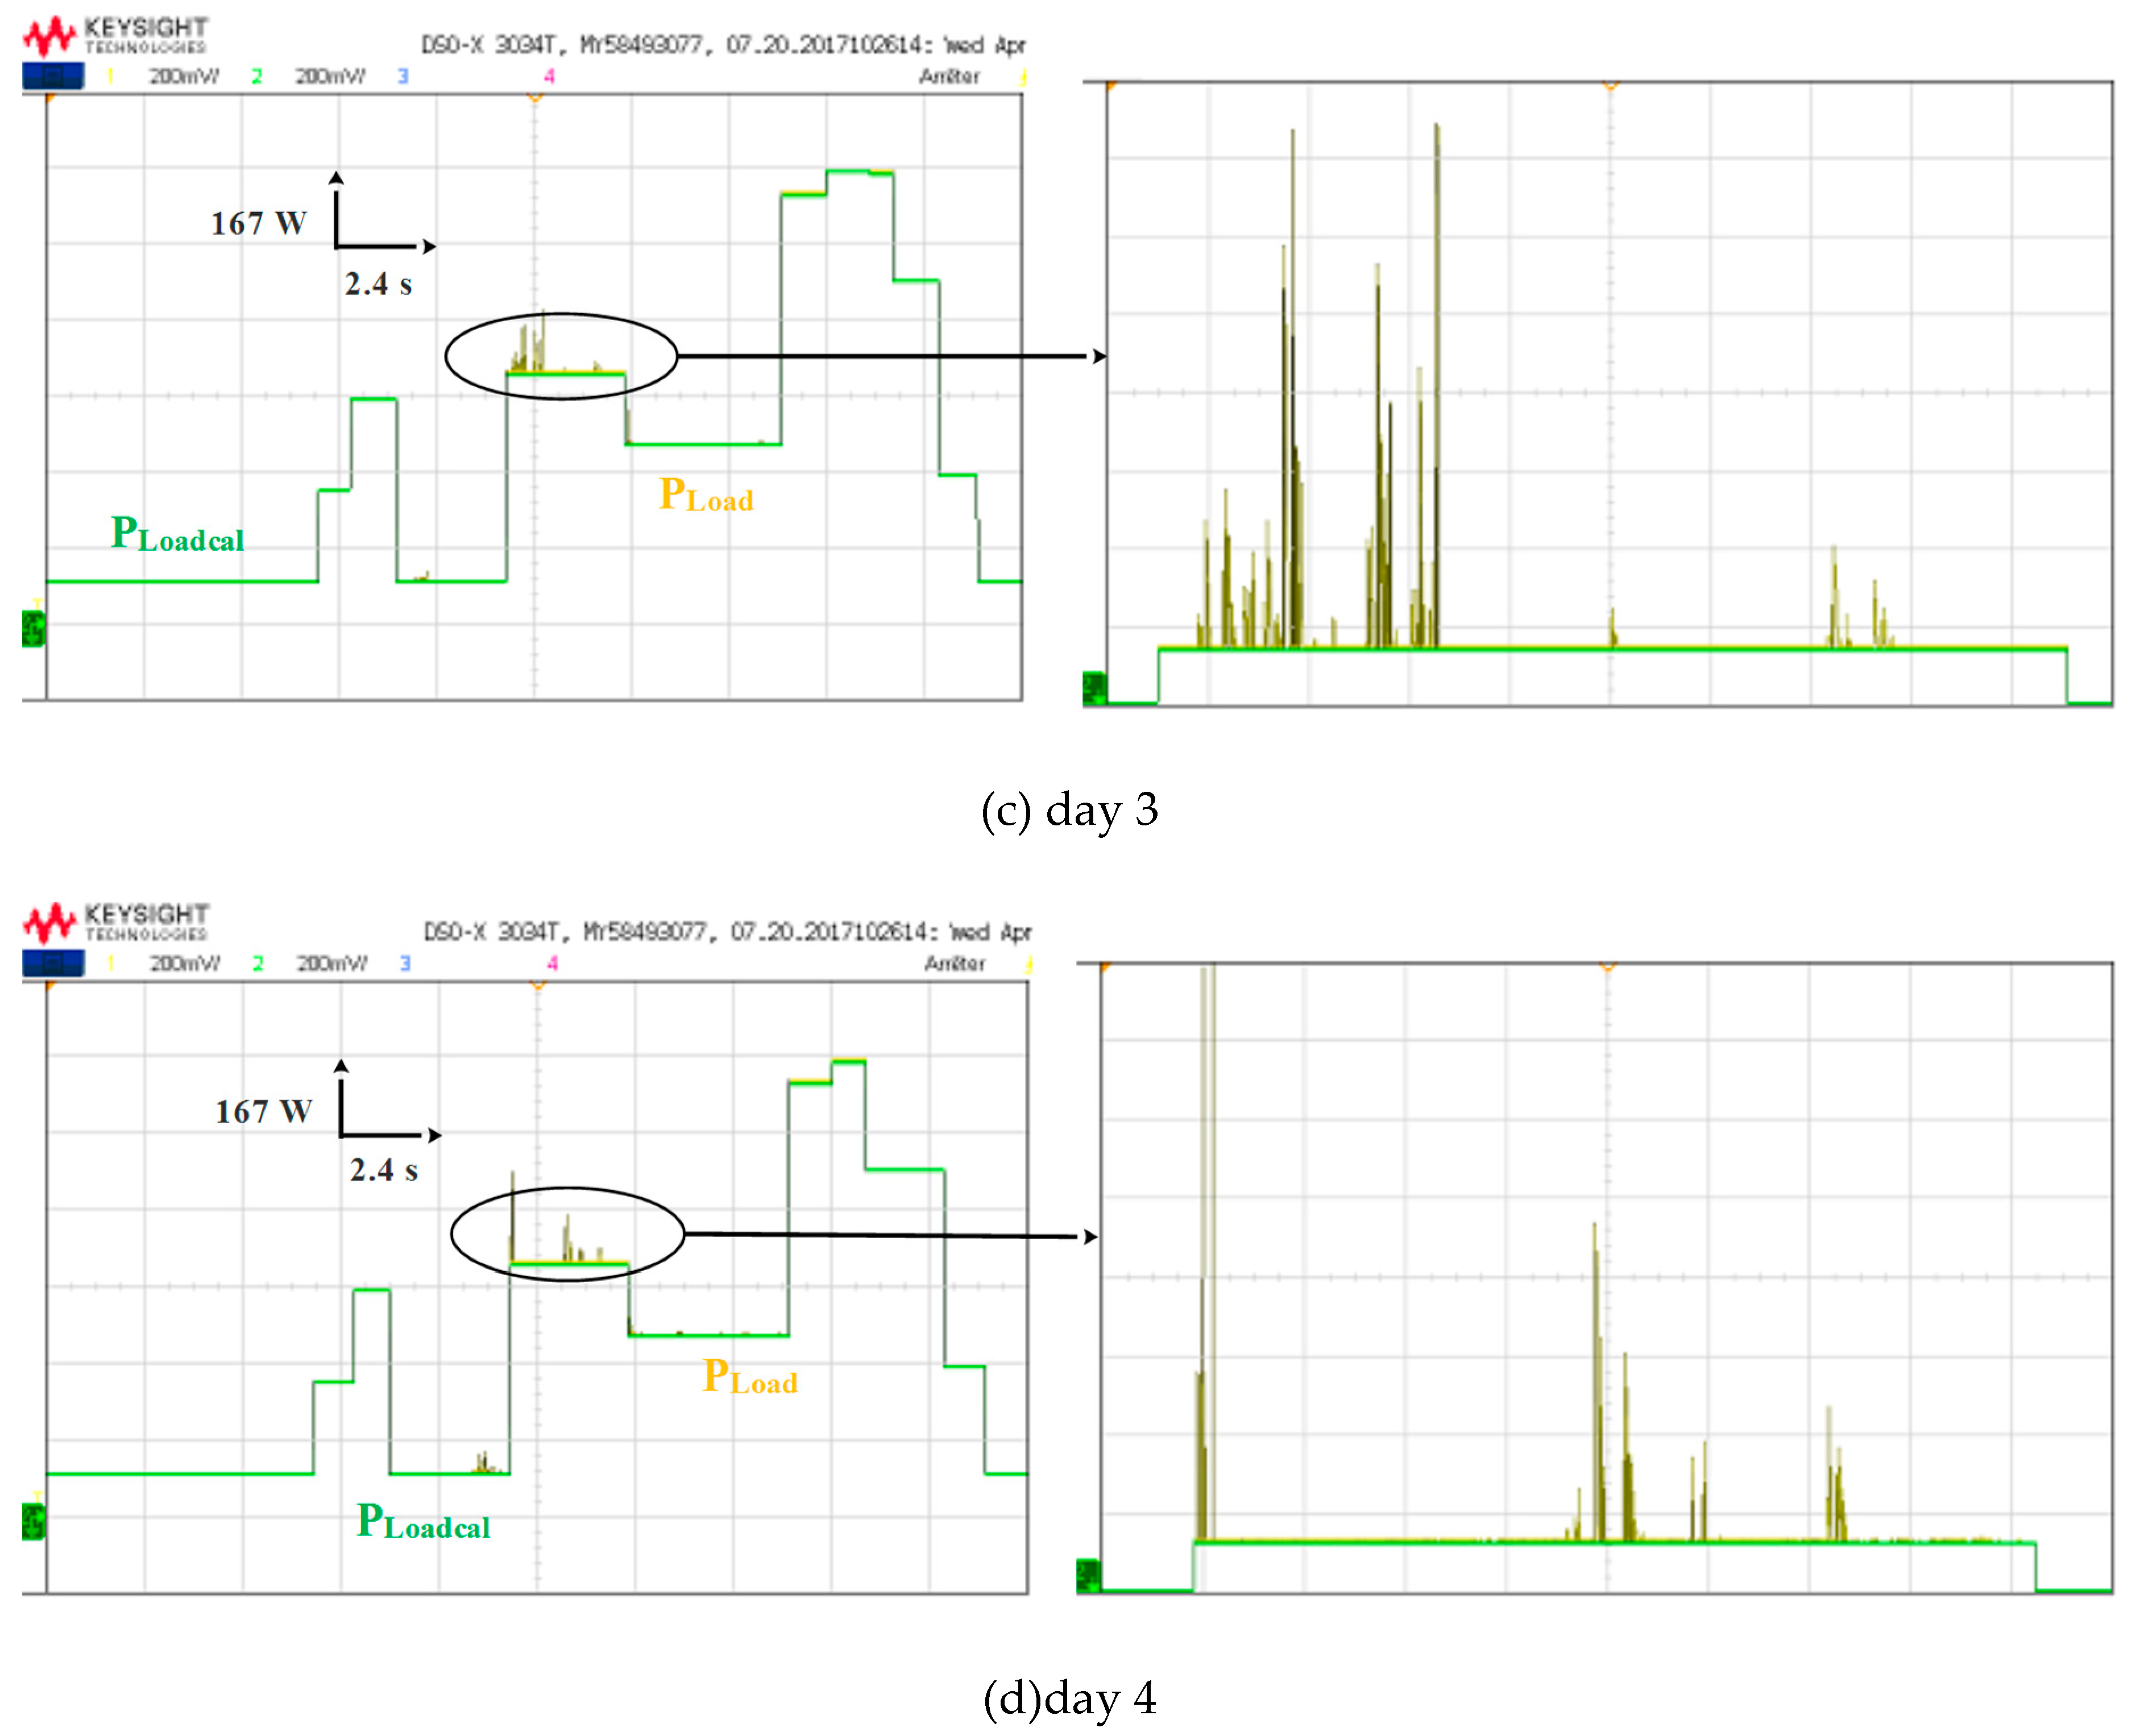
Table 1.
PV identification tests.
| Tests | Es (W/m²) | Ta (°C) |
| Test 1 | 750.00 | 28.00 |
| Test2 | 410.00 | 27.50 |
| Test 3 | 158.00 | 21.00 |
Table 3.
Different supercapacitor identification techniques.
| Technique | Description | Advantages | Drawbacks |
| Electrochemical impedance spectroscopy | Supercapacitor impedance is measured as a function of frequency |
Identifiesseveral supercapacitor electrical properties such as capacitance, resistance, and frequency-dependent behavior | Expensive equipment required. |
| Cyclic voltammetry | Various voltages are applied to the supercapacitor and the resulting current is measured. | Provides information about the supercapacitor's capacitance, charge/discharge behavior, and electrochemical stability. | High degree of interpretation and practical skillsare required |
| Charge-Discharge Cycling | The capacitor is charged to a set voltage, then it is discharged through a load while measuring the resulting voltage and current. | Fast and relatively easy way to determine the capacitance and resistance of supercapacitors | The accuracy of the results can be influenced by the quality of measurement equipments, the accuracy of the voltage and current measurements |
Table 4.
Supercapacitor parameters.
| Paramètres | Values |
| Rated capacitance | 165 F |
| Maximum ESRDC initial | 60 m Ω |
| Test current for capacitance and ESRDC | 100A |
| Rated voltage | 48 V |
| Stored energy | 53 Wh |
| Absolute maximum voltage | 51 V |
| Absolute maximum current | 1,900 A |
| Maximum series voltage | 750V |
| Capacitance of individuel cells | 3,000 F |
| Storage Energy, individual cell | 3.0 Wh |
| Number of cells | 18 |
Table 5.
Obtained identified parameters.
| Parameters | Values |
| R1 | 1,8 |
| R2 | 0,5 |
| C1 | 161F |
| C2 | 102F |
Table 6.
The different possible modes.
| Modes | description | Equations | Scheme |
| M1 | We disconnected the batteries because they are fully charged. | 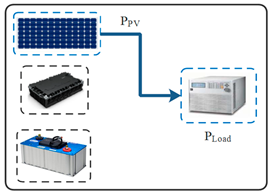 |
|
| M2 | We disconnected the the supercapacitors because they are fully charged. | 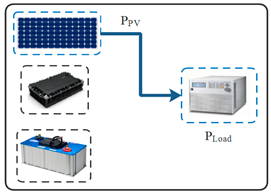 |
|
| M3 | When the batteries and supercapacitors are depleted and disconnected, the load is powered by PV power. | 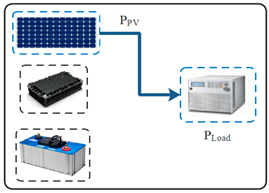 |
|
| M4 | The generated photovoltaic power will be used to supply the load since it is greater than what is needed by the load.The extra power recharge the batteries.. | 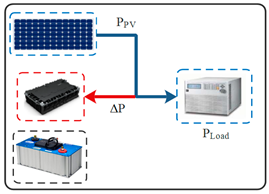 |
|
| M5 | The generated photovoltaic electricity will be used to supply the load because it is greater than the load power.The extra power charge the supercapacitors. | 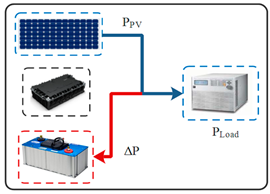 |
|
| M6 | PV powers the load, and any extra power is sent to a backup load while the batteries and supercapacitors are charged | 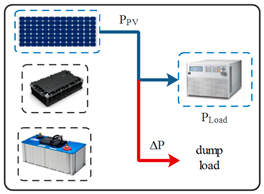 |
|
| M7 | The batteries are charged, the load is supplied, and the photovoltaic power is zero | 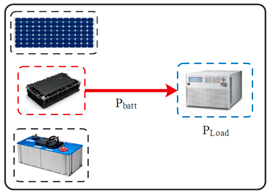 |
|
| M8 | As long as the batteries are charged, since the PV power is not zero, they will fill up the power gap and supply the load. | 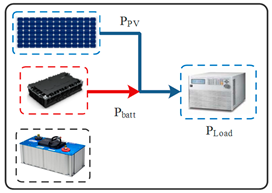 |
|
| M9 | Since there is no PV power in this scenario, charged SCs will be used to fed the load. | 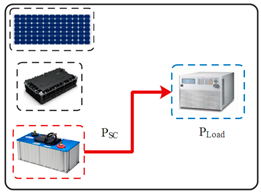 |
|
| M10 | he load is provided by SCs and PV power because the SCs are charged and the PV power is not zero. | 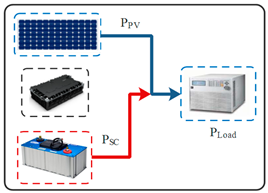 |
|
| M11 | We disconnected the batteries and SCs. The load could not be supplied by the PV because of the low batteries and SCs levels of SOC. | 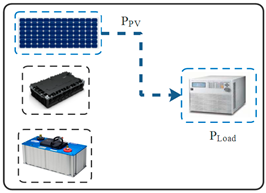 |
Disclaimer/Publisher’s Note: The statements, opinions and data contained in all publications are solely those of the individual author(s) and contributor(s) and not of MDPI and/or the editor(s). MDPI and/or the editor(s) disclaim responsibility for any injury to people or property resulting from any ideas, methods, instructions or products referred to in the content. |
© 2023 by the authors. Licensee MDPI, Basel, Switzerland. This article is an open access article distributed under the terms and conditions of the Creative Commons Attribution (CC BY) license (https://creativecommons.org/licenses/by/4.0/).
Copyright: This open access article is published under a Creative Commons CC BY 4.0 license, which permit the free download, distribution, and reuse, provided that the author and preprint are cited in any reuse.
Submitted:
07 August 2023
Posted:
08 August 2023
You are already at the latest version
Alerts
A peer-reviewed article of this preprint also exists.
This version is not peer-reviewed
Submitted:
07 August 2023
Posted:
08 August 2023
You are already at the latest version
Alerts
Abstract
The paper addresses the ongoing and continuous interest in photovoltaic energy systems (PESs). In this context, the study focuses on an isolated photovoltaic system with hybrid bat-tery-supercapacitor storage (HBSS). The integration of supercapacitors (SCs) in this system is of particular importance because of their high specific power density. In photovoltaic (PV) systems, multi-storage systems use two or more energy storage technologies to enhance system perfor-mance and flexibility. When batteries and supercapacitors are combined in a PV system, their benefits are maximized and offer a more reliable, efficient, and cost-effective energy storage op-tion. In addition, effective multi-storage power management in a PV system needs a solid grasp of the energy storage technologies, load power demand profiles, and the whole system architecture. In this work, battery-supercapacitor storage system (HBSS) is established by combining batteries and supercapacitors. The primary objective is to devise a novel management algorithm that ef-fectively controls the different power sources. The algorithm's purpose is to regulate the charge and discharge cycles of the HBSS, ensuring that the state of charge (SOC) of both batteries and supercapacitors remains within the desired range. The proposed management algorithm is de-signed to be simple, efficient, and light on computational resources. It efficiently handles the energy flow within the HBSS, optimizing the usage of both batteries and supercapacitors based on real-time conditions and energy demands. By maintaining the SOC of these energy storage components within the specified limits, the proposed method ensures their longevity and max-imizes their performance. Simulation results obtained from applying the management strategy are found to be satisfactory. These results show that the proposed algorithm maintains the SOC of batteries and supercapacitors within the desired range, leading to improved energy management and enhanced system efficiency.
Keywords:
Subject: Engineering - Electrical and Electronic Engineering
1. Introduction
In remote areas the adoption of renewable energy systems is rising [1--5]. In order to keep the source energy and the charge demand in an optimal power balance, the energy storage system is essential [6, 7]. In photovoltaic (PV) systems, energy storage is used to store excess solar energy produced during the day so that it can be used at a later time when the sun is not shining or when electricity demand is high. There are several types of energy storage technologies that can be used in photovoltaic (PV) systems, including batteries, supercapacitors, Flywheels, pumped hydroelectric storage, thermal energy storage and fuel cells. Batteries are the most widely used storage technology for PV systems, as they are relatively inexpensive and can be easily installed in residential and commercial settings. Supercapacitors, also known as ultracapacitors, store electrical energy as an electrostatic charge. They have a high-power density, meaning they can charge and discharge quickly, making them well-suited for applications that require high power output. While supercapacitors have some advantages over batteries, such as faster charging times and longer lifetimes under certain conditions; they also have some limitations that may make them less practical for some PV system applications. The different drawbacks are low energy density, high cost, limited lifespan, voltage limitations and leakage current [8, 9].
The best combination will be determined by the system requirements and the resources at hand. It will be determined by various criteria, including the system's precise requirements, the available budget, and the tradeoffs between the advantages and downsides of each technology. The combination of batteries and supercapacitors has various advantages. Batteries can store significant quantities of energy for extended periods of time, but supercapacitors may discharge fast and give high-power bursts for brief periods of time. This combination has the potential to assist balance the load on the PV system, particularly during high energy demand periods. When a PV system produces extra energy, the batteries may be charged and when power demand is high, the stored energy in the batteries can be released. However, Batteries have a limited discharge rate and are susceptible to voltage loss during high-power demands. Supercapacitors, however, discharge fast, giving extra power to meet high power demands, and they can also maintain a constant voltage output during periods of high-power demand. Combining batteries and supercapacitors has the added benefit of extending the life span of both power sources. Supercapacitors can absorb high power bursts, lowering battery burden and reducing battery cycling. This helps preventing battery damage, increasing their life span. Supercapacitors are more costly than batteries, but they are capable of reducing the capacity required for the battery system. However, there are some potential disadvantages, such as higher costs, complex control systems, maintenance issues, safety concerns, and limited scalability.
Power management of multi-storage in a PV system is a crucial aspect to ensure that the different energy storage technologies work together effectively and efficiently. Additionally, continuous monitoring of the SOC ensures that the storage systems operate within their optimal range, by ensuring optimized utilization and maximum system efficiency. Power management of photovoltaic (PV) systems with multi storage technologies has been the subject of several research papers [10-19]. The power management of PV systems with multi storage technologies involves controlling the power flow between different energy storage technologies, such as batteries and supercapacitors, while also ensuring that the load is supplied. The goal is to optimize the use of each storage technology and maximize the overall system efficiency.
The purpose of this study is to introduce a management power control which permits the control of the charge and discharge process of storage. The application is demonstrated in Berjaya an area with a significant potential for solar irradiation, using four different day patterns. The validity and usefulness of the suggested power management approach are shown in this study through simulation results. On a real-time simulator (RT Lab), a number of experimental tests were carried out to assess the suggested control algorithms.
2. Biometrical study on storage in renewable energies
The integration of biometrics in renewable energy's storage of freshen handed security, improved use reexperience, and increased efficiency in managing renewable energy systems. A research has been made based on different keywords (energy storage, renewable energy, batteries, photovoltaic, Figure 1 visually depicts the network of relationships between terms, represented by lines connecting one term to another. This figure illustrates the clusters associated with different aspects of renewable energy research. Notably, recent developments in the field are prominently related to storage systems, photovoltaic, hybrid renewable energies, and electric vehicle charging. This figure can be a reference for future researchers to identify relevant themes within the renewable energy domain. The findings reveal a total of 741 items related to renewable energy. These items are organized into six distinct clusters as follows:
- Cluster 1 (Red) - Contains 234 items.
- Cluster 2 (Green) - Contains 192 items.
- Cluster 3 (Blue) - Contains 158 items.
- Cluster 4 (Yellow) - Contains 82 items.
- Cluster 5 (Purple) - Contains 65 items.
- Cluster 6 (Cyan) - Contains 11 items.
Each cluster represents a group of related terms, and a colored circle is assigned to each term within the clusters. The size of the circles is proportional to the frequency of occurrence of the terms in the titles and abstracts. Larger circles and letters indicate more frequent appearances of the terms.
- 3.
- Proposed PV hybridstoragesystem
PV panels, a DC/DC converter, and (batteries/supercapacitors)storage system are all components of the system under study (Figure 1). Long-term energy storage is possible with battery technology. Supercapacitors can quickly absorb current variation, lowering the risk to the batteries. The voltage of the solar panels can be raised by connecting a boost converter to them. Due to the connection of supercapacitors and batteries to the DC bus, electrical power from the PV panels, batteries, and supercapacitors can all be used to power the load simultaneously.
3. CONTROLLER DESIGN
3.1. Photovoltaic pannel modeling
The electrical current is [6,20-25]:

Where: Iph, Id and IRsh are respectively photo-current, diode-current and shunt resistance current.
Various tests (Experimental and simulations) have been performed in order to identify the different PV panel characteristics (Figure 3) under threedistinct solar irradiation and ambient temperatre levels: low, médium and high as point edout in Table 1. The established experimental bench is high lighted in Figure 4
3.2. Battery modeling
The following model (Figure 5) has been employed in our work using various voltage and chargestateequations [1,7].
In this study, a 12 V-100 Ah battery is used as a storage device as shown in Figure 6. Identification is performed to determine the battery impedance (ZBatt).
The phase shift of these two signals gives the impedance ZBatt. And then internal resistance RBatt, and the capacitive reactance XBatt
With: ƒ the frequency, (Hz)
The different calculated results are:
RBatt=0.795 Ω, XBatt=0.07 Ω and CBatt=44.96 mF
All of these identified variables were included in simulation models to establish realistic mathematical models that were as near to the experiment as possible.Figure 7 shows the different curves obtained while proceeding to the identification of the battery. It shows that there exsit a phase shift of 3 degrees between voltage and current (voltage is lagging)
3.3. Supercapacacitors model
Different models for simulating a supercapacitor (SC) have been putforth in theliterature [26 - 36]. The corresponding electric circuit with two RC branches (Figure 8) is the model utilized in our research.
There are two branches to it. The supercapacitor's immediate behavior during quick charge and discharge cycles with in seconds is defined by the R1C1 branch [8, 9]. The slugg is hbranch is the second branch R2C2. The model [8] is described by the equations below:

The SC's pack voltage and current are represented as Usc and Isc, respectively. The fundamental supercapacitor voltage and current are Vsc and isc, respectively.
The secondary capacity C2's secondary voltage V2 is determined by:

Q2 is the instantaneous charge of C2, we have:

The current i1 in the main capacitor C1 is given as:

There are threemain techniques to characterize a supercapacitor as listed in Table 3 shown below:
Galvanostatic charge-discharge cycling, potentiation charge-discharge cycling, and constant current charge-discharge cycling are just a few of the methods that can be used to describe supercapacitors. The exact properties of the supercapacitor being tested and the data needed for the application determine the technique to use. Charge-discharge cycling was employed in this study to evaluate the supercapacitor (Figure 9). Table 4 displays the various supercapacitor's researched parameters.
During charge and for a current of 10A, we obtain the following response (Figure 10). The resistance R1 is the cause of the drop in the load voltage at the initial moment. C1 is determined directly from the constant current load characteristic of the cell: 𝐶1 = I/((ΔV)/(Δt))=10/((20-2)/((300-10)))=161F.
The different identified parameters are given in Table 5.
Proposed Power management control
Two DC/DC convertersthat are set up as buck-boostconverters are employedbythepowermanagementsystem, whichalsoemploys a powerflow control method. Tomakesurethesystemrunssmoothly and effectively, theseconvertersregulatetheflowofpower. These are the load powerrequirements:
Where ∆P is the powerd emand variation
It is worth mentioning that the proposed energy management strategy has eleven different modes and this increases the HESS system reliability and reduces the stress applied on the batteries.
5. Simulation results
The studied system is simulated under MATLAB/Simulink to verify the suggested control and energy management technique. The simulation's findings have been presented and analyzed. Themeasuredprofilesof solar irradiationand ambienttemperatureare respectivelygiven in Figure 12 and Figure 13. DC bus voltagetrackswellitsreference (Figure 14).Voltage battery and supercapacitor are represented in Figure 15.
Itisshown in Figure 16, battery SOC ismaintainedbetween 82.85%and 90% whilesupercapacitor SOC varies between 58.05and 90 %.Figure 17 shown below points out the battery and supercapacitor currents. The different resulting modes are given in the Figure 18. The battery, supercapacitor and the PV powers are simultaneously depicted in Figure 19. The power per day of all power sources corresponding to four distinct days are shown in Figure 20. The reference load power and the sum of power developed by all the power sources are respectively shown in Figure 21. The zoom of this last mentioned figure for four distinct days is shown in Figure 22.
6. Real-Time simulation
On a real-time simulator (RT Lab), a number of experimental tests were carried out to assess the suggested control algorithms. The system parameters remained the same as those used in the MATLAB/Simulink numerical simulation. A host PC, a real-time digital simulator (OP5700), an HIL controller, an OP8660 data collection interface, and a digital oscilloscope make up the real-time simulation bench (Figure 23).
Figure 24 shows the different obtained modes when the energy management strategy is run using the RT LAB real time simulation platform. The scheduled modes from 1 to 11 are highlighted to demonstrate the efficacy of the suggested management.
Battery and supercapacitorvoltagesand theircorresponding zooms are highlighted in Figure 25. TheSOCofbothsupercapacitor and battery are shown in Figure 26. The zoom in thesame figure confirmsthattheSOCofthepreviosulymentionnedpowersourcesiskeptwithinsafelimitsduringallthesimulationperiod.
The battery and supercapacitor currents are shown in Figure 27. It can be seen that the battery is used during low and medium power demands. However, during fast and peak load demands, the supercapacitor is used ecause of its rapid transient dynamics.
Figure 28 shows the reference DC bus voltage, its reference and a zoomthe aforementioned quantity. It can be seen clearly that VDCfollows precisely its reference. Note also that the voltage ripple band is small and tolerable.
The power developed by each energy source is shown separately in Figure 29. As shown in Figure 30, the load power equals the developed power. Out of Figure 31, one can notice that the hybrid energy storage system produces a power that is equivalent to the total demand with a little excess as illustrated in the different subfigures of Figure 31 illustrated below:
5. Conclusion
This paper discusses an energy management strategy for multi storage (Battery/SC) applied in photovoltaic system has been proposed. The used control technique is based on current regulation of two energy sourcesthrought the use ofproportional integral (PI)regulators. Thefindingswereverifiedbysimulationwith MATLAB/Simulink, and theywerealsoputtothe test in real-time withthe RT LAB simulationplatform.This means that the control used is efficient and allows the flow of energy appropriately and this ensure good and optimal system operation. The power management techniques covered in this paper enable the system to operate as effectively as possible with high photovoltaic system performance, regardless of the weather conditions.As a further work, it is planned to apply intelligent control methods to extend the lifespan of energy sources while ensuring their efficient and optimal utilization.
Funding
This work is funded by the Deanship of Scientific Research, Taif University.
Acknowledgments
The researchers would like to acknowledge the Deanship of Scientific Research, Taif University for funding this work.
Conflicts of Interest
The authors declare no conflict of interest.
References
- Amrouche, S.O.; Rekioua, D.; Rekioua, T.; Bacha, S. Overview of energy storage in renewable energy systems. International Journal of Hydrogen Energy 2016, 41, 20914–20927. [Google Scholar] [CrossRef]
- Kamarzaman, N.A.; Tan, C.W. A comprehensive review of maximum power point tracking algorithms for photovoltaic systems. Renewable and Sustainable Energy Reviews 2014, 37, 585–598. [Google Scholar] [CrossRef]
- Elgendy, J.-M.A.; Zahawi, B.; Atkinson, D.J. Assessment of Perturb and Observe MPPT Algorithm Implementation Techniques for PV Pumping Applications. IEEE Transactions on Sustainable Energy 2012, 3, 21–33. [Google Scholar] [CrossRef]
- Rekioua, D. Hybrid Renewable Energy Systems Overview. Green Energy and Technology 2020, 1–37. [Google Scholar]
- Attia, H. Fuzzy Logic Controller Effectiveness Evaluation through Comparative Memberships for Photovoltaic Maximum Power Point Tracking Function. International Journal of Power Electronics and Drive Systems (IJPEDS) 2018, 9, 1147–1156. [Google Scholar] [CrossRef]
- Rekioua, D.; Matagne, E. Optimization of Photovoltaic Power Systems, Modelization, Simulation and Control. 2012, Edition Springer.
- Lalouni, S.; Rekioua, D. Optimal control of a grid connected photovoltaic system with constant switching frequency. Energy Procedia 36, 189–199. [CrossRef]
- Oubelaid, A.; Taib, N.; Rekioua, T.; Bajaj, M.; Yadav, A.; Shouran, M.; Kamel, S. Secure Power Management Strategy for Direct Torque Controlled Fuel cell/Supercapacitor Electric Vehicles. Frontiers in Energy Research 1425. [CrossRef]
- Oubelaid, A.; Alharbi, H.; Humayd, A.S.B.; Taib, N.; Rekioua, T.; Ghoneim, S.S.M. Fuzzy-Energy-Management-Based Intelligent Direct Torque Control for a Battery—Supercapacitor Electric Vehicle. Sustainability 2022, 14, 8407. [Google Scholar] [CrossRef]
- Kumar, R.N. Energy Management system for Hybrid RES with Hybrid Cascaded Multilevel inverter. International Journal of Electrical and Computer Engineering (IJECE) 2014, 4, 24–30. [Google Scholar] [CrossRef]
- Dursun, E.; Kilic, O. Comparative evaluation of different power management strategies of a stand-alone PV/Wind/PEMFC hybrid power system. Electrical Power and Energy Systems 2012, 34, 81–89. [Google Scholar] [CrossRef]
- Bratcu, A.I.; Munteanu, I.; Bacha, S.; Raison, B. Maximum power point tracking of grid-connected photovoltaic arrays by using extremum seeking control. Journal of Control Engineering and Applied Informatics 2008, 10, 3–12. [Google Scholar]
- Mebarki, N.; Rekioua, T.; Mokrani, Z.; Rekioua, D. Supervisor control for stand-alone photovoltaic/ hydrogen/ battery bank system to supply energy to an electric vehicle. International Journal of Hydrogen Energy 2015, 40, 13777–13788. [Google Scholar] [CrossRef]
- Belaid, S.; Rekioua, D.; Oubelaid, A.; Ziane, D.; Rekioua, T. A power management control and optimization of a wind turbine with battery storage system. Journal of Energy Storage 45, 103613. [CrossRef]
- Singh, S.N.; Snehlata, N. Intelligent home energy management by fuzzy adaptive control model for solar (PV)-grid/dg power system in india. International Journal of Power Control Signal and Computation (IJPCSC) 2011, 2, 61–66. [Google Scholar]
- Hajizadeh, A.; Golkar, M.A. Intelligent power management strategy of hybrid distributed generation system. Electrical Power and Energy Systems 2007, 29, 783–795. [Google Scholar] [CrossRef]
- Rekioua, D.; Rekioua, T. , DSP-controlled direct torque control of induction machines based on modulated hysteresis control. Proceedings of the International Conference on Microelectronics, 2009, 5418603, 378–381. [Google Scholar]
- Sumarmad, K.A.A.; Sulaiman, N.; Wahab, N.I.A.; Hizam, H. Microgrid Energy Management, System Based on Fuzzy Logic an. d Monitoring Platform for Data Analysis. Energies 2022, 15, 4125. [Google Scholar]
- Rekioua, D. Power Electronics in Hybrid Renewable Energies Systems. Green Energy and Technology 2020, 39–77. [Google Scholar]
- Mohammedi, A.; Rekioua, D.; Rekioua, T.; Bacha, S. Valve Regulated Lead Acid battery behavior in a renewable energy system under an ideal Mediterranean climate. Int Journal Hydrogen Energy 2016, 41, 20928–20938. [Google Scholar] [CrossRef]
- Soulatiantork, P. Performance comparison of a two PV module experimental setup using a modified MPPT algorithm under real outdoor conditions. Solar Energy 2018, 169, 401–410. [Google Scholar] [CrossRef]
- Rekioua, D.; Matagne, E. Modeling of solar irradiance and cells In: Optimization of Photovoltaic Power Systems. Green Energy and Technology. Springer, London. 2012.
- Smida, M.B.; Sakly, A. Fuzzy logic control of a hybrid renewable energy system: A comparative study. Wind Engineering 2021, 45, 793–806. [Google Scholar] [CrossRef]
- Rekioua, D. , Energy Management for PV Installations. Advances in Renewable Energies and Power Technologies 2018, 1, 349–369. [Google Scholar]
- Guerra, M.I.S.; de Araujo, F.M.U.; Dhimish, M.; Vieira, R.G. Assessing maximum power point tracking intelligent techniques on a pv system with a buck–boost converter. Energies 2021, 14, 7453. [Google Scholar] [CrossRef]
- Zubieta, L.; Bonert, R. Characterization of double-layercapacitors (DLCs) for power electronics applications. IEEE Transactions on Industry Applications 2000, 36, 199–205. [Google Scholar] [CrossRef]
- Zhang, L.; Hu, X.; Wang, Z.; Sun, F.; Dorrell, D.G. A review of supercapacitor modeling, estimation, and applications: A control/management perspective. Renewable and Sustainable Energy Reviews 2018, 81, 1868–1878. [Google Scholar] [CrossRef]
- Hassani, H.; Zaouche, F.; Rekioua, D.; Belaid, S.; Rekioua, T.; Bacha, S. Feasibility of a standalone photovoltaic/battery system with hydrogen production. Journal of Energy Storage 2020, 31, 101644. [Google Scholar] [CrossRef]
- Elbaset, A.A.; Abdelwahab, S.A.M.; Ibrahim, H.A.; Eid, M.A.E. Performance Analysis of Photovoltaic Systems with Energy Storage Systems. book chapter, Renewable and Green Energy, Springer, 19. 20 January.
- Elbaset, A.A.; Abdelwahab, S.A.M.; Ibrahim, H.A.; Eid, M.A.E. The Performance Analysis of a PV System with Battery-Supercapacitor Hybrid Energy Storage System. book chapter, Renewable and Green Energy, Springer, 19. 20 January.
- Yousef, A.M.; Abo-Elyousr, F.K.; Elnozohy, A.; Moayed, M.; Saad, A.; Mohamed, A. Fractional Order PI Control in Hybrid Renewable Power Generation System to Three Phase Grid Connection. International Journal on Electrical Engineering and Informatics 2020, 12. [Google Scholar] [CrossRef]
- Elnozahy, A.; Yousef, A.M.; Abo, F.K. , Moayed Mohamed and Saad A. Mohamed Abdelwahab," Performance improvement of hybrid renewable energy sources connected to the grid using artificial neural network and sliding mode control. Journal of Power Electronics, Springer, 21. 20 March.
- Saleh, B.; Yousef, A.M.; Abo-Elyousr, F.K.; Mohamed, M. , Saad A. Mohamed Abdelwahab and Ahmed Elnozahy,"Performance Analysis of Maximum Power Point Tracking for Two Techniques with Direct Control of Photovoltaic Grid -Connected Systems", Energy Sources, Part A: Recovery, Utilization, and Environmental Effects, pp. 1–23, 12 Mar 2021.
- Elnozahy, A.; Yousef, A.M.; Ghoneim, S.S.M.; Abdelwahab, S.A.M.; Mohamed, M.; Abo, F.K. Optimal Economic and Environmental Indices for Hybrid PV/ Wind.Based Battery Storage System. Journal of Electrical Engineering & Technology, The Korean Institute of Electrical Engineers 2021 Springer, pp. 2847–2862, 2021.
- Eid, M.A.E.; Elbaset, A.A.; Ibrahim, H.A.; Abdelwahab, S.A.M. ; Modelling, Simulation of MPPT Using Perturb and Observe and Incremental Conductance techniques For Stand-Alone PV Systems. 2019 21st International Middle East Power Systems Conference (MEPCON), 2019. [Google Scholar]
- Abdelwahab, S.A.M.; Hamada, A.M.; Abdellatif, W.S.E. Comparative Analysis of the Modified Perturb & Observe with Different MPPT Techniques for PV Grid Connected Systems. International Journal of Renewable Energy Research-IJRER 2020, 10, 156–164. [Google Scholar]
Figure 1.
Network visualisation of renewable energy keyword.

Figure 2.
Proposed PV based hybrid storage scheme.

Figure 3.
Experimental test bench.

Figure 4.
Electricalcharacteristics.

Figure 5.
R-C model of the battery.

Figure 6.
Battery identification test bench.

Figure 7.
Batetry voltage and current curves.

Figure 8.
SC model.

Figure 9.
Supercapacitor identification test bench.

Figure 10.
Tests under charge and discharge.

Figure 11.
Photovoltaic system energy management flowchart.

Figure 12.
Measured solar irradiance.

Figure 13.
Ambient temperature.

Figure 14.
DC bus voltage.

Figure 15.
Voltage battery and supercapacitor.

Figure 16.
Battery and supercapacitorSOC.

Figure 17.
Battery and supercapacitor currents.

Figure 18.
Differentobtainedmodes.

Figure 19.
The different powers.

Figure 20.
Powers per day with the different modes.


Figure 21.
Calculated Ploadcal and developped Ploadload power.

Figure 22.
Zoomson calculated and developped load power.


Figure 23.
RT Lab real-time simulator work bench.

Figure 24.
Differentmodesobtained in RTlab.

Figure 25.
Batteryvoltage.

Figure 26.
Battery-supercapacitor SOC and their zoom.

Figure 27.
Battery-supercapacitor currents.

Figure 28.
DC bus voltage and its zoom.

Figure 29.
Different energy sources powers.

Figure 30.
Total developped power and desired one.

Figure 31.
Zooms on calculated and developped load power in RTlab.


Table 1.
PV identification tests.
| Tests | Es (W/m²) | Ta (°C) |
| Test 1 | 750.00 | 28.00 |
| Test2 | 410.00 | 27.50 |
| Test 3 | 158.00 | 21.00 |
Table 3.
Different supercapacitor identification techniques.
| Technique | Description | Advantages | Drawbacks |
| Electrochemical impedance spectroscopy | Supercapacitor impedance is measured as a function of frequency |
Identifiesseveral supercapacitor electrical properties such as capacitance, resistance, and frequency-dependent behavior | Expensive equipment required. |
| Cyclic voltammetry | Various voltages are applied to the supercapacitor and the resulting current is measured. | Provides information about the supercapacitor's capacitance, charge/discharge behavior, and electrochemical stability. | High degree of interpretation and practical skillsare required |
| Charge-Discharge Cycling | The capacitor is charged to a set voltage, then it is discharged through a load while measuring the resulting voltage and current. | Fast and relatively easy way to determine the capacitance and resistance of supercapacitors | The accuracy of the results can be influenced by the quality of measurement equipments, the accuracy of the voltage and current measurements |
Table 4.
Supercapacitor parameters.
| Paramètres | Values |
| Rated capacitance | 165 F |
| Maximum ESRDC initial | 60 m Ω |
| Test current for capacitance and ESRDC | 100A |
| Rated voltage | 48 V |
| Stored energy | 53 Wh |
| Absolute maximum voltage | 51 V |
| Absolute maximum current | 1,900 A |
| Maximum series voltage | 750V |
| Capacitance of individuel cells | 3,000 F |
| Storage Energy, individual cell | 3.0 Wh |
| Number of cells | 18 |
Table 5.
Obtained identified parameters.
| Parameters | Values |
| R1 | 1,8 |
| R2 | 0,5 |
| C1 | 161F |
| C2 | 102F |
Table 6.
The different possible modes.
| Modes | description | Equations | Scheme |
| M1 | We disconnected the batteries because they are fully charged. |  |
|
| M2 | We disconnected the the supercapacitors because they are fully charged. |  |
|
| M3 | When the batteries and supercapacitors are depleted and disconnected, the load is powered by PV power. |  |
|
| M4 | The generated photovoltaic power will be used to supply the load since it is greater than what is needed by the load.The extra power recharge the batteries.. |  |
|
| M5 | The generated photovoltaic electricity will be used to supply the load because it is greater than the load power.The extra power charge the supercapacitors. |  |
|
| M6 | PV powers the load, and any extra power is sent to a backup load while the batteries and supercapacitors are charged |  |
|
| M7 | The batteries are charged, the load is supplied, and the photovoltaic power is zero |  |
|
| M8 | As long as the batteries are charged, since the PV power is not zero, they will fill up the power gap and supply the load. |  |
|
| M9 | Since there is no PV power in this scenario, charged SCs will be used to fed the load. |  |
|
| M10 | he load is provided by SCs and PV power because the SCs are charged and the PV power is not zero. |  |
|
| M11 | We disconnected the batteries and SCs. The load could not be supplied by the PV because of the low batteries and SCs levels of SOC. |  |
Disclaimer/Publisher’s Note: The statements, opinions and data contained in all publications are solely those of the individual author(s) and contributor(s) and not of MDPI and/or the editor(s). MDPI and/or the editor(s) disclaim responsibility for any injury to people or property resulting from any ideas, methods, instructions or products referred to in the content. |
© 2023 by the authors. Licensee MDPI, Basel, Switzerland. This article is an open access article distributed under the terms and conditions of the Creative Commons Attribution (CC BY) license (https://creativecommons.org/licenses/by/4.0/).
Copyright: This open access article is published under a Creative Commons CC BY 4.0 license, which permit the free download, distribution, and reuse, provided that the author and preprint are cited in any reuse.
Self-Consumption and Self-Sufficiency Improvement for Photovoltaic System Integrated with Ultra-Supercapacitor
Qusay Hassan
et al.
Energies,
2021
Advanced Energy Management Strategy of Photovoltaic/PEMFC/Lithium-Ion Batteries/Supercapacitors Hybrid Renewable Power System Using White Shark Optimizer
Hesham Alhumade
et al.
Sensors,
2023
Dynamic Performance Enhancement of Power Grids by Operating Solar Photovoltaic (PV) System as Supercapacitor Energy Storage
Morteza Keshavarzi
et al.
Energies,
2021
MDPI Initiatives
Important Links
© 2024 MDPI (Basel, Switzerland) unless otherwise stated


