Submitted:
07 August 2023
Posted:
08 August 2023
You are already at the latest version
Abstract
Keywords:
1. Introduction
2. Materials and Methods
Materials:
| Sample | Thickness before (b) and after (a) (mm) | Look | Color | Photo before | Photo after |
|---|---|---|---|---|---|
| Entry 1 | 1,64 (b) 1,54 (a) |
Full hand | black |  |
 |
| Entry 2 | 1,56 (b) 1,36 (a) |
Compact touch | brown |  |
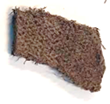 |
| Entry 3 | 1,29 (b) 1,11 (a) |
Soft hand | Light brown | 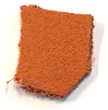 |
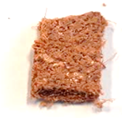 |
Cryogenic delamination
- -
- The polymeric layer removed, to know and characterize which compound is it.
- -
- The resulting crust leather, to be sure of all polymeric removal and the quality maintenance.
- -
- The original sample for a better comparison.
Analysis
- -
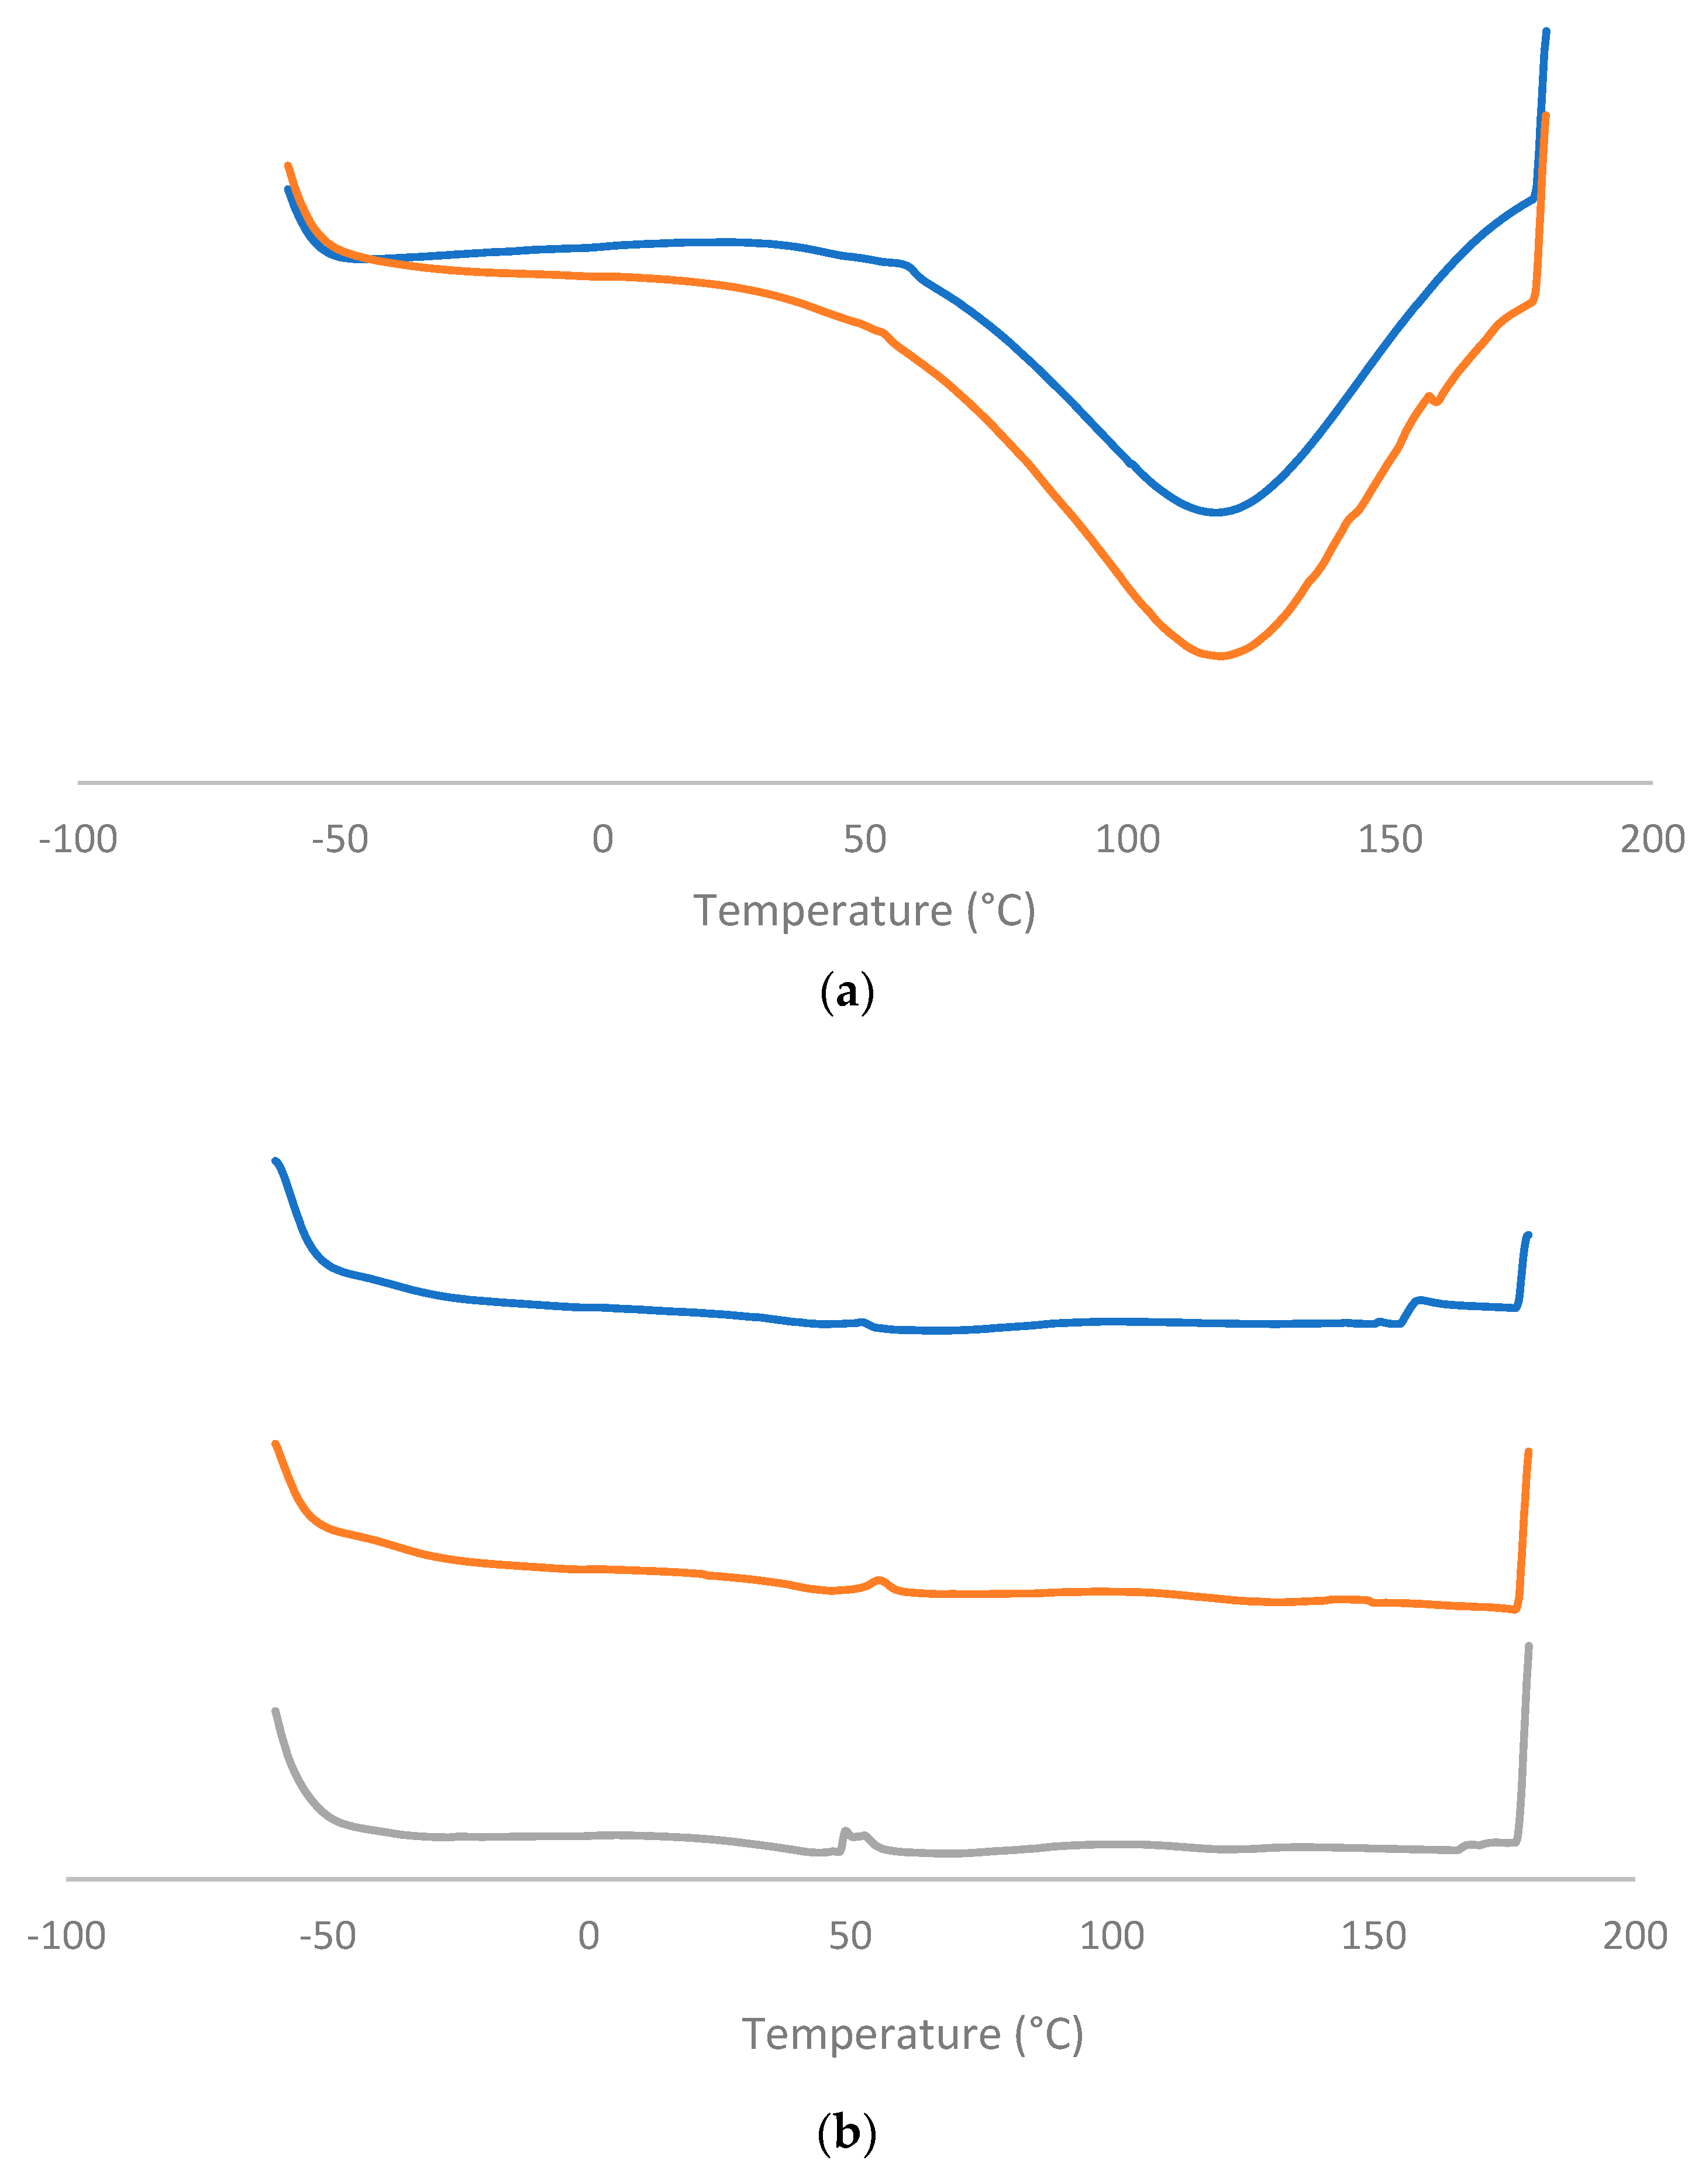
- Differential Scanning Calorimetry: DSC was done on 5mg of every sample, that were heated and cooled between − 60 and 180 °C for four times. The heating rate was of 20 °C/min in a suitable sample holder. The instrument was Mettler Toledo Polymer DSC. It allowed to know an exactly transition temperature.
- -
- Thermal Gravimetric Analysis-Thermal Mechanical Analysis: TGA-TMA samples were heated from 30-900°C, at heating rate of 10 °C/min. The instrument was PerkinElmer STA 6000. Two analyses were coupled and in the analysis was possible to see the weight decrease and the temperature paths.
3. Results and discussion
Cryogenic removal

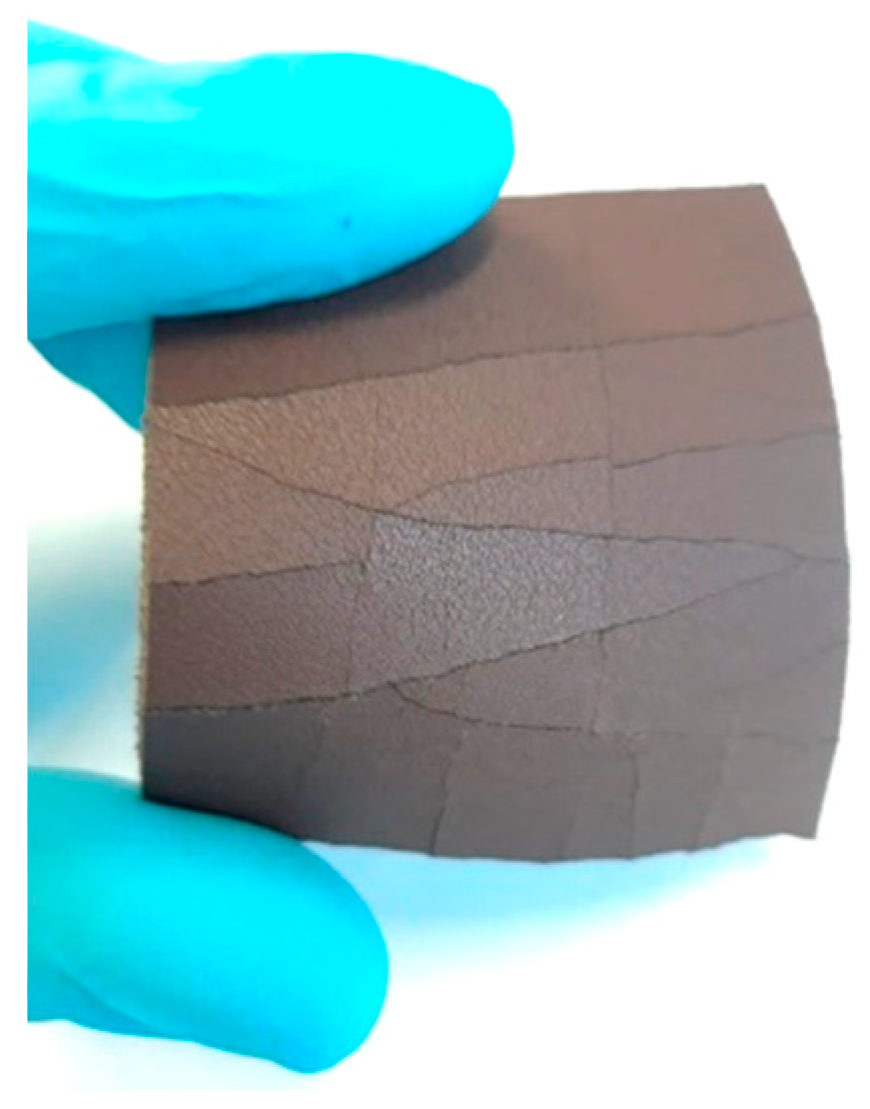
Dissolution
| Sample | Solvent | Dissolution activity |
|---|---|---|
| Sample 1 finished layer | Distilled water | Negative |
| DMSO | Partially | |
| THF | Negative | |
| Chloroform | Polymer separation | |
| Acetonitrile | Negative | |
| Ethanol | Negative | |
| n-hexane | Negative | |
| DCM | Negative | |
| Cyclohexanone | Polymer separation | |
| Acetone | Negative | |
| Methyl tert-butyl ether | Negative | |
| Toluene | Negative | |
| Butanone | Negative | |
| Methyl acetate | Negative | |
| Ethylene glycol | Negative | |
| DMS | Negative | |
| Dioxane | Negative | |
| DMF | Partially | |
| Sample 1 uncolored finished layer | THF | Negative |
| Acetone | Negative | |
| Acetonitrile | Negative | |
| Methanol | Negative | |
| Distiller water | Negative | |
| Toluene | Negative | |
| DCM | Negative | |
| DMF (100°C) | Negative | |
| Dioxane | Negative | |
| Sample 2 finished layer | DMSO | Partially |
| Sample 3 finished layer | DMSO | Negative |
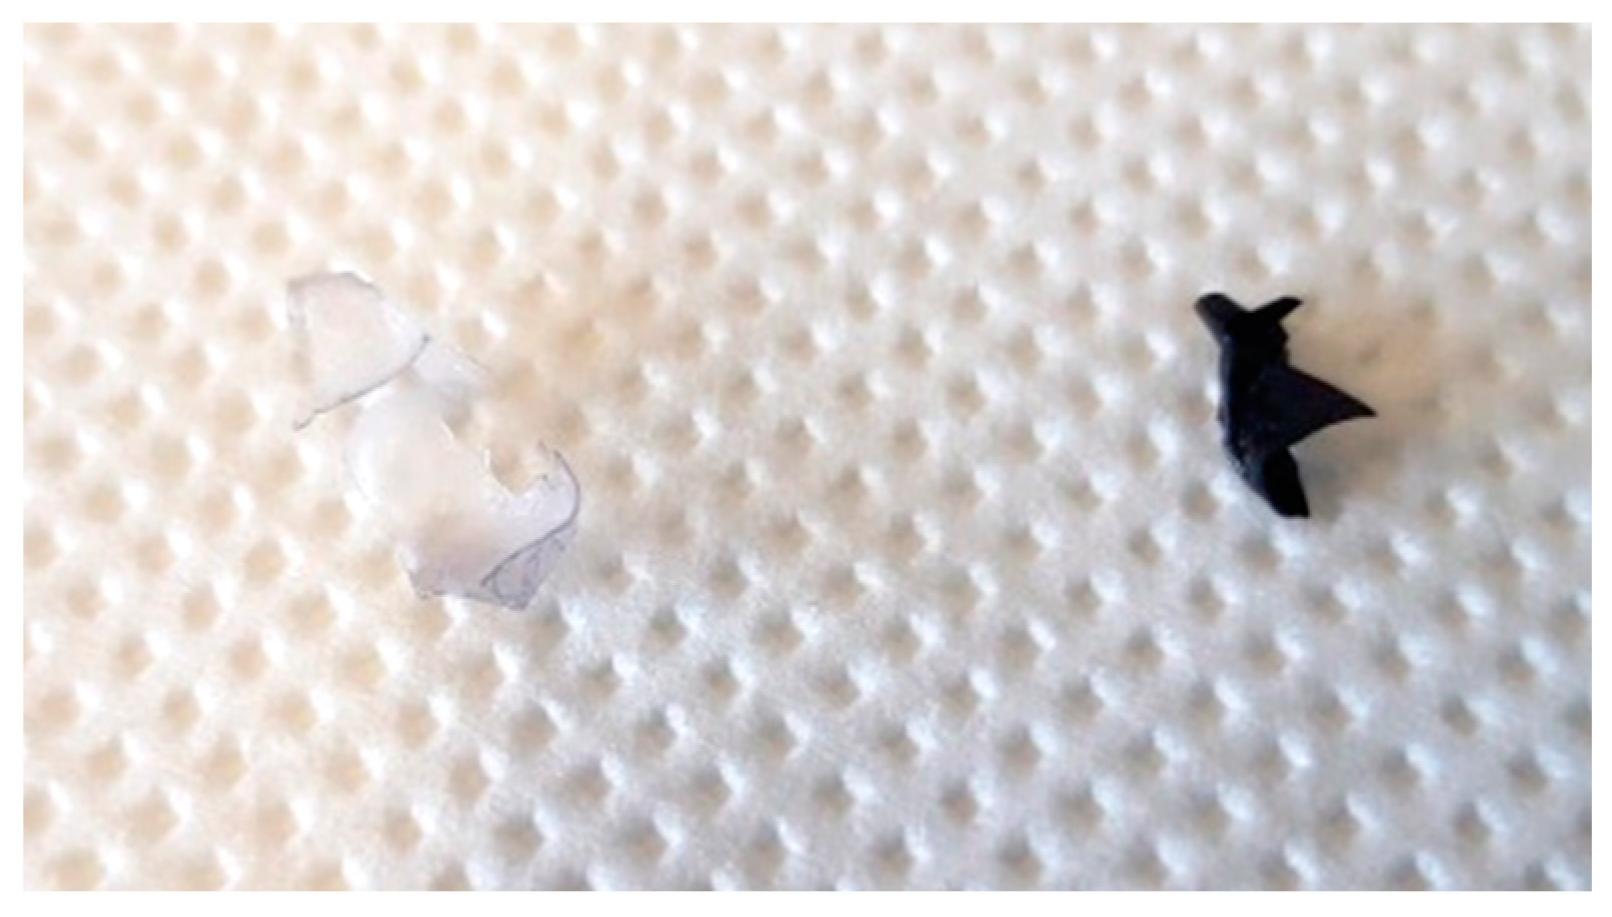
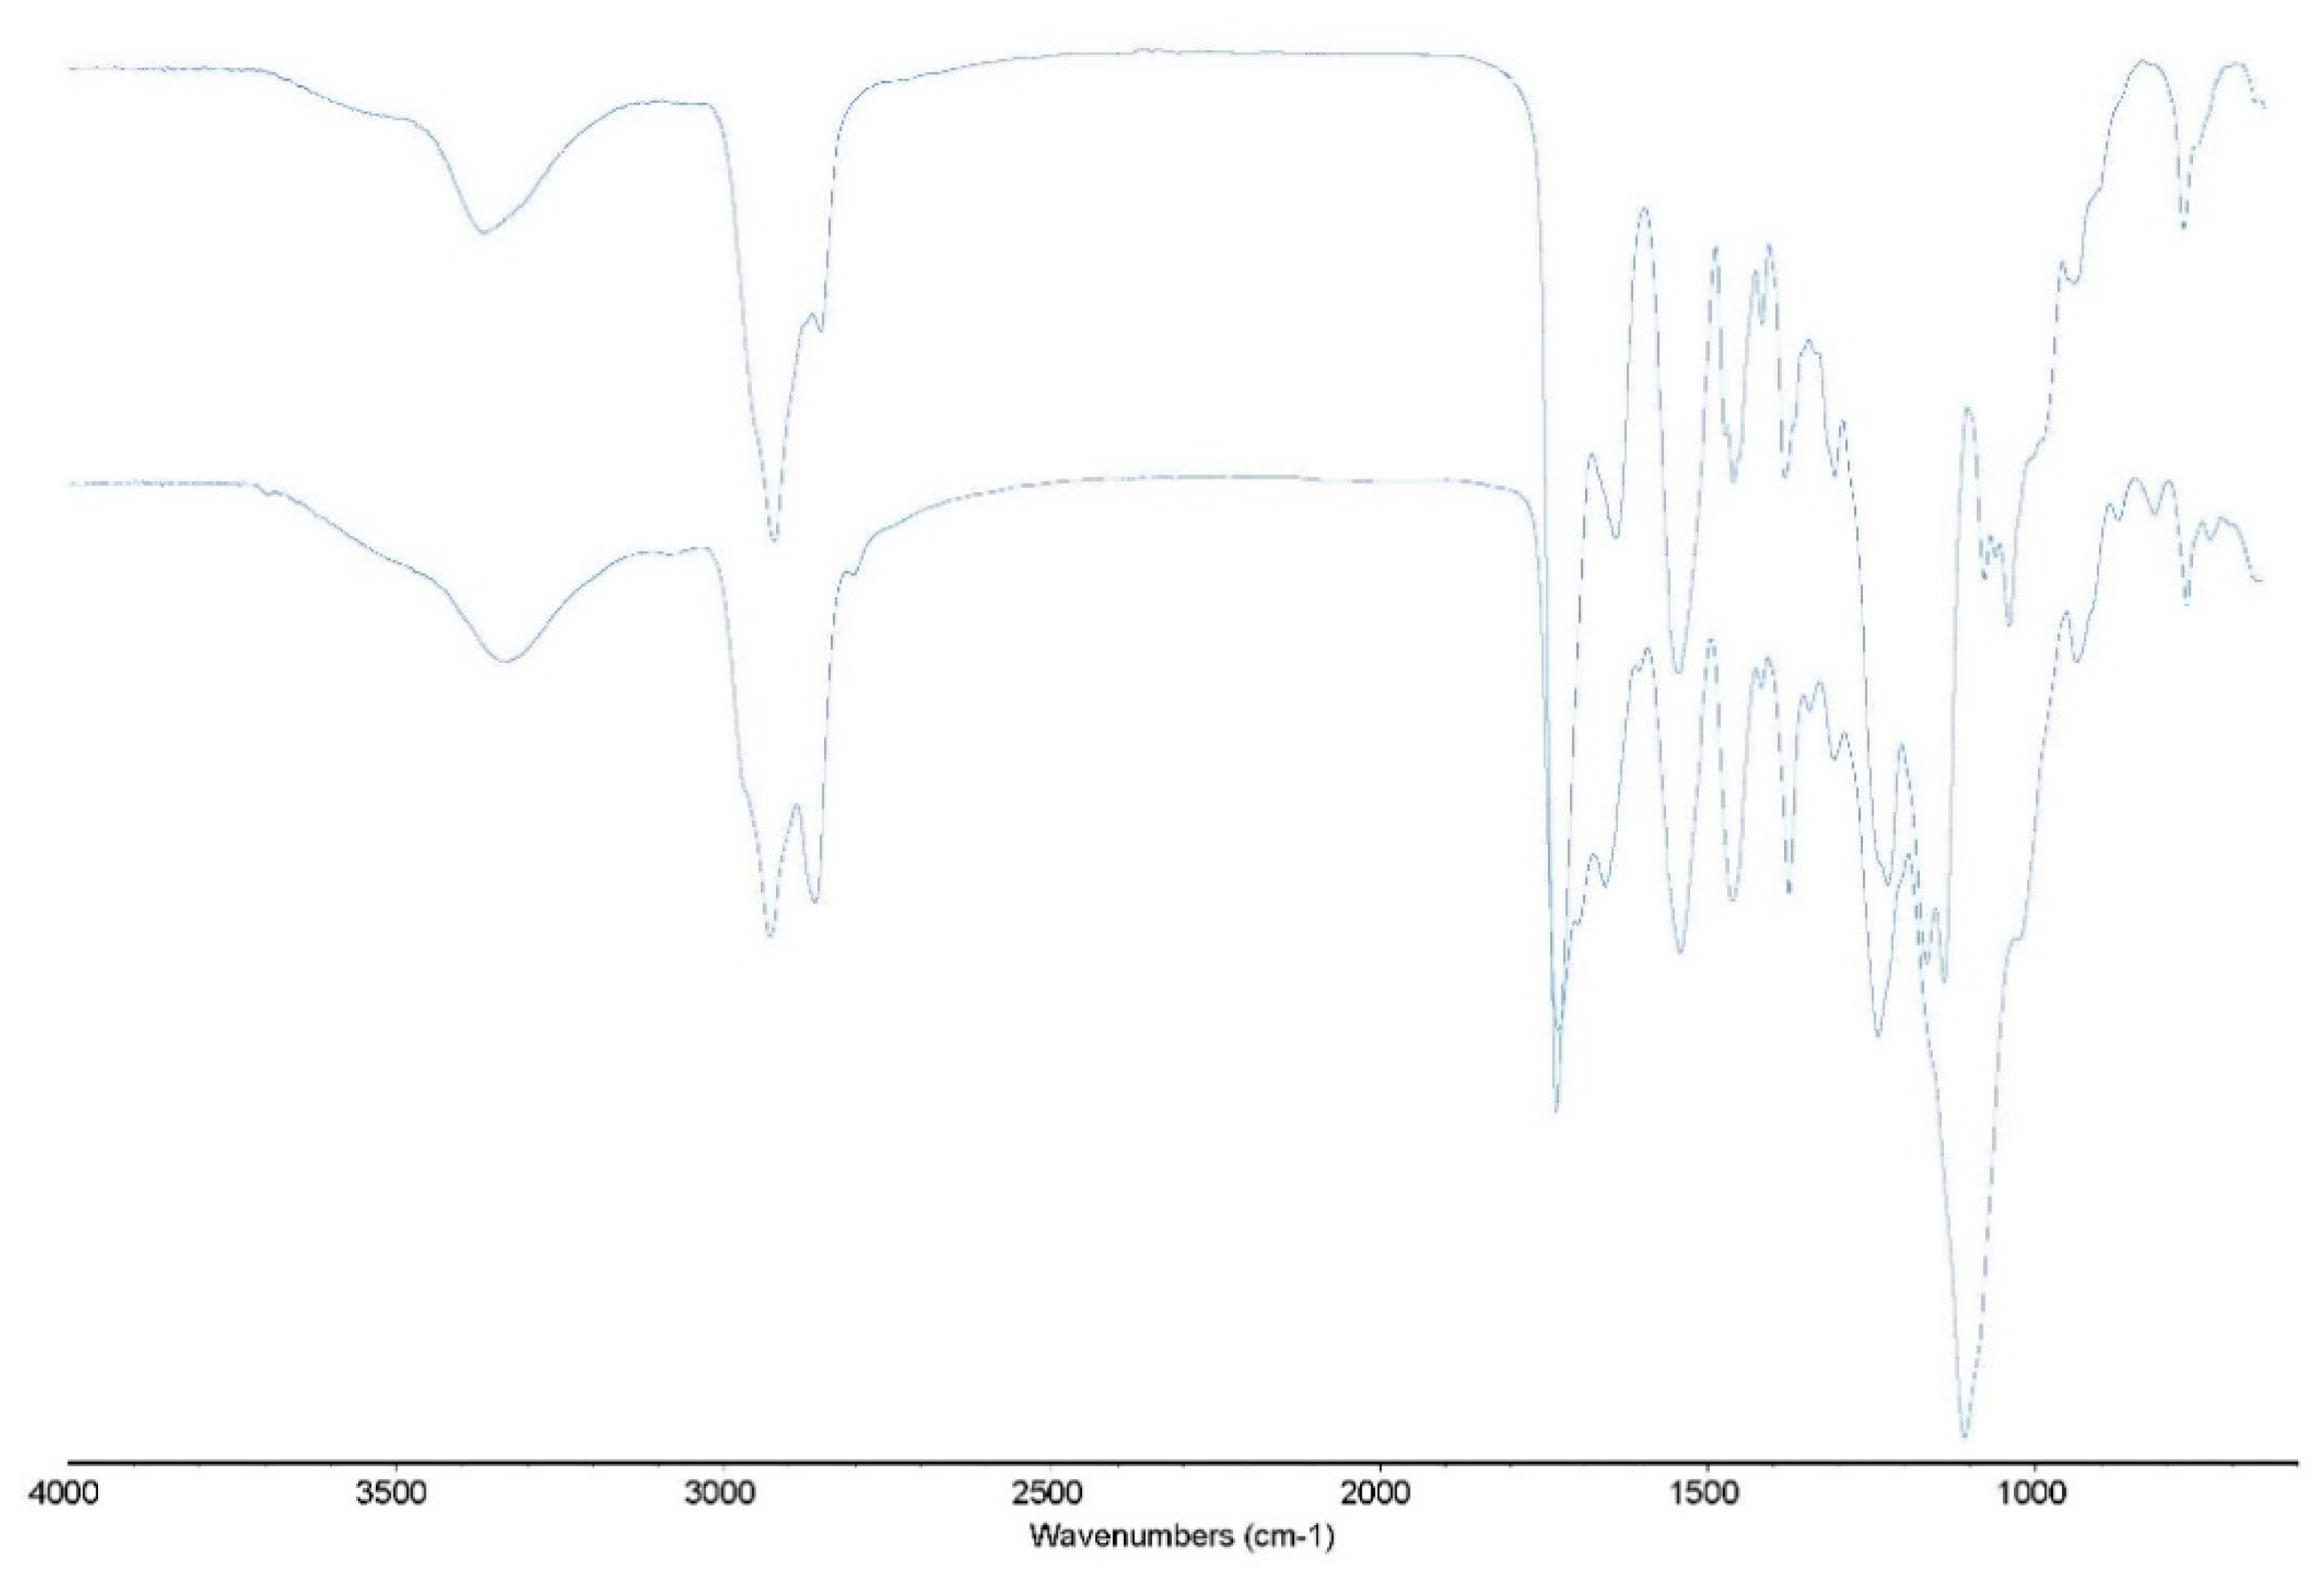
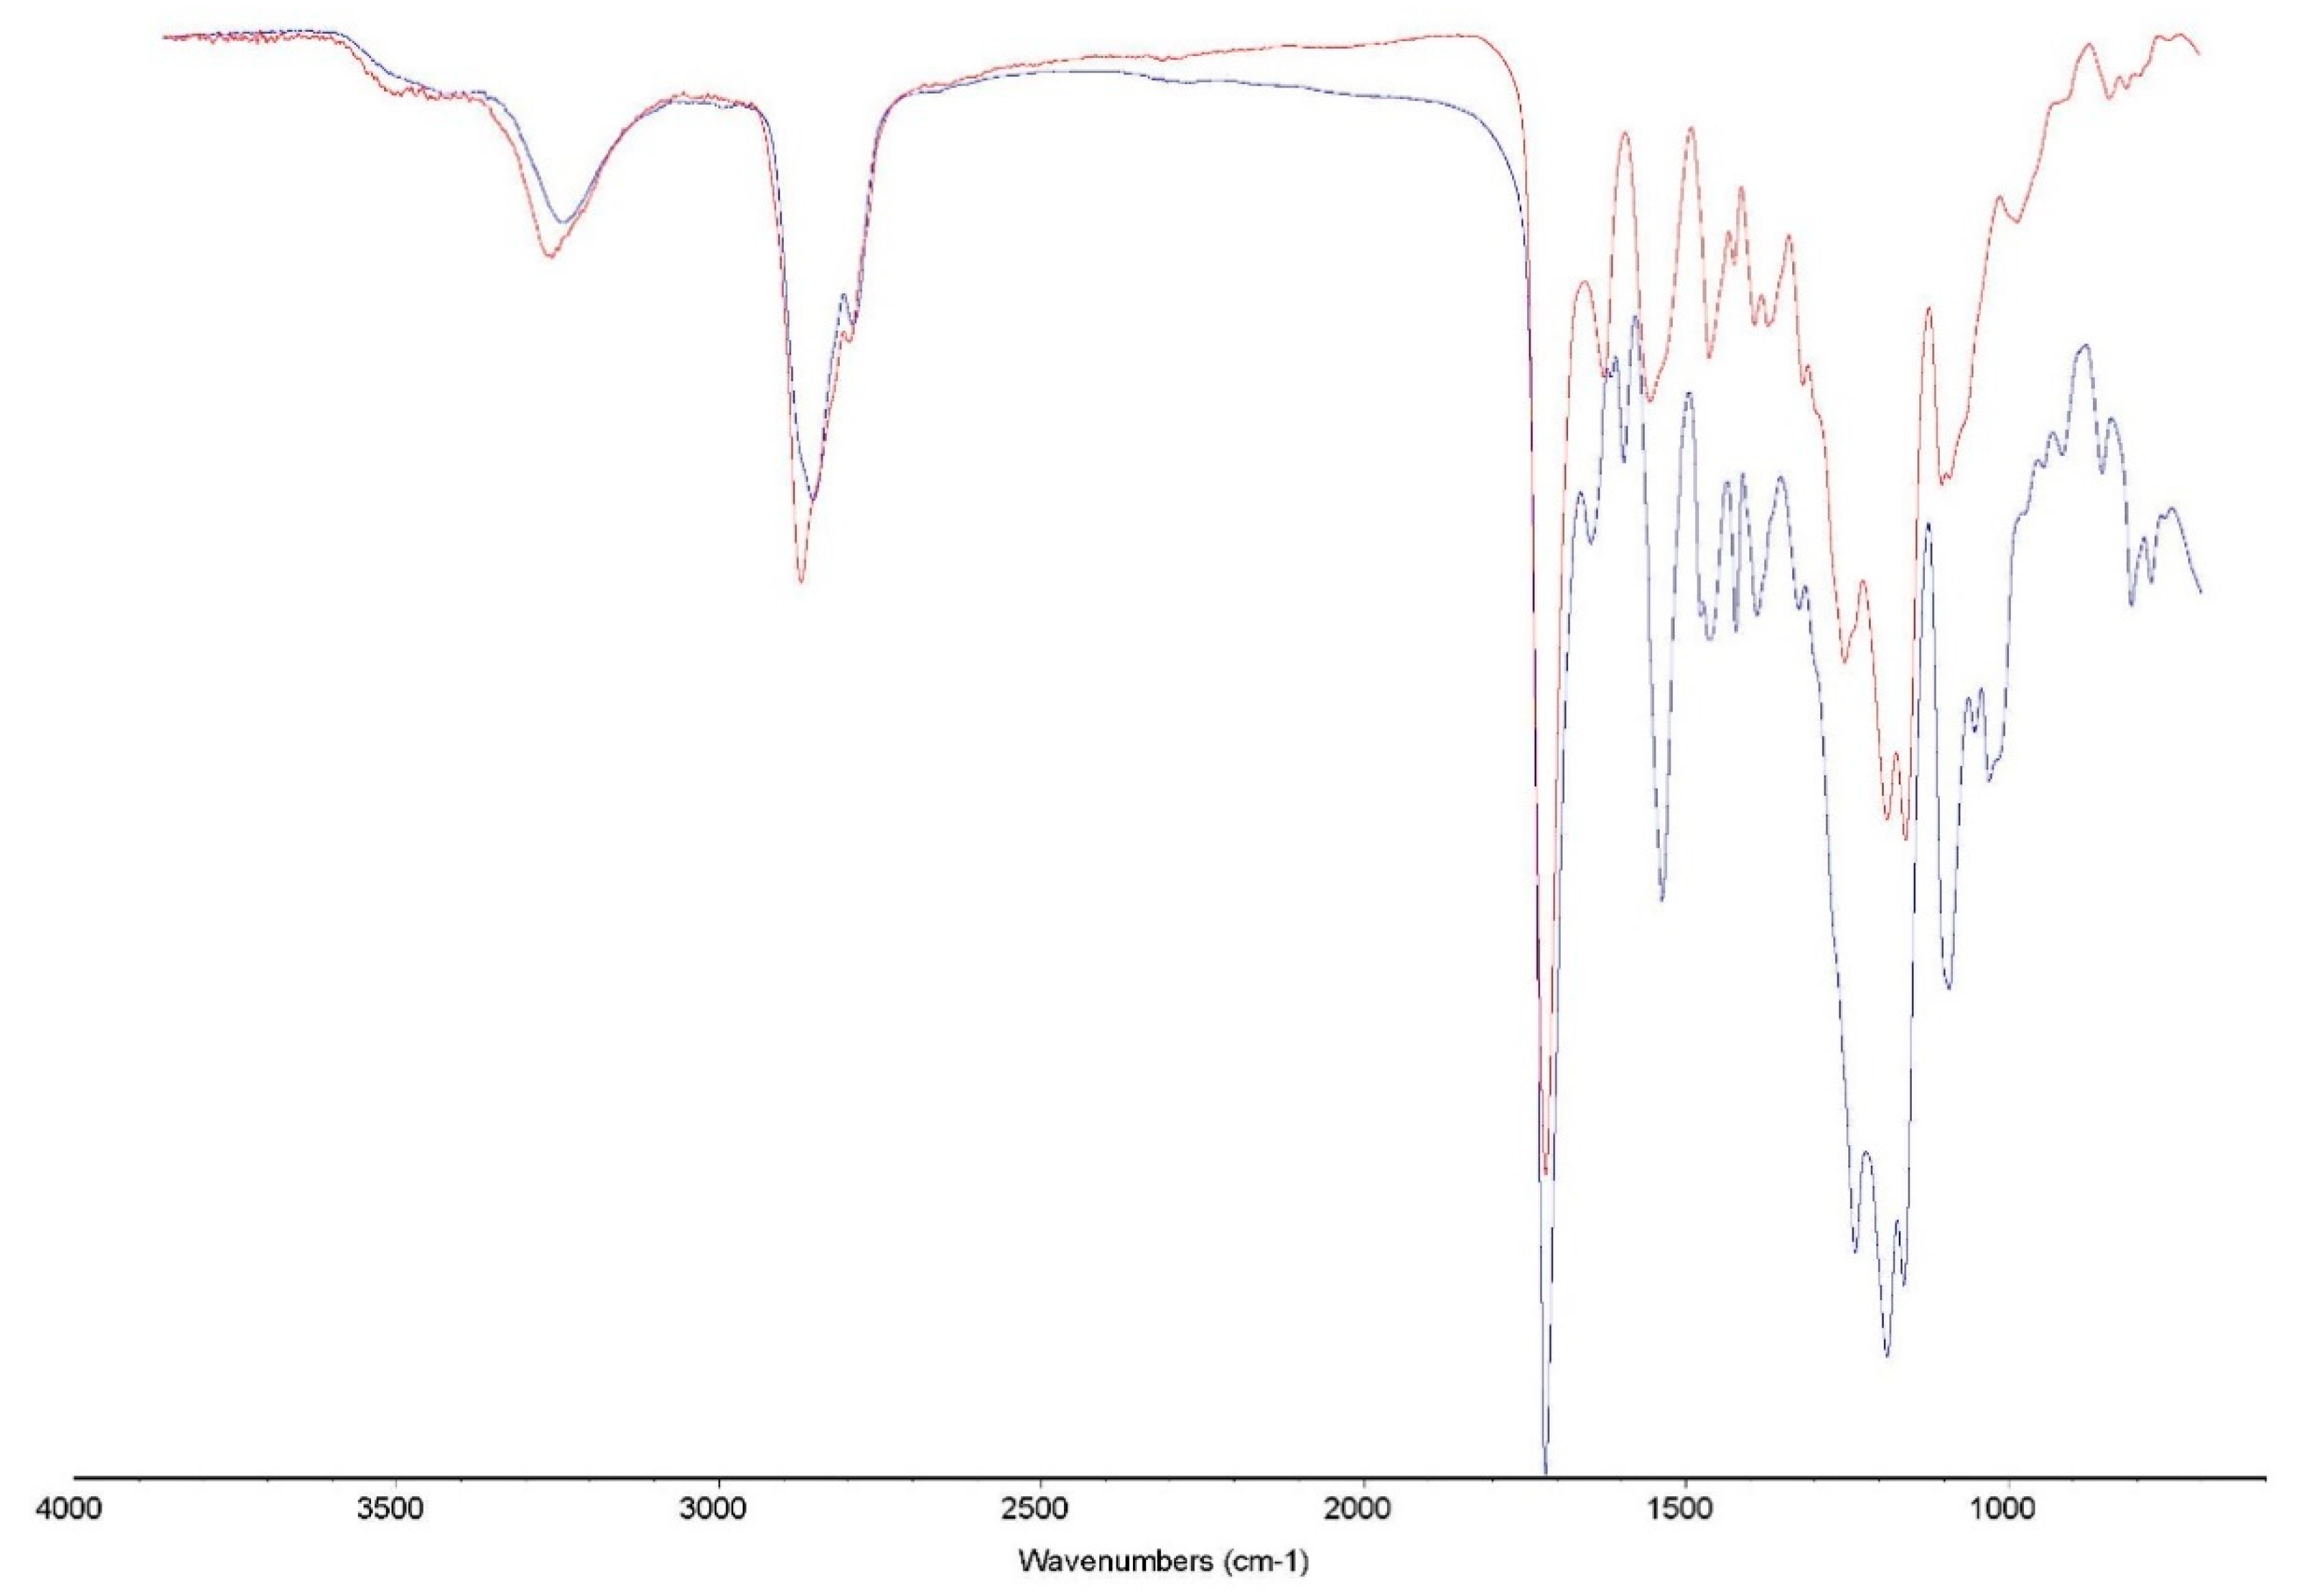
FTIR
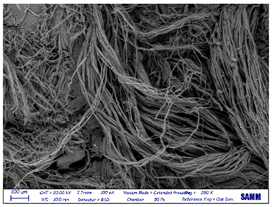
SEM
| Sample | Before | After |
|---|---|---|
| leather side |  |
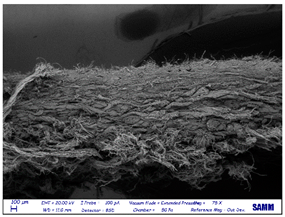 |
| leather top | 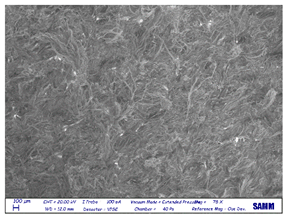 |
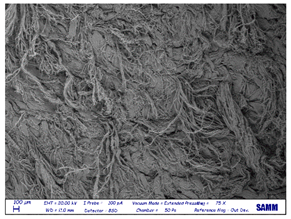 |
| leather down | 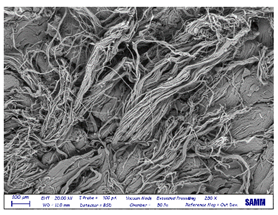 |
 |
Tensile strength according to UNI EN ISO 3376:2020
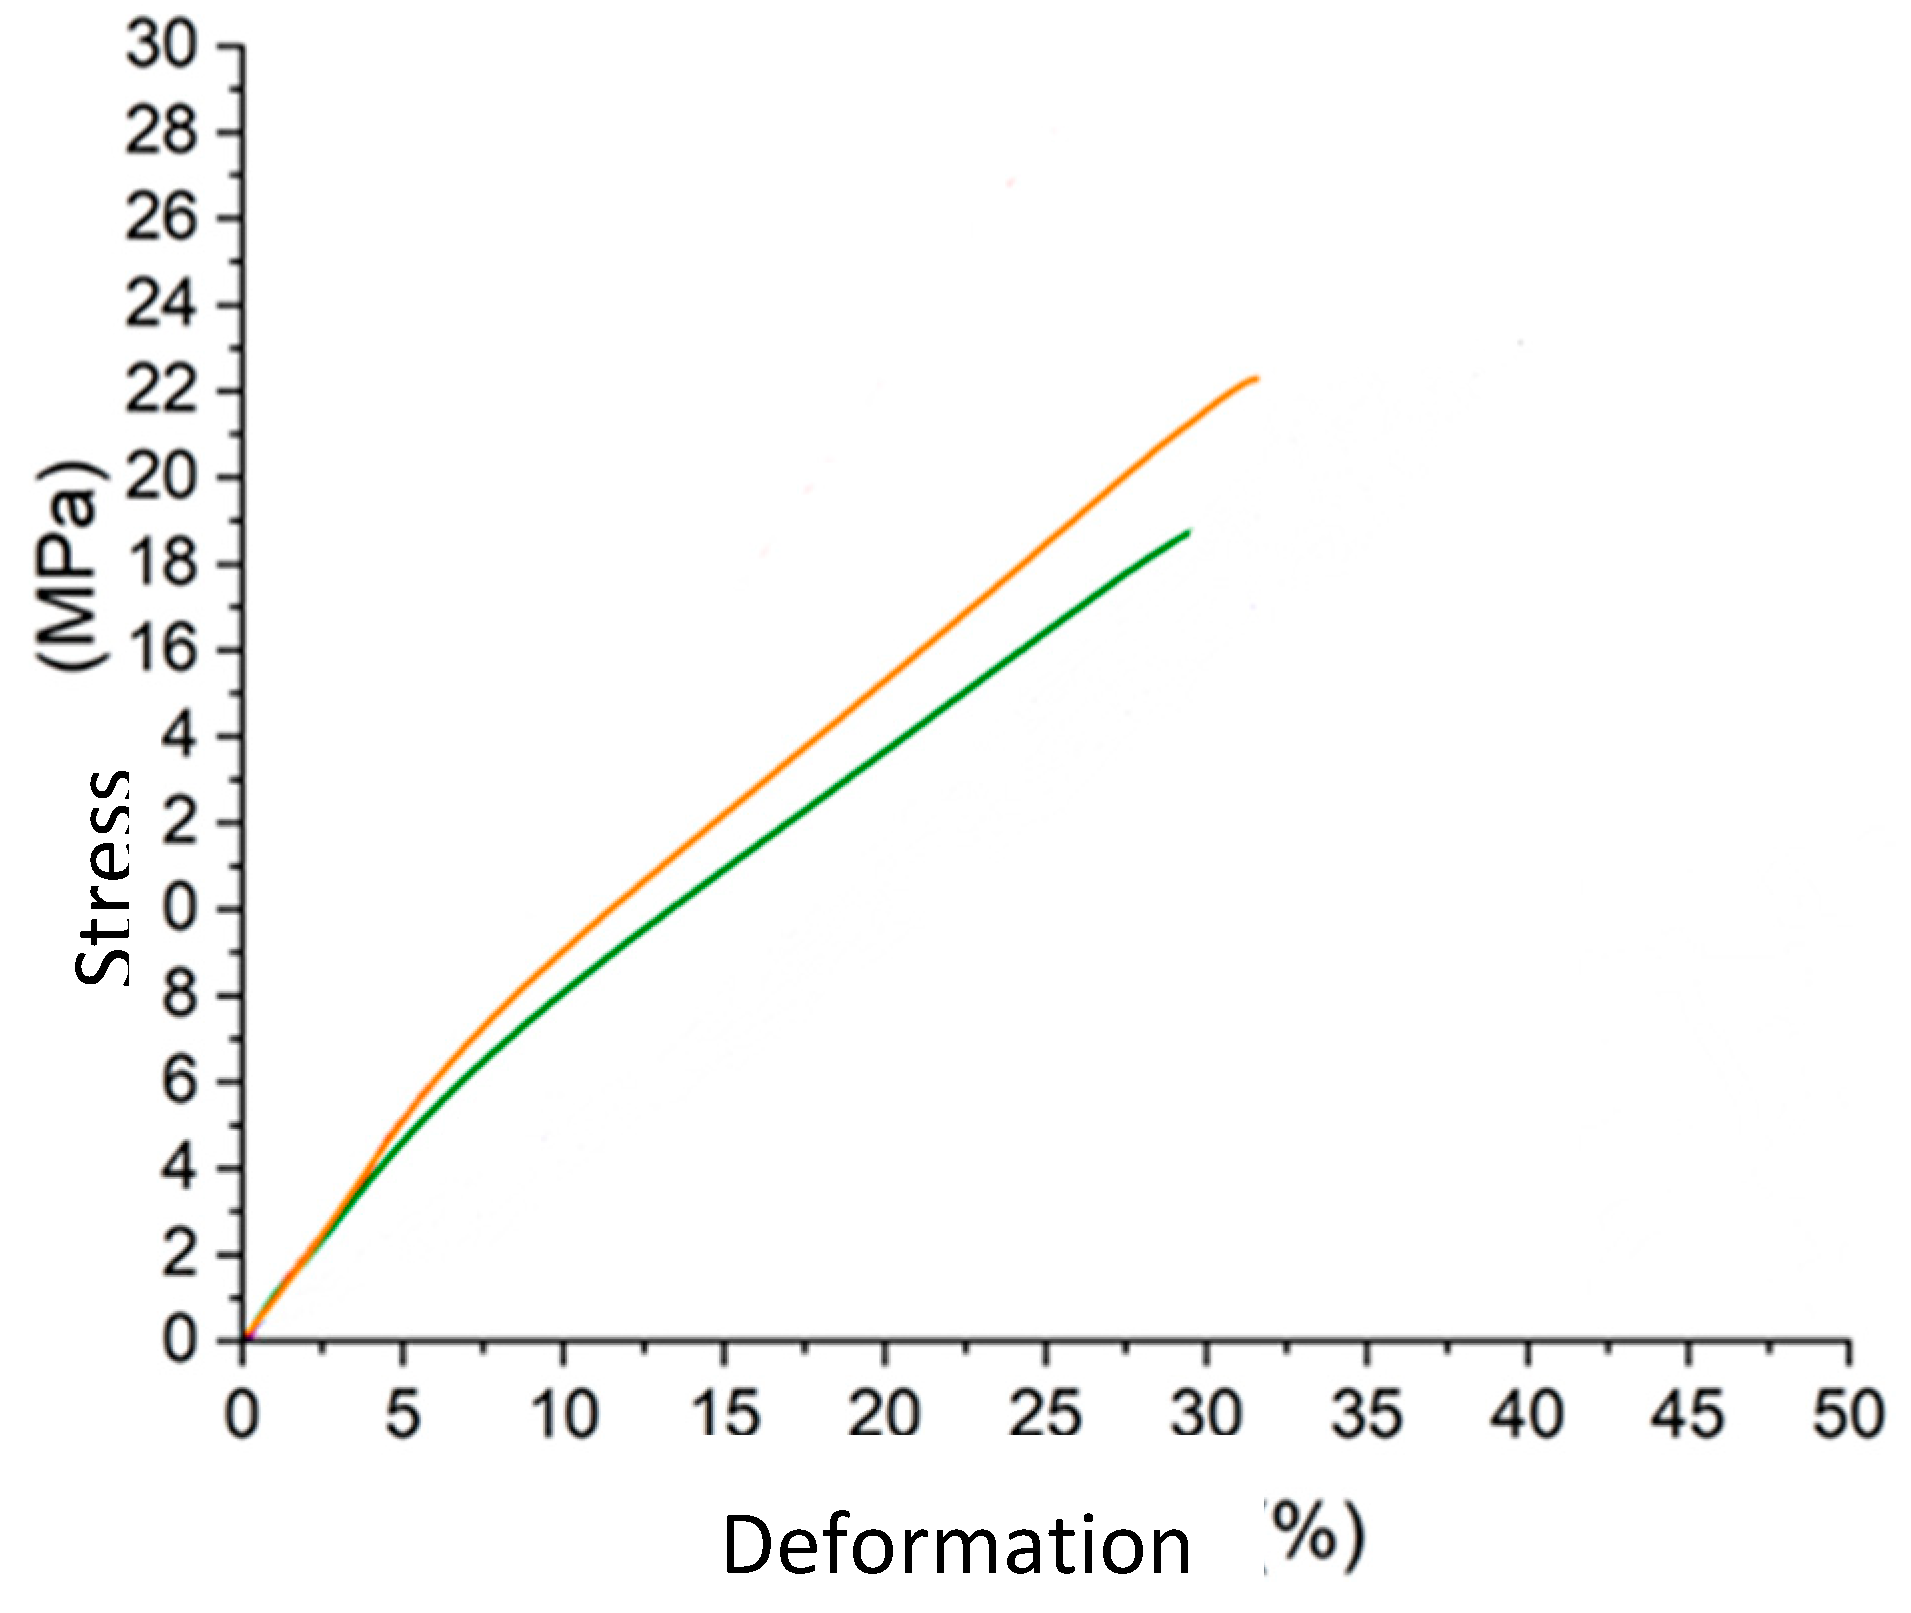
| Entry | Deformation at maximum stress (%) | Maximum stress (MPa) |
|---|---|---|
| 1 | 36.7 | 20.6 |
| 2 | 40.4 | 23.4 |
| 3 | 31.6 | 22.3 |
| 4 | 29.8 | 18.7 |
| 5 | 35.1 | 22.3 |
| 6 | 34.1 | 20.4 |
DSC
TGA-TMA

4. Conclusions
5. Patents
Author Contributions
Funding
Institutional Review Board Statement
Informed Consent Statement
Data Availability Statement
Acknowledgments
Conflicts of Interest
References
- Moktadir, A.; Dwivedi, A.; Rahman, A.; Jabbour, C.J.C.; Paul, S.K.; Sultana, R.; Madaan, J. An investigation of key performance indicators for operational excellence towards sustainability in the leather products industry. Bus. Strat. Environ. 2020, 29, 3331–3351. [Google Scholar] [CrossRef]
- Joseph, K.; Nithya, N. Material flows in the life cycle of leather. J. Clean. Prod. 2009, 17, 676–682. [Google Scholar] [CrossRef]
- Kráľ, I.; Schmėl, F.; Buljan, J. “The future for leather,” 2014.
- i Canals, L.M.; Domènèch, X.; Rieradevall, J.; Puig, R.; Fullana, P. Use of Life Cycle assessment in the procedure for the establishment of environmental criteria in the catalan ECO-label of leather. Int. J. Life Cycle Assess. 2002, 7, 39–46. [Google Scholar] [CrossRef]
- Omoloso, O.; Mortimer, K.; Wise, W.R.; Jraisat, L. Sustainability research in the leather industry: A critical review of progress and opportunities for future research. J. Clean. Prod. 2021, 285, 125441. [Google Scholar] [CrossRef]
- Exports of Leather and Leather Goods.” [Online]. Available online: http://man.ac.uk/04Y6Bo.
- S. Gounder Rajamani, “RECENT DEVELOPMENTS IN CLEANER PRODUCTION AND ENVIRONMENT PROTECTION IN WORLD LEATHER SECTOR.”.
- Moktadir, A.; Ahmadi, H.B.; Sultana, R.; Zohra, F.-T.; Liou, J.J.; Rezaei, J. Circular economy practices in the leather industry: A practical step towards sustainable development. J. Clean. Prod. 2020, 251, 119737. [Google Scholar] [CrossRef]
- Why Sustainability Is Now the Key Driver of Innovation”.
- Rigueto, C.V.T.; Rosseto, M.; Krein, D.D.C.; Ostwald, B.E.P.; Massuda, L.A.; Zanella, B.B.; Dettmer, A. Alternative uses for tannery wastes: a review of environmental, sustainability, and science. J. Leather Sci. Eng. 2020, 2, 21. [Google Scholar] [CrossRef]
- Marconi, M.; Barbanera, M.; Calabrò, G.; Baffo, I. Reuse of leather scraps for insulation panels: Technical and environmental feasibility evaluation. Procedia CIRP 2020, 90, 55–60. [Google Scholar] [CrossRef]
- Barbanera, M.; Belloni, E.; Buratti, C.; Calabrò, G.; Marconi, M.; Merli, F.; Armentano, I. Recycled leather cutting waste-based boards: thermal, acoustic, hygrothermal and ignitability properties. J. Mater. Cycles Waste Manag. 2020, 22, 1339–1351. [Google Scholar] [CrossRef]
- O. Olaitan and E. Alfnes, “Optimizing Leather Cutting Process To Reduce Waste,” 2017. [Online]. Available online: https://www.researchgate.net/publication/322977368.
- Brun, A.; Ciccullo, F. Factors affecting sustainability-oriented innovation in the leather supply chain. Strat. Chang. 2022, 31, 305–321. [Google Scholar] [CrossRef]
- Hu, J.; Xiao, Z.; Zhou, R.; Deng, W.; Wang, M.; Ma, S. Ecological utilization of leather tannery waste with circular economy model. J. Clean. Prod. 2011, 19, 221–228. [Google Scholar] [CrossRef]
- A. Candas, A. Zengin, and B. O. Bitlisli, “THE EFFECTS OF LEATHER FINISHING TYPES ON FOOT WEAR COMFORT PROPERTIES Investigation of the Effects of Different Retanning Agents on the Aging Properties of Chromed Leather View project Production of Environmentally Friendly Keratin Hydrolysate from Wool Wastes Generated in Double-Face Factories, Development of Keratin Based Dye-Stuff Auxiliary and Surface Coating Products View project,” 2018. [Online]. Available online: https://www.researchgate.net/publication/323144238.
- Kiliç, T.I.; Zengi̇n, G. Effect of Viscosity on the Characteristic Properties of Solvent Free Patent Finished Leathers. Tekst- VE KONFEKSİYON 2021, 31, 137–145. [Google Scholar] [CrossRef]
- Li, Y.; Guo, R.; Lu, W.; Zhu, D. Research progress on resource utilization of leather solid waste. J. Leather Sci. Eng. 2019, 1, 6. [Google Scholar] [CrossRef]
- Cimatti, B.; Campana, G.; Carluccio, L. Eco Design and Sustainable Manufacturing in Fashion: A Case Study in the Luxury Personal Accessories Industry. Procedia Manuf. 2017, 8, 393–400. [Google Scholar] [CrossRef]
- Fakhfakh, R.; Mihoubi, D.; Kechaou, N. Moisture sorption isotherms and thermodynamic properties of bovine leather. Heat Mass Transf. 2050, 54, 1163–1176. [Google Scholar] [CrossRef]
- S. Jeyapalina Bsc, “STUDIES ON THE HYDRO-THERMAL AND VISCOELASTIC PROPERTIES OF LEATHER,” 2004.
- M. Masi, F. Rossi, and O. Salmi, “metodo di rimozione di strati di rifinitura da pelli conciate e finite,” P07501, 2023.
- Máša, V.; Horňák, D.; Petrilák, D. Industrial use of dry ice blasting in surface cleaning. J. Clean. Prod. 2021, 329. [Google Scholar] [CrossRef]
- Darrie, G. Commercial Extraction Technology and Process Waste Disposal in the Manufacture of Chromium chemicals From Ore. Environ. Geochem. Heal. 2001, 23, 187–193. [Google Scholar] [CrossRef]
- Osin, Y.; Makhotkina, L.; Abutalipova, L.; Abdullin, I. SEM and X-ray analysis of surface microstructure of a natural leather processed in a low temperature plasma. Vacuum 1998, 51, 221–225. [Google Scholar] [CrossRef]
- UNI1608206_EIT (2)”.
- Chahine, C. Changes in hydrothermal stability of leather and parchment with deterioration: a DSC study. Thermochim. Acta 2000, 365, 101–110. [Google Scholar] [CrossRef]
- Creemers, E.; Nijs, M.; Vanheusden, E.; Ombelet, W. Cryopreservation of human sperm: efficacy and use of a new nitrogen-free controlled rate freezer versus liquid nitrogen vapour freezing. Andrologia 2011, 43, 392–397. [Google Scholar] [CrossRef]
- Williams, S.L.; Beyer, S.R.; Khan, S. Effect Of “Freezing” Treatments on the Hydrothermal Stability of Collagen. J. Am. Inst. Conserv. 1995, 34, 107–112. [Google Scholar] [CrossRef]
- Pena, A.C.; Agustini, C.B.; Trierweiler, L.F.; Gutterres, M. Influence of period light on cultivation of microalgae consortium for the treatment of tannery wastewaters from leather finishing stage. J. Clean. Prod. 2020, 263, 121618. [Google Scholar] [CrossRef]
- Zinck, P.; Terrier, M.; Mortreux, A.; Visseaux, M. On the number-average molecular weight of poly(1,4-trans isoprene) determined by conventional GPC. Polym. Test. 2009, 28, 106–108. [Google Scholar] [CrossRef]
- Sur, S.-H.; Choi, P.-J.; Ko, J.-W.; Lee, J.-Y.; Lee, Y.-H.; Kim, H.-D. Preparation and Properties of DMF-Based Polyurethanes for Wet-Type Polyurethane Artificial Leather. Int. J. Polym. Sci. 2018, 2018, 1–9. [Google Scholar] [CrossRef]
- Maiti, P.; Radhakrishnan, G.; Aruna, P.; Ghosh, G. Novel Polyurethane Gels: The Effect of Structure on Gelation. Macromol. Symp. 2006, 241, 51–59. [Google Scholar] [CrossRef]
- Žagar, E.; Žigon, M. Solution properties of carboxylated polyurethanes and related ionomers in polar solvents (DMF and LiBr/DMF). Polymer 2000, 41, 3513–3521. [Google Scholar] [CrossRef]
- Covington, A.D.; Wise, W.R. Current trends in leather science. J. Leather Sci. Eng. 2020, 2, 28. [Google Scholar] [CrossRef]
- Tian, S. Recent Advances in Functional Polyurethane and Its Application in Leather Manufacture: A Review. Polymers 2020, 12, 1996. [Google Scholar] [CrossRef]
- Belbachir, K.; Noreen, R.; Gouspillou, G.; Petibois, C. Collagen types analysis and differentiation by FTIR spectroscopy. Anal. Bioanal. Chem. 2009, 395, 829–837. [Google Scholar] [CrossRef]
- Liu, M.; Ma, J.; Lyu, B.; Gao, D.; Zhang, J. Enhancement of chromium uptake in tanning process of goat garment leather using nanocomposite. J. Clean. Prod. 2016, 133, 487–494. [Google Scholar] [CrossRef]
- Sizeland, K.H.; Edmonds, R.L.; Basil-Jones, M.M.; Kirby, N.; Hawley, A.; Mudie, S.; Haverkamp, R.G. Changes to Collagen Structure during Leather Processing. J. Agric. Food Chem. 2015, 63, 2499–2505. [Google Scholar] [CrossRef]
- Pringle, T.; Barwood, M.; Rahimifard, S. The Challenges in Achieving a Circular Economy within Leather Recycling. Procedia CIRP 2016, 48, 544–549. [Google Scholar] [CrossRef]
- Nahar, S.; Khan, R.A.; Abdullah, E.C.B.; Khan, M.J.H.; Islam, R.; Karim, F.; Rahman, M.; Rahman, A.; Mahmood, A.A.; Deb, A.K.; et al. An Approach to Utilize Crust Leather Scrapes, Dumped into the Land, for the Production of Environmental Friendly Leather Composite. Eng. J. 2013, 17, 17–24. [Google Scholar] [CrossRef]
- Thanikaivelan, P.; Rao, J.R.; Nair, B.U.; Ramasami, T. Recent Trends in Leather Making: Processes, Problems, and Pathways. Crit. Rev. Environ. Sci. Technol. 2005, 35, 37–79. [Google Scholar] [CrossRef]
- Zhang, Y.; Chen, Z.; Liu, X.; Shi, J.; Chen, H.; Gong, Y. SEM, FTIR and DSC Investigation of Collagen Hydrolysate Treated Degraded Leather. J. Cult. Heritage 2021, 48, 205–210. [Google Scholar] [CrossRef]
- S. Jeyapalina, G. E. Attenburrow, and A. D. Covington, “Dynamic Mechanical Thermal Analysis (DMTA) of leather-Part 1: Effect of tanning agent on the glass transition temperature of collagen Bacterial growth in tannery effluent View project Microbiome-Percutaneous devices View project,” 2007. [Online]. https://www.researchgate.net/publication/31870705.
- Shi, H.; Chen, Y.; Fan, H.; Xiang, J.; Shi, B. Thermosensitive polyurethane film and finished leather with controllable water vapor permeability. J. Appl. Polym. Sci. 2010, 117, 1820–1827. [Google Scholar] [CrossRef]
- Elsayed, H.; Attia, R.; Mohamed, O.; Haroun, A.; El-Sayed, N. Preparation of Polyurethane Silicon Oxide Nanomaterials as a Binder in Leather Finishing. Fibers Polym. 2018, 19, 832–842. [Google Scholar] [CrossRef]
- Saikia, P.; Goswami, T.; Dutta, D.; Dutta, N.K.; Sengupta, P.; Neog, D. Development of a flexible composite from leather industry waste and evaluation of their physico-chemical properties. Clean Technol. Environ. Policy 2017, 19, 2171–2178. [Google Scholar] [CrossRef]
- Mohamed, O.A.; Moustafa, A.B.; Mehawed, M.A.; El-Sayed, N.H. Styrene and butyl methacrylate copolymers and their application in leather finishing. J. Appl. Polym. Sci. 2009, 111, 1488–1495. [Google Scholar] [CrossRef]
Disclaimer/Publisher’s Note: The statements, opinions and data contained in all publications are solely those of the individual author(s) and contributor(s) and not of MDPI and/or the editor(s). MDPI and/or the editor(s) disclaim responsibility for any injury to people or property resulting from any ideas, methods, instructions or products referred to in the content. |
© 2023 by the authors. Licensee MDPI, Basel, Switzerland. This article is an open access article distributed under the terms and conditions of the Creative Commons Attribution (CC BY) license (http://creativecommons.org/licenses/by/4.0/).


