1. Introduction
In recent years, the pursuit of sustainable and reliable power sources for remote sites has gained significant attention. These sites, often located in areas without access to the traditional electricity grid, require innovative solutions to meet their energy needs [
1,
2]. The utilization of renewable energy technologies, such as photovoltaics (PV) and small wind turbines, coupled with energy storage systems, has emerged as a promising approach to provide power to these remote locations.
The key challenge in remote power supply lies in efficiently capturing and storing the intermittent energy generated by renewable sources [
3]. To address this challenge, two primary storage options have been explored: battery banks and hydrogen storage fuel cell systems. Battery banks have been widely utilized for their ability to store and release electricity as needed [
4]. On the other hand, hydrogen storage systems offer an alternative approach by converting surplus renewable power into hydrogen, which can be stored and subsequently used by fuel cells to generate electricity [
5,
6]
The objective of this paper is to conduct a comprehensive analysis comparing the performance and cost-effectiveness of PV and small wind turbines in combination with battery banks and hydrogen storage systems for remote power supply. This analysis considers various factors, including system efficiency, reliability, economic feasibility, and environmental impact [
7].
To evaluate the performance of the hydrogen storage system, a sensitivity analysis was conducted, focusing on variables such as wind speed and the cost of the hydrogen subsystem. By linking the capital and replacement costs of the electrolyzer and hydrogen storage tank to the fuel cell capital cost, the study assessed the impact of changes in fuel cell pricing on the overall system economics[
8].
The results of the analysis revealed several important findings [
9]. The optimal system type graph indicated that for the hydrogen storage system to become competitive with the battery bank, a substantial decrease in the cost of the hydrogen subsystem is required. Furthermore, in most cases where the hydrogen system was recommended, it was suggested in conjunction with a battery bank, indicating the complementary nature of the two-storage media in providing reliable and efficient power supply to remote sites [
10,
11]
However, there was one exceptional scenario identified by the analysis, where the HOMER software recommended the hydrogen storage system without the battery bank. This scenario occurred when the wind speed was low, and the cost of the hydrogen system was nearly negligible.
Based on the findings, the battery bank currently stands out as the more viable option for remote power supply due to its cost-effectiveness and proven performance [
12]. Nonetheless, it is crucial to recognize the dynamic nature of technology and cost trends, requiring continuous monitoring and evaluation of both systems to identify emerging opportunities for improvements in efficiency and cost reduction [
13].
The findings provide valuable insights into the most efficient and cost-effective approach to address the energy needs of remote sites. By considering factors such as system performance, economics, and environmental impact, decision-makers can make informed choices when selecting the most suitable power supply solution for remote locations [
14].
3. Challenges of power in Remote Areas
This Power in remote areas faces several challenges, which can hinder the provision of reliable and sustainable energy solutions. Some common challenges include:
(1) Lack of Grid Infrastructure: Remote areas often lack access to existing power grids, making it difficult to connect to centralized electricity networks. Building extensive transmission and distribution infrastructure to reach these areas can be costly and time-consuming [
16].
(2) Geographical Constraints: Remote areas are often characterized by rugged terrains, mountains, or isolated islands, which pose challenges for deploying conventional power infrastructure. These geographical constraints make it challenging to transport equipment, construct power plants, and lay transmission lines.
(3) Limited Resources: Remote areas may have limited access to conventional energy resources such as coal, oil, or natural gas. This can lead to higher energy costs due to the need to import fuel sources or rely on alternative energy options.
(4) Fluctuating Energy Demand: In some remote areas, energy demand can vary significantly depending on the season or specific activities. For example, tourist destinations may experience high energy demand during peak tourist seasons. Meeting these fluctuating energy demands can be challenging without proper planning and energy storage systems.
(5) Environmental Considerations: Remote areas often have unique and fragile ecosystems that need to be protected. Traditional power generation sources, such as fossil fuel-based power plants, can have adverse environmental impacts, including air and water pollution. Finding sustainable and environmentally friendly energy solutions is crucial in such areas.
(6) Economic Viability: The limited population and dispersed settlements in remote areas can make it economically challenging to justify large-scale power projects. Low electricity demand and high upfront costs may make it difficult to attract private investment or secure financing for energy infrastructure development.
(7) Maintenance and Technical Support: Remote areas may lack the necessary skilled workforce, technical expertise, and infrastructure for maintaining and troubleshooting power systems. The remoteness of these areas can lead to delays in addressing technical issues and conducting regular maintenance, affecting the reliability of power supply[
17].
Addressing these challenges requires innovative approaches, such as deploying decentralized renewable energy systems, utilizing microgrids, implementing energy storage technologies, and leveraging advancements in smart grid technologies. It is essential to consider the specific geographical, social, and economic conditions of each remote area to develop tailored and sustainable energy solutions [
18].
5. System Design and results
Sustainable energy solutions for remote areas often involve a combination of renewable energy sources, energy storage systems, and backup power options. In this case, the system consists of a small wind turbine, PV panels, diesel batteries, a hydrogen tank, an electrolyzer, and a DC load[
28].
The small wind turbine harnesses the power of wind to generate electricity. It is designed to capture the energy from the wind and convert it into usable electrical energy [
29]. This is particularly beneficial in remote areas where there may be consistent wind patterns [
30].
PV panels, also known as solar panels, utilize the sun’s energy to produce electricity. These panels contain photovoltaic cells that convert sunlight into direct current (DC) electricity. By installing PV panels in remote areas with ample sunlight, a reliable and renewable energy source can be established [
31].
To ensure continuous power supply even during periods of low wind or sunlight, energy storage systems are crucial. The diesel batteries serve as a backup power option and can be utilized when the renewable energy sources are not generating enough electricity. These batteries store excess energy produced by the wind turbine and PV panels for later use [
32].
In addition to diesel batteries, the system incorporates a hydrogen tank and an electrolyzer. During periods of excess renewable energy generation, such as when the wind is strong or the sun is shining brightly, the surplus electricity is used to power the electrolyzer. The electrolyzer splits water into hydrogen and oxygen through a process called electrolysis. The hydrogen gas is then stored in the tank for later use [
33]. The stored hydrogen can be utilized in a fuel cell system when there is a high energy demand or when renewable energy sources are not readily available. The fuel cell converts the stored hydrogen back into electricity, providing a reliable and clean energy source for the DC load [
34].
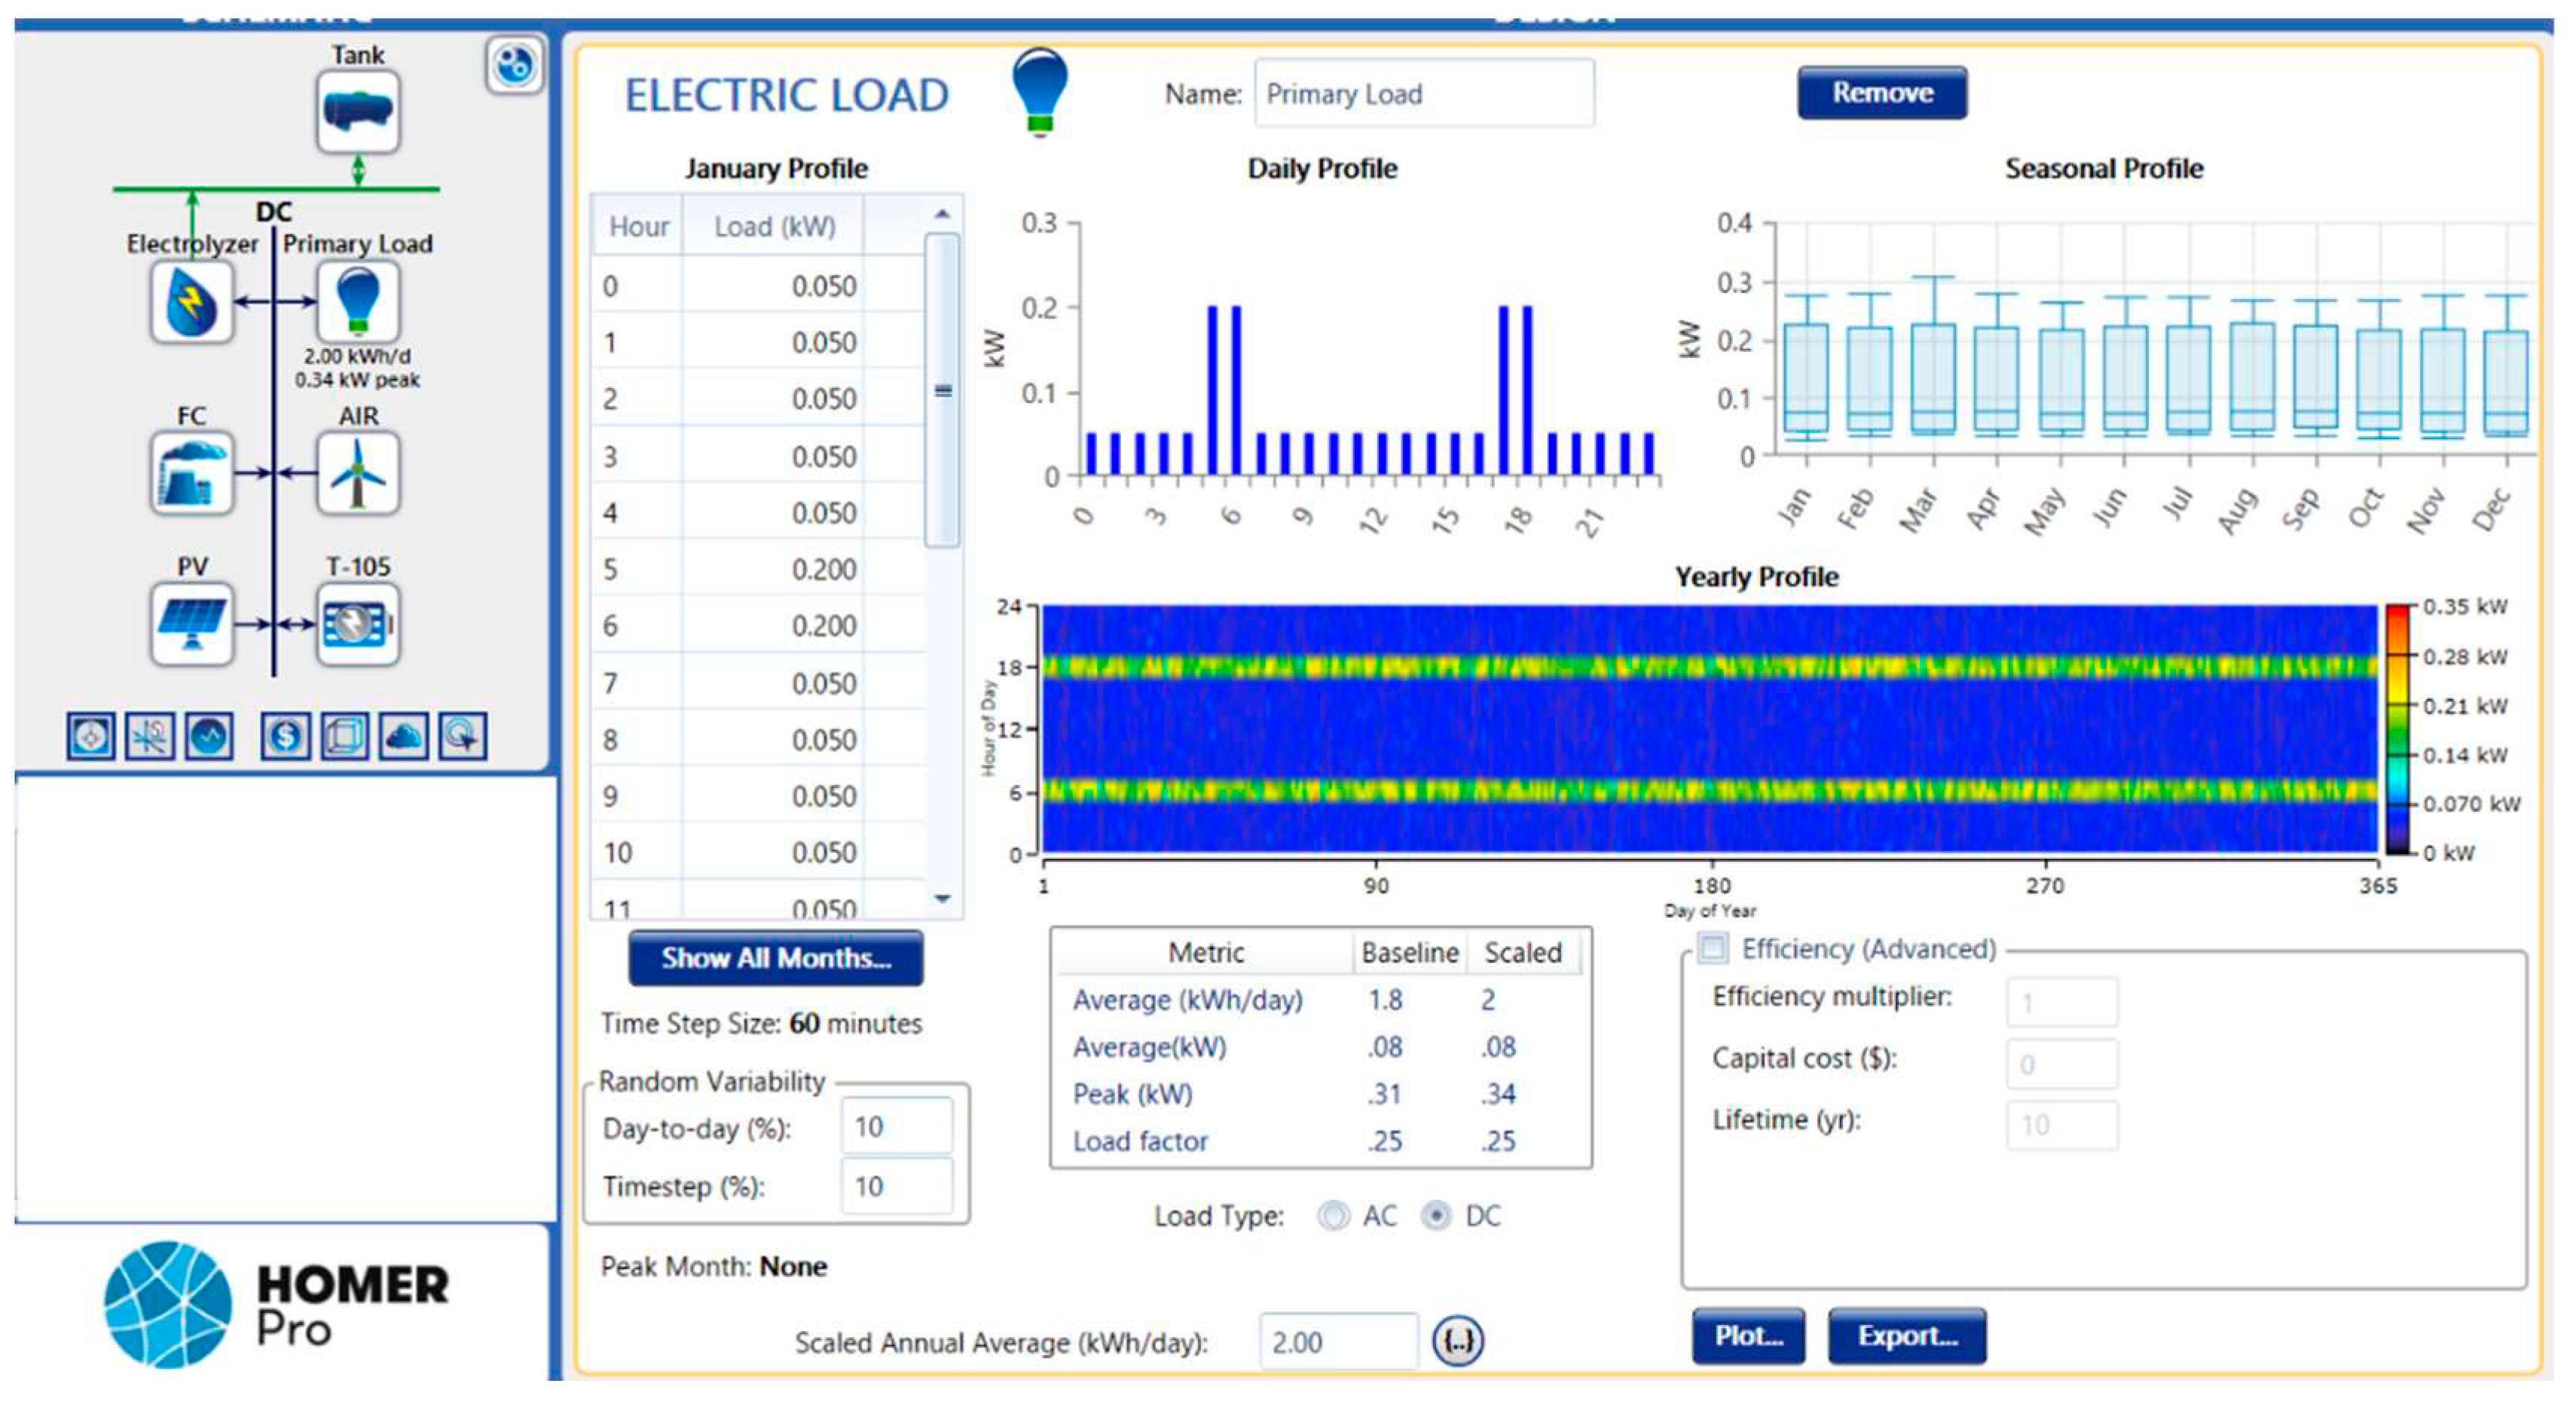
Figure 1 represents the general design of the system, a simulation was made for a hybrid system consisting of photovoltaic panels combined with wind turbines for energy production, storage batteries and diesel generator for reserve. The energy produced is used for the formation of hydrogen [
35].
By integrating these components into a comprehensive system, remote areas can benefit from a sustainable energy solution [
36]. The combination of the small wind turbine and PV panels ensures a consistent renewable energy supply, while the diesel batteries and hydrogen tank provide backup power during periods of low renewable energy production [
37]. This system enables the efficient utilization of renewable energy sources, reducing dependence on fossil fuels and promoting environmental sustainability [
38].
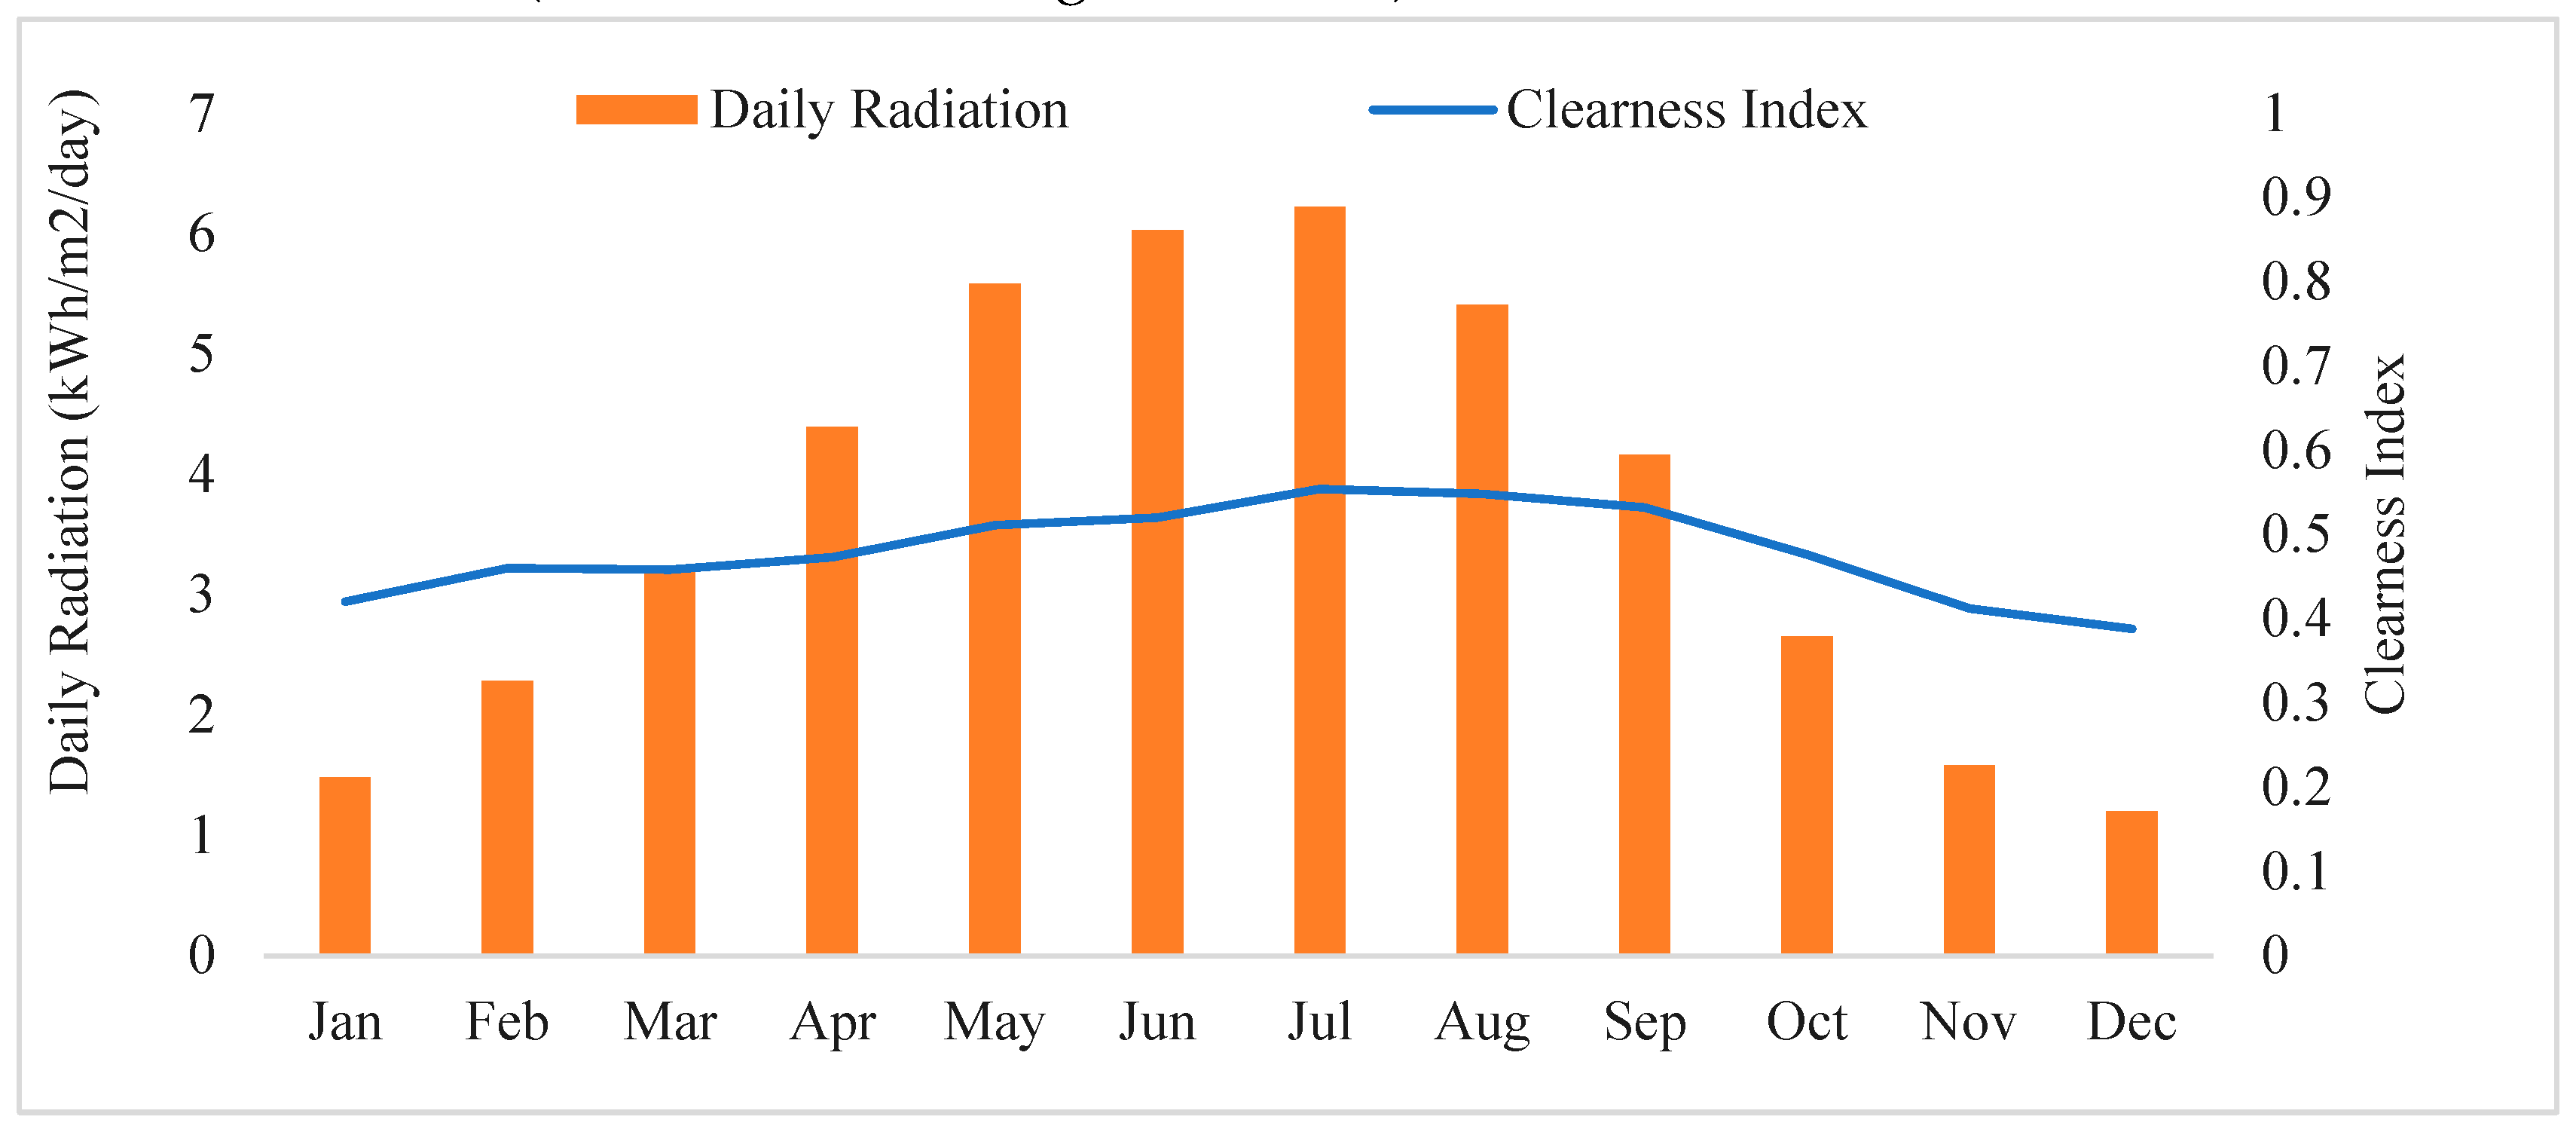
The clearness index and daily radiation values provided in the
Figure 2 give an indication of the solar energy potential throughout the year. Generally, higher clearness index values and daily radiation values suggest sunnier and more favorable conditions for solar energy generation. The data is taken from location (Latitude 44.25, longitude 28.75) from NASA database.
Figure 2 shows the Monthly Average Solar Global Horizontal Irradiance. In this figure, two graphs are represented. The first graph consists of the daily radiation reported for the 12 months of the year in kWh/m
2/day. The second graph represents the clearness index also reported for the 12 months of the year.
It can be noted that the clearness index ranges from 0.388 in December to 0.554 in July, indicating that July tends to have the highest proportion of solar radiation reaching the Earth’s surface compared to clear sky conditions. Similarly, the daily radiation values show an increasing trend from January to July, peaking in June at 6.03 kWh/m2/day. After July, the daily radiation values start to decline gradually until December.
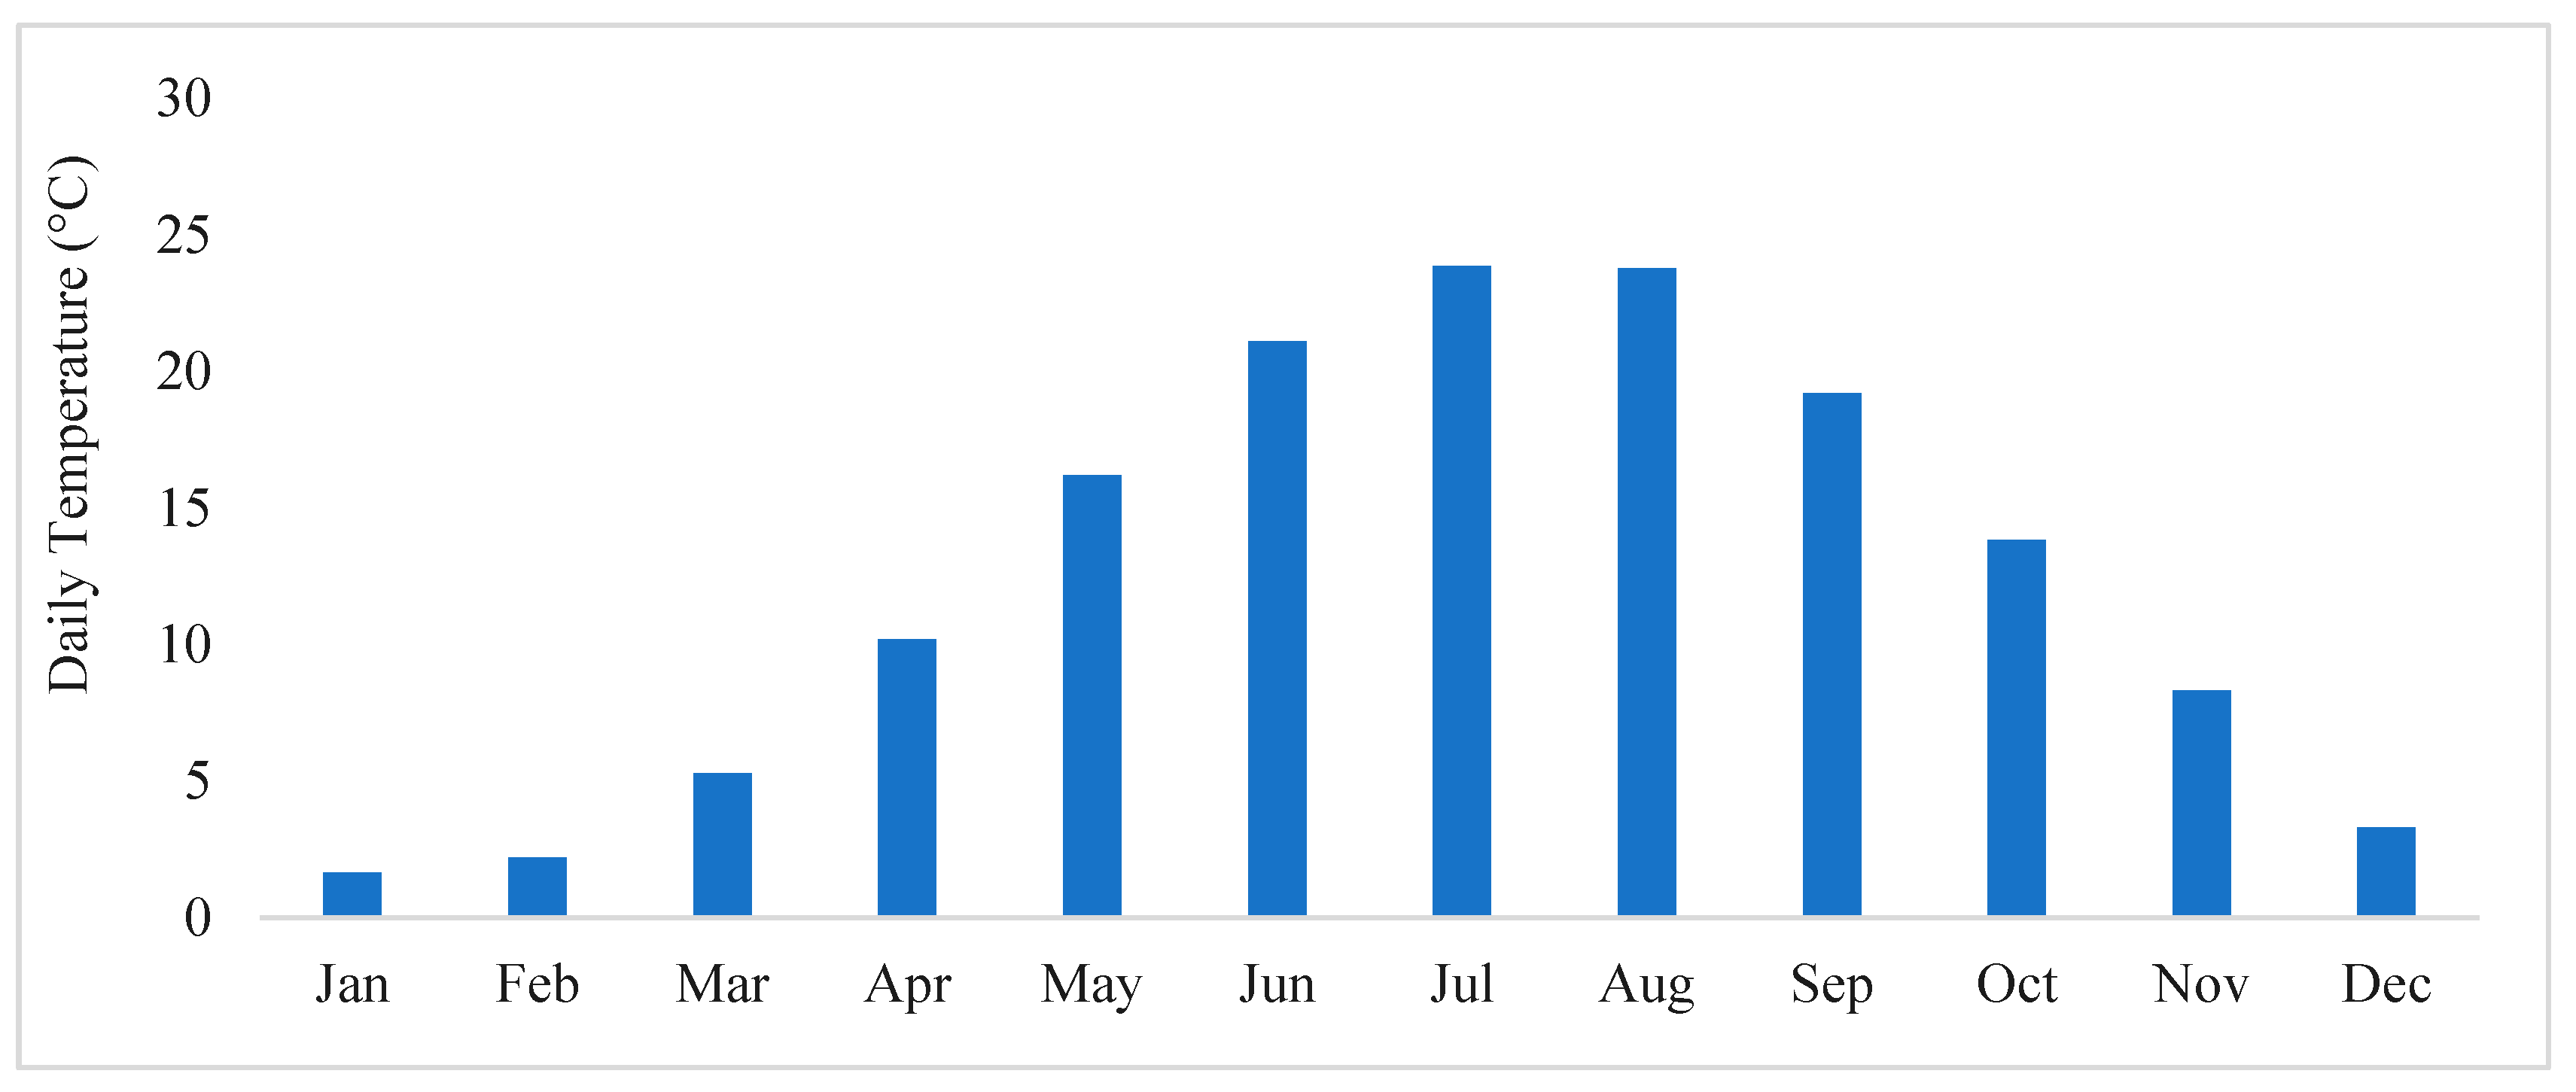
Figure 3 provided shows the daily temperature values for each month of the year. The temperature values are measured in degrees Celsius.
From the
Figure 3, it can be observed that the temperatures gradually increase from winter to summer months, with the highest average daily temperature occurring in July and August. This aligns with the typical pattern in many regions where summer months tend to be warmer. Similarly, the temperatures gradually decrease from summer to winter months, with the lowest average daily temperature occurring in December and January [
39].
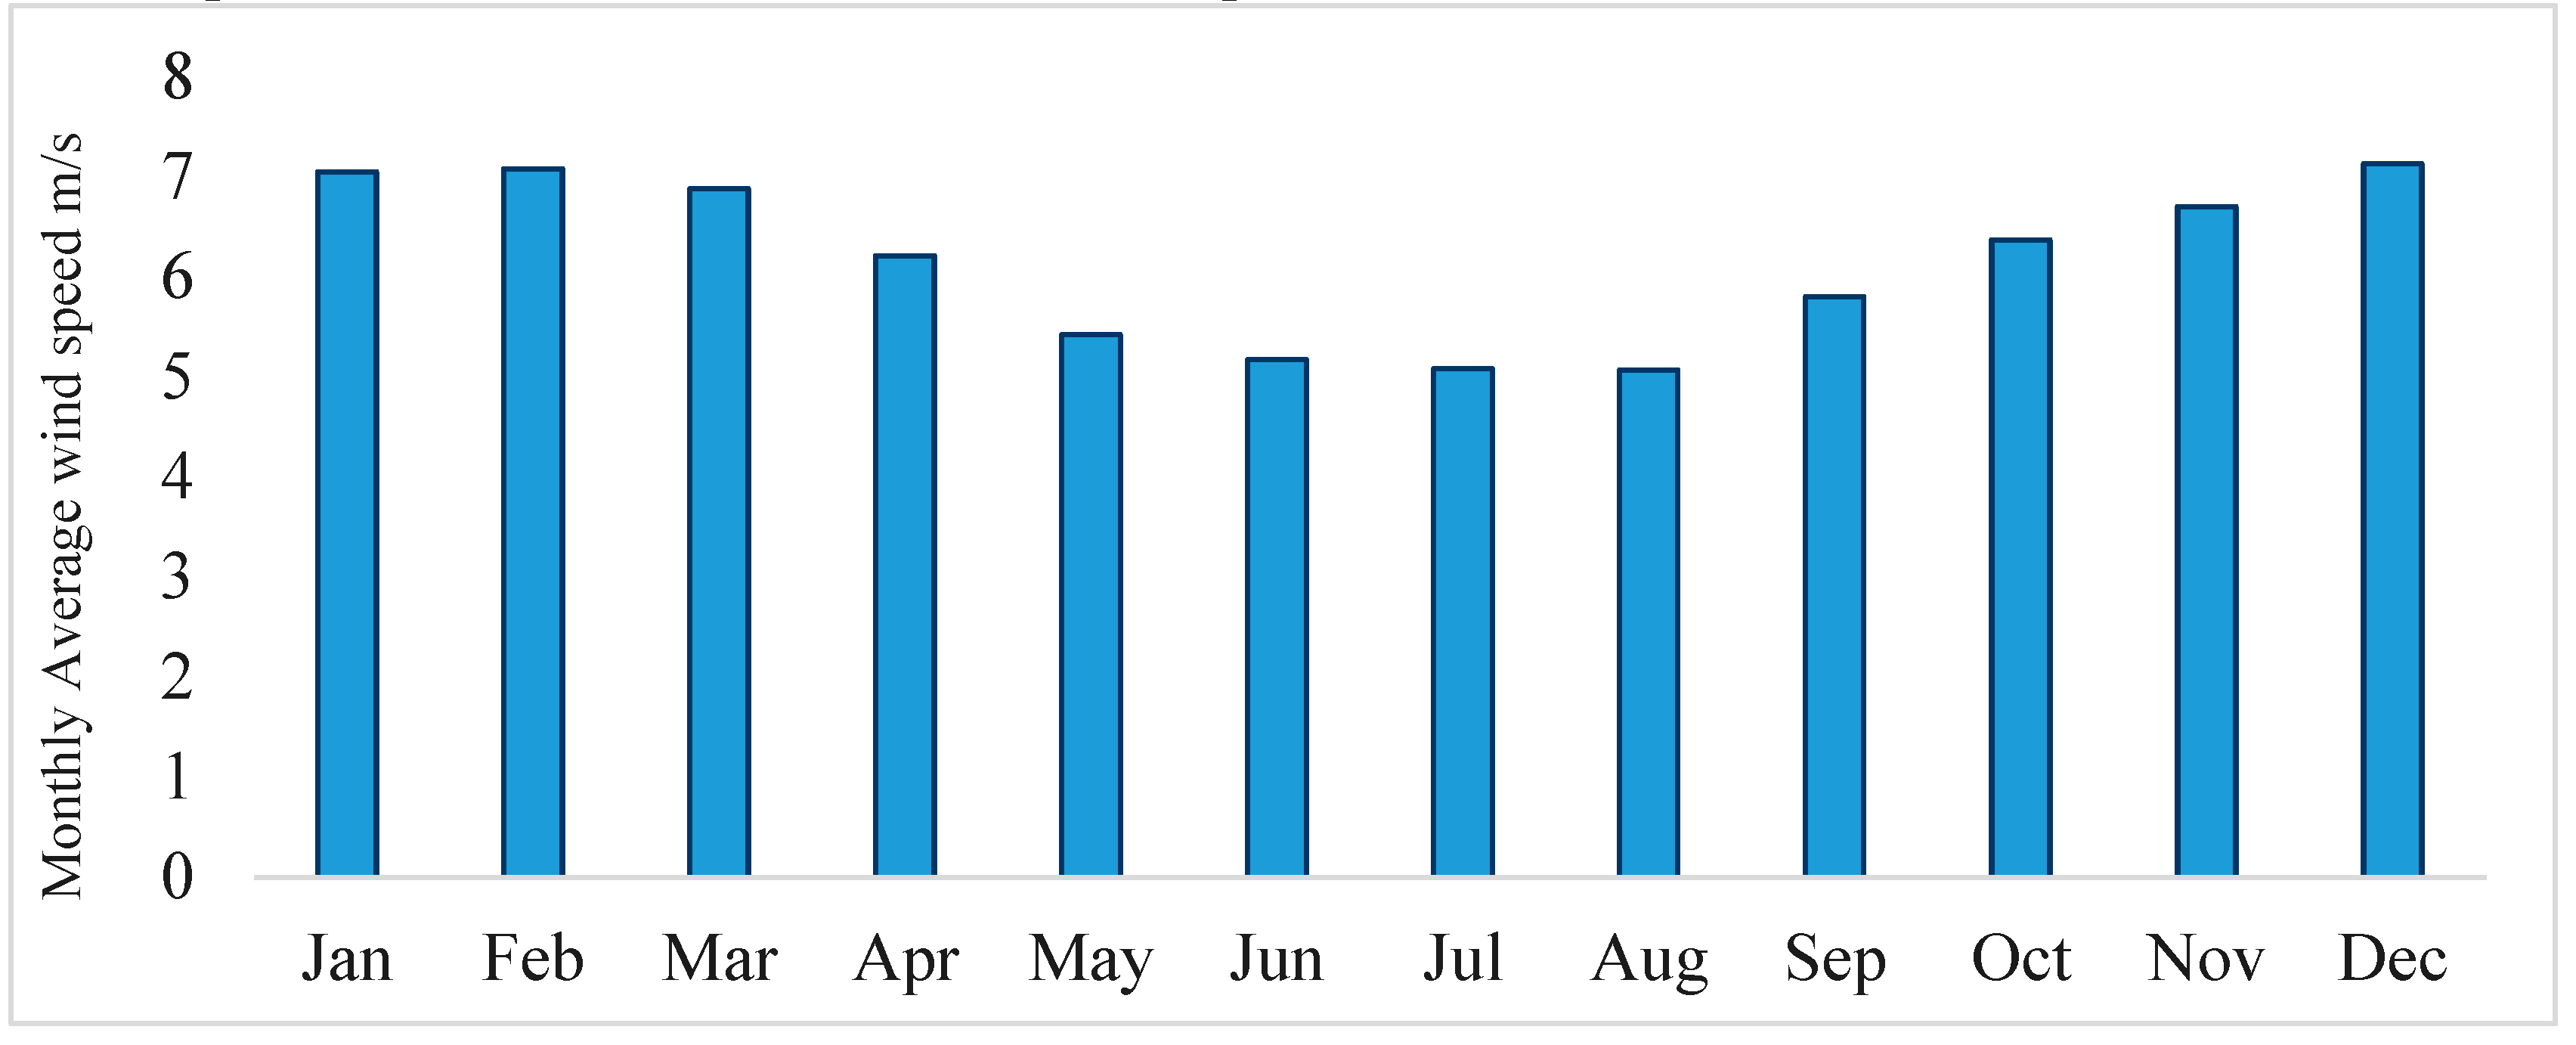
Figure 4 provided shows the monthly average wind speed values for each month of the year. The wind speed values are measured in meters per second (m/s).
Figure 4 it can be observed that the wind speeds show some variation but generally remain within a consistent range across the months. The highest average wind speeds are observed in the winter months, particularly in December and January, with values exceeding 7 m/s. This aligns with the expectation that winter months tend to have stronger wind conditions in many regions. On the other hand, the summer months show relatively lower average wind speeds, with values around 5 m/s.
Table 1 provided shows the annual production of different energy sources in kilowatt-hours (kWh) and their respective percentages. The energy sources listed are PV (Photovoltaic), Fuel Cell, and SW AIR X.
From Table, it can be observed that PV contributes 571 kWh/year, accounting for approximately 33.1% of the total energy production. The Fuel Cell contributes 227 kWh/year, representing around 13.1% of the total. The SW AIR X source has the highest production, generating 928 kWh/year, which makes up approximately 53.8% of the total energy production.
The in this case is 1726 kWh/year, accounting for 100% of the total energy production.
Figure 5 represents the monthly electricity production graph. It can be seen that we have all 3 types of energy production sources (PV, FC, AIR).
An electrolyzer is an electrochemical device used to produce hydrogen gas by splitting water molecules into hydrogen and oxygen through a process called electrolysis. It consists of two electrodes (an anode and a cathode) submerged in an electrolyte solution, usually water or an aqueous solution of an electrolyte [
40].
When an electric current is passed through the electrolyte, water molecules at the cathode receive electrons, reducing them to form hydrogen gas (H2). At the same time, at the anode, water molecules lose electrons, oxidizing them to produce oxygen gas (O2). The overall reaction can be represented as follows:
2H2O(l) -> 2H2(g) + O2(g)
The process of electrolysis requires an external power source, typically electricity, which provides the energy needed to drive the electrolysis reaction. The efficiency of an electrolyzer is determined by factors such as the design of the electrodes, the type and concentration of the electrolyte, temperature, and operating conditions [
41].
Table 2 provided includes various quantities and values to Electrolyzer input and output power.
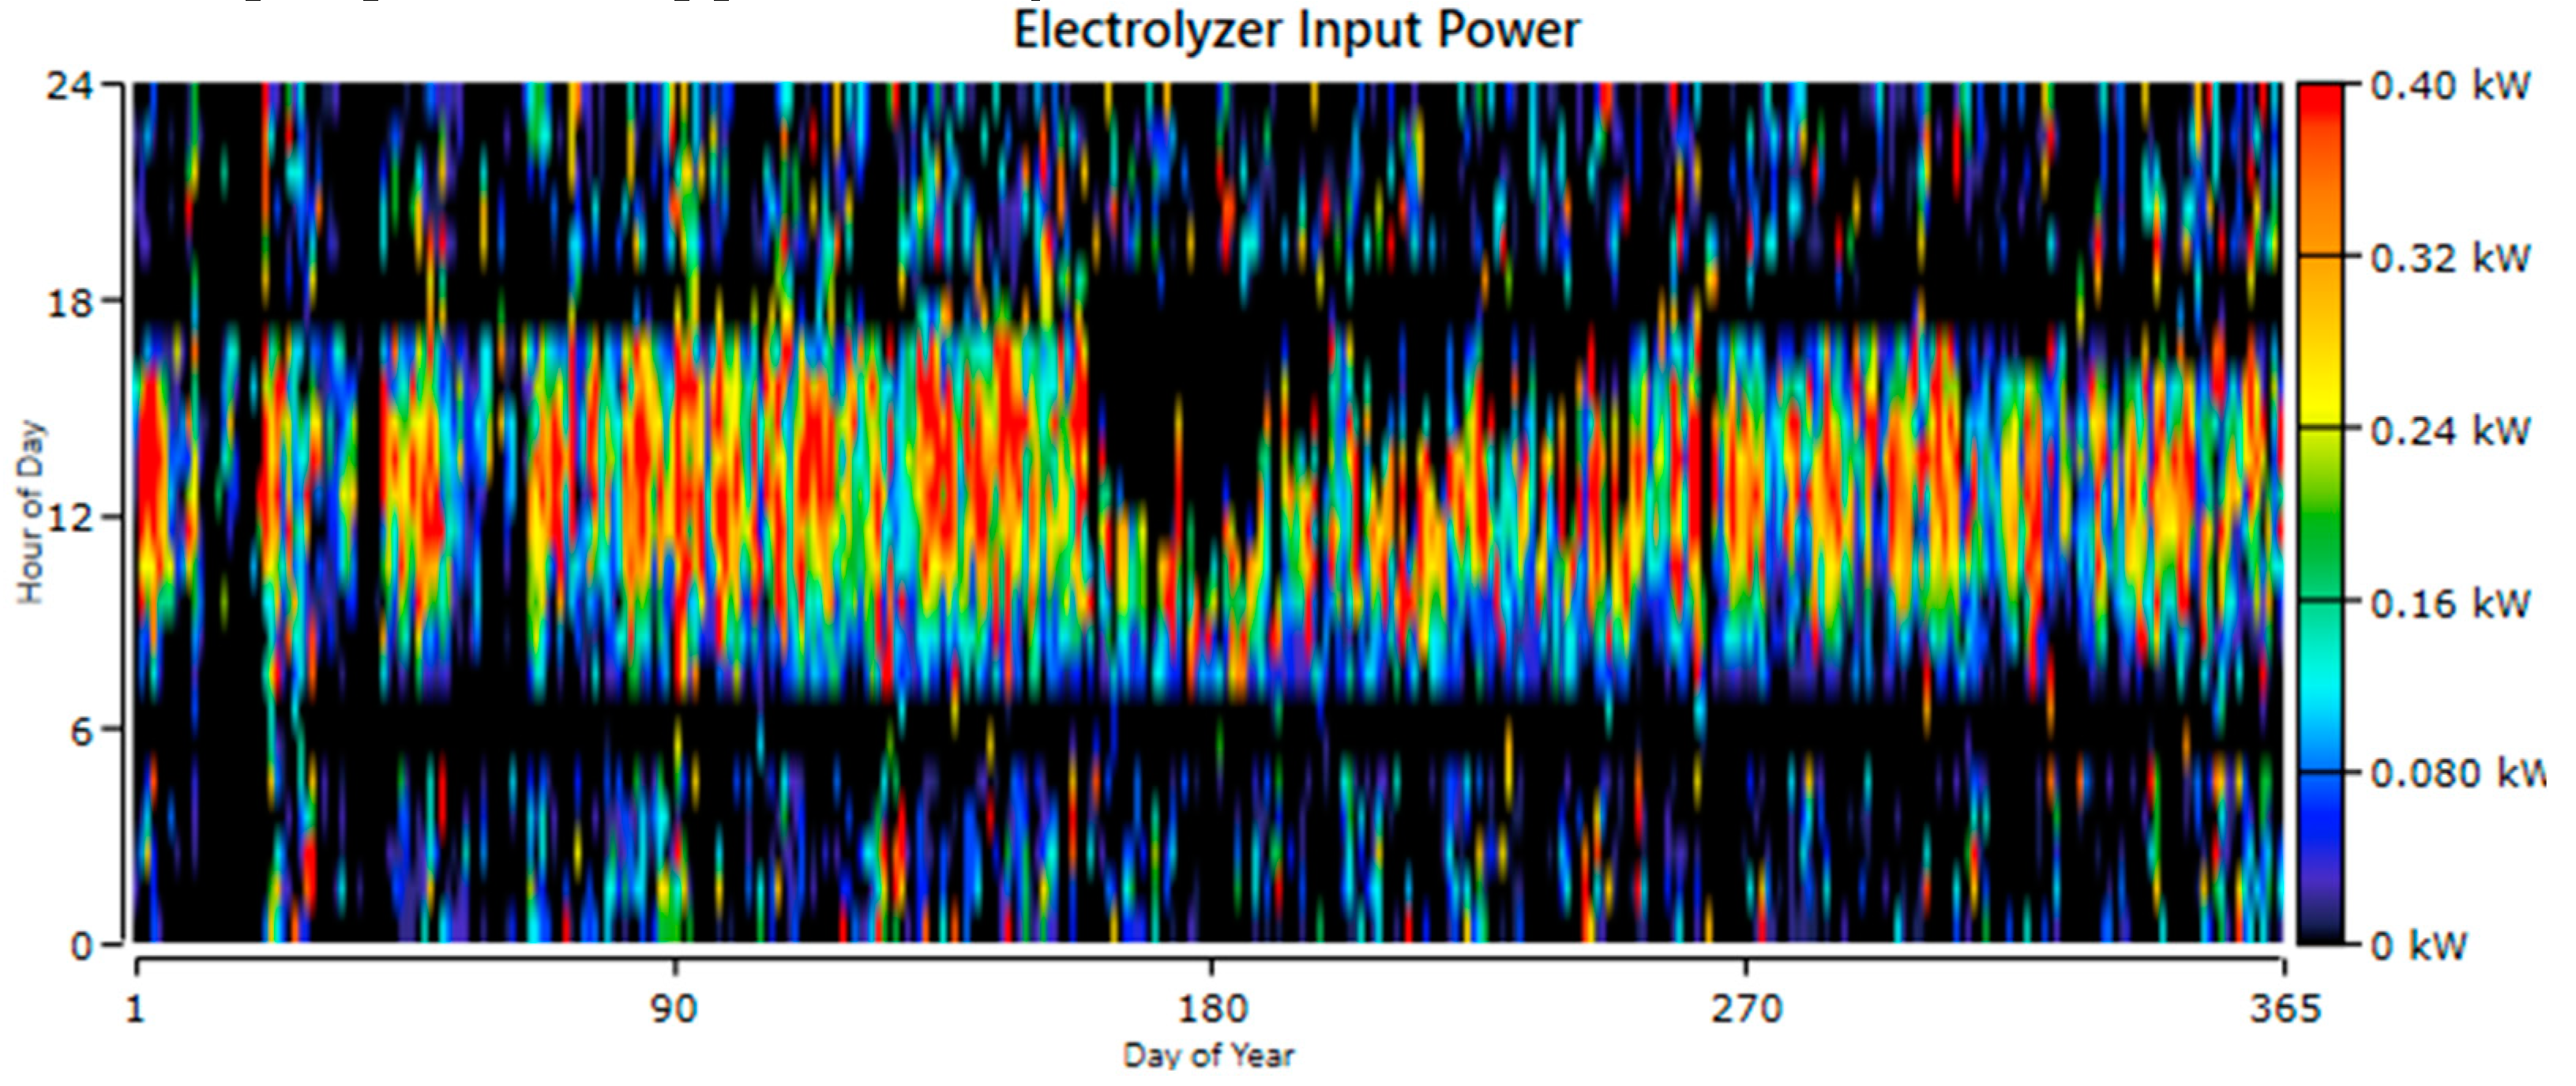
The system has a rated capacity of 0.400 kW, meaning it can provide a maximum power output of 0.400 kW under normal operating conditions. On average, the system receives an input of 0.0847 kW, with a maximum input of 0.400 kW. Over the course of a year, the total energy input into the system amounts to 742 kWh. The system’s capacity factor is 21.2%, indicating that it operates at approximately one-fifth of its maximum capacity on average. In terms of output, the system produces the specified material or substance at an average rate of 0.00163 kg/hr., with a maximum output rate of 0.00771 kg/hr. The total production of the specified material or substance over a year is 14.3 kg.
Figure 6 represents the graph for simulating the electrolysis process. It can be seen that we have a maximum input power of approximately 0.40kW.
The table above consists of the parameters interpreted from the simulation in
Figure 6.
The system operates for a total of 2,307 hours per year, with 958 starts recorded annually. It has an expected operation life of 17.3 years. The capacity factor of the system is 6.47%, indicating that it operates at a relatively low fraction of its maximum capacity on average. The fixed generation cost is $0.008 per hour
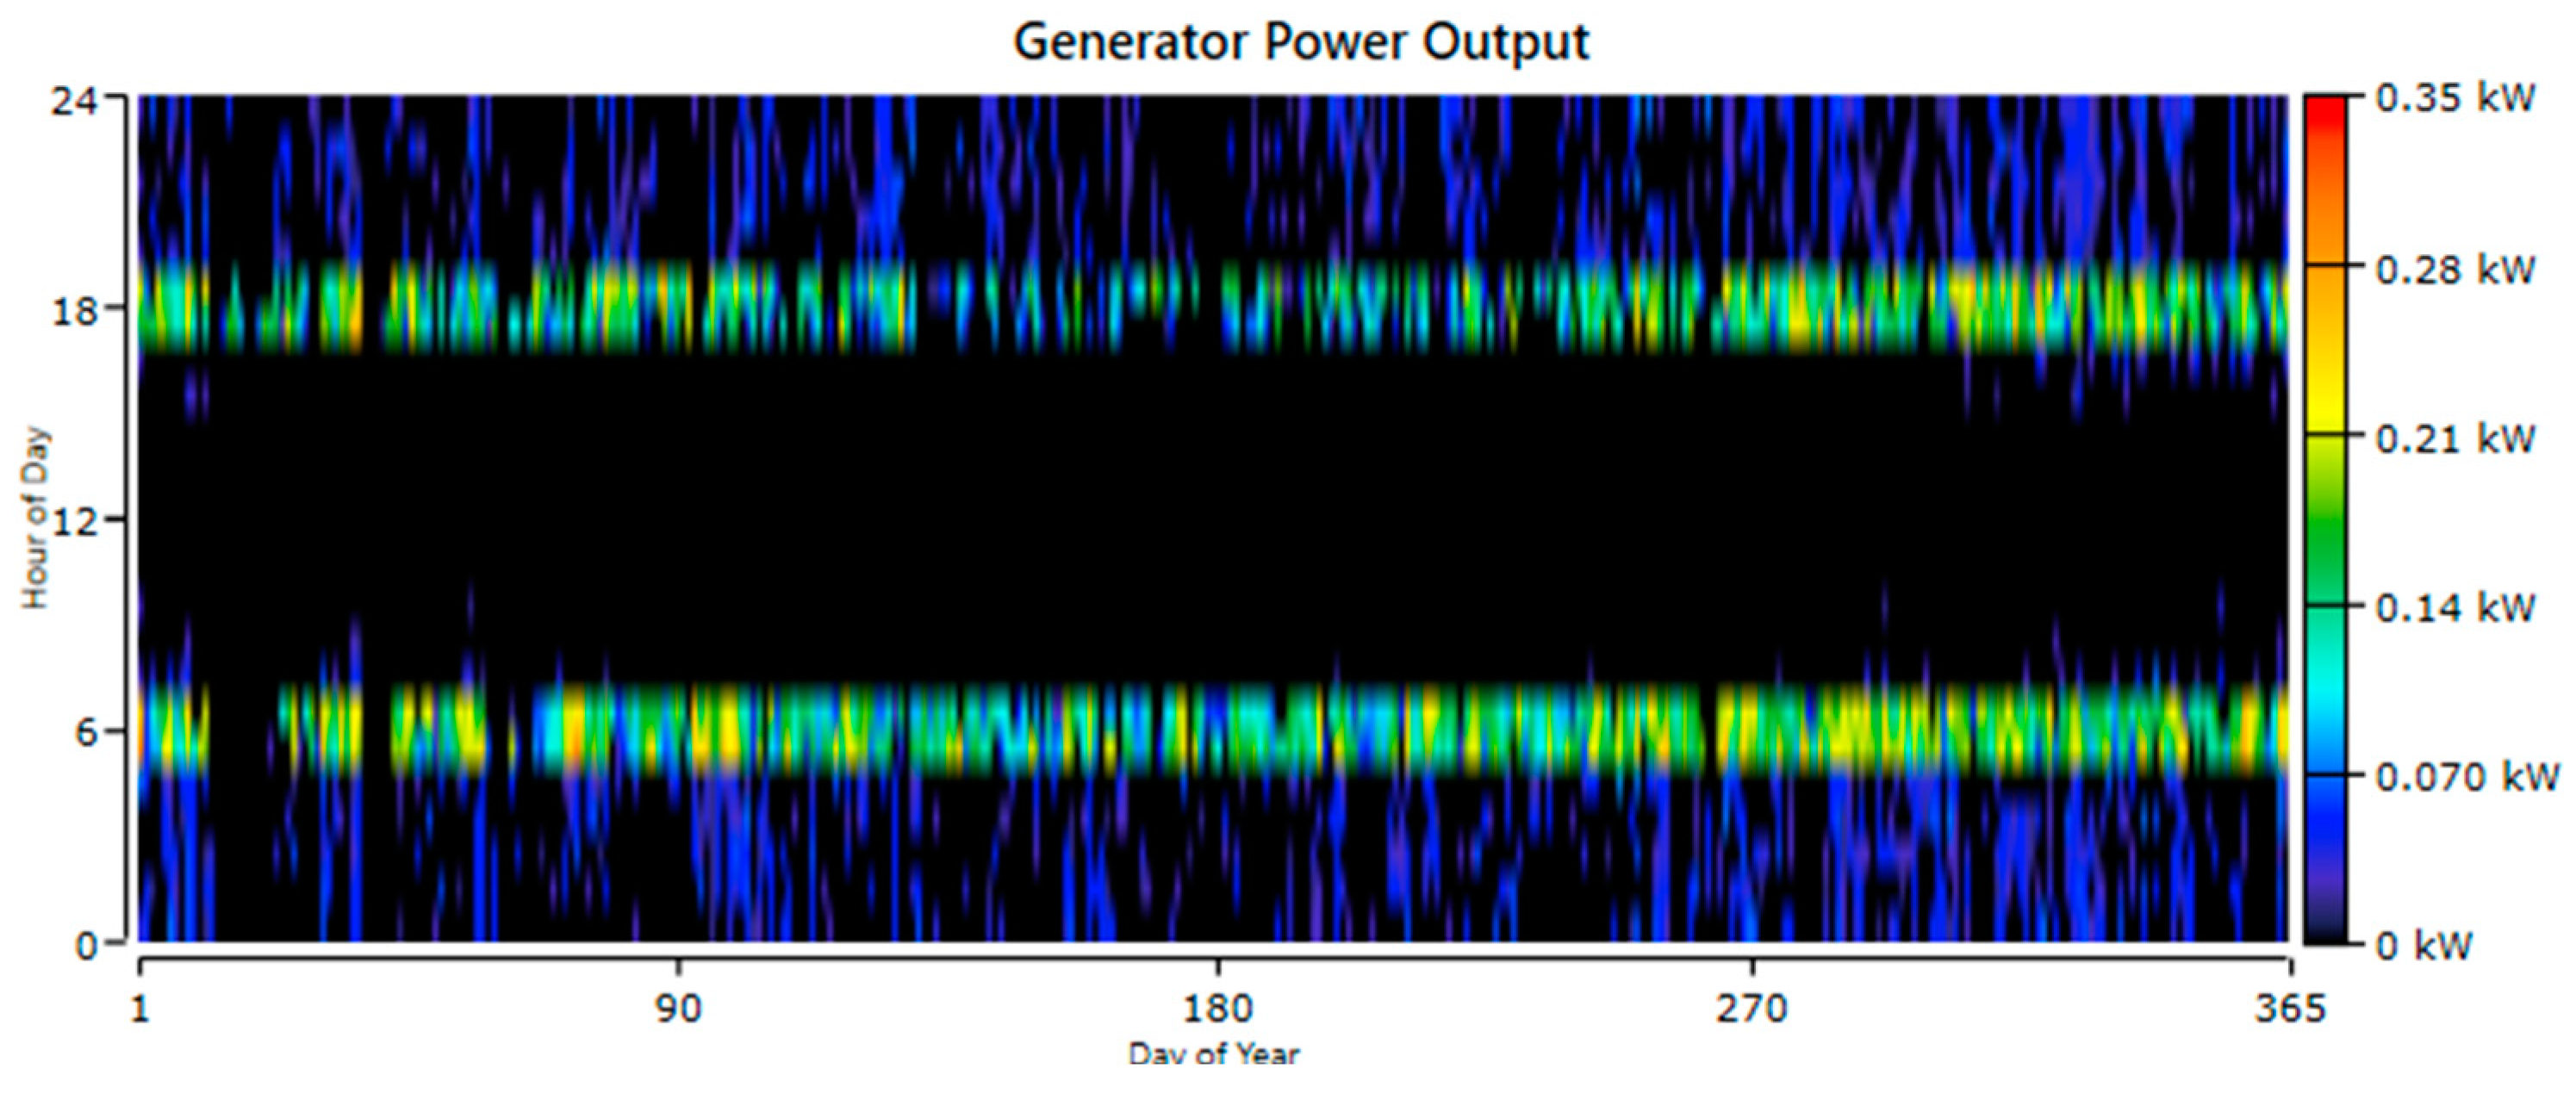
Figure 7 represents the graph for the simulation of the electricity production process. It can be seen that we have a maximum output power of about 0.35 kW.
The system generates a total of 227 kWh of electrical production per year, with an average electrical output of 0.0983 kW. It can deliver a minimum output of 0.0208 kW and a maximum output of 0.307 kW. The system consumes 13.6 kg of fuel, with a specific fuel consumption of 0.06 kg/kWh. The fuel energy input is 454 kWh per year. The mean electrical efficiency of the system is 50%. These values provide insights into the system’s operational characteristics, fuel consumption, electrical output, and efficiency.
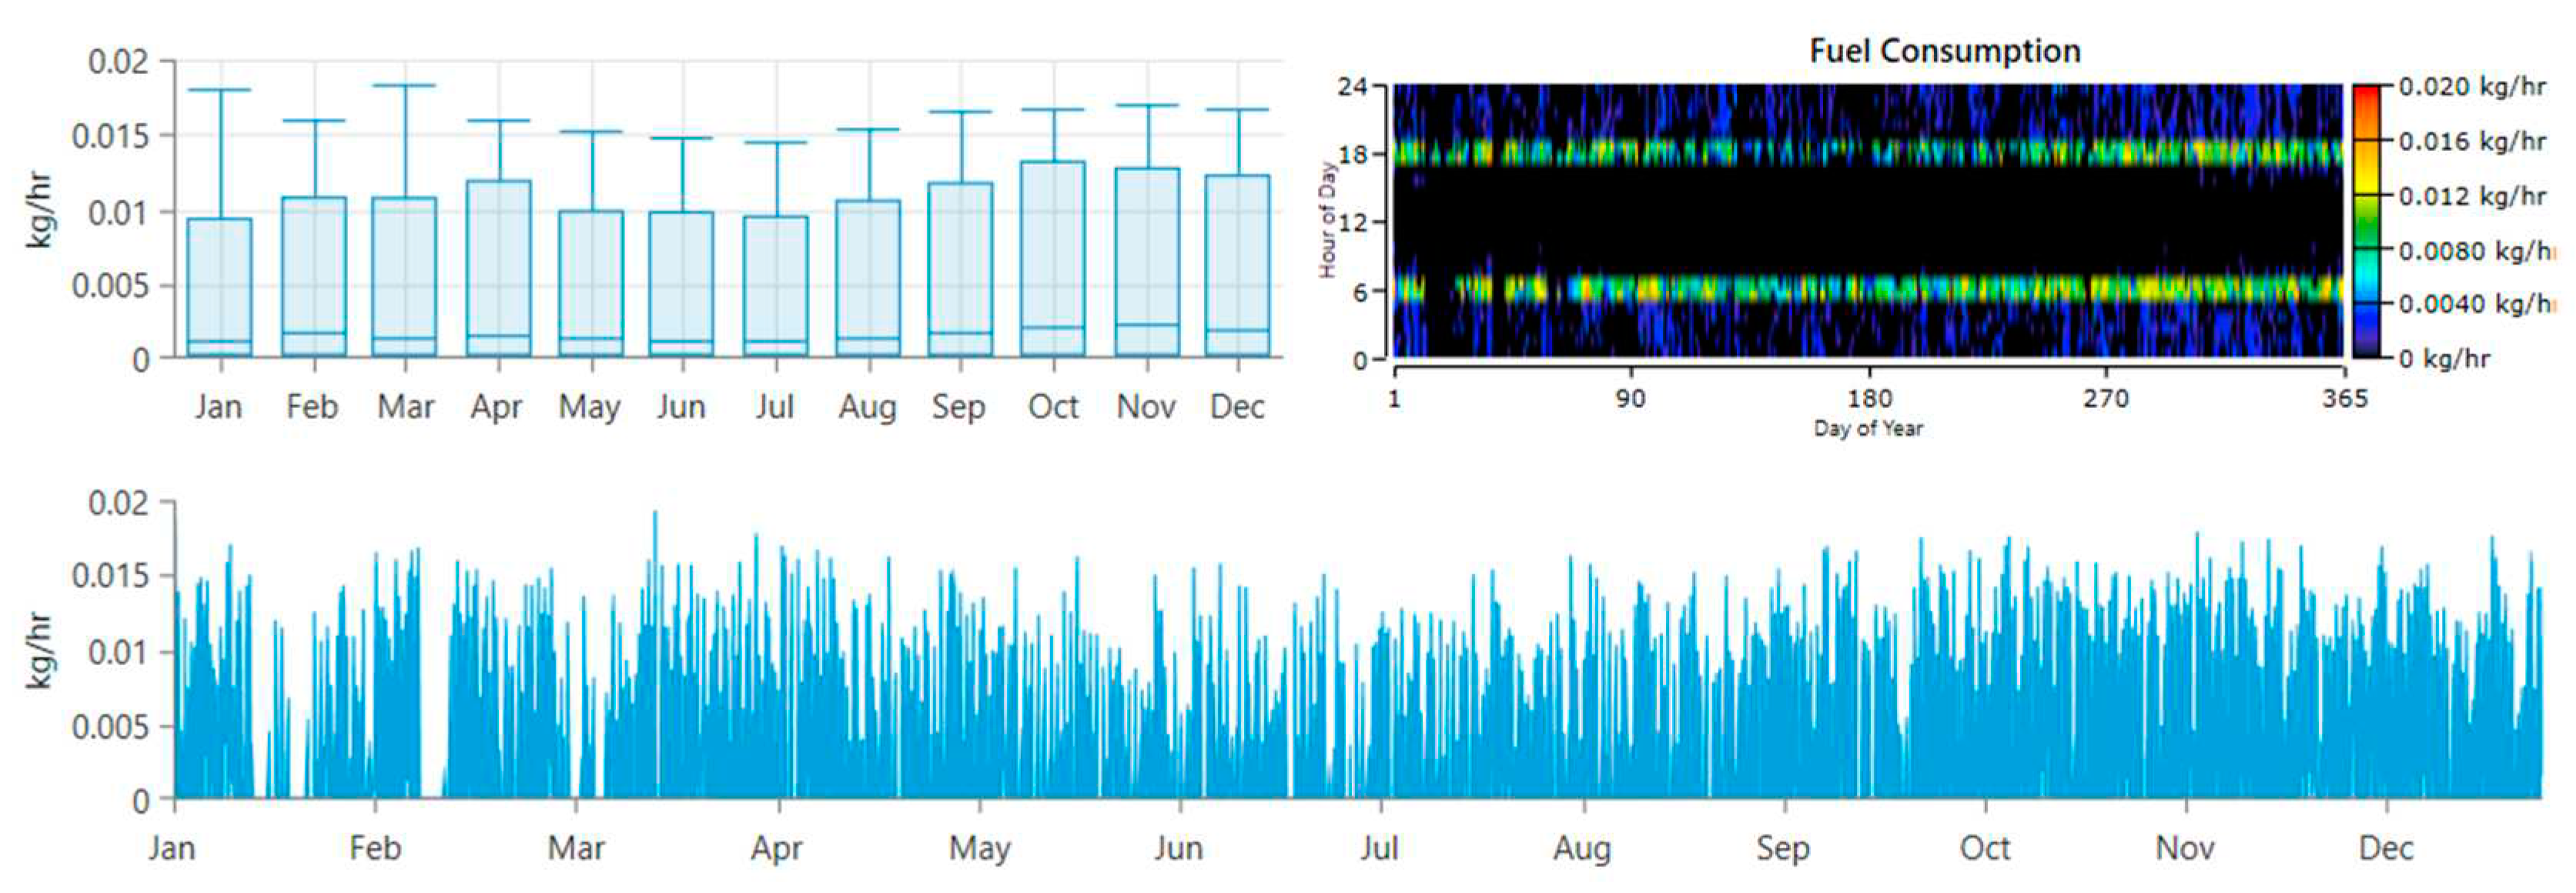
The graphs in
Figure 8 show the consumption of fuel consumed for energy production. The amount of fuel is measured per hour. It can be seen that we have a maximum consumption in March of approximately 0.18 kg/hr.
Figure 9 shows the simulation of the hydrogen storage tank. The hydrogen storage tank has a capacity of 2 (kg) and an energy storage capacity of 66.7 (kWh). The tank autonomy, which refers to the duration the tank can provide hydrogen at a given rate, is 800 hours.
At the beginning of the year, the hydrogen storage tank has a content of 0.2 kg. This represents the amount of hydrogen gas stored in the tank.
By the end of the year, the content of the hydrogen storage tank increases to 0.889 kg. This indicates that additional hydrogen has been generated and stored in the tank throughout the year.
The storage and accumulation of hydrogen in the tank allow for the utilization of surplus renewable power generated during peak production periods. This stored hydrogen can then be utilized as needed by a fuel cell or other hydrogen-powered devices to produce electricity or provide energy for various applications[
42].
The photovoltaic (PV) system has a rated capacity of 0.4 kW, meaning it is designed to produce a maximum power output of 0.4 kW under optimal conditions. The mean output of the PV system is 0.0652 kW, representing the average power output over a given period. The mean daily output of the PV system is 1.57 kWh, indicating the average energy output per day. This value represents the electricity generated by the PV system on an average day.
The capacity factor of the PV system is 16.3%. This percentage reflects the ratio of the actual energy output of the system to its maximum possible output over a specified time. A capacity factor of 16.3% suggests that the PV system operates at a relatively low fraction of its maximum capacity on average.
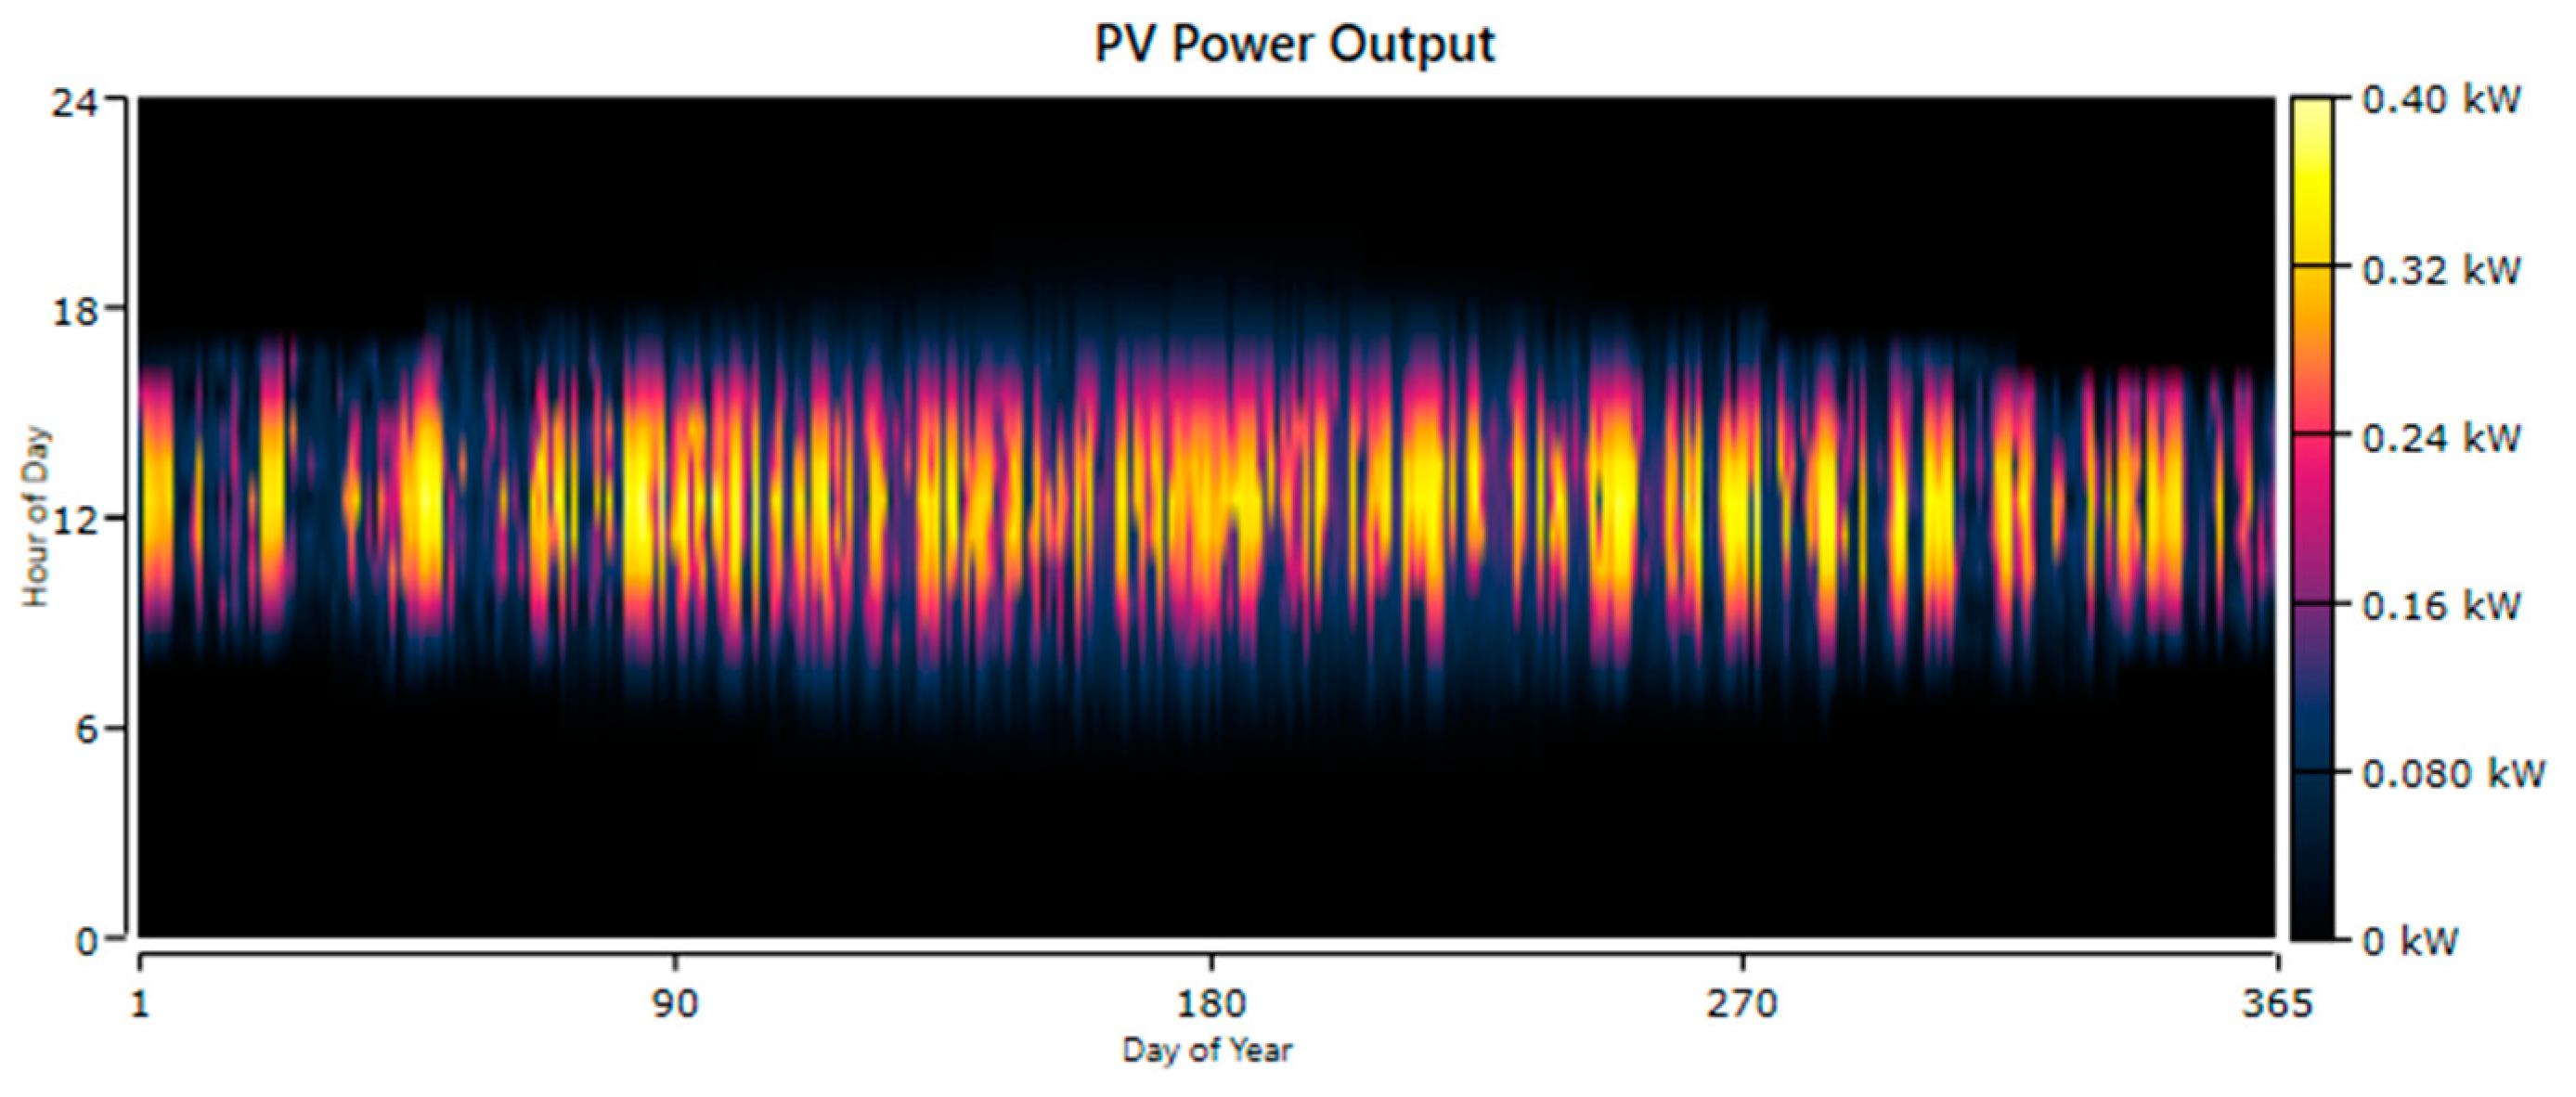
Figure 10 shows the total power at the output of the system with photovoltaic panels. This power is rendered in hours per day over the course of a year. This time we have a maximum output power of approximately 0.40 kW.
The total production of the PV system over the year is 571 kWh, indicating the total amount of energy generated by the system over the course of a year.
The maximum output of the PV system is 0.383 kW, representing the highest power output it can achieve under optimal conditions.
The levelized cost of electricity (LCOE) for the PV system is $0.201 per kilowatt-hour (kWh). This value represents the average cost of producing each unit of electricity by the PV system, considering the total costs over its lifespan.
The total rated capacity of the wind system is 0.55 kW, indicating its maximum power output under optimal conditions. The mean output of the wind system is 0.106 kW, representing the average power output over a given period.
The capacity factor of the wind system is 19.3%, which reflects the ratio of the actual energy output of the system to its maximum possible output over a specified time. A capacity factor of 19.3% suggests that the wind system operates at a relatively low fraction of its maximum capacity on average.
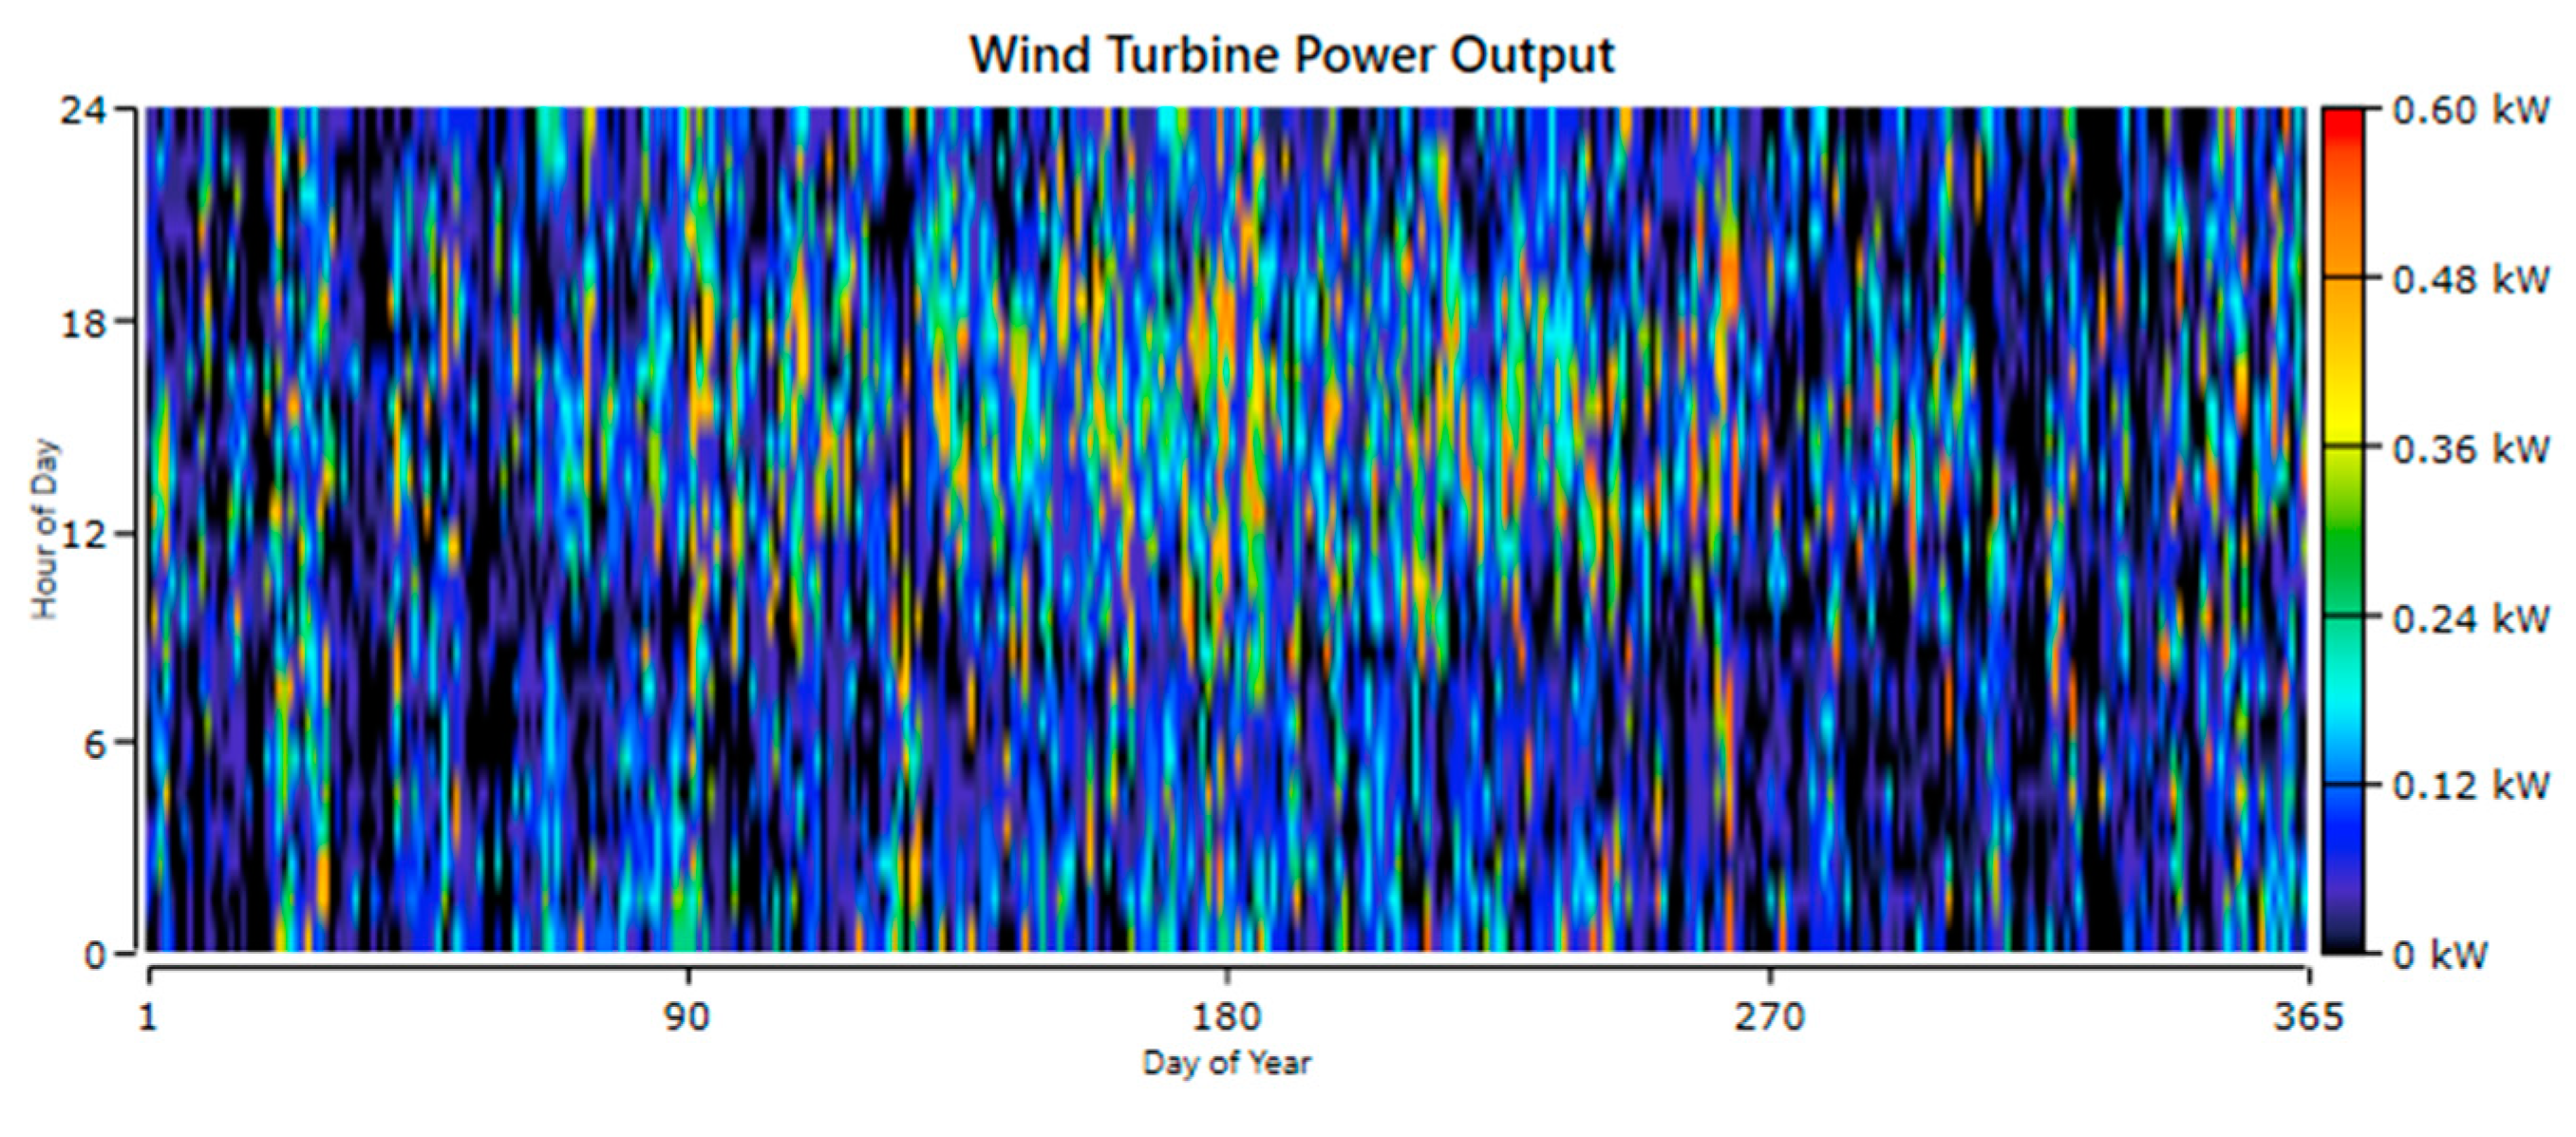
Figure 11 represents the total power at the output of the wind turbine system. As in the case of photovoltaic panels, the power is reproduced in hours per day over the course of a year. The maximum output power this time is around 0.60 kW.
The total production of the wind system over the year is 928 kWh, indicating the total amount of energy generated by the system over the course of a year. The wind system can achieve a maximum output of 0.547 kW, representing the highest power output it can generate under optimal conditions. The wind penetration is 127%, which suggests that the wind system can generate more energy than is needed for the site’s power requirements. This implies that the wind system can potentially contribute excess energy to the grid or be used for additional purposes such as energy storage.
The levelized cost of electricity (LCOE) for the wind system is $0.168 per kilowatt-hour (kWh). This value represents the average cost of producing each unit of electricity by the wind system, considering the total costs over its lifespan.
7. Conclusion
The analysis conducted on the renewable energy system reveals valuable insights into its components and performance. By considering photovoltaics (PV), fuel cells, and small wind turbines, along with the hydrogen storage system, the study aimed to determine the most efficient and cost-effective approach to supplying power to a remote site.
The PV system proved to be a significant contributor, with a rated capacity of 0.4 kW and a total production of 571 kWh/year, accounting for approximately 33.1% of the total energy production. The fuel cell, on the other hand, provided 227 kWh/year, representing around 13.1% of the total. The SW AIR X small wind turbine demonstrated its potential by generating the highest production of 928 kWh/year, making up approximately 53.8% of the total energy production.
The electrolyzer played a crucial role in the system, converting surplus renewable power into hydrogen through electrolysis. It had a rated capacity of 0.4 kW and a mean input of 0.0847 kW. The electrolyzer total input energy throughout the year amounted to 742 kWh, with a capacity factor of 21.2%. The mean output of the electrolyzer was 0.00163 kg/hr., and the maximum output was 0.00771 kg/hr., resulting in a total production of 14.3 kg/year.
The simulation of the system’s operation over the course of a year showcased its efficiency and performance. The electrolyzer operated for 2,307 hours/year with 958 starts/year and an expected lifespan of 17.3 years. It had a capacity factor of 6.47% and a fixed generation cost of $0.008/hr. The system’s electrical production reached 227 kWh/year, with a mean electrical output of 0.0983 kW. The minimum and maximum electrical outputs were 0.0208 kW and 0.307 kW, respectively. The system consumed 13.6 kg of fuel, with a specific fuel consumption of 0.06 kg/kWh. The mean electrical efficiency was recorded at 50%.
The hydrogen storage tank, with a capacity of 2 kg and an energy storage capacity of 66.7 kWh, demonstrated a tank autonomy of 800 hours. At the beginning of the year, the tank contained 0.2 kg of hydrogen, which increased to 0.889 kg by the end of the year. This indicates successful storage and accumulation of hydrogen throughout the year, allowing for the utilization of surplus renewable power during low production periods.
The analysis also included insights into the PV system and the small wind turbine. The PV system had a rated capacity of 0.4 kW, with a mean output of 0.0652 kW and a capacity factor of 16.3%. It generated a total production of 571 kWh/year, with a maximum output of 0.383 kW. The levelized cost of electricity (LCOE) for the PV system was calculated to be $0.201/kWh.
The small wind turbine had a total rated capacity of 0.55 kW, with a mean output of 0.106 kW and a capacity factor of 19.3%. Its total production reached 928 kWh/year, with a maximum output of 0.547 kW. The wind penetration was measured at 127%, indicating the potential for excess energy generation beyond the site’s power requirements. The levelized cost of electricity (LCOE) for the wind system was determined to be $0.168/kWh.
The analysis of the renewable energy system highlights the significance of utilizing a combination of PV, fuel cells, small wind turbines, and the hydrogen storage system to provide efficient and sustainable power to a remote
The analysis indicates that the battery bank is currently the more viable option for providing power to the remote site. However, as technology advances and costs change over time, it is essential to continue monitoring and evaluating the performance of both systems. A comprehensive analysis, considering various factors such as site location, energy needs, and available resources, can help determine the most suitable option for providing power to the remote site.
