1. Introduction and state of the art
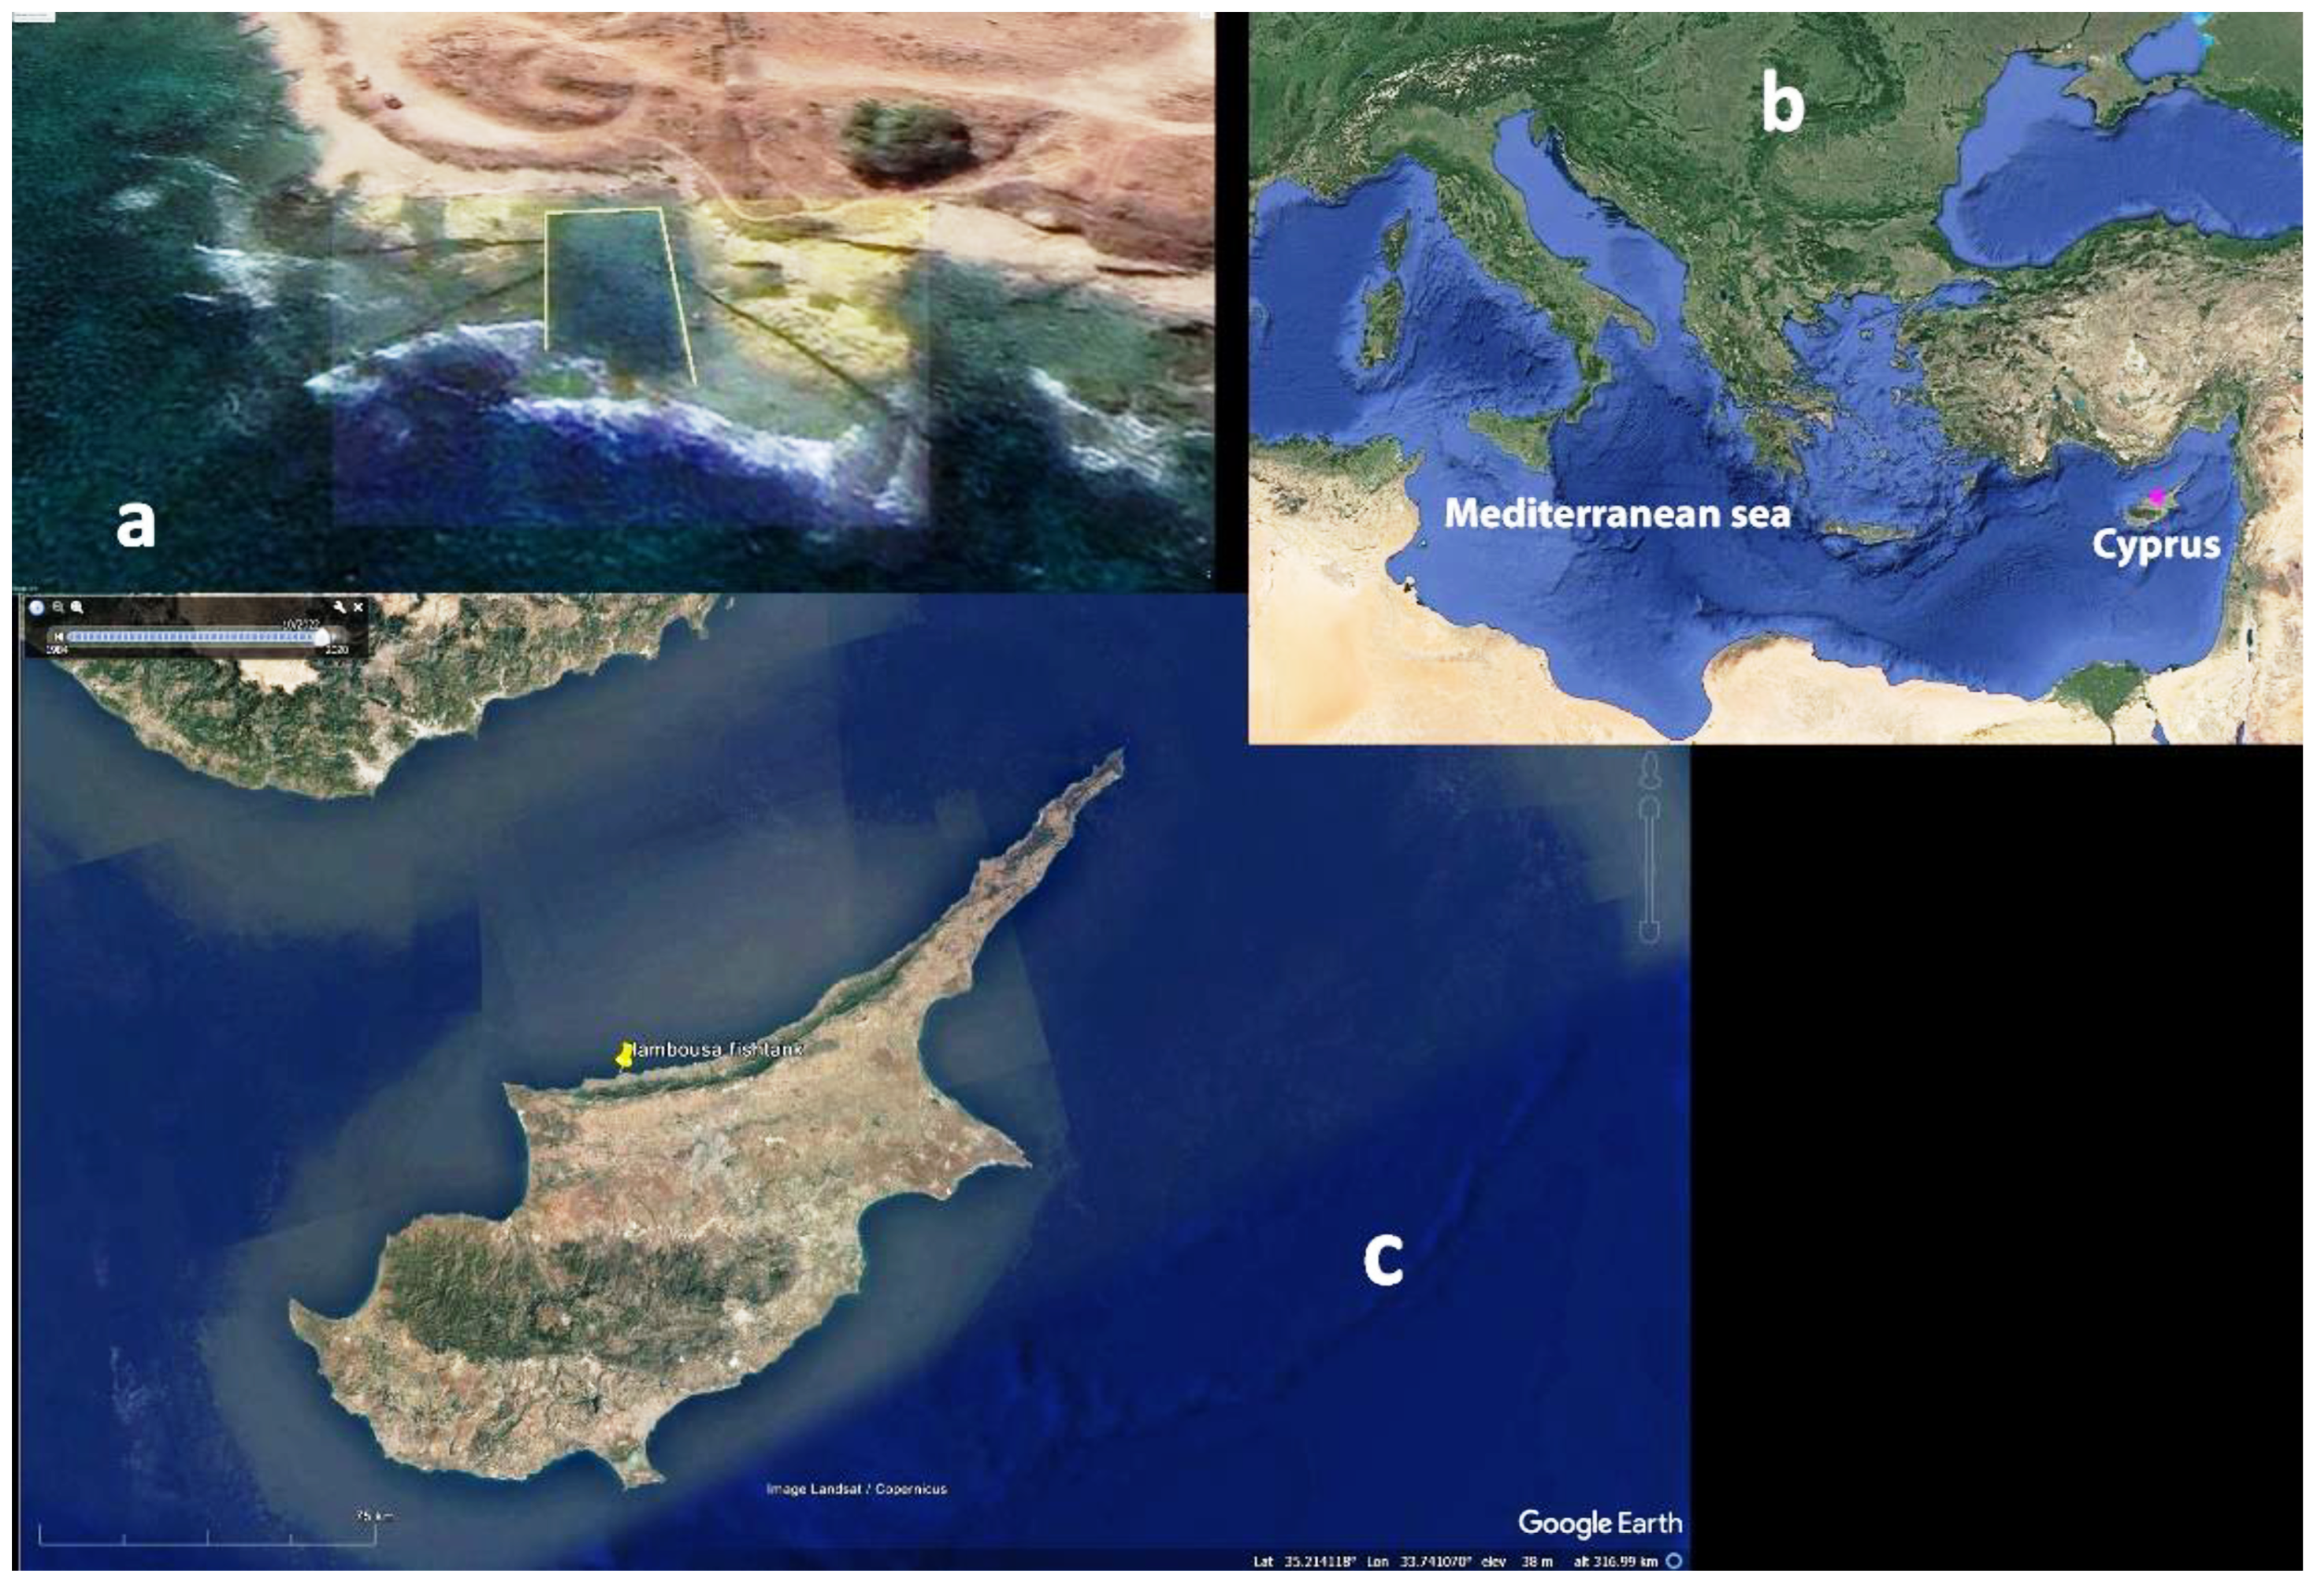
The aim of this research is to evaluate the relative sea-level changes at the site of the Lambousa fishtank (
ft), on the northern coast of Cyprus, at the time slice between today and 2 ka BP using just
ft as a very precise sea level marker [
2]. Roman
fts were built mainly along the Mediterranean coast [
3,
4,
5,
6] and they follow very precise rules of construction. The constructional features of the fish tanks are: the channels, the sluicegates, and the
crepido which, if well-preserved, bear directly on mean sea level at the time of construction and provide a precise measurements of the relative sea level change from the time of construction. Mediterranean
fts were built in a confined interval between 2.1. and 1.9 ka BP [
5].
2. Study area
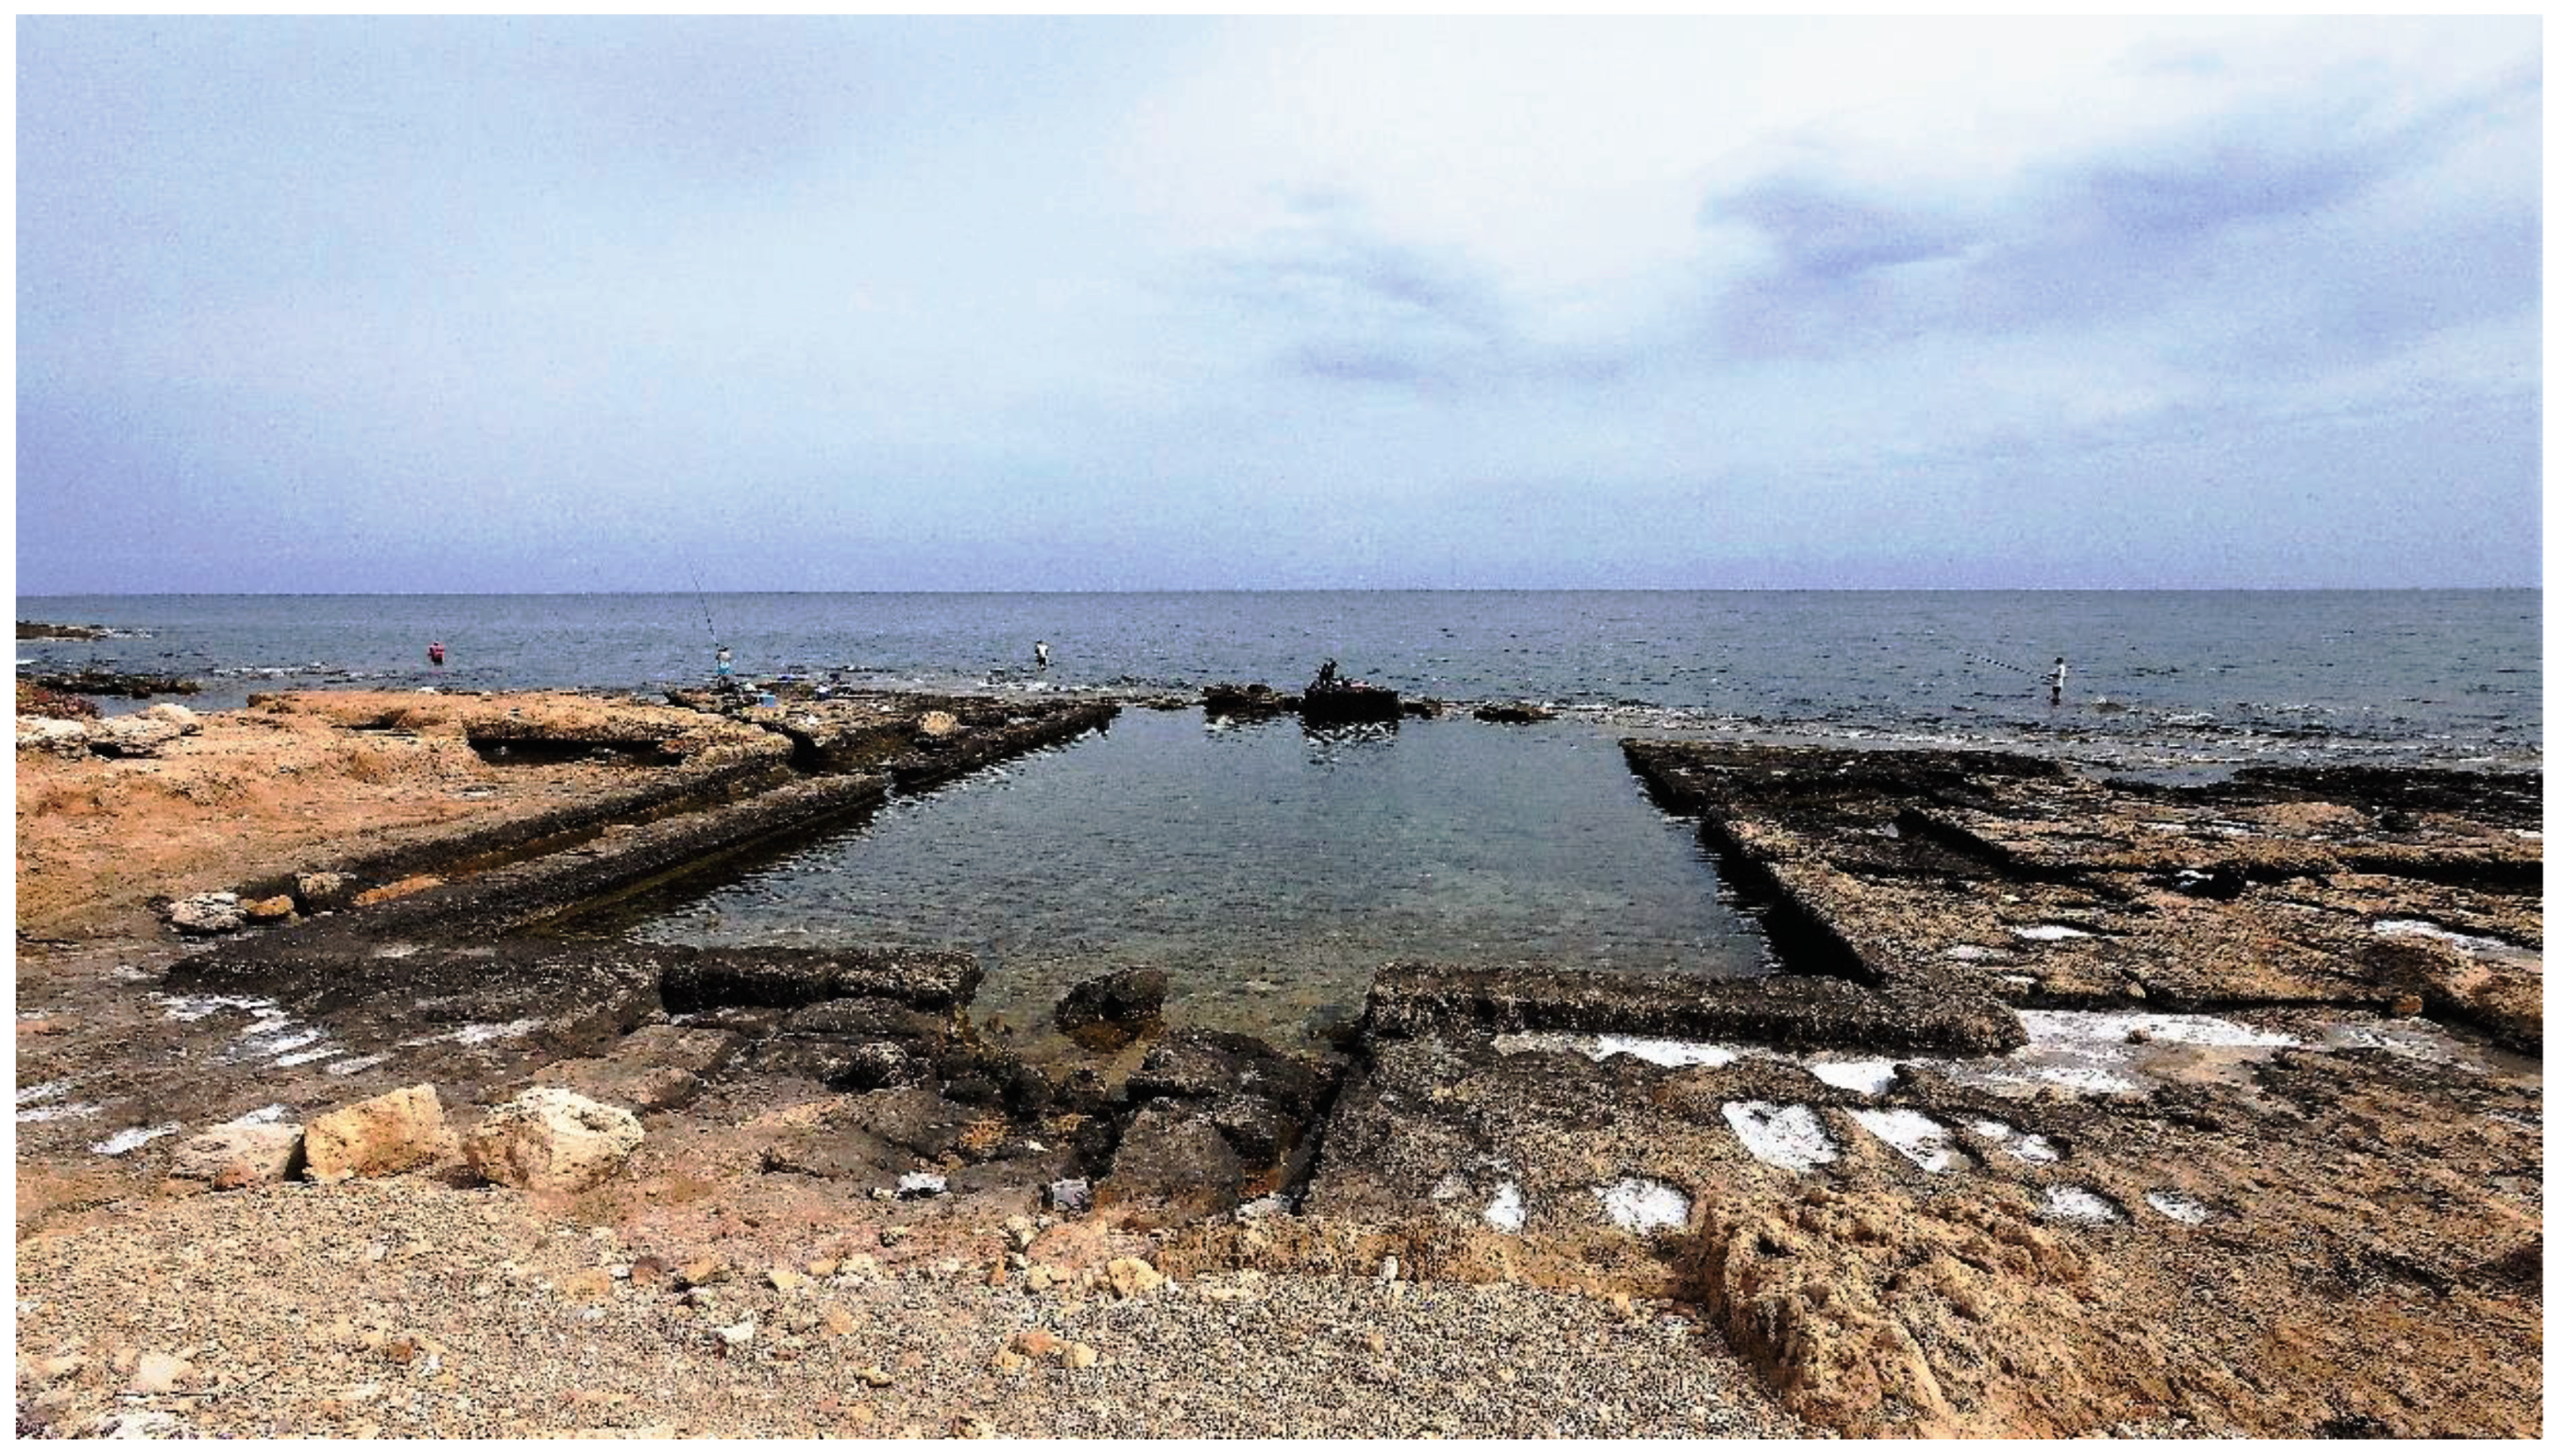
The study site is located on the rocky coast of Karavas village, 10 km west of the city of Keryneia. Flinder [
7] mentioned it as a Lapithos fishtank. He described the tank, the channels, and assumed that the channels provided with double sluicegates (absent today) but does not describe the tunnel probably because it was covered by sand. Then Flinders observed that a wall placed to the north, at the tunnel, was repaired and thus protected the
ft from the waves. At the end, Flinder observed a maximum of 12 centimeters of tide in 24 hours and describes the lateral channels as a supplementary exchange of water in some unfavorable wind conditions. He compared this
ft to those described by [
3] in Torre Valdaliga (Italy) and wrote:
“Lapithos (Lambousa) remained an important city into Graeco-Roman times for we know from Ptolemy, the geographer that in the middle of the 2nd century AD, Lapithos was one of the four districts of Cyprus, the others being Salamis, Paphos and Amathus. Again, a principal oblong tank of similar proportion, contain feeder channels, straddled by secondary tanks, slotted sluice gates, and smaller tanks unconnected to the main tank. Both sites also possess similar traditional names: Caesarea, The pool of Cleopatra, and Lapithos, The pool of the queen.”
Indirectly, therefore, he restricted the chronological attribution to the Roman Age. In the Greek Age there are no known
fts. In particular, all the Tyrrhenian fishtanks (most of those studied) are between the first century BC and the first century AD [
5,
6].
The
ft is carved in a Quaternary marine deposit consisting of a well cemented and fossiliferous calcarenite. From a geological point of view, Cyprus, the third largest Mediterranean island, is notable for its geodiversity and tectonics, both of which have created a unique landscape and natural environment (
Figure 1). [
8] could not have made a more representative statement about the geology of Cyprus and its ophiolite when stating that “one of the most fascinating aspects of eastern Mediterranean geology is the very rapid Plio – Quaternary uplift of the Troodos ophiolite” [
9]. The age of the rocks outcropping on the northern part od Cyprus span from the Permian to the present. Four distinct geological terraces are partly covered partly by surficial sediments. These lands, their lithologies and tectonic history contribute to the shaping of the island.
The tectonic behaviour of Cyprus is commonly considered to be that of a compressional zone between the northward-moving African Plate and the westward moving Eurasian Plate, a tectonic compression that is bound to close the eastern Mediterranean in the geological future. Recent earthquakes show left transpressional motions along the Cyprus arc off SW Cyprus and the Florence Rise, while extensional earthquakes are abundant in the region of southern Anatolia off Cyprus [
10].
Regarding the Late Pleistocene tectonics, [
9] in her Ph.D thesis studied numerous coastal sites on Cyprus where flights of marine terraces range in age from MIS 5.3 to MIS 17. Archiving older work and using new analyses / dating of different methods (Radiocarbon, U\Th, Osl, Ar\Ar, cosmogenic) a total of 21 samples in 14 different coastal sites provide evidence for the uplift rates of MIS 5.5, including the site where the Lambousa
ft is located. Moreover, also Zomeni published figures on the Cyprus terraces, in particular all those concerning the MIS 5.5 transgression. Regarding the Late Pleistocene tectonics,
Figure 2,
Figure 3,
Figure 4,
Figure 5,
Figure 6 and
Figure 7 of Zomeni 2012, shows the vertical distribution of marine terraces in 17 different coastal sectors around the island. The marine terraces related to the MIS 5.5 transgression are found at elevations between +1.8 and +32 meters above present sea level. These terraces have been dated with ESR or U\Th or we determined as MIS 5.5 because they contain
Persistrombus latus or other Senegalese fauna. For a large area of the north coast of Cyprus (where the Lambousa
ft is located), [
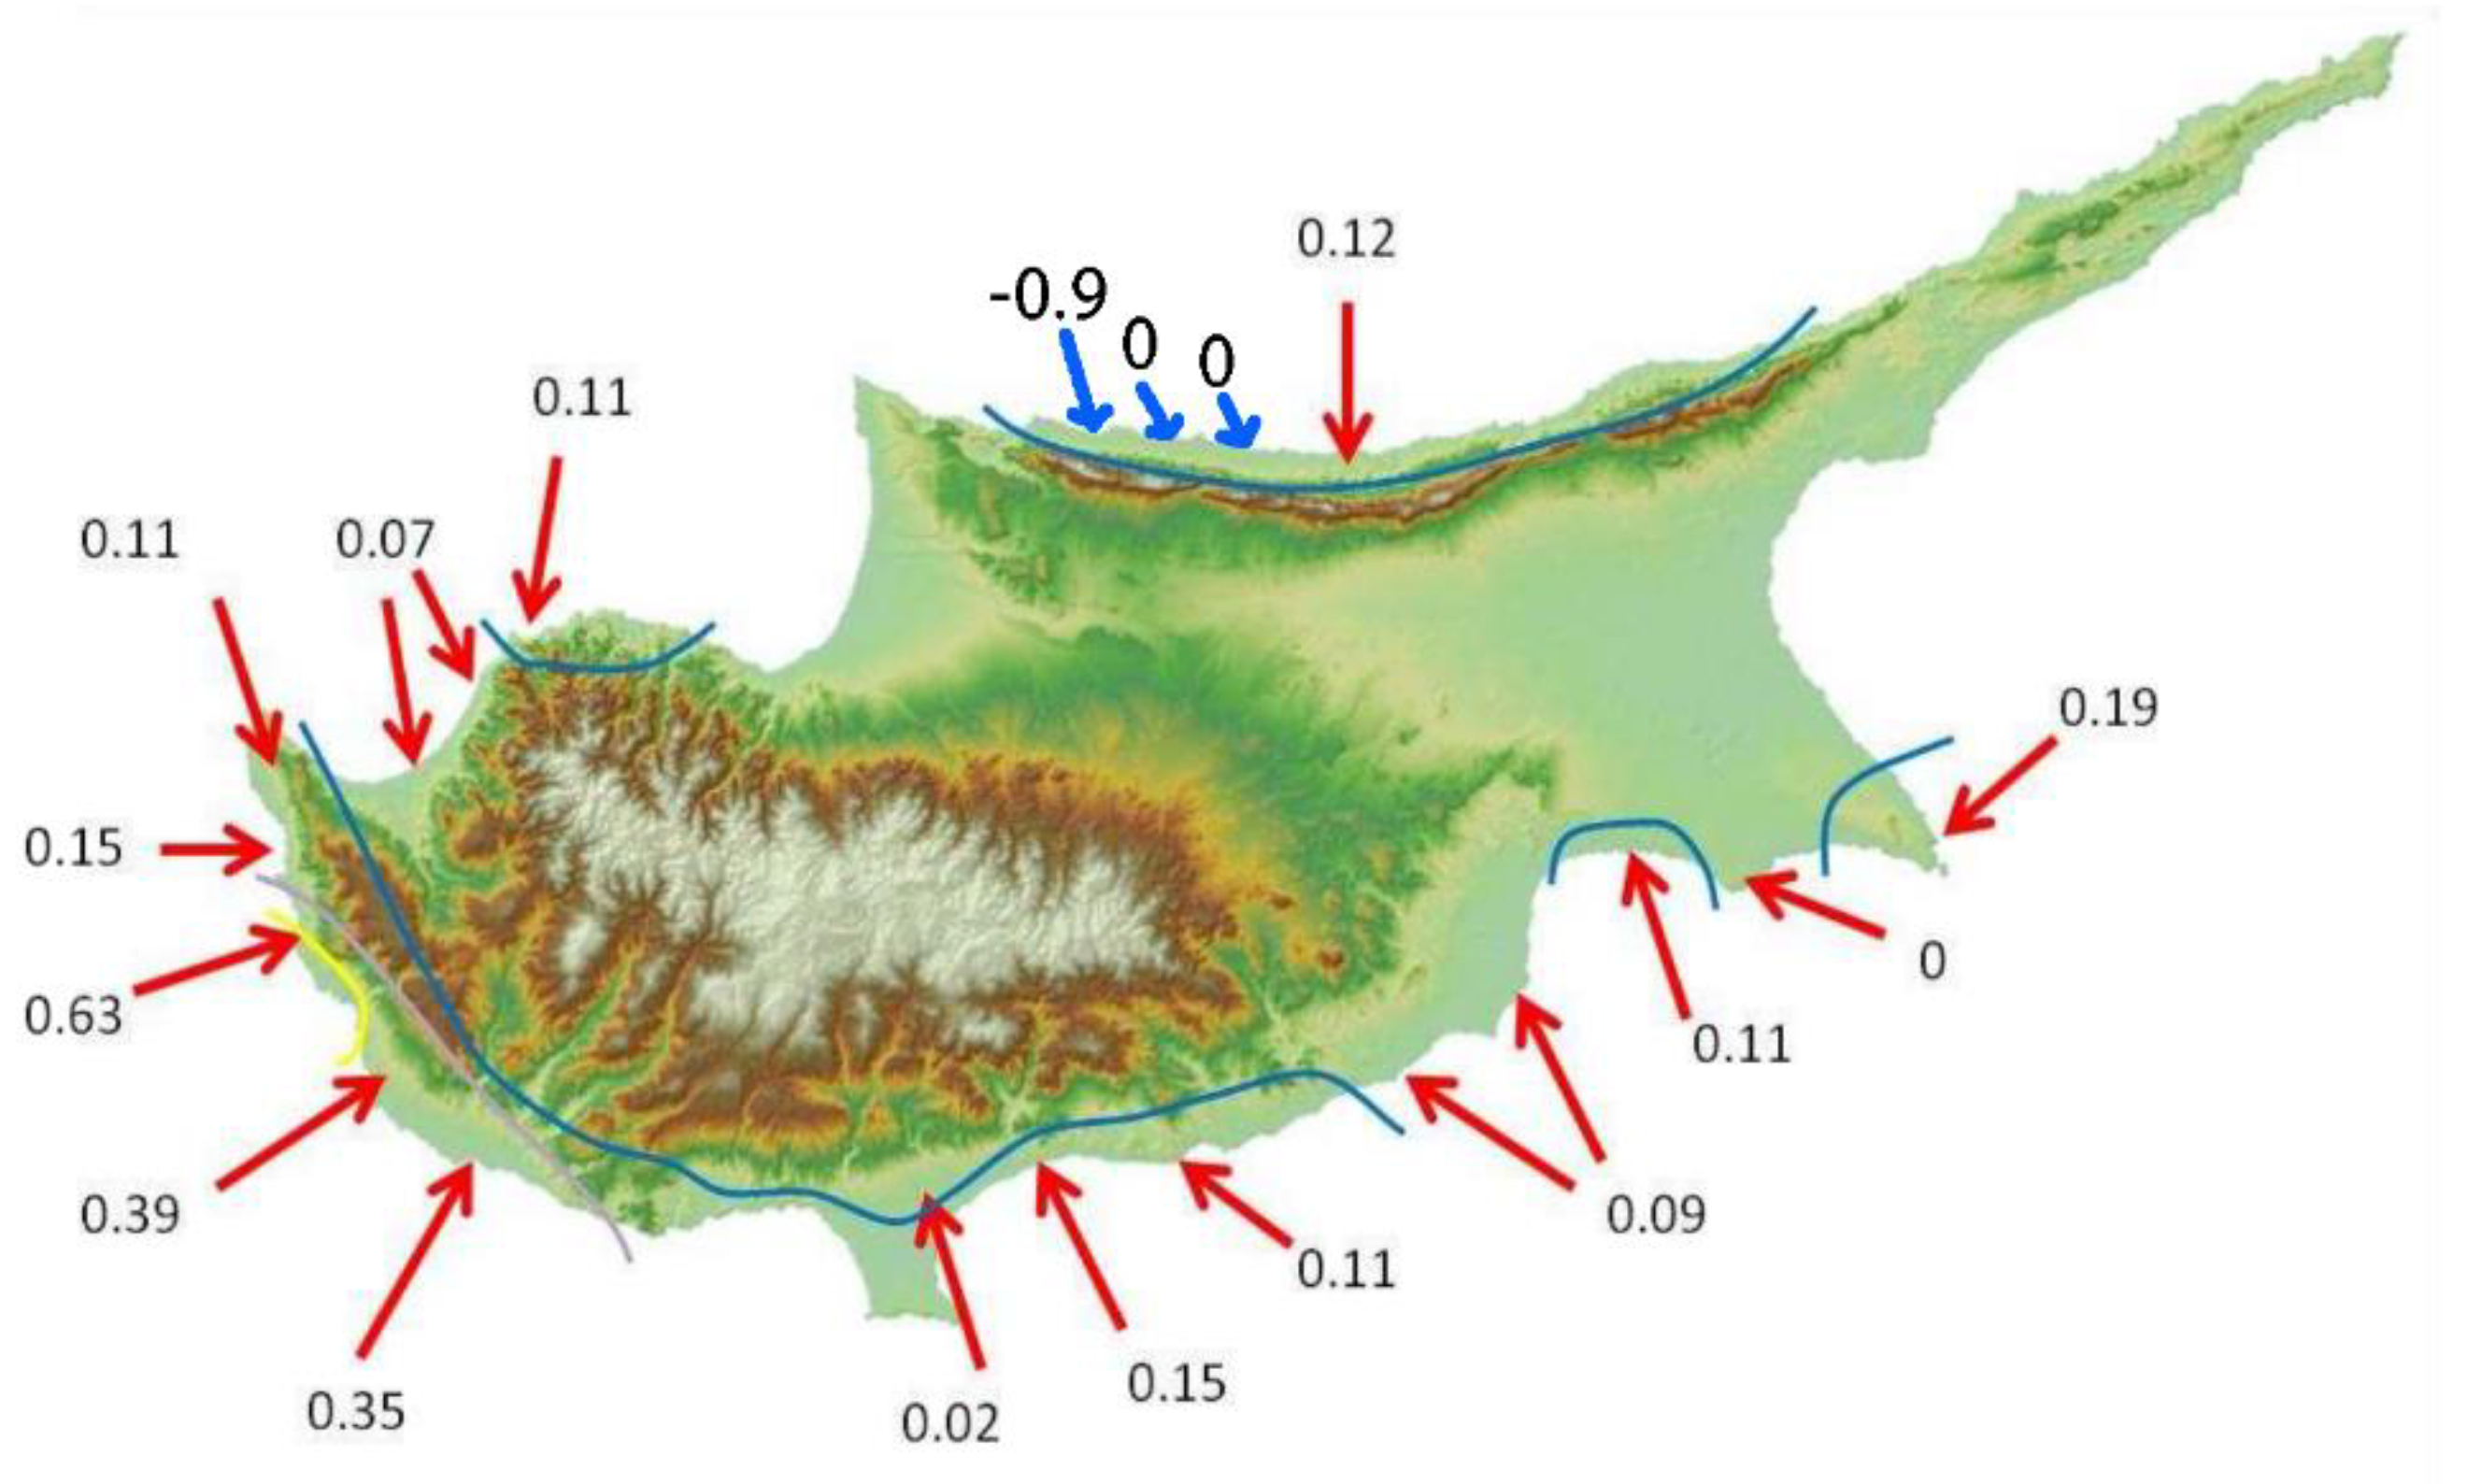
9] provides an uplift rate of 0.12 mm/year. [
1] studied 22 MIS 5.5 sections, including a site (site number 9) at Lambousa. By combining already published dating results with several new observations and analyses, he provided uplift rate on the terraces.
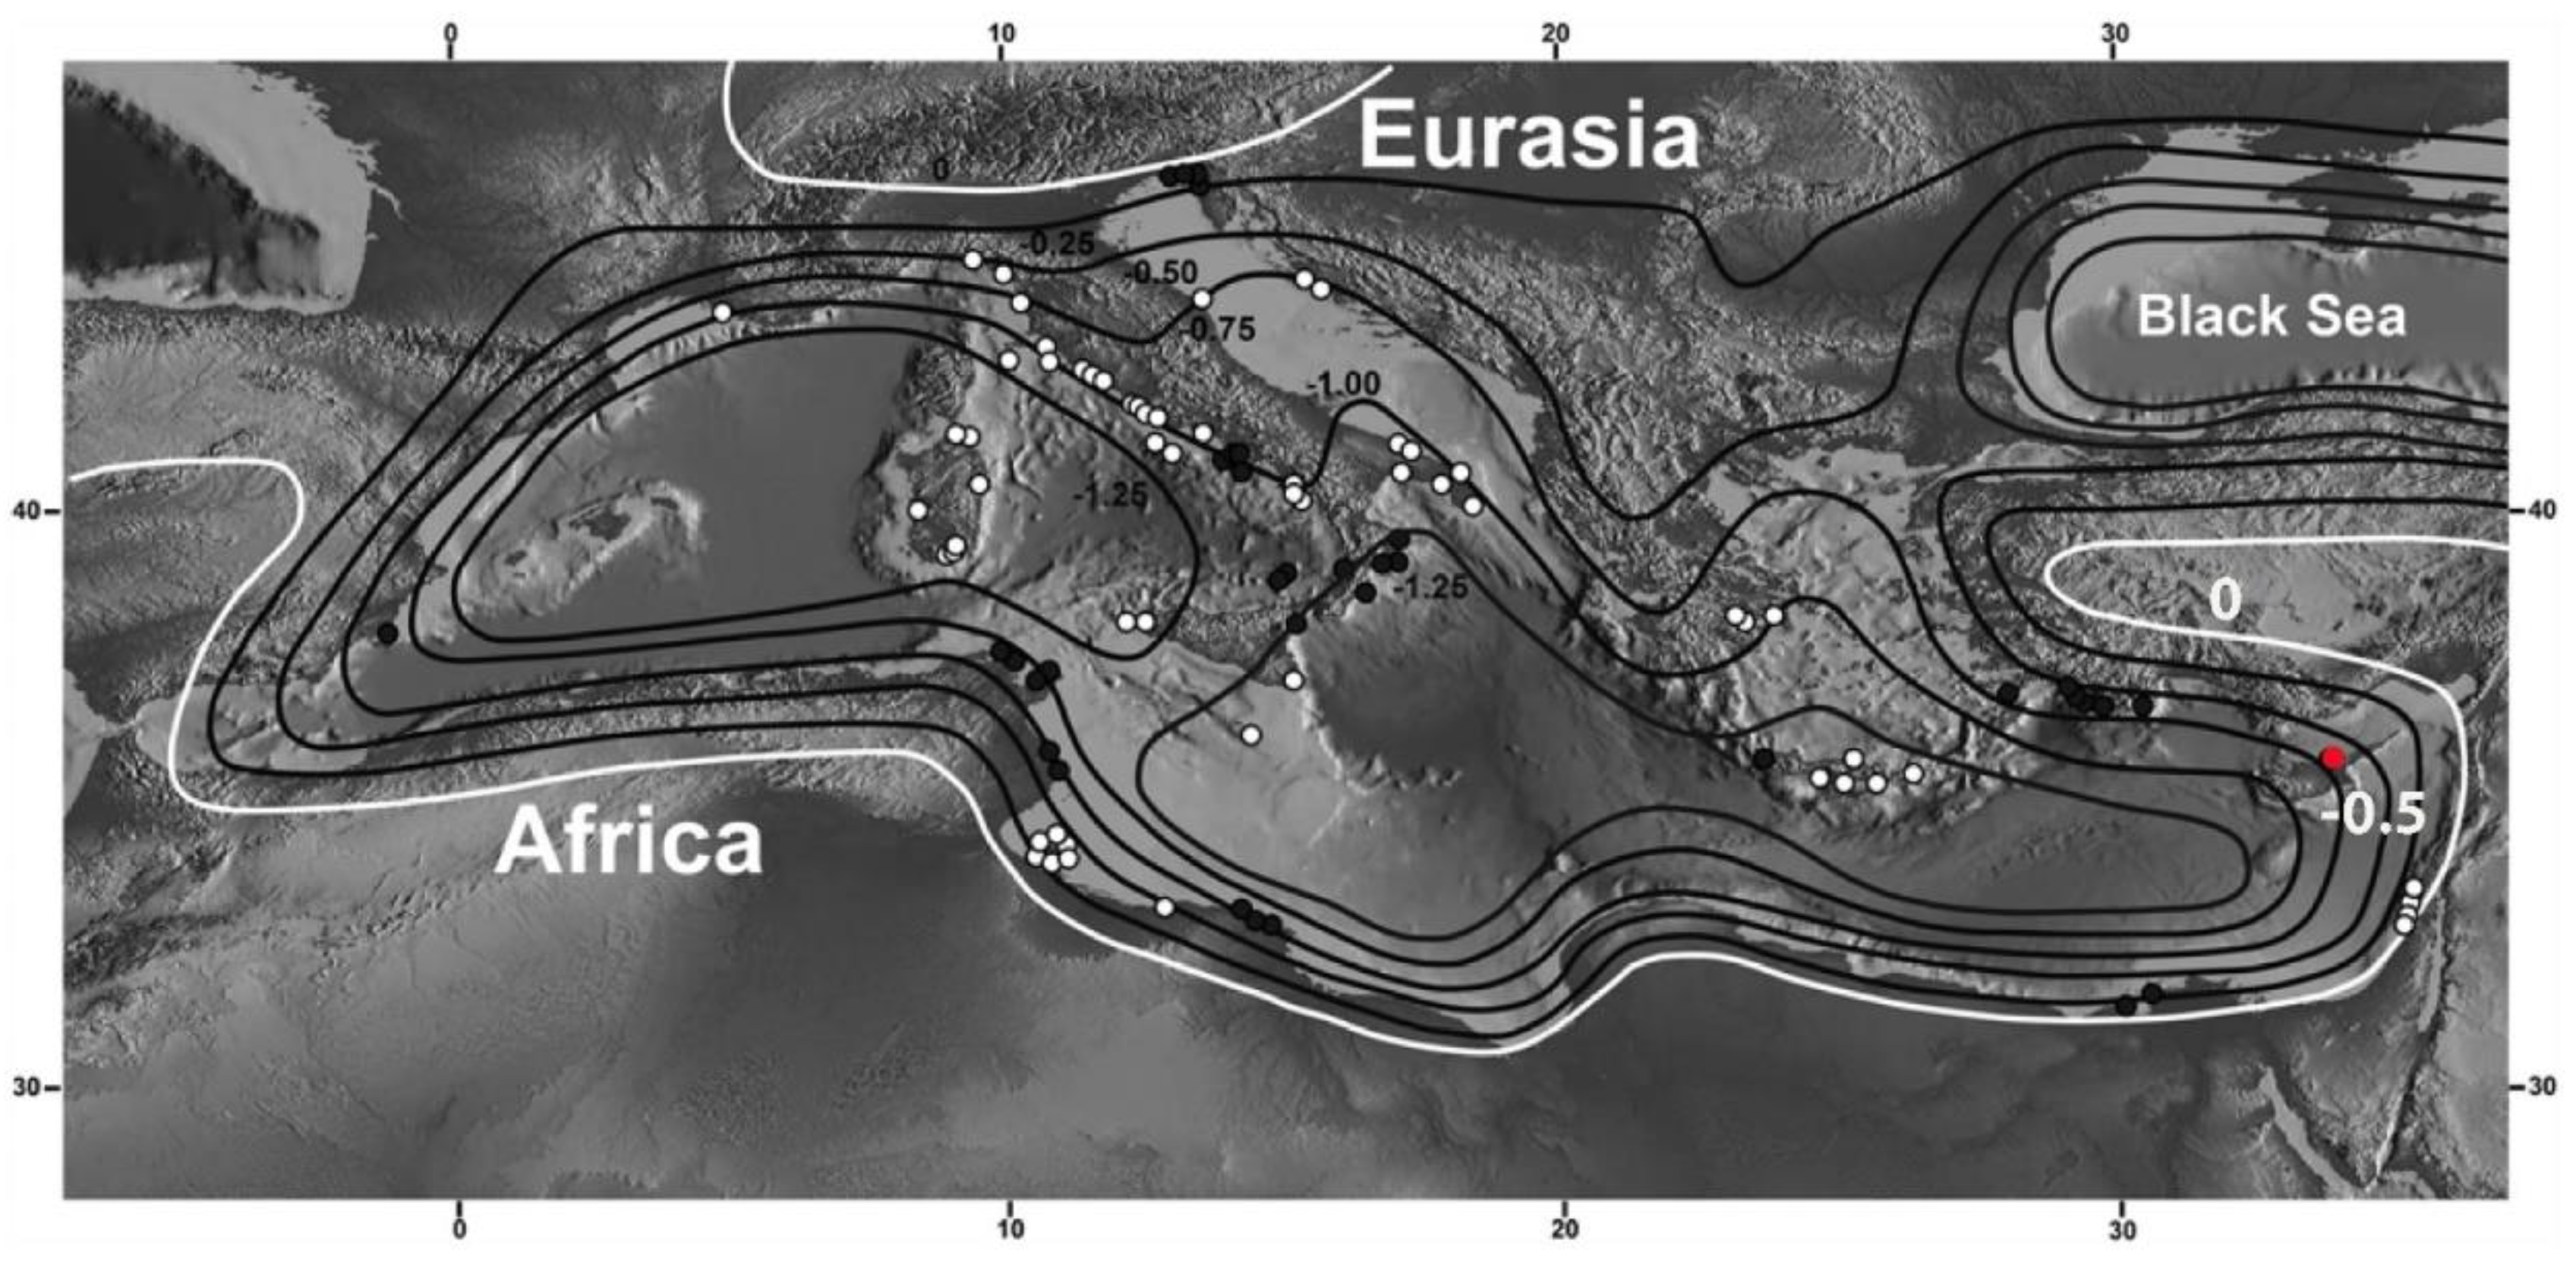
In
Figure 3 we combine these observations with those of [
9] for the coastal area of the Lambousa
ft (
Figure 3) and the deposits.
3. Materials and Methods
3.1. Surveys
The survey of the Lambousa fishtank was carried out using a metric-rod to measure the size of the entry hole (located at the northern part of the
ft) and measurements on the
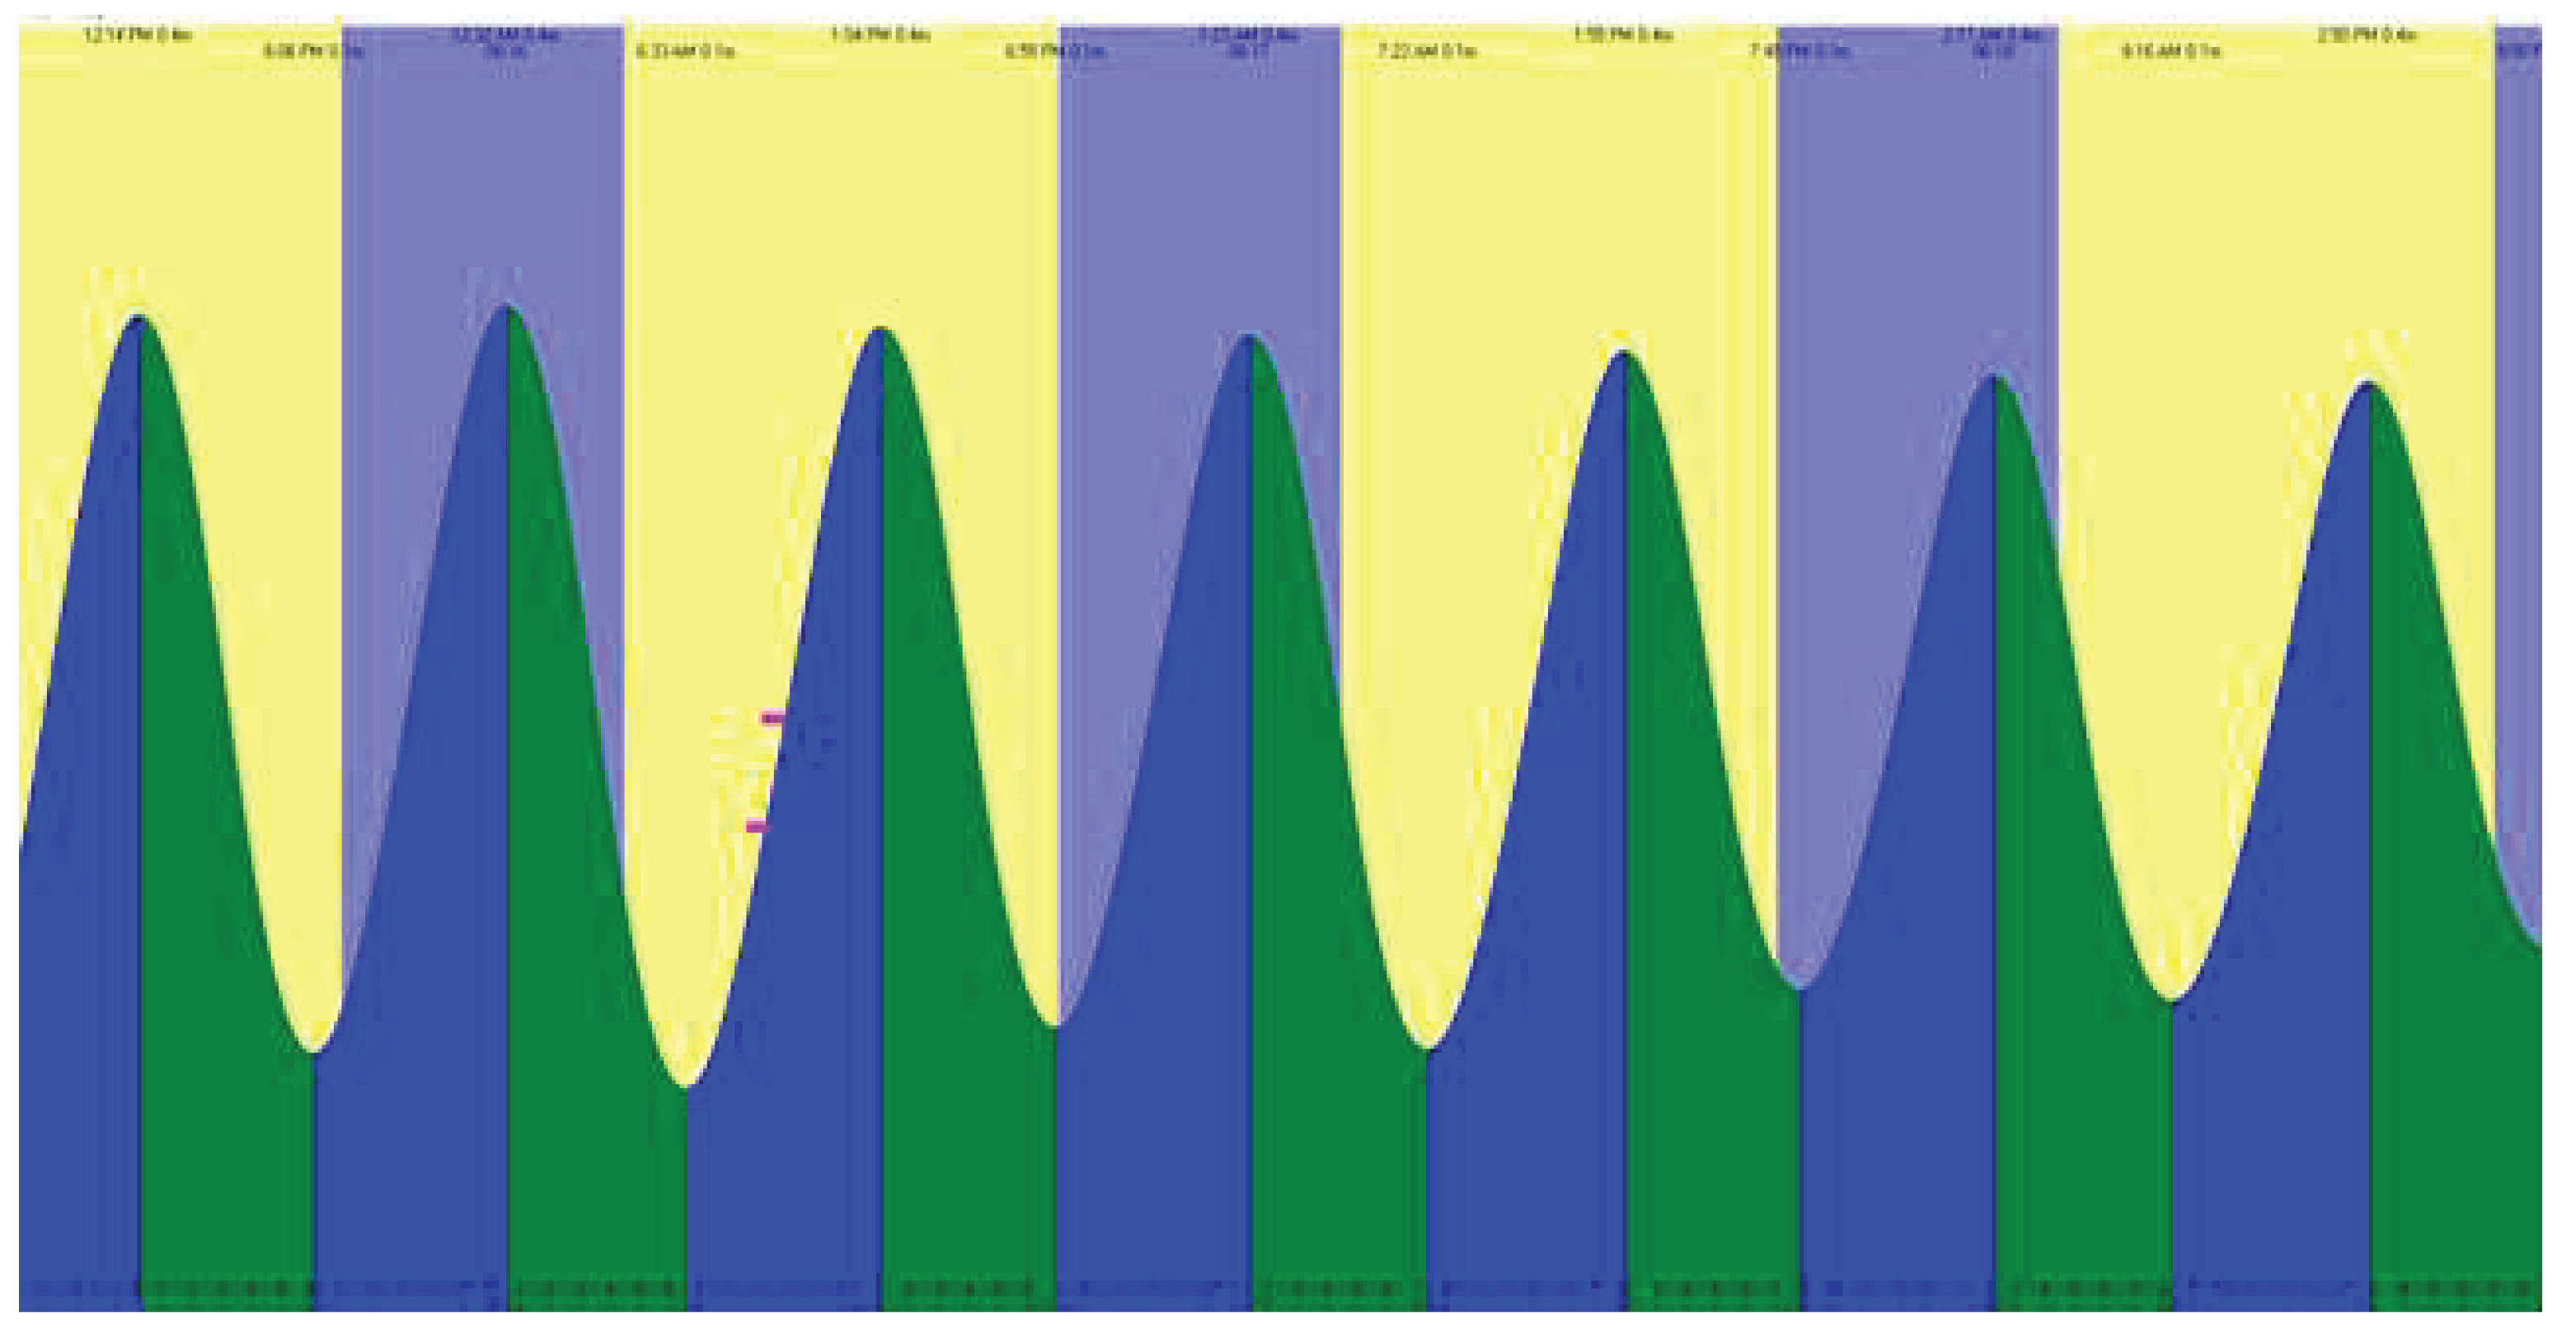
Crepido. The altitudes were corrected for the tide using prediction from the Xtide site (
https://flaterco.com/xtide/files.html#xtide, see
Figure 4). The atmospheric pressure during the measurements on site was 1016 bar, therefore no correction for pressure has been made.
3.2. GIA
The history of relative sea-level at the site of Lambousa has been reconstructed using a suite of GIA models based upon a numerical solution of the Sea Level Equation (SLE), adopting the SLE solver SELEN 4 of [
11]. SELEN4 solves the SLE through the pseudospectral approach, assuming a laterally homogeneous, spherical, incompressible and self-gravitating Earth characterized by a Maxwell rheological law. It accounts for horizontal migration of shorelines (e.g., [
12]) and for the effects of rotational feedback on sea-level, according to the revised theory of [
13]. We obtained predictions of past sea level at the Lambousa site by integrating into SELEN^4 the GIA models ICE-6G (VM5a) of [
14], ICE-7G (VM7) of [
15] and one of the models progressively developed by the Australian National University (ANU) by Kurt Lambeck and collaborators (see e.g., [
16]). Since the Mediterranean basin is characterized by a complex geodynamic setting whose rheological structure is likely to significantly depart from the globally averaged 1D profiles employed in GIA models, it is important to estimate the sensitivity of GIA predictions to possible variations of the rheological model [
11,
17]. To this aim, we evaluated the uncertainties associated to GIA predictions from ICE-6G and ICE-7G by generating two random ensembles of 10,000 GIA models based on perturbations of the VM5a and VM7 viscosity profiles, while for the ANU we considered the mini-ensemble of 7 GIA models employed by [
16] for the Mediterranean basin.
4. Data
4.1. Field Data,
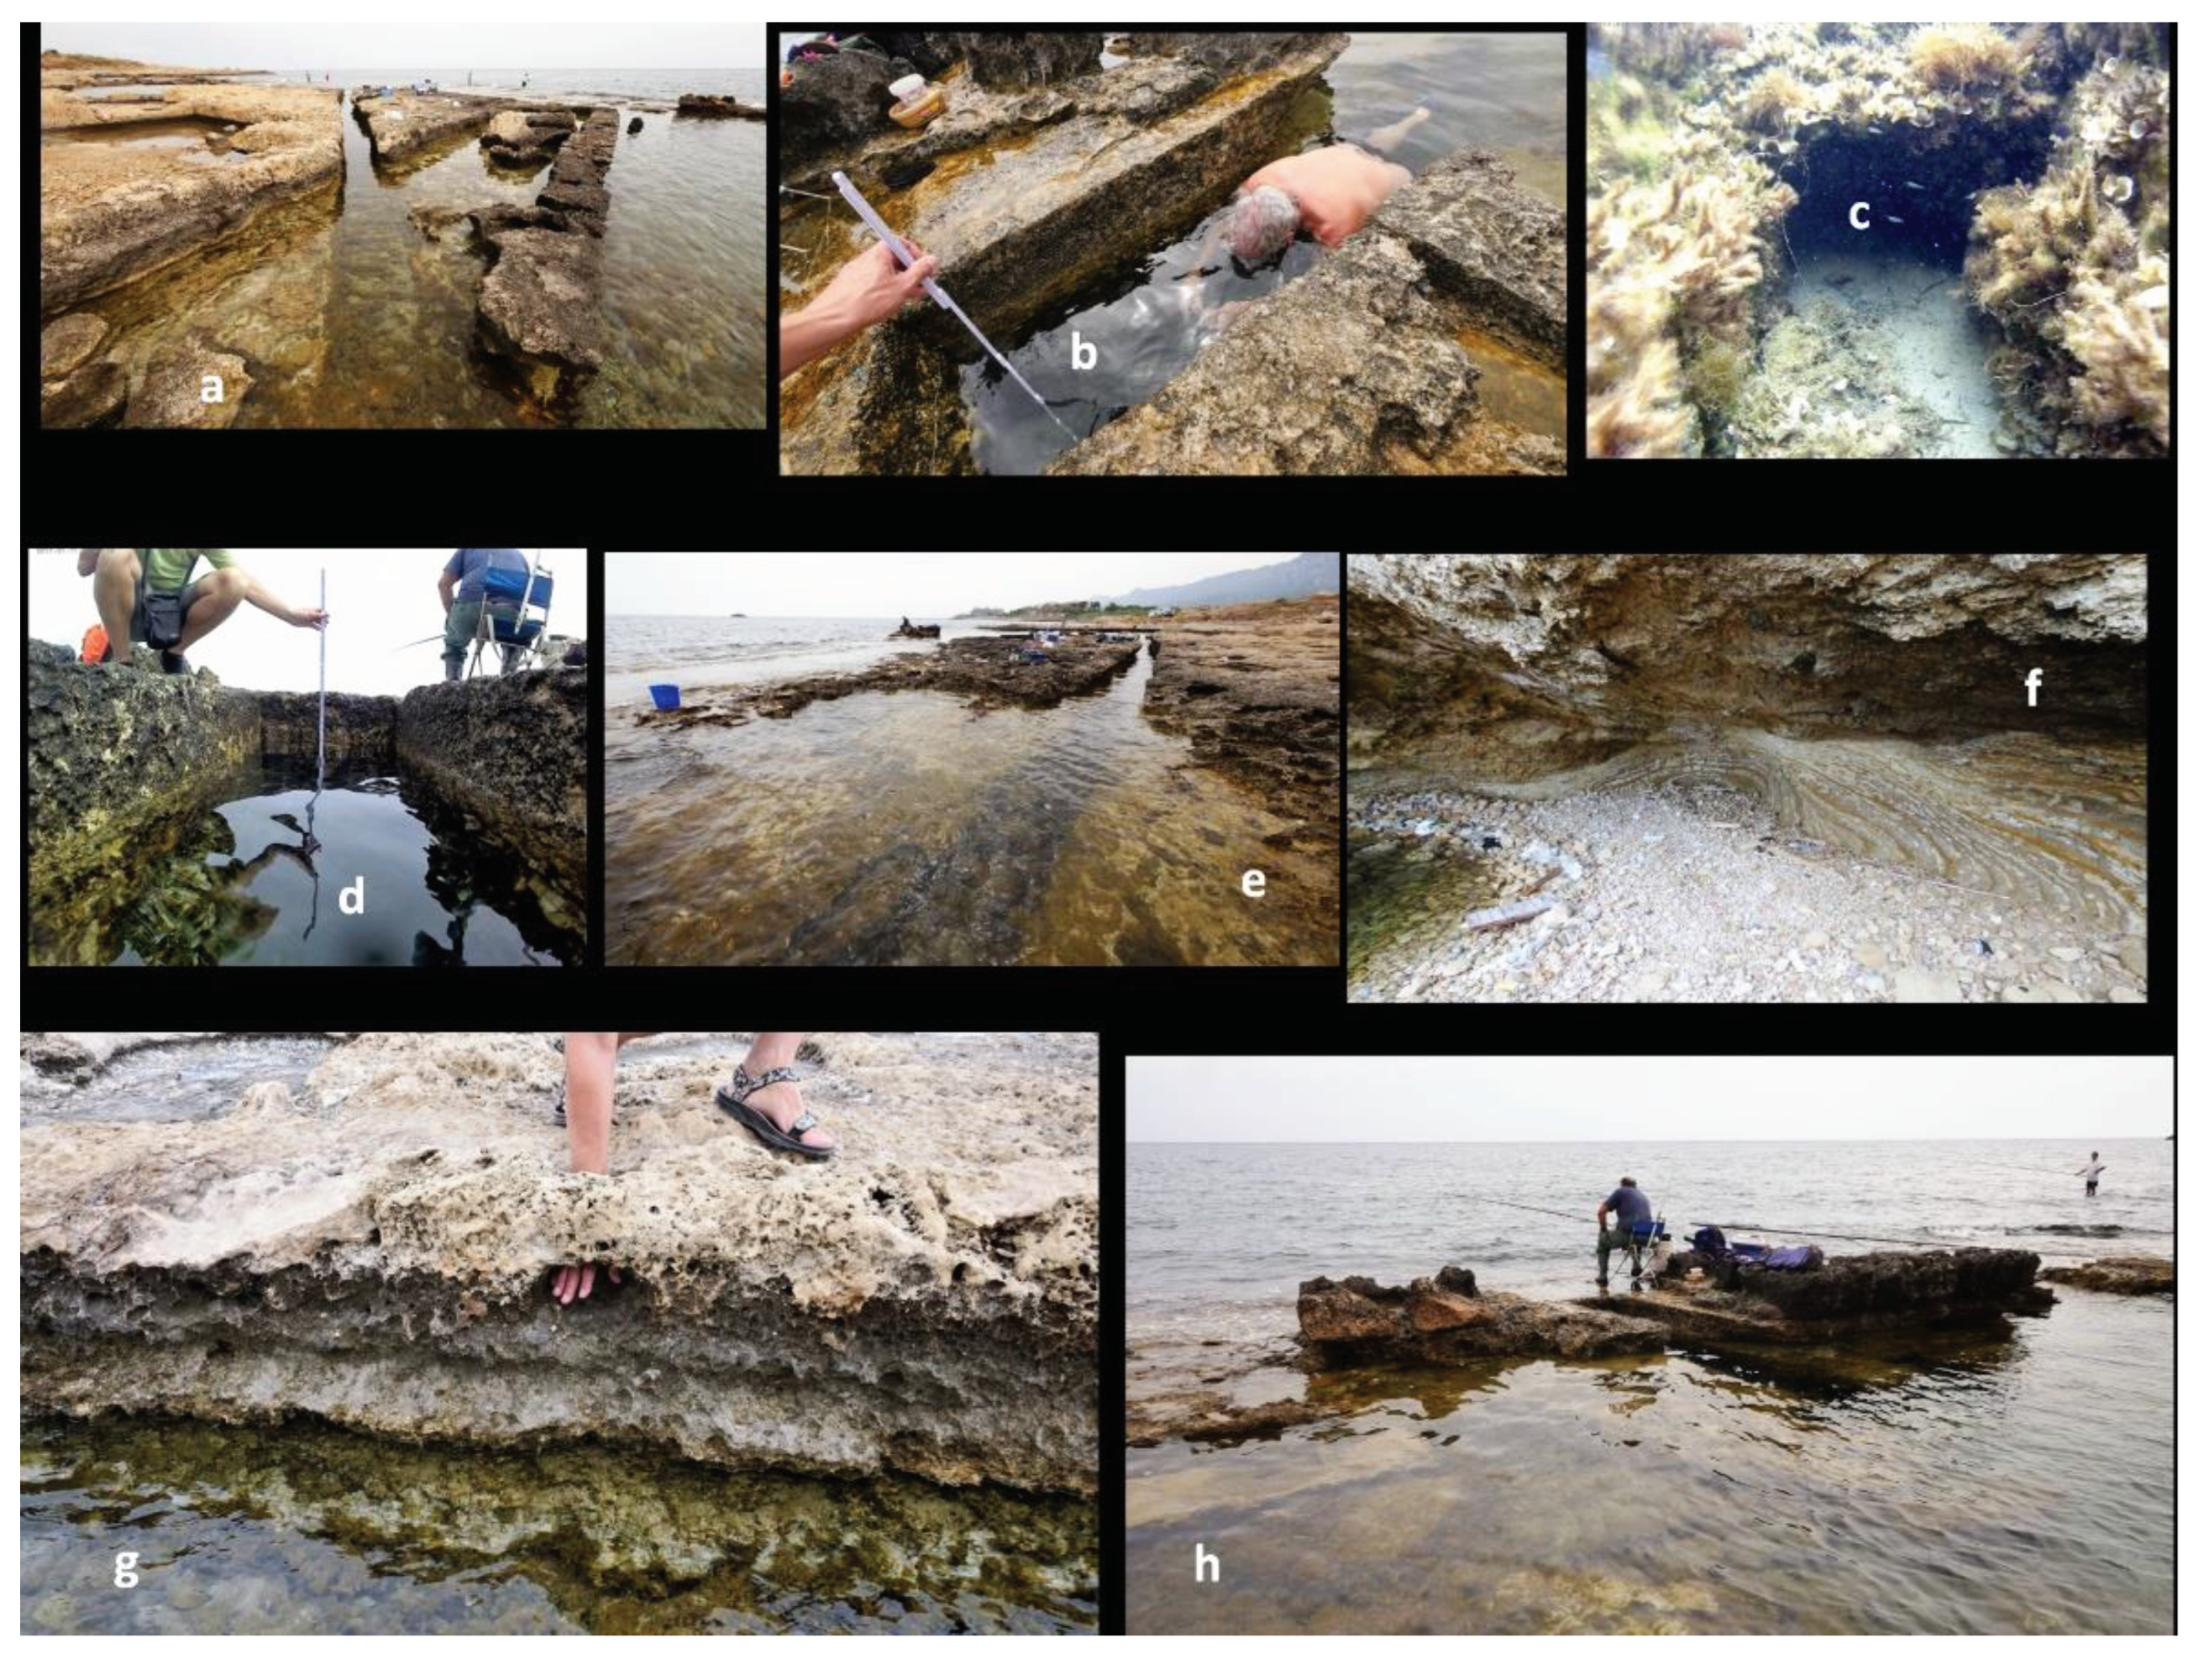
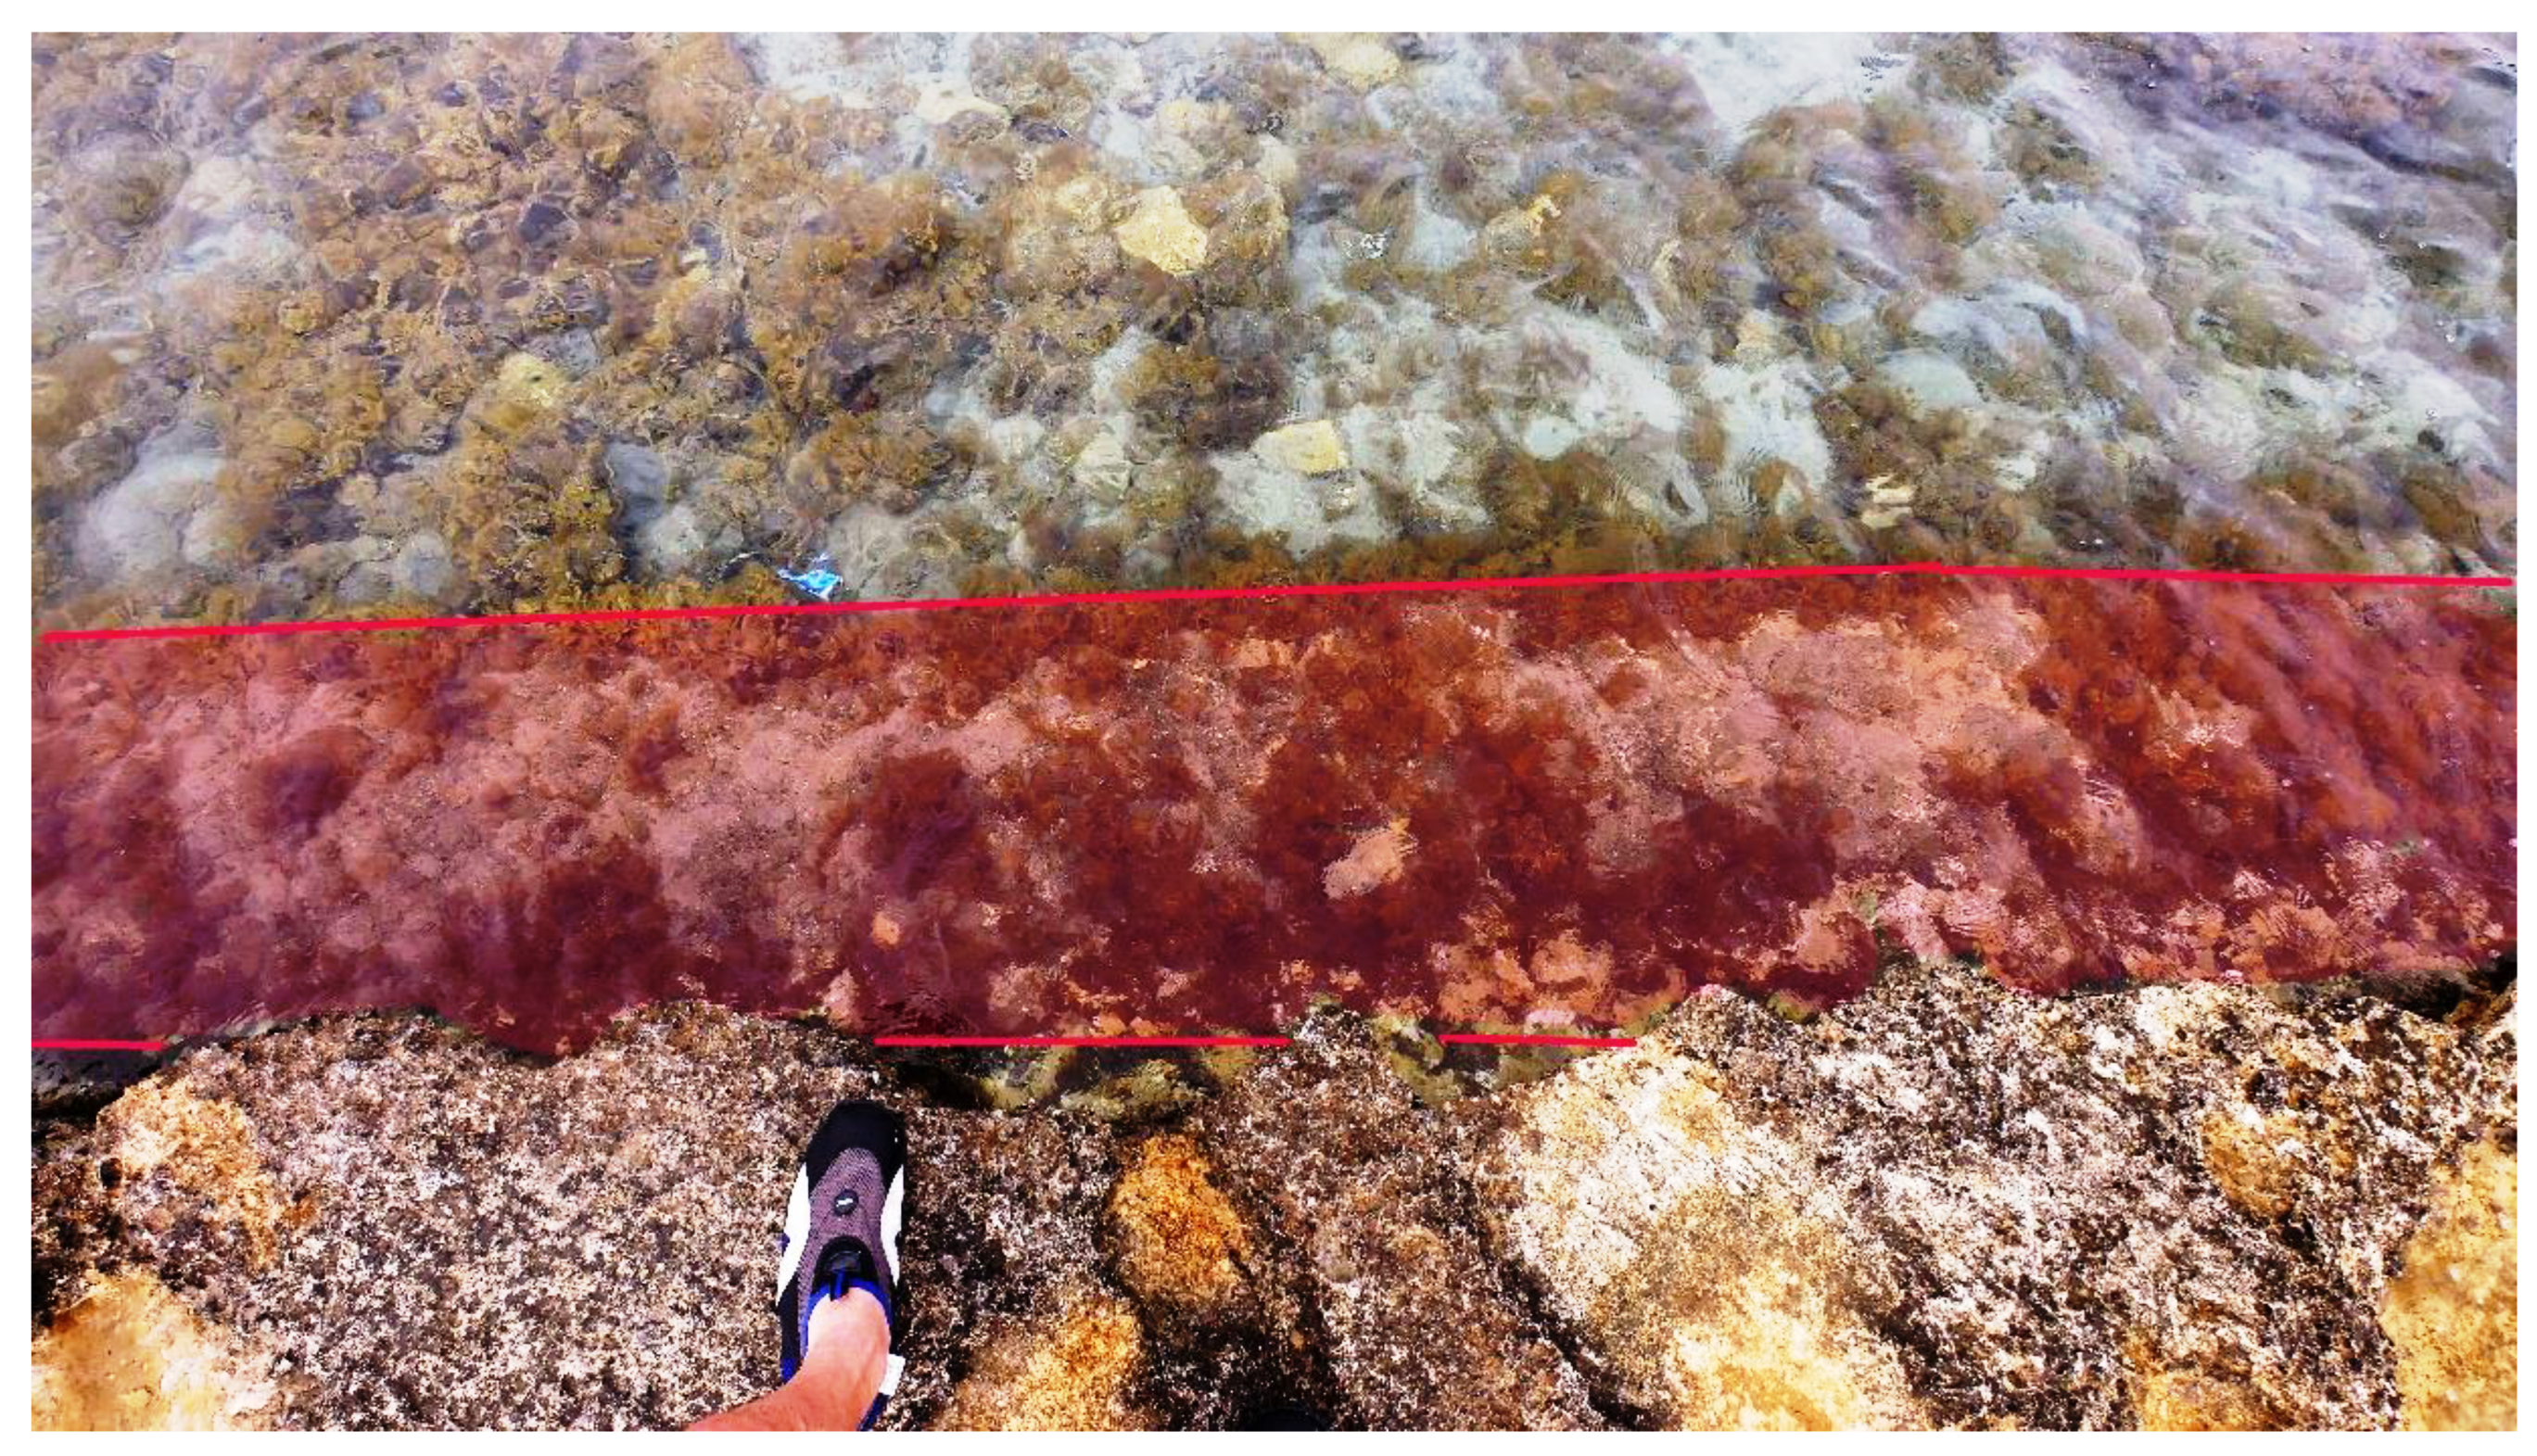
We obtained new data with simple observations, photographs and measurements using a meter stick, of some archaeological markers on the
ft (
Figure 5 and
Figure 6). In particular we found: a
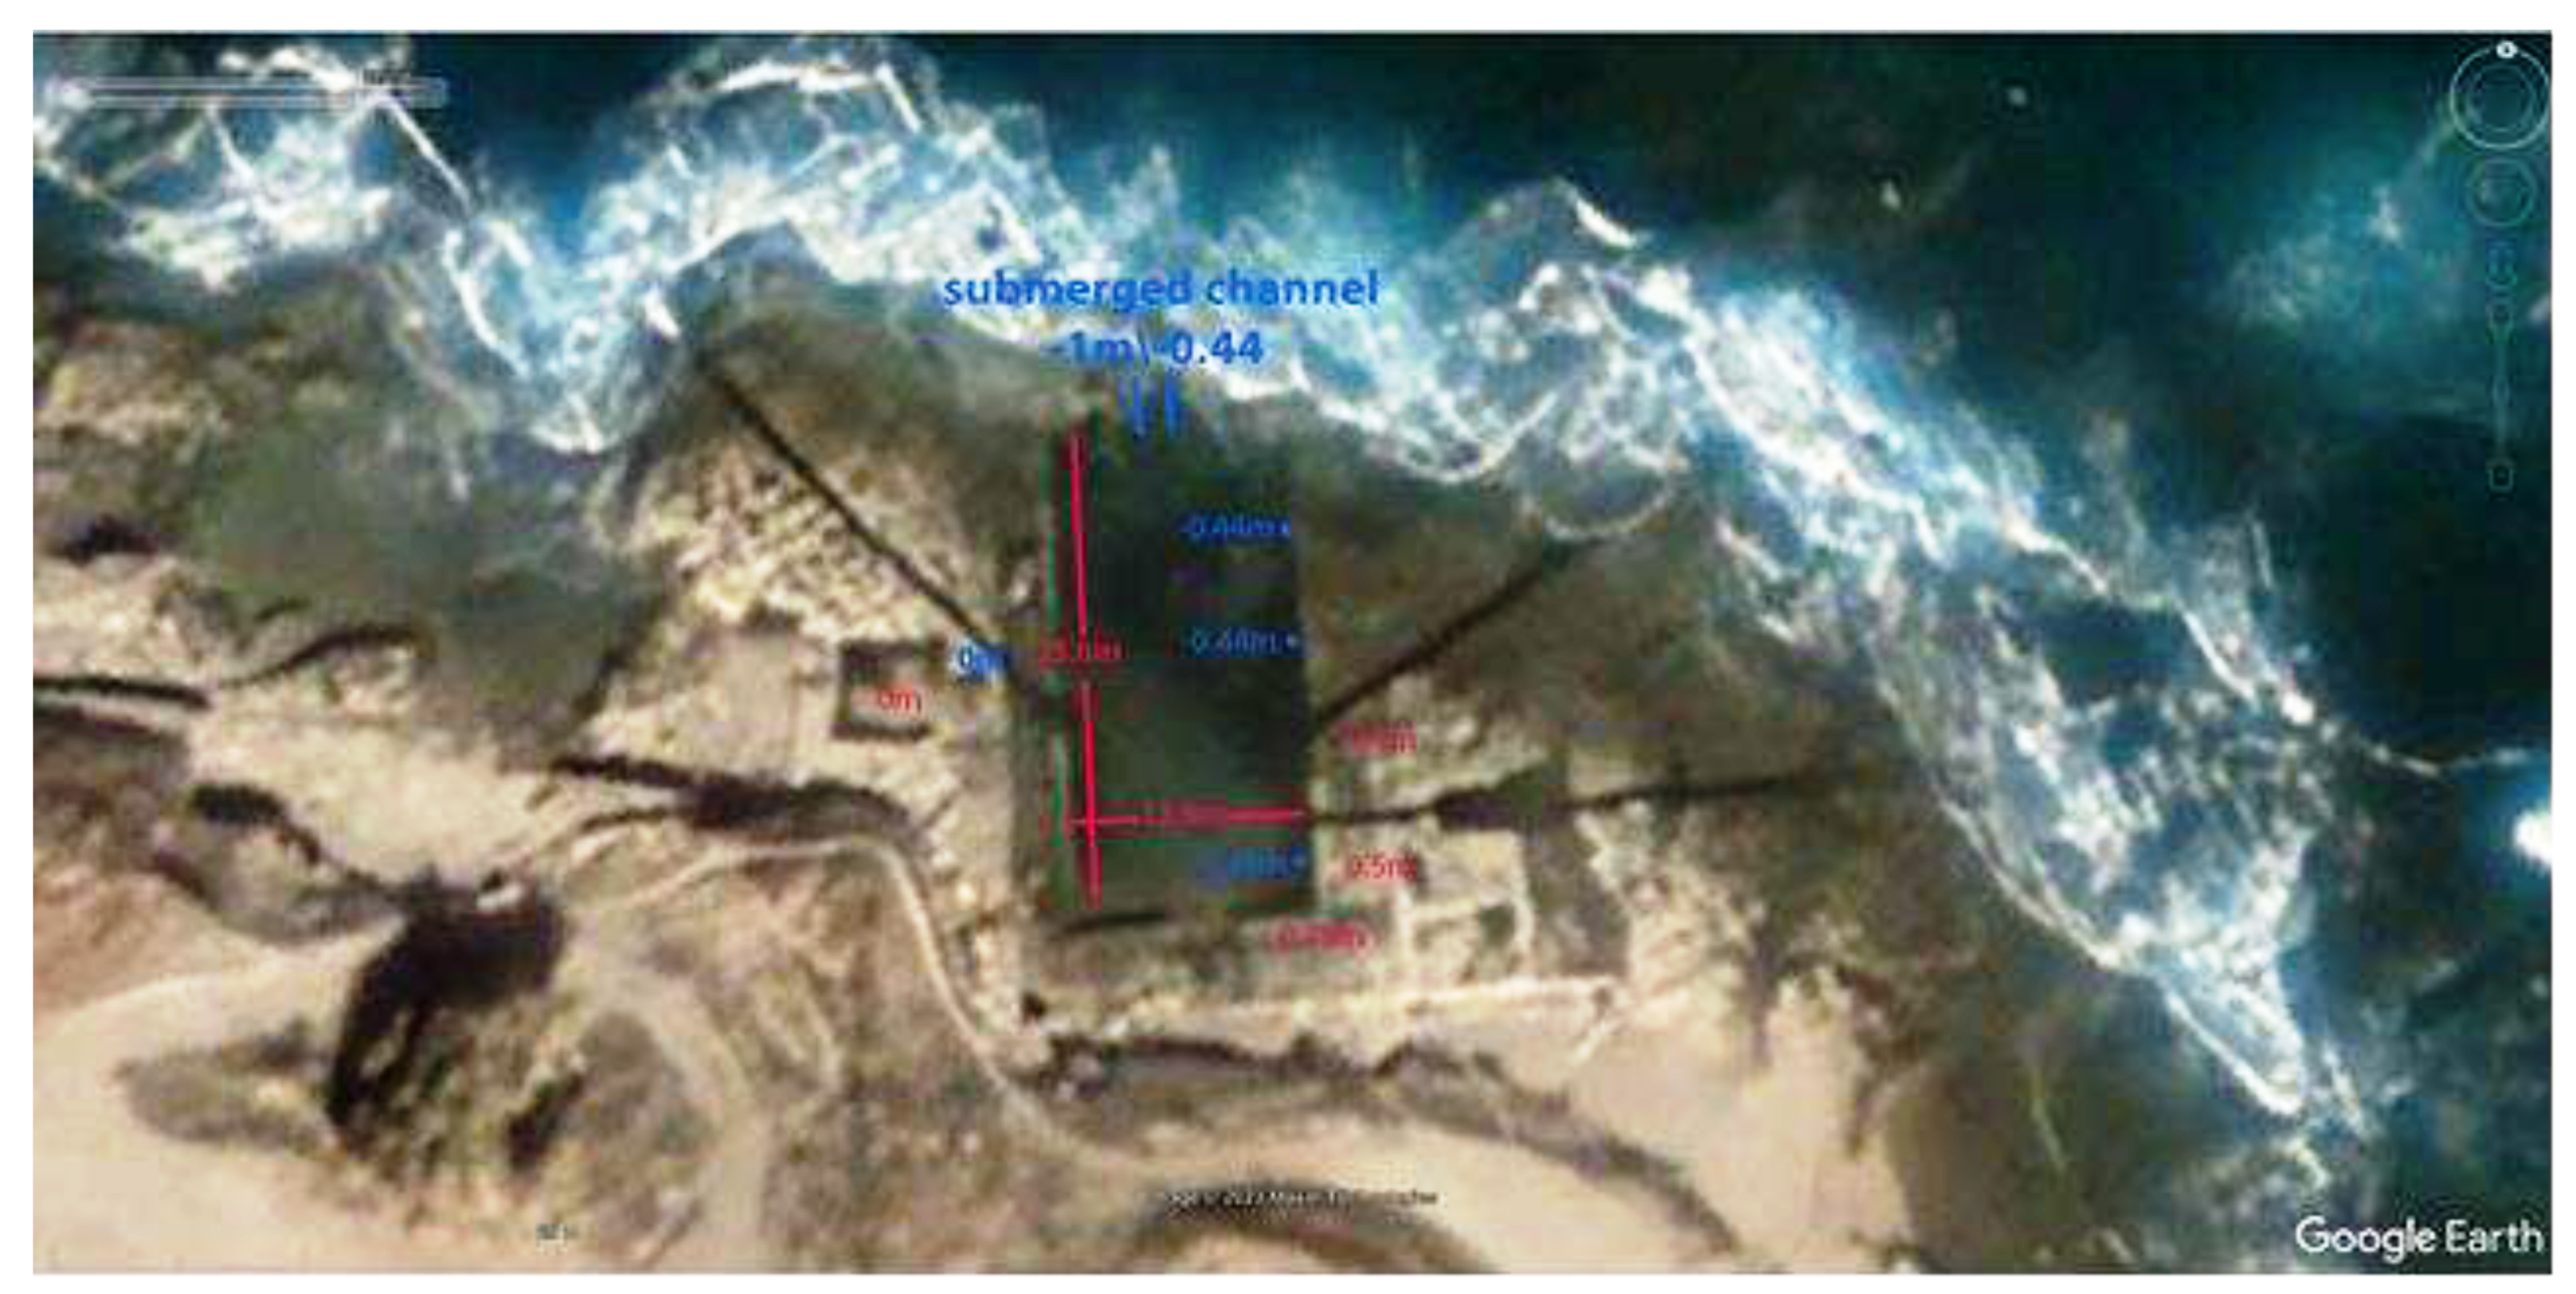
Crepido at -0.44 m from sea level at the time of measurement, and an “exit inlet” hole of the sea water between -0.44 high and -1.0 m (
Figure 6b–d).
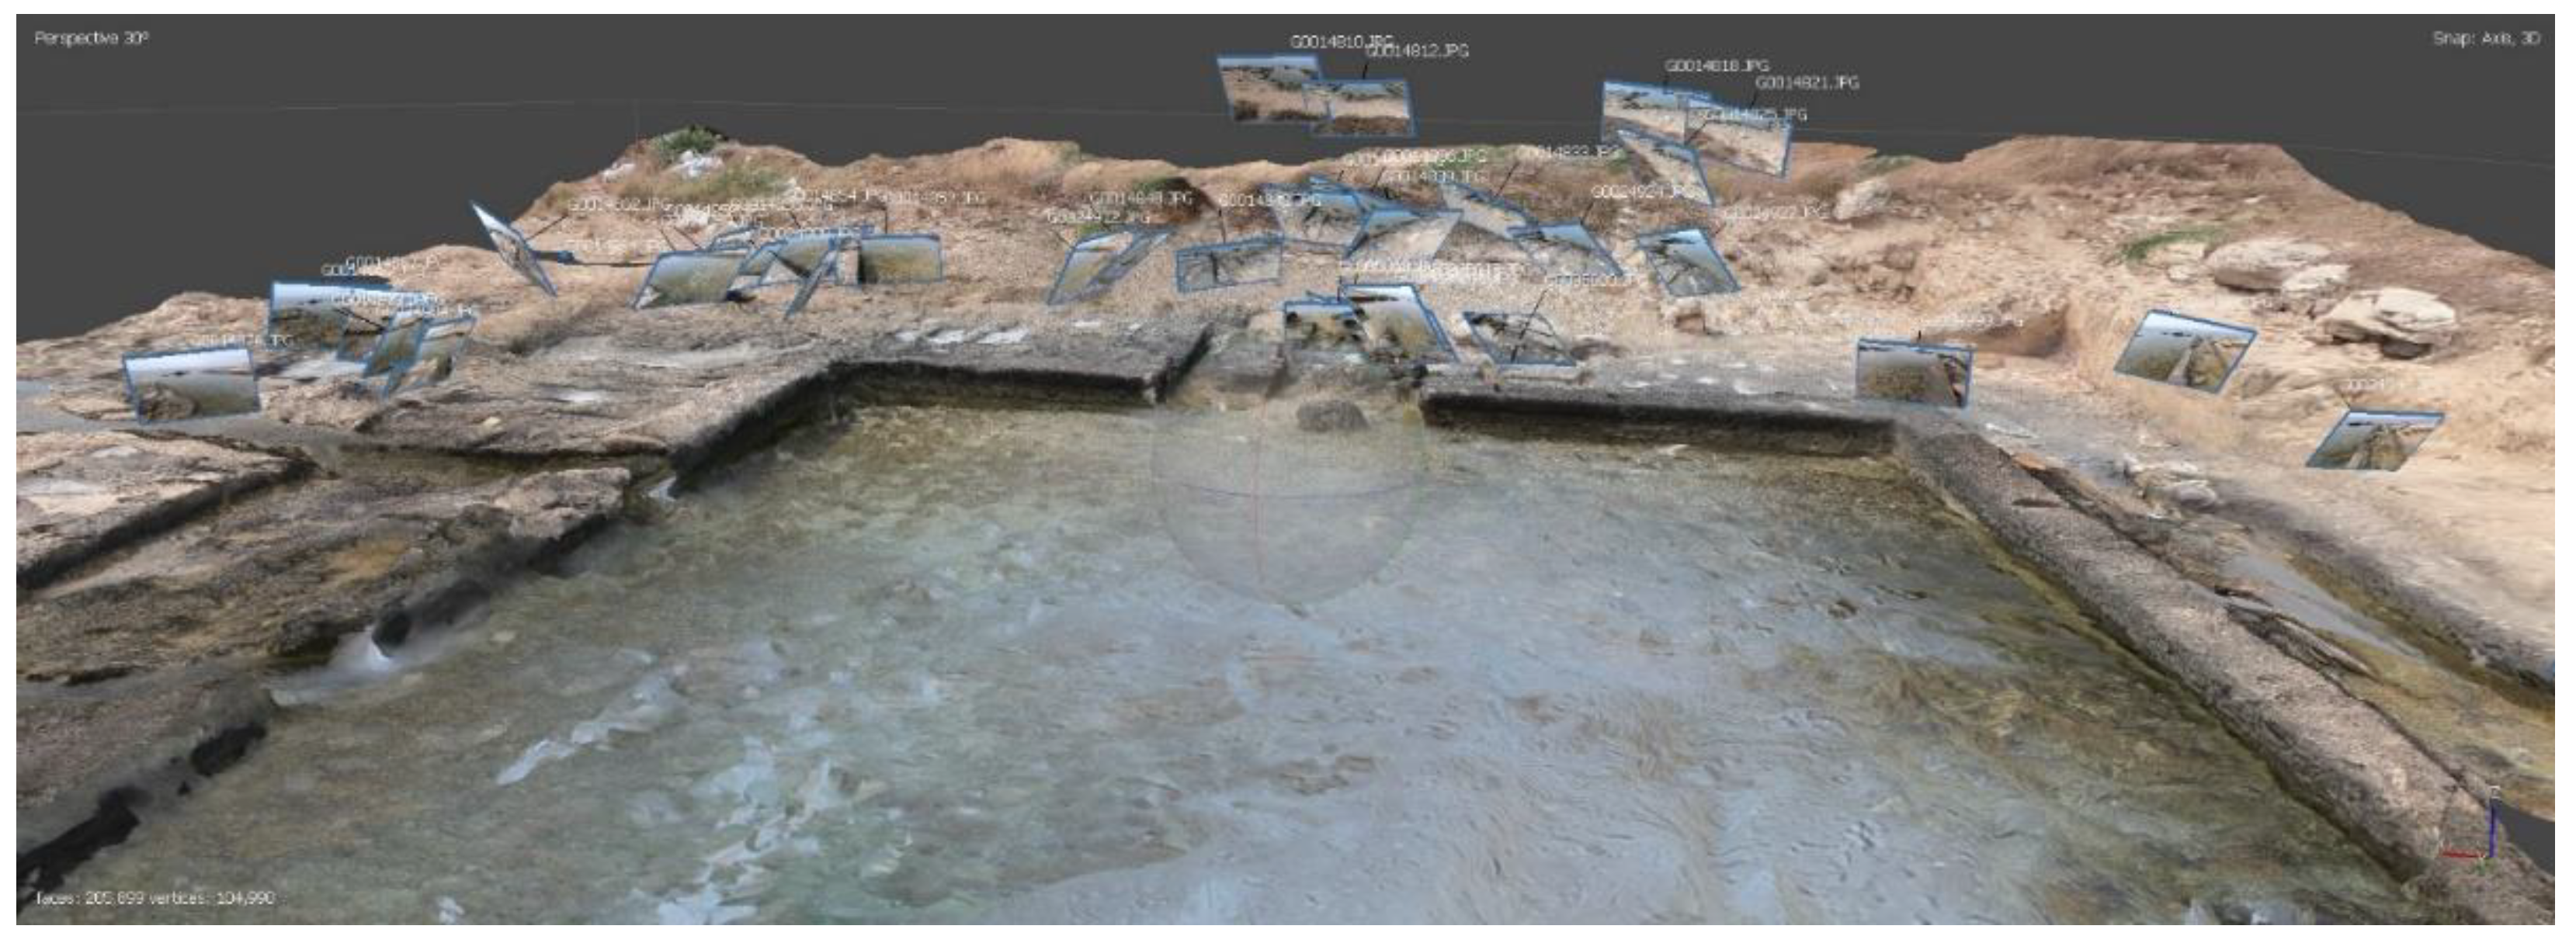
We measured the
Crepido (
Figure 7,
Figure 8 and
Figure 9) at 9.15 a.m. in the morning: -0.44 m from sea level showing dimensions similar to same archaeological markers studied and measured in other Mediterranean fishtanks [
5]. The
ft bottom, certainly deeper than 2 meters, is today filled with stones and sand. In the long lateral channels (
Figure 6a and
Figure 7, as also described by [
7], it is possible to note sluicegates which regulated the flow of the water and presumably prevented the escape of fish. We found one of the most interesting points on the northern portion of the
ft where a tunnel about 2 meters long has a minimum width towards the outside of about 50 cm and can be seen both inside (dimensions between -1.0 m and -0.44 m). This tunnel currently works as a replacement, while the long external canals are silted up and partly filled with stone, they are no longer functional.
We corrected for the tide (according to Xtide model) the measurements we made on 16 June 2016 bar: the tide at 09-00 was 0.18 m, while at 10: 30 was 0.28 m (above zero) on 16-06 the minimum was 0 m the maximum 0.4 m. The pressure was 1016 units? measured with an instrument so no corrections have been applied.
The measurements we carried out around 9.15 a.m. at the Crepido and at 9.45 a.m. on the tunnel must therefore be corrected and decreased by 0.18 m for the Crepido and 0.22 m for the tunnel and then corrected to -0.26 and -0.78 meters respectively. The mean sea level at about 2 kyr BP of the ft was therefore to be found at an average altitude between these two measurements: -0.52 m.
4.2. GIA
In
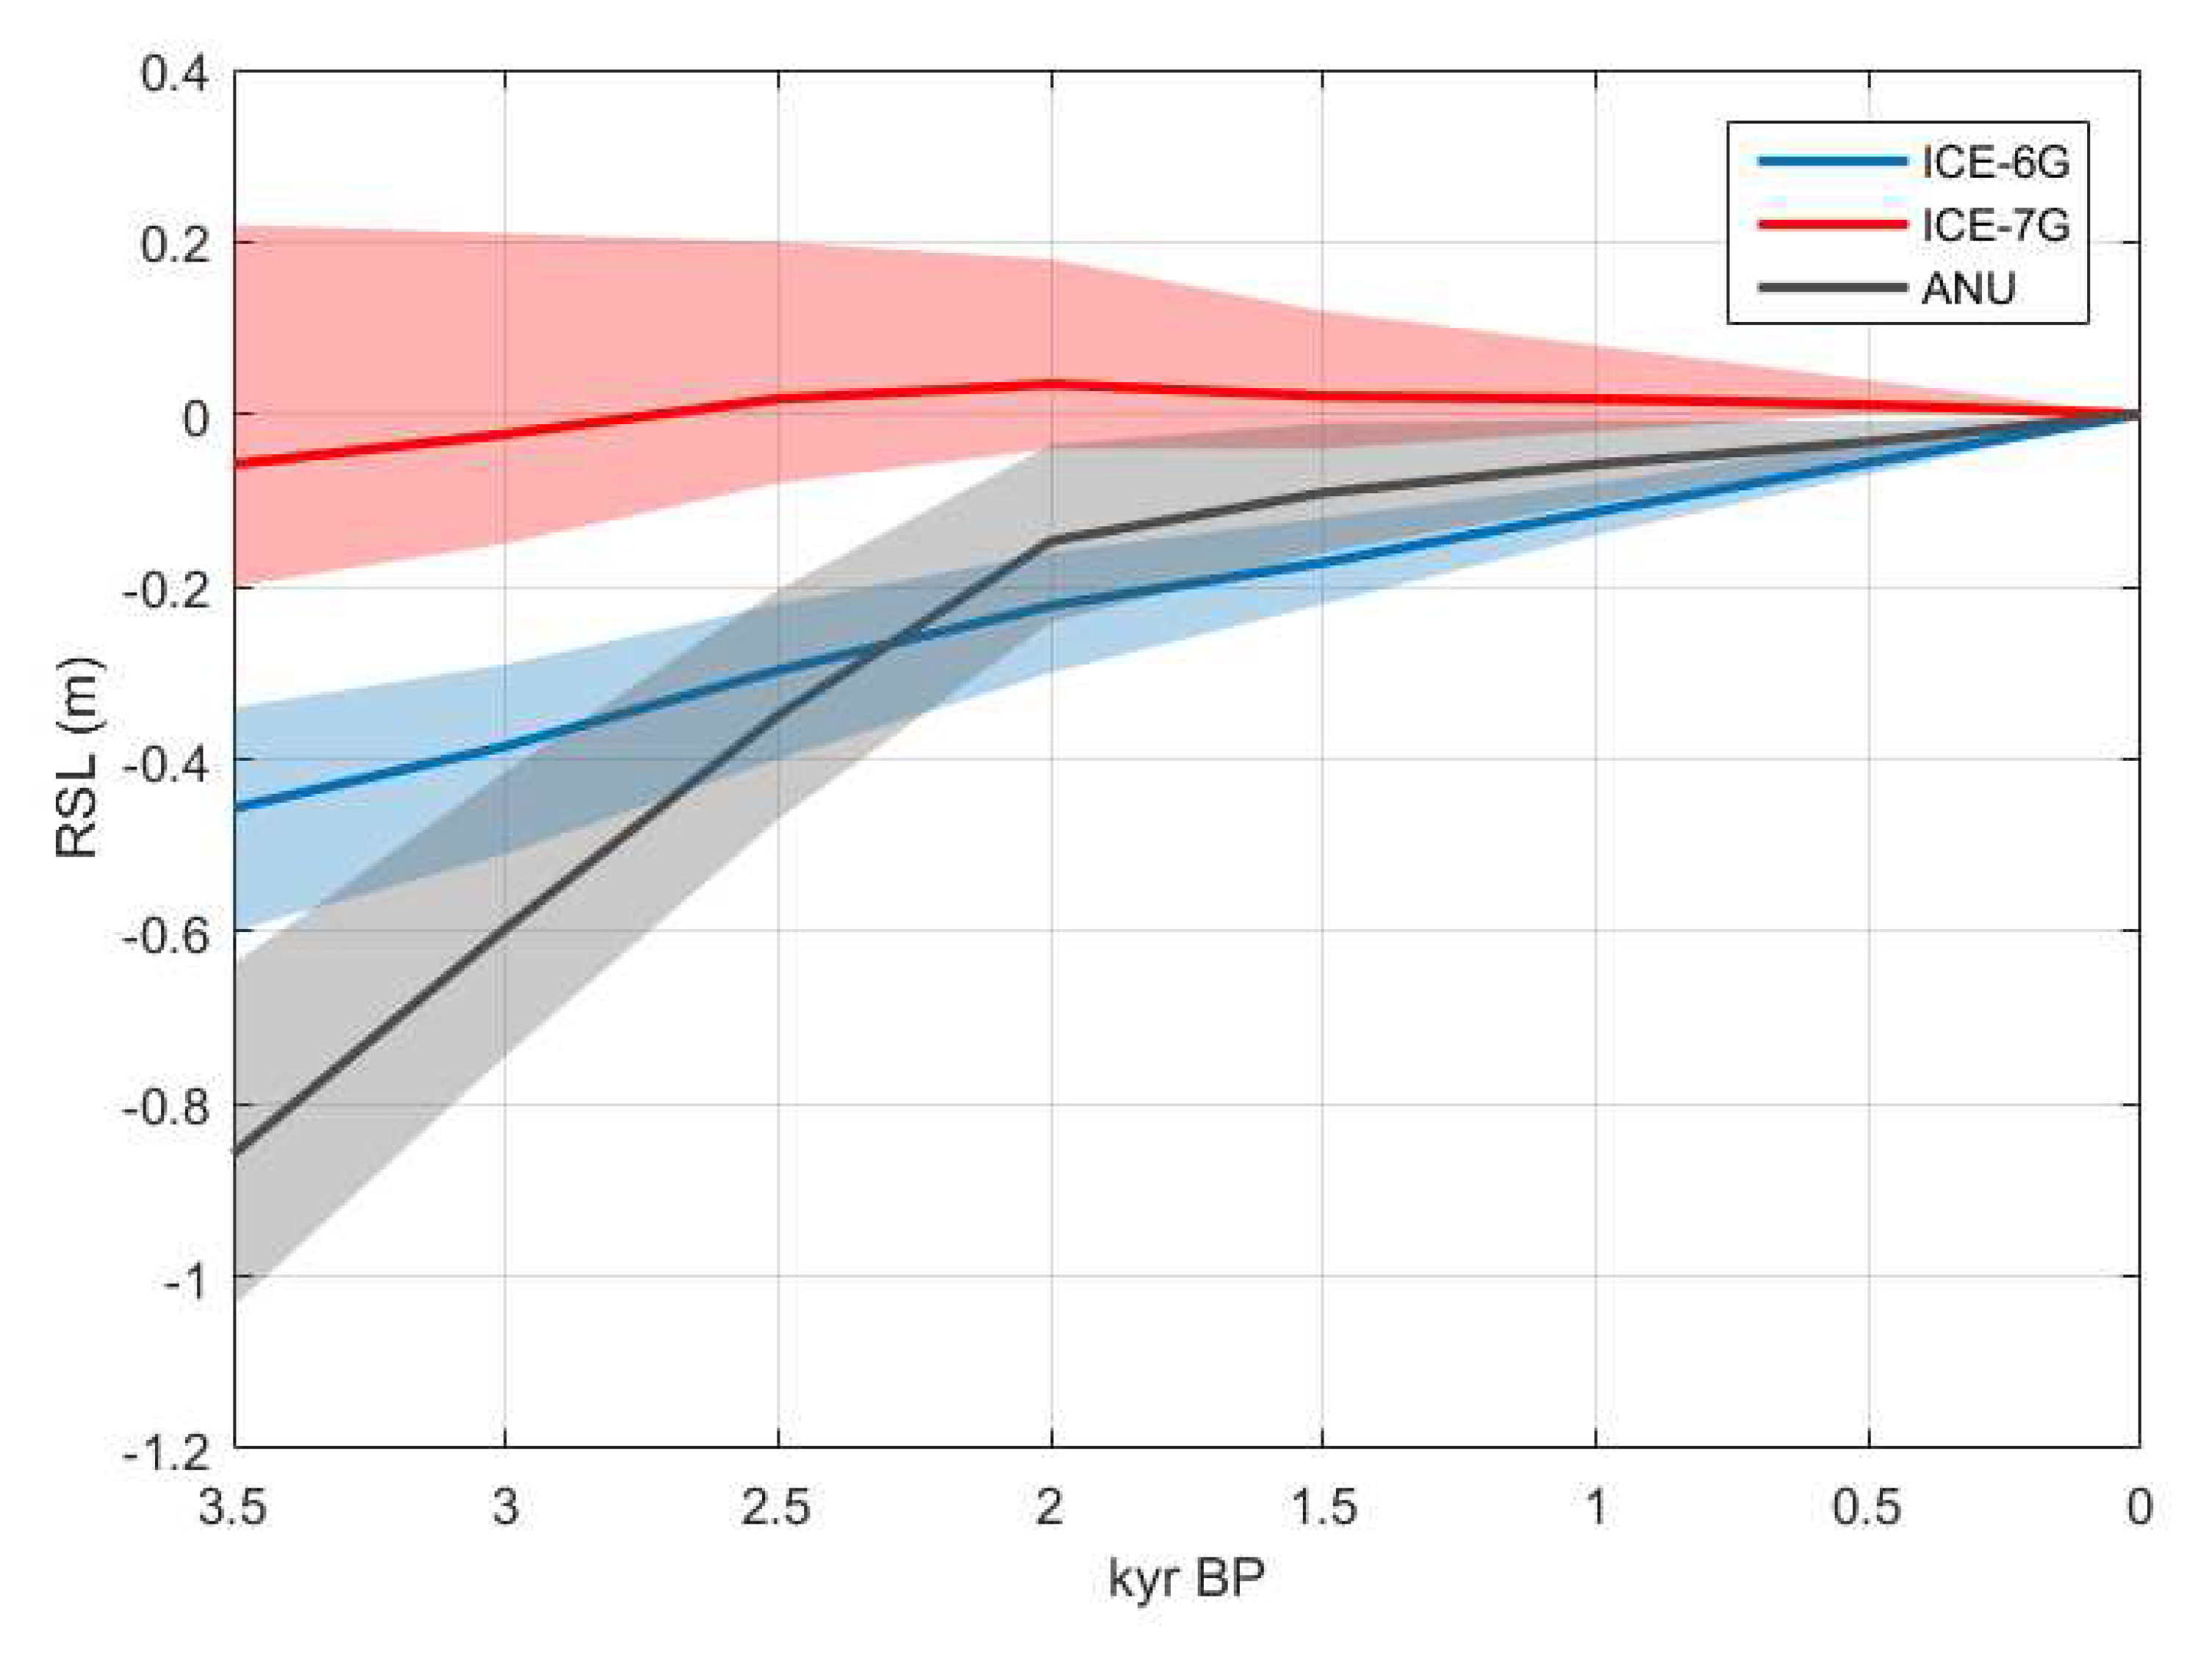
Figure 9, solid lines show predictions for the history of relative sea level at Lambousa for the past 3.5 kyr according to GIA models ICE-6G (VM5a), ICE-7G (VM7) and to the GIA model by [
16], hereinafter referred to as ANU. All the predictions have been obtained with the SELEN4 SLE solver [
11]. For ICE-6G and ICE-7G, shaded regions show the standard deviation of RSL computed over an ensemble of 10,000 GIA models based on random variations of the VM5a and VM7 viscosity profiles, respectively, where the lithospheric thickness and the viscosity profile in the upper mantle have been perturbed with respect to the nominal values. For the ANU GIA model, the shaded region corresponds to the range of RSL obtained with the mini-ensemble of models E1 through E7 as defined in the work of [
16]. The differences between the three RSL curves in
Figure 9 reflect different assumptions about the ice sheet deglaciation histories and the viscosity profile in the mantle, while the amplitude of the shaded region is a measure of the sensitivity of each GIA model to possible regional variations of rheological parameters.
From
Figure 9, we see that our implementation of ICE-7G predicts a substantially stable sea level at Cyprus during the past ~3 kyr, while for ICE-6G and ANU we obtain a RSL gradually rising to the present level, albeit with different rates. At 2kyr BP, for ICE-6G and ANU we obtain a relative sea level of about -0.2m, with associated uncertainties at the 0.1 m level. For ANU, our result is significantly smaller than the estimate by [
16], who obtained a RSL of about -0.75 m for Cyprus at 2 kyr BP. For ICE-6G (VM5a) and ICE-7G (VM7), [
18] estimated a RSL at 2 kyr BP in Cyprus in the range between -0.25 m and -0.50 m; while our estimate for ICE-6G is comparable, considering also the uncertainty range, for ICE-7G we obtain a significantly smaller RSL. Those differences are likely to reflect the structural uncertainties for GIA models, as discussed by [
17], and may be attributed to different approaches to the solution of the SLE, including different assumptions about the Earth’s compressibility.
5. Discussion
We believe that the vertical movements observed on the northern coast of Cyprus, in the
ft coastal area between 2 kyears and today, can be considered null. Even if, as clear, Cyprus is located in a tectonically active area showing terraced platforms that reach altitudes of up to 400 m [
9]. We think that no tectonic corrections should be made for the time slice of the last 2 Ka.
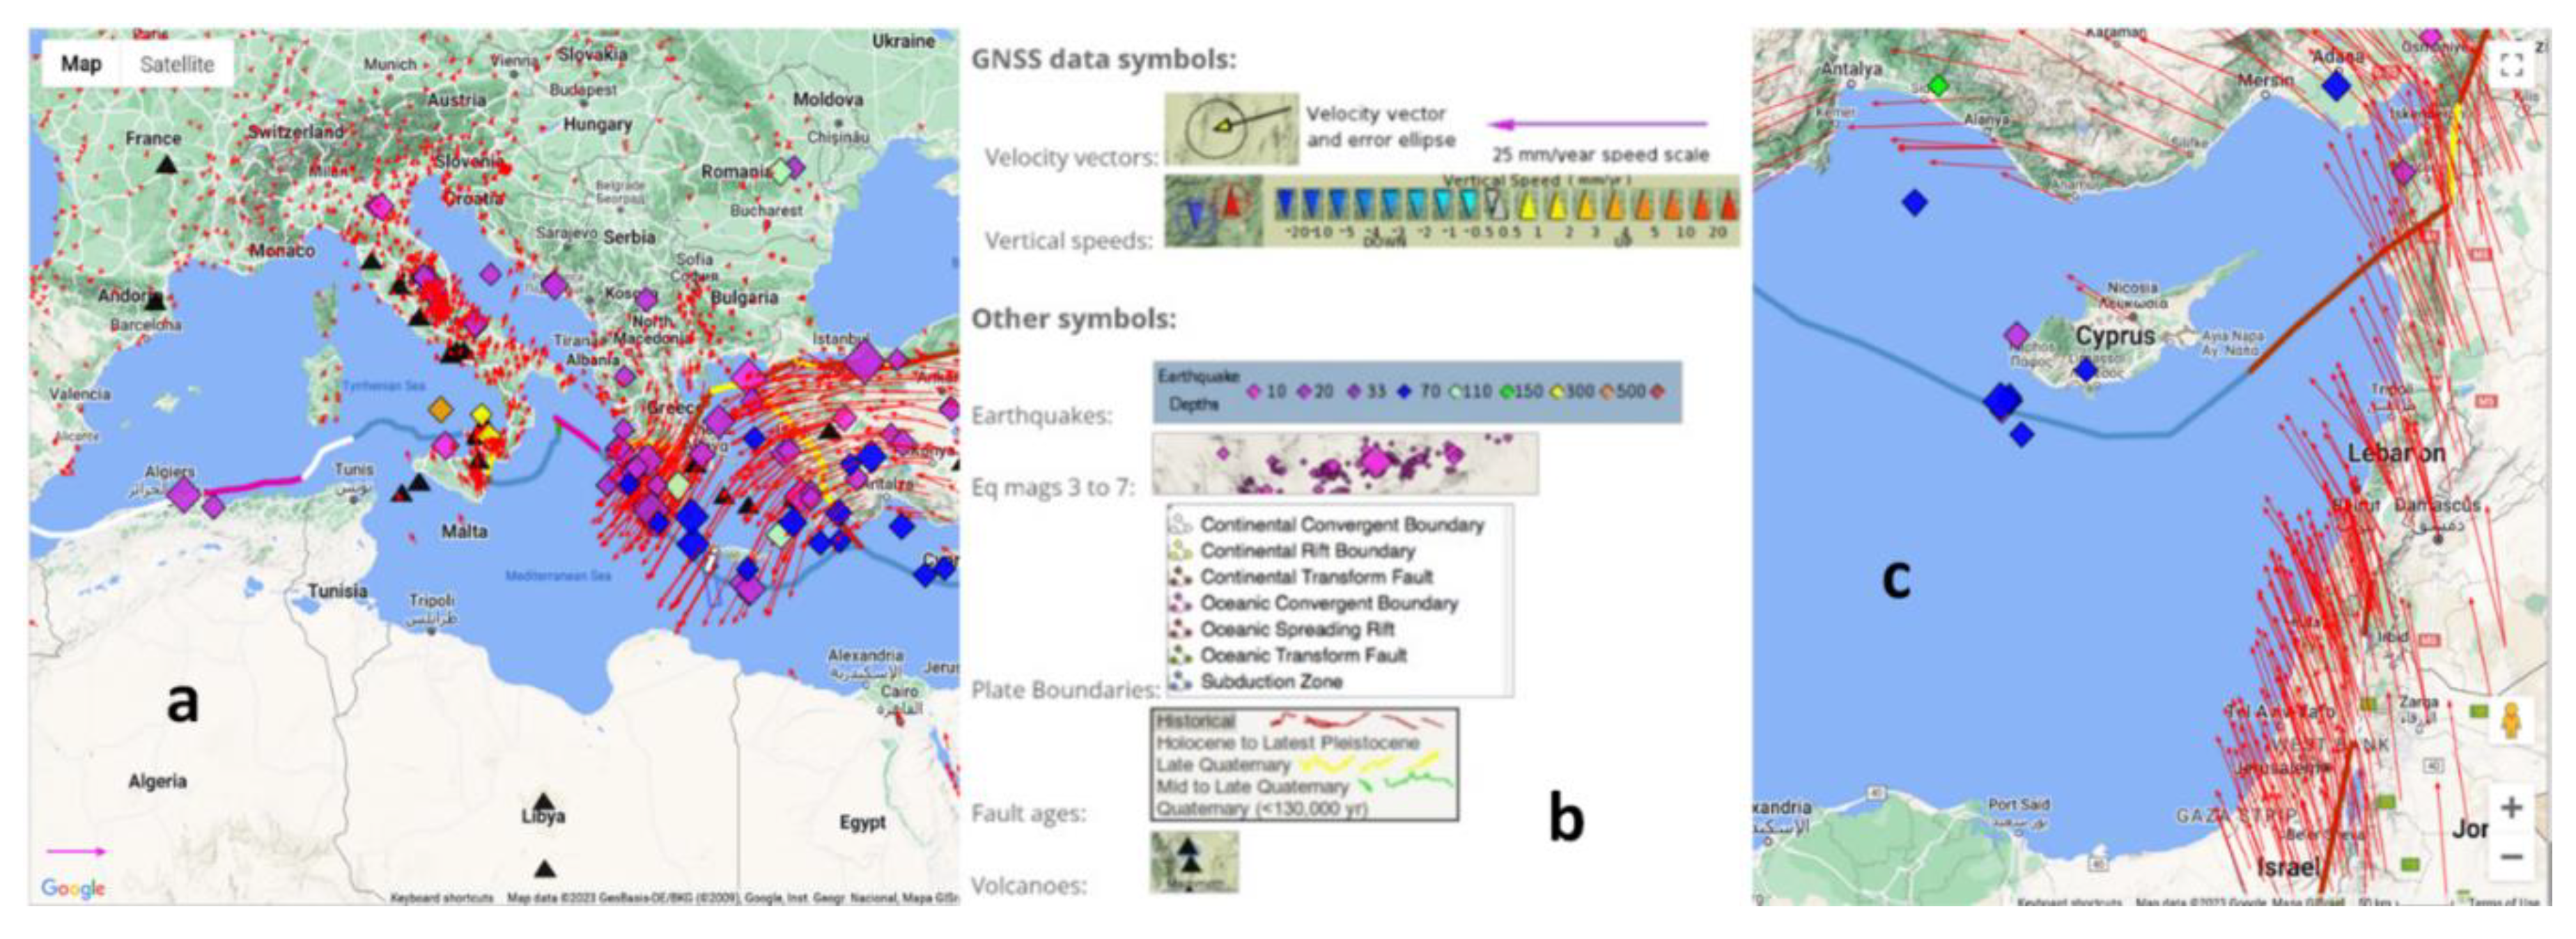
As far as instrumental data is concerned, GPS or tide gauge records longer than 6 years are not available, while observing the maps provided by the Sentinel satellite published by the European Copernicus site (
Figure 10a,b) near Lambousa
ft, no particular vertical movements are observed. GIA-driven sea level change in the Mediterranean basin is known to be controlled mostly by lithospheric flexure and hydro-isostatic effects (see, e.g., [
11]. The range of GIA models that we considered predict, at 2 ka BP, a minimum relative sea-level in Cyprus of about -0.25m, according to our implementation of the ICE-6G and ANU GIA models, and up to a maximum of 0.75 m according to [
17]. Results from [
18] for the ICE-6G (VM5a) and ICE-7G (VM7) GIA models point to an intermediate estimate between -0.25 and -0.50m.
In our work in order to calculate MIS 5.5 vertical movements we have used the maximum transgression of 7.2 m corrected by GIA and 118 Ka as maximum timing [
19].
GIA models show that the predicted sea levels at 2 ka BP range between ~-0.25 m bsl and ~0.05 m asl (
Figure 9). [
16] obtained a value of ~-0.5 m bsl for the same period. Field data collected at the Lambousa fishtank highlighted a sea level of about -0.52 m. The archaeological structure is built by directly excavating the bedrock, so possible gravitational adjustments of the material composing it are to be ruled out. Considering that the tectonic behavior of the study area suggested by [
9] excludes the presence of tectonic movements from the Tyrrhenian onward, [
16] modified model well fits with field data. However, it is not possible to exclude more recent tectonic movements subsequent to the use of the
ftof -0.52 m that could have lowered the structure, e.g., during Medieval Age, or general tectonic re-adjustments of the area of about 30 cm in the last 2 ka.
6. Conclusions
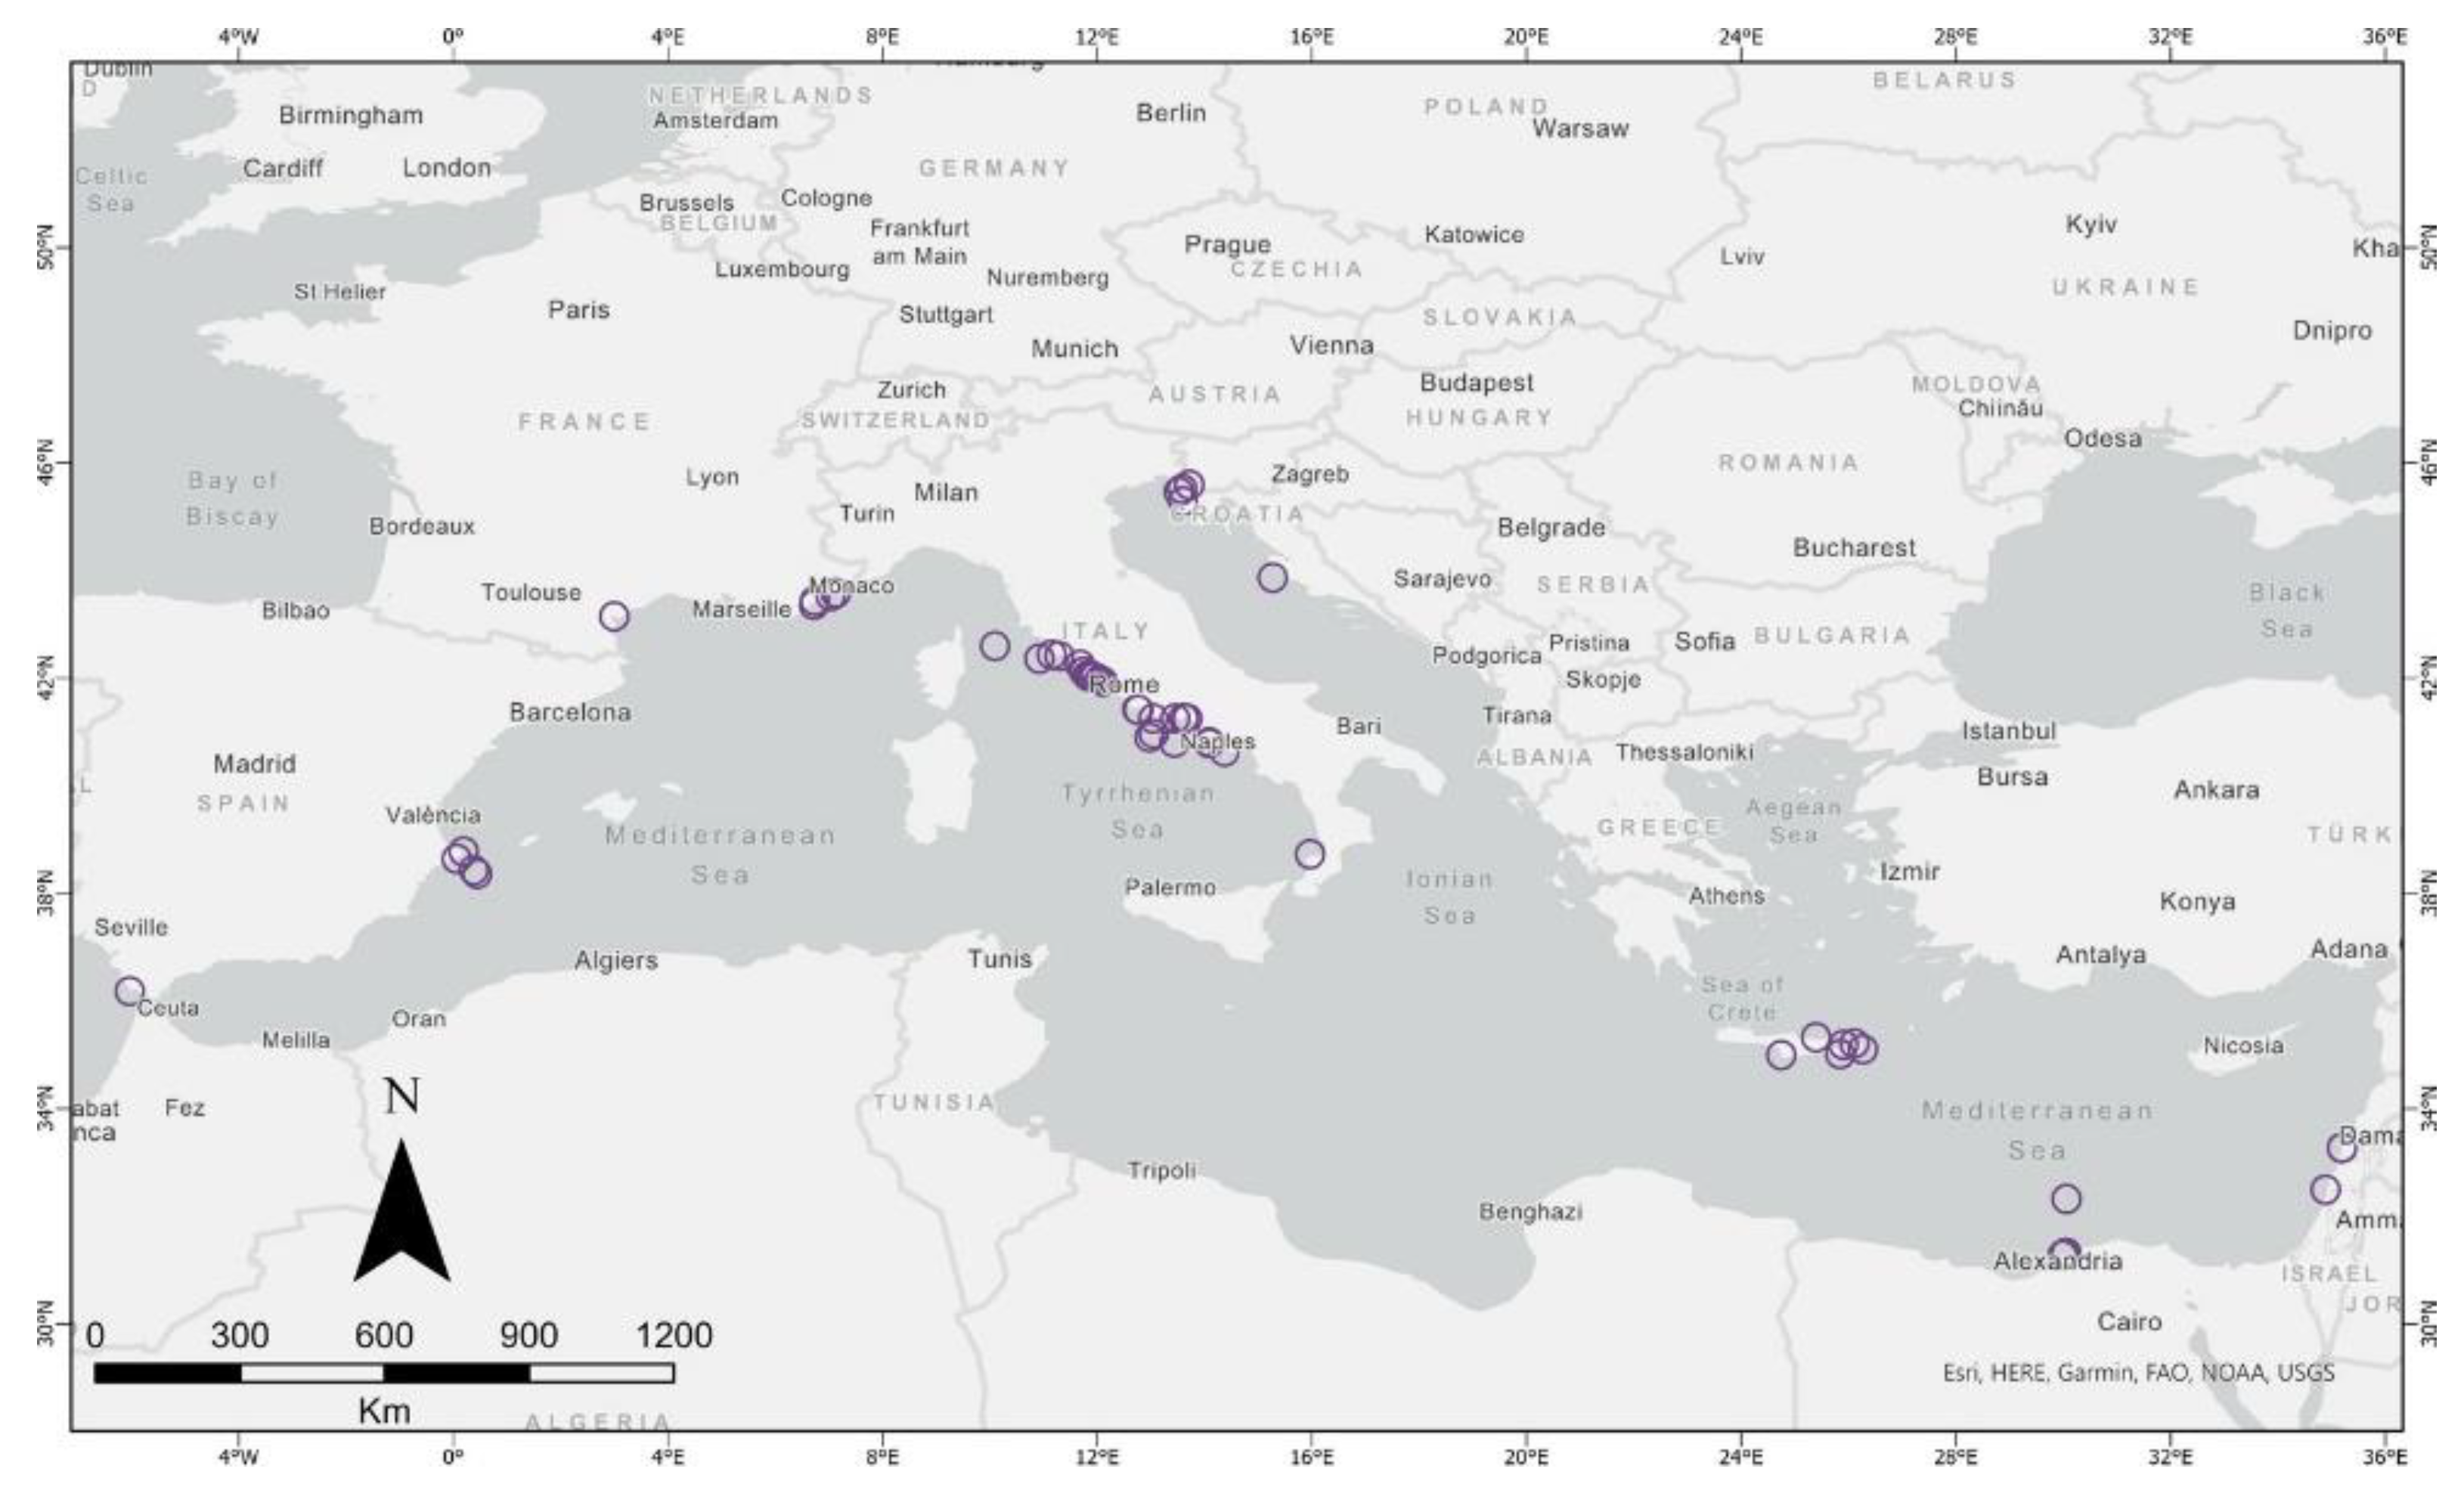
Previous studies have identified a conspicuous number of
fts scattered mostly in the Central Mediterranean, in Crete and in Israel (
Figure 12). On tectonically stable coasts the elevation of the sea level at the time of their construction varies according to the GIA. In the few coastal areas which are undergoing uplift: as in Creta [
20], or at Briatico (Southern Italy, [
21]) or subsidence (Adriatic fishtank, [
4]) it is possible to find an elevation difference as much as 7 metres. The Lambousa
ft, on the basis of the construction techniques and on the in situ observations, is attributed to an age of 2 kyrs ±0.1. The coastal area of the Lambousa ft is tectonically stable since the period of construction, a conclusion based both on geological and instrumental markers, and, according to our corrected tide and pressure measurements, the mean sea level of 2 ka BP (according to the data of the Crepido and the base of the tunnel) is -0.52 m. The GIA models used in this study substantially confirm this measure.
Author Contributions
Conceptualization, F.A. and S.F.; methodology, S.F, G.S, D.M., and Z.Z.; software, S.F, G.S, D.M.; validation, F.A., S.F. and Z.Z.; investigation, F.A, S.F.; data curation, S.F, D.M.; writing—original draft preparation, F.A.; writing—review and editing, F.A, S.F, G.S, D.Mand Z.Z.;; supervision, S.F, Z:Z.; All authors have read and agreed to the published version of the manuscript.
Funding
This research received no external funding.
Data Availability Statement
Not applicable.
Conflicts of Interest
The authors declare no conflict of interest.
References
- Galili, E.; Sevketoglu, M.; Salamon, A.; Zviely, D.; Mienis, H.K.; Rosen, B.; Moshkovitz, S. Late Quaternary beach deposits and archaeological relicts on the coasts of Cyprus, and the possible implications of sea-level changes and tectonics on the early populations. Geol. Soc. Lond. Spec. Publ. 2015, 411, 179–218. [Google Scholar] [CrossRef]
- Auriemma, R.; Solinas, E. ; Archaeological remains as sea level change markers: A review. Quaternary International. 2009, 147, 1–13. [Google Scholar] [CrossRef]
- Schmiedt, G. , Il livello antico del Mar Tirreno, Testimonianze da resti archeologici, 1972, E. Olschki, Firenze, 323 pp.
- Florido, E.; Auriemma, R.; Faivre, S.; Radi´c Rossi, I.; Antonioli, F.; Furlani, S.; Spada, G. Istrian and Dalmatian fishtanks as sea-level markers. Quat. Int. 2011, 232, 105–113. [Google Scholar] [CrossRef]
- Lambeck, K.; Anzidei, M.; Antonioli, F.; Benini, A.; Esposito, A. Sea level in Roman time in the Central Mediterranean and implications for recent change. Earth and Planetary Science Letters 2004, 224, 563–575. [Google Scholar] [CrossRef]
- Lambeck, K.; Anzidei, M.; Antonioli, F.; Benini, A.; Verrubbi, V. Tyrrhenian sea level at 2000 BP: evidence from Roman age fish tanks and their geological calibration. Rendiconti Lincei. Scienze Fisiche e Naturali 2018, 1–12. [Google Scholar] [CrossRef]
- Flinder, A. The fish-tanks. International Journal of Nautical Archaeology 1976, 5, 136–141. [Google Scholar] [CrossRef]
- Robertson AH, F.; Kidd, R.B.; Ivanov, M.K.; Limonov, A.F.; Woodside, J.M.; Galindo-Zaldivar, J.; Nieto, L. Eratosthenes Seamount: collisional processes in the easternmost Mediterranean in relation to the Plio-Quaternary uplift of southern Cyprus. Terra Nova 1995, 7, 254–264. [Google Scholar] [CrossRef]
- Zomeni, Z. ; Quaternary Marine Terraces on Cyprus: Constraints on Uplift and Pedogenesis, and the Geoarchaeology of Pal aipafos. PhD. Thesis., 2012. Oregon State University.
- Mart, Y.; Ryan, B.F. The complex tectonic regime of the Cyprus Are: A short review. lsr. J. Earth Sci 2015, 51, 117–123. [Google Scholar] [CrossRef]
- Spada, G.; Melini, D. SELEN4 (SELEN version 4.0): a Fortran program for solving the gravitationally and topographically self-consistent sea-level equation in glacial isostatic adjustment modeling. Geosci. Model Dev. 2002, 12, 5055–5075. [Google Scholar] [CrossRef]
- Peltier, W.R. Global glacial isostasy and the surface of the ice-age Earth: the ICE-5G (VM2) model and GRACE. Annual Review of Earth and Planetary Sciences 2004, 32, 111–149. [Google Scholar] [CrossRef]
- Mitrovica, J.X.; Milne, G.A. Glaciation-induced perturbations in the Earth's rotation: A new appraisal. Journal of Geophysical Research: Solid Earth 1998, 103, 985–1005. [Google Scholar] [CrossRef]
- Roy, K.; Peltier, W.R. Glacial isostatic adjustment, relative sea level history and mantle viscosity: reconciling relative sea level model predictions for the US East coast with geological constraints. Geophysical Journal International 2015, 201, 1156–1181. [Google Scholar] [CrossRef]
- Roy, K.; Peltier, W.R. Space-geodetic and water level gauge constraints on continental uplift and tilting over North America: regional convergence of the ICE-6G_C (VM5a/VM6) models. Geophysical Journal International 2017, 210, 1115–1142. [Google Scholar] [CrossRef]
- Lambeck, K.; Purcell, A. Sea-level change in the Mediterranean Sea since the LGM: model predictions for tectonically stable areas. Quater. Sci. Rev 2005, 24, 1969–1988. [Google Scholar] [CrossRef]
- Melini, D.; Spada, G. Some remarks on glacial isostatic adjustment modelling uncertainties. J. Geophys. Int. 2019, 218, 401–413. [Google Scholar] [CrossRef]
- Roy, K.; Peltier, W.R. Relative sea level in the Western Mediterranean basin: A regional test of the ICE-7G_NA (VM7) model and a constraint on Late Holocene Antarctic deglaciation. Quaternary Science Reviews 2018, 183, 76–87. [Google Scholar] [CrossRef]
- Antonioli, F.; Ferranti, L.; Stocchi, P.; Deiana, G.; Lo Presti, V.; Furlani, S.; Marino, C.; Orru, P.; Scicchitano, G.; Trainito, E.; et al. Morphometry and elevation of the last interglacial tidal notches in tectonically stable coasts of the Mediterranean Sea. Earth-Sci. Rev. 2018, 185, 600–623. [Google Scholar]
- Howes, D.; Dawson, A.; Smith, D. Late Holocene coastal tectonics at Falasarna_western_Crete a sedimentary sedimentary Geological Society London Special Publications. 1998. [Google Scholar] [CrossRef]
- Anzidei, M.; Antonioli, F.; Benini, A.; Gervasi, A.; Guerra, I. Evidence of vertical tectonic uplift at Briatico (Calabria, Italy) inferred from Roman age maritime archaeological indicators. Quat. Int. 2012. [Google Scholar] [CrossRef]
- Oikonomou, P.; Karkani, A.; Evelpidou, N.; Kampolis, I.; Spada, G. The Fish Tanks of the Mediterranean Sea. Quaternary 2023, 6. [Google Scholar] [CrossRef]
|
Disclaimer/Publisher’s Note: The statements, opinions and data contained in all publications are solely those of the individual author(s) and contributor(s) and not of MDPI and/or the editor(s). MDPI and/or the editor(s) disclaim responsibility for any injury to people or property resulting from any ideas, methods, instructions or products referred to in the content. |
© 2023 by the authors. Licensee MDPI, Basel, Switzerland. This article is an open access article distributed under the terms and conditions of the Creative Commons Attribution (CC BY) license (http://creativecommons.org/licenses/by/4.0/).
