1. Introduction
Rainfall is one of the main factors inducing slope instability [
1,
2].Under the action of rainfall, the slope failure type is shallow landslide. Most landslides occur during or after rainfall, and the critical time of landslide is related to the unsaturated permeability coefficient and shear strength of soil [
3]. In order to reduce the occurrence of geological disasters such as slope instability, many scholars have proposed methods of ecological slope protection, which mainly relies on the combined action of rainwater interception by plant stems and leaves, transpiration, root reinforcement and water absorption[
4,
5]. Plant stems and leaves transpiration and root water absorption would reduce the water in the soil, increase the matrix suction of the soil, reduce the unsaturated permeability coefficient of the soil and increase the shear strength, so as to achieve the purpose of improving slope stability [
6]. Therefore, it is of great theoretical and practical engineering significance to study the influence of different kinds of plants on slope permeability under rainfall.
Up to now, a large number of scholars have carried out experimental research on soil permeability and achieved certain research results. Qin et al. [
7] developed a one-dimensional soil column vertical infiltration model test device, and proposed a new method for calculating the permeability coefficient of unsaturated soil. Jiao et al. [
8] constructed a large-scale loess cover test base to carry out a series rainfall tests, and found that the permeability coefficient of the vegetation root growth area was higher than that of the non-vegetation. Chen et al. [
9] and Cheng et al. [
10] established three vegetation cover layers, and monitored the changes of water content and matric suction in each vegetation cover layer during the active period of rainfall and evaporation. It was found that the permeability coefficient of the straight root plant cover layer was the largest and the fibrous root plant cover layer was the smallest. Song et al. [
11], Bordoloi et al. [
12], Li et al. [
13] found that vegetation roots would enhance the permeability of soil, and the presence of vegetation under rainfall conditions would improve the stability of the slope. Xu et al. [
14] investigated the influence of slope gradient and compaction degree on the infiltration rate of slope rainwater by self-made rainfall and monitoring system. Zeng et al. [
15] conducted rainfall experiments with different rainfall intensities for the loess slope model, and explored the relationship between rainfall intensity and volumetric water content and matric suction. Yang et al. [
16] analyzed the influence of two common slope protection plants on slope rainwater infiltration through in-situ monitoring of engineering slope and numerical simulation. Zeng et al. [
17] carried out the seepage characteristics test of fissured red clay slope by fluorescence tracer method, and explored the variation of wetting front, transient saturation zone and soil moisture content during rainfall. Although the above research results have brought many new insights into the permeability characteristics of slopes, most of the existing research focuses on the permeability performance of slope soil through flat overburden layer, and studies the internal water migration law and permeability of slopes using small bare soil slopes filled indoors. There is still a lack of research on the internal water migration law and permeability of large ecological slopes in outdoor natural environments.
In light of this, this paper aims to conduct a series experiments to study the internal water migration law and permeability of large ecological slopes. At first, four kinds of large overburden ecological slopes are established outdoors, and artificial rainfall tests are conducted on each overburden slope simultaneously to monitor the water migration law inside the slope in real time after the vegetation matures in a year’s dry-wet cycle. Then, the soil-water characteristic curve of the test soil is measured by using the pressure plate instrument and the matrix suction inside the slope is calculated. Finally, the unsaturated permeability coefficients of the shallow soil of the slopes are calculated by using the transient profile method, and the influences of different vegetation overburdens on the permeability performance of the shallow soil of the slopes under the effect of rainfall are investigated in details.
2. Experimental model and scheme design
2.1. Basic properties of soil
In this paper, a deep clay soil at a construction site in Wuhan, Hubei is used for the test, and its basic physical properties are measured according to the relevant requirements in the ‘Highway Geotechnical Test Procedure’ (JTGE40-2007) [
18] as shown in
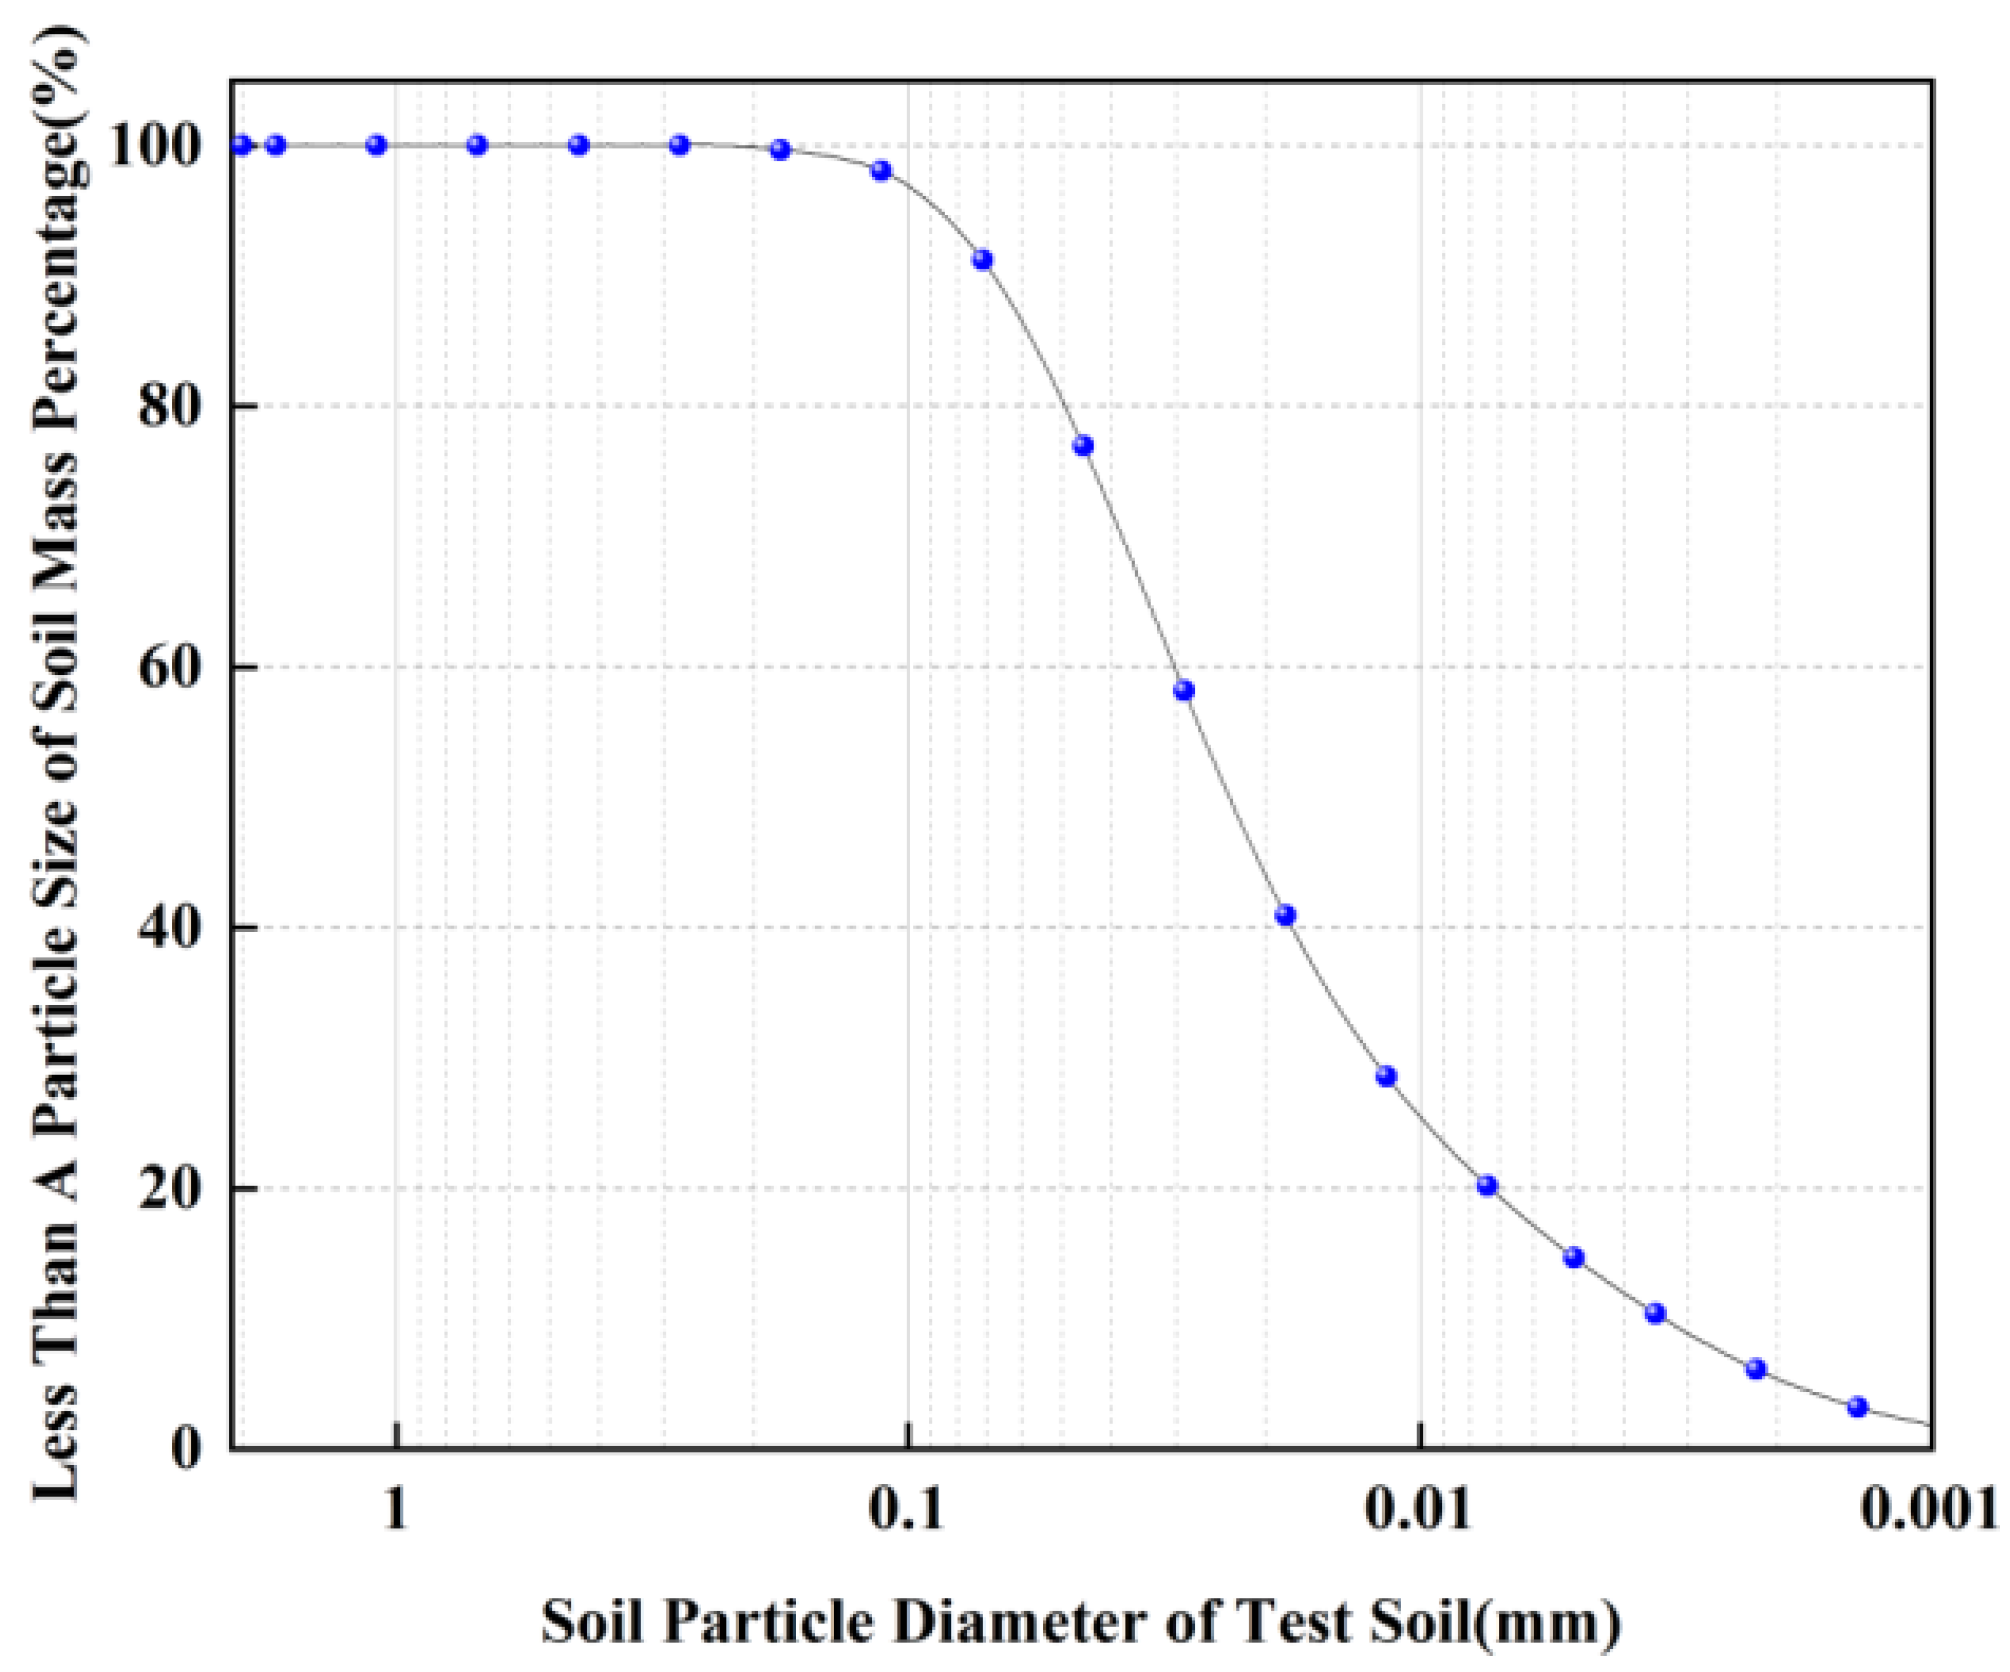
Table 1, and the particle gradation curve of the soil for the test is measured by using the Omicron laser particle size analyzer TopSize as shown in
Figure 1.
2.2. Slope model
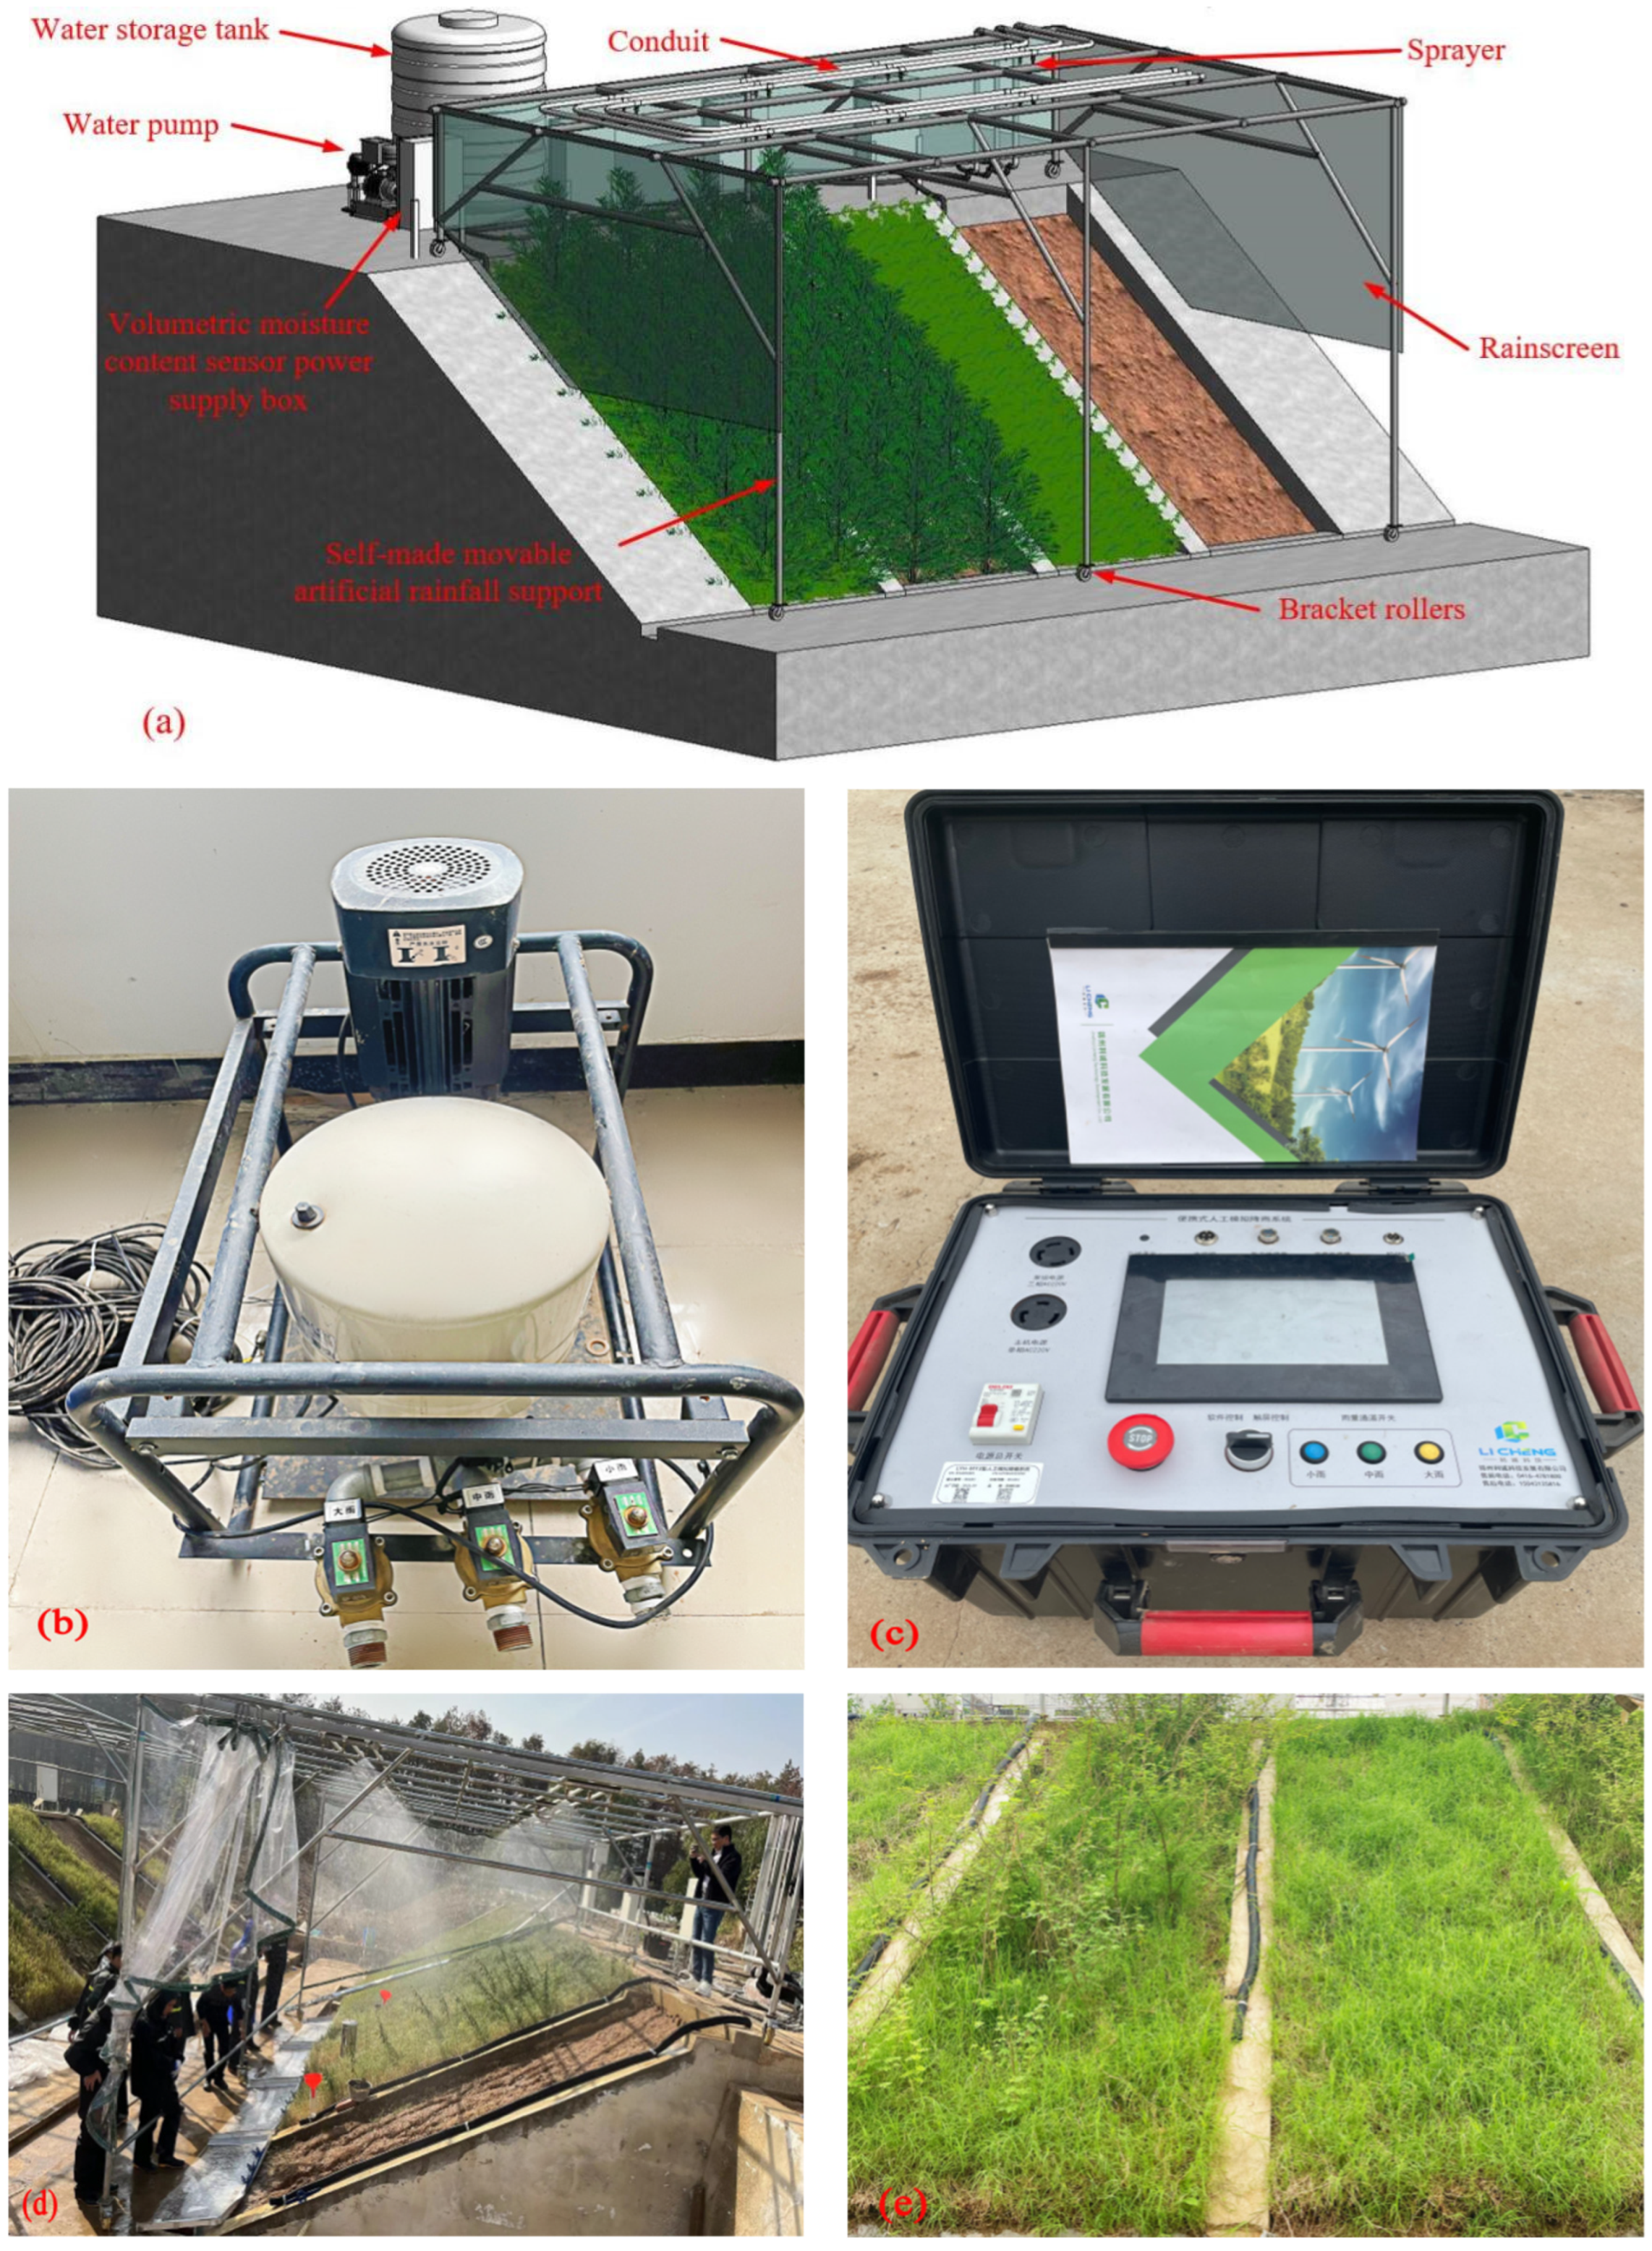
The materials for this artificial rainfall test consist of an outdoor slope model (as shown in
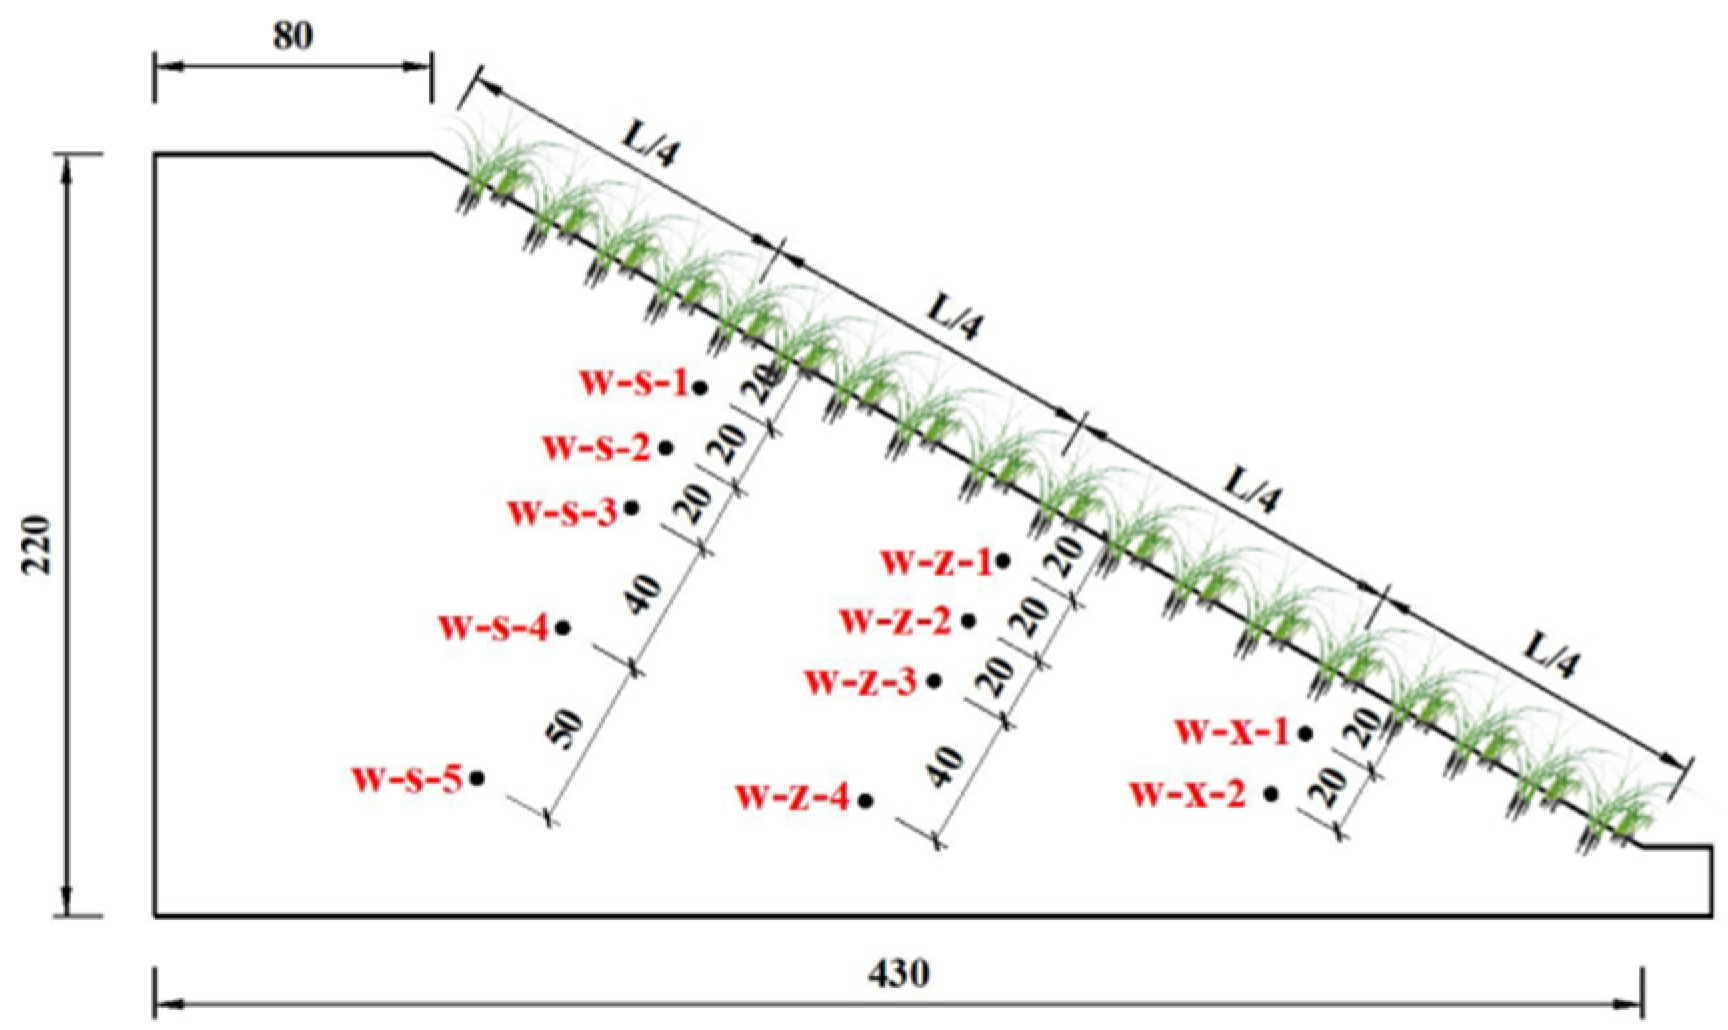
Figure 2), a test monitoring system, a self-made movable artificial rainfall system, and a soil erosion collection device. Each slope model has a height of 2 m, a width of 1.5 m, and a slope ratio of 1:1.75. The slope is separated from the slope by a retaining wall. In the filling process of slopes, the slope soil is filled in six layers in order to ensure that the soil compaction of the slope model is 85%, and the surface of the soil is scraped and compacted after filling each layer. Cynodon dactylon and Magnolia multiflora are planted in the top layer of the fill, sprayed with mist water twice a day in the pre-sowing period, and maintained with nutrient solution once a week. The test monitoring system consists of soil moisture sensors and intelligent data collector DL1. Eleven soil moisture sensors are buried on the central axis of each slope, and the sensors are arranged at 1/4, 1/2 and 3/4 of the vertical slope surface (upper part of the slope, middle part of the slope and lower part of the slope) along 20cm, 40cm, 60cm, 100cm and 150cm of the parallel slope surface. The data line of the soil moisture sensor is led along the partition wall to the power supply box at the top of the slope and connected to the collector, and the specific sensor burial position is shown in
Figure 3. The homemade movable artificial rainfall system consists of fogging nozzles, water supply system, central control panel, power supply system, curtain and movable support frame. The rain sprayed by the fog nozzle is atomized to simulate natural rainfall as much as possible, and the role of the curtain is to prevent the rain from spilling out of the slope and to reduce the impact of wind speed on the rainfall.
In
Figure 3, w indicates the soil volumetric water content, s depicts the upper part of the slope, z denotes the middle of the slope, x stands for the lower part of the slope, and the numbers 1 to 5 indicate the number of the soil moisture sensor, such as: w-s-1 means the water content sensor No. 1 on the upper part of the slope, w-z-2 indicates the water content sensor No. 2 in the middle of the slope, w-x-1 illustrates the water content sensor No. 1 on the lower part of the slope, and the other numbers are the same. In addition, J in the text indicates matrix suction, H1 denotes slope No. 1, H2, H3, H4 in the same way, so H1-w-s-2 indicates the water content of the upper part of slope No. 1 at position No. 2, H2-J-z-1 depicts the matrix suction at position No. 1 in the middle of slope No. 2, and other numbers in the same way. Furthermore, L represents the length of the slope, and the black solid point represents the SWR-100 soil moisture sensor.
2.3. Experimental scheme
Four types of overburden slopes are established outdoors, namely, H1-artificial slope without vegetation, Magnolia multiflora (shrub vegetation) overburden slopes, Cynodon dactylon (herbaceous vegetation) overburden slopes, and Cynodon dactylon and Magnolia multiflora (Herbaceous vegetation and shrub vegetation mixed) overburden slopes, which are cultivated under natural outdoor environment for one year. After the vegetation of the overburden is mature, the artificial rainfall test with rainfall intensity of 60mm per hour and rainfall time of 4 hours is carried out on four slope models. During the rainfall period, the intelligent data acquisition instrument is set to collect water content data every half minute, and after 4 hours of rainfall, it is set to collect water content data every minute, and analyze the change pattern of water content data during 4 hours of rainfall and 7 hours of natural evaporation. Based on the soil-water characteristic curve measured by the pressure plate instrument, the matrix suction corresponding to each water content is calculated, and the unsaturated permeability coefficients of the four overburden slopes are further evolved by combining the water content and matrix suction using the transient profile method, and the slope model filling and planting schemes are shown in
Table 2.
3. Test results and analysis
3.1. Variation law of volumetric water content
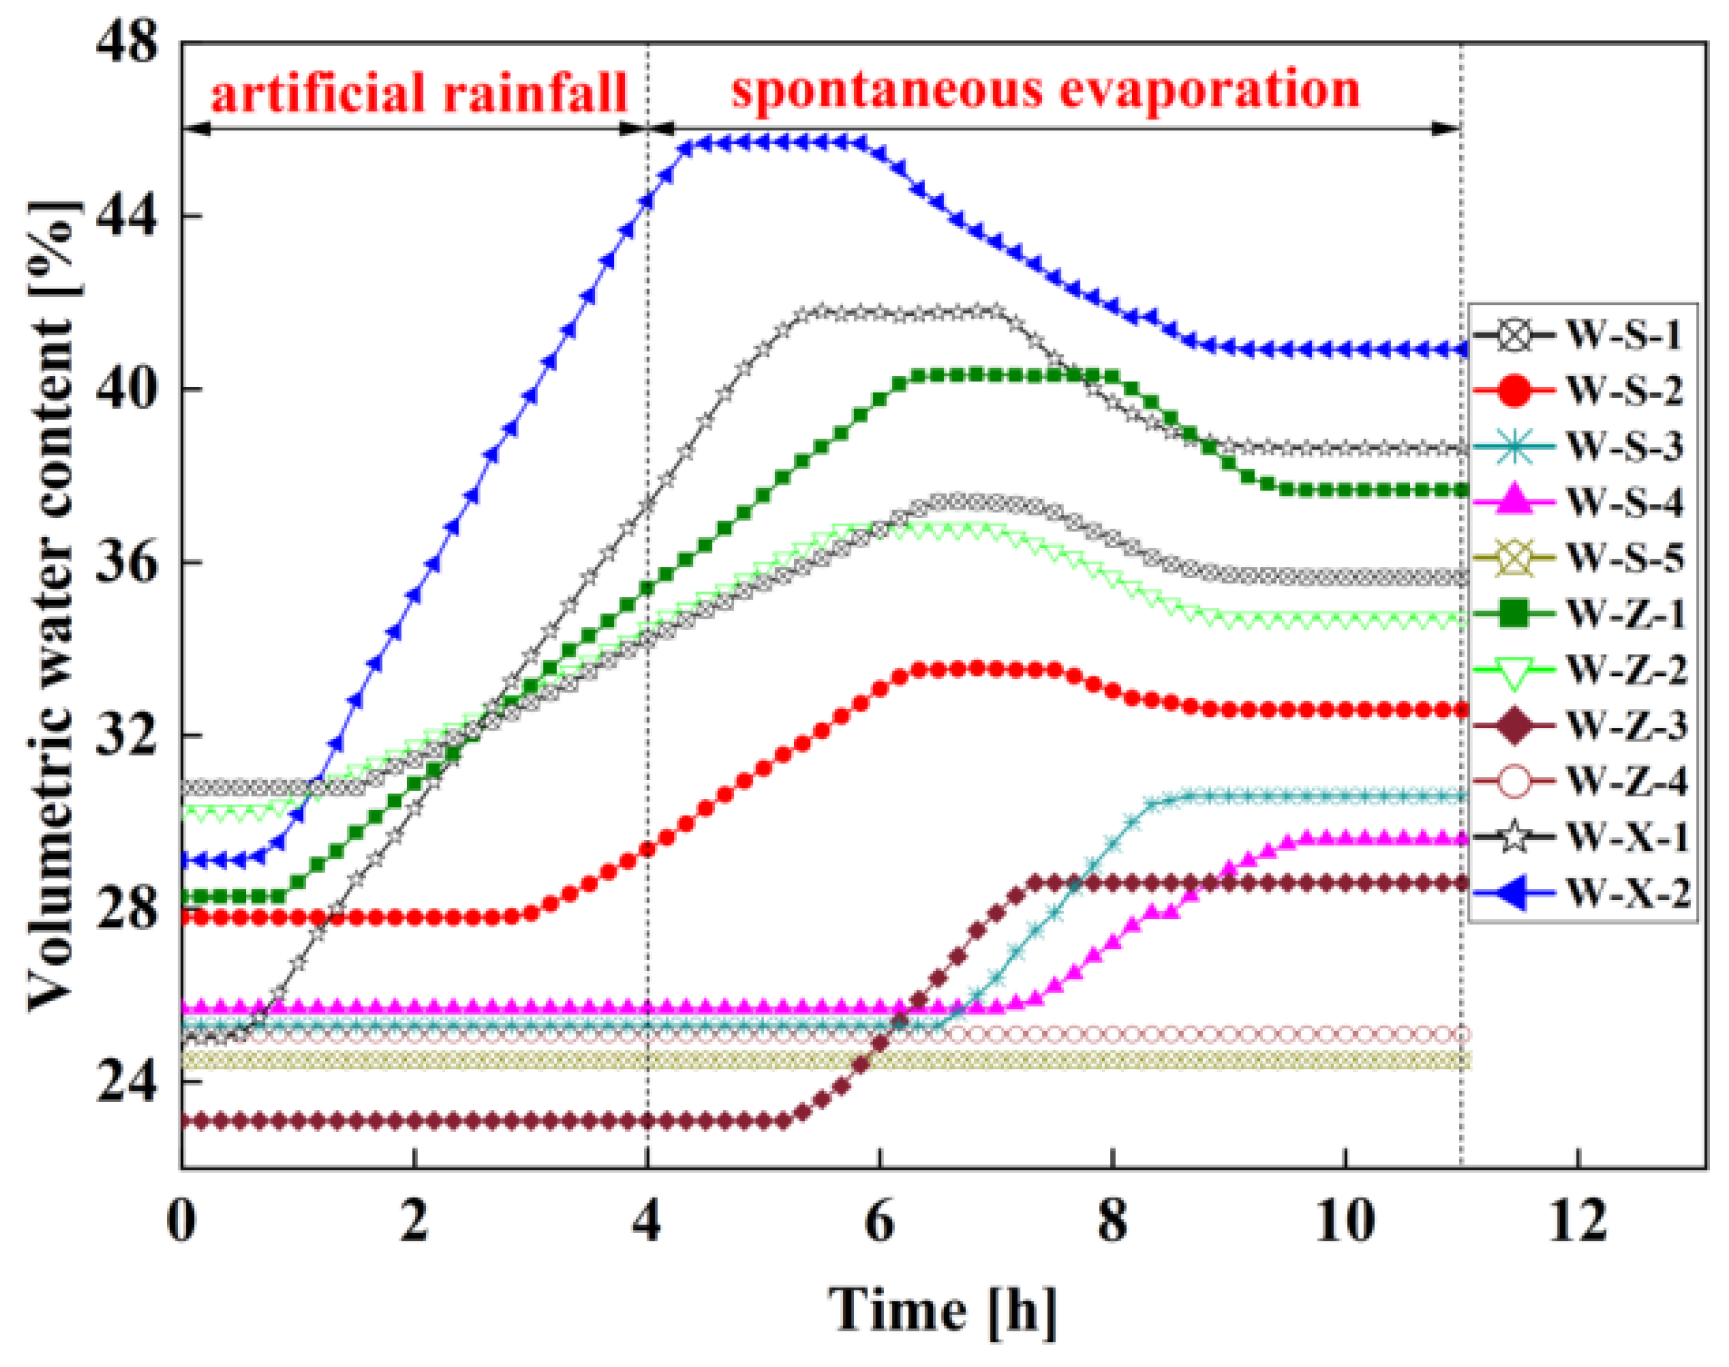
Figure 4 shows the relationship between the volumetric water content of each burial depth monitoring point inside the artificial slope without vegetation H1 and time under the rainfall condition.
The artificial slope H1 without vegetation has been growing for one year in natural environment, and has experienced many wet and dry cycles during this period. Therefore, the initial water content at different slope locations is not consistent, resulting in different starting points of the water content versus time curves. As shown in
Figure 4, all the water contents of measurement points w-s-1, w-s-2, w-z-1, w-z-2, w-x-1 and w-x-2 begin to increase after 3 hours of rainfall. Among them, the water contents of measurement points w-s-1, w-z-1, w-z-2, w-x-1 and w-x-2 begin to increase after 1.5 hours of rainfall, indicating that the depth of rainfall infiltration at this time is not less than 20cm in the upper part of the slope, and not less than 40cm in the middle and lower part of the slope. Within the following 1.5 hours, the water content of measurement point begins to increase, indicating that after 3 hours of continuous rainfall, the depth of rainfall infiltration in the upper part of the slope, the middle of the slope and the lower part of the slope is not less than 40cm. Within the natural evaporation stage of 7 hours after the end of 4 hours rainfall, the water contents of measurement points w-s-3, w-s-4 and w-z-3 have increased, which indicates that the infiltration depth of rainwater in the upper part of the slope is not less than 100cm, and the infiltration depth in the middle part of the slope is not less than 60cm. Meanwhile, it is found that the water contents of measurement points w-s-3, w-s-4 and w-z-3 begin to increase only after the end of rainfall, which indicates that there is a lag in the infiltration of rainwater into the slope. However, the water contents of the monitoring points w-s-5 buried at a distance of 150cm from the upper part of the slope and w-z-4 buried at a distance of 100cm from the middle part of the slope remain unchanged, indicating that the rainwater infiltration depth does not reach the corresponding burial depth value. In summary, during 4 hours of continuous rainfall, the rainfall infiltration depth of the artificial slope without vegetation reaches 40cm in the upper, middle and lower parts of the slope, and during 7 hours of natural evaporation, the rainfall infiltration depth reaches 100cm in the upper part of the slope, 60cm in the middle part of the slope and 40cm in the lower part of the slope. This indicates that the infiltration rate of rainwater in the slope is different, showing the rule that the lower part of the slope surface is the largest, the middle part of the slope surface is the second and the upper part of the slope surface is the smallest. It is worth noting that the infiltration rates of the other three types of slopes with overburden also show similar patterns.
The reason for the phenomena shown in
Figure 4 is that the initial state of the surface soil of the slope is in a dry state, and the rain falls on the entire surface of the slope after the rainfall begins. As the rainfall continues, part of the rainwater that falls on the upper part of the slope infiltrates into the interior of the slope and moves to the lower part of the slope under the action of gravity. The other part of the rainwater forms runoff on the slope surface and gradually flows towards the lower part of the slope. Finally, the two parts of the rainwater converge at the lower part of the slope to form a temporary saturation zone, and then penetrate into the interior of the lower part of the slope along the cracks in the lower part of the slope, resulting in a faster increase in water content in the lower part of the slope compared to the upper and middle parts of the slope. Therefore, the monitoring points in the lower part of the slope respond the fastest. Based on this reason, the response time of the water content monitoring point in the middle part of the slope is the second, and the response time in the upper part of the slope is the smallest. At the same time, due to the formation of a transient saturation zone in the lower part of the slope, the rainwater in this area would continuously flow to the monitoring point w-x-2 under the action of gravity, so the water content of the monitoring point w-x-2 increases faster than that of the monitoring point w-s-1.
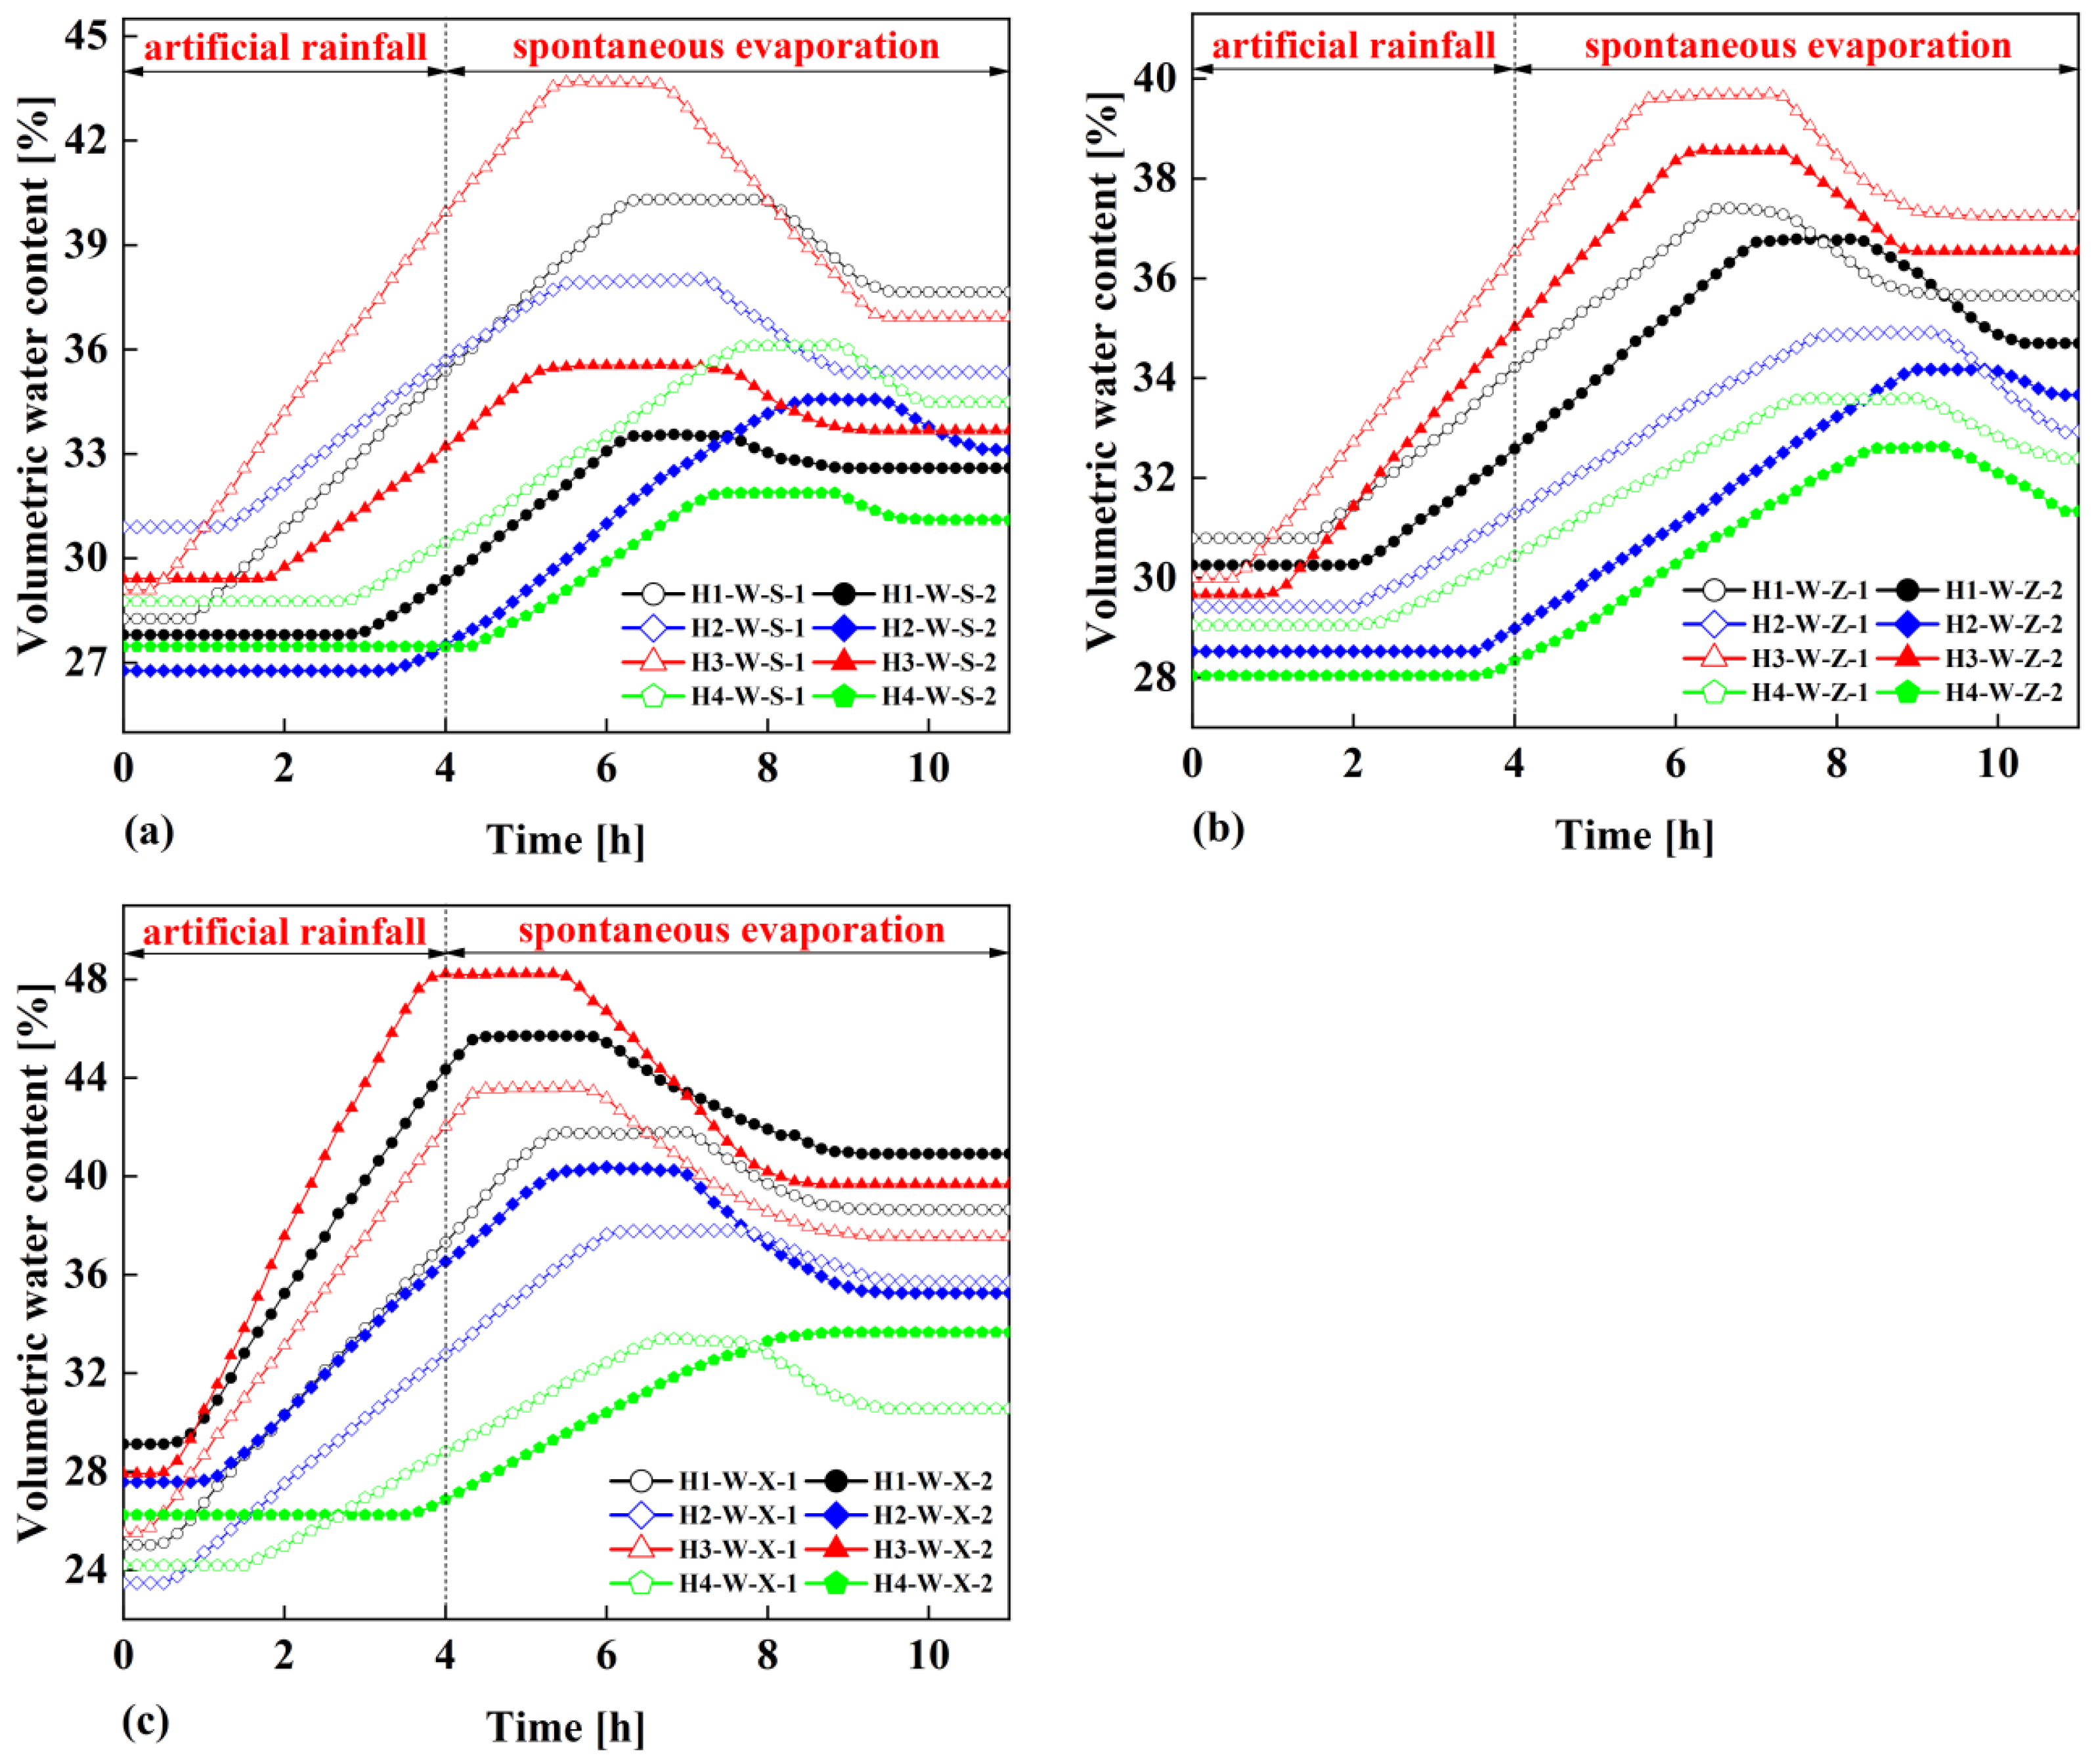
The relationship between the volumetric water content of the surface monitoring points of the four types of overburden slopes and time is shown in
Figure 5.
According to the data curves of the water content monitoring points at a vertical distance of 20cm from the slope surface and 40cm from the slope surface, it can be seen that during the period of 4 hours rainfall and 7 hours natural evaporation, the water content variation curve generally shows a trend of first unchanged, then increased, then unchanged, then decreased and finally unchanged. At the beginning of the rainfall, the rainwater has not yet infiltrated to the location of the water content monitoring points, so the values of each water content monitoring point inside the four slopes remain unchanged, and the values of the water content monitoring points are the water content of the initial state of the slope soil at this time. As the rainfall continues, the rainwater continues to infiltrate, and the values of each monitoring point begin to increase at different times, indicating that the rainwater has infiltrated to the location of the water content monitoring point. After several hours of rainwater infiltration, the slope soil at each water content monitoring point reaches a saturated state, i.e., the peak plateau of the curve, so that the slope soil has experienced the process from unsaturated state to saturated state. During the natural evaporation stage after the cessation of rainfall, the rainwater in the slope soil migrates downwards under the action of gravity, and the slope soil would be over from the saturated state to the unsaturated state. Then, the slope soil would be finally in the moist state with a certain water content, which shows the trend of the curve gradually decreasing and finally leveling off in
Figure 5. It is worth noting that the faster the infiltration rate of rainwater in each slope, the shorter the time period from the initial constant value to the beginning of the increase in the curve, and the larger the value of the peak plateau reaches afterwards.
Comparing
Figure 5c with
Figure 5a and
Figure 5b, it can be seen that the infiltration rate of rainwater (i.e., the slope of each curve rising in
Figure 5) in the lower part of the four types of overburden slopes is larger than that in the upper part of the slopes and the middle part of the slopes, resulting in a shorter response time (i.e., the horizontal coordinate corresponding to the dividing point of the water content monitoring points from unchanged to increasing) for the initial increase of water content compared to the upper and middle parts of the slopes. When the location of slope surface and slope type are certain, the response time of water content monitoring points closer to the slope surface is shorter. When the location of slope surface and the depth of water content monitoring points are certain, the infiltration rate of each overburden slope shows the following pattern from fast to slow: Magnolia multiflora overburden slope, artificial slope without vegetation, Cynodon dactylon overburden slope and Cynodon dactylon and Magnolia multiflora mixed overburden slope.
3.2. Determination of matrix suction of test clay
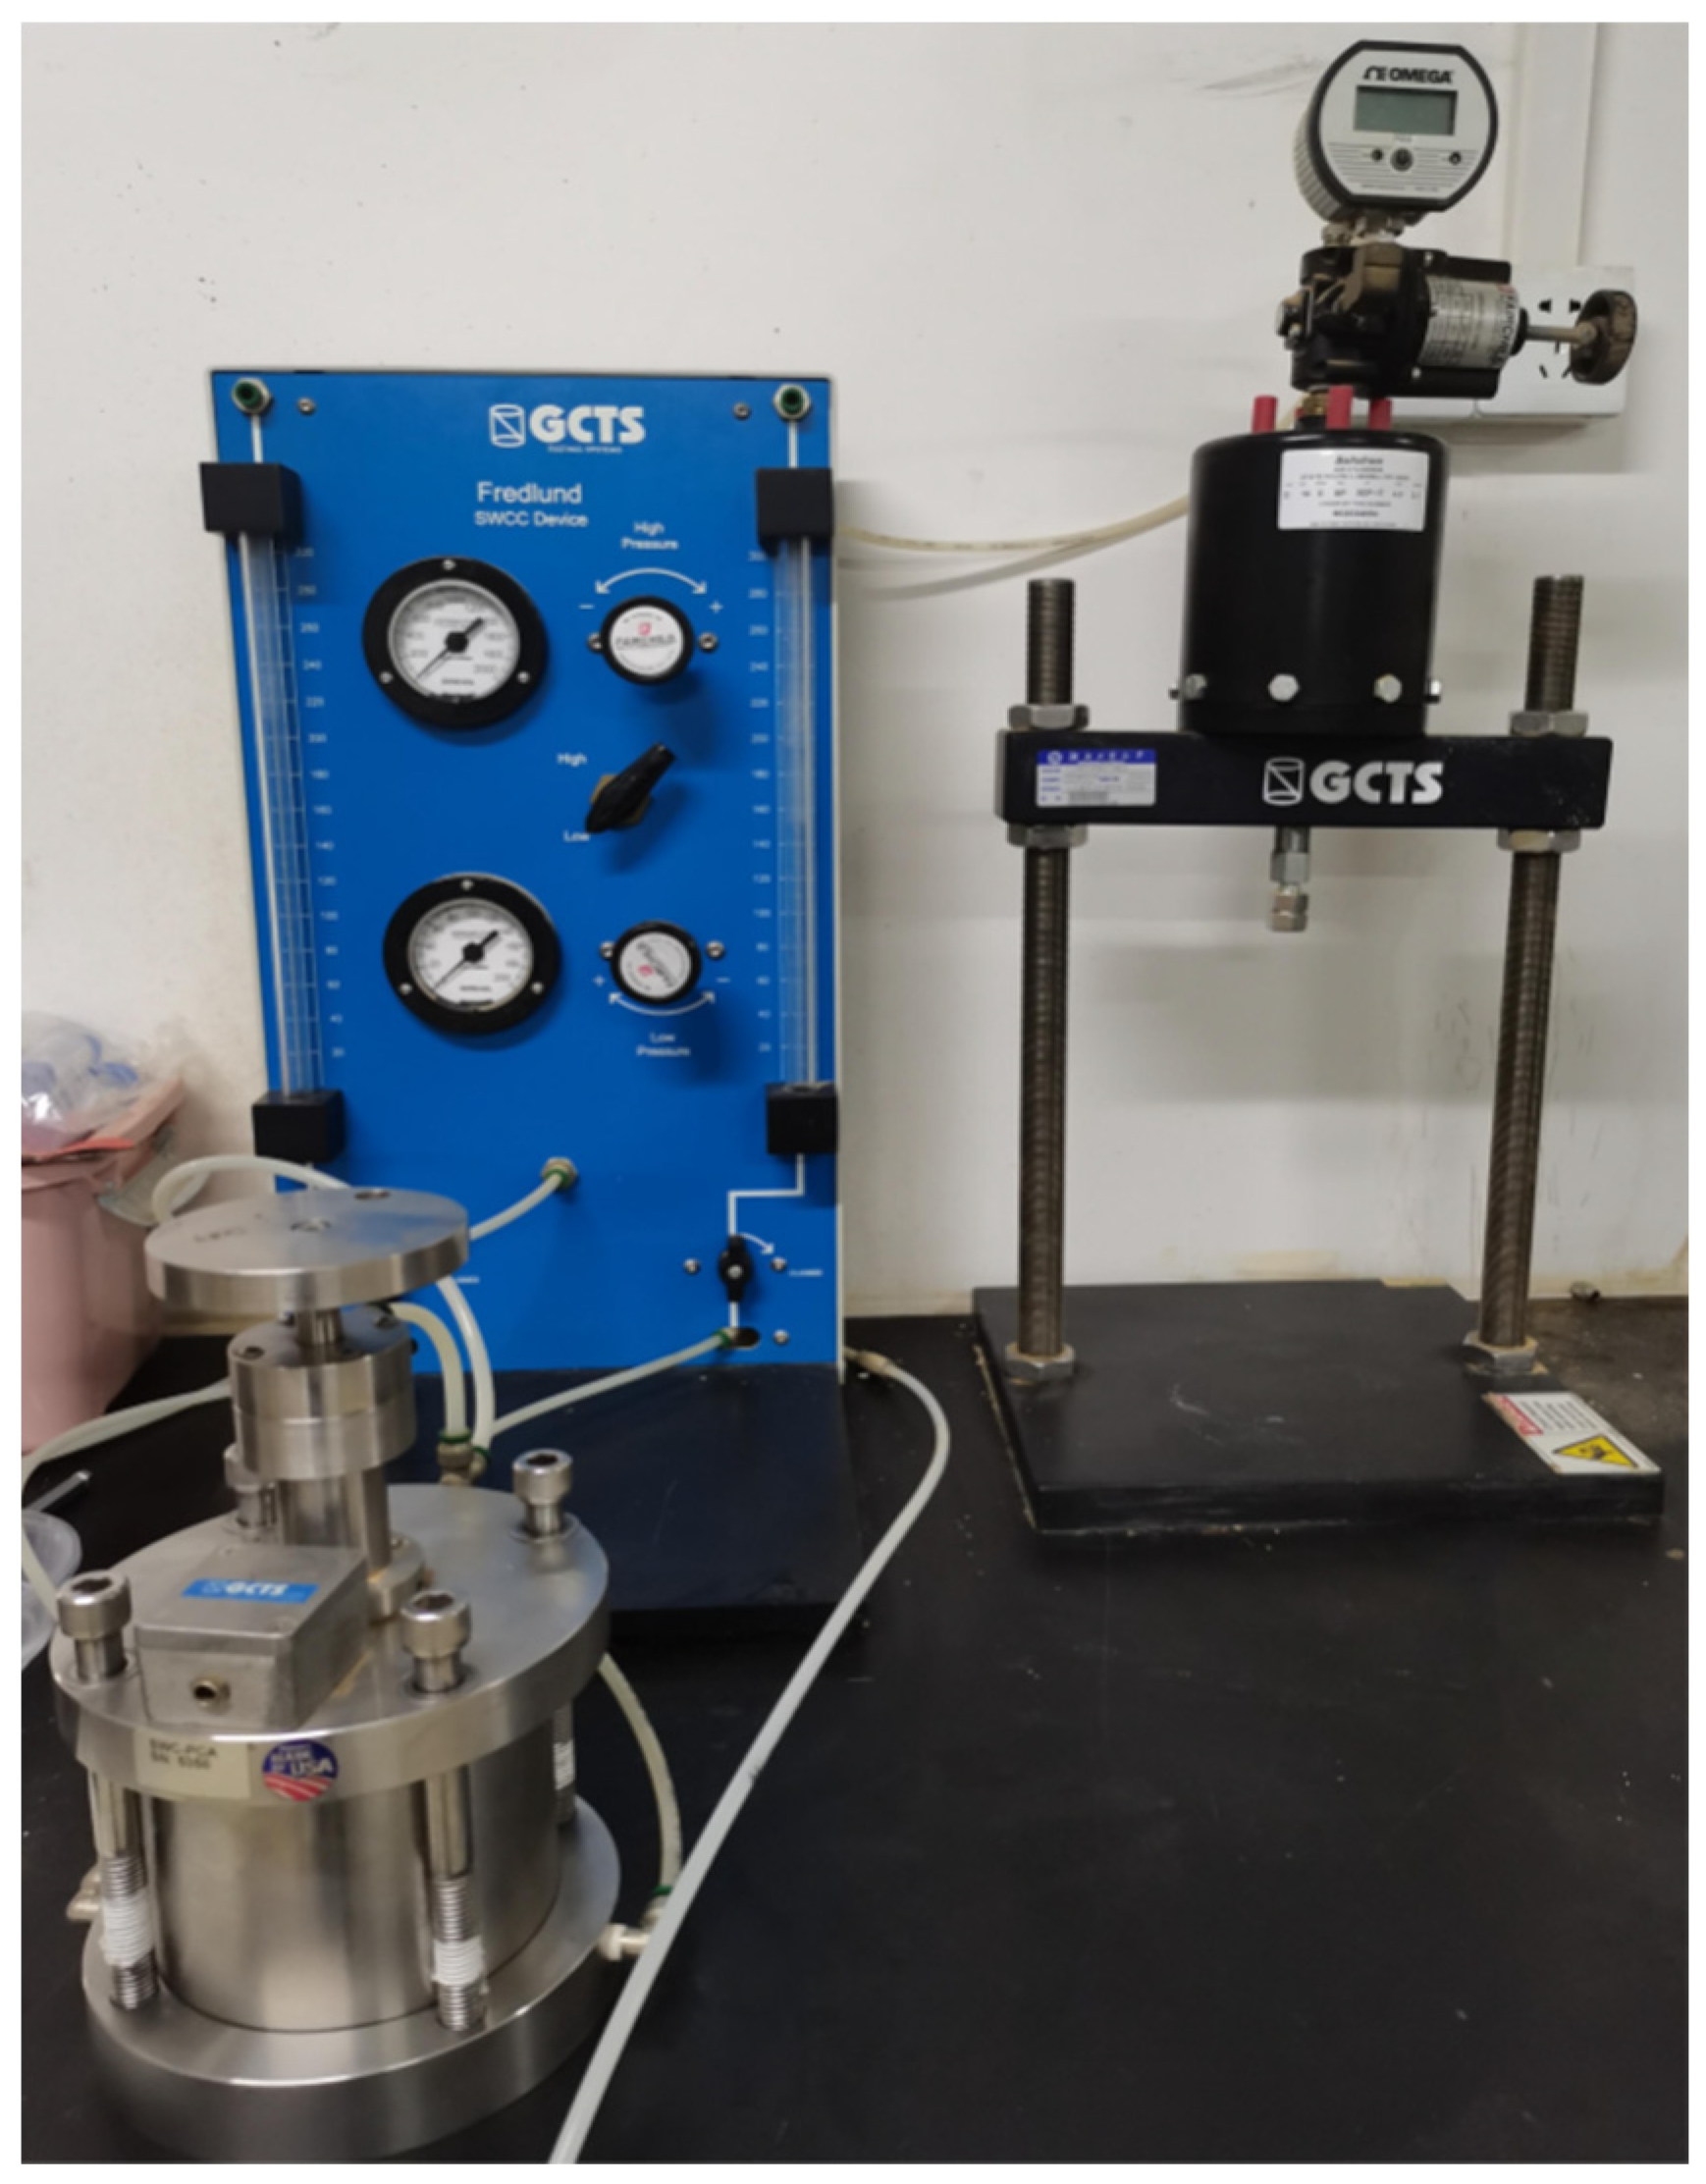
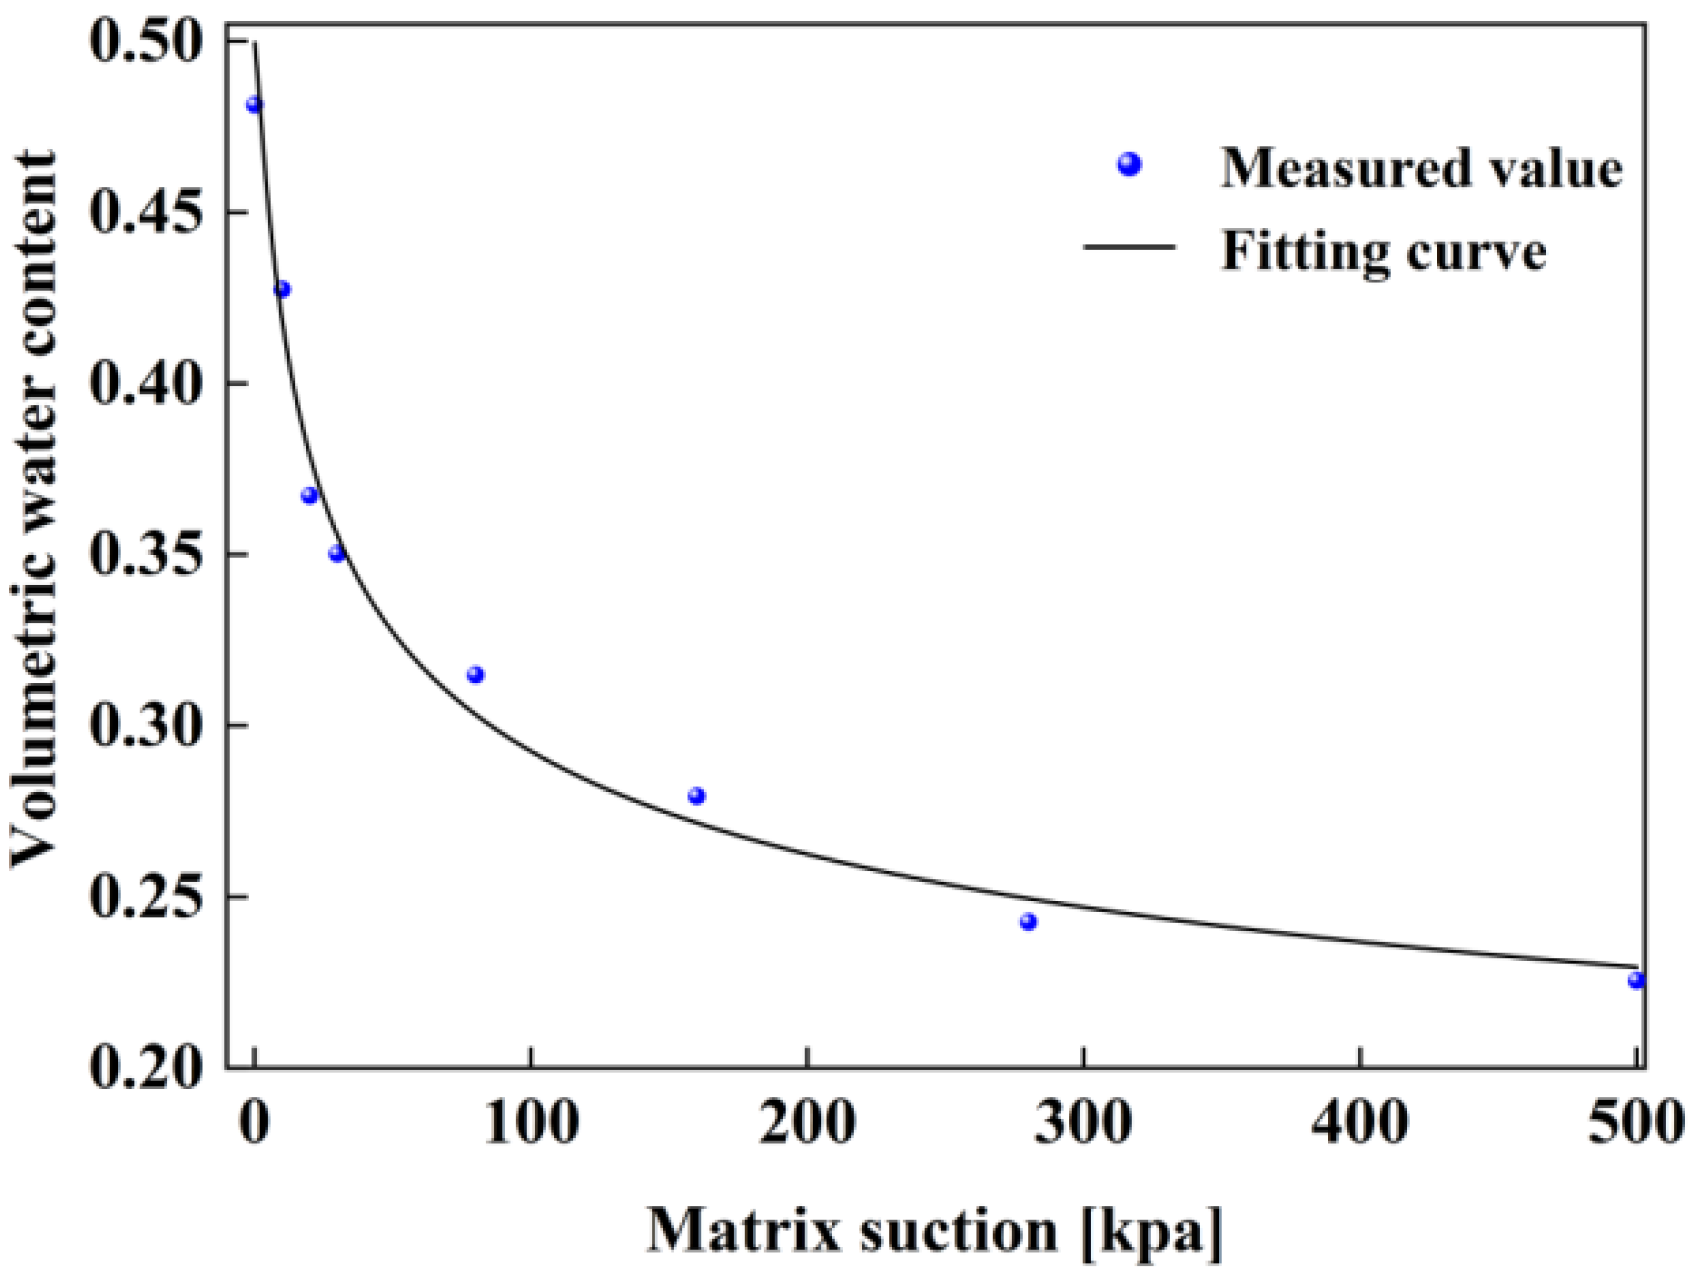
A pressure plate apparatus manufactured by GCTS, USA, is used for the indoor tests to measure the soil-water characteristic curve of the test clay as shown in
Figure 6. Then, the VG model [
19] is used to fit the measured data points, and the expression of the VG model is shown in equation (1):
where
denotes the volumetric water content;
and
are the saturated water content and residual water content, respectively;
represents the matrix suction (kPa);
a,
m, and
n are the fitting parameters, and
m = 1 − 1/
n. The fitting parameters of the soil-water characteristic curve of the specific test clay are given in
Table 3, and the soil-water characteristic curve of the test clay is depicted in
Figure 7.
The curve correlation coefficient R2 = 0.982 indicates a good fit. The relationship between soil water content and matrix suction in the slope model can be known from the VG model. Therefore, the corresponding relationship between matrix suction at the slope surface monitoring point and time can be calculated based on the relationship between volumetric water content at the slope surface monitoring point and time with the help of the VG model.
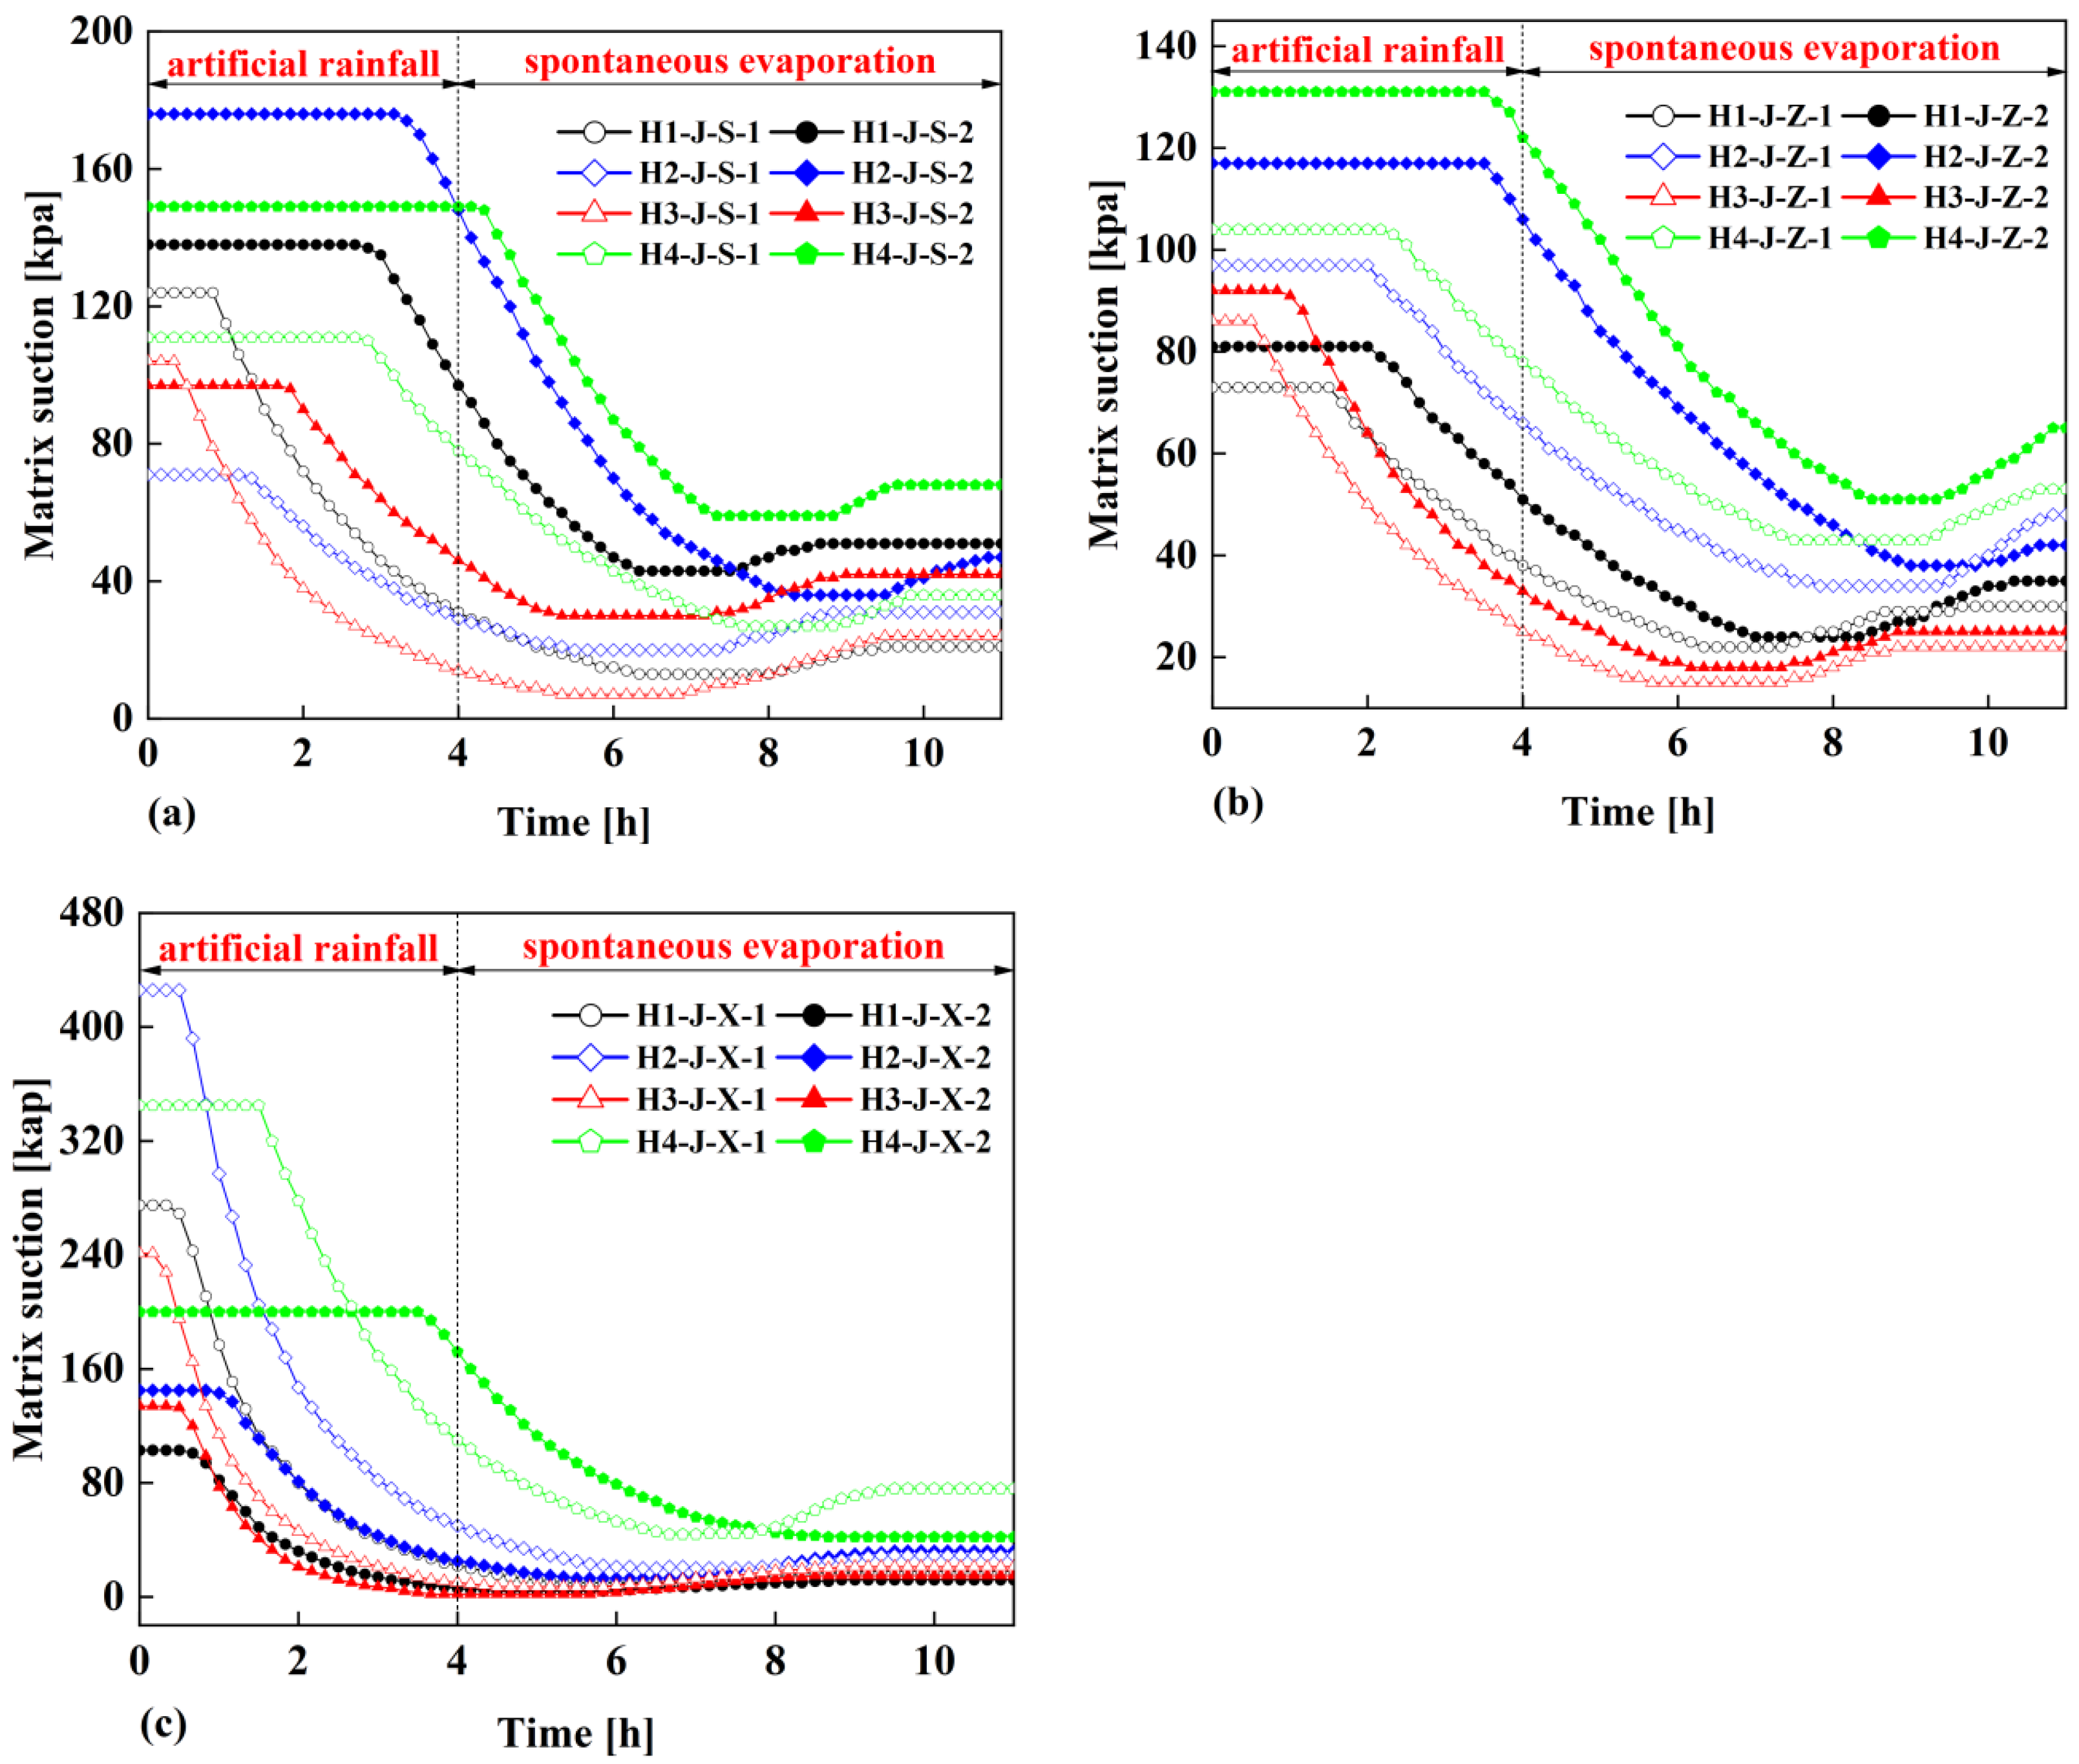
Figure 8 illustrates the relationship of matrix suction with time at the surface monitoring points of the four overburden slopes. After 4 hours of continuous rainfall and 7 hours of natural evaporation, the matric suction of the shallow soil of the four overburden slopes has changed significantly. In general, the matric suction shows a trend of first unchanged, then decreased, then increased and finally unchanged, but there are differences in the response time when the matrix suction of the shallow soil of the different vegetation overburden slopes begins to decrease. From the VG model, it can be found that there is an inverse relationship between water content and matrix suction. Therefore, the variation of matrix suction on the slope surface over time is exactly opposite to the trend of water content on the slope surface over time, but the initial response time is consistent.
3.3. Calculation of unsaturated permeability coefficient
In order to study the influence of different vegetation overburden on the permeability of the shallow soil layers of slopes under rainfall, the transient profile method is used herein to calculate the permeability coefficients of the shallow soil layers of the four overburden slopes [
9,
20]. The transient profile method refers to a method that utilizes the water content and matrix suction of each monitoring point to calculate the average water flow velocity and average hydraulic gradient of each monitoring point, and divides the average water flow velocity by the corresponding average hydraulic gradient to estimate the unsaturated permeability coefficient of the soil.
The unsaturated permeability coefficient varies with the variation of water content, so a small soil column of a certain time interval must be selected as the research object, and every two adjacent vertical slope surface water content monitoring points are chosen as the calculation interval here. In the process of calculating the unsaturated permeability coefficient, it is divided into three parts: the upper part of the slope surface, the middle part of the slope surface and the lower part of the slope surface. The following is the specific calculation process of the unsaturated permeability coefficient of the shallow soil at a vertical distance of 20cm and 40cm from the slope surface.
3.3.1. Average water content volume
Assuming that the water volume at each two water content monitoring points is linearly distributed, the average water content volume for two consecutive moments
, interval section 20–40 cm can be calculated as:
where
denotes the average water content volume (cm
3) of 20–40 cm interval at time
,
represents the water content volume (cm
3) at 20 cm and at time
,
depicts the water content volume (cm
3) at 40 cm and at time
; the physical meanings of
,
,
are the same as those at time
; L is the seepage length of
the vertical slope. The value of L is that the distance between the two soil
volumetric water content sensors in the surface soil is 20cm; A is the seepage
section (cm
2).
3.3.2. Average flow velocity
The average flow velocity during the time period
can be calculated by the following equation:
where
is the average flow rate (cm/s) in time period
.
3.3.3. Calculation of water head
The water head of a point in the soil is composed of position head, pressure head and velocity head. However, the water transport in the soil is slower compared to the position head, leading to that the velocity head can be ignored. Then, the water head of a point in the soil can be calculated as:
where
represents a point of the total head (cm);
denotes a point in the height above the reference plane (cm); and the reference plane in this paper is a distance of 20 cm from the slope surface then
;
is the pore water pressure (kPa), and according to the shear strength formula of unsaturated soil, the pore water pressure at a certain point in the soil is opposite to the matrix suction;
depicts the density of water with a value of 1.0 g/cm
3;
g is the acceleration of gravity with a value of 9.8 N/kg.
3.3.4. Average hydraulic gradient
The average hydraulic gradient is calculated using the forward differential method:
where
is the average hydraulic gradient within the period from
to
;
and
denote the water heads (cm) at a vertical distance of 40 cm and 20 cm from the slope surface at time
, respectively; the physical meanings of
and
are the same as those at time
.
3.3.5. Unsaturated permeability coefficient
The unsaturated permeability coefficient is the ratio of the average water flow velocity within a certain time period to the average hydraulic gradient within the corresponding time period, then the unsaturated permeability coefficient can be calculated as:
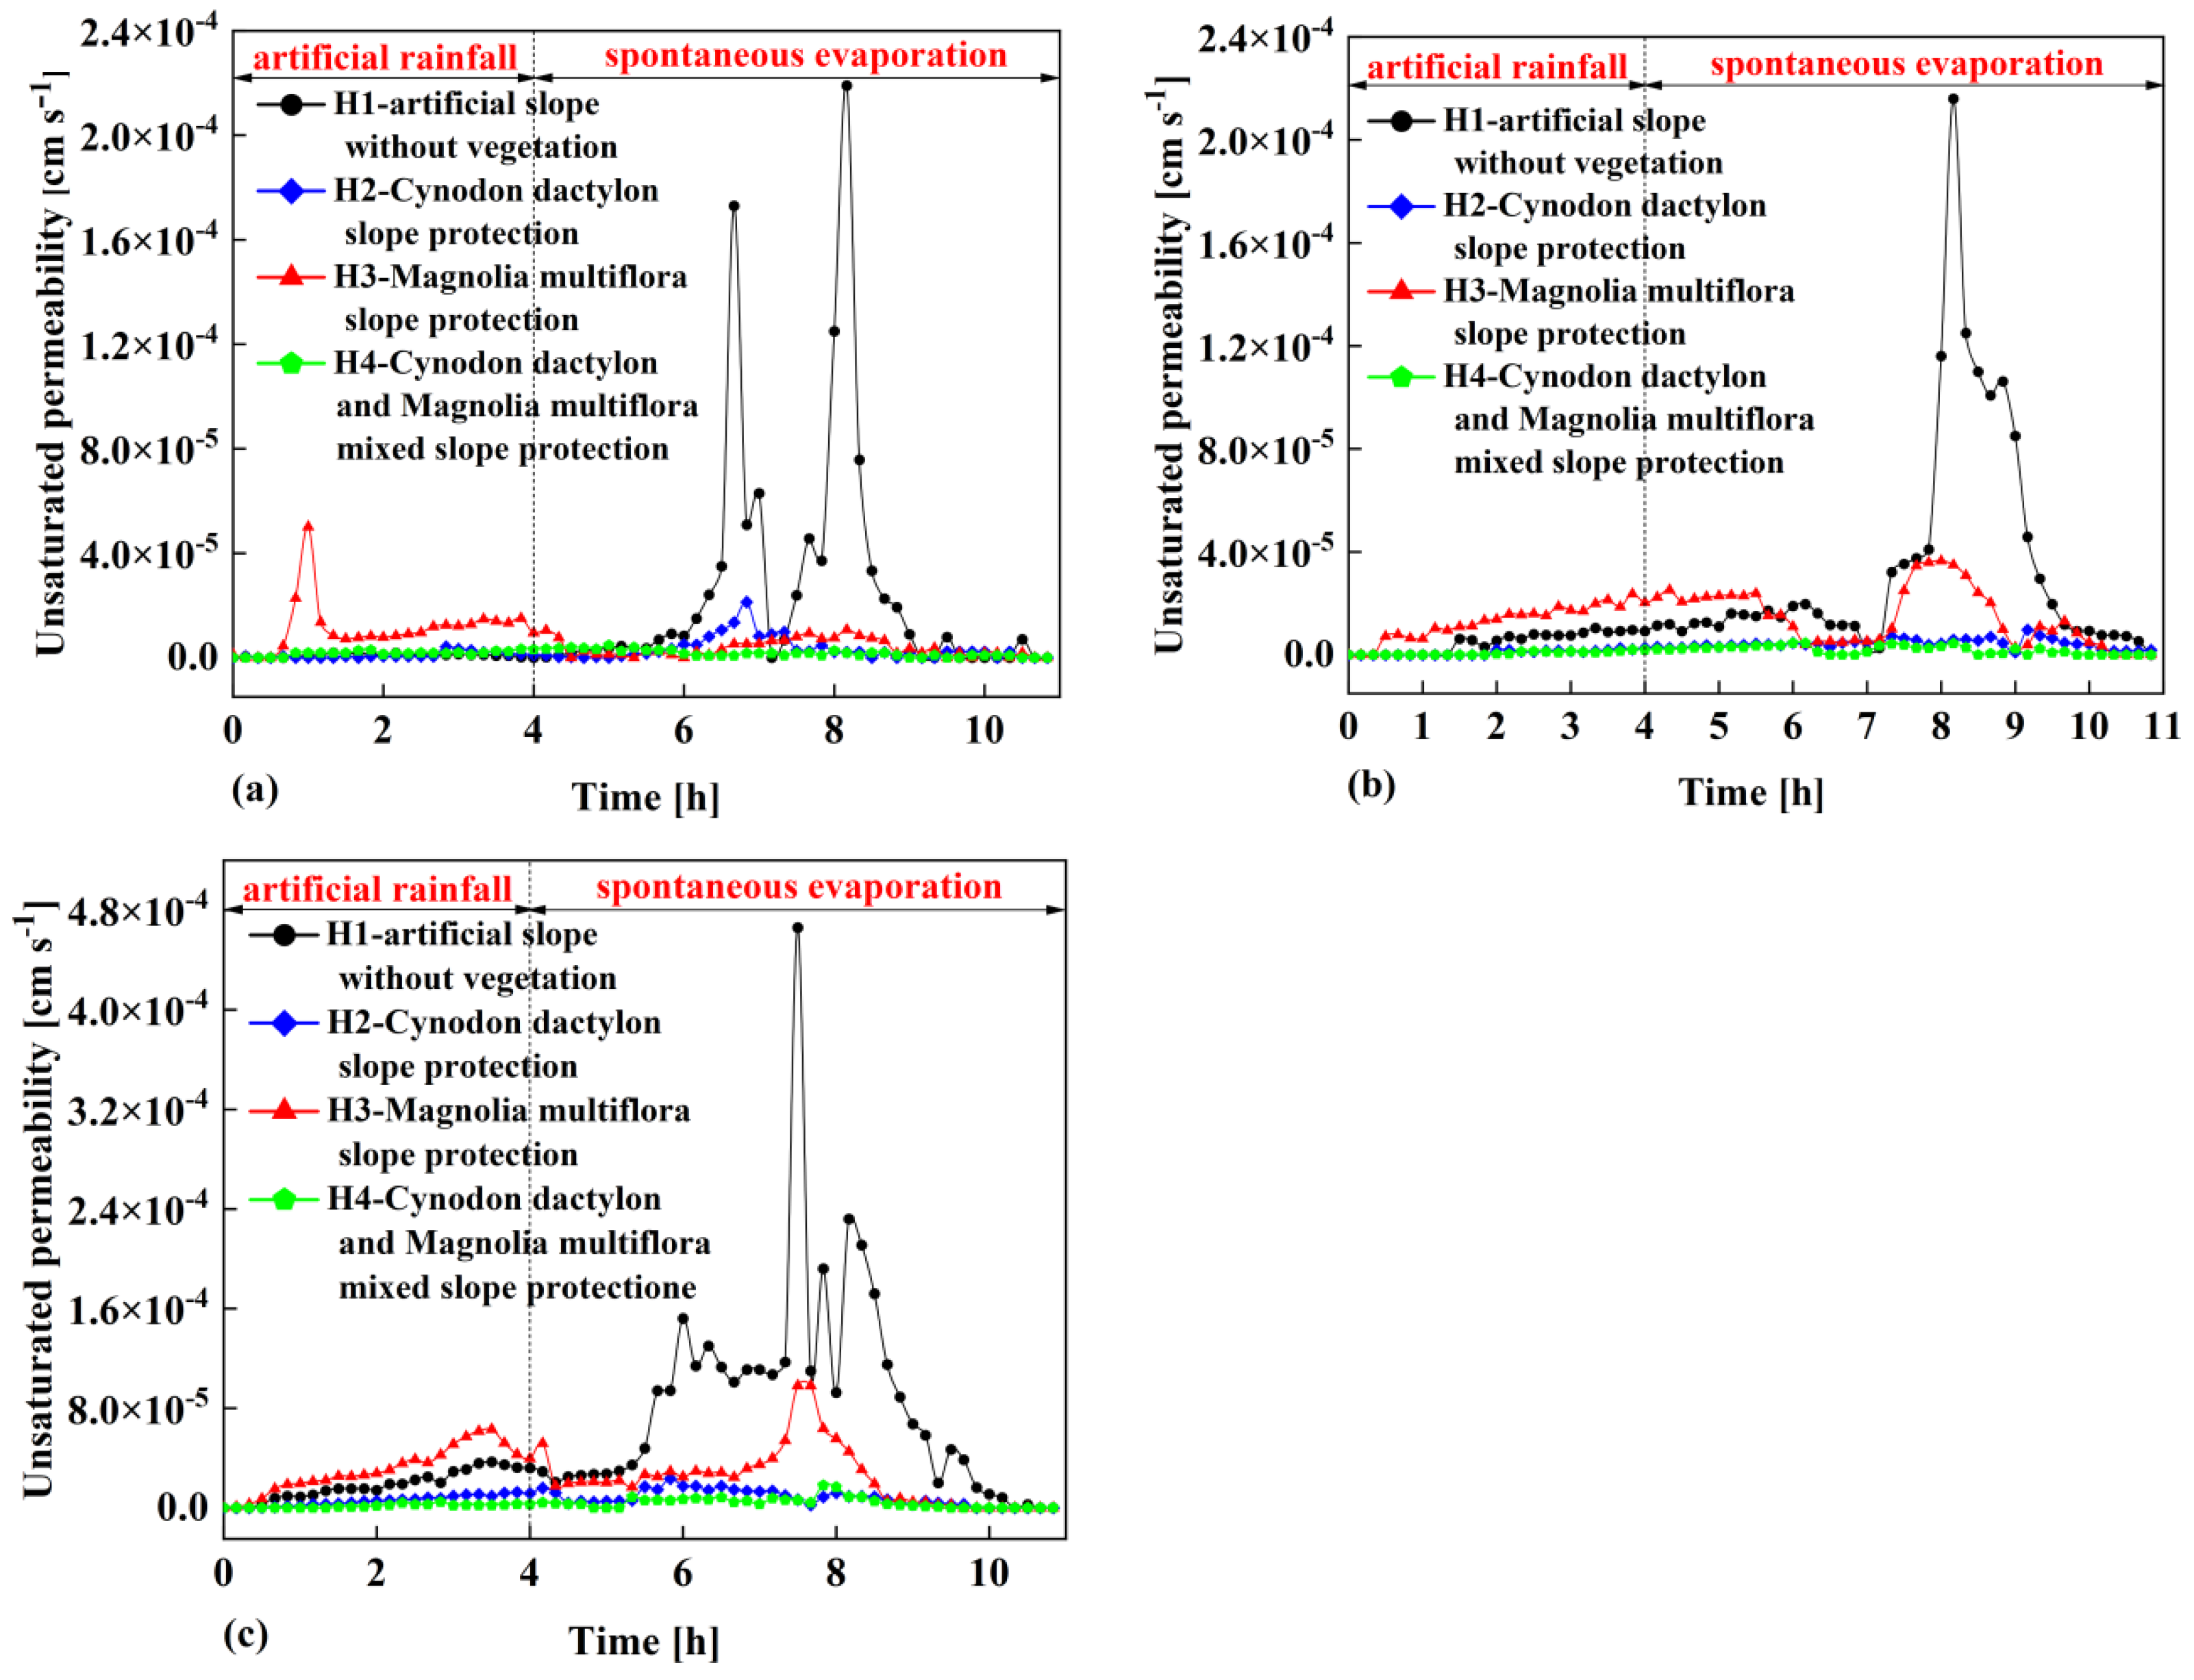
Figure 9 illustrates the time-dependent relationship of unsaturated permeability coefficients of shallow soil layers in the four overburden slopes calculated using the transient section method.
Figure 9a shows the relationship between the unsaturated permeability coefficient of the upper part of shallow soil in four overburden slopes and time. It is found that the permeability coefficient of the artificial slope without vegetation changes within the range of 2.58×10
-7cm/s ~ 2.19×10
-4cm/s with time. The permeability coefficient of the Cynodon dactylon overburden slope changes with time in the range of 3.09×10
-7cm/s ~ 2.13×10
-5cm/s, the permeability coefficient of the Magnolia multiflora overburden slope changes with time in the range of 1.08×10
-6cm/s ~ 5.01×10
-5cm/s, and the permeability coefficient of the Cynodon dactylon and Magnolia multiflora mixed slope changes with time in the range of 7.7×10
-7cm/s ~ 4.8×10
-6cm/s.
Figure 9b illustrates the relationship between the unsaturated permeability coefficient of the middle part of shallow soil in four overburden slopes and time. It can be seen that the permeability coefficient of the artificial slope without vegetation changes within the range of 1.43×10
-6cm/s ~ 2.16×10
-4cm/s with time. The permeability coefficient of the Cynodon dactylon overburden slope changes with time in the range of 9.44×10
-7cm/s ~ 9.73×10
-6cm/s, the permeability coefficient of the Magnolia multiflora overburden slope changes with time in the range of 2.92×10
-6cm/s ~ 3.65×10
-5cm/s, and the permeability coefficient of the Cynodon dactylon and Magnolia multiflora mixed slope changes with time in the range of 3.50×10
-7 cm/s ~ 4.64×10
-4 cm/s.
Figure 9c depicts the relationship between the unsaturated permeability coefficient of the lower part of shallow soil in four overburden slopes with time. It is found that the permeability coefficient of the artificial slope without vegetation changes within the range of 2.64×10
-6cm/s ~ 4.66×10
-4cm/s with time. The permeability coefficient of the Cynodon dactylon overburden slope changes with time in the range of 3.56×10
-7cm/s ~ 2.35×10
-5cm/s, the permeability coefficient of the Magnolia multiflora overburden slope changes with time in the range of 7.14×10
-7cm/s ~ 9.80×10
-5cm/s, and the permeability coefficient of the Cynodon dactylon and Magnolia multiflora mixed slope changes with time in the range of 6.80×10
-7cm/s ~ 1.80×10
-5cm/s.
As shown in Figs. 9a, 9b and 9c, it can be seen that whether in the upper part, middle part or lower part of the shallow soil of the four overburden slopes, the permeability coefficients of the shallow soil of the Cynodon dactylon overburden slope H2 and the Cynodon dactylon and Magnolia multiflora mixed slope H4 are always small, while the permeability coefficients of the shallow soil of the artificial slope H1 without vegetation and the Magnolia multiflora overburden slope H3 are always large, indicating that planting Cynodon dactylon or mixed planting Magnolia multiflora and Cynodon dactylon on the slope can reduce the permeability coefficient of the shallow soil of the slopes to a certain extent. It is worth noting that the permeability coefficients of the Magnolia multiflora overburden slope H3 and the artificial slope H1 without vegetation show different magnitude relationships at different experiment stages, indicating that planting Magnolia multiflora alone on the slope cannot always increase or decrease the unsaturated permeability coefficient of the surface soil of the slope, so further analysis of the data is needed.
From
Figure 9, it can also be found that with the continuous rainfall, the permeability coefficients of the shallow soil of the four overburden slopes show a trend from stable to fluctuating and finally stable. In the early stage of the experiment, the permeability coefficient of the shallow soil of the Magnolia multiflora overburden slope H3 always increases first, but the its maximum value is always larger than that of the slope H1 without vegetation. Overall, the permeability coefficient of the shallow soil of the slope H1 without vegetation is greater than that of the Magnolia multiflora overburden slope H3, indicating that the straight root system vegetation would increase the permeability coefficient of the shallow soil in the early stage of the test, but the influence of the root system vegetation of Magnolia multiflora on increasing the permeability coefficient of the shallow soil is not significant in the later stage of the experiment. The reason for these phenomena is that, Magnolia multiflora is a shrub plant with a conical root system and the most developed horizontal root system, and the effective root system is mainly distributed in the soil layer within the range of 0 ~ 60cm [
21]. Therefore, the pore structure of the soil layer within a vertical distance of about 60cm from the slope surface is destroyed, and the gap between the Magnolia multiflora root system and the soil during rainfall would provide a priority channel for rainwater infiltration. Therefore, in the early stage of rainfall, the permeability coefficient of the shallow soil of the Magnolia multiflora overburden slope H3 is larger than that of the slope H1 without vegetation. The rainwater falling on the slope H1 without vegetation carries away some of the soil on the slope H1 without vegetation to form slope runoff, while the other part of rainwater continues to infiltrate. This rainwater infiltration would form the seepage channel of the slope H1 without vegetation, which would continue to be expanded as the rainfall continues into the later stage. In contrast, the reinforcement effect of the Magnolia multiflora root system makes the seepage channel of the Magnolia multiflora overburden slope H3 not easy to expand. Therefore, the permeability coefficient of the shallow soil of the slope H1 without vegetation in the later stage of the test is larger than that of the Magnolia multiflora overburden slope H3.
In addition, it can be seen from Fig.9 that the permeability coefficient of the shallow soil of the Cynodon dactylon overburden slope H2 is larger than that of Cynodon dactylon and Magnolia multiflora mixed slope H4, but the overall fluctuation range of the two slopes is not as large as that of the slope H1 without vegetation and Magnolia multiflora overburden slope H3, indicating that fibrous root system vegetation would reduce the permeability coefficient of the shallow soil of slopes, and the mixture of straight root system and fibrous root system can minimize the permeability coefficient of the shallow soil of slopes. The reason for these phenomena is that, Cynodon dactylon is a herbaceous plant with luxuriant and dense stems and leaves. The root system is mainly distributed in the shallow soil layer. The root system grows in the shallow soil layer, encapsulating the shallow soil particles and filling the small gaps between the soil particles, thus reducing the permeability coefficient of the shallow soil layer. In the process of rainfall, firstly, the stems and leaves of Magnolia multiflora in the Cynodon dactylon and Magnolia multiflora mixed slope H4 would intercept rainwater, thereby reducing the infiltration of some rainwater into the slope. Secondly, the above analysis shows that Cynodon dactylon would reduce the permeability coefficient of the shallow soil of the slope. Therefore, the mixed planting of the two vegetations makes the permeability coefficient of the shallow soil of the Cynodon dactylon and Magnolia multiflora mixed slope H4 minimum and its anti-seepage ability best.
4. Conclusions
In this paper, a series of artificial rainfall experiments are conducted on four kinds of overburden slopes to study the permeability of shallow soil and the water migration law of rainwater in the slopes with different vegetation. The following conclusions can be drawn from the study:
(1) The response time of water content monitoring points with the same buried depth and different locations is different. The closer the distance of the monitoring points to the slope surface is, the shorter the response time is. Some water content monitoring points far away from the slope only begin to respond after the end of rainfall, indicating that the infiltration rate of rainwater in the slopes is different.
(2) The infiltration rate of each overburden slope shows the law from fast to slow in turn: Magnolia multiflora overburden slope, artificial slope without vegetation, Cynodon dactylon overburden slope, Cynodon dactylon and Magnolia multiflora mixed slope, indicating that the initial rainfall falling on the Magnolia multiflora overburden slope is easier to infiltrate.
(3) In the early stage of rainfall, the permeability coefficient of the Magnolia multiflora overburden slope is the largest. As the rainfall continues, the permeability coefficient of the artificial slope without vegetation becomes the largest, followed by that of the Magnolia multiflora overburden slope. This indicates that in the early stage of rainfall, the straight root vegetation can increase the permeability coefficient of shallow soil, but in the later stage of the test, the root system of Magnolia multiflora vegetation has no obvious effect on increasing the permeability coefficient of shallow soil.
(4) The permeability coefficient of Cynodon dactylon overburden slope is larger than that of Cynodon dactylon and Magnolia multiflora mixed slope, but the overall fluctuation range of the two slopes is not as large as that of artificial slope without vegetation and Magnolia multiflora overburden slope. The phenomena reveal that fibrous root system vegetation can reduce the permeability coefficient of shallow soil to a certain extent, while the mixed planting of straight root vegetation and fibrous root vegetation has the best reduction effect on the permeability coefficient of shallow soil of slopes.
Acknowledgments
This research is supported by the National Natural Science Foundation of China (Grant Nos. 52178371, 52108355, 52178321), the Outstanding Youth Project of Natural Science Foundation of Zhejiang Province (Grant No. LR21E080005). The China Postdoctoral Science Foundation Funded Project (Grant No. 2020M673093, 2022M712964), the Research Project of Engineering Research Centre of Rock-Soil Drilling & Excavation and Protection, Ministry of Education (Grant No.202305), the Exploring Youth Project of Zhejiang Natural Science Foundation (LQ22E080010), the Zhejiang Province's 2022 Key R&D Plan Project-'Lingyan' Project (2022C03151), the Science and Technology Project of Zhejiang Provincial Communication Department (202305-2), and the Construction Research Founds of Department of Housing and Urban-Rural Development of Zhejiang Province (Grant No. 2021K256) are also acknowledged.
References
- Chandrasekaran, S.S.; Owaise, R.S.; Ashwin, S. Investigation on infrastructural damages by rainfall-induced landslides during November 2009 in Nilgiris, India. Natural Hazards. 2013, 65, 1535–1557. [Google Scholar] [CrossRef]
- Pradhan, S.; Toll, D.G.; Rosser, N.J. An investigation of the combined effect of rainfall and road cut on landsliding. Engineering Geology. 2022, 307, 106787. [Google Scholar] [CrossRef]
- Zhang, J.; Li, J.T.; Lin, H.; H, M.P.; Chang, R.Q. Delay phenomenon of shallow slope failure triggered by rainfall and its correlation with soil parameters. Journal of Central South University (Science and Technology). 2018, 49, 150–157. [Google Scholar]
- Tan, S.H.; Wang, Y.M. Research progress and thinking of bioengineering techniques for slope protection in expressway. Research of soil and water conservation. 2004, 11, 81–84. [Google Scholar]
- Li, X.G.; Mao, W.B.; Xu, F.Y. Greening and Protection of Highway Slopes in Japan—A Report on the Investigation to Japan in 1994. Journal of Highway and Transportation Research Development. 1995, 59–64. [Google Scholar]
- Wu, H. W; Atmosphere-plant-soil interactions: theories and mechanisms. Chinese Journal of Geotechnical Engineering. 2017, 39, 1–47. [Google Scholar]
- Qin, X.H.; Liu, D.S.; Song, Q.H.; Du, C.H.; Wang, X. Experimental study on one-dimensional vertical infiltration in soil column under rainfall and the derivation of permeability coefficient. Chinese Journal of Rock Mechanics and Engineering. 2017, 36, 475–484. [Google Scholar]
- Jiao, W.G.; Zhan, L.T.; Ji, Y.X.; He, M.W.; Liu, Z.N. Experimental study on effects of vegetation on water transport and storage in soil overburden. Chinese Journal of Geotechnical Engineering. 2020, 42, 1268–1275. [Google Scholar]
- Chen, J.L.; Li, J,H. ; Cheng, P.; Song, L.; Zhou, T. Field test on seepage performance of soil cover with different types of vegetation. Rock and Soil Mechanics. 2018, 39, 222–228. [Google Scholar]
- Cheng, P.; Li, J.H.; Song, L. Hydraulic and mechanical characteristics of ecological slopes: experimental study. Chinese Journal of Geotechnical Engineering. 2017, 39, 1901–1907. [Google Scholar]
- Song, L.; Li, J.H.; Zhou, T. Experimental study on unsaturated hydraulic properties of vegetated soil. Ecological Engineering. 2017, 103, 207–216. [Google Scholar] [CrossRef]
- Bordoloi, S.; Garg, A.; Sreedeep, S. Investigation of cracking and water availability of soil-biochar composite synthesized from invasive weed water hyacinth. Bioresource Technology. 2018, 263, 665–677. [Google Scholar] [CrossRef] [PubMed]
- Li, X.W.; Kong, L.W.; Guo, A.G. Permeability and mechanical characteristics of expansive soil and cut slope protection mechanism under vegetation action. Rock and Soil Mechanics. 2013, 34, 85–91. [Google Scholar]
- Xu, X.T.; Jian, W.B.; Wu, N.S.; Xu, X.; Liu, J.L. Unsaturated seepage characteristics of slope under rainfall infiltration. Earth Science. 2018, 43, 922–932. [Google Scholar]
- Zeng, C.L; Li, R.J.; Guan, X.D.; Zhang, S.B.; Bai, W.S. Experimental study on rainfall infiltration characteristics of loess slopes under different rainfall intensities. Chinese Journal of Geotechnical Engineering. 2020, 42 (Suppl. 1), 111–115. [Google Scholar]
- Yang, G.L.; Li, Y.L.; Zhao, T.Y.; Duan, R.K.; Li, H.F. Humidity evolution and stability analysis of expansive soil ecological slope under rainfall conditions. Journal of Railway Science and Engineering, 1-11[2023-04-03].
- Zeng, L.; Chen, J.Y.; Liu, J. Study on Seepage Characteristics of Red Clay Slope With Fracture Zone Based on Fluorescence Tracer Method. China Journal of Highway and Transport. 2023, 36, 136. [Google Scholar]
- China Academy of Transportation Science. Test Methods of Soils for Highway Engineering: JTG E40-2007. China Communications Press. 2007.
- Genuchten, V.; Th, M. A closed-form equation for predicting the hydraulic conductivity of unsaturated soils. Soil Science Society of America Journal. 1980, 44, 892–898. [Google Scholar] [CrossRef]
- Fredlund, D.G.; Rahardjo, H. Soil mechanics for unsaturated soils. New York: John Wiley and Sons, Inc. 1993.
- Liu, A.L.; Yi, W.; Lu, Y.R.X. Study on Root Morphology of Magnolia multiflora in Northern Hunan. Mass standardization. 2020, 117–119. [Google Scholar]
|
Disclaimer/Publisher’s Note: The statements, opinions and data contained in all publications are solely those of the individual author(s) and contributor(s) and not of MDPI and/or the editor(s). MDPI and/or the editor(s) disclaim responsibility for any injury to people or property resulting from any ideas, methods, instructions or products referred to in the content. |
© 2023 by the authors. Licensee MDPI, Basel, Switzerland. This article is an open access article distributed under the terms and conditions of the Creative Commons Attribution (CC BY) license (http://creativecommons.org/licenses/by/4.0/).
