Submitted:
04 August 2023
Posted:
10 August 2023
Read the latest preprint version here
Abstract
Keywords:
Introduction
2. Materials and Methods
2.1. Participants
2.2. Body Composition Assessment
2.3. Statistical Methods
3. Results
4. Discussion
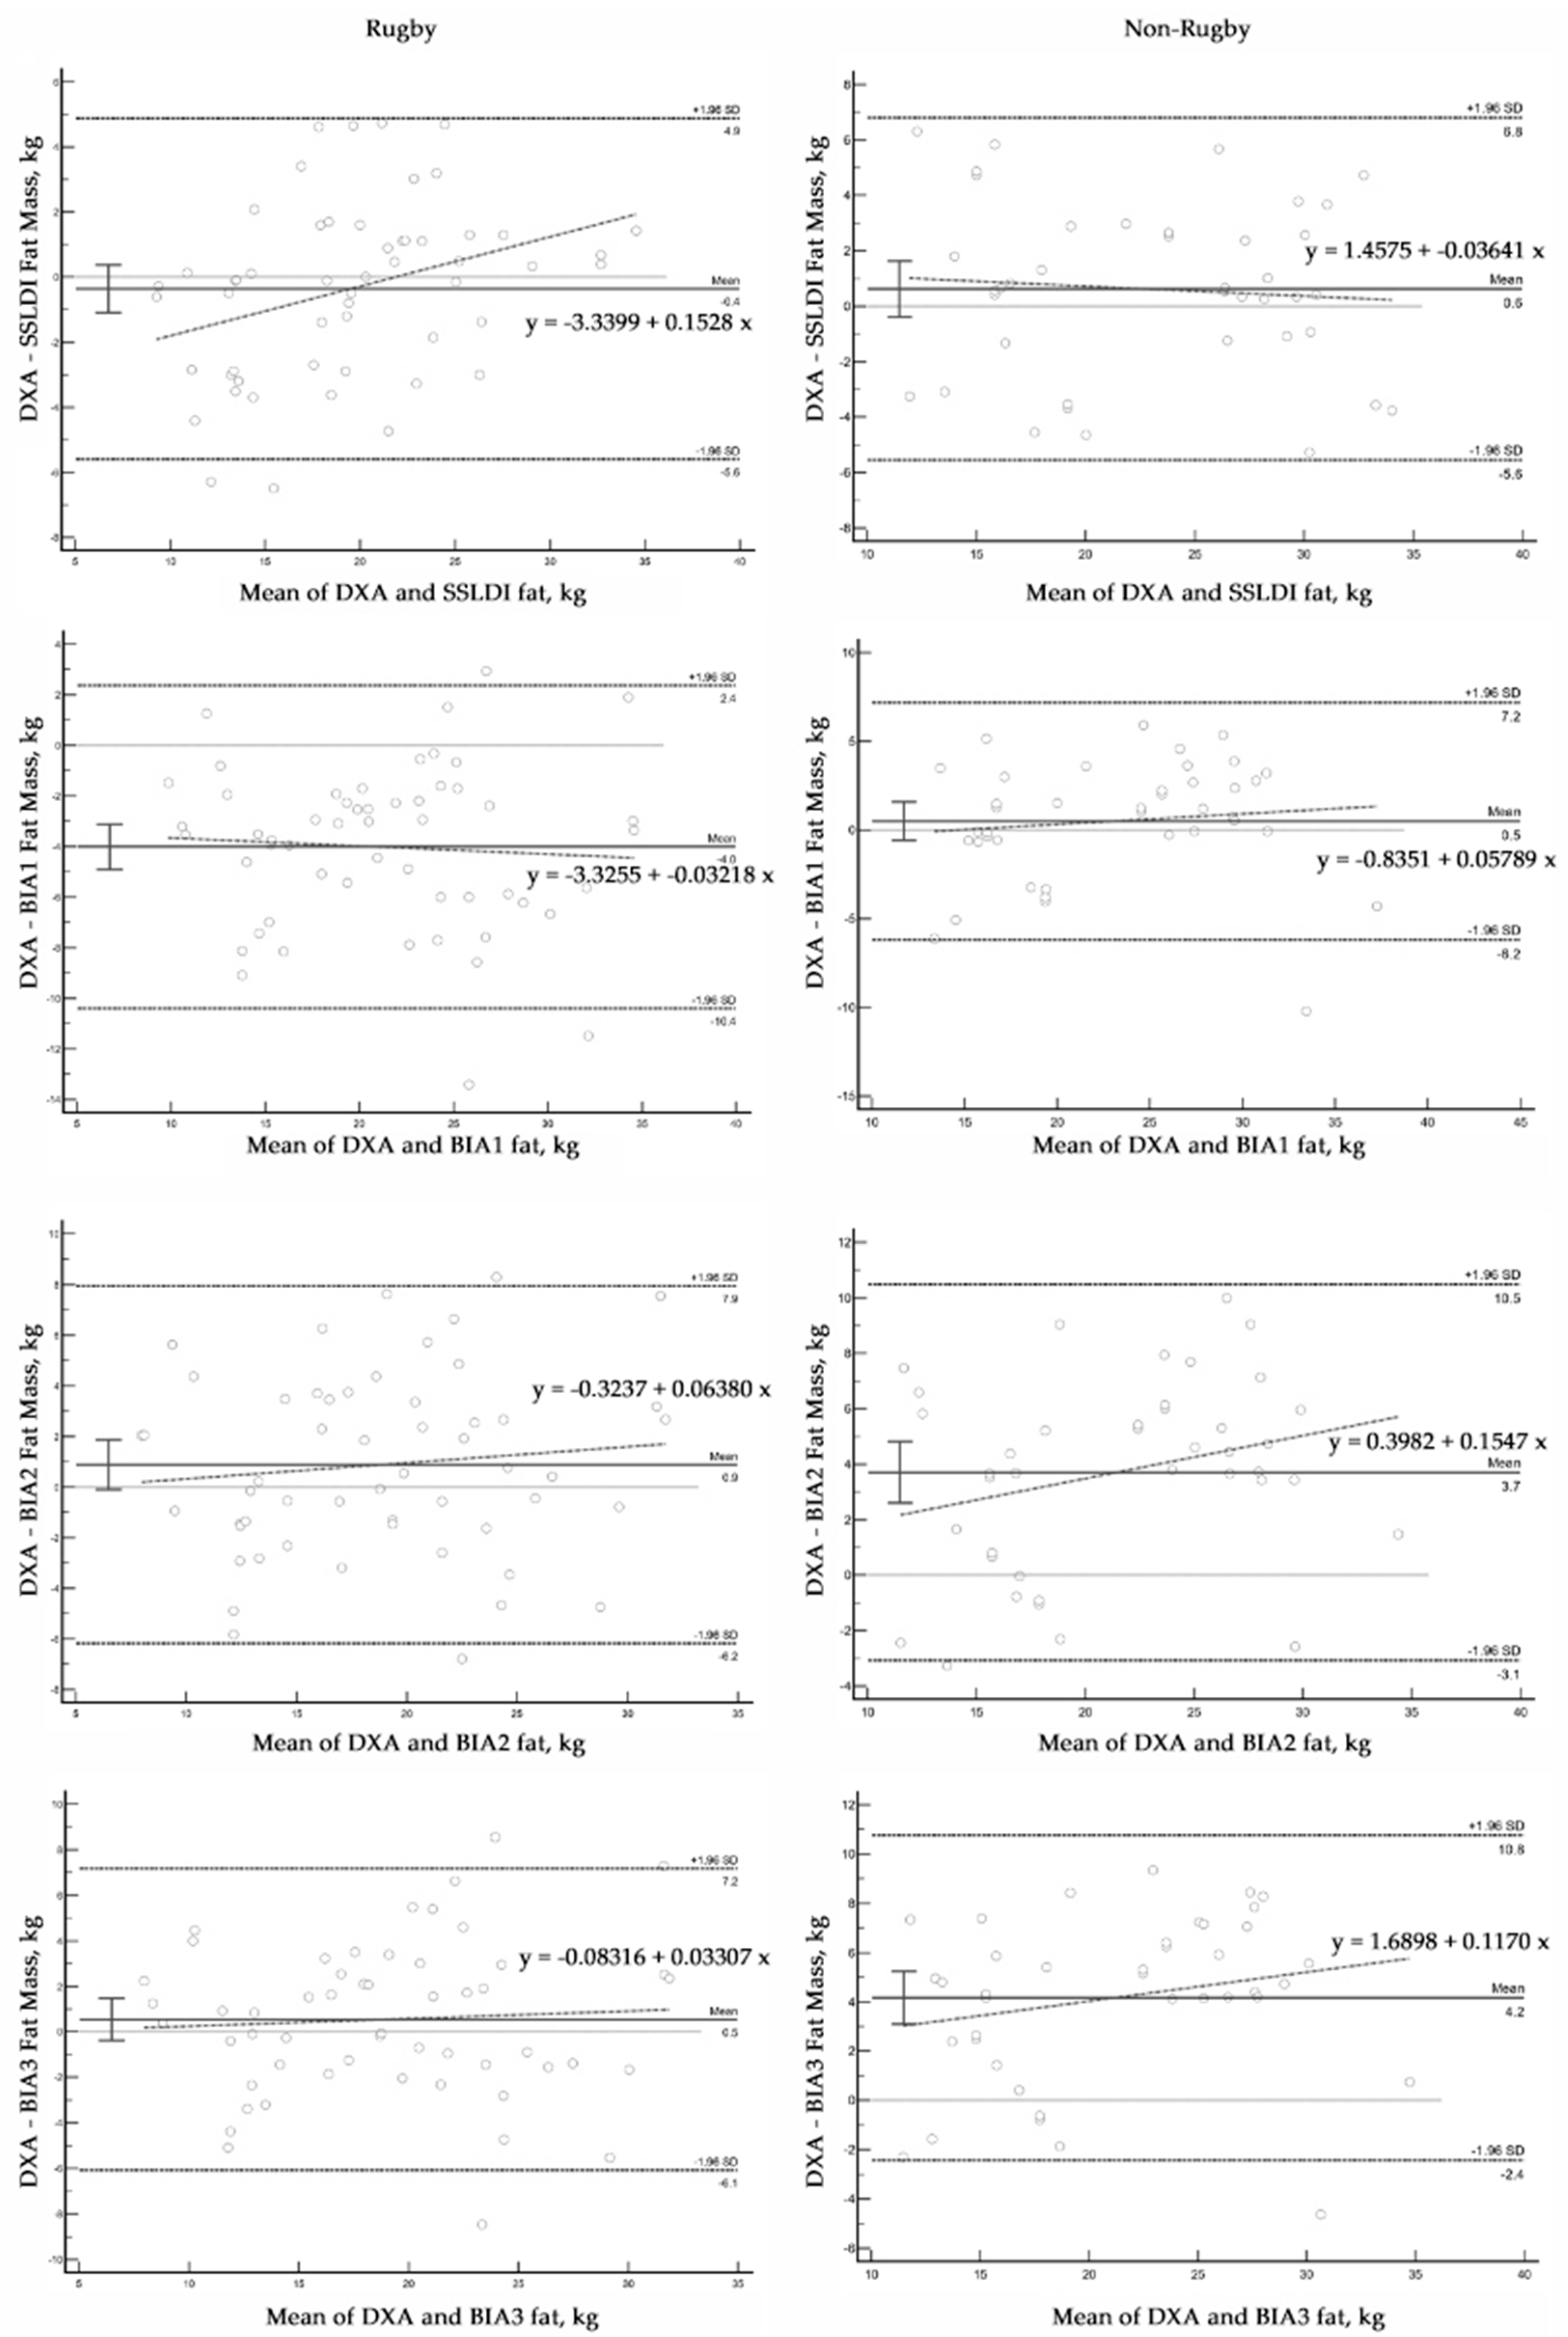
- The independent variables in the BIA prediction models offer potential sources of error in the prediction of FFM. The common predictors of Ht2/R and R are significantly related to TBW. Thus, an increase of ECW in individuals with excess body fat increases TBW and decreases R, which assuming constant hydration of FFM, can overestimate FFM and thus underestimate FM. The BIA models also include body weight, which is highly correlated with body fat, and can vary depending on environmental, dietary, and physical activity conditions and hence affect hydration. Additionally, the application of BIA prediction equations in groups in whom the original model was not developed can lead to errors. It is well established that body geometry (e.g., limb length, cross-sectional area, and volume) and fluid content (total and distribution) directly affect resistivity and contribute to inter-individual differences in whole body and regional BIA measurements [37,40]. Additionally, regional BIA measurements using different electrode placements, such as foot-to-foot and hand-to-hand, yield discordant estimates of body composition compared to whole-body measurements [41]. These factors contribute to the errors in BIA predictions of body fat using various BIA methods and models and DXA in the present study and other reports [20,21].
5. Conclusions
Author Contributions
Funding
Institutional Review Board Statement
Informed Consent Statement
Data Availability Statement
Acknowledgments
Conflicts of Interest
References
- World Health Organization. Obesity and Overweight—Fact Sheet. 2021. Available online: https://www.who.int/news-room/fact-sheets/detail/obesity-and-overweight.
- GBD 2015 Obesity Collaborators; Afshin, A. ; Forouzanfar, M.H.; Reitsma, M.B.; et al. Health effects of overweight and obesity in 195 countries over 25 years. N. Engl. J. Med. 2017, 377, 13–27.
- Okunogbe, A.; Nugent, R.; Spencer, G.; Ralston, J.; Wilding, J. Economic impacts of overweight and obesity: Current and future estimates for eight countries. BMJ Glob. Health 2021, 6, e006351. [Google Scholar] [CrossRef] [PubMed]
- Wellens, R.I.; Roche, A.F.; Khamis, H.J.; Jackson, A.S.; Pollock, M.L.; Siervogel, R.M. Relationships between the body mass index and body composition. Obes. Res. 1996, 4, 35–44. [Google Scholar] [CrossRef] [PubMed]
- Frankenfield, D.C.; Rowe, W.A.; Cooney, R.N.; Smith, J.S.; Becker, D. Limits of body mass index to detect obesity and predict body composition. Nutrition. 2001, 17, 26–30. [Google Scholar] [CrossRef] [PubMed]
- Okorodudu, D.O.; Jumean, M.F.; Montori, V.M.; Romero-Corral, A.; Somers, V.K.; Erwin, P.J.; Lopez-Jimenez, F. Diagnostic performance of body mass index to identify obesity as defined by body adiposity: a systematic review and meta-analysis. Int. J. Obes. (Lond) 2010, 34, 791–799. [Google Scholar] [CrossRef]
- Tomiyama, A.J.; Hunger, J.M.; Nguyen-Cuu, J.; Wells, C. Misclassification of cardiometabolic health when using body mass index categories in NHANES 2005-2012. Int. J. Obes. (Lond) 2016, 40, 883–886. [Google Scholar] [CrossRef]
- Gonzalez, M.C.; Correia, M.I.T.D.; Heymsfield, S.B. A requiem for BMI in the clinical setting. Curr. Opin. Clin. Nutr. Metab. Care. 2017, 20, 314–321. [Google Scholar] [CrossRef]
- Frühbeck, G.; Kiortsis, D.N.; Catalán, V. Precision medicine: diagnosis and management of obesity. Lancet Diabetes Endocrinol. 2018, 6, 164–166. [Google Scholar] [CrossRef]
- Salmón-Gómez, L.; Catalán, V.; Frühbeck, G.; Gómez-Ambrosi, J. Relevance of body composition in phenotyping the obesities. Rev. Endocr. Metab. Disord. 2023. [Google Scholar] [CrossRef]
- Romero-Corral, A.; Somers, V.K.; Sierra-Johnson, J.; Thomas, R.J.; Collazo-Clavell, M.L.; Korinek, J.; Allison, T.G.; Batsis, J.A.; Sert-Kuniyoshi, F.H.; Lopez-Jimenez, F. Accuracy of body mass index in diagnosing obesity in the adult general population. Int. J. Obes. (Lond) 2008, 32, 959–966. [Google Scholar] [CrossRef]
- Holmes, C.J.; Racette, S.B. The utility of body composition assessment in nutrition and clinical practice: an overview of current methodology. Nutrients. 2021, 13, 2493. [Google Scholar] [CrossRef]
- Borga, M.; West, J.; Bell, J.D.; Harvey, N.C.; Romu, T.; Heymsfield, S.B.; Dahlqvist Leinhard, O. Advanced body composition assessment: from body mass index to body composition profiling. J. Investig. Med. 2018, 66, 1–9. [Google Scholar] [CrossRef]
- Sommer, I.; Teufer, B.; Szelag, M.; Nussbaumer-Streit, B.; Titscher, V.; Klerings, I.; Gartlehner, G. The performance of anthropometric tools to determine obesity: a systematic review and meta-analysis. Sci. Rep. 2020, 10, 12699. [Google Scholar] [CrossRef] [PubMed]
- Laine, C.; Wee, C.C. Overweight and obesity: clinical challenges. Ann. Int. Med. 2023, 176, 699–700. [Google Scholar] [CrossRef] [PubMed]
- Report of the Council on Science and Public Health. American Medical Association. Is obesity a disease? CSAPH Report 3-A-13. Available online: https://www.ama-assn.org/sites/ama-assn.org/files/corp/media-browser/public/about-ama/councils/Council%20Reports/council-on-science-public-health/a13csaph3.pdf.
- Mestre, L.M.; Lartey, S.T.; Ejima, K.; Mehta, T.; Keith, S.; Maki, K.; Allison, D.B. Body mass index, obesity, and mortality–Part I. Associations and limitations. Nutr. Today. 2023, 58, 92–99. [Google Scholar] [CrossRef]
- Lukaski, H.C.; Vega Diaz, N.; Talluri, A.; Nescolarde, L. Classification of hydration in clinical conditions: indirect and direct approaches using bioimpedance. Nutrients. 2019, 11, 809. [Google Scholar] [CrossRef] [PubMed]
- Fedewa, M.V.; Sullivan, K.; Hornikel, B.; Holmes, C.J.; Metoyer, C.J.; Esco, M.R. Accuracy of a mobile 2D imaging system for body volume and subsequent composition estimates in a three-compartment model. Med. Sci. Sports Exerc. 2021, 53, 1003–1009. [Google Scholar] [CrossRef]
- Nana, A.; Staynor, J.M.D.; Arlai, S.; El-Sallam, A.; Dhungel, N.; Smith, M.K. Agreement of anthropometric and body composition measures predicted from 2D smartphone images and body impedance scales with criterion methods. Obes. Res. Clin. Pract. 2022, 16, 37–43. [Google Scholar] [CrossRef]
- Majmudar, M.D.; Chandra, S.; Yakkala, K.; Kennedy, S.; Agrawal, A.; Sippel, M.; Ramu, P.; Chaudhr, A.; Smith, B.; Criminisi, A.; Heymsfield, S.B.; Stanford, F.C. Smartphone camera-based assessment of adiposity: A validation study. NPJ Digit. Med. 2022, 5, 79. [Google Scholar] [CrossRef]
- Farina, G.L.; Orlandi, C.; Lukaski, H.; Nescolarde, L. Digital single-image smartphone assessment of total body fat and abdominal fat using machine learning. Sensors 2022, 22, 8365. [Google Scholar] [CrossRef]
- Waki, M.; Kral, J.G.; Mazariegos, M.; Wang, J.; Pierson, R.N. Jr.; Heymsfield, S.B. Relative expansion of extracellular fluid in obese vs. nonobese women. Am. J. Physiol. 1991, 261 Pt 1, E199–E203. [Google Scholar]
- Segal, K.R.; Gutin, B.; Presta, E.; Wang, J.; Van Itallie, T.B. Estimation of human body composition by electrical impedance methods: a comparative study. J. Appl. Physiol. 1985, 58, 1565–1571. [Google Scholar] [CrossRef] [PubMed]
- Hodgdon, J.A.; Fitzgerald, P.I. Validity of impedance predictions at various levels of fatness. Hum. Biol. 1987, 59, 281–298. [Google Scholar]
- Kyle, U.G.; Genton, L.; Karsegard, L.; Slosman, D.O.; Pichard, C. Single prediction equation for bioelectrical impedance analysis in adults aged 20--94 years. Nutrition 2001, 17, 248–253. [Google Scholar] [CrossRef] [PubMed]
- Sun, S.S.; Chumlea, W.C.; Heymsfield, S.B.; Lukaski, H.C.; Schoeller, D.; Friedl, K.; Kuczmarski, R.J.; Flegal, K.M.; Johnson, C.L.; Hubbard, V.S. Development of bioelectrical impedance analysis prediction equations for body composition with the use of a multicomponent model for use in epidemiologic surveys. Am. J. Clin. Nutr. 2003, 77, 331–340. [Google Scholar] [CrossRef] [PubMed]
- Lukaski, H.C.; Piccoli, A. Bioelectrical impedance vector analysis for assessment of hydration in physiological states and clinical conditions. Handbook of Anthropometry: Physical Measures of Human Form in Health and Disease; Preedy, V.R., Ed.; Springer, 2012; pp. 287–305. [Google Scholar]
- McBride, G.B. A proposal for strength-of-agreement criteria for Lin’s Concordance Correlation Coefficient. 2005 NIWA Client Report: HAM2005-062.
- Bland, J.M.; Altman, D.G. Measuring agreement in method comparison studies. Stat. Methods Med. Res. 1999, 8, 135–160. [Google Scholar] [CrossRef]
- Giavarina, D. Understanding Bland Altman analysis. Biochem. Med. (Zagreb). 2015, 25, 141–51. [Google Scholar] [CrossRef] [PubMed]
- Marini, E.; Campa, F.; Buffa, R.; Stagi, S.; Matias, C.N.; Toselli, S.; Sardinha, L.B.; Silva, A.M. Phase angle and bioelectrical impedance vector analysis in the evaluation of body composition in athletes. Clin. Nutr. 2020, 39, 447–454. [Google Scholar] [CrossRef] [PubMed]
- Baumgartner, R.N. , Ross, R. ; Heymsfield, S.B. Does adipose tissue affect bioelectrical impedance in obese men and women? J. Appl. Physiol. 1998, 84, 257–262. [Google Scholar]
- Marken Lichtenbelt, W.D.; Fogelholm, M. Increased extracellular water compartment, relative to intracellular water compartment, after weight reduction. J. Appl. Physiol. 1999, 87, 294–298. [Google Scholar] [CrossRef] [PubMed]
- Woodard, H.Q.; White, D.R. The composition of body tissues. Br. J. Radiol. 1986, 59, 1209–1218. [Google Scholar] [CrossRef] [PubMed]
- Nescolarde, L.; Roca, E.; Bogónez-Franco, P.; Hernández-Hermoso, J.; Bayes-Genis, A.; Ara, J. Relationship between bioimpedance vector displacement and renal function after a marathon in non-elite runners. Front Physiol. 2020, 11, 352. [Google Scholar] [CrossRef] [PubMed]
- Kyle, U.G.; Bosaeus, I.; De Lorenzo, A.D.; Deurenberg, P.; Elia, M.; Gómez, J.M.; Heitmann, B.L.; Kent-Smith, L.; Melchior, J.C.; Pirlich, M.; Scharfetter, H.; Schols, A.M.; Pichard, C. Bioelectrical impedance analysis--part I: review of principles and methods. Clin. Nutr. 2004, 23, 1226–1243. [Google Scholar] [CrossRef] [PubMed]
- Kyle, U.G.; Bosaeus, I.; De Lorenzo, A.D.; Deurenberg, P.; Elia, M.; Gómez, J.M.; Heitmann, B.L.; Kent-Smith, L.; Melchior, J.C.; Pirlich, M.; Scharfetter, H.; Schols, A.M.; Pichard, C. Bioelectrical impedance analysis-part II: utilization in clinical practice. Clin. Nutr. 2004, 23, 1430–1453. [Google Scholar] [CrossRef]
- Scharfetter, H.; Brunner, P.; Mayer, M.; Brandstatter, B.; Hinghofer-Szalkay, H. Fat and hydration monitoring by abdominal bioimpedance analysis: data interpretation by hierarchical electrical modeling. I.E.E.E. Trans. Biomed. Eng. 2005, 52, 975–982. [Google Scholar] [CrossRef]
- Organ, L.W.; Bradham, G.B.; Gore, D.T.; Lozier, S.L. Segmental bioelectrical impedance analysis: theory and application of a new technique. J. Appl. Physiol. 1994, 77, 98–112. [Google Scholar] [CrossRef]
- Lukaski, H.C.; Siders, W.A. Validity and accuracy of regional bioelectrical impedance devices to determine whole-body fatness. Nutrition. 2003, 19, 851–857. [Google Scholar] [CrossRef]
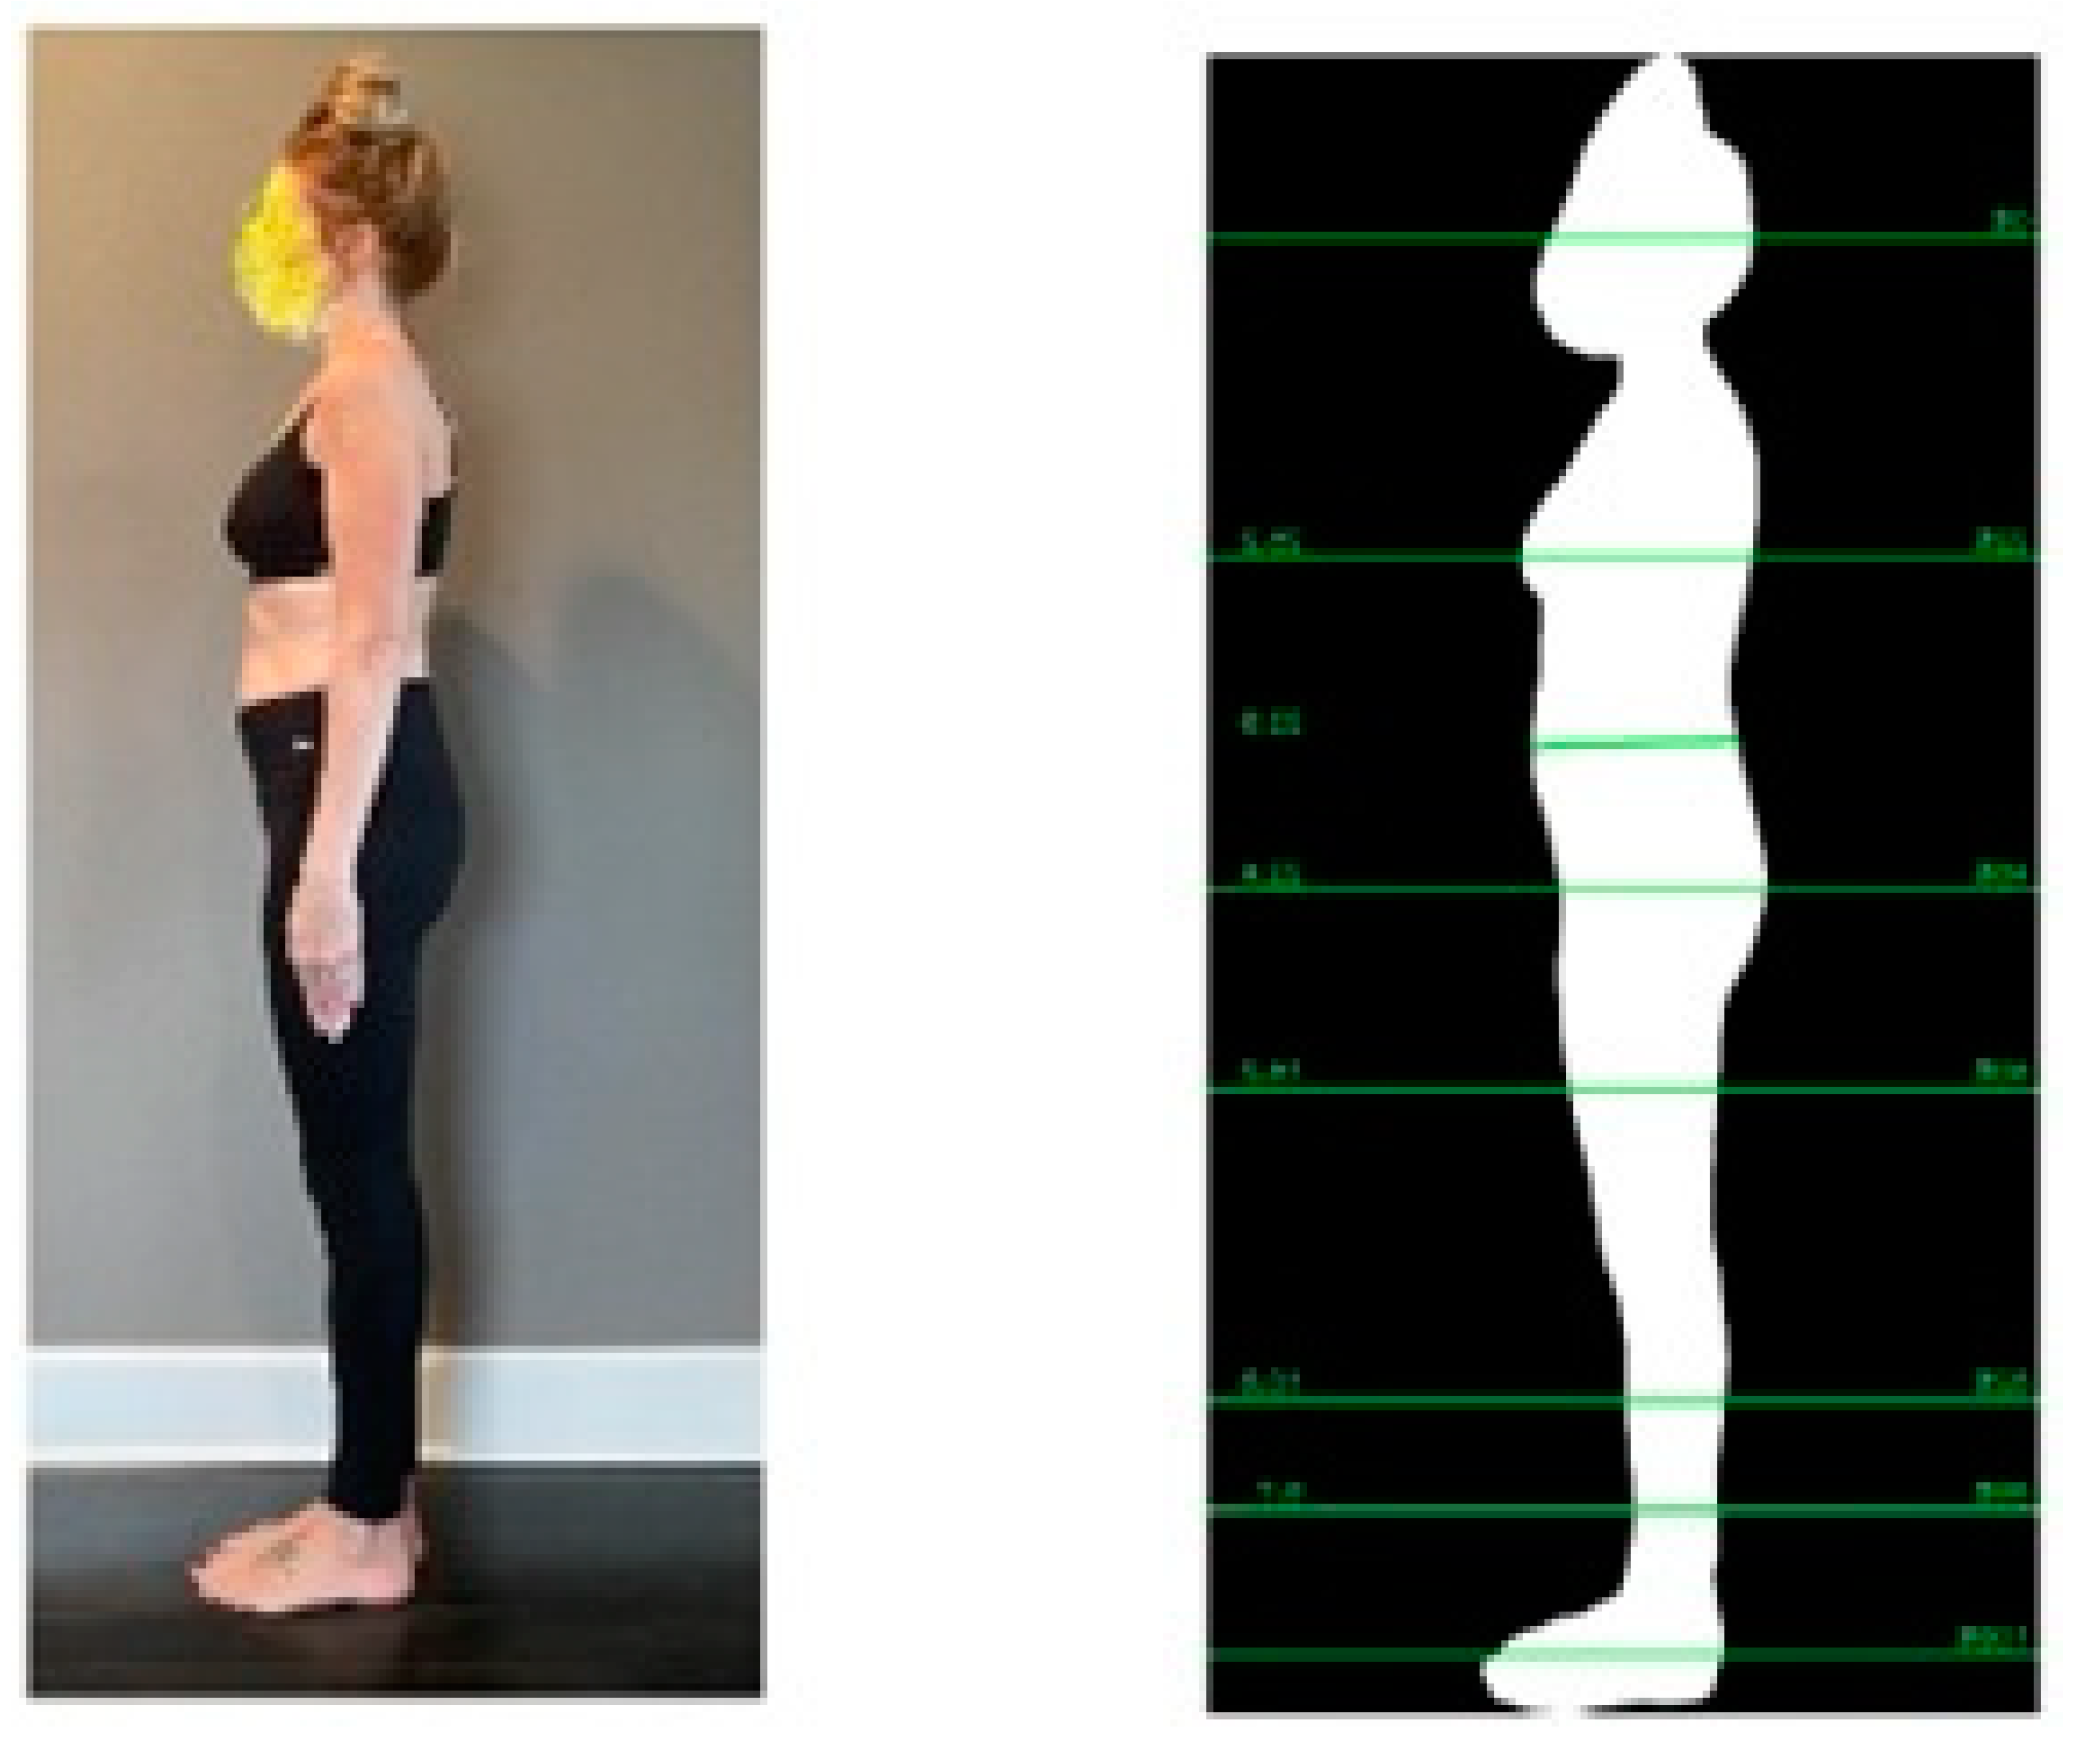
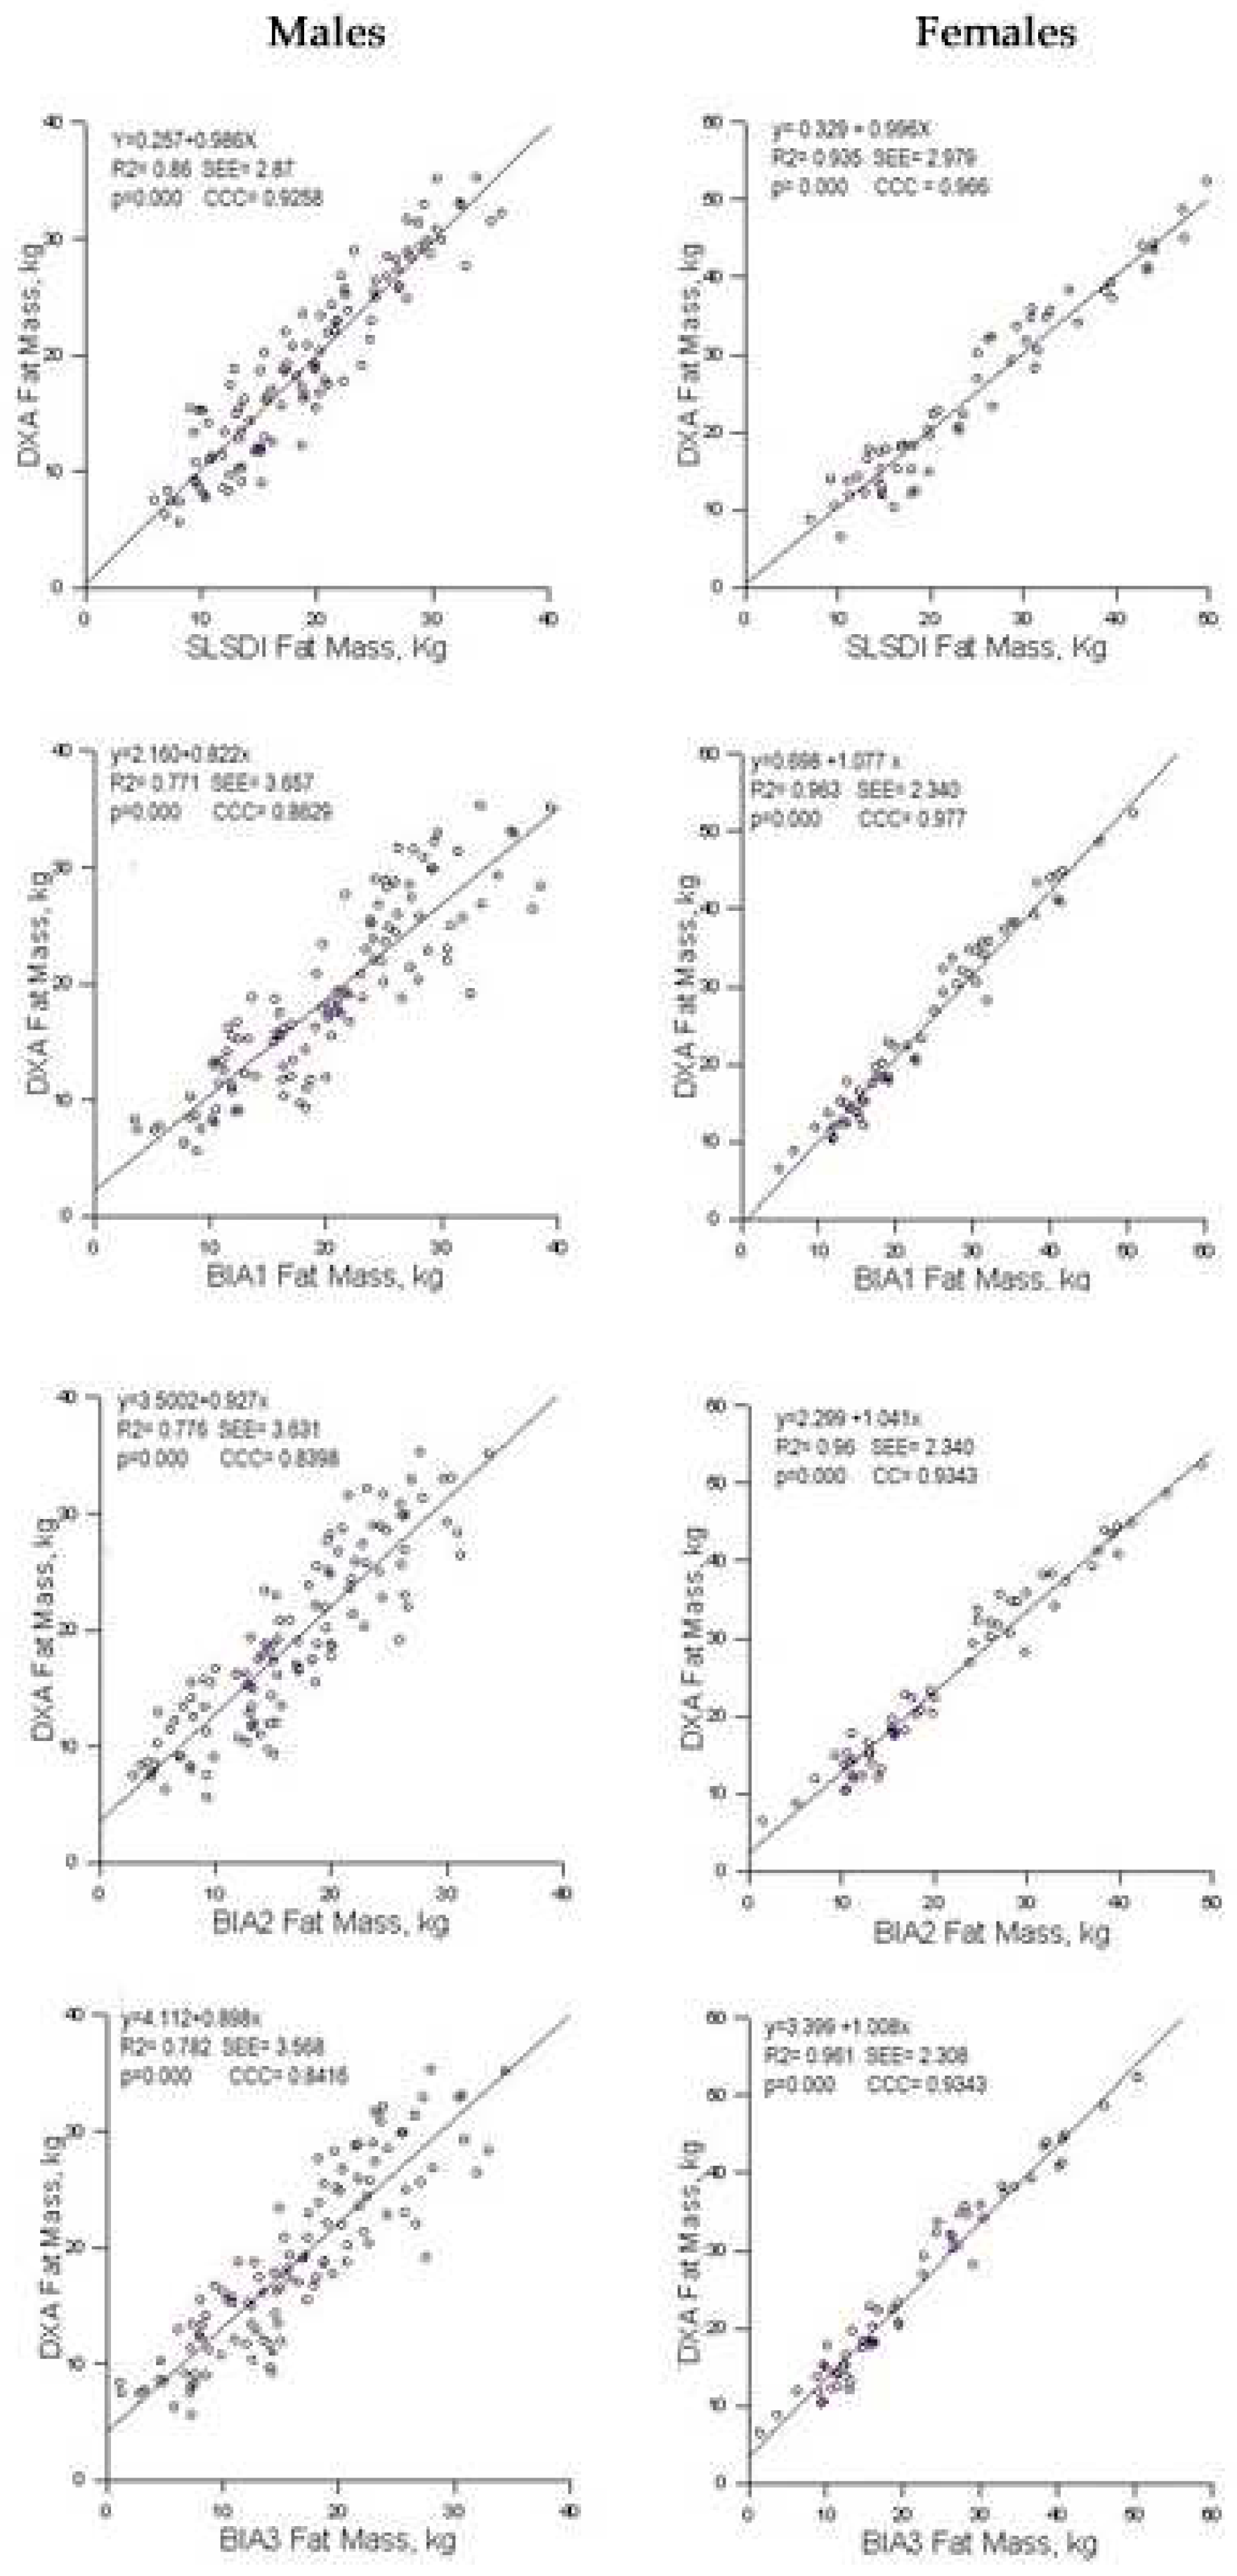
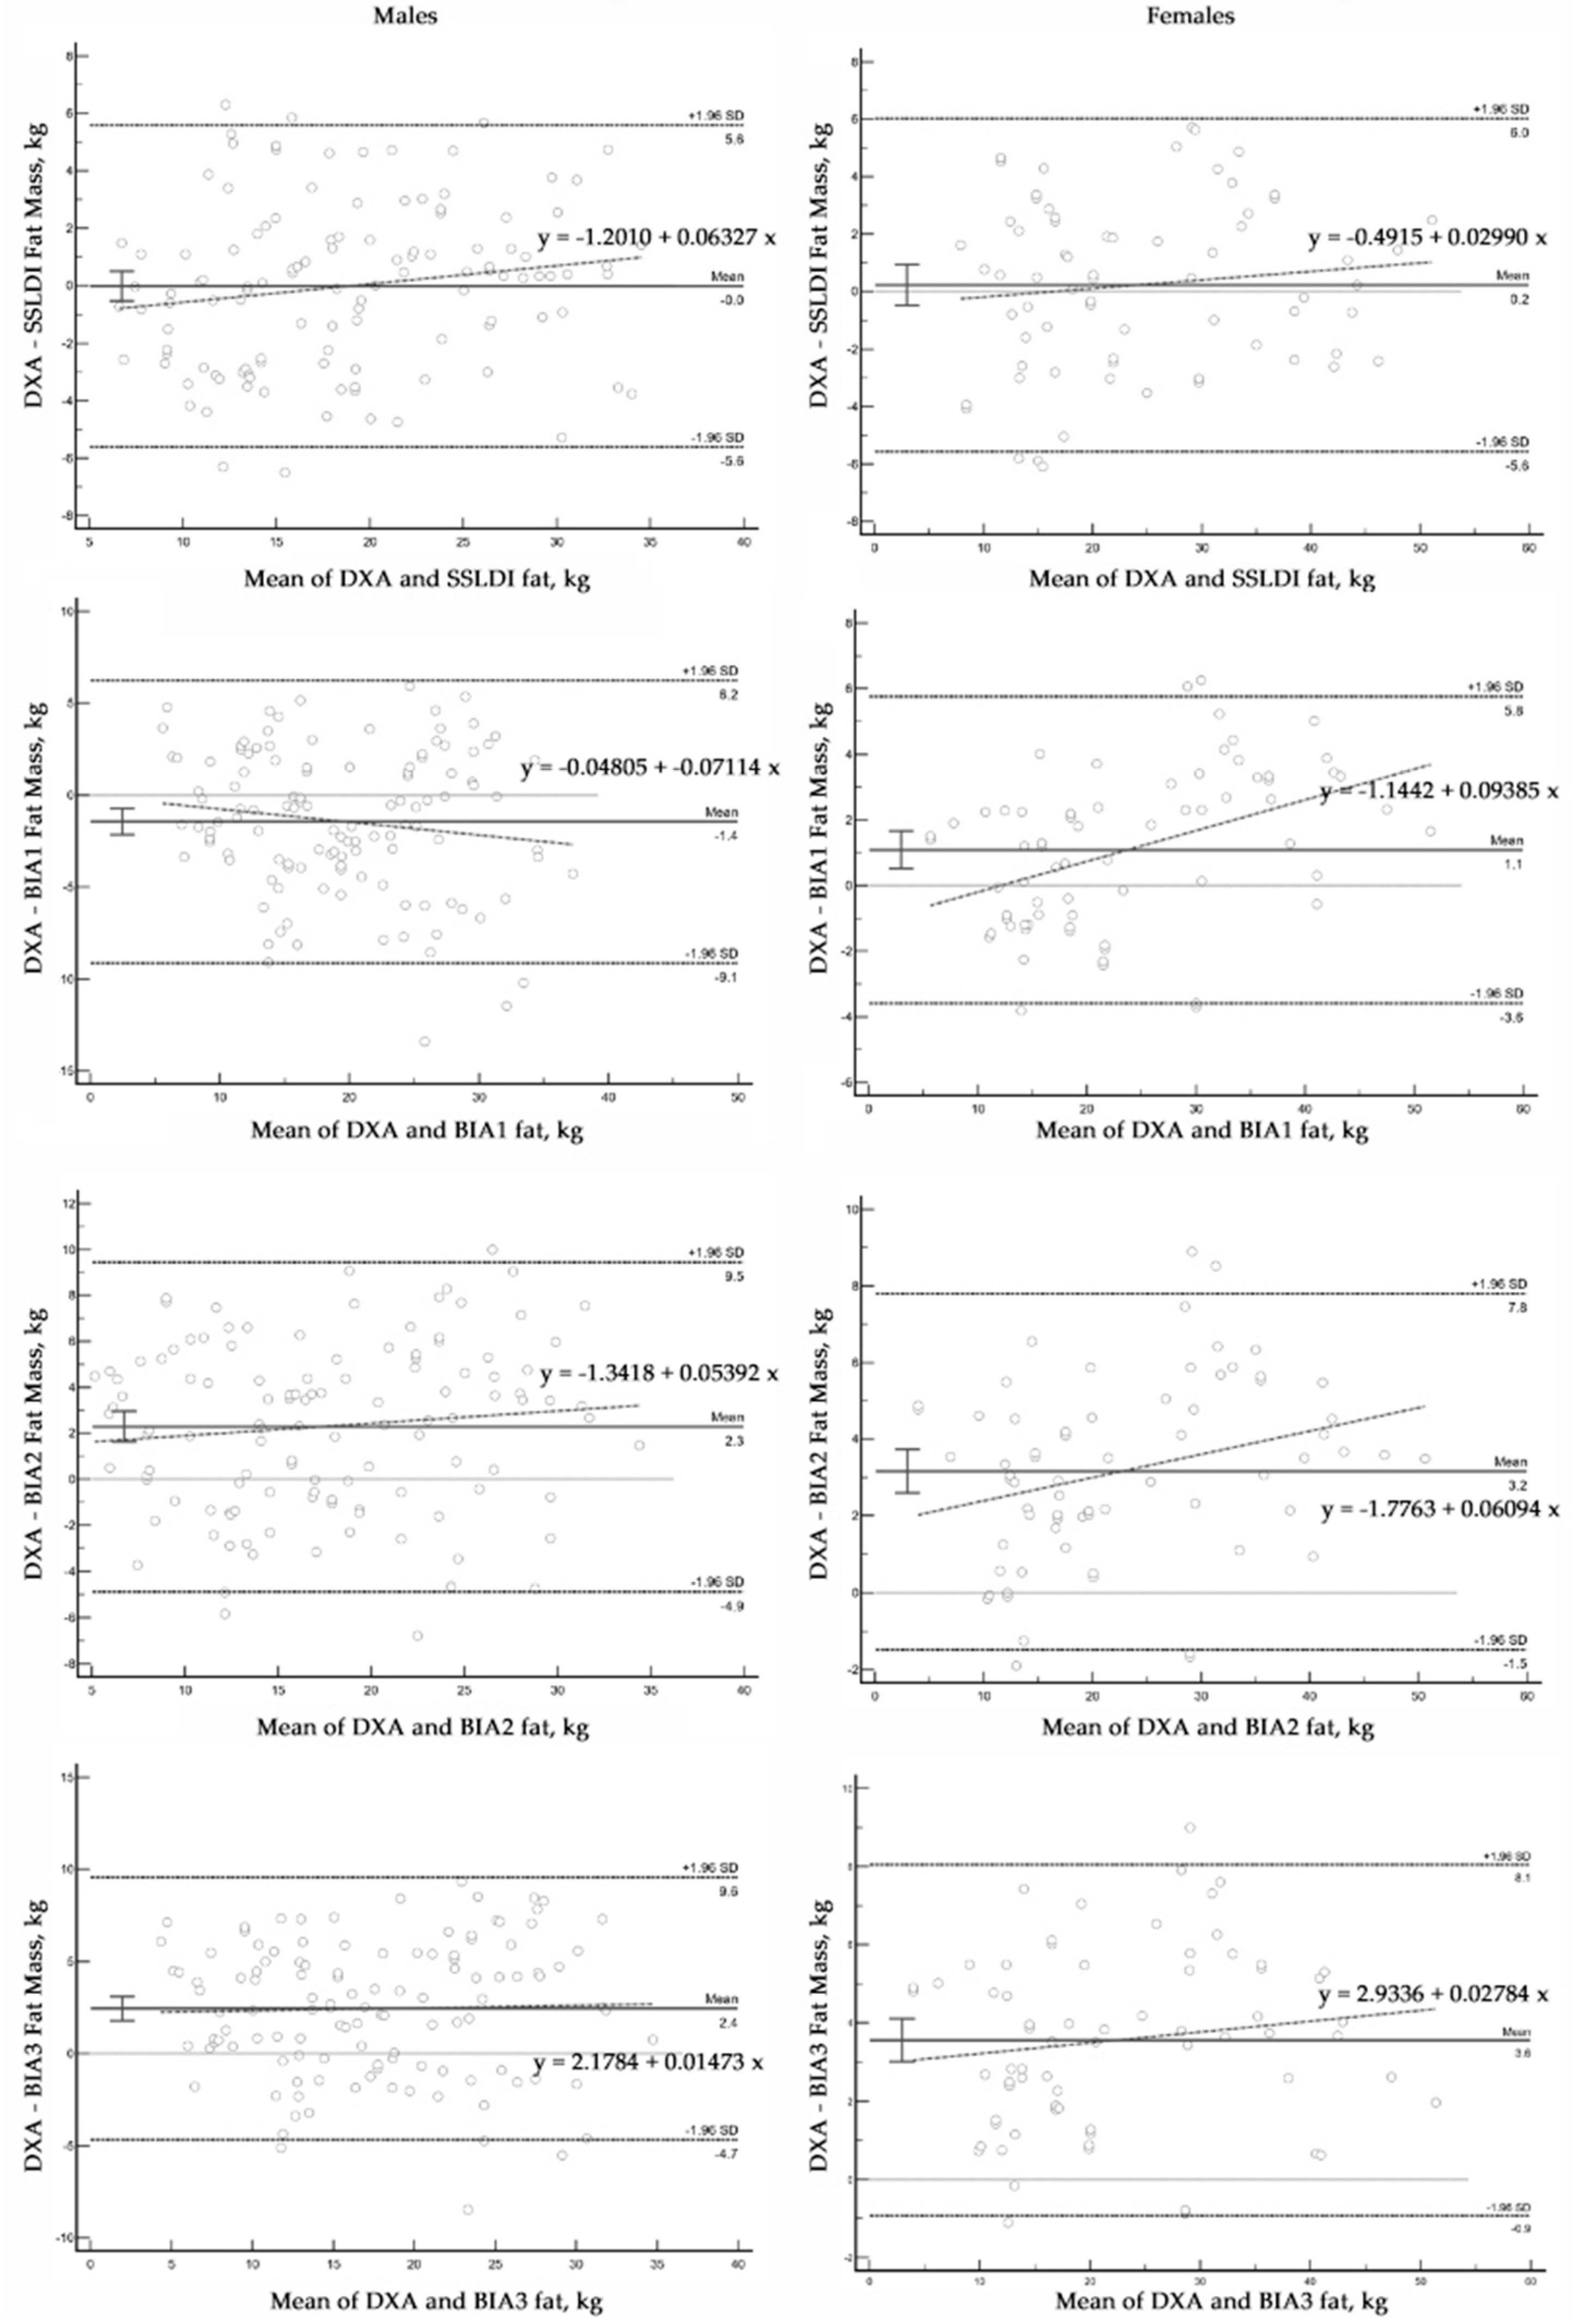
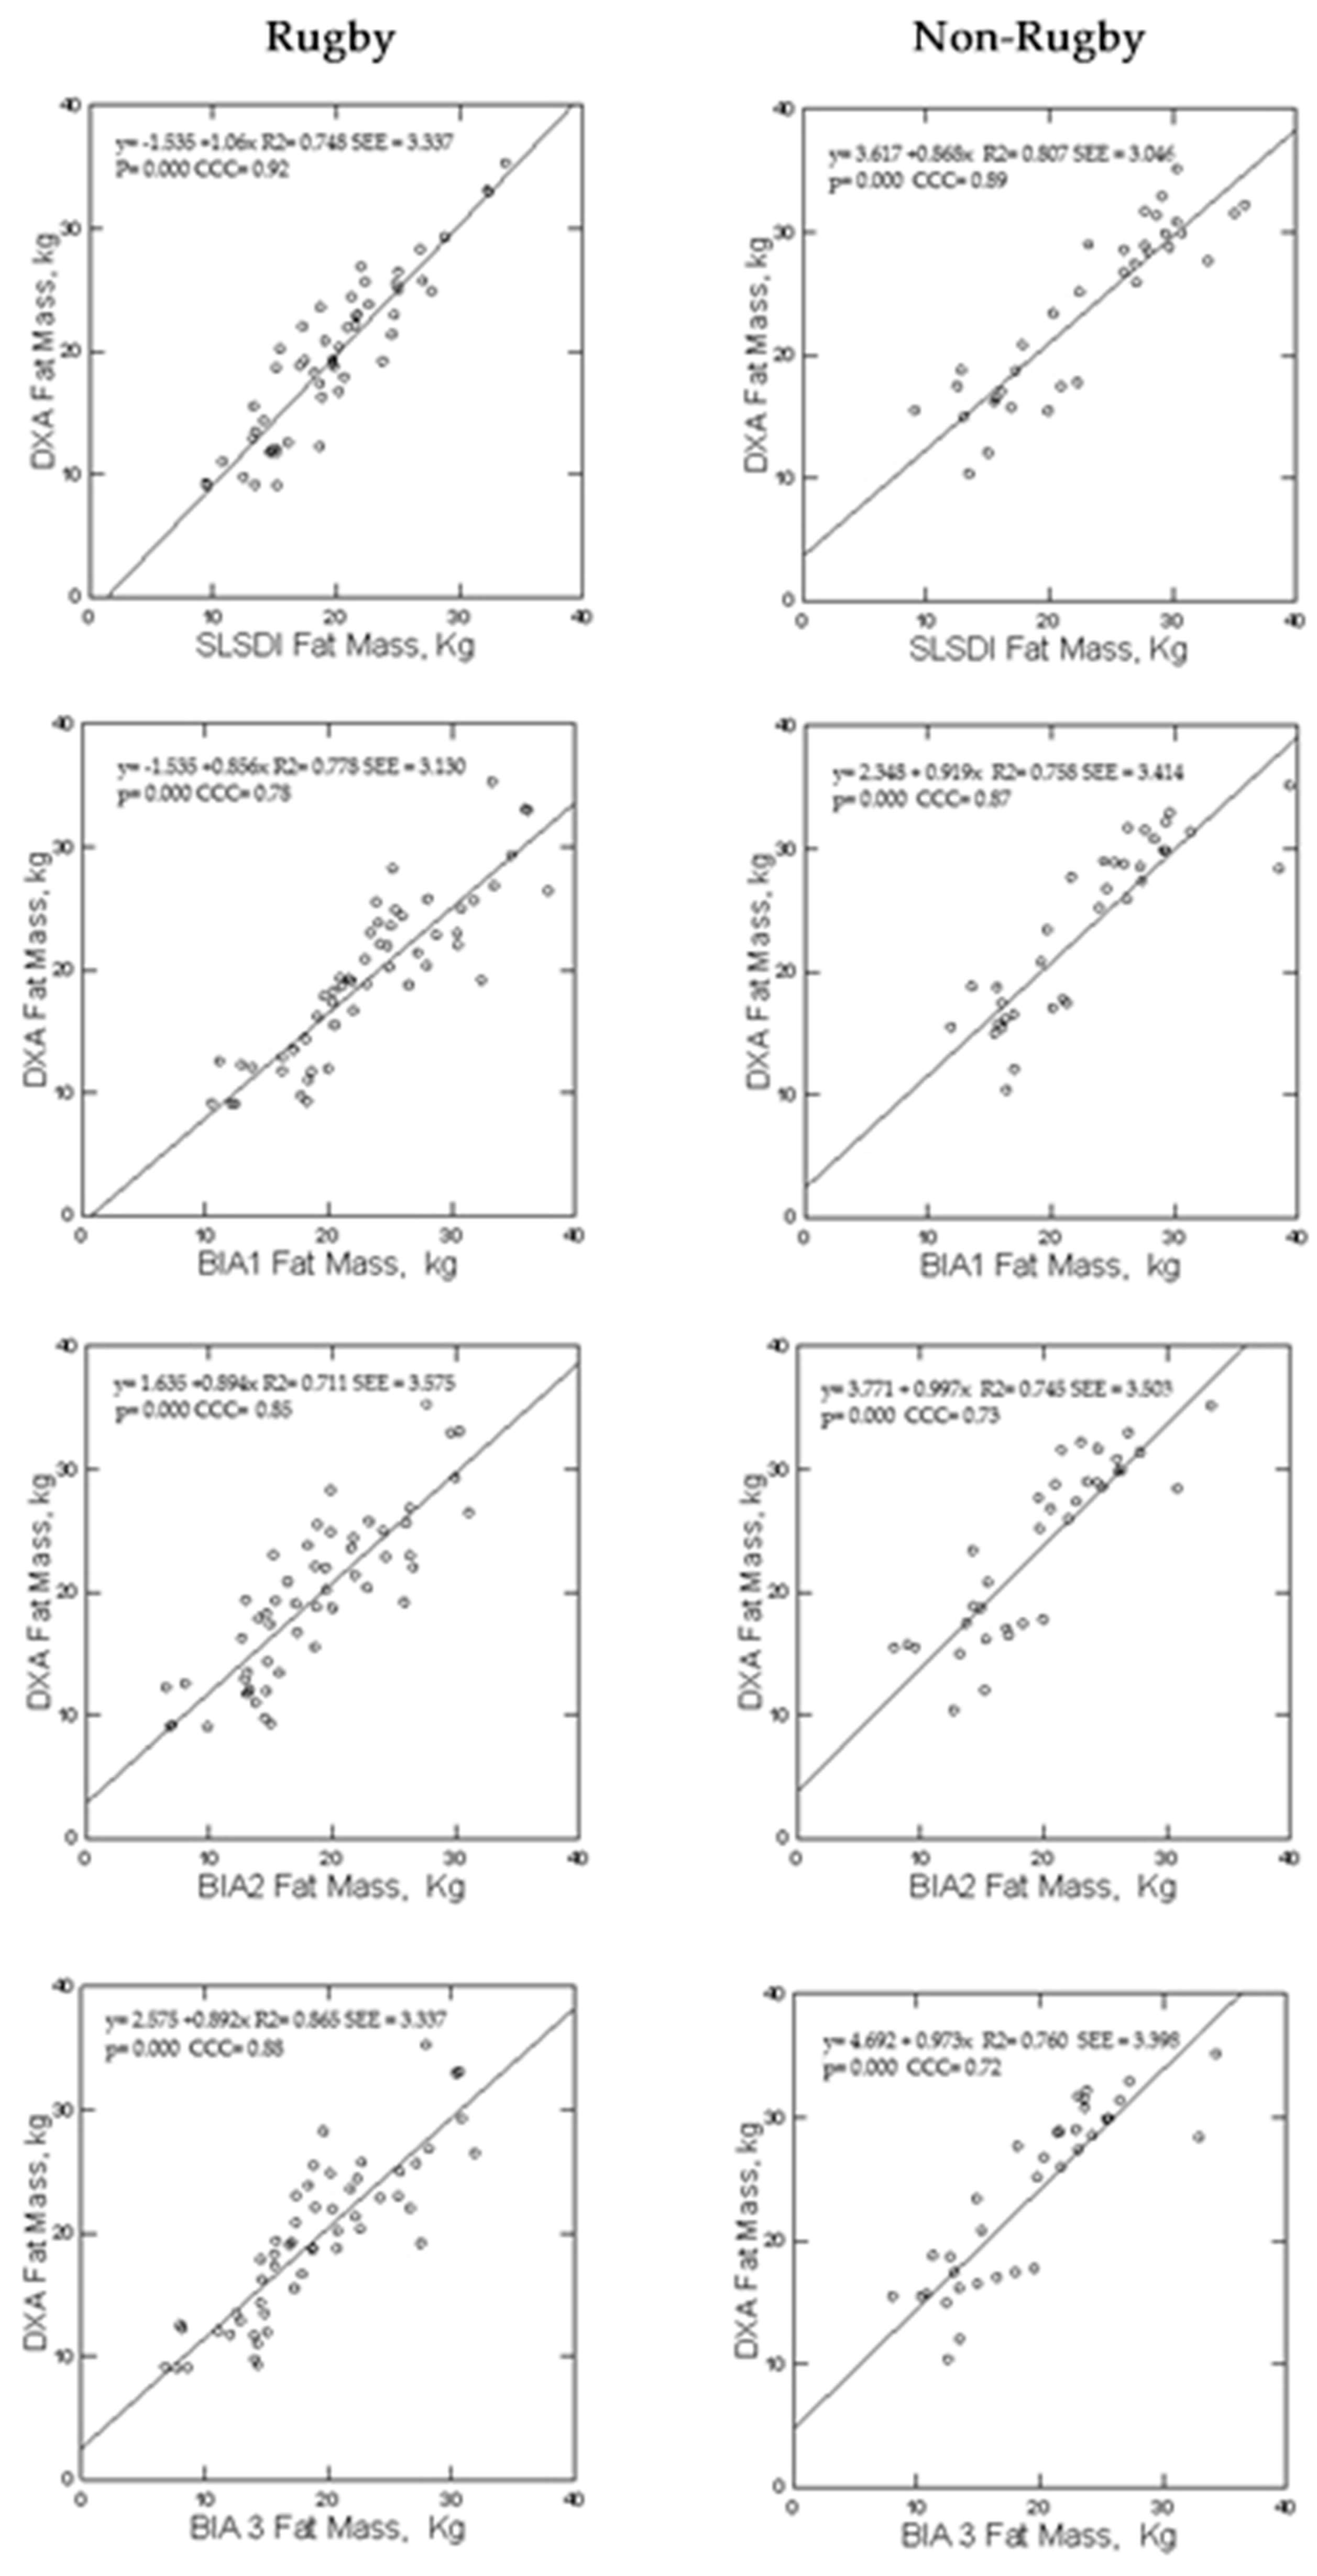
| Females | Males | Males | ||
| BMIA>25 kg/m² | ||||
| Total | Total | Rugby | Non-rugby | |
| N | 69 | 119 | 54 | 40 |
| Height, cm | 162.7 ± 6.3 | 182.5 ± 8.7 | 186.2 ± 7.2 | 179.7 ± 9.2 |
| (150.0-178.0) | (160.0-202.0) | (173.0-202.0) | (163.0-198.0) | |
| Weight, kg | 67.8 ± 14.5 | 93.2 ± 13.3 | 104.8 ± 11.4 | 91.4 ± 12.2 |
| (41.8-103.6) | (61.1-125.6) | (79.4-123.0) | (69.5-124.6) | |
| BMI, kg/m2 | 25.6 ± 5.4 | 27.6 ± 4.0 | 30.4 ± 3.3 | 28.7 ± 3.0 |
| (16.1-37.2) | (19.5-37.0) | (25.2-36.6) | (25.1–37.1) | |
| Fat massB, kg | 24.3 ± 11.6 | 18.8 ± 7.67 | 19.3 ± 6.5 | 23.3 ± 6.9 |
| (6.4-52.3) | (5.6-35.2) | (9.0–35.2) | (10.3–35.1) | |
| FatB, % | 34.2 ± 10.2 | 19.8 ± 6.7 | 18.2 ± 4.7 | 25.4 ± 6.2 |
| (12.1-50.5) | (8.3-36.8) | (9,8- 28.9) | (11.4-36.8) | |
| Fat-free massB, kg | 43.5 ± 5.6 | 74.4 ± 12.7 | 84.7 ± 6.6 | 68.1 ± 10.1 |
| (31.0-55.8) | (47.4-103.2) | (68.9-103.2) | (50.6-97.2) | |
| Group | Method | Fat mass, kg | Bias, kg | p | SEE, kg | CCC | MAE, kg | MAPE, % | LOA, kg |
|---|---|---|---|---|---|---|---|---|---|
| Females | DXA | 24.3±11.6 | |||||||
| SLSDI | 24.1±11.3 | 0.2±3.3 | 0.29 | 3.0 | 0.96 | 2.5 | 8.6 | 6.0, -5.5 | |
| BIA1 | 23.2±10.6 | 1.1±2.4 | 0.0001 | 2.3 | 0.98 | 2.2 | 8.9 | 5.8, -3.6 | |
| BIA2 | 21.1±10.9 | 3.2±2.4 | 0.0001 | 2.3 | 0.94 | 3.4 | 13.6 | 7.8, -1.5 | |
| BIA3 | 20.7±11.3 | 3.6±2.3 | 0.0001 | 2.3 | 0.93 | 3.6 | 15.1 | 8.1, -0.9 | |
| Males | DXA | 18.8±7.6 | |||||||
| SLSDI | 18.8±7.2 | 0±2.9 | 0.97 | 2.9 | 0.93 | 2.3 | 11.5 | 5.6, -5.6 | |
| BIA1 | 20.3±8.2 | -1.4±3.9 | 0.0001 | 3.7 | 0.86 | 3.3 | 16.9 | 6.2, -9.1 | |
| BIA2 | 21.1±7.3 | -2.9±3.7 | 0.0001 | 3.6 | 0.84 | 3.6 | 19.0 | 9.5, -4.9 | |
| BIA3 | 16.4±7.5 | 2.4±3.6 | 0.0001 | 3.6 | 0.84 | 3.6 | 18.1 | 9.6, -4.7 | |
| Group | Method | Fat mass, kg | Bias, kg | p | SEE, kg | CCC | MAE, kg | MAPE, % |
|---|---|---|---|---|---|---|---|---|
| Rugby | DXA | 19.3±6.6 | ||||||
| SLSDI | 19.7±5.7 | 0.4±2.6 | 0.33 | 2.6 | 0.92 | 2.1 | 7.9 | |
| BIA1 | 23.4±6.8 | 4.0±3.3 | 0.0001 | 3.1 | 0.78 | 4.3 | 21.4 | |
| BIA2 | 18.5±6.2 | -0.9±3.6 | 0.08 | 3.5 | 0.85 | 3.0 | 14.3 | |
| BIA3 | 18.8±6.4 | -0.5±3.4 | 0.24 | 3.3 | 0.88 | 2.7 | 11.3 | |
| Non-rugby | DXA | 23.3±6.8 | ||||||
| SLSDI | 22.7±7.1 | -0.6±3.1 | 0.22 | 3.1 | 0.89 | 2.6 | 10.8 | |
| BIA1 | 22.8±6.5 | -0.5±3.4 | 0.36 | 3.4 | 0.87 | 2.6 | 8.3 | |
| BIA2 | 19.7±5.9 | -3.7±3.5 | 0.0001 | 3.5 | 0.73 | 4.4 | 19.1 | |
| BIA3 | 19.1±6.1 | -4.2±3.6 | 0.0001 | 3.4 | 0.72 | 4.8 | 20.9 |
Disclaimer/Publisher’s Note: The statements, opinions and data contained in all publications are solely those of the individual author(s) and contributor(s) and not of MDPI and/or the editor(s). MDPI and/or the editor(s) disclaim responsibility for any injury to people or property resulting from any ideas, methods, instructions or products referred to in the content. |
© 2023 by the authors. Licensee MDPI, Basel, Switzerland. This article is an open access article distributed under the terms and conditions of the Creative Commons Attribution (CC BY) license (http://creativecommons.org/licenses/by/4.0/).


