1. Introduction
Brazil has geographical inequalities that impact socio-spatial and socioeconomic differences and disproportionate access to healthcare resources. It is believed that the coronavirus disease 2019 (COVID-19) pandemic may have more severe consequences in contexts with greater socio-spatial inequality, resulting in systemic and lasting deepening of economic and social crises [
1].
The age range of 0 to 19 years was delimited in this study, considering that child care is a priority field within population health care, given the susceptibility of childhood to illness and the worsening of diseases due to the fragility of this period of life [
2].
The period from 2018 to 2021 covers two years before the COVID-19 pandemic and the first two years of the pandemic. During this time, the Unified Health System (SUS) and monitoring the spread of cases and deaths from the disease were at the forefront of public debate. Comparing the data on access to health services before and after the onset of the COVID-19 pandemic is essential for understanding the profile of demands and care [
3]. The official records available at DATASUS and presented in this study demonstrate how the variables described above-affected access to health structures for children and adolescents in each Brazilian region.
Cerebral Palsy (CP) is a neurodevelopmental disorder characterized by abnormalities in muscle tone, movement, and motor skills and is attributed to non-progressive lesions in the developing brain [
4,
5]. Some disabilities only become apparent as the child grows and develops, such as CP, which makes both diagnosis and epidemiological recording more challenging [
6].
In Europe, a report using standardized definitions encompassing 6000 children with CP from 13 geographically defined populations found an overall rate of 2.08/1000 live births
7. In developing countries, the prevalence of cerebral palsy reaches 7 per 1000 live births when all grades of CP (8, 9, 10) are considered [
8,
9,
10]. According to the Brazilian Cerebral Palsy Association [
11], 17 million people live with this condition worldwide.
In Brazil, there is a lack of studies investigating the prevalence and incidence of CP nationally. However, there are projections of the prevalence and incidence of CP in developing countries based on data from other countries [
12]. The census does not include specific questions about this diagnosis; it only contains questions about physical disability, which has a different prognosis and treatment.
The difference in prevalence between these two groups of countries is attributed to poor prenatal care and primary care for pregnant women [
10], which may also affect postnatal medical follow-up and make it challenging to observe early childhood developmental milestones, which would provide an opportunity for early intervention. Therefore, it can be stated that a child diagnosed with CP requires ongoing medical monitoring, particularly during early childhood and specifically in Primary Health Care Units. Additionally, a medical team must make a diagnosis based on specific tests to formalize the diagnosis in DATASUS.
The present study aims to correlate data that can shed light on the current state of healthcare access for individuals diagnosed with CP. CP is a chronic disease that involves non-progressive impairments but affects a wide range of bodily systems, including the respiratory system, which can manifest as upper or lower airway pathologies (UA-LA), oropharyngeal incoordination (OPI), secretion accumulation, bronchitis, recurrent cases of pneumonia, and gastroesophageal reflux (GER), which is a disabling disorder that often leads to aspiration pneumonia. Children with cerebral palsy are highly susceptible to opportunistic respiratory diseases [
13]. The primary symptomatology of the condition caused by the SARS-CoV-2 virus is associated with the respiratory system, although its clinical spectrum varies significantly. During this pandemic, it has been emphasized that individuals with disabilities are at a higher risk of developing comorbidities [
14].
Objectives
General objective
To analyze and compare the number of healthcare facilities and doctors concerning the number of children and adolescents based on the data published by the Unified Health System (SUS) in each region of Brazil and compare them.
Specific objectives
Investigate if and how differences in health structure by region affected hospitalizations and deaths of children and young people with all categories of pathologies described in the International Classification of Diseases [ICD-10] (control group), compared to hospitalizations and deaths of people in the same age group with a specific diagnosis of CP and other paralytic syndromes (ICD-10 G80 and G83).
Facilitate the planning of effective actions tailored to the profile of each region in the context of relevant public health.
2. Materials and Methods
Study design
An ecological study of time series, population-based, using secondary data obtained by consulting DATASUS from the Brazilian Ministry of Health.
As this study collected information from open-access secondary databases, it was not necessary to submit or obtain approval from a Research Ethics Committee in compliance with regulations for research involving human subjects (Res. CNS 466/12) of the National Health Council.
Study site
According to the Brazilian Institute of Geography and Statistics (IBGE) [
15], Brazil's territorial extension in 2021 was 8,510,345.540 km², with a population of 214.3 million in the same year, of which 60,359,871 were aged between 0 and 19 years [
16], the demographic density was 25.07 inhabitants/km
2, the Human Development Index (HDI) was 0.754, and the Gini coefficient was 0.544. To measure the similarities and differences in health care across the country, we conducted a study by dividing it into regions and delimiting the age range from 0 to 19 years due to the vast territorial proportions.
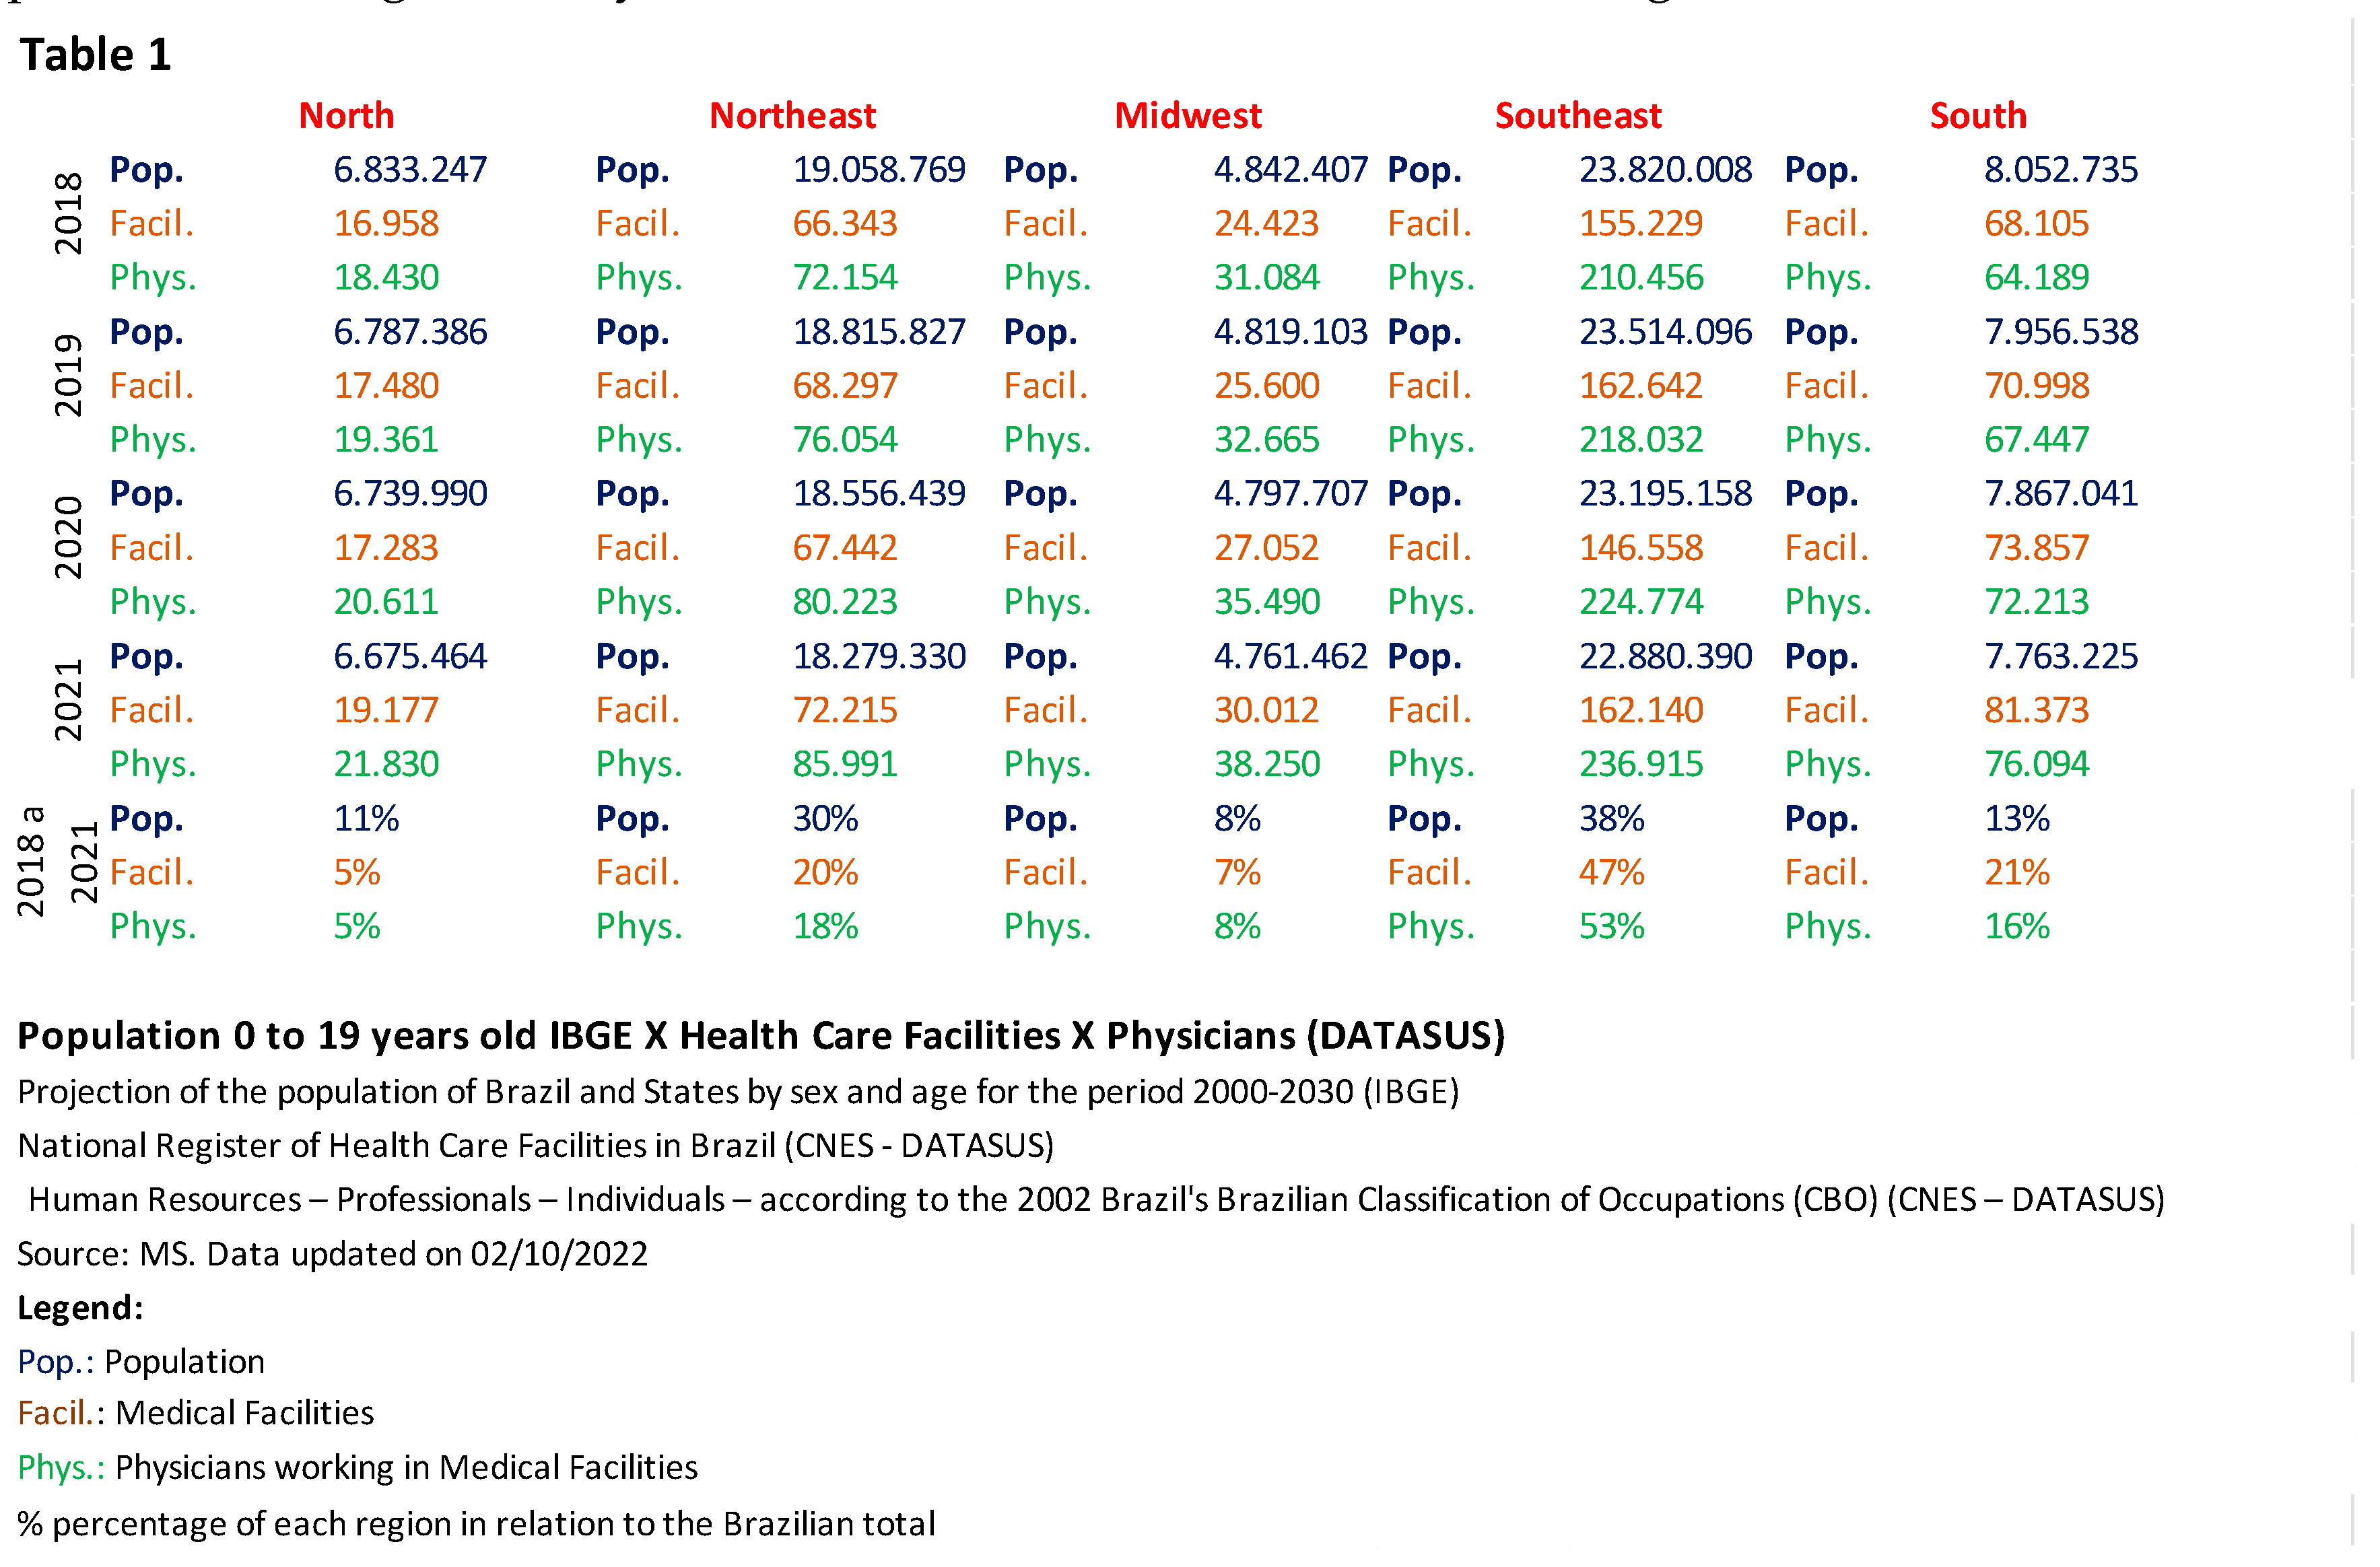
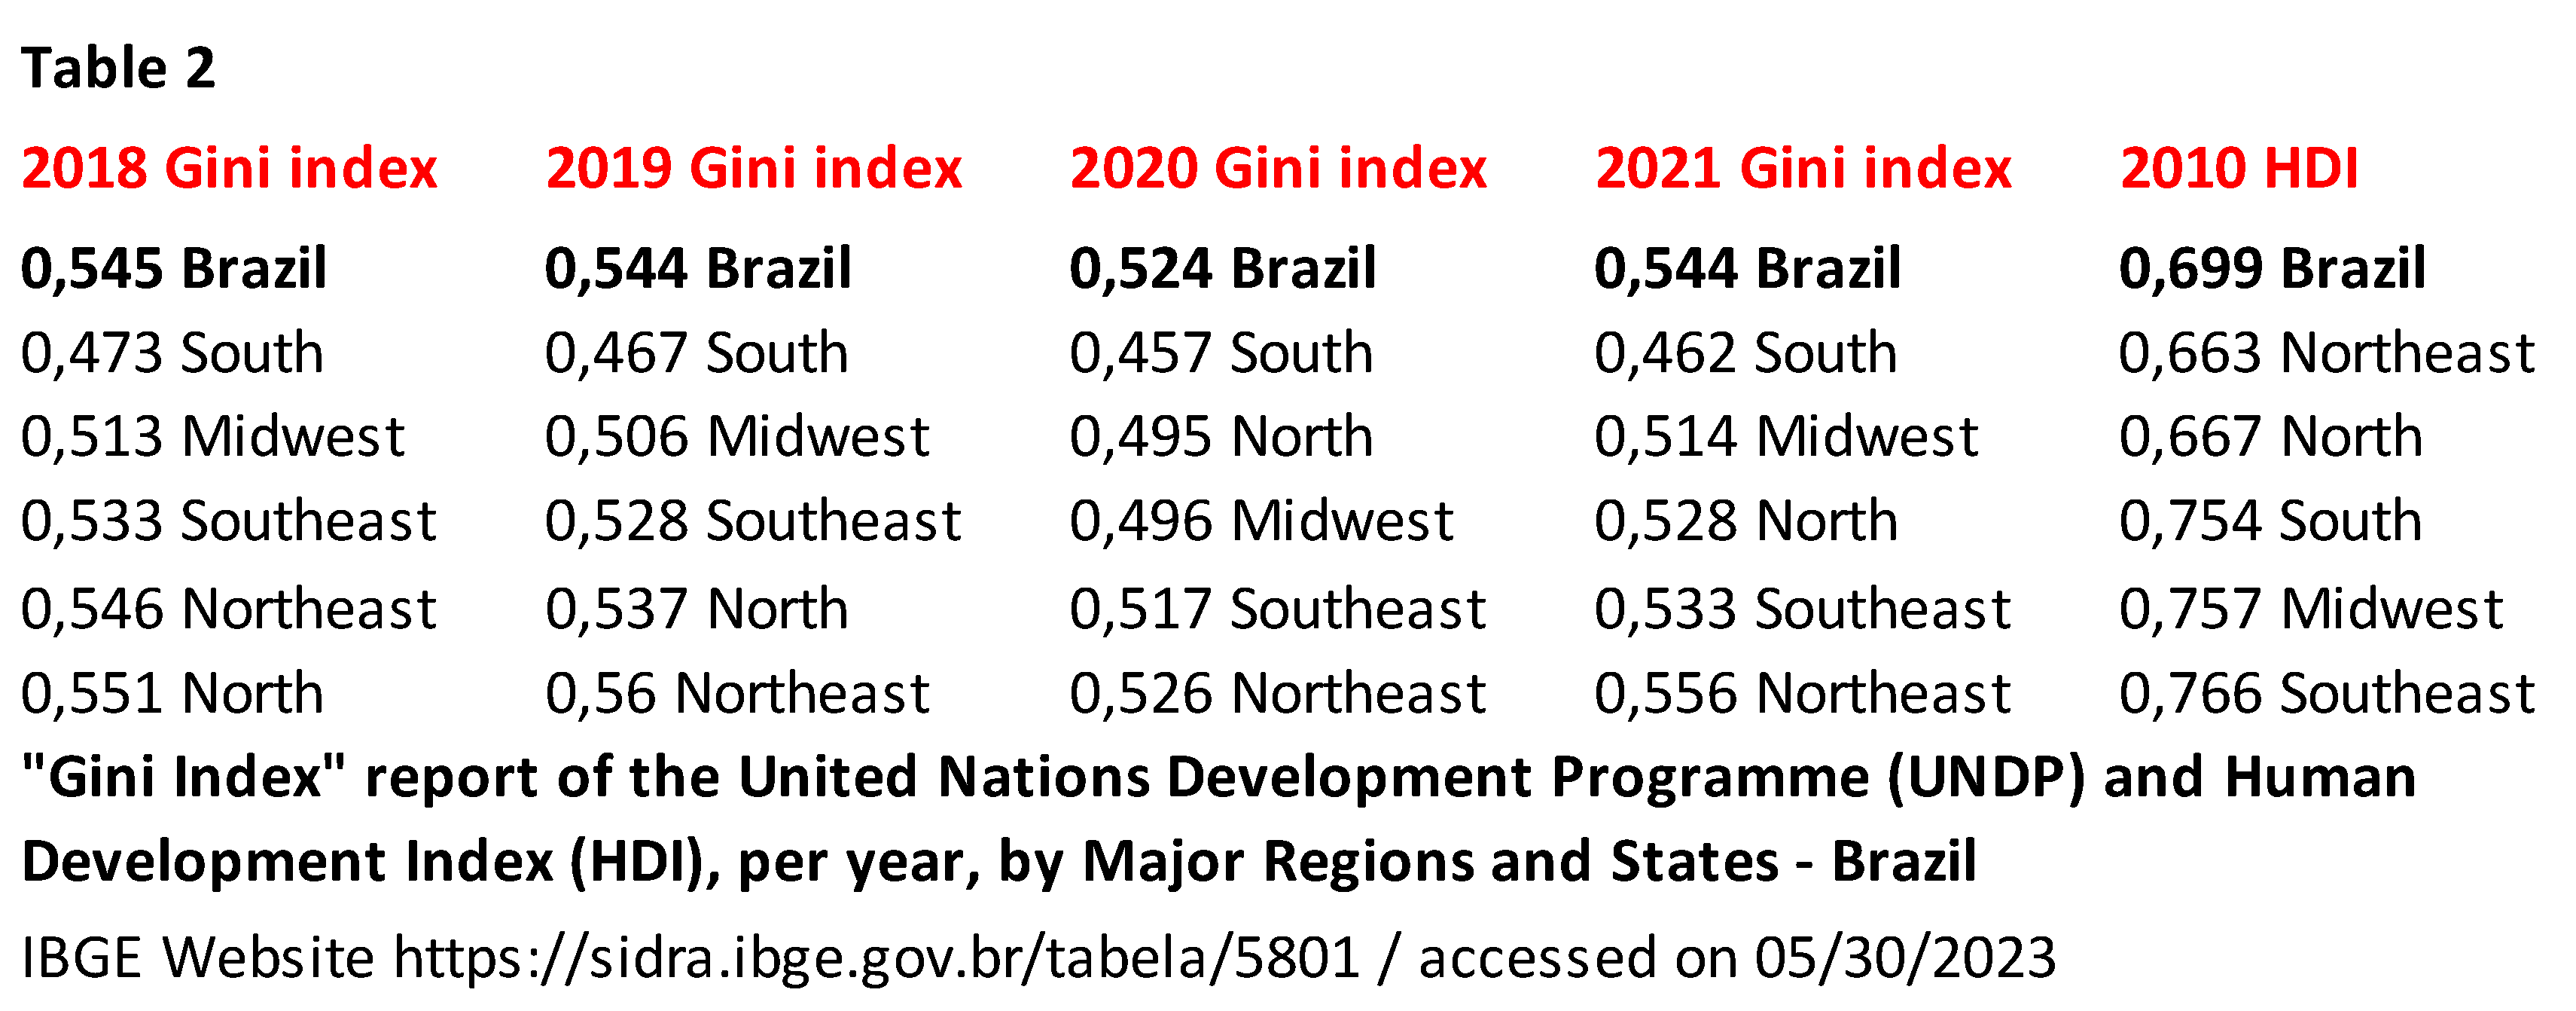
In 2021, the North region had 6,675,464 children and young people in the defined age group, with a demographic density of 4.1 inhabitants/km2, an HDI of 0.667, and a Gini coefficient of 0.528. The Northeast region had a population of 18,279,330 within the limited range, with a demographic density of 34.1 inhabitants/km2, an HDI of 0.663, and a Gini coefficient of 0.556. The Midwest region had a population of 4,761,462 people within the limited range, with a demographic density of 10.01 inhabitants/km2, an HDI of 0.757, and a Gini coefficient of 0.514. The Southeast region had a population of 22,880,390 within the limited range, with a demographic density of 84.21 inhabitants/km2, an HDI of 0.766, and a Gini coefficient of 0.533. The Southern region had a population of 7,763,225 within the limited range, with a demographic density of 53.19 inhabitants/km2, an HDI of 0.754, and a Gini coefficient of 0.462.
Study population
The data on the population aged 0 to 19 years, available on TABNET and tabulated in Microsoft Excel, indicates the number of healthcare facilities and doctors working in these places, as well as the hospitalizations and deaths of children and youth with Cerebral Palsy and other paralytic syndromes across all diagnostic categories. The study encompassed the timeframe of 2018 to 2021, focusing on collecting a data sample from two months before the COVID-19 pandemic and the first two years of the pandemic in Brazil. Sociodemographic variables used were: sex (male, female, and not informed); age (age range 2: under 1 year, 1 to 4 years, 5 to 9 years, 10 to 14 years, 15 to 19 years); race or ethnicity (white, black, brown, yellow, indigenous, no information); place of residence, hospitalization, and death by region (North, South, Midwest, Northeast, and Southeast); healthcare system (public, private, and not informed).
Data Stratification
Secondary data collected from Brazil's National Register of Health Establishments (CNES), Human Resources - Professionals - Individuals - according to 2002 Brazil's Brazilian Classification of Occupations (CBO) (CNES), SUS Hospital Information System (SIH/SUS), and Mortality Information System (SIM) of the Department of Informatics of the Unified Health System (DATASUS), of the Ministry of Health of Brazil; Projection of the population of Brazil and its states by sex and age for the period 2000-2030, obtained from the Brazilian Institute of Geography and Statistics (IBGE), accessed on June 20, 2019, available at
https://datasus.saude.gov.br/.
Data were collected from September 2022 to February 2023. The following strategy was used for data access, tabulation, and retrieval. Access to
https://datasus.saude.gov.br/. Access to information > TABNET health information > Demographic and Socioeconomic > Resident Population > Population Projection of the states by sex and age groups: 2000-2030 > Row > Age Group 2 > Column > Year > Contents > Resident Population > Available Periods > 2018, 2019, 2020, 2021 > Available Selections > Region > 1 North Region, 2 Northeast Region, 3 Southeast Region, 4 South Region, and 5 Midwest Region > State > All Categories > Sex > Male, Female > Age Group 2 > 0 to 4 years, 5 to 9 years, 10 to 14 years, 15 to 19 years.
Data from each region were collected and analyzed separately in addition to the comprehensive collection that included all regions.
Access to
https://datasus.saude.gov.br/. Access to information > TABNET health information > Health Care System > CNES - Facilities > Types of Facilities > Geographic Scope > Brazil by Region, State, and Municipality > Row > Region > Column > Fiscal year/month > Content > Quantity > Available Periods > 2018/Jan 2018/Dec 2019/Jan 2019/Dec 2020/Jan 2020/Dec 2021/Jan 2021/Dec > Available Selections > Region > 1 North Region, 2 Northeast Region, 3 Southeast Region, 4 South Region, and 5 Midwest Region > State > All Categories > Types of Facilities > All Categories. Data from each region were collected and analyzed separately in addition to the comprehensive collection that included all regions.
To collect data on health care professionals or physicians. Access to
https://datasus.saude.gov.br/. Access to information > TABNET health information > Health Care System > CNES - Human Resources as of August 2007 - Occupations classified by 2002 CBO > Professionals > Geographical Scope > Brazil by Region, State, and Municipality > Row > Physicians > Column > Fiscal year/month > Content > Quantity > Available Periods > 2018/Dec 2019/Dec 2020/Dec 2021/Dec > Available Selections > Region > 1 North Region, 2 Northeast Region, 3 Southeast Region, 4 South Region, and 5 Midwest Region > State > All Categories > Physicians > All Categories. Data from each region were collected and analyzed separately in addition to the comprehensive collection that included all regions.
To collect data on Hospitalizations by place of residence. Access to
https://datasus.saude.gov.br/. Access to information > TABNET health information > epidemiological and morbidity > SUS (SIH/SUS) Hospital Morbidity > General, by place of residence - from 2008 > Geographic Scope > Brazil by Region and State > Row > Region/State > Column > Processing year/month > Content > Hospitalizations > Available Periods > Jan/2018 to Dec/2021 > Available Selections > Region > 1 North Region, 2 Northeast Region, 3 Southeast Region, 4 South Region, and 5 Midwest Region > State > All Categories > Type of care: All categories > Health care system > public, private, not informed > ICD-10 Chapter > All categories > ICD-10 Morbid List > All sorts> Age 2 > Under 1 year, 1 to 4 years, 5 to 9 years, 10 to 14 years, 15 to 19 years > Sex > Men, Women, Ig > Race/ethnicity > White, Black, Brown, Yellow, Indigenous, No information.
To collect data on Hospitalizations of people with Cerebral Palsy and other paralytic syndromes by place of residence. Access to
https://datasus.saude.gov.br/. Access to information > TABNET health information > epidemiological and morbidity > SUS (SIH/SUS) Hospital Morbidity > General, by place of residence - from 2008 > Geographic Scope > Brazil by Region and State > Row > Region/State > Column > Processing year/month > Content > Hospitalizations > Available Periods > Jan/2018 to Dec/2021 > Available Selections > Region > 1 North Region, 2 Northeast Region, 3 Southeast Region, 4 South Region, and 5 Midwest Region > State > All Categories > Type of care: All categories > Healthcare system > public, private, not informed > ICD-10 Morbid List > Cerebral palsy and other paralytic syndromes > Age Group 2 > Under 1 year, 1 to 4 years, 5 to 9 years, 10 to 14 years, 15 to 19 years > Sex > Men, Women, Ig > Race/ethnicity > White, Black, Brown, Yellow, Indigenous, No information.
To collect data on Hospitalizations by place of hospitalization. Access to
https://datasus.saude.gov.br/. Access to information > TABNET health information > Epidemiological and morbidity > SUS (SIH/SUS) Hospital Morbidity > General, by place of hospitalization - from 2008 > Geographic Scope > Brazil by Region and State > Row > Region/State > Column > Processing year/month > Content > Hospitalizations > Available Periods > Jan/2018 to Dec/2021 > Available Selections > Region > 1 North Region, 2 Northeast Region, 3 Southeast Region, 4 South Region and 5 Midwest Region > State > All Categories > Service type: All categories > Health care system > public, private, not informed > ICD-10 Chapter > All categories > ICD-10 Morbid List > All categories > Age 2 > Under 1 year, 1 to 4 years, 5 to 9 years, 10 to 14 years, 15 to 19 years > Sex > Men, Women, Ig > Race/ethnicity > White, Black, Brown, Yellow, Indigenous, No information.
To collect data on Hospitalizations of people with Cerebral Palsy and other paralytic syndromes by place of hospitalization. Access to
https://datasus.saude.gov.br/. Access to information > TABNET health information > Epidemiological and morbidity > SUS (SIH/SUS) Hospital Morbidity > General, by place of hospitalization - from 2008 > Geographic Scope > Brazil by Region and State > Row > Region/State > Column > Processing year/month > Content > Hospitalizations > Available Periods > Jan/2018 to Dec/2021 > Available Selections > Region > 1 North Region, 2 Northeast Region, 3 Southeast Region, 4 South Region and 5 Midwest Region > State > All Categories > Service type: All categories > Health care system > public, private, not informed > ICD-10 Morbid List > Cerebral palsy and other paralytic syndromes > Age Group 2 > Under 1 year, 1 to 4 years, 5 to 9 years, 10 to 14 years, 15 to 19 years > Sex > Men, Women, Ig > Race/ethnicity > White, Black, Brown, Yellow, Indigenous, No information.
To collect data on deaths by place of residence. Access to
https://datasus.saude.gov.br/. Access to information > TABNET health information > Vital Statistics > Mortality - since 1996 by ICD-10 > Overall mortality > Geographic Scope > Brazil by Region and State > Row > State > Column > Region > Content > Deaths by place of residence > Available Periods > 2018 to 2020 > Available Selections > Region > 1 North Region, 2 Northeast Region, 3 Southeast Region, 4 South Region, and 5 Midwest Region > Federation Unit > All categories > ICD-10 Chapter > All categories > ICD-10 Group > All categories > ICD-10 Category > All categories > Cause - ICD-BR-10 > All categories > Poorly defined cause > All categories > Age > Under 1 year, 1 to 4 years, 5 to 9 years, 10 to 14 years, 15 to 19 years > Sex > Men, Women, Ig > Race/ethnicity > White, Black, Brown, Yellow, Indigenous, No information > Place of occurrence > Hospital, Other health facilities, Home, Public road, Other, Unknown.
To collect data on deaths by place of occurrence. Access to
https://datasus.saude.gov.br/. Access to information > TABNET health information > Vital Statistics > Mortality - since 1996 by ICD-10 > Overall mortality > Geographic Scope > Brazil by Region and State > Row > Region/State > Column > Region > Contents > Deaths by place of occurrence > Available Periods > 2018 to 2020 > Available Selections > Region > 1 North Region, 2 Northeast Region, 3 Southeast Region, 4 South Region, and 5 Midwest Region > State > All categories > ICD-10 Chapter > All categories > ICD-10 Group > All categories > ICD-10 Category > All categories > Cause - ICD-BR-10 > All categories > Poorly defined cause > All categories > Age > Under 1 year, 1 to 4 years, 5 to 9 years, 10 to 14 years, 15 to 19 years > Sex > Men, Women, Ig > Race/ethnicity > White, Black, Brown, Yellow, Indigenous, No information > Place of occurrence > Hospital, Other health facilities, Home, Public road, Other, Unknown.
To collect data on deaths of people with Cerebral Palsy and other paralytic syndromes by place of residence. Access to
https://datasus.saude.gov.br/. Access to information > TABNET health information > Vital Statistics > Mortality - since 1996 by ICD-10 > Overall mortality > Geographic Scope > Brazil by Region and State > Row > Region/State > Column > Region > Contents > Deaths by place of residence > Available Periods > 2018 to 2020 > Available Selections > Region > 1 North Region, 2 Northeast Region, 3 Southeast Region, 4 South Region, and 5 Midwest Region > State > All Categories > ICD-10 Group > Cerebral palsy and other categories > ICD-10 Category > G80 Cerebral palsy, G83 Other paralytic syndromes > Age > Under 1 year, 1 to 4 years, 5 to 9 years, 10 to 14 years, 15 to 19 years > Sex > Men, Women, Ig > Race/ethnicity > White, Black, Brown, Yellow, Indigenous, No information > Place of Occurrence > Hospital, Other health facilities, Home, Public road, Other, Unknown.
To collect data on deaths of people with Cerebral Palsy and other paralytic syndromes by place of occurrence. Access to
https://datasus.saude.gov.br/. Access to information > TABNET health information > Vital Statistics > Mortality - since 1996 by ICD-10 > Overall mortality > Geographic Scope > Brazil by Region and State > Row > Region/State > Column > Region > Contents > Deaths by place of occurrence > Available Periods > 2018 to 2020 > Available Selections > Region > 1 North Region, 2 Northeast Region, 3 Southeast Region, 4 South Region, and 5 Midwest Region > State > All Categories > ICD-10 Group > Cerebral palsy and other categories > ICD-10 Category > G80 Cerebral palsy, G83 Other paralytic syndromes > Age > Under 1 year, 1 to 4 years, 5 to 9 years, 10 to 14 years, 15 to 19 years > Sex > Men, Women, Ig > Race/ethnicity > White, Black, Brown, Yellow, Indigenous, No information > Place of Occurrence > Hospital, Other health facilities, Home, Public road, Other, Unknown.
Statistical Analysis
Descriptive analysis was performed to report/describe the events and variables of interest. The rate of health facilities and health professionals by region was calculated annually from 2018 to 2021 based on the number of facilities (in each region) divided by the population aged 0–19 years (in each region), then multiplied by 100,000. This calculation was also used to determine the number of physicians, hospitalizations, and deaths by region and each year. The respective population proportions were preserved to minimize the impact of external fluctuations during the evaluated period.
3. Results
Table 1 shows the official population projection figures for ages 0–19 years from 2018 to 2021 (released by IBGE and available on DATASUS) and the percentage of healthcare facilities and physicians in each region compared to the national total. When comparing the ratio between population, locations, and mentioned professionals, the North and Northeast regions have a higher population and significantly fewer health resources than the other regions.
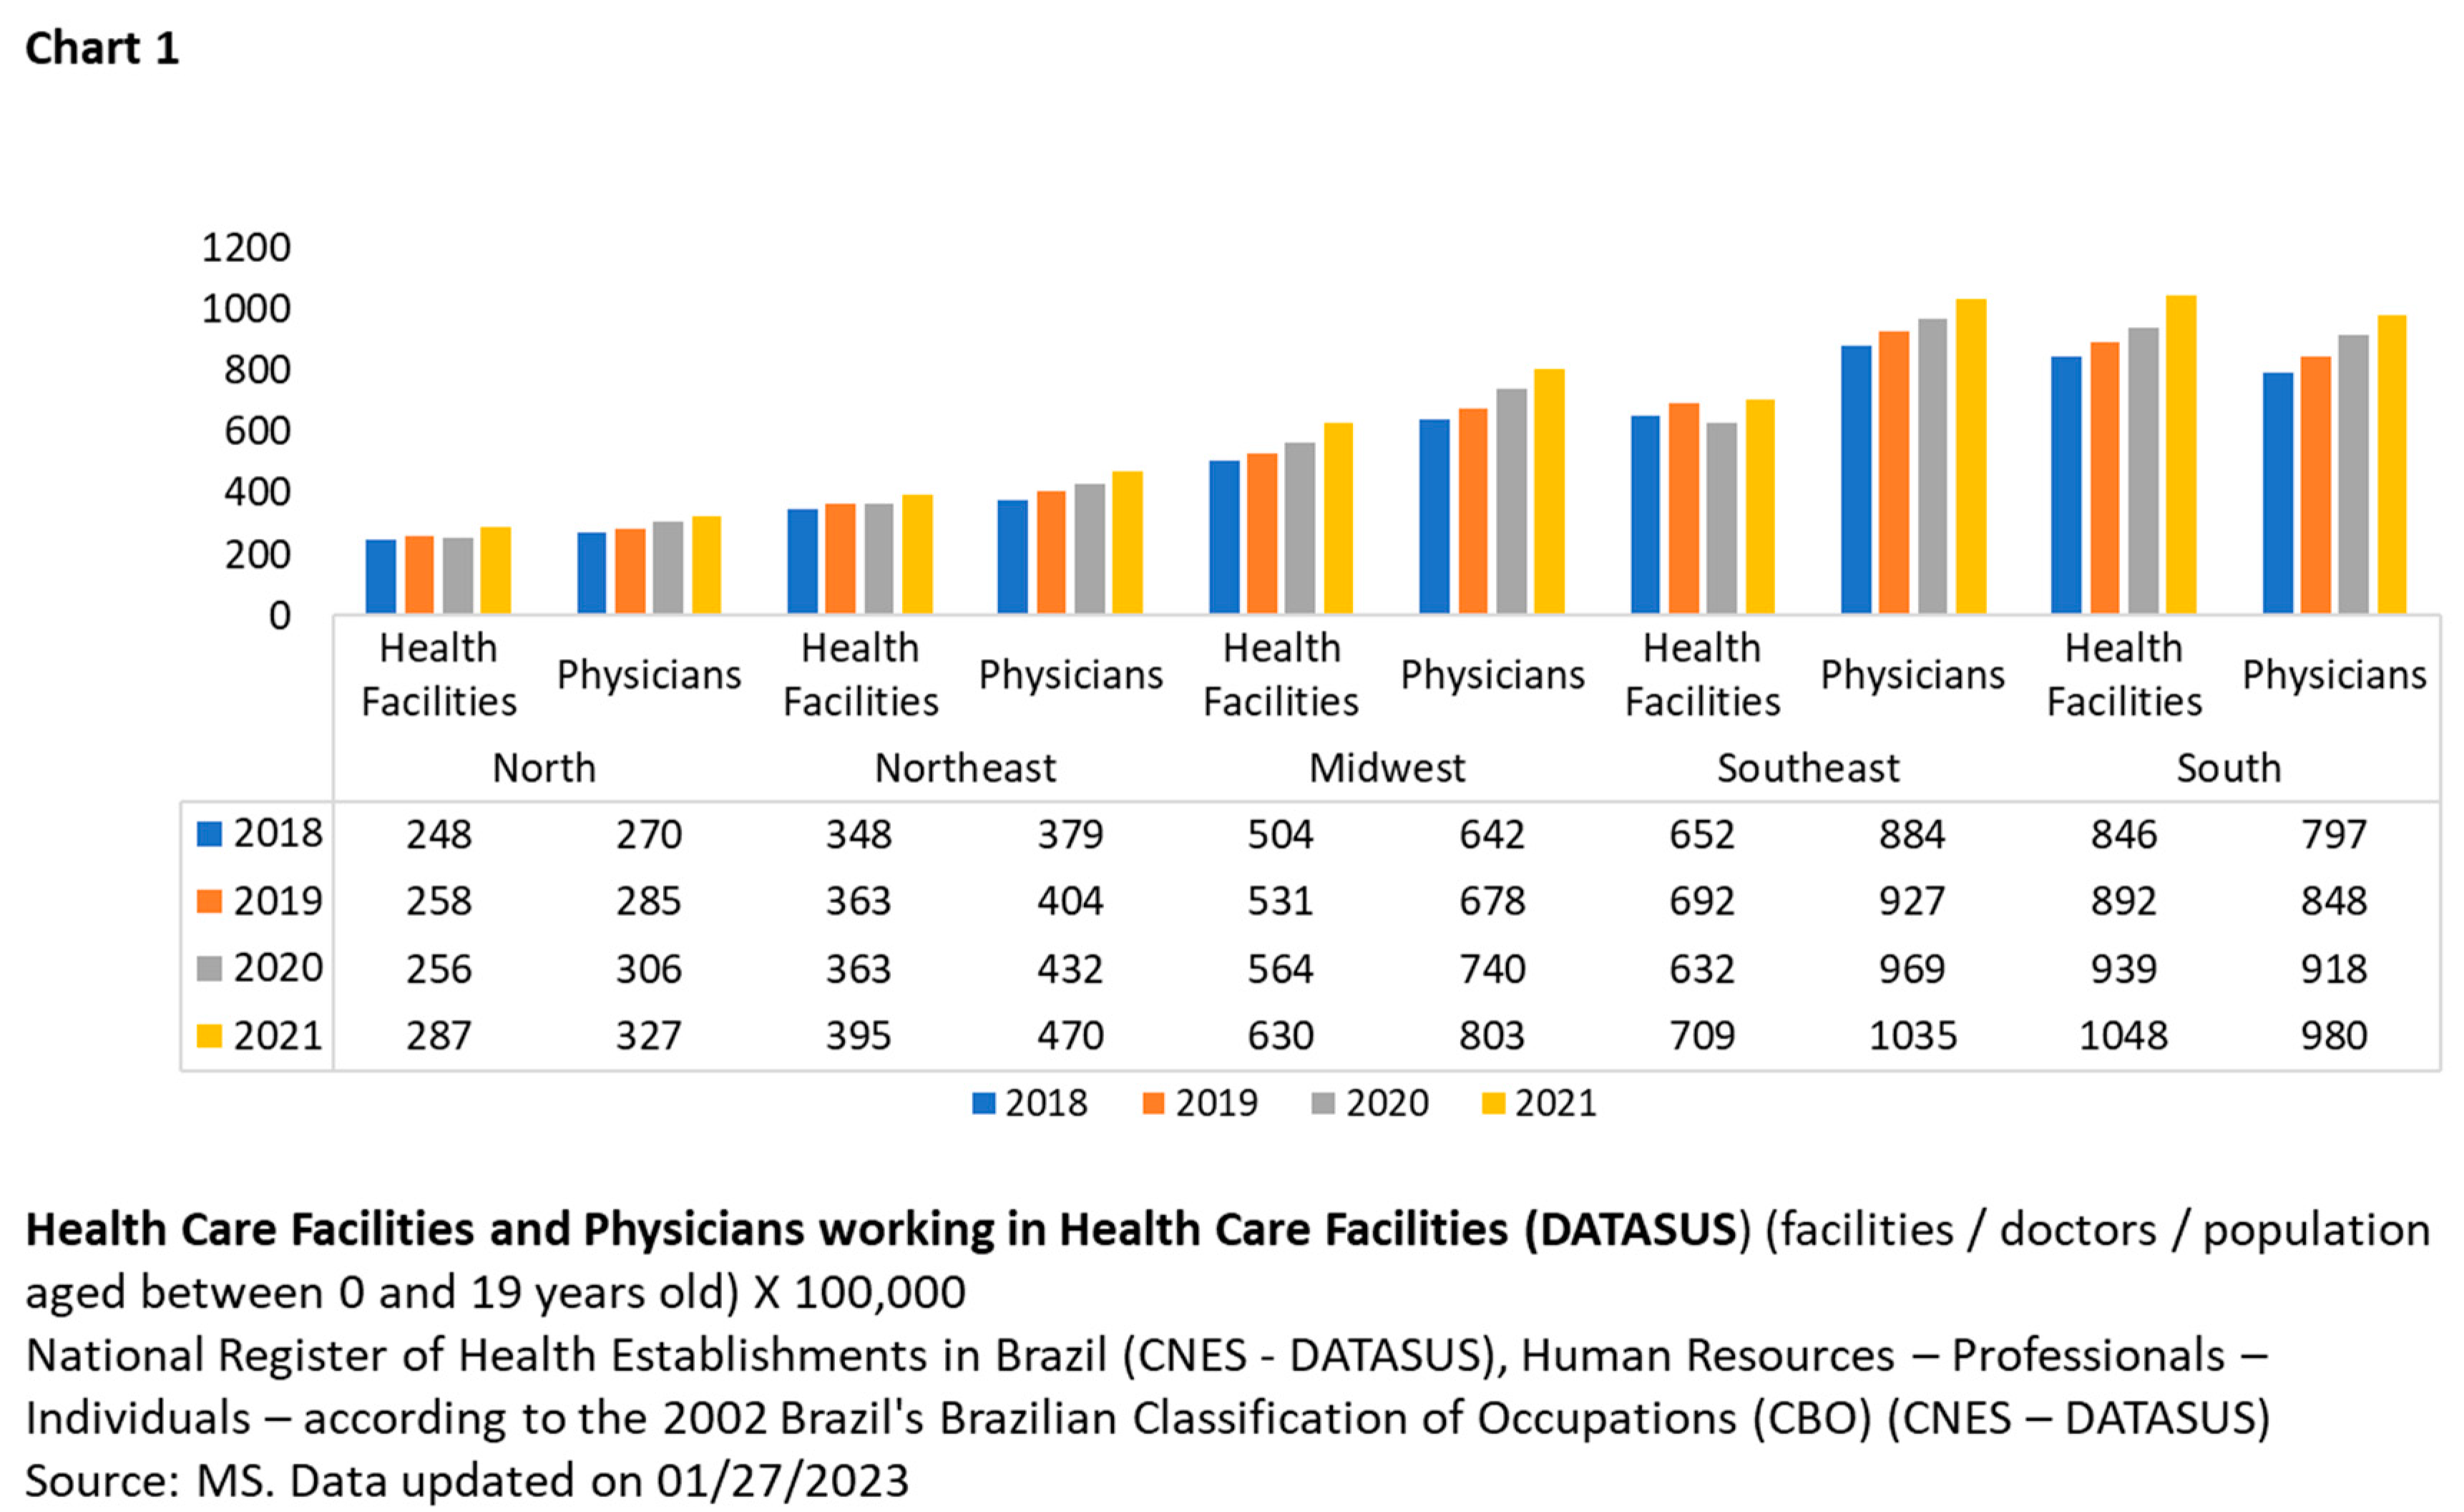
The percentage calculations in Chart 1 consider the number of healthcare facilities and physicians per 100,000 inhabitants within the age group mentioned above to preserve the respective population proportions.
The trend over time has increased in healthcare facilities and physicians, ranging from 4% to 11% across all regions. However, there has been no compensation for areas with poorer health structures.
To examine the disparity between regions, we focused on analyzing the North and Northeast compared to other areas, as Chart 1 shows significant differences regarding health structure. During the analyzed period, it was observed that the North had 3% more population than the Midwest, but the latter had 103% more health facilities and 138% more doctors than the North; the Southeast had 27% more inhabitants than the North, but 163% more health facilities and 228% more physicians than the North; the South had 2% more inhabitants than the North, but the former had 241% more health facilities and 196% more physicians than the latter; In the Southeast, there were 8% more people than in the Northeast, but 87% more health care facilities and 133% more physicians; finally, in the Northeast, the population was 17% larger than in the South, but the latter had 158% more health care facilities and 112% more physicians.
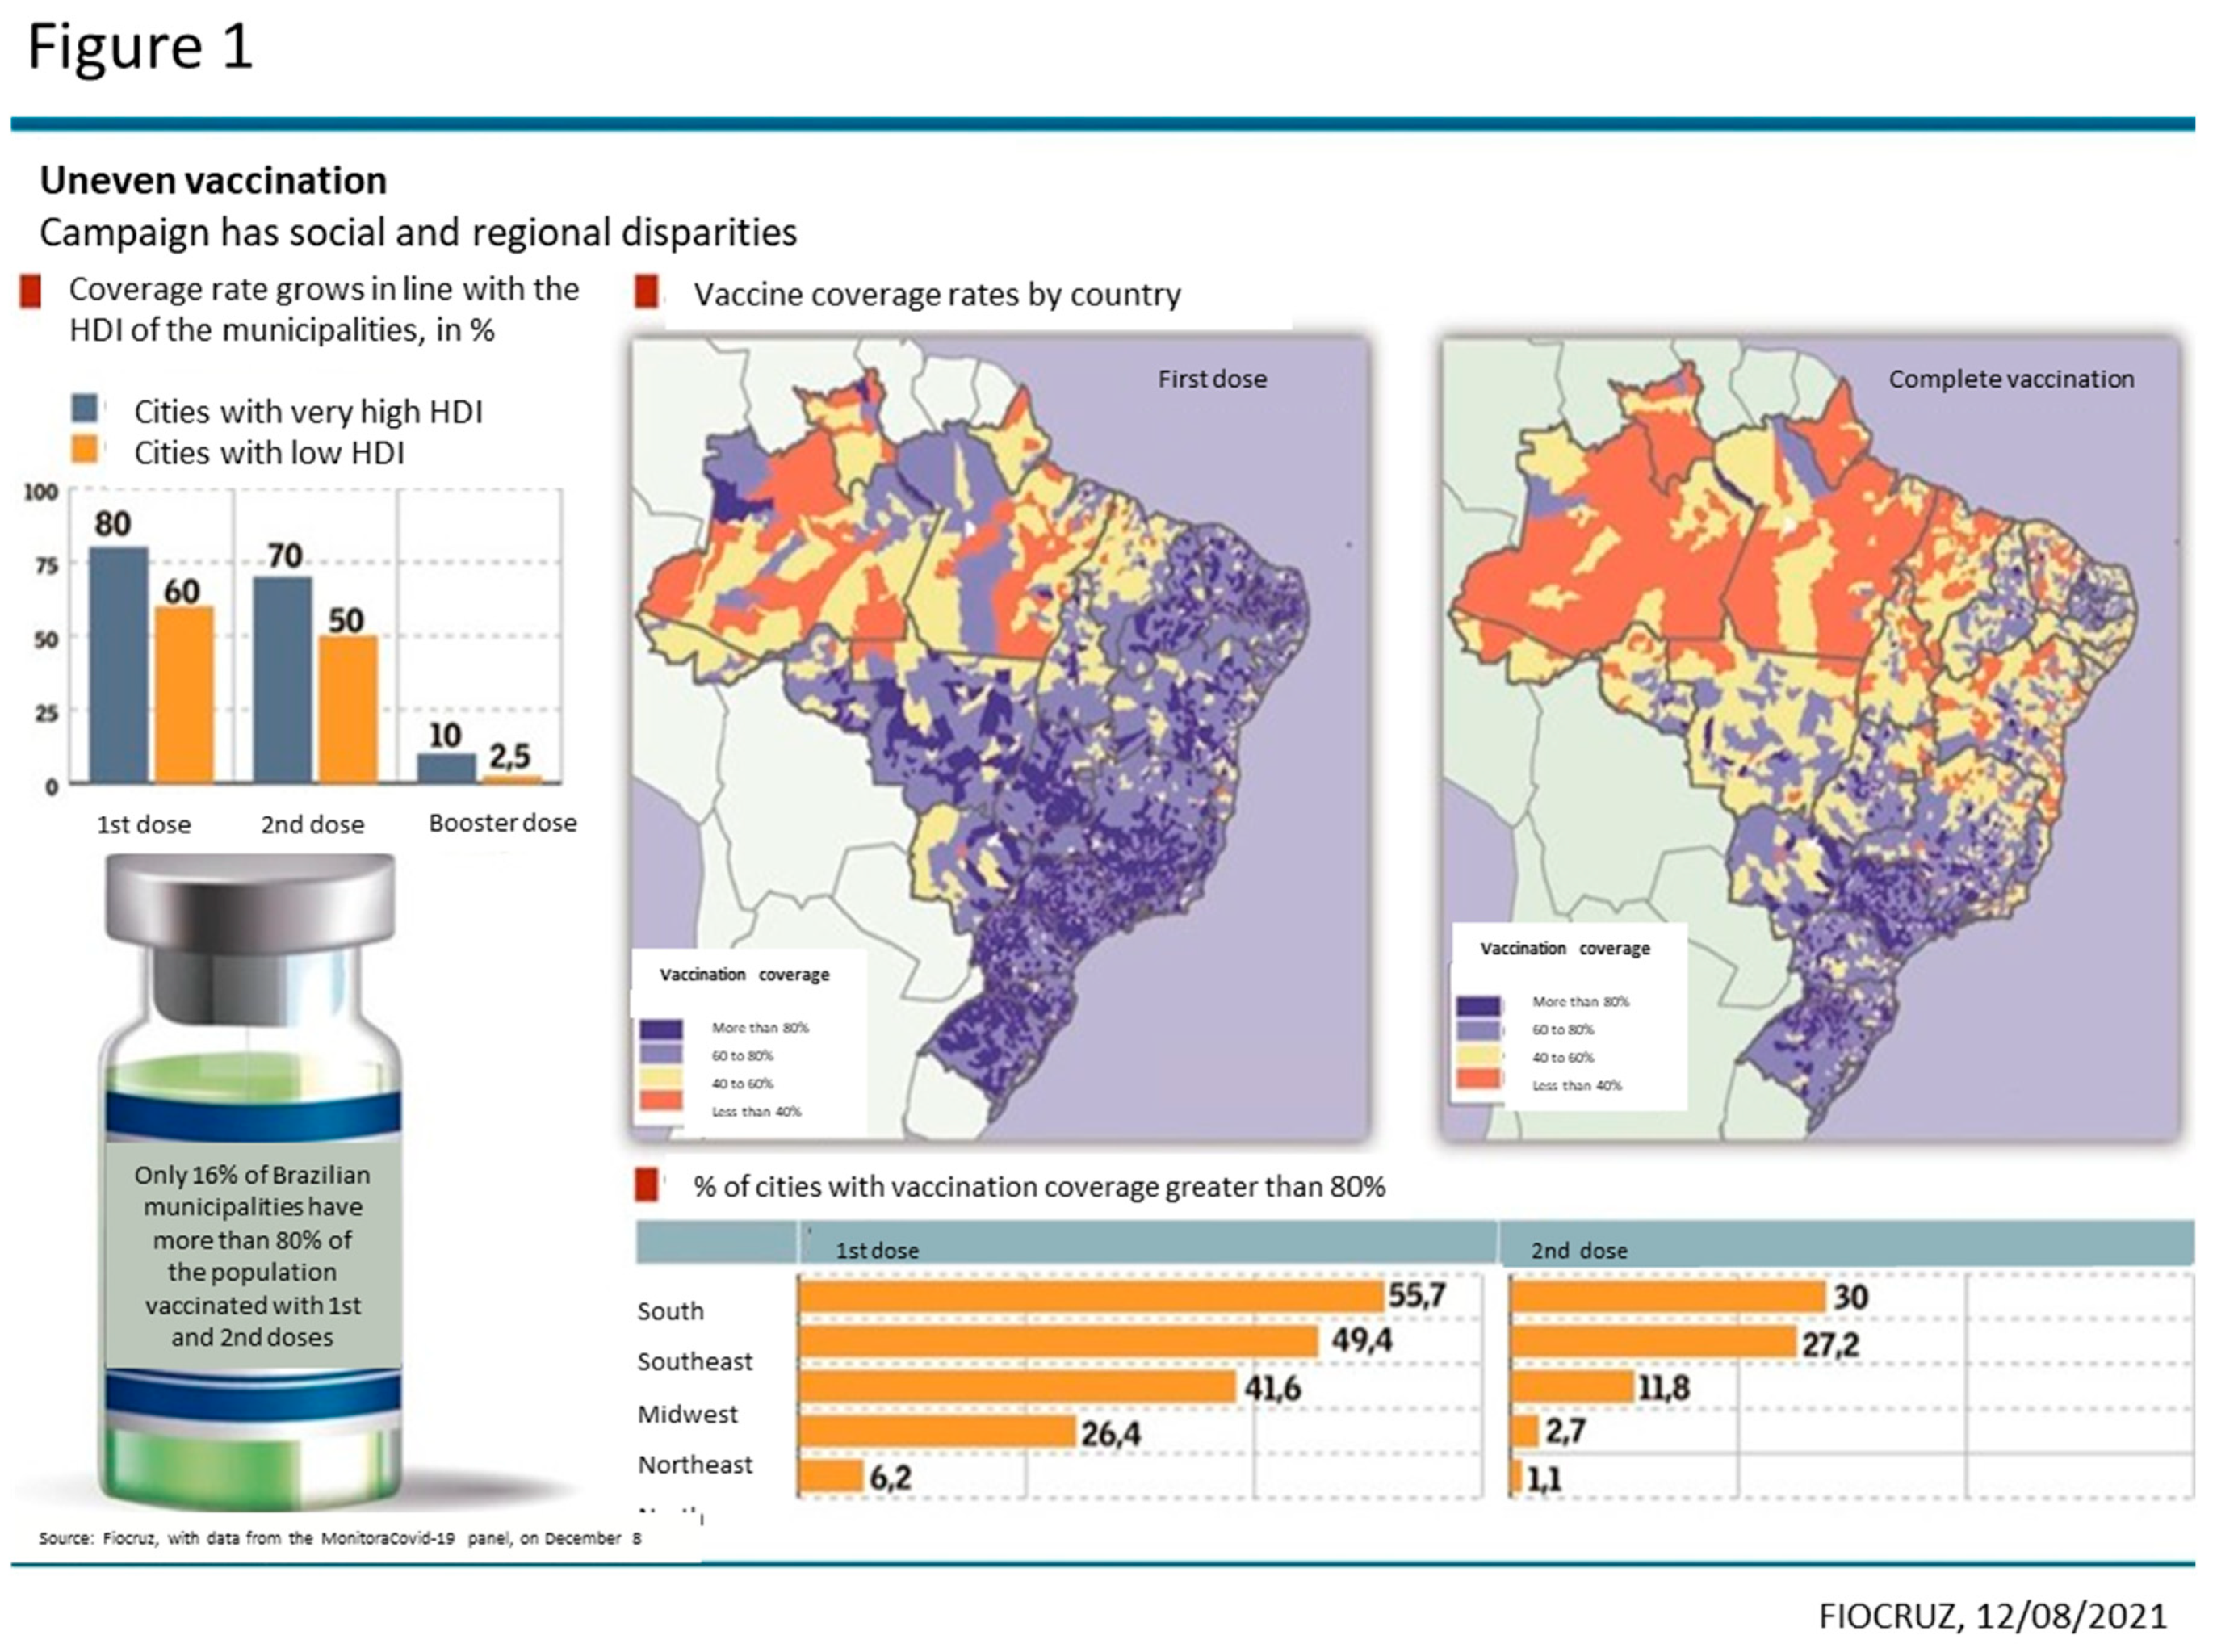
The disparity among Brazilian regions is evident in Figure 1 and Table 2. By associating the Human Development Index (HDI) obtained from the Atlas of Human Development in
Brazil [
17] — with COVID-19 vaccination data made available by Fiocruz and DATASUS (health care facilities, physicians, hospitalizations, and deaths in the age group specified in this study), it is possible to conclude that regions with the lowest HDI are also the least equipped in terms of health structure [
17].
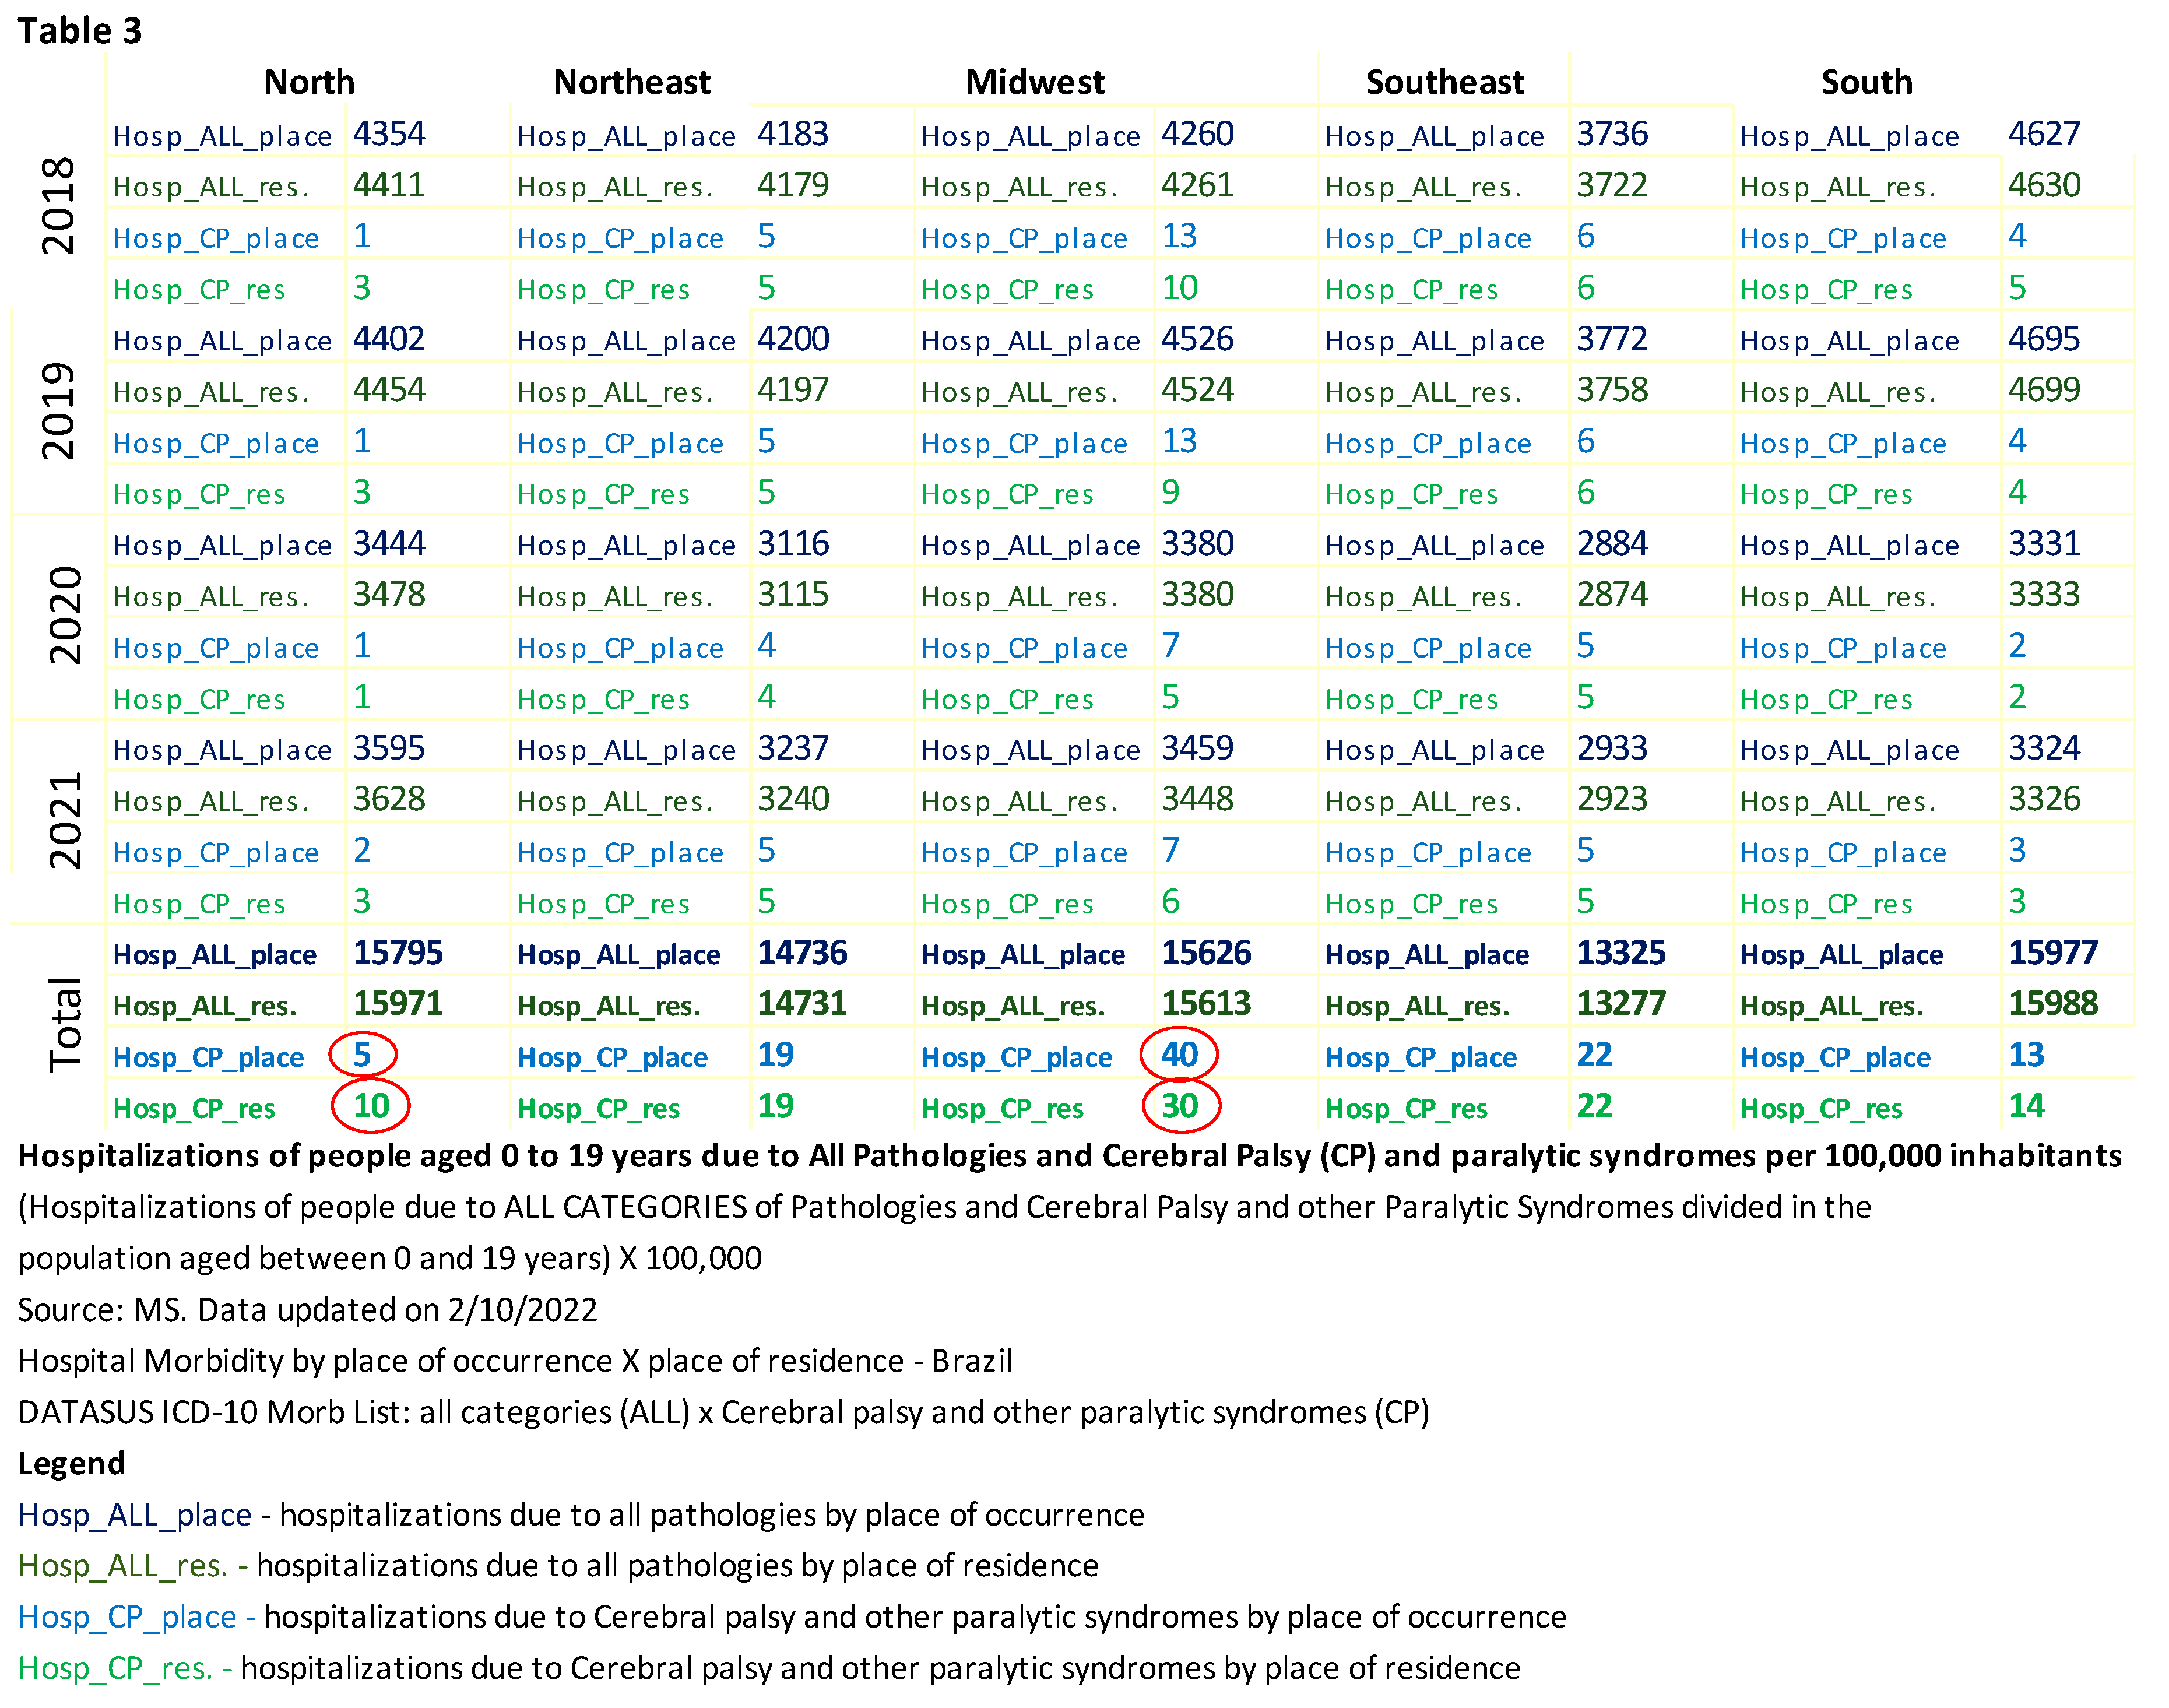
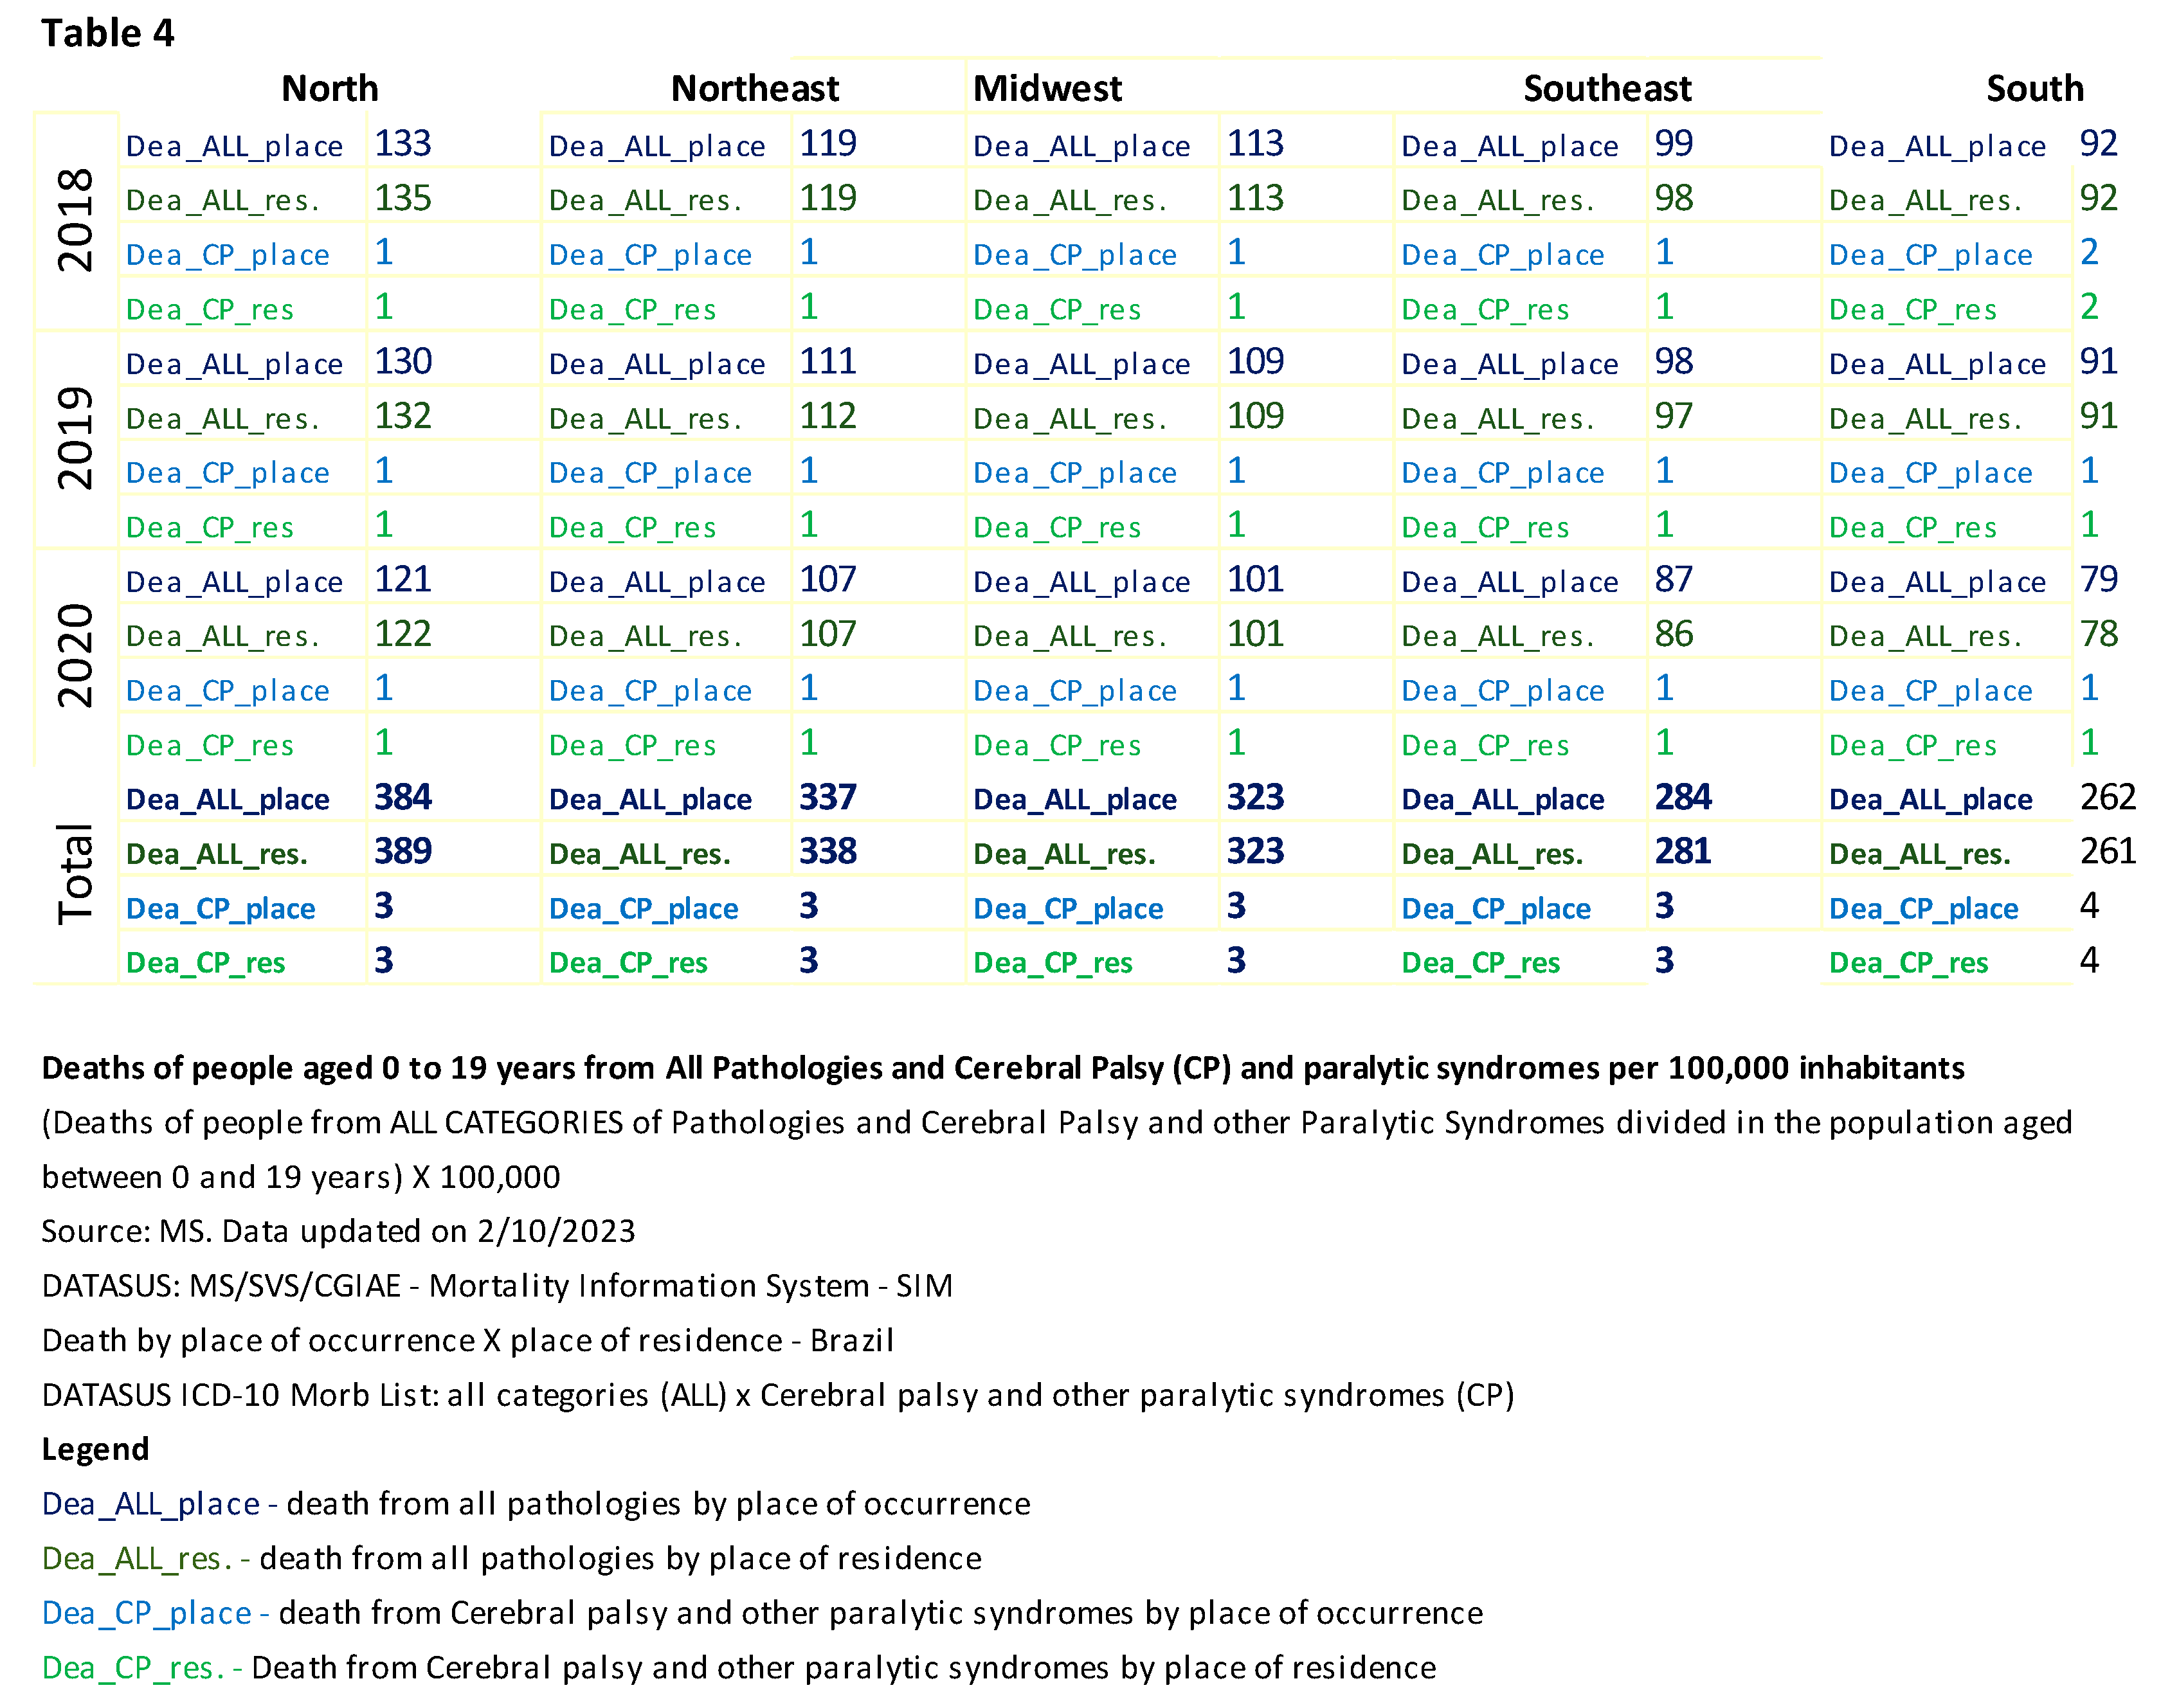
Table 3 shows the hospitalizations of individuals aged 0 to 19 years, with all categories of pathologies divided by the total population of the mentioned age range and multiplied by 100,000. The same calculation was performed to measure the deaths of people of the same age with a specific diagnosis of CP and other paralytic syndromes, as shown in Table 4.
Hospitalizations
Considering all pathology categories, the total number of hospitalizations by place of care is 75,459, while the total number of hospitalizations by place of residence is 75,580. In the category "Hospitalizations of persons with CP and other paralytic syndromes," the total number of hospitalizations by place of care is 98, while the total number of hospitalizations by place of residence is 94. The discrepancy in the total number of hospitalizations for each category may indicate underreporting, which is a limitation of this study. For the annual comparison analysis between regions, hospitalization data by place of care were used because more data was available.
When comparing hospitalizations of people with a specific diagnosis of CP and other paralytic syndromes by place of hospitalization and place of residence, Table 3 shows a significant difference (100%) in the North, with the number of hospitalizations being lower than the number of residents. In the Midwest, there was also a significant difference (27.5%) between the place of hospitalization and the place of residence, but in this region, the numbers for hospitalization were higher. This analysis suggests that individuals from the North may have migrated to other regions in search of medical care. The conclusion cannot be precise as it is impossible to determine with certainty in which region patients who migrated from other regions were treated due to the variation in admission numbers.
During the research on out-of-home care (OHC), which refers to care provided by the government outside the region of residence, it was not possible to determine the specific age group studied in this research, as all available documents only provide information on the total number of the care supplied to the population of all ages.
A search was conducted by region to find out more details about the health care system, whether it was public, private, or unknown, but the only available data was "not informed."
The total number of hospitalizations for all conditions in the five regions was 2,563,560 in 2018, 2,567,688 in 2019, 1,903,448 in 2020, and 1,925,568 in 2021, totaling 8,960,264. In 2018 and 2019, total hospitalizations accounted for 29%, while the rates decreased to 21% in 2020 and remained the same in 2021. According to data published by DATASUS, there were more hospitalizations in this age range two years before the pandemic.
When analyzing the percentage of hospitalizations of people with all categories of pathologies, the variation among the regions ranged from 1% to 2%. Adolescents aged 15 to 19 accounted for 31% of hospitalizations, followed by children under 1 year old (26%), children 1 to 4 years old (19%), children 5 to 9 years old (13%), and children 10 to 14 years old (11%). Women predominated in hospitalizations, accounting for 54% of the cases.
When measuring ethnicity/race, individuals who self-identified as brown accounted for 44% of hospitalizations, while those who did not report their ethnicity/race accounted for 26%. The lack of information on ethnicity/race in DATASUS constitutes a limitation in this study.
Regarding the nature of hospitalization, emergency care accounted for 86%.
When analyzing the percentage of hospitalizations of people with CP and other paralytic syndromes in 2018, the South had 140% more hospitalizations of people with CP compared to the North; the Midwest had 800% more hospitalizations of people with CP compared to the North; the Northeast had 380% more hospitalizations of people with CP compared to the North; finally, the Southeast had 440% more hospitalizations of people with CP compared to the North. It is possible to verify that hospitalizations recorded in the North region are significantly lower than in other regions when PC is diagnosed.
Children between the ages of 5 and 9 years old accounted for 30% of hospitalizations, followed by those aged 10 to 14 at 26%, adolescents aged 15 to 19 at 22%, children between 1 and 4 at 19%, and children under 1 year old at 4%. Males predominated in hospitalizations with 57%.
When measuring ethnicity or race, 64% of hospitalizations have no information on ethnicity or race. The lack of information on ethnicity or race in DATASUS constitutes a limitation in this study.
Regarding the nature of the admissions, elective care accounted for 85% of them.
Deaths
The mortality data from the Mortality Information System (SIM) [
18] covers up to 2020.
According to Table 4, the North and Northeast regions had more deaths across all categories listed in the Morbidity List. There were no regional discrepancies regarding the deaths of patients with CP and other paralytic syndromes between 0 and 19 years in the age group.
For the annual comparison analysis between regions, we used data on deaths by place of occurrence to maintain the same reasoning as for hospitalizations.
The total number of deaths due to all conditions in the five regions was 68,270 in 2018, 65,206 in 2019, and 59,129 in 2020, resulting in 192,605. Regarding total deaths, 35% occurred in 2018, 34% in 2019, and 31% in 2020.
Children under 1 year old accounted for 53% of the deaths. Males predominated in the deaths, accounting for 63%.
When measuring ethnicity/race, the reported deaths show that individuals with a brown ethnicity or race accounted for 53% of the deaths, while those with an unknown ethnicity/race accounted for 5%. The lack of information on ethnicity or race in DATASUS constitutes a limitation in this study. Deaths in hospitals accounted for 74% of all recorded deaths.
The total number of deaths among people diagnosed with CP and other paralytic syndromes in the five regions was 745 in 2018, 740 in 2019, and 539 in 2020, totaling 2024 deaths. Regarding total deaths, 37% occurred in 2018, another 37% in 2019, and the remaining 27% in 2020.
Adolescents aged 15 to 19 accounted for 34% of deaths, followed by children aged 10 to 14 (28%), children aged 5–9 years (17%), children aged 1 to 4 (16%), and infants under 1 year (5%). Males predominated in the deaths, accounting for 58%.
People of the white race accounted for 55% of the deaths, while those of unknown race accounted for 3%. The lack of information on ethnicity/race in DATASUS constitutes a limitation in this study. Deaths in hospitals accounted for 62% of all records.
4. Discussion
The statistical data must reflect the reality of each region so that specialized services tailored to the population's needs are available in the area where the child was born and lives.
When comparing the data provided by DATASUS and IBGE, it is possible to observe a discrepancy in the number of healthcare facilities in each Brazilian region.
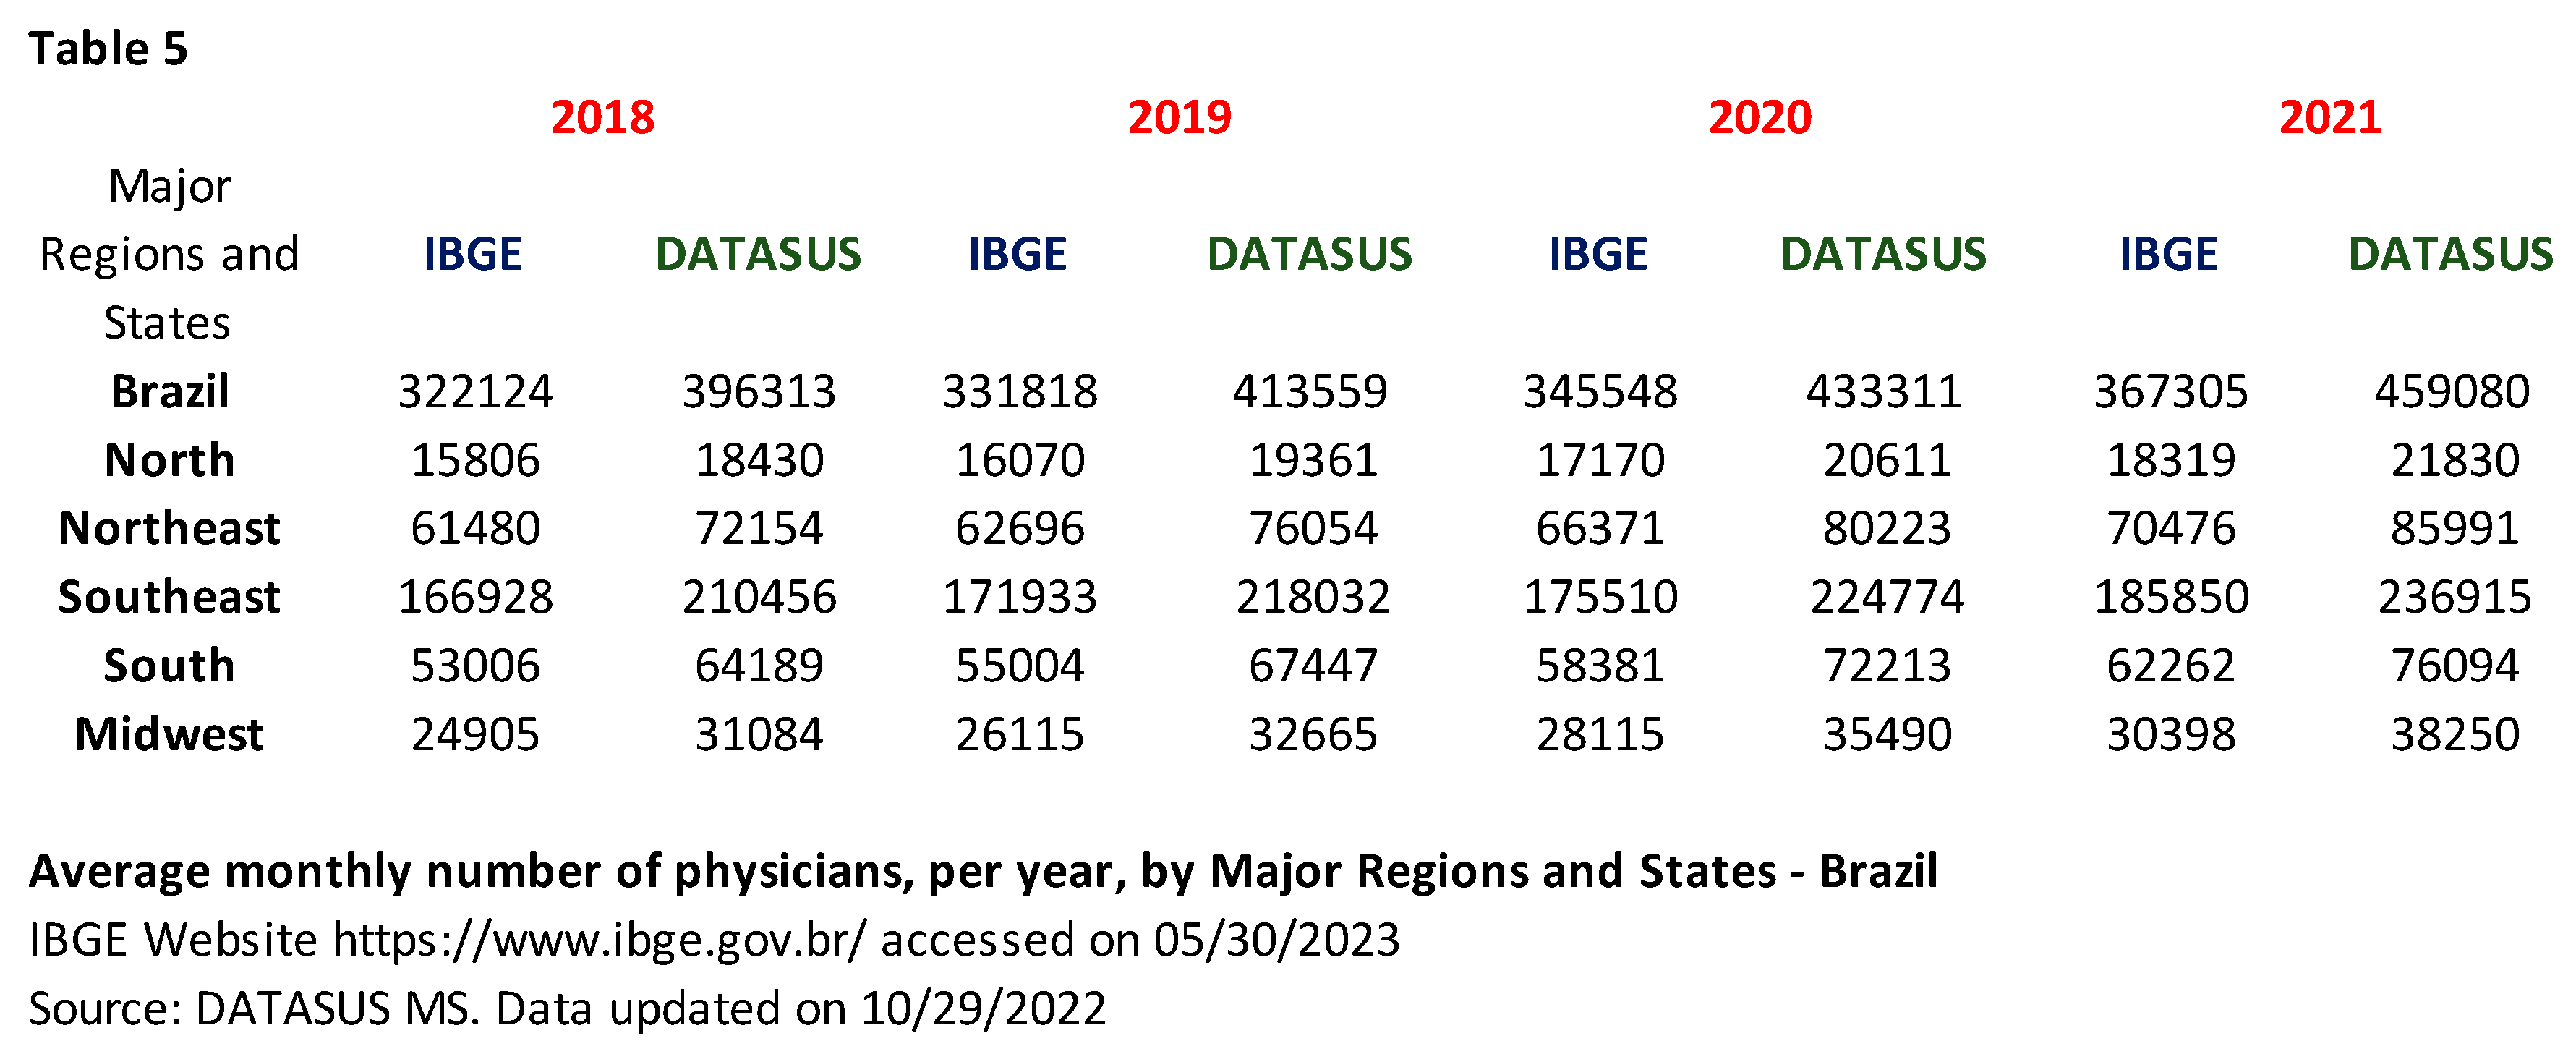
The discrepancy between the table showing the number of physicians (also shown in Table 1) and Table 5 highlights the need to improve the certification of health-related data provided by official Brazilian government sources.
Other studies have reported underreporting and regional inequalities in Brazil [
19,
20].
The analysis of the profile of health service utilization is complex, as it results from the interplay between the supply and access to health services and the users' sociodemographic and epidemiological characteristics. The changes in the demographic and epidemiological profile of the population, as well as the transformations in the organization of care and the continuous incorporation and demand for new technologies, imply the need for increasingly detailed studies of hospital care in the country and the creation of instruments that support the management of the SUS and the Supplementary Care System [
21]. Comparing the data on access to health services before and after the onset of the COVID-19 pandemic is crucial for comprehending the demands and care profile [
3].
By correlating the data made available by DATASUS with the HDI of each Brazilian region, it is possible to collaborate with the development of public policies [
21].
By correlating the HDI with the data provided by DATASUS, it becomes evident that the regions with the lowest HDI also have poorer healthcare structures [
17].
The socioeconomic and healthcare indicators show an expansion in the supply of healthcare facilities and physicians in Brazil, especially in 2020 (Chart 1), coinciding with the beginning of the COVID-19 pandemic. However, the unequal distribution of these resources across the regions of Brazil remained unchanged, which corroborates previous studies by Oliveira et al. [
22] and Costa et al. [
23].
The difference in health structure impacts the number of hospitalizations [
24,
25]. However, when compared, there has been a decrease in the number of hospitalizations since 2020. The COVID-19 pandemic has impacted pediatric epidemiology, resulting in declining hospitalizations and medical visits [
26,
27].
The mapping of age groups and regions using data from DATASUS can significantly impact the implementation of specialized services in the areas with demand, such as rehabilitation services for individuals with cerebral palsy.
When comparing hospitalizations of people with CP and other paralytic syndromes between the North and other regions, it is evident that the North has significantly fewer hospitalizations. A study conducted by the Association for Assistance to Disabled Children (AACD - São Paulo unit) characterized the profile of the population served by the institution concerning the socioeconomic status of the patients who participated in the study by Binha, Maciel, and Bezerra [
6]. Considering the IBGE's standard geographic divisions, it analyzed the territoriality regarding the cases' origin and naturalness. It was observed that a majority of families reported moving to the state of São Paulo in search of improved access to specialized and multi-professional healthcare. Regarding the socioeconomic profile, 55.5% of families did not receive any social benefit; 36.6% received some social benefit; and in 7.7% of cases, this information was unavailable. Regarding access to specialized medical care before the initial triage/consultation at AACD, it was found that 62.4% of cases had previously consulted with a neurologist or neurosurgeon; 50.3% with a pediatrician; and 15.1% with an orthopedist. Additionally, 97.7% had never consulted with a physiatrist/specialist in physical medicine and rehabilitation. This supports findings from another study that links children and adolescents with CP in northeastern Brazil and their families to individuals living below the extreme poverty line [
28].
It is essential to highlight the hypothesis of underreporting hospitalizations and deaths due to deficits in the diagnostic process of CP and other paralytic syndromes. This can cause the omission of critical epidemiological data and may be associated with a lack of medical care, resources for diagnosing the underlying cause, and correct reporting.
Identifying discrepancies in healthcare and understanding the impact of these differences on diagnosis, specialized treatment, and prognosis "can lead to better discussions on public policies, allowing for the restructuring of these policies and health programs, including the reformulation of actions directed towards specific pathologies in different regions, given the great cultural, demographic, and socioeconomic diversity across the vast Brazilian territory. This fact justifies the need to verify regional contrasts, which, among other advantages, can support planning and decision-making in these areas" [
29].
