
Submitted:
09 August 2023
Posted:
11 August 2023
You are already at the latest version
Abstract
This paper presents a novel dynamic camera parameter control method for position and posture estimation of highly miniaturized AR markers (micro AR markers) using a low cost general camera. The proposed method performs iterative calculation of the marker’s position and posture to converge them to specified accuracy with dynamically updating the camera’s zoom, focus and other parameter values based on the detected marker’s depth distances. For a 10 mm square micro AR marker, the proposed system demonstrated recognition accuracy of better than ±1.0% for depth distance and 2.5∘ for posture angle with a maximum recognition range of 1.0 m. In addition, the iterative calculation time was at most 0.7 seconds in an initial detection of the marker. These experimental results suggest that the proposed method and system can be applied to a robotic precise handling of small objects with low cost.
Keywords:
Image recognition
; Micro AR marker
; Camera parameter control
; Iterative recognition
1. Introduction
In recent years, robots have been used to automate many tasks to improve productivity at manufacturing and other production sites. Real-time object position and posture estimation using image processing is an essential function for autonomous robots that perform object handling in automation. There are various methods for estimating object position and posture using image processing.
Methods using stereo cameras or RGB-D cameras can estimate the position, posture, and shape of an object from multiple RGB images or depth images, enabling handling of general objects without the need to process the handling target. There have been many attempts to estimate the position and posture of objects using machine learning [2,3,4,5,6]. However in general, the above methods have disadvantages such as high implementation costs due to the large amount of data sets required and the time required for data learning. Therefore, they are not suitable for applications that require low-cost and low-computational resources.
On the other hand, visual markers are support tools that facilitate object identification and position and posture estimation. Since visual markers utilize known shape information and image features, they can be used to identify marker IDs and estimate relative position and posture from a camera using only a single 2D camera. Although there is a restriction that the marker must be fixed to the target object, it has the advantage of being inexpensive to implement. In addition, there are a variety of marker projection patterns, and they have been presented for various applications [7,8,9,10,11].
Among visual markers, AR markers have the advantage of easily enabling augmented reality and providing information to users in a more intuitive manner. Most AR markers use the principle of projective transformation to perform position and posture estimation of the marker by finding a homogeneous transformation matrix that represents the position and posture of the marker’s coordinate system as seen from the camera coordinate system. The open source library ARToolKit markers [12] is a typical example, and this marker technology is used in self-position estimation [13,14,15,16,17,18] and mapping [19,20,21] for mobile robots, and is one of the essential technologies in navigation systems.
On the other hand, AR markers can also be used for handling specific objects [22,23,24]. However, the size and recognition accuracy of AR markers are problematic when handling small objects or objects with complex shapes. Conventional AR markers require a large amount of space to be attached to the target object, and it is undesirable from an aesthetic point of view for the markers to be too conspicuous in a real environment. Several previous studies have attempted to reduce marker size or improve the aesthetics of markers. Zhang et al [25] developed a curved surface marker that can be attached to cylindrical objects as small as 6 mm in diameter, enabling real-time tracking of ultrasound probes. However, these markers can only be recognized in a space of 30 to 125 mm in depth from the camera, making them unsuitable for object handling that requires a large workspace. Costanza et al [26] created a marker that is unobtrusive to users in their living environment with "d-touch”, an open source system that allows users to create their own markers based on their aesthetic sense. However, there is no concrete verification with regard to miniaturization or recognition accuracy.
It is also difficult to consistently achieve the recognition accuracy needed for accurate object handling. To solve this problem, Douxchamps et al. [27] improved accuracy and robustness by physically increasing marker size and using high-density patterns to reduce noise and discretization in marker recognition. This method can recognize markers at a maximum of 0.06 to 4 ppm, however, the miniaturization of the marker becomes a trade-off issue. Yoon et al. [28] presented a coordinate transformation algorithm to obtain the globally optimal camera posture from local transformations of multiple markers, improving the accuracy of pose estimation. Yu et al. [29] presented a robust pose estimation algorithm using multiple AR markers and showed its effectiveness in real-time AR tracking. Hayakawa et al. [30] presented a 3D toothbrush positioning method that recognizes AR markers on each face of a dodecahedron attached to a toothbrush and achieved a motion tracking rate of over 99.5%. However, these methods require multiple markers to achieve high recognition accuracy, which requires large space to attach them to objects.
There are two methods to improve recognition performance with a single marker while maintaining the marker size; one is using filters and the other is using circular dots as feature points. The method using a filter [31,32] reduces jitter between frames and stabilizes posture recognition, but does not guarantee accurate recognition. On the other hand, in the method of using circular dots for posture estimation, Bergamasco et al. [33,34] achieved robustness against occlusion by using markers that utilize the projection characteristics of a circular set of dots and an ellipticity algorithm. In addition to circular dots, Tanaka et al. [35,36,37,38] presented an AR marker that uses lenticular lenses or microlens arrays to change the pattern depending on the viewing angle, reducing the posture estimation error and improving robustness against distance and illumination changes. These techniques have dramatically improved recognition performance for a single marker to enhance the practicality. Therefore, these techniques are also promising for marker miniaturization, but have not been demonstrated to date.
However, even if marker miniaturization and high recognition accuracy can be achieved, a generally-used camera system limits the range of marker recognition, making practical operation difficult. Because the markers are so small, they cannot be recognized with high accuracy from an overhead view of the workspace. Conversely, a magnified view narrows the field of view, making it difficult to recognize the surrounding environment necessary for handling. To solve this problem, Toyoura et al. [39] presented a monospectrum marker that enables real-time detection from blurred images, thereby extending the recognition range. However, the recognition of translational positions has an average error of 5 to 10 mm, which does not meet the level of recognition accuracy required for object handling. Another disadvantage is that the system requires a high-performance GPU for real-time detection.
Based on the background described above, this study will develop a prototype micro AR marker of 10 mm per side that is compatible with the high accuracy recognition method of Tanaka et al. [38], and construct a low-cost and high accuracy marker recognition system using a general-purpose web camera. The micro AR marker is printed on a glass substrate by photolithography with high resolution, so that the marker image is not easily degraded even when the marker is magnified by a camera. First, we demonstrate that this AR marker inherently has very high accuracy with regard to position and posture recognition despite its ultra-compact size. On the other hand, we reveal the problem of insufficient recognition range for practical use with a conventional camera system. Next, to solve this problem, we newly present a dynamic camera parameter control method that can maintain high recognition accuracy over a wide field of view, and demonstrate its effectiveness through a series of experiments.
This paper is organized as follows. Section 1 describes the background and objectives of this study. Section 2 describes the overall system configuration. Section 3 describes the process of the proposed camera control system, i.e., the algorithm for camera parameter optimization. Section 4 describes the results of the evaluation experiments of the proposed camera control system. Section 5 discusses the results of the evaluation experiments. Finally, Section 6 describes the summary of this paper and future issues.
2. System Configuration
2.1. Hardware Configuration
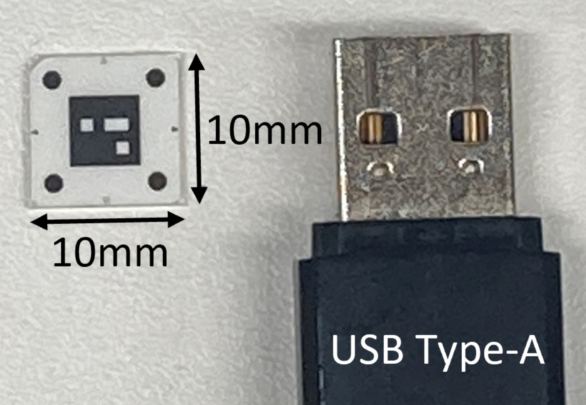
The hardware of the camera control system proposed in this paper consists of three pieces of hardware: an AR marker, a single RGB camera, and a PC as a processing unit. The AR marker used was a micro AR marker of 10 mm per side, which is compatible with the Tanaka et al. [38] high-precision recognition method shown in Figure 1. As shown in Figure 1, this marker is equivalent in size to a USB Type-A. The marker was printed on a glass substrate by photolithography with high resolution, so that the marker image is not easily degraded even when viewed under magnification with a camera. The camera captures reference points at the four corners of this marker, and by processing the images arithmetically, as shown in Figure 2, it is possible to estimate the relative position and posture of the marker as seen from the camera with high accuracy. A USB 3.0 webcam was used as the single RGB camera. Table 1 shows the camera performance. The proposed dynamic camera control system requires zoom and focus adjustment functions, and a wide diagonal viewing angle is desirable. Therefore, a BRIO C1000eR® (Logicool, Figure 3) with digital zoom and focus adjustment functions and a maximum diagonal viewing angle of 90 degrees was used. However, when the camera’s diagonal viewing angle was set to 90 degrees, the output image from this camera was highly distorted, and this distortion had to be removed first. To prepare the camera calibration data that would serve as a reference for removing the distortion, calibration was performed using OpenCV’s camera calibration function [40], with the camera’s autofocus function turned on. In addition, for the camera control system described in Section 3.1, calibration was also performed with the camera’s autofocus function turned off to prepare a set of calibration data for each focus value. A Think-Pad X1 Carbon (i7-6600U 2.6GHz, 16GB memory) was used as the processing PC.
2.2. Software Configuration
Figure 4 shows the software configuration of the camera control system proposed in this paper. ROS Melodic was used as the middleware for the development of this study. The software used for AR marker recognition was LEAG-Library from LEAG Solutions Corp. This library is compatible with the high-accuracy recognition method of Tanaka et al.[38]. It also uses OpenCV as an image processing library and uvc-camera as a library for acquiring images from USB cameras, etc. The Relay node is used to relay the AR marker values received from the LEAG-Library. It identifies marker IDs and performs type conversion. The Iteration node determines camera parameters such as zoom, focus, and calibration data based on the AR marker values received from the Relay node, and provides input to the camera and feedback to the LEAG-Library. It also determines the convergence of the AR marker position and posture and the final AR marker value. Topic communication was used to send and receive AR marker information between nodes. Figure 5 shows the correlation diagram of topic communication between nodes obtained from the ROS function rqt_graph. The mid node acts as the Relay node shown in Figure 4, passing AR marker values to the iteration node using a topic named tf_mid. Each node is written in C/C++ language for high-speed processing. The cycle of topics delivered from LEAG-Library is about 30 Hz, the same as the frame rate of the camera.
3. Camera Control System
This section describes the dynamic camera control processes that properly adjust the parameters of zoom, focus, and calibration data to finally determine the position and posture of the AR markers. The three parameters of zoom, focus, and calibration data are collectively referred to as "camera parameters”.
3.1. Marker Recognition Process
As shown in Figure 6, the proposed camera control system consists of two processes: Scanning process scans the camera’s shooting range to detect AR markers; Iteration process optimizes camera parameters based on the detected AR marker positions to determine the final AR marker position and posture. Here, it is assumed that the AR marker is still present within the camera’s shooting range when the camera parameters are changed.
Table 2 shows the camera parameters used in this system and the parameters used to calculate the camera parameters. As will be discussed later in Section 4.4, when recognizing micro AR markers, if the camera zoom function is not used, the size of the AR marker in the image will be very small and the recognition range of the AR marker will be narrow. Also, when the zoom magnification is large, the recognition accuracy of the position of AR markers in close proximity to the camera is poor. Therefore, it is necessary to dynamically control the zoom value to have a wide recognition range. The zoom value W is proportional to the depth distance z from the camera of the AR marker shown in Figure 2, and is calculated by Equation 1. The camera magnification n is also proportional to W as shown in Equation 2.
As the data is presented in Section 4.3, a fixed-focus camera has a narrow range for recognizing AR markers with a range of only 0.2 m in the depth distance. On the other hand, an auto-focus camera often fails to recognize AR markers because the camera unexpectedly focuses on the background that has greater contrast than the micro AR markers. Therefore, it is necessary to explicitly control the focus to have a wide recognition range. The focus value F is also determined by the marker’s depth distance z using Equation 3. The smaller the focus value is, the farther away from the camera it is. The constants and used in Equation 3 are constants obtained by measuring the optimum focus value according to the depth distance from the camera in advance and by exponential approximation of the experimental results.
The calibration data also includes the distortion coefficient matrix and the internal parameter matrix of the camera. The distortion coefficient matrix refers to the lens distortion and is represented by a 1 × 5 matrix containing the radial distortion coefficients () and tangential distortion coefficients () as in Equation 4. The internal parameter matrix refers to camera-specific parameters and is represented as shown in Equation 5 in a 3 × 3 matrix containing the focus distance () and optical center (). In this work, 31 calibration data sets for every increment of 5 in the focus value were prepared. The system selects the most appropriate calibration data based on the calculated focus value and applies it to the next recognition process.
The two processes shown in Figure 6 are described in detail below.
In the Scanning process, AR markers are initially detected by scanning within the camera’s shooting range; the Scanning process follows the steps below.
- (1a)
- The camera parameters are set to the initial values W=500 and F=150, with the zoom at its maximum and the focus at its farthest forward. The reason for these settings is that the zoom value is farther away for a wider recognition range, and the focus value can be processed faster if it is shifted from near to far.
- (1b)
- Detect AR markers within a single frame of image output from the camera.
- (1c)
- If no AR marker is found in the image, the focus value F is reduced by 15 to focus on a more distant point.
- (1d)
- Repeat steps (1b) – (1c) until AR markers are detected.
- (1e)
- If an AR marker is detected for the first time, get the initial position and posture of the AR marker to be given as initial values for the next Iteration process.
According to the above algorithm, the scanning takes a maximum of 11 frames of images before the AR marker is detected. Since the frame rate of the camera used is 30 fps, the maximum scanning time is theoretically about 0.33 seconds. In reality, however, even if the AR marker was at the farthest point within the recognition range, the scanning time was only about 0.3 seconds. This is because the AR marker could be detected even when the focus position was in front of the AR marker, and detection was possible from the 10th frame of the image.
In the Iteration process, the camera parameters are optimized to determine the final marker position and posture with enhanced accuracy; the Iteration process follows the steps below.
- (2a)
- Receive the initial recognition values and of the AR marker from the Scanning process.
- (2b)
- Update the camera parameters based on the recognized depth distance z of the AR marker.
- (2c)
- Get the next recognition values and with the updated camera parameters.
- (2d)
- Calculate the absolute error value between and , and between and . If the error values are larger than the thresholds and , repeat steps (2b) – (2c).
- (2e)
- If the absolute error values calculated in step (2d) are smaller than the thresholds and , the latest and are output as the final recognition values and .
3.2. Dynamic Camera Parameter Controller
Figure 7 shows a block diagram of the system for the camera parameter optimization update process shown in the Iteration Process in Figure 6. The values and are the final output of the marker’s position and posture. The Iterator judges whether the marker’s recognized position and posture converge to an accuracy within set thresholds, as in Equations 6 and 7.
The Iterator also calculates the marker’s depth distance z for updating the camera parameters, which takes into account the magnification of the image due to zooming. When the image is magnified by a factor of n by zooming, the "apparent” depth distance becomes of the real value z. Therefore, the zoom value W is input to LEAG-Library to recognize the real marker position with compensation of the apparent depth distance as shown in Equation 8.
4. Experimental Evaluation
4.1. Experimental Setup
Figure 8 shows the experimental setup. Figure 8(a) shows the definition of coordinates of the AR marker: the depth distance z, and the rotation angle , which are treated in the experiments in Section 4.3-Section 4.5. Figure 8(b) shows a scene of actual experiment setup. The actual distances and angles were measured using a measuring tape and protractor with the AR marker fixed to a rotating stand.
4.2. Experimental Conditions
In all experiments, measurements were taken five times for each condition, and the average value was recorded as the value for that condition. Note that the values were recorded only when the marker’s ID was correctly recognized five times in a row.
The accuracy of the marker’s translational position recognition is evaluated by the error rate relative to the true value. When the measured value is M and the true value is T, the error rate is defined by Equation 9. On the other hand, the accuracy of posture recognition is evaluated by the error between M and T.
4.3. Recognition Performance using Fixed Camera Parameters
Prior to the evaluation of the proposed method, the recognition range and recognition accuracy were examined with camera parameters fixed at specific values. The zoom value W and focus value F were set to three patterns: (1); (2); (3). The distortion coefficient matrix and internal parameter matrix were calibrated with the camera’s auto-focus function turned on. The micro AR marker was placed at a rotation angle to the camera for the most stable recognition.
Figure 9 shows the recognition range and error rate on the marker’s depth distance z for each of the fixed parameter conditions. Under the conditions of this experiment, the recognition range was very narrow with only 0.2 m at maximum in the depth direction. Recognition accuracy also tends to significantly deteriorate especially at short distances, which cannot be acceptable for precise navigation and object handling. This is largely due to the fact that a fixed focus value is used, which results in a wide range of out-of-focus areas. Therefore, it is essential for expanding the recognition range to properly control the camera focus and calibration data according to the marker’s depth distance.
4.4. Recognition Performance using Dynamic Focus Control
Next, we investigate the performance improvement of position recognition using the dynamic focus control given by Equation 3. In this experiment, the zoom values W were set to five constant values: 100, 200, 300, 400, and 500. The focus value F was sequentially computed according to the recognized values of depth distance z. The camera calibration data and are determined based on the calculated focus values. During the experiment, the micro AR marker was placed at a rotation angle to the camera for the most stable recognition.
Figure 10 shows the recognition range and error rate on the marker’s depth distance z obtained in this experiment. The recognizable range of markers varies depending on the zoom value W. Naturally, the larger the zoom value, the farther away the marker can be recognized. At the maximum zoom value (W = 500), the AR markers can be recognized from the minimum distance =0.05 m to the maximum distance z=1.05 m in the depth direction. Compared to Figure 9, the recognition range is expanded by adjusting the camera focus. However, when the zoom value W is large, the recognition error rate worsens at close distances. This is thought to be because the marker area in the image is considerably larger due to zooming at close distances, making it more susceptible to lens distortion. On the other hand, the recognition accuracy at close distances is good with small values of W. According to the experimental result, proper control of the zoom value W as well as the focus value F is necessary to ensure high recognition accuracy over the entire range.
4.5. Recognition Performance using Dynamic Control of Both Focus and Zoom (Proposed Method)
After understanding the results of the two experiments described above, we investigate and evaluate the recognition performance of the micro AR marker using dynamic control of both focus and zoom values, i.e., applying the proposed camera control method.
Table 3 shows the initial values of the camera parameters and the threshold values and used to determine convergence of iterative calculations. The initial zoom value was set to the maximum value (W = 500) that has the widest recognition range, as shown in Figure 10. The initial focus value was set at the closest distance from the camera (F = 150) so that the scanning process was performed from near to far points from the camera. The threshold values and for convergence judgment was set as an absolute error. In addition, the initial values of the camera calibration data and were measured with the autofocus function turned on, as described in Section 2.1.
4.5.1. Performance on Translational Position Recognition
First, the precision and accuracy of the marker’s translational position recognition are examined. The evaluation experiment was conducted by measuring the marker’s depth distance z under three conditions of the marker’s rotation angle: . In order to focus on the performance of the position measurement in this experiment, the convergence judgment of the marker’s posture was not performed, but only the convergence judgment of the marker’s position was performed.
Figure 11 shows the recognition error rate of the marker’s depth distance z. The error rate is within ±1% for the entire range where the AR markers can be recognized. Compared to the recognition accuracy only with the focus value control (see Figure 10), the proposed method achieved significant performance improvement. The range of recognition distance becomes smaller at , but the recognition accuracy has not deteriorated as long as the marker position can be recognized.
The behavior of iterative calculations during marker position recognition was also investigated. Figure 12 shows the iteration time taken for the convergence of the position recognition in this experiment. According to the result, the iteration time is within 0.7 seconds, indicating that the AR marker at an unknown location can be recognized quickly with high accuracy. Also, as the depth distance z increases, the iteration time tends to increase. This is because the threshold value for the position convergence is set to a constant value of 1.0 mm independent of the depth distance, the convergence accuracy becomes relatively high at large distances.
Related to the iteration time, Figure 13 shows the convergence of the recognized values of depth distance z by iterative calculations for five experimental trials. In this experiment, the true values of the marker’s depth distance were set to (a) m, (b) m, and (c) m with the rotation angle of . According to the result, although the number of convergence calculations tends to increase at large depth distances, recognition with the specified absolute accuracy() is achieved over the entire range of recognizable depth distance. Note that the first detected values of z were larger than the true value in all cases. This is because the focus position is not perfectly adjusted to the marker immediately after scanning, and the AR marker is recognized as smaller than its actual size in the blurred image.
4.5.2. Performance of the Marker’s Posture Recognition
Next, the precision and accuracy of the marker’s posture recognition are examined. The evaluation experiment was conducted by measuring the marker’s rotation angle under three conditions of the depth distance: . In order to focus on the performance of the posture measurement in this experiment, the convergence judgment of the marker’s position was not performed, but only the convergence judgment of the marker’s posture was performed.
As the experimental result, Figure 14 shows the recognition error of the marker’s rotation angle at each condition. When the marker angle is in the range of to , accurate recognition within an error of is achieved. On the other hand, in the range where the marker angle is smaller than , the recognition error is as large as 2.5 degrees at maximum. This is due to the characteristic of AR markers that deteriorates recognition accuracy at angles near the frontal direction of the camera.
In addition, Figure 15 shows the iteration time taken for the convergence of the posture recognition in this experiment. According to the result, the iteration time is within 0.6 seconds, realizing fast convergence of recognized value of within the specified iteration accuracy () over the entire recognizable angular range. It can also be seen that the larger the depth distance z, the longer it takes to converge the recognized value of the marker angle .
5. Discussion
Using the proposed dynamic camera control system, the 10 mm square micro AR marker can be recognized with accuracy of better than for depth distance and for rotation angle. The depth recognition range is 1.0 m, which is five times greater than the range with fixed camera parameters. In the most recent relevant study, Inoue et al.[41] proposed an AR marker pose estimation system using a 64 mm × 64 mm AR marker, in which the recognition accuracy was 4% in the depth direction and in the rotation angle. The depth recognition range was 0.1 ∼ 0.7 m. Compared to the state-of-the-art research as above, the proposed method in this study achieves significantly better performance in terms of marker size, recognition accuracy, and recognition range.
Regarding the iteration time, the proposed system requires a maximum of 0.6 to 0.7 seconds for convergence of recognition values for both position and posture. For application to object tracking in a robotic manipulation system, the iteration time can be significantly reduced except for the initial detection. This is because the previous marker recognition value and the kinematic information of the robot arm can be utilized to efficiently determine the initial values of the camera parameters at the next recognition.
On the other hand, the recognition performance of the proposed system depends on the hardware specifications. A camera with a higher zoom magnification capabilities, including an optical zoom, can further expand the recognition range. Iteration time also depends on the computational resources. Considering low-cost implementation, this study uses a normal laptop PC without a GPU. However, the real-time performance of the system can be further improved by using an industrial camera with a high frame rate and a processor with GPU acceleration.
6. Conclusion
In this paper, a dynamic camera parameter control method was proposed for accurate and precise recognition of micro AR markers. In this system, the marker’s detected position and posture are converged to specified accuracy through iterative calculations with updating the camera parameters. The evaluation experiments have shown significant superiority of the proposed system in recognition performance over existing methods.
For future works, we will implement an object handling system on a robot arm using micro AR markers with the proposed recognition method, and evaluate its performance.
Author Contributions
Conceptualization, D.H.; methodology, D.H. and R.M.; software, R.M.; validation, D.H. and R.M.; formal analysis, D.H. and R.M.; investigation, R.M.; resources, D.H.; writing—original draft preparation, D.H. and R.M.; writing—review and editing, D.H.; visualization, R.M.; supervision, D.H.; project administration, D.H. All authors have read and agreed to the published version of the manuscript.
Acknowledgments
The authors would like to thank LEAG Solutions Corp. and Dai Nippon Printing Co., Ltd. for their cooperation in prototyping of the micro AR Marker.
Conflicts of Interest
The authors declare no conflict of interest.
References
- Miyahara, R.; Haraguchi, D. Object Handling System using Ultra-Small and High-Precision AR Markers(KRIS2023). 2023, p. 140.
- Brachmann, E.; Rother, C. Visual camera re-localization from RGB and RGB-D images using DSAC. IEEE transactions on pattern analysis and machine intelligence 2021, 44, 5847–5865. [Google Scholar] [CrossRef] [PubMed]
- Mathis, A.; Mamidanna, P.; Cury, K.M.; Abe, T.; Murthy, V.N.; Mathis, M.W.; Bethge, M. DeepLabCut: markerless pose estimation of user-defined body parts with deep learning. Nature neuroscience 2018, 21, 1281–1289. [Google Scholar] [CrossRef] [PubMed]
- Madec, S.; Jin, X.; Lu, H.; Solan, B.D.; Liu, S.; Duyme, F.; Heritier, E.; Baret, F. Ear density estimation from high resolution RGB imagery using deep learning technique. Agricultural and forest meteorology 2019, 264, 225–234. [Google Scholar] [CrossRef]
- Panteleris, P.; Oikonomidis, I.; Argyros, A. Using a Single RGB Frame for Real Time 3D Hand Pose Estimation in the Wild. 2018, pp. 436–445. [CrossRef]
- Ichnowski, J.; Avigal, Y.; Kerr, J.; Goldberg, K. Dex-NeRF: Using a Neural Radiance Field to Grasp Transparent Objects. PMLR 2022, 164, 526–536. [Google Scholar]
- Kan, T.W.; Teng, C.H.; Chen, M.Y. , B., Ed.; Springer New York: New York, NY, 2011; pp. 339–354. https://doi.org/10.1007/978-1-4614-0064-6_16.Applications. In Handbook of Augmented Reality; Furht, B., Ed.; Springer New York: New York, NY, 2011; Springer New York: New York, NY, 2011; pp. 339–354. [Google Scholar] [CrossRef]
- Rekimoto, J. Matrix: a realtime object identification and registration method for augmented reality. In Proceedings of the Proceedings. 3rd Asia Pacific Computer Human Interaction (Cat. No.98EX110); 1998; pp. 63–68. [Google Scholar] [CrossRef]
- Ruan, K.; Jeong, H. An Augmented Reality System Using Qr Code as Marker in Android Smartphone. In Proceedings of the 2012 Spring Congress on Engineering and Technology; 2012; pp. 1–3. [Google Scholar] [CrossRef]
- Ikeda, K.; Tsukada, K. CapacitiveMarker: novel interaction method using visual marker integrated with conductive pattern. 2015, pp. 225–226.
- Uranishi, Y.; Imura, M.; Kuroda, T. The Rainbow Marker: An AR marker with planar light probe based on structural color pattern matching. IEEE, 2016, pp. 303–304.
- ARToolKit SDKs download website. http://www.hitl.washington.edu/artoolkit/download/.
- Zhao, T.; Jiang, H. Landing system for AR. Drone 2.0 using onboard camera and ROS. IEEE, 2016, pp. 1098–1102. [CrossRef]
- Qi, J.; Guan, X.; Lu, X. An Autonomous Pose Estimation Method of MAV Based on Monocular Camera and Visual Markers. 2018, pp. 252–257. [CrossRef]
- Aoki, R.; Tanaka, H.; Izumi, K.; Tsujimura, T. Self-Position Estimation based on Road Sign using Augmented Reality Technology. 2018, pp. 39–42. [CrossRef]
- eddine Ababsa, F.; Mallem, M. Robust camera pose estimation using 2d fiducials tracking for real-time augmented reality systems. 2004, pp. 431–435.
- Kato, J.; Deguchi, G.; Inoue, J.; Iwase, M. Improvement of Performance of Navigation System for Supporting Independence Rehabilitation of Wheelchair - Bed Transfer. Journal of Physics: Conference Series 2020, 1487, 012041. [Google Scholar] [CrossRef]
- Nakanishi, H.; Hashimoto, H. AR-Marker/IMU Hybrid Navigation System for Tether-Powered UAV. Journal of Robotics and Mechatronics 2018, 30, 76–85. [Google Scholar] [CrossRef]
- Tsujimura, T.; Aoki, R.; Izumi, K. Geometrical optics analysis of projected-marker augmented reality system for robot navigation. IEEE, 2018, pp. 1–6.
- Yu, X.; Yang, G.; Jones, S.; Saniie, J. AR Marker Aided Obstacle Localization System for Assisting Visually Impaired. 2018, pp. 271–276. [CrossRef]
- Romli, R.; Razali, A.F.; Ghazali, N.H.; Hanin, N.A.; Ibrahim, S.Z. Mobile Augmented Reality (AR) Marker-based for Indoor Library Navigation. IOP Conference Series: Materials Science and Engineering 2020, 767, 012062. [Google Scholar] [CrossRef]
- Choi, C.; Christensen, H.I. Real-time 3D model-based tracking using edge and keypoint features for robotic manipulation. 2010, pp. 4048–4055. [CrossRef]
- Pai, Y.S.; Yap, H.J.; Singh, R. Augmented reality–based programming, planning and simulation of a robotic work cell. Proceedings of the Institution of Mechanical Engineers, Part B: Journal of Engineering Manufacture 2014, 229, 1029–1045. [Google Scholar] [CrossRef]
- Raessa, M.; Chen, J.C.Y.; Wan, W.; Harada, K. Human-in-the-Loop Robotic Manipulation Planning for Collaborative Assembly. IEEE Transactions on Automation Science and Engineering 2020, 17, 1800–1813. [Google Scholar] [CrossRef]
- Zhang, L.; Ye, M.; Chan, P.L.; Yang, G.Z. Real-time surgical tool tracking and pose estimation using a hybrid cylindrical marker. International journal of computer assisted radiology and surgery 2017, 12, 921–930. [Google Scholar] [CrossRef] [PubMed]
- Costanza, E.; Huang, J. Designable Visual Markers. Association for Computing Machinery, 2009, pp. 1879–1888. [CrossRef]
- Douxchamps, D.; Chihara, K. High-accuracy and robust localization of large control markers for geometric camera calibration. IEEE Transactions on Pattern Analysis and Machine Intelligence 2008, 31, 376–383. [Google Scholar] [CrossRef] [PubMed]
- Yoon, J.H.; Park, J.S.; Kim, C. Increasing Camera Pose Estimation Accuracy Using Multiple Markers. Springer Berlin Heidelberg, 2006, pp. 239–248.
- Yu, R.; Yang, T.; Zheng, J.; Zhang, X. Real-Time Camera Pose Estimation Based on Multiple Planar Markers. 2009, pp. 640–645. [CrossRef]
- Hayakawa, S.; Al-Falouji, G.; Schickhuber, G.; Mandl, R.; Yoshida, T.; Hangai, S. A Method of Toothbrush Position Measurement using AR Markers. IEEE, 2020, pp. 91–93.
- Uematsu, Y.; Saito, H. Improvement of Accuracy for 2D Marker-Based Tracking Using Particle Filter. 2007, pp. 183–189. [CrossRef]
- Rubio, M.; Quintana, A.; Pérez-Rosés, H.; Quirós, R.; Camahort, E. Jittering reduction in marker-based augmented reality systems. Springer, 2006, pp. 510–517. [CrossRef]
- Bergamasco, F.; Albarelli, A.; Rodolà, E.; Torsello, A. RUNE-Tag: A high accuracy fiducial marker with strong occlusion resilience. 2011, pp. 113–120. [CrossRef]
- Bergamasco, F.; Albarelli, A.; Torsello, A. Pi-tag: a fast image-space marker design based on projective invariants. Machine vision and applications 2013, 24, 1295–1310. [Google Scholar] [CrossRef]
- Tanaka, H.; Sumi, Y.; Matsumoto, Y. A novel AR marker for high-accuracy stable image overlay. IEEE, 2012, pp. 217–218. [CrossRef]
- Tanaka, H.; Sumi, Y.; Matsumoto, Y. A high-accuracy visual marker based on a microlens array. IEEE, 2012, pp. 4192–4197. [CrossRef]
- Tanaka, H.; Sumi, Y.; Matsumoto, Y. Avisual marker for precise pose estimation based on lenticular lenses. 2012, pp. 5222–5227. [CrossRef]
- Tanaka, H.; Ogata, K.; Matsumoto, Y. Improving the accuracy of visual markers by four dots and image interpolation. 2016, pp. 178–183. [CrossRef]
- Toyoura, M.; Aruga, H.; Turk, M.; Mao, X. Mono-spectrum marker: an AR marker robust to image blur and defocus. The Visual Computer 2014, 30, 1035–1044. [Google Scholar] [CrossRef]
- OpenCV-Python Tutorials. http://labs.eecs.tottori-u.ac.jp/sd/Member/oyamada/OpenCV/html/py_tutorials/py_calib3d/py_calibration/py_calibration.html#.
- Inoue, M.; Ogata, M.; Izumi, K.; Tsujimura, T. Posture Estimation for Robot Navigation System based on AR Markers. 2021, pp. 628–633.
Figure 1.
The 10 mm square micro AR marker prototyped in this study.
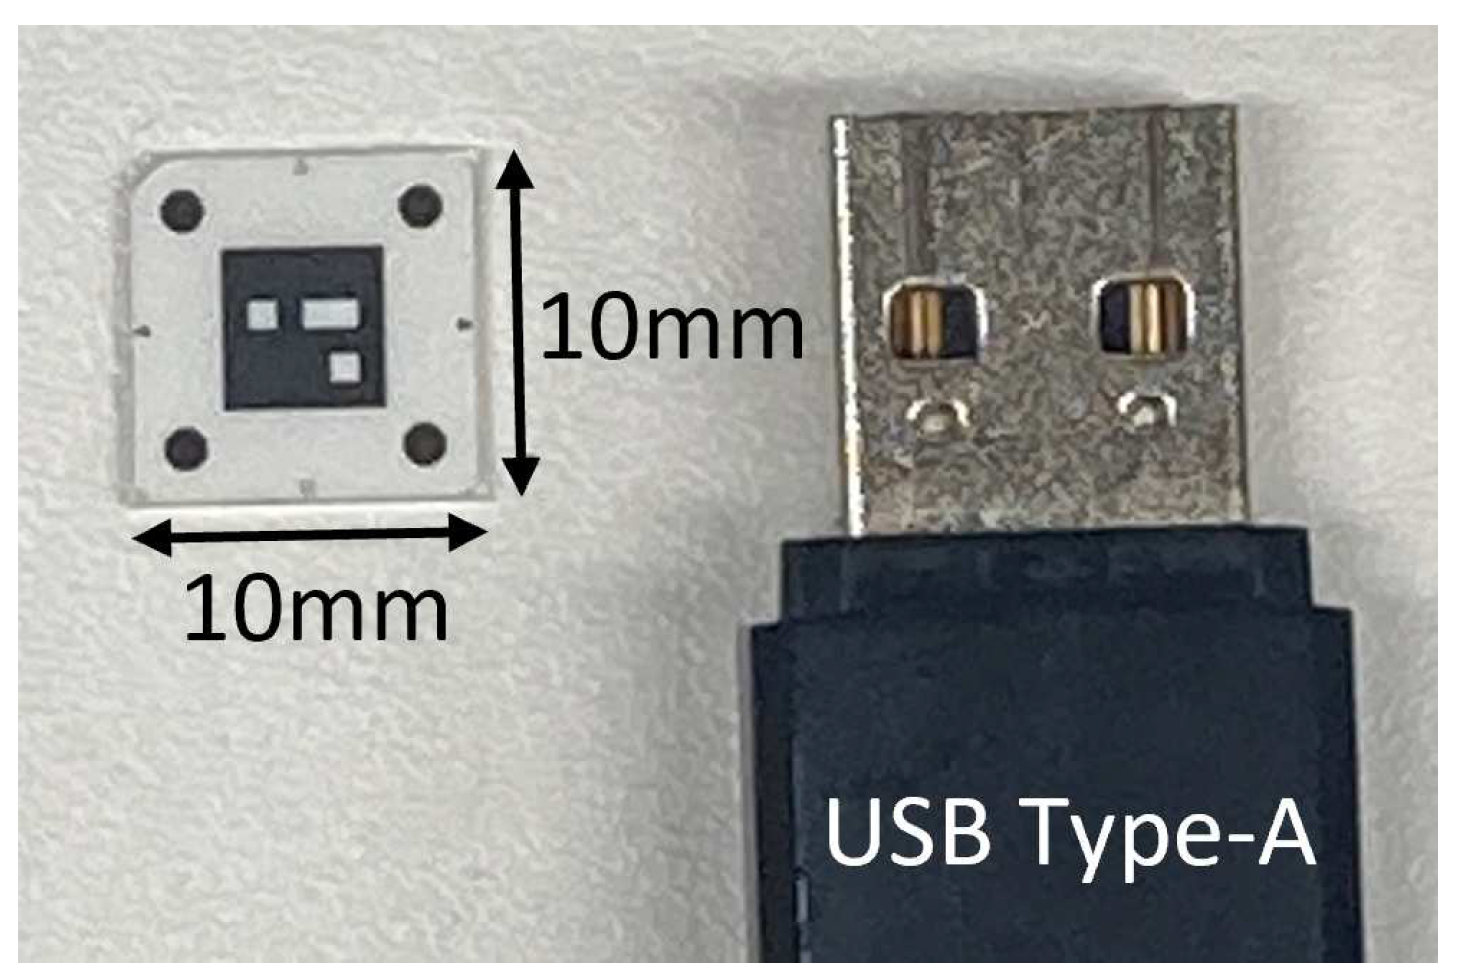
Figure 2.
Definition of the marker position and posture with respect to the camera.
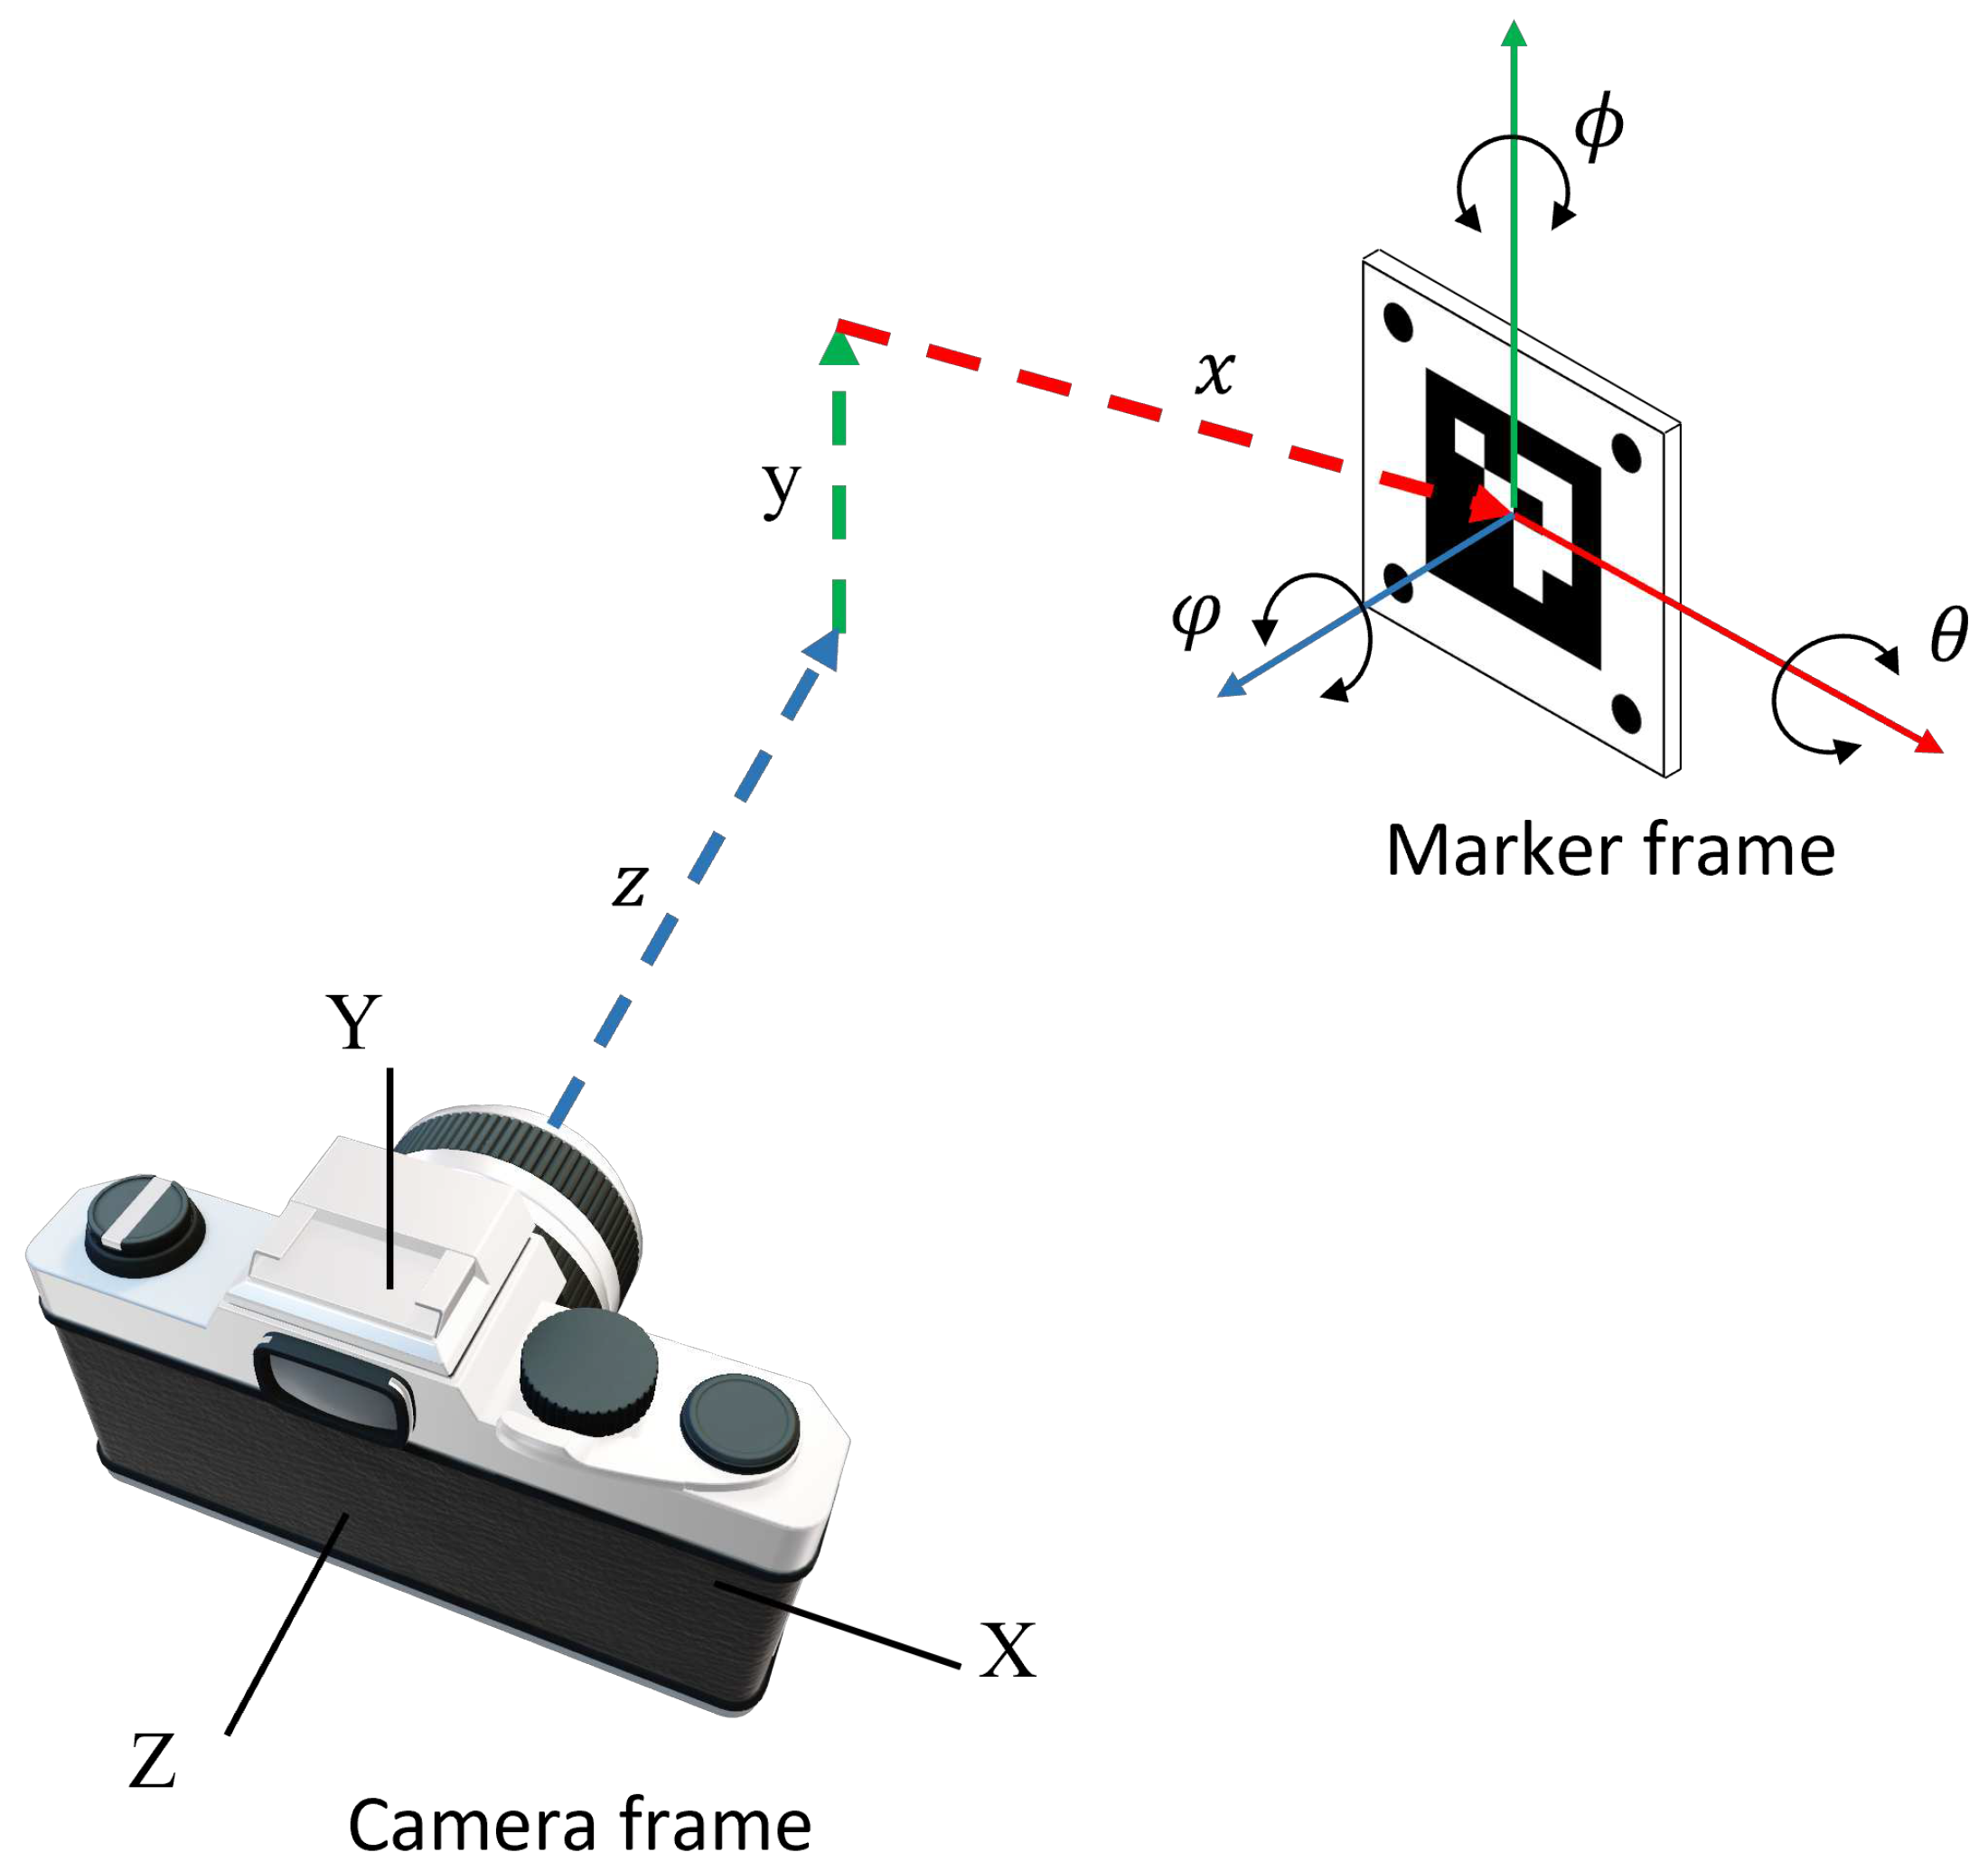
Figure 3.
Logicool BRIO C1000eR®.
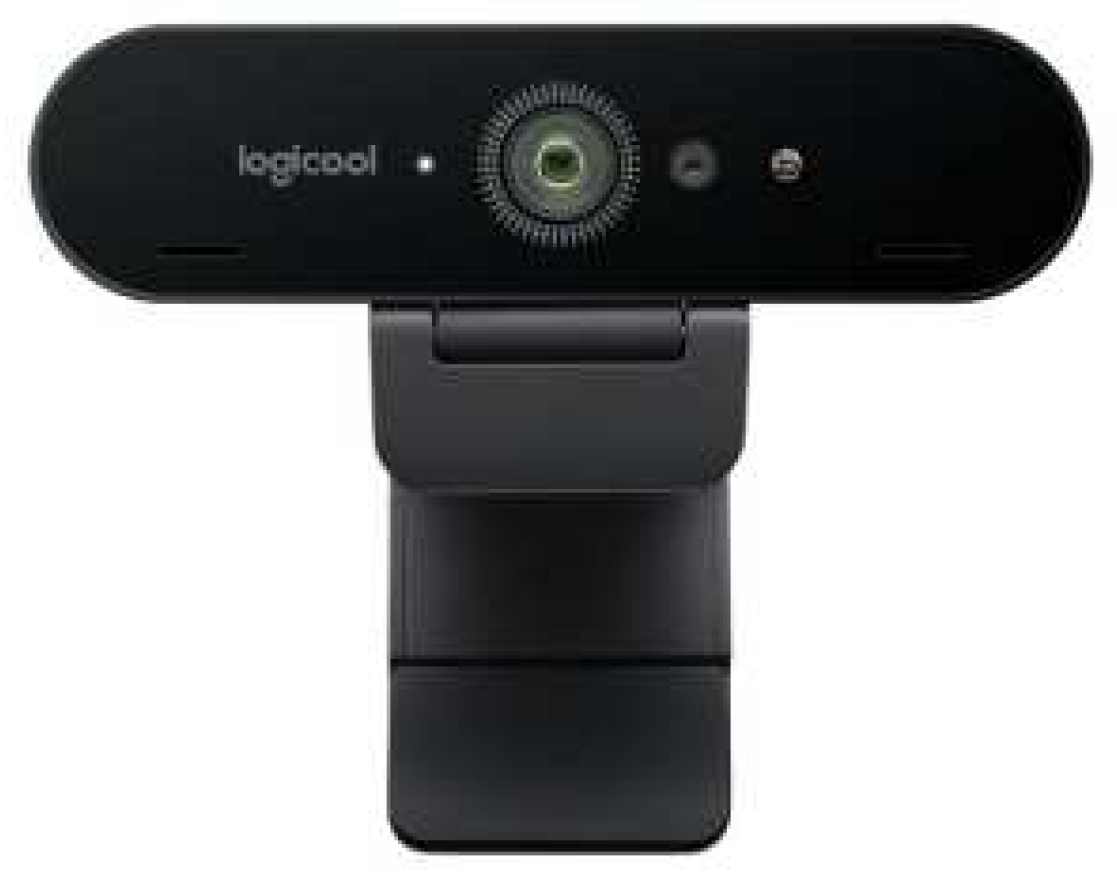
Figure 4.
System architecture.
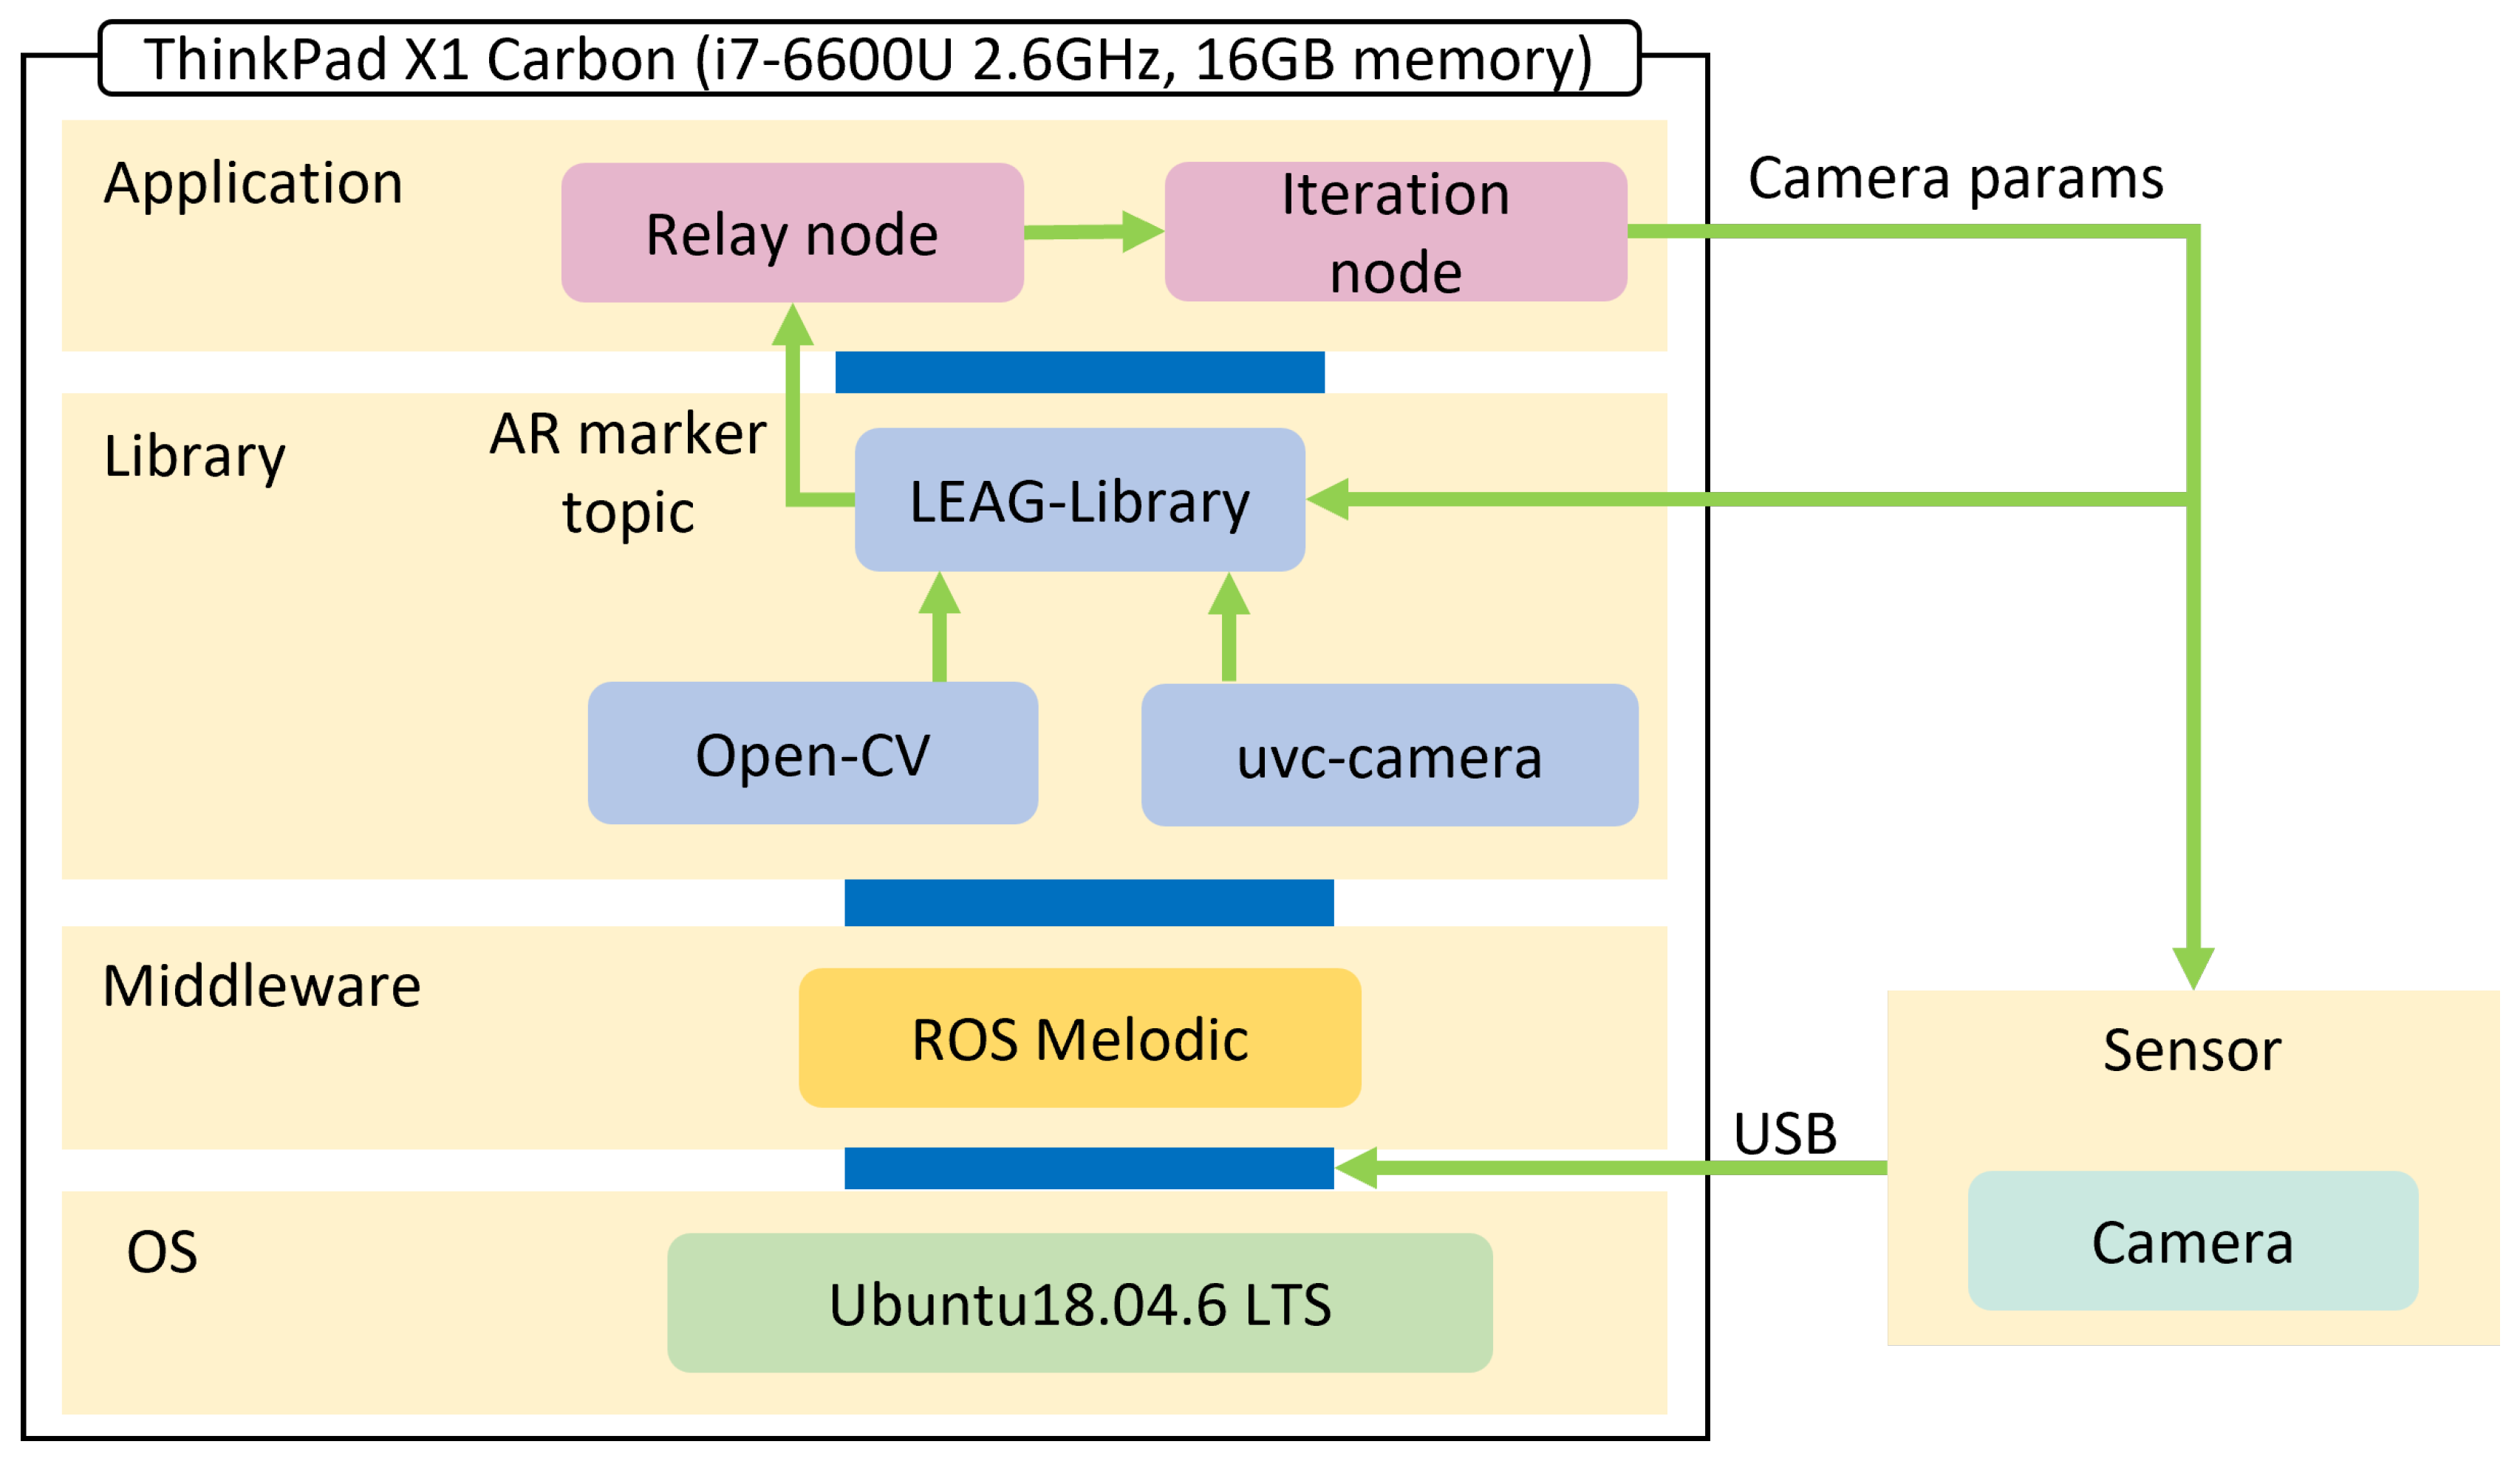
Figure 5.
Correlation diagram of ROS nodes.
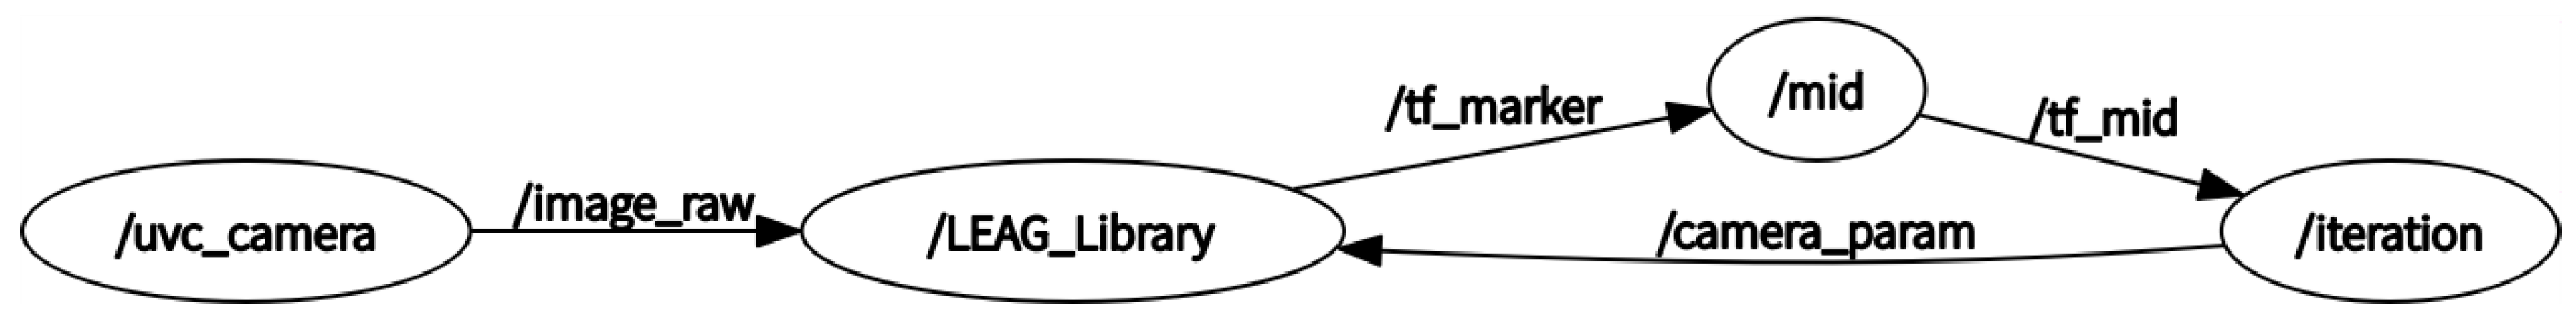
Figure 6.
Flowchart of proposed method.
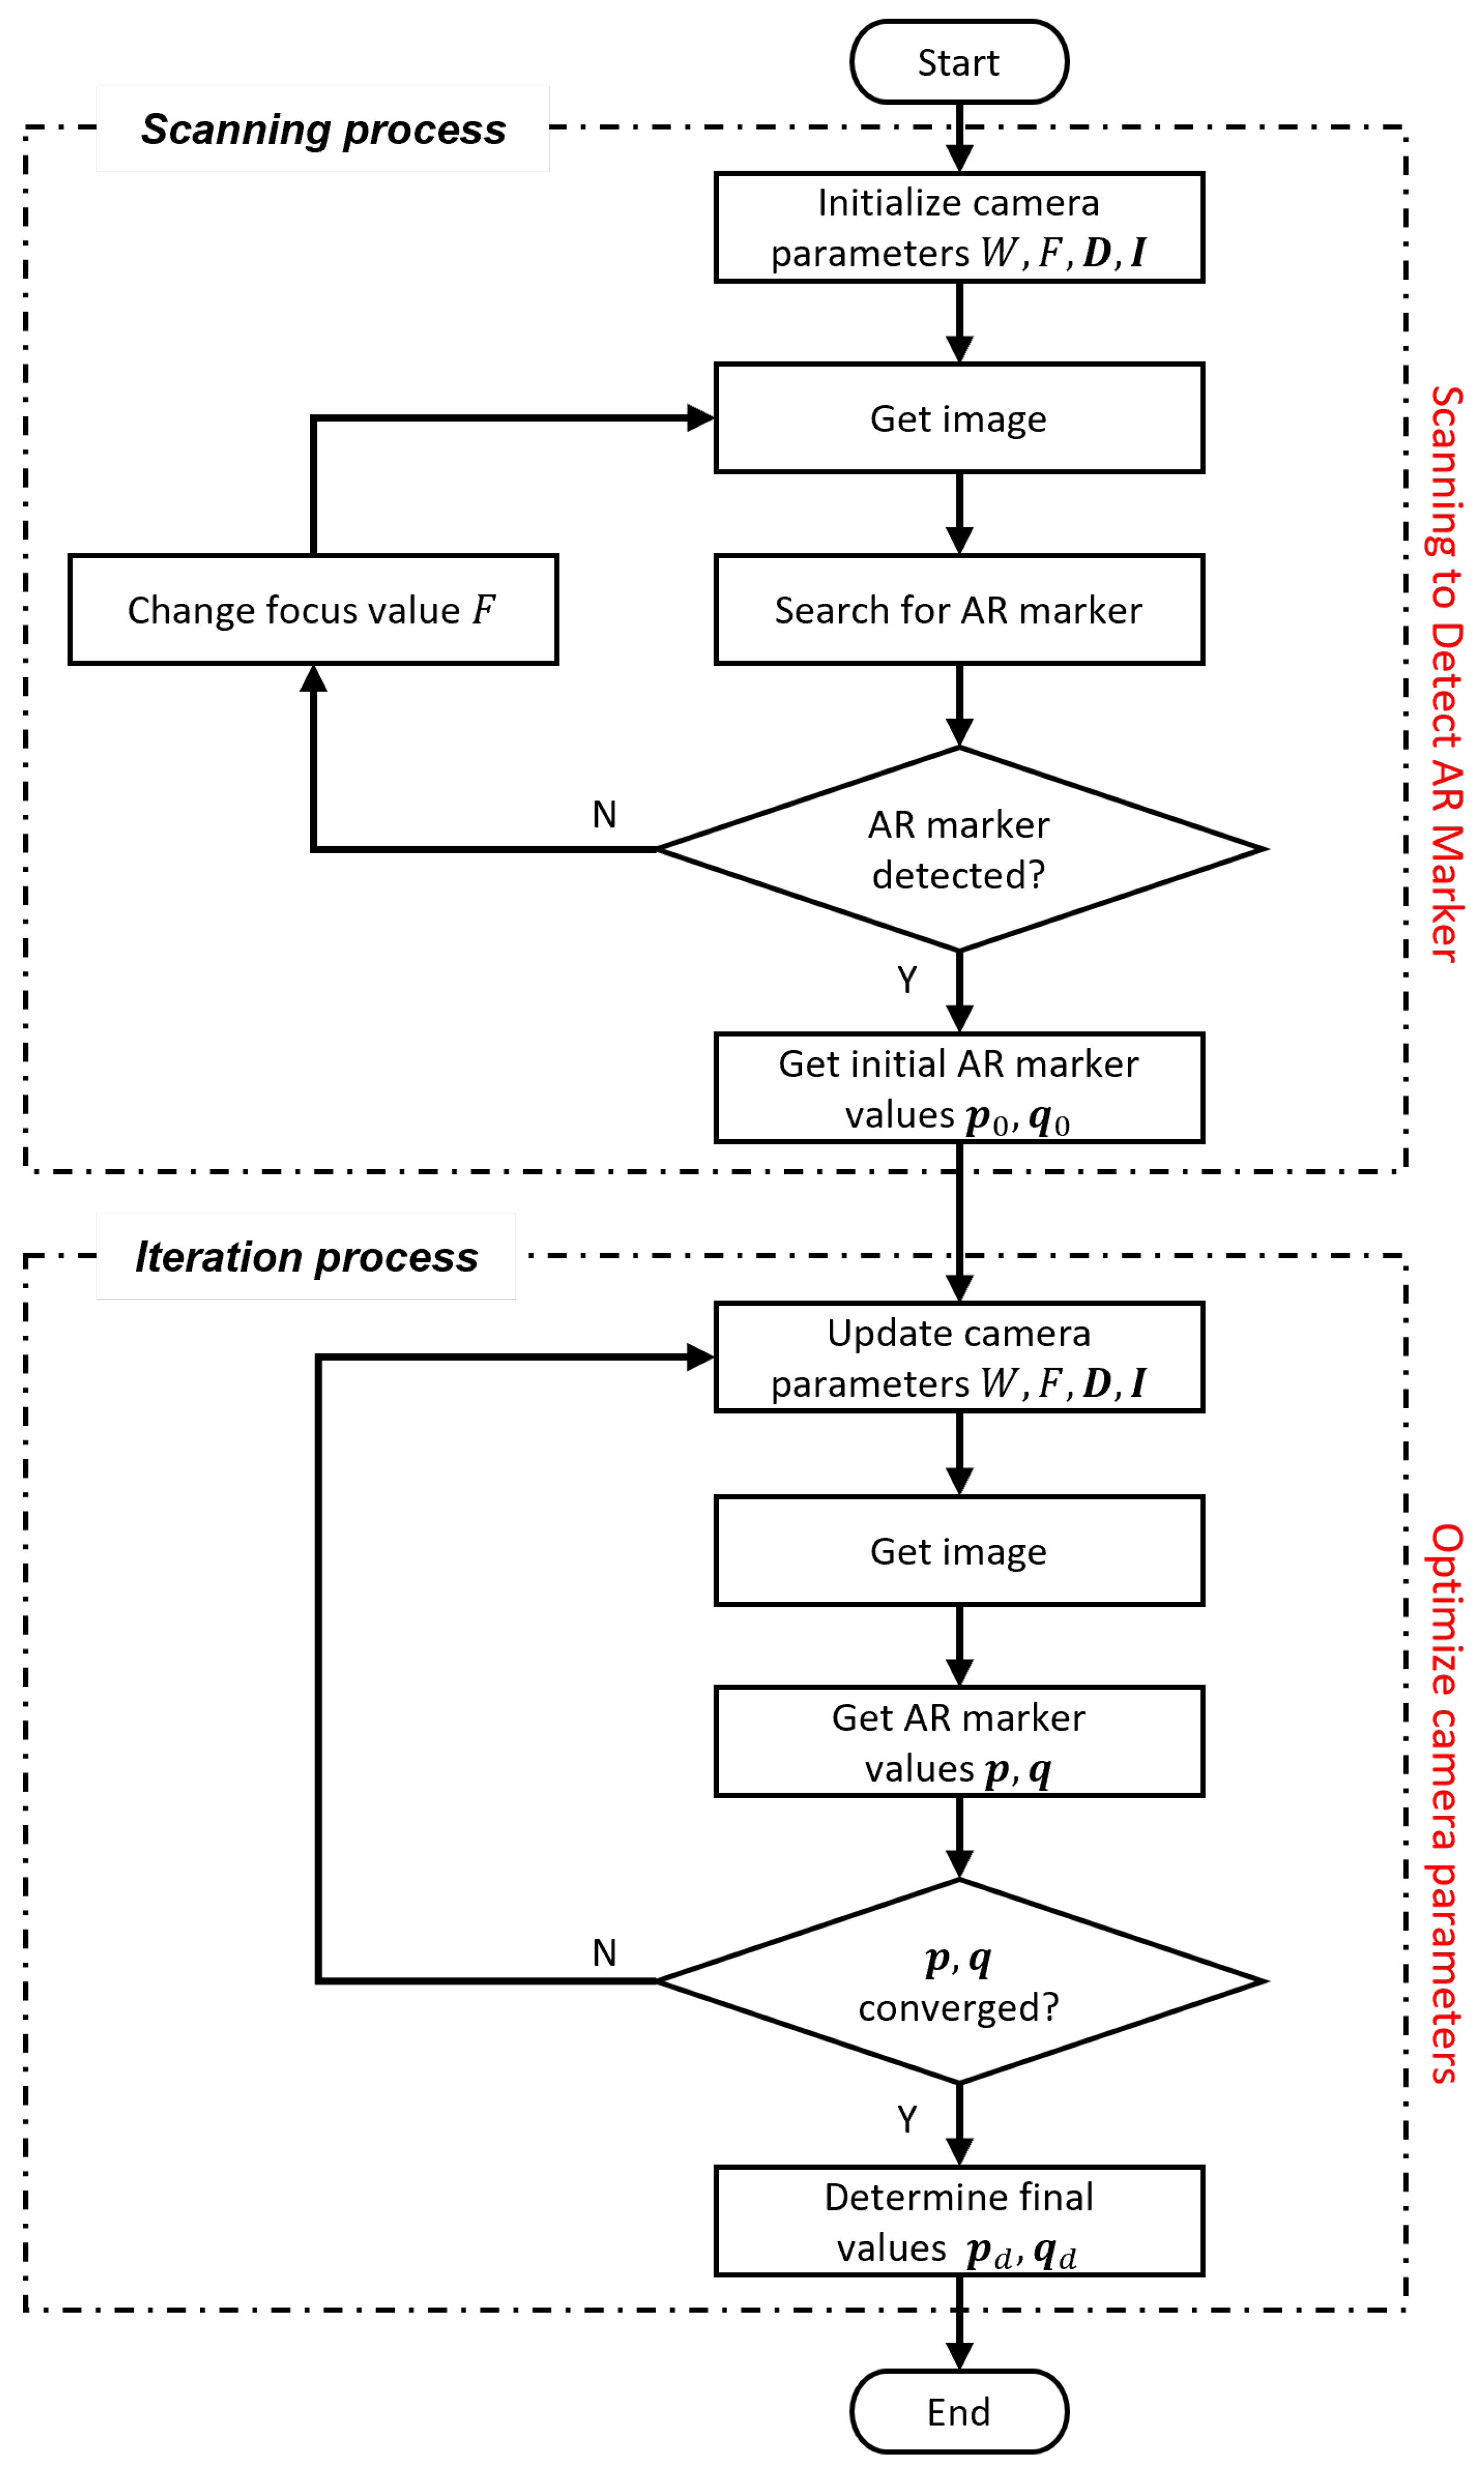
Figure 7.
Block diagram of camera parameter optimization.
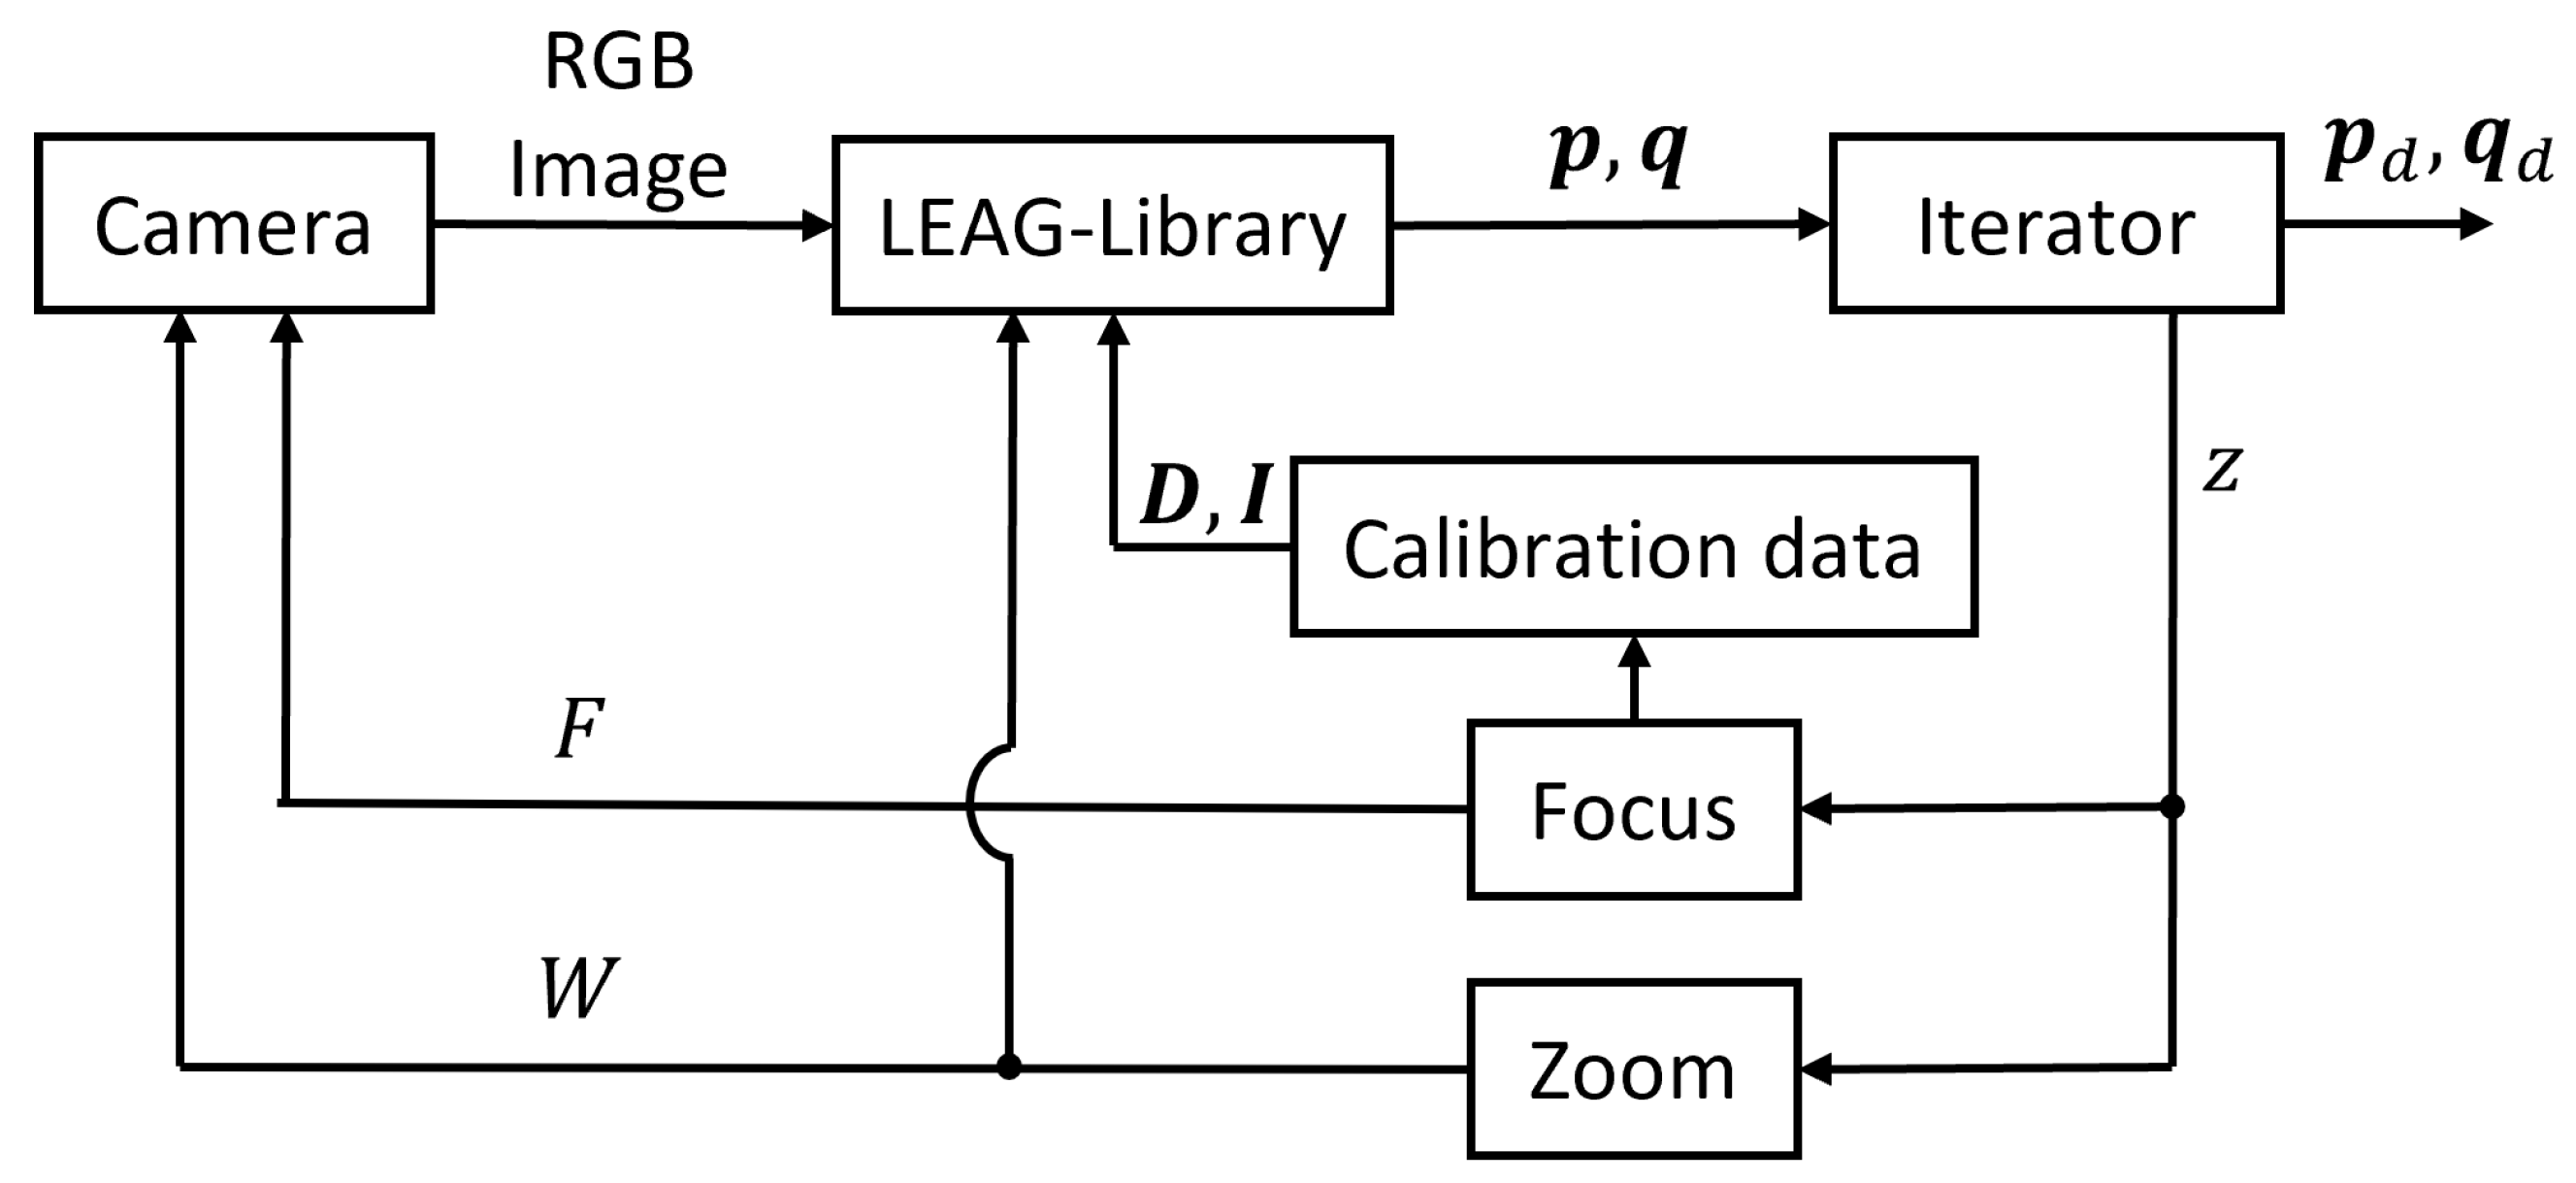
Figure 8.
Experimental setup: (a) Definition of AR marker position and angles. (b) Scene of the experiment.
Figure 8.
Experimental setup: (a) Definition of AR marker position and angles. (b) Scene of the experiment.
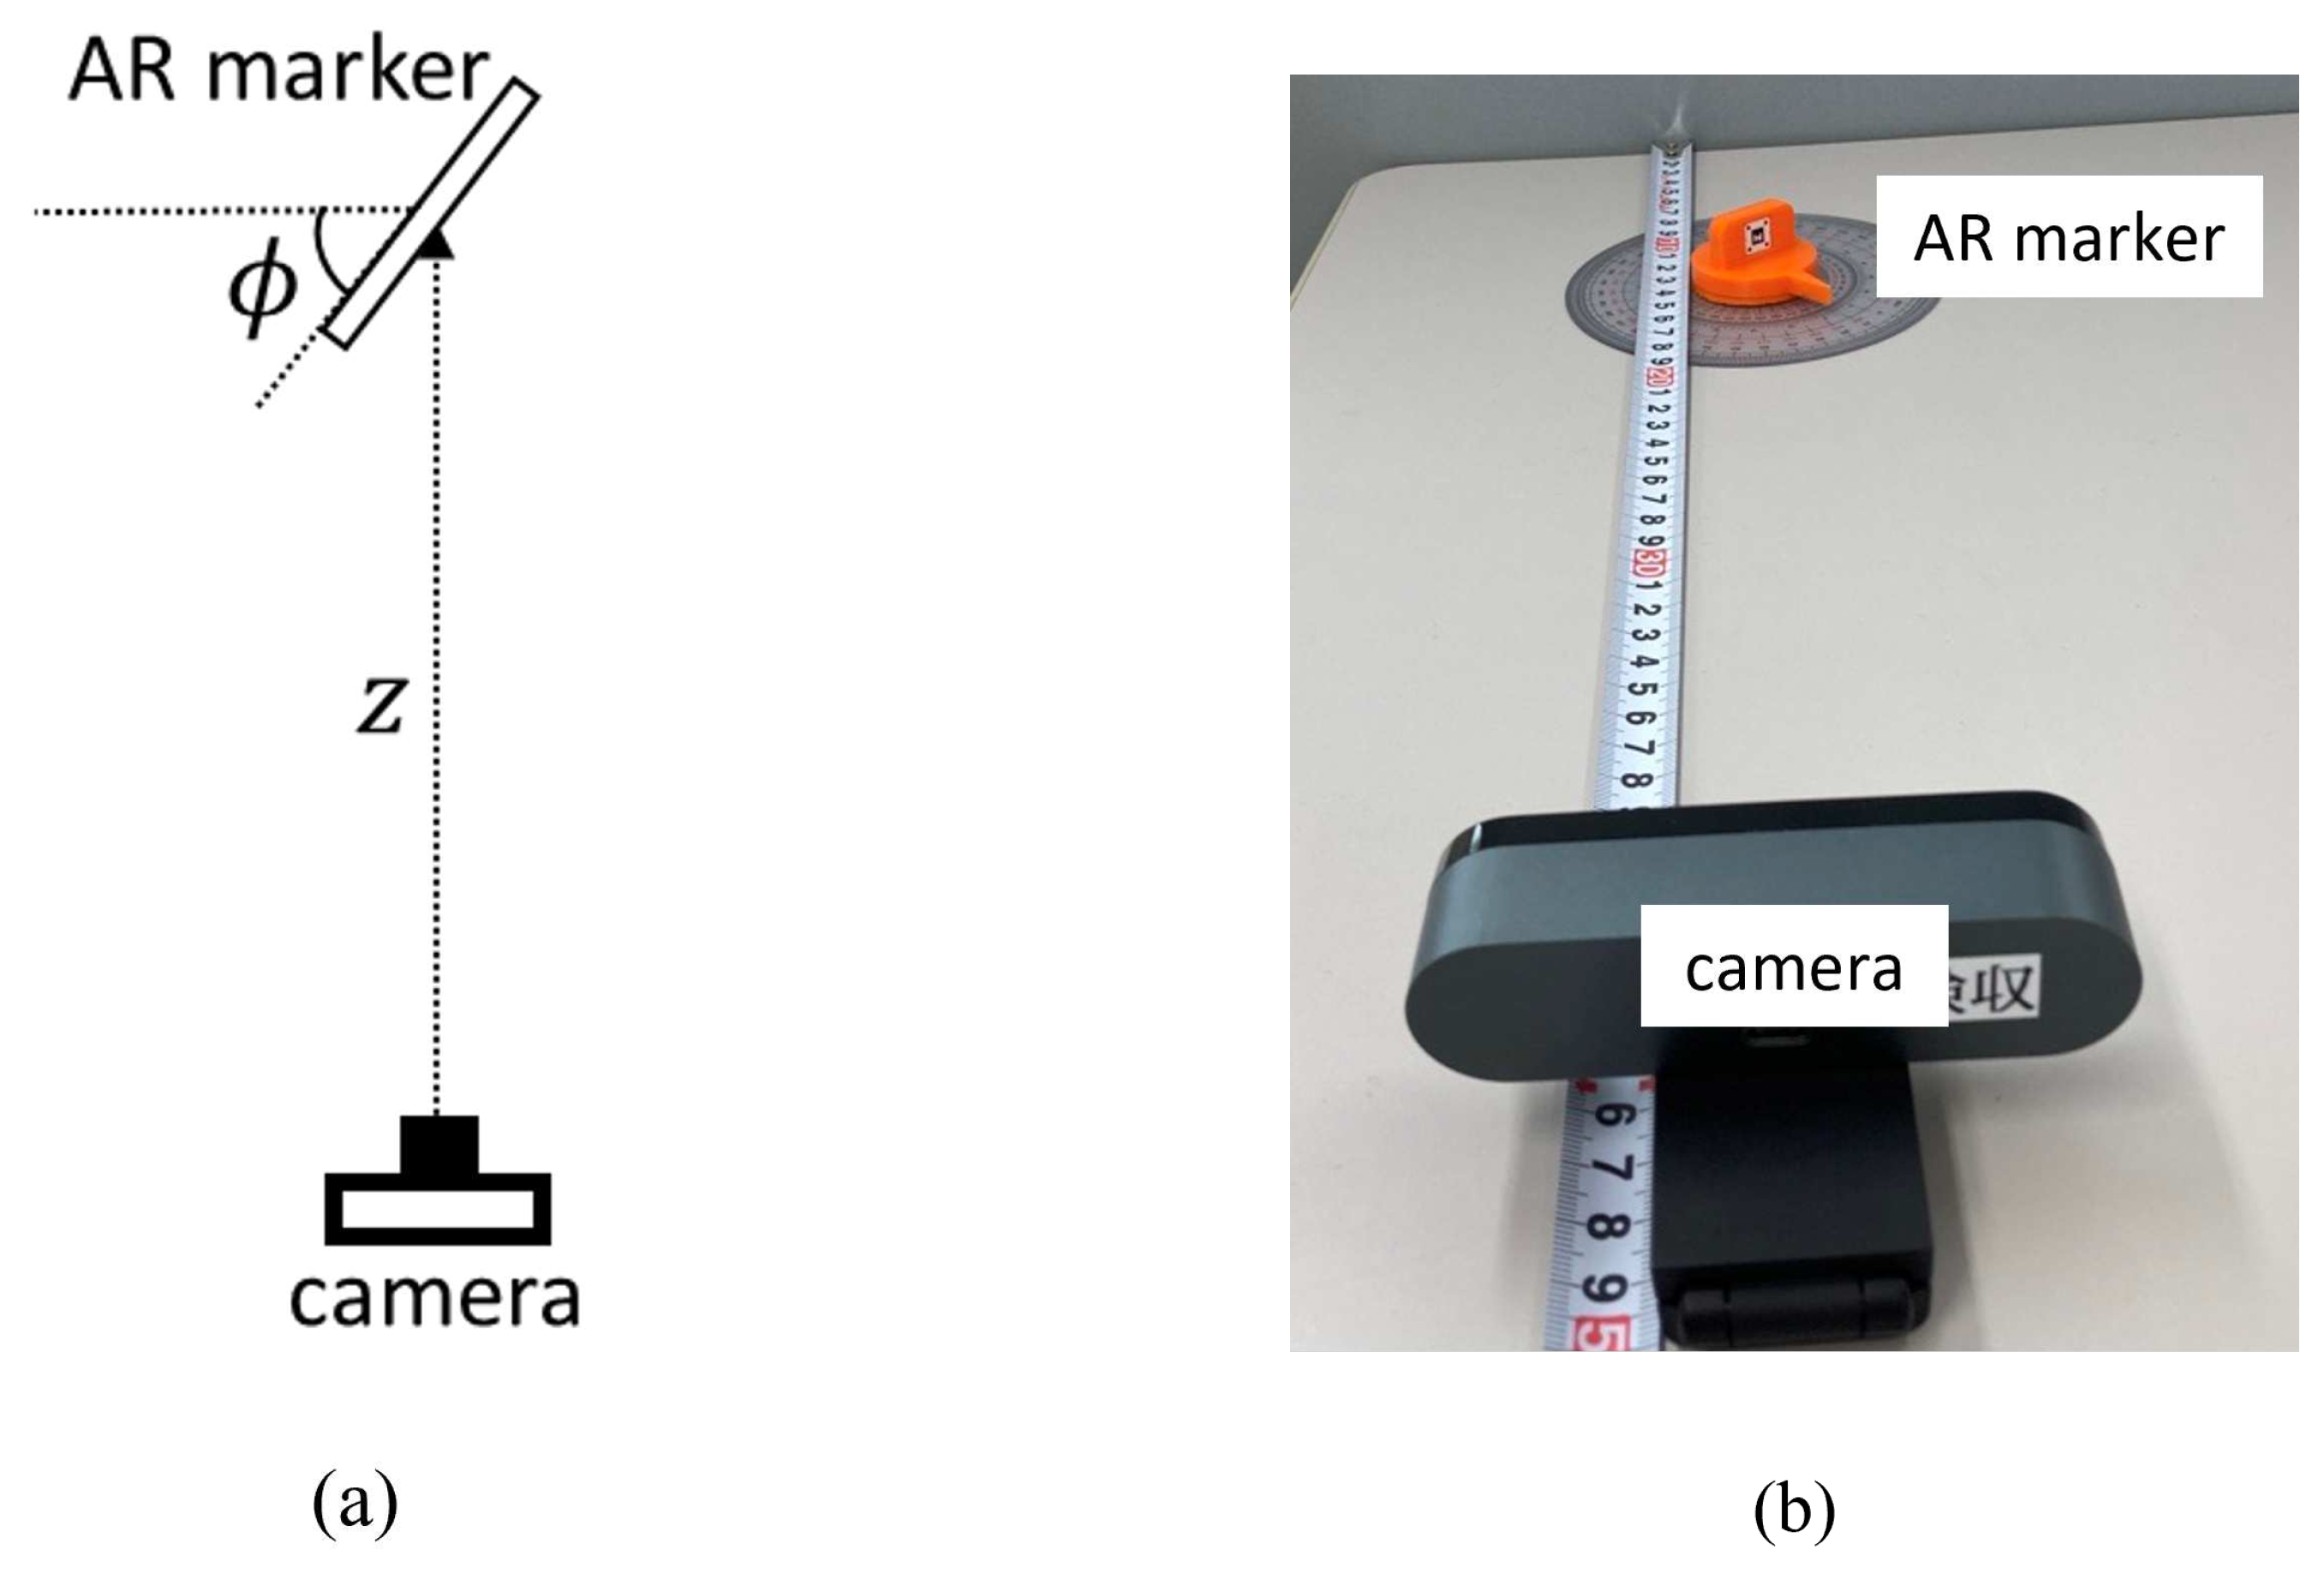
Figure 9.
Recognition error rate of the marker’s depth distance(z) with fixed camera parameters.
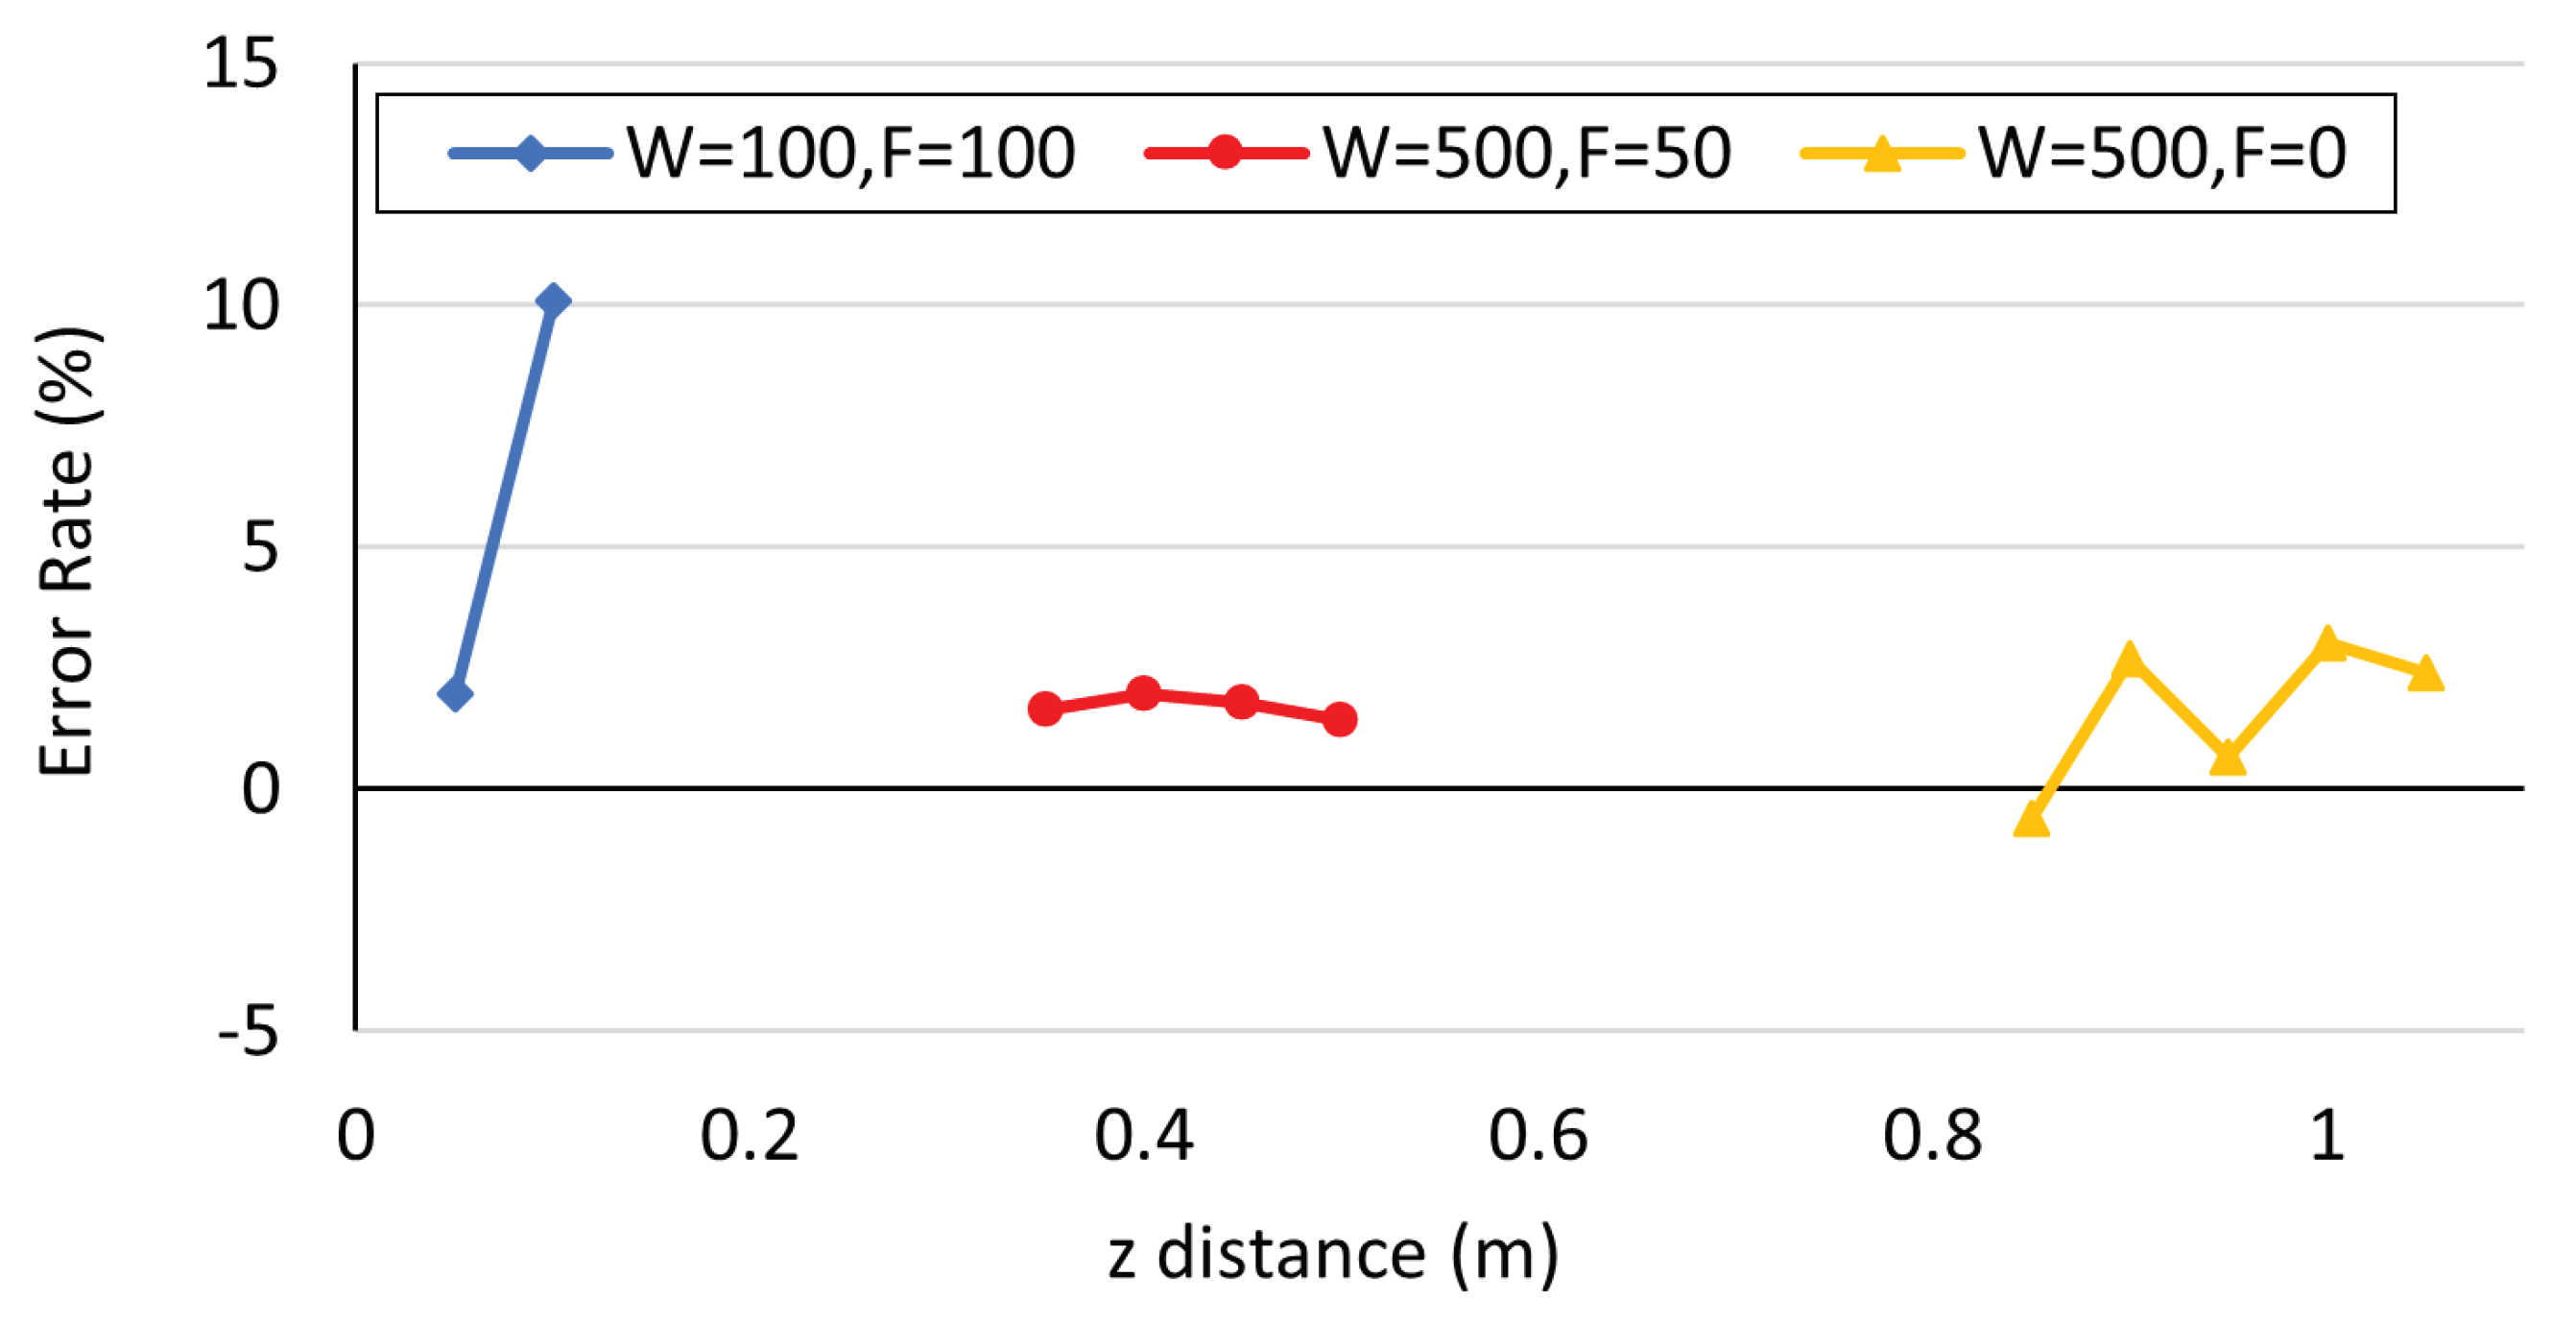
Figure 10.
Recognition error rate of the marker’s depth distance(z) using dynamic focus control with constant zoom values(W).
Figure 10.
Recognition error rate of the marker’s depth distance(z) using dynamic focus control with constant zoom values(W).
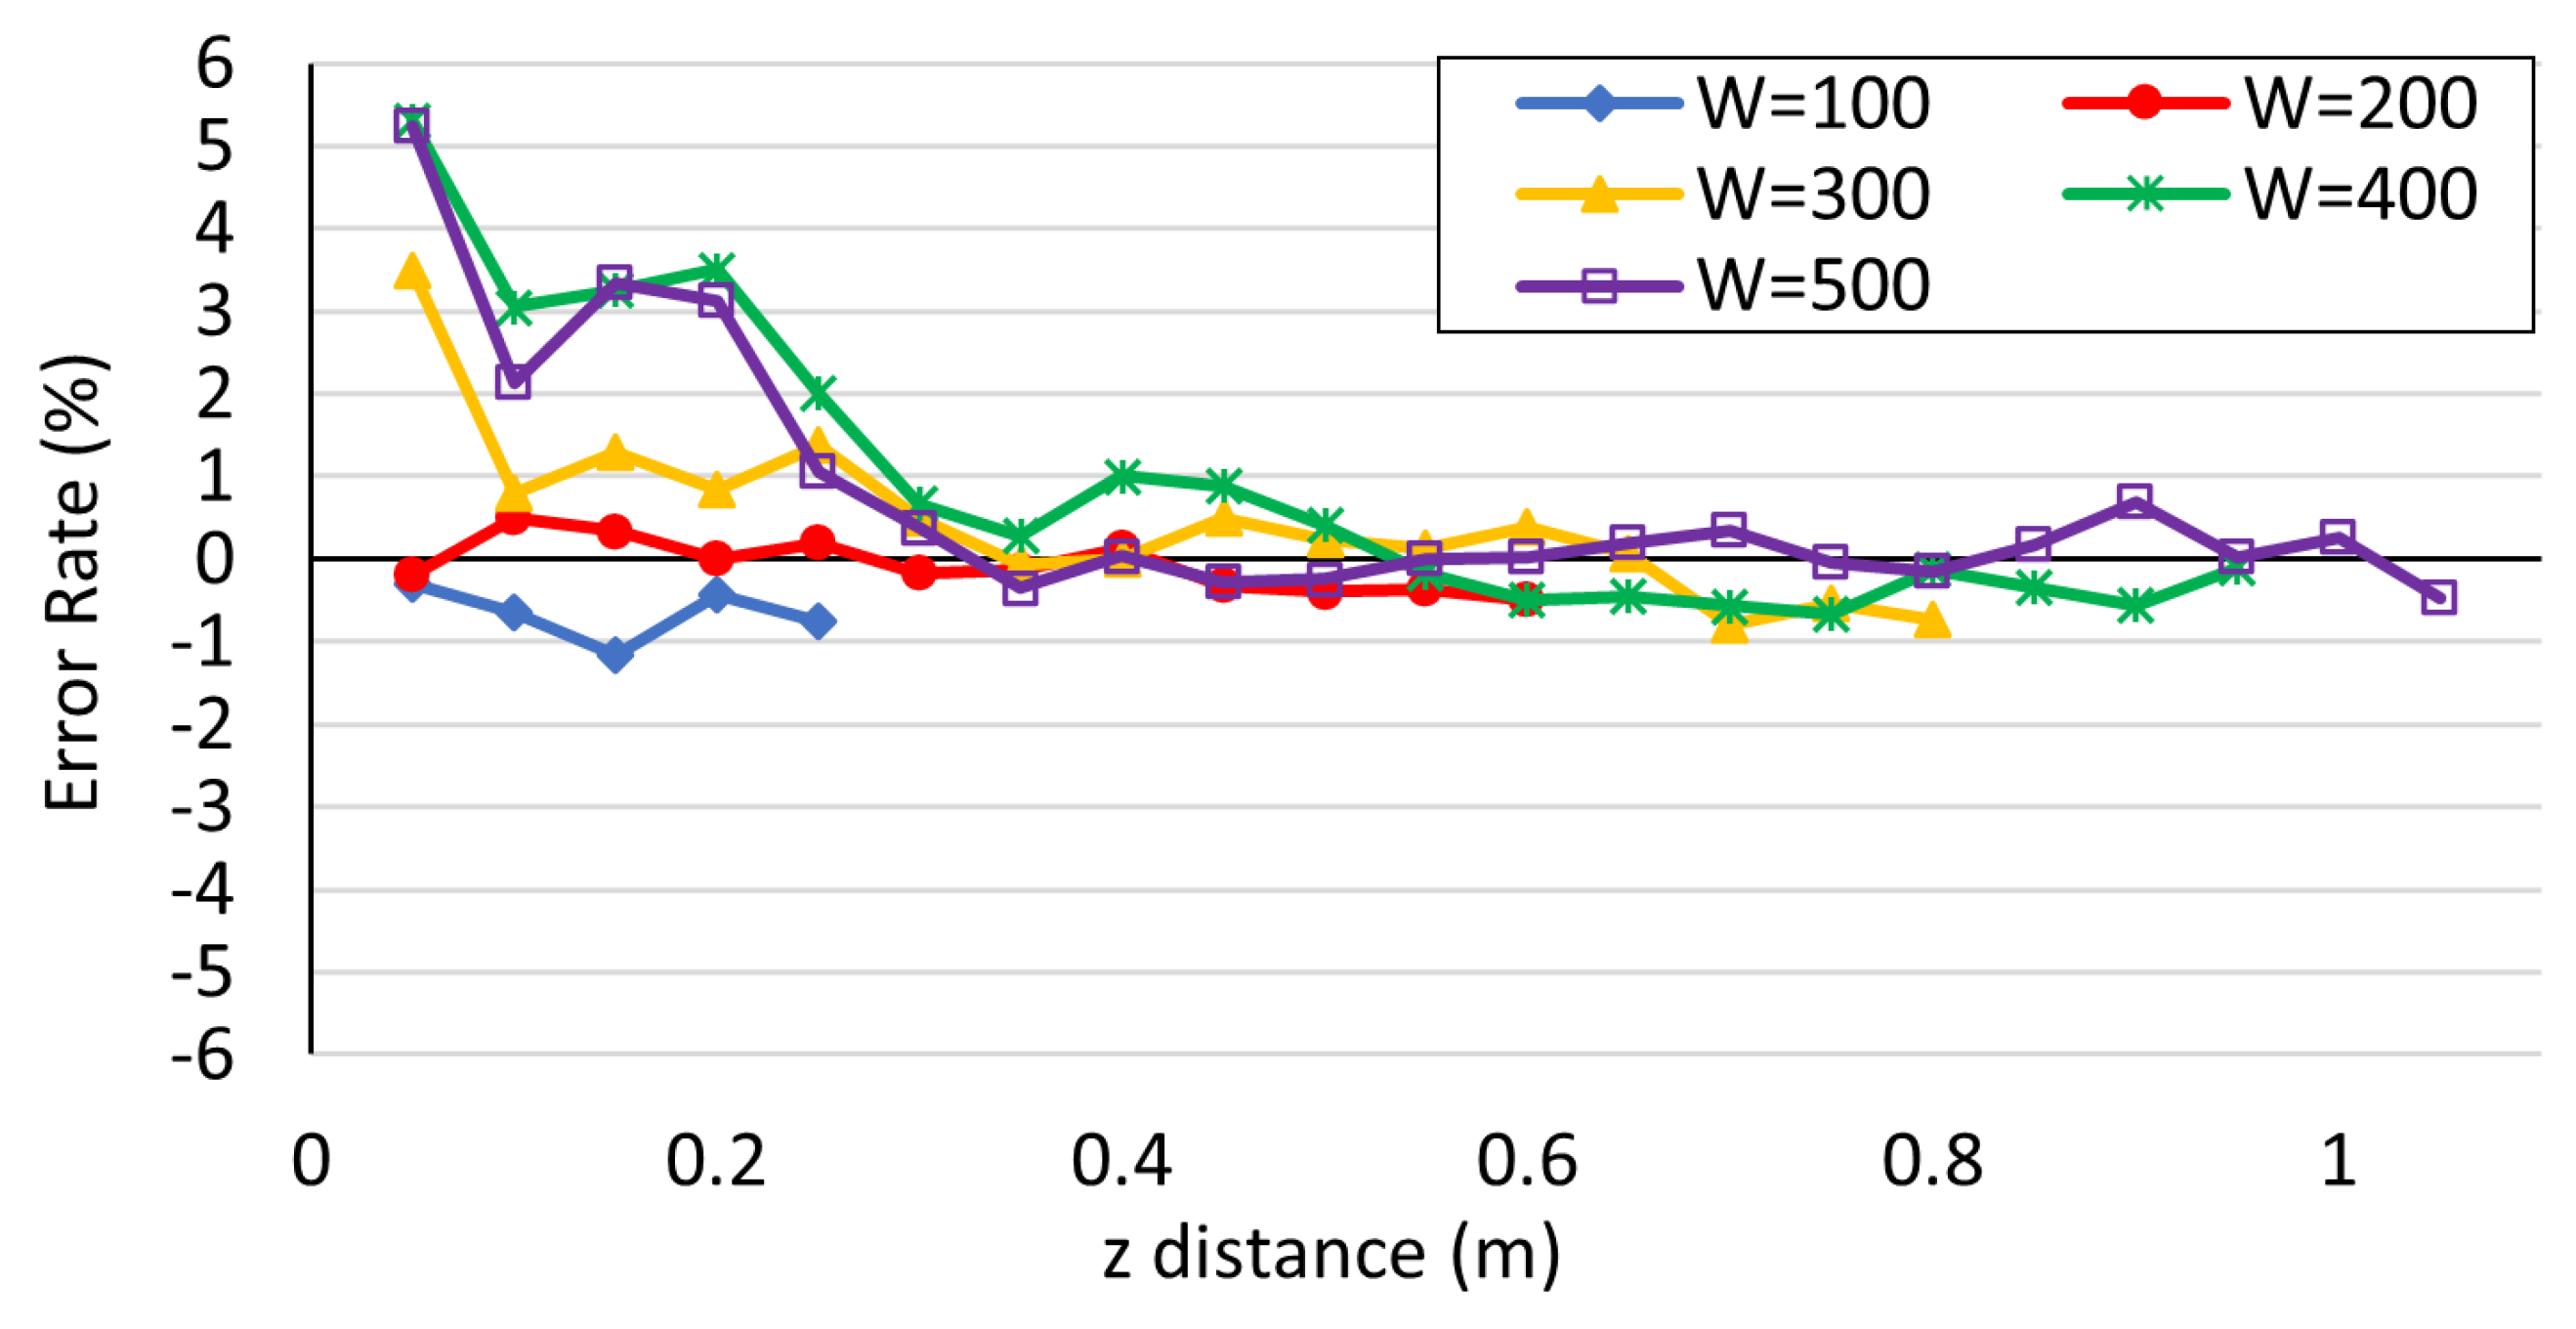
Figure 11.
Recognition error rate of the depth distance(z) with proposed camera control for different marker angles().
Figure 11.
Recognition error rate of the depth distance(z) with proposed camera control for different marker angles().
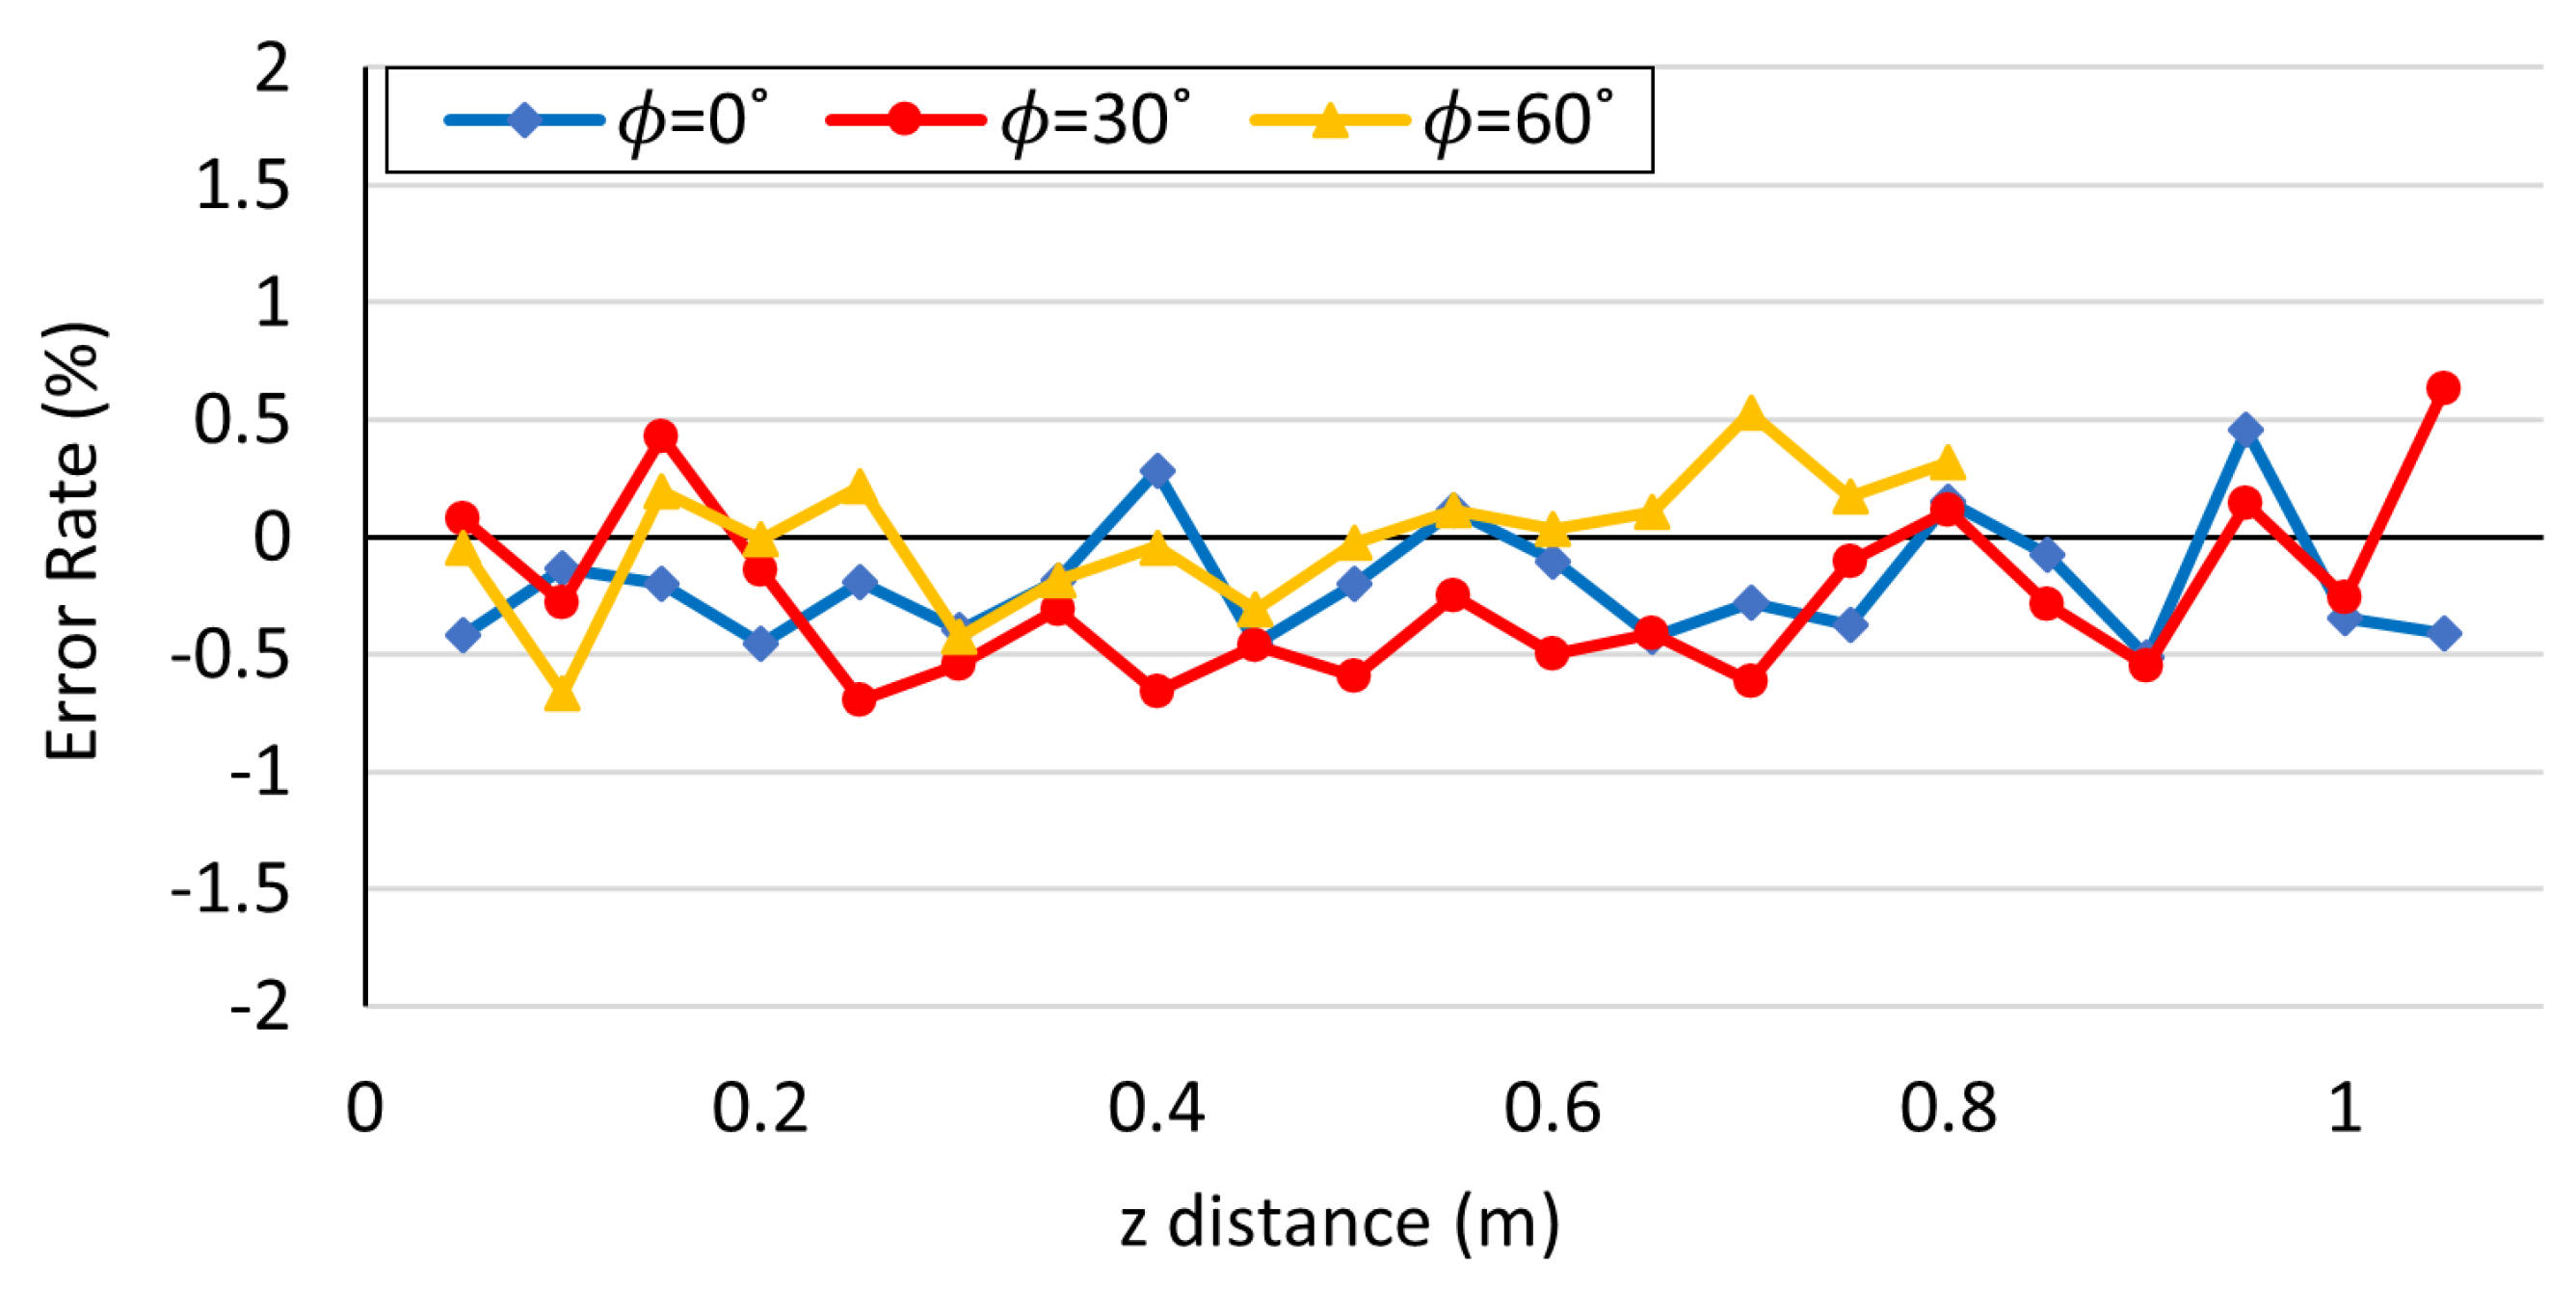
Figure 12.
Iteration time of the depth distance(z) to converge with proposed camera control for different marker angles().
Figure 12.
Iteration time of the depth distance(z) to converge with proposed camera control for different marker angles().
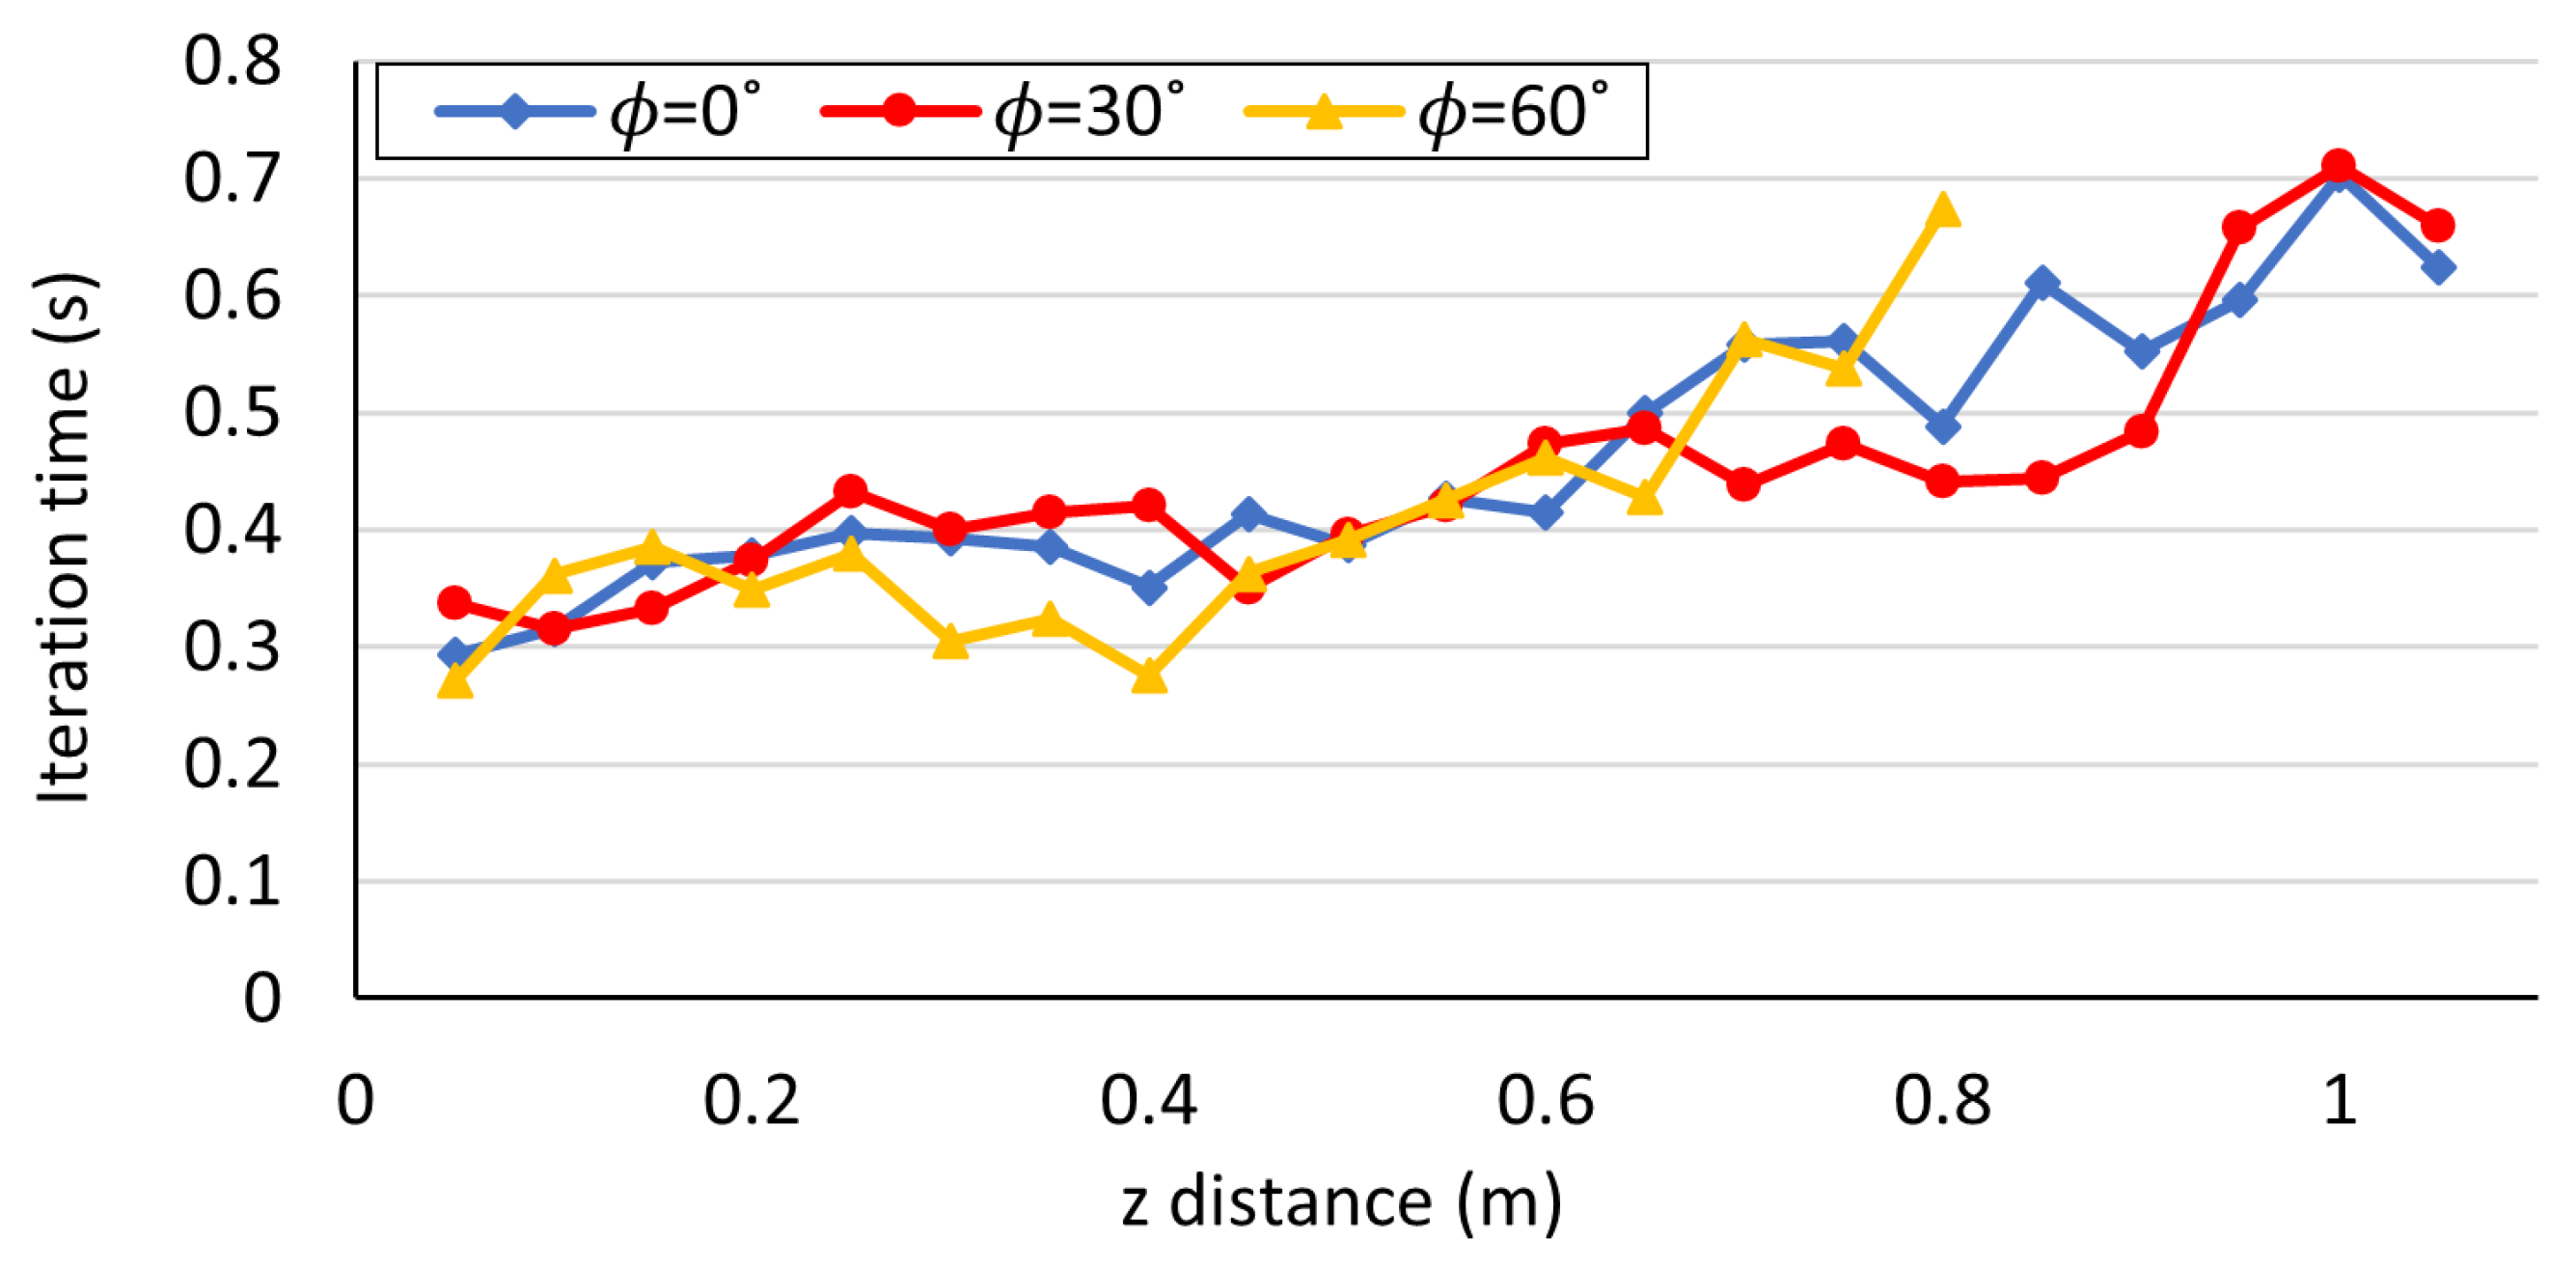
Figure 13.
Convergence of the depth distance(z) measurement values to true values by iteration: (a) z=1.0m; (b) z=0.5m; (c) z=0.1m
Figure 13.
Convergence of the depth distance(z) measurement values to true values by iteration: (a) z=1.0m; (b) z=0.5m; (c) z=0.1m
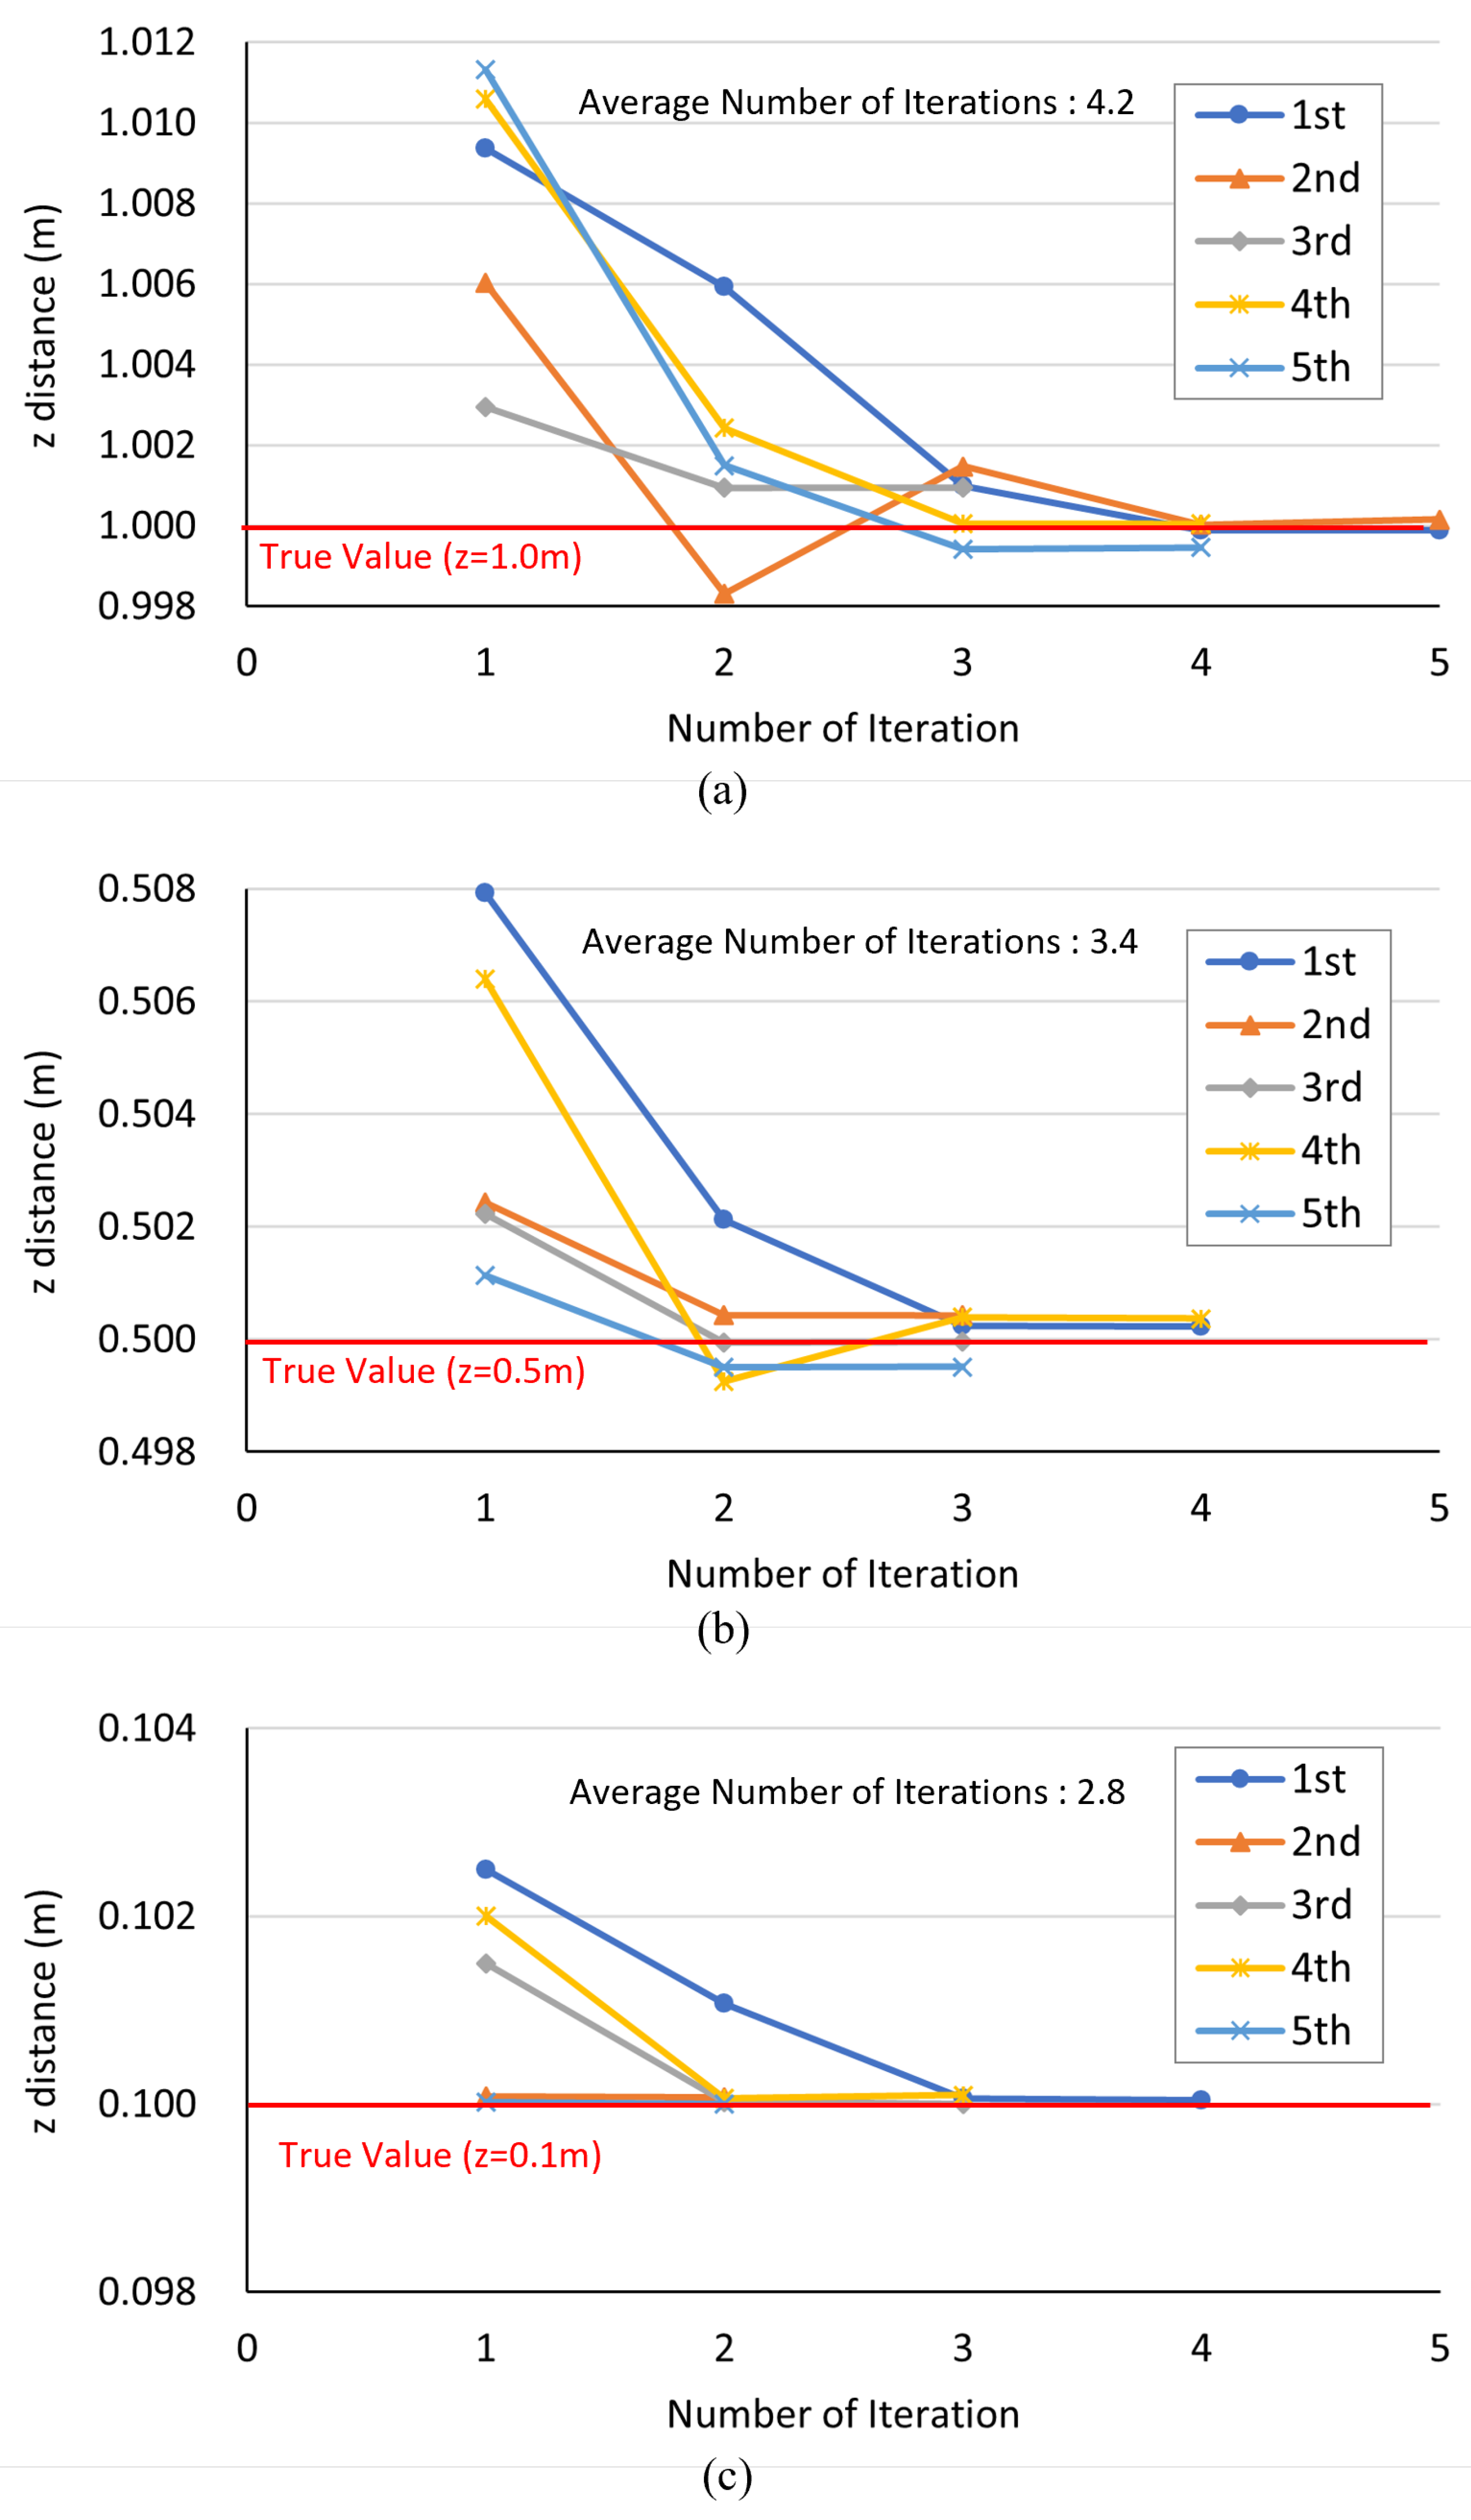
Figure 14.
Recognition error of the marker angle() with proposed camera control for different depth distances(z).
Figure 14.
Recognition error of the marker angle() with proposed camera control for different depth distances(z).
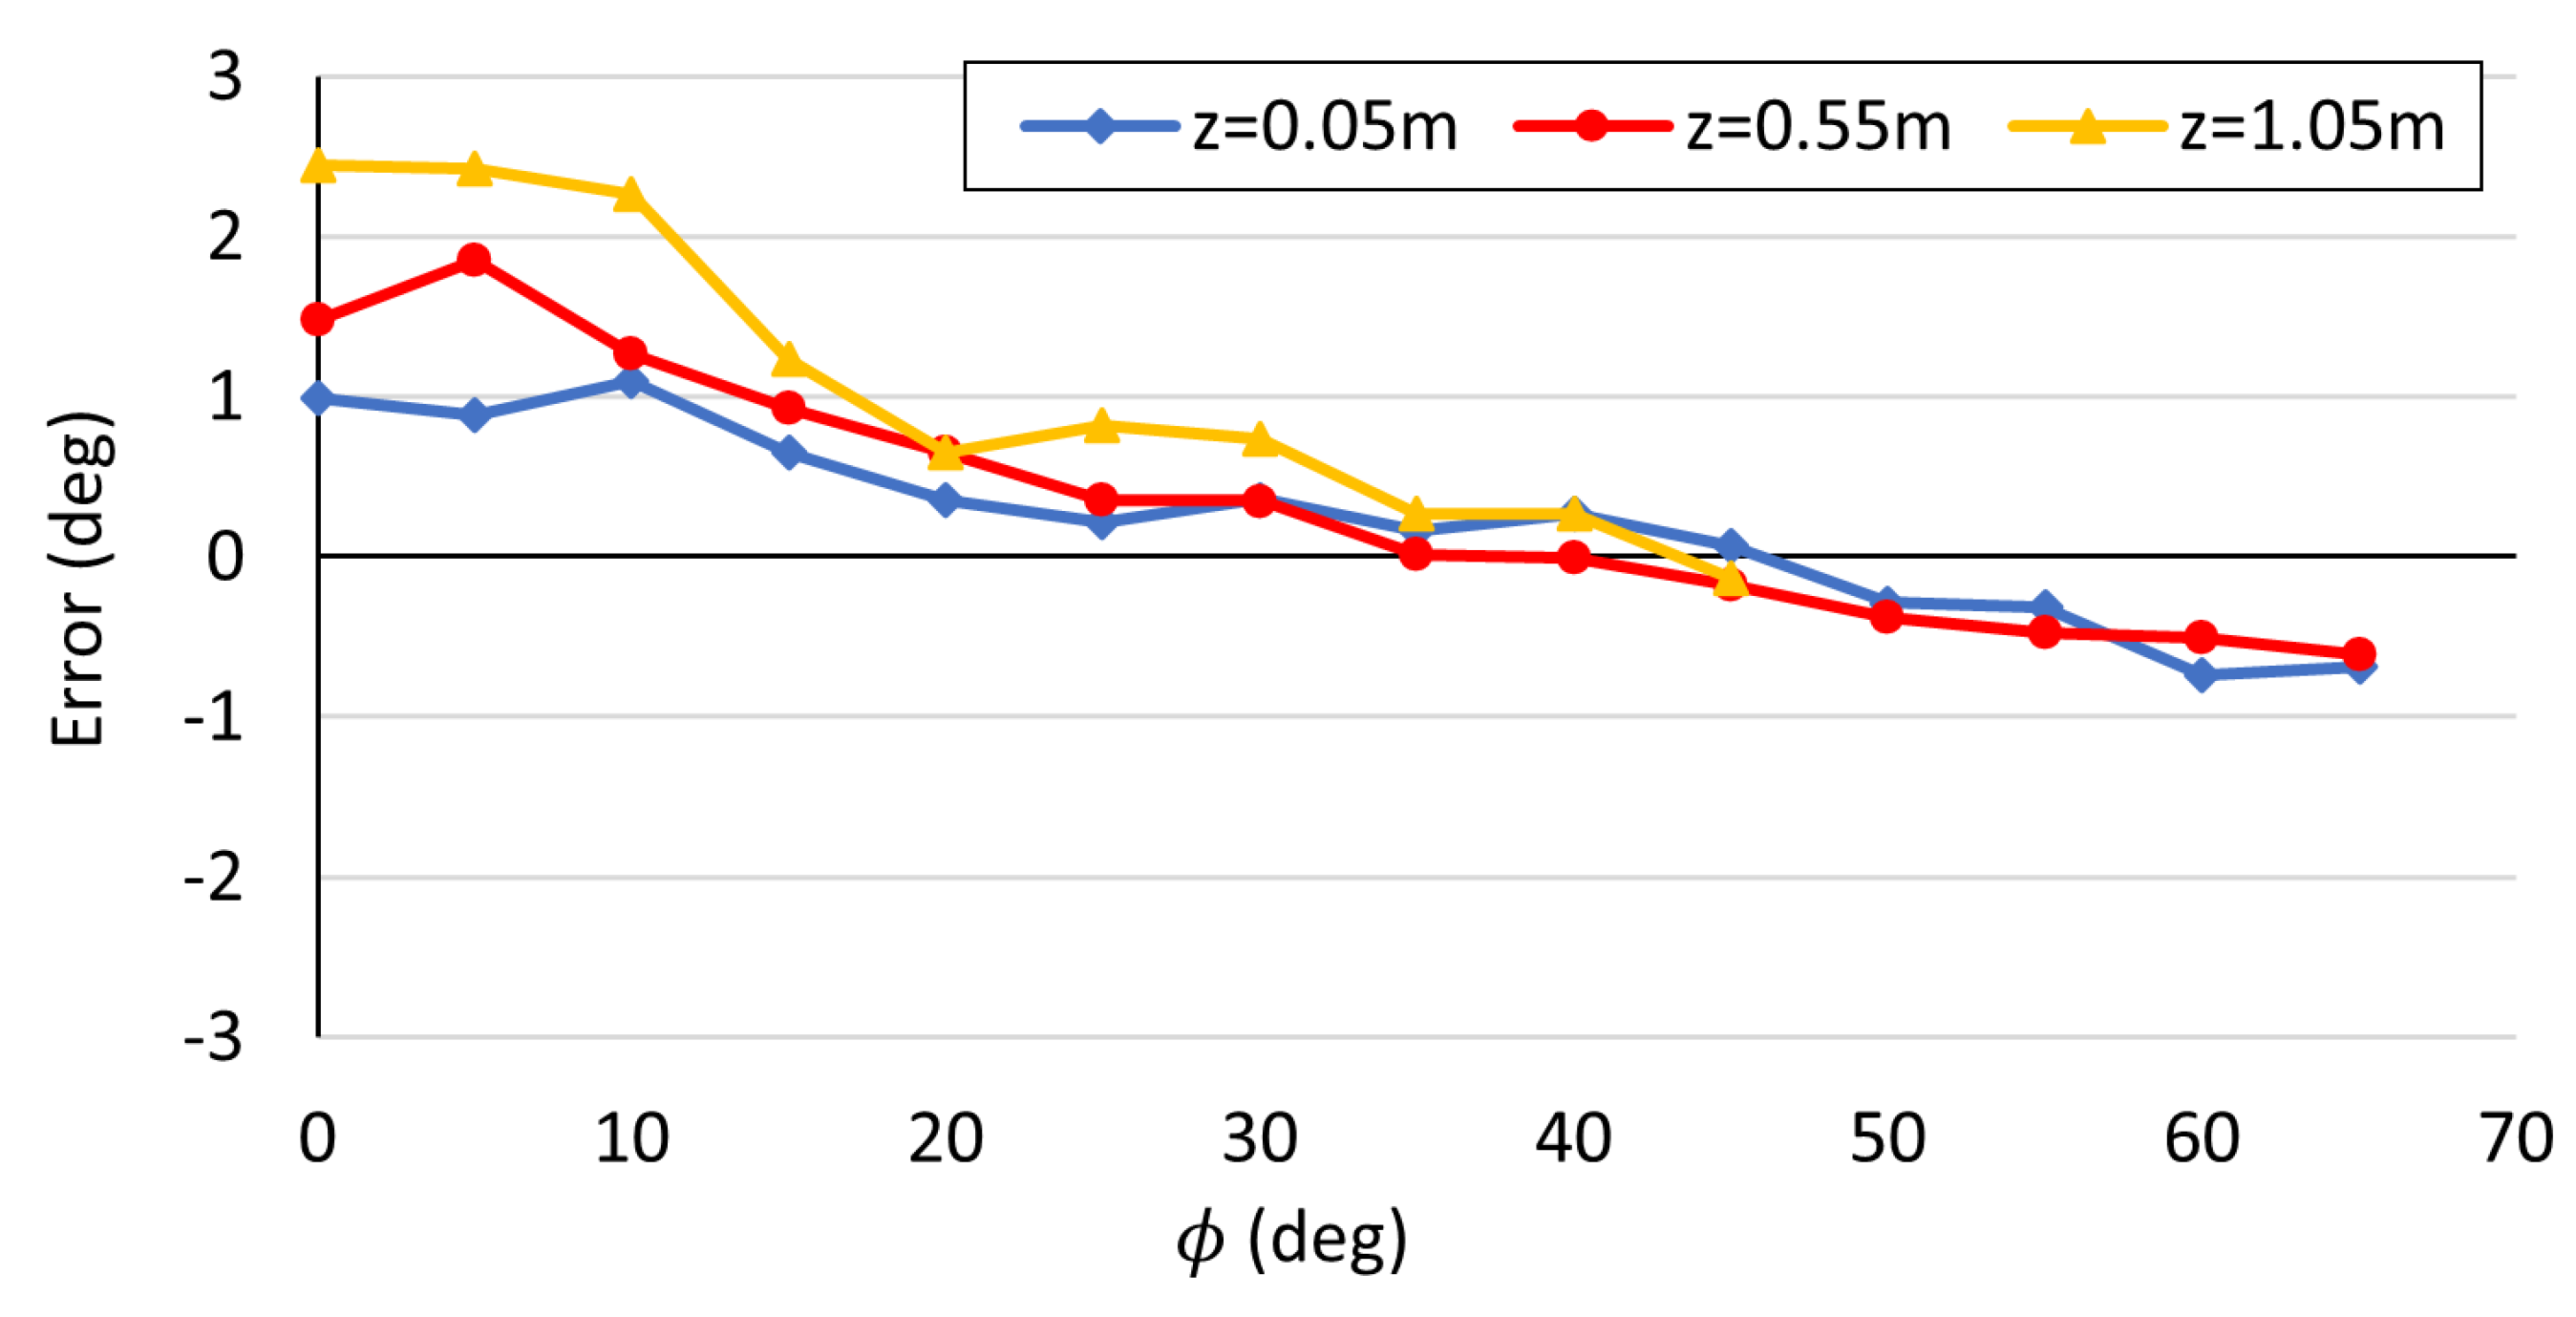
Figure 15.
Iteration time of the marker angle() with proposed camera control for different depth distances(z).
Figure 15.
Iteration time of the marker angle() with proposed camera control for different depth distances(z).
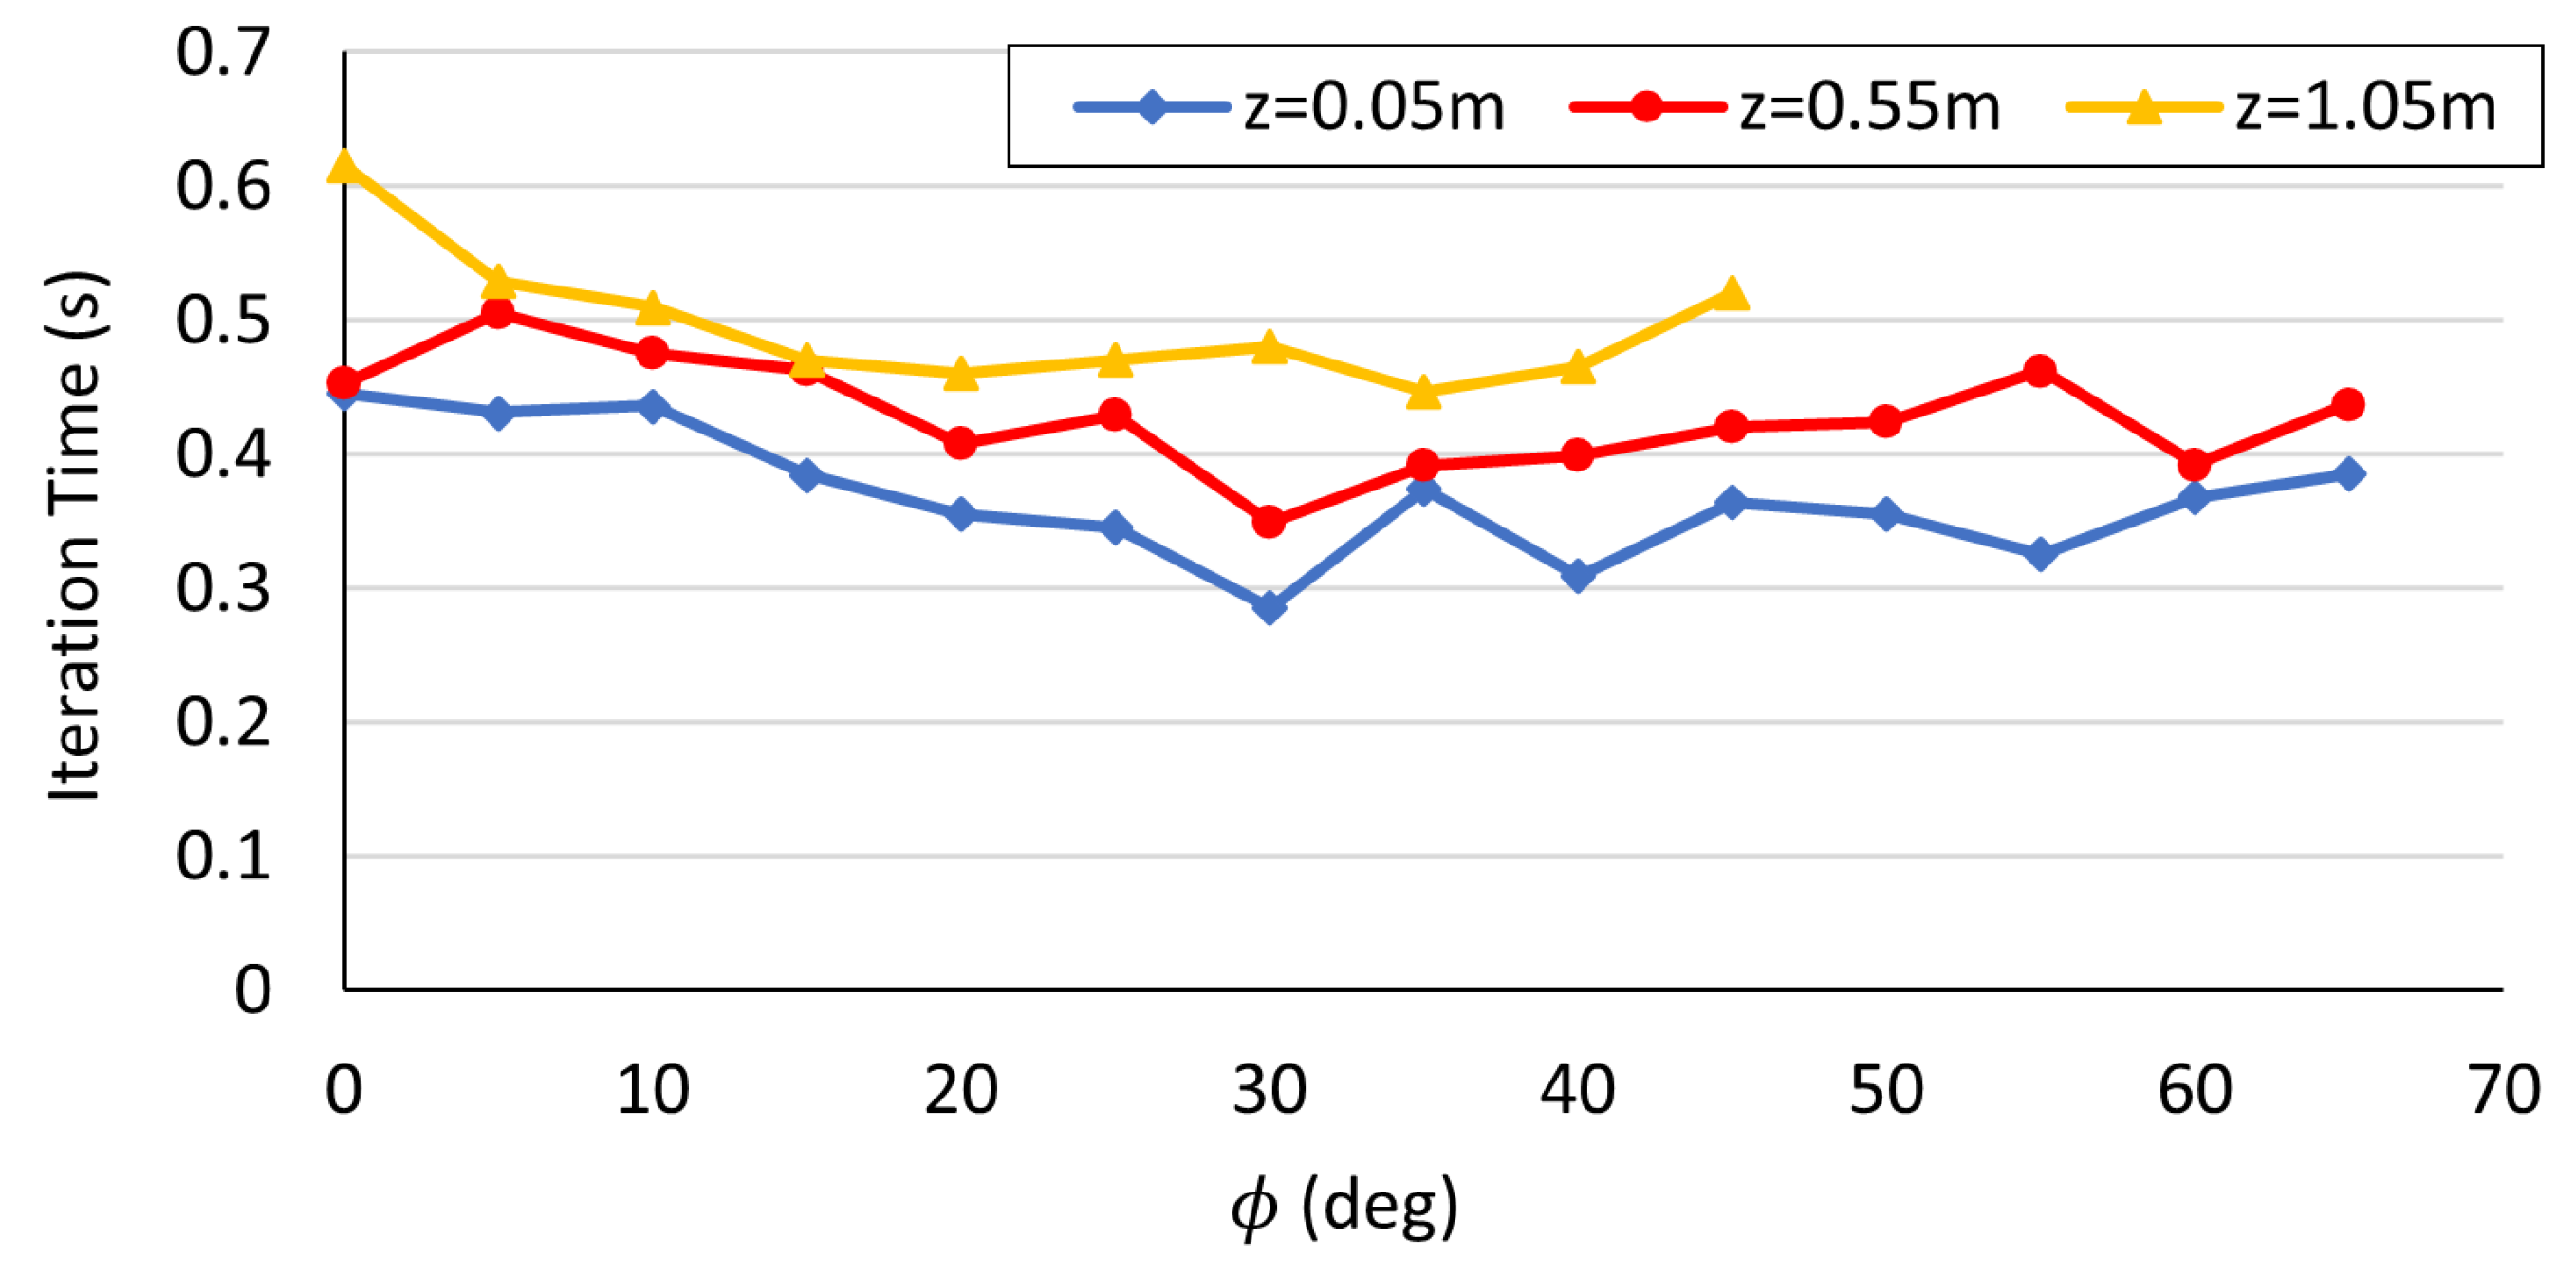

Table 1.
Camera specifications.
| Product name | Logicool BRIO C1000eR® |
|---|---|
| Output resolution | 1920 × 1080 (FHD) |
| Frame rate | 30fps |
| Diagonal FOV | 90° |
| Digital zoom | 1x - 5x |
| Size (mm) | 102 × 27 × 27 |
Table 2.
Parameters used in the proposed camera control system.
| Parameter | Symbol | Value |
|---|---|---|
| Zoom value | W | Variable. () |
| Maximum zoom value | 500 | |
| Minimum zoom value | 100 | |
| Depth distance of AR marker | z | Variable. (m) |
| Minimum depth distance | 0.05 (m) | |
| Conversion coefficient of zoom value | C | 1000 (1/m) |
| Camera magnification | n | Variable. |
| Focus value | F | Variable. () |
| Constants of focus value | ||
| Constants of focus value | ||
| Distortion coefficient matrix | Determined by calibration. | |
| Radial distortion coefficient | ||
| Tangential distortion coefficient | ||
| Internal parameter matrix | Determined by calibration. | |
| focus distance | ||
| Optical center | ||
| AR marker position | Iterative output variable. | |
| AR marker posture | Iterative output variable. | |
| Threshold of position error | Arbitrally setting. | |
| Threshold of posture error | Arbitrally setting. |
Table 3.
Initial camera parameter values and error thresholds.
| Parameter | Symbol | Value |
|---|---|---|
| Zoom value | W | 500 |
| Focus value | F | 150 |
| Threshold of position error | 1.0 (mm) | |
| Threshold of posture error | 0.01 (deg) |
Disclaimer/Publisher’s Note: The statements, opinions and data contained in all publications are solely those of the individual author(s) and contributor(s) and not of MDPI and/or the editor(s). MDPI and/or the editor(s) disclaim responsibility for any injury to people or property resulting from any ideas, methods, instructions or products referred to in the content. |
© 2020 by the authors. Licensee MDPI, Basel, Switzerland. This article is an open access article distributed under the terms and conditions of the Creative Commons Attribution (CC BY) license (https://creativecommons.org/licenses/by/4.0/).
Copyright: This open access article is published under a Creative Commons CC BY 4.0 license, which permit the free download, distribution, and reuse, provided that the author and preprint are cited in any reuse.


