1. Introduction
Energy-efficient driving strategies have shown to substantially lower the total energy consumption of railway trains. With an increased demand for energy saving technologies, numerous research studies have been devoted to this subject in recent years, showing that in many cases an average energy saving of 15 to 30 % could be achieved by assisted driving [
2,
3,
4,
5,
6,
7,
8,
9]. A comprehensive review on energy-efficient train control, commonly abbreviated as EETC, is given by Scheepmaker, Goverde, and Kroon [
10]. The majority of the mathematical models that have been developed to calculate energy minimised driving are based on Pontryagin’s maximum principle (PMP), a fundamental theorem of optimal control theory. The maximum principle was formulated in 1961 by Pontryagin, Boltyanskii, Gamkrelidze, and Mishchenko [
11,
12]. The first application of Pontryagin’s maximum principle to the operation of trains dates back to Japanese research in 1968 (Ichikawa [
13]). The model of Ichikawa was restricted to a flat track and linear train resistance depending on speed. Another early contribution is due to Strobel, Horn, and Kosemund [
2]. They considered non-constant altitude and found that the optimal solution is always in one of the drive regimes
full traction,
partial traction with constant speed,
coasting,
partial braking with constant speed, and
full braking. Based on their model, they set up a first driver advisory system for the Berlin S-Bahn (suburban trains).
Since those pioneering research on this topic, models have gained complexity. Important developments have been: (1) the application to variable altitude and variable speed limit, (2) the inclusion of regenerative braking in electric locomotives or motor coaches, (3) improved modelling for train resistance, tractive, and brake force depending on speed, (4) the energy minimisation with non-zero speed boundary conditions, (5) advanced modelling of efficiency as dependent on speed, tractive, and brake force, (6) multiple-train problems.
Regarding the second aspect, some (especially the earlier) authors are dealing only with mechanical braking of trains. When regenerative braking is considered, most authors base their energy-efficient driving strategy on the exclusive use of the regenerative brake. A few recent contributions cover the combined application of mechanical and regenerative brake in their optimisation strategy.
We proceed with some important developments for purely mechanical braking. Starting from the PhD thesis of Milroy [
14] in 1980, a reaserch team at the University of South Australia introduced the system
Metromiser (Howlett and Pudney [
3]). The system covered both timetable planning and driver advisory. Metromiser was restricted to constant track gradients during both coasting and braking. The system was first applied on trains in Adelaide (Australia) in 1984, followed by Toronto (Canada), Melbourne (Australia), and Brisbane (Australia). Howlett, Milroy, and Pudney [
15] were the first to assume variable speed limit, but only for the special case of discrete traction control. In 2003, Liu and Golovitcher [
16] presented a method covering variable altitude, variable speed limit, continuous traction control, and quadratic train resistance dependence on speed. Except being bound to purely mechanical braking, this algorithm is therefore quite general with respect to the other assumptions. The article contains a complete description of switching between the possible drive regimes. In 2013, Albrecht, Howlett, Pudney, and Vu [
17] introduced the driver advisory system
Energymiser that has been applied by French railway SNCF on TGV high speed trains. They proved the uniqueness of the energy optimum being derived. A multi-objective algorithm combining energy minimisation and punctuality of trains was developed by Aradi, Becsi, and Gaspar [
7].
Regenerative braking was first considered in 1985 by Asnis, Dmitruk, and Osmolovskii [
18] in the context of train energy minimisation. They assumed constant altitude and speed limit in their model. Franke, Terwiesch, and Meyer [
4] introduced an energy optimisation algorithm for variable altitude, variable speed limit, and purely regenerative braking that was restricted to piecewise constant traction and brake force. They suggested a discrete dynamic programming (DDP) method for solution. In 2000, Khmelnitsky [
1] developed a model that covered variable altitude, variable speed limit, continuous traction control, arbitrary maximum tractive and brake force depending on speed, quadratic train resistance with respect to speed, and exclusively regenerative braking. Regarding this features, it is a broadly applicable approach with little restrictions. Due to this advantages, the algorithm of Khmelnitsky has been chosen as the basis for our research. In a recent article by Ying et al. [
19], the EETC problem solved by Khmelnitsky has been revisited, with a special focus on solutions touching the speed limit. The paper of Ying et al. [
19] can be especially recommended for its comprehensive illustration of the large variety of cases that can arise during construction of the optimum solution. The EETC problem with prescribed non-zero speed boundary conditions was solved by Ying et al. [
20].
There are relatively few research contributions dealing with the EETC problem using combined mechanical and regenerative braking. Baranov, Meleshin, and Chin’ [
21] were the first considering this topic, but an algorithm to solve the problem was left as an open question in their article. Lu et al. [
22] studied combined mechanical and regenerative braking, but excluded both variable speed limit and variable track gradients. Zhou et al. [
23] studied synchronisation of accelerating and braking trains, considering both kinds of braking, but again did not include variable speed limit. Fernández-Rodríguez et al. [
24] combined both brake systems in a multi-objective optimisation method, but did not derive a rigorous energy minimum. In the paper of Scheepmaker and Goverde [
25], the optimisation problem with combined mechanical and regenerative braking was solved for the first time under general assumptions, i.e., with speed dependent tractive and brake effort, variable speed limit, and variable altitude. Scheepmaker and Goverde have used the Gauss-Radau pseudospectral method implemented in GPOPS [
26] to solve the optimal control problem.
Several authors have considered advanced efficiency modelling, in particular efficiency depending on speed, tractive, and brake force. This assumption is more realistic but substantially complicates the approach. Most notably, the optimal trajectory for this problem is no more restricted to the driving regimes of full traction, constant speed, coasting, and full brake. Therefore, other methods than PMP techniques are used in this case, in particular track length discretisation combined with nonlinear programming. Research on advanced efficiency modelling was carried out, e.g., by Franke, Terwiesch, and Meyer [
4], Ghaviha et al. [
27], Kouzoupis et al. [
28], and Feng, Huang, and Lu [
29].
Multiple train problems have often been studied with a focus on timetable design in order to synchronise accelerating and braking trains for best distribution of regenerative energy. See, for example, Zhou et al. [
23] for research on this topic. More references can be found in Scheepmaker and Goverde [
25]. Szkopiński and Kochan [
30] have studied energy-efficient train driving when approaching a train on the track ahead.
Apart from the many research contributions based on an application of Pontryagin’s maximum principle, a variety of other methods exist to solve the EETC problem. In particular, so-called
direct methods have recently gained attention. They are characterised by the fact that the problem is first discretised, usually by dividing the track length into smaller intervals. The resulting nonlinear programming (NLP) problem is then solved by nonlinear programming methods as, for example, the pseudospectral one. Wang et al. [
31] were the first to apply the pseudospectral method to an EETC problem. Scheepmaker and Goverde [
25] also utilised a pseudospectral approach. Direct methods have the advantage of being very flexible with respect to the problem under consideration. In addition, optimal control solvers like DIDO (Direct and Indirect Dynamic Optimization) [
32,
33], PSOPT [
34], or GPOPS (General Pseudospectral Optimal Control Software) [
26] are readily available. The implementation is much easier than a solution of the problem along the lines of Pontryagin’s maximum principle. On the other hand, the pseudospectral method often shows an inaccurate oscillatory behaviour of solutions, and it tends to be time consuming. [
28] Recently, Kouzoupis et al. [
28] were able to reduce the computing time of a direct method using multiple shooting.
Based on the above-mentioned approach of Khmelnitsky [
1], a programme called
opTop (optimum train operation) has been developed at Fraunhofer Institute for Factory Operation and Automation (IFF), Magdeburg, Germany. The code is written in MATLAB and currently features energy minimisation with exclusively regenerative braking, except for fastest train motion in the case of tight timetables where additional mechanical braking is considered. The choice of Khmelnitsky’s method was mainly motivated by superior accuracy at an acceptable computing time. An extension of the code to fully include mechanical braking into the optimisation is subject to further development, as well as non-zero speed boundary conditions and smooth switching from fastest to energy-efficient driving in case of a train delay. The code has been tested offline in numerous cases based on real railway tracks and timetables, and computing time has been substantially reduced by code optimisation. A couple of tests with driver advisory in real-life operation have shown energy savings of about 20 % compared to an average of unassisted runs.
The present article was driven by two main motivations. The first one was to show a direct derivation of Khmelnitsky’s theory from a more general formulation of Pontryagin’s maximum principle given by Hartl, Sethi, and Vickson [
35]. By seeing Khmelnitsky’s theory in this general framework, extensions to other conditions could be elaborated. A second motivation was to provide a comprehensive illustration of the behaviour of the method of Khmelnitsky using a couple of numerical examples. We have felt that this very useful method would strongly benefit from some illustrative examples that show the behaviour of the trajectory field including kink points as well as the large variety of switching cases from one driving regime to another. We have, therefore, put a strong focus on the examples in
Section 2.4 and
Section 2.5, in which most of the possible switching cases can be studied in detail.
The article is structured in the following way: In
Section 2.1, the model of train motion is introduced.
Section 2.2 is devoted to the Pontryagin maximum principle that provides a couple of necessary conditions the energy minimising solution has to fulfil. In
Section 2.3, the maximum principle is applied to the specific minimum energy problem for train motion. This leads to the observation that only four driving regimes
full traction,
constant speed,
coasting, and
full regenerative braking are feasible for an energy minimising motion. The regime
constant speed can be driven only at two specific velocities or at speed limit.
Section 2.4 and
Section 2.5 describe the algorithm of Khmelnitsky [
1] for the construction of the minimum energy solution. A complete list of switching cases is given and explained in
Section 2.4, and four numerical examples are introduced to illustrate those cases. Some directions are given that lead to a substantial reduction of computing time. Finally, in
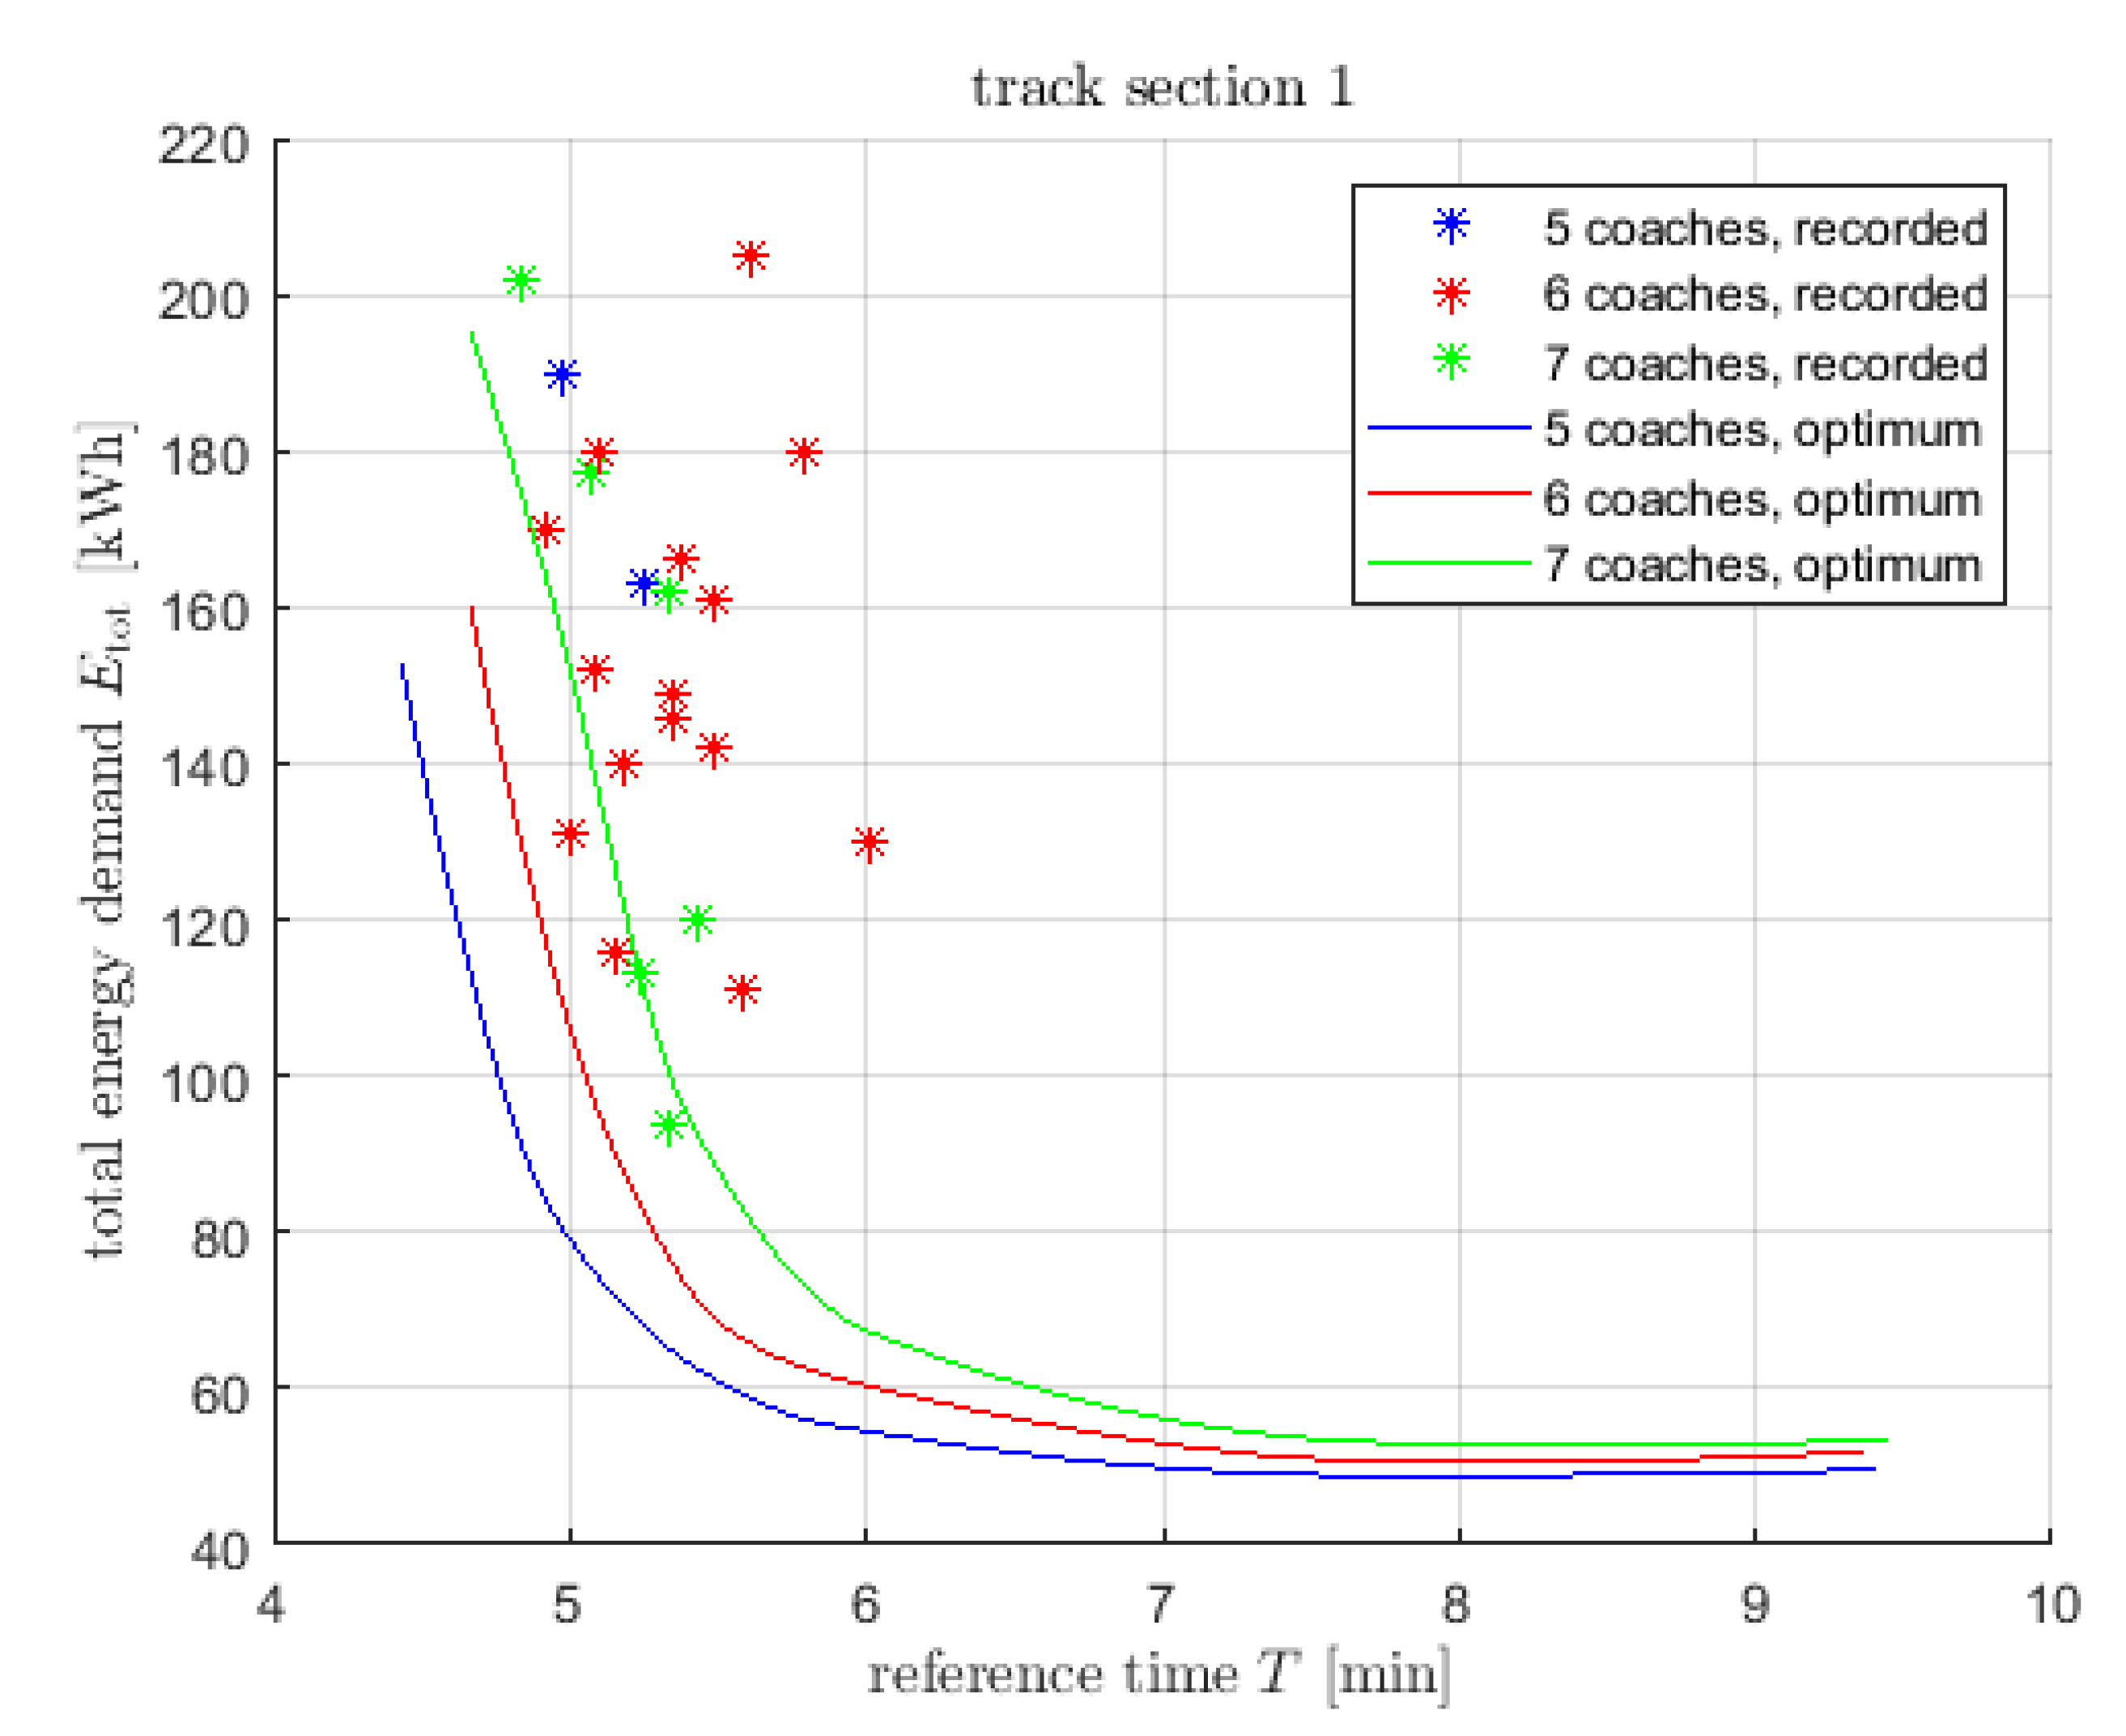
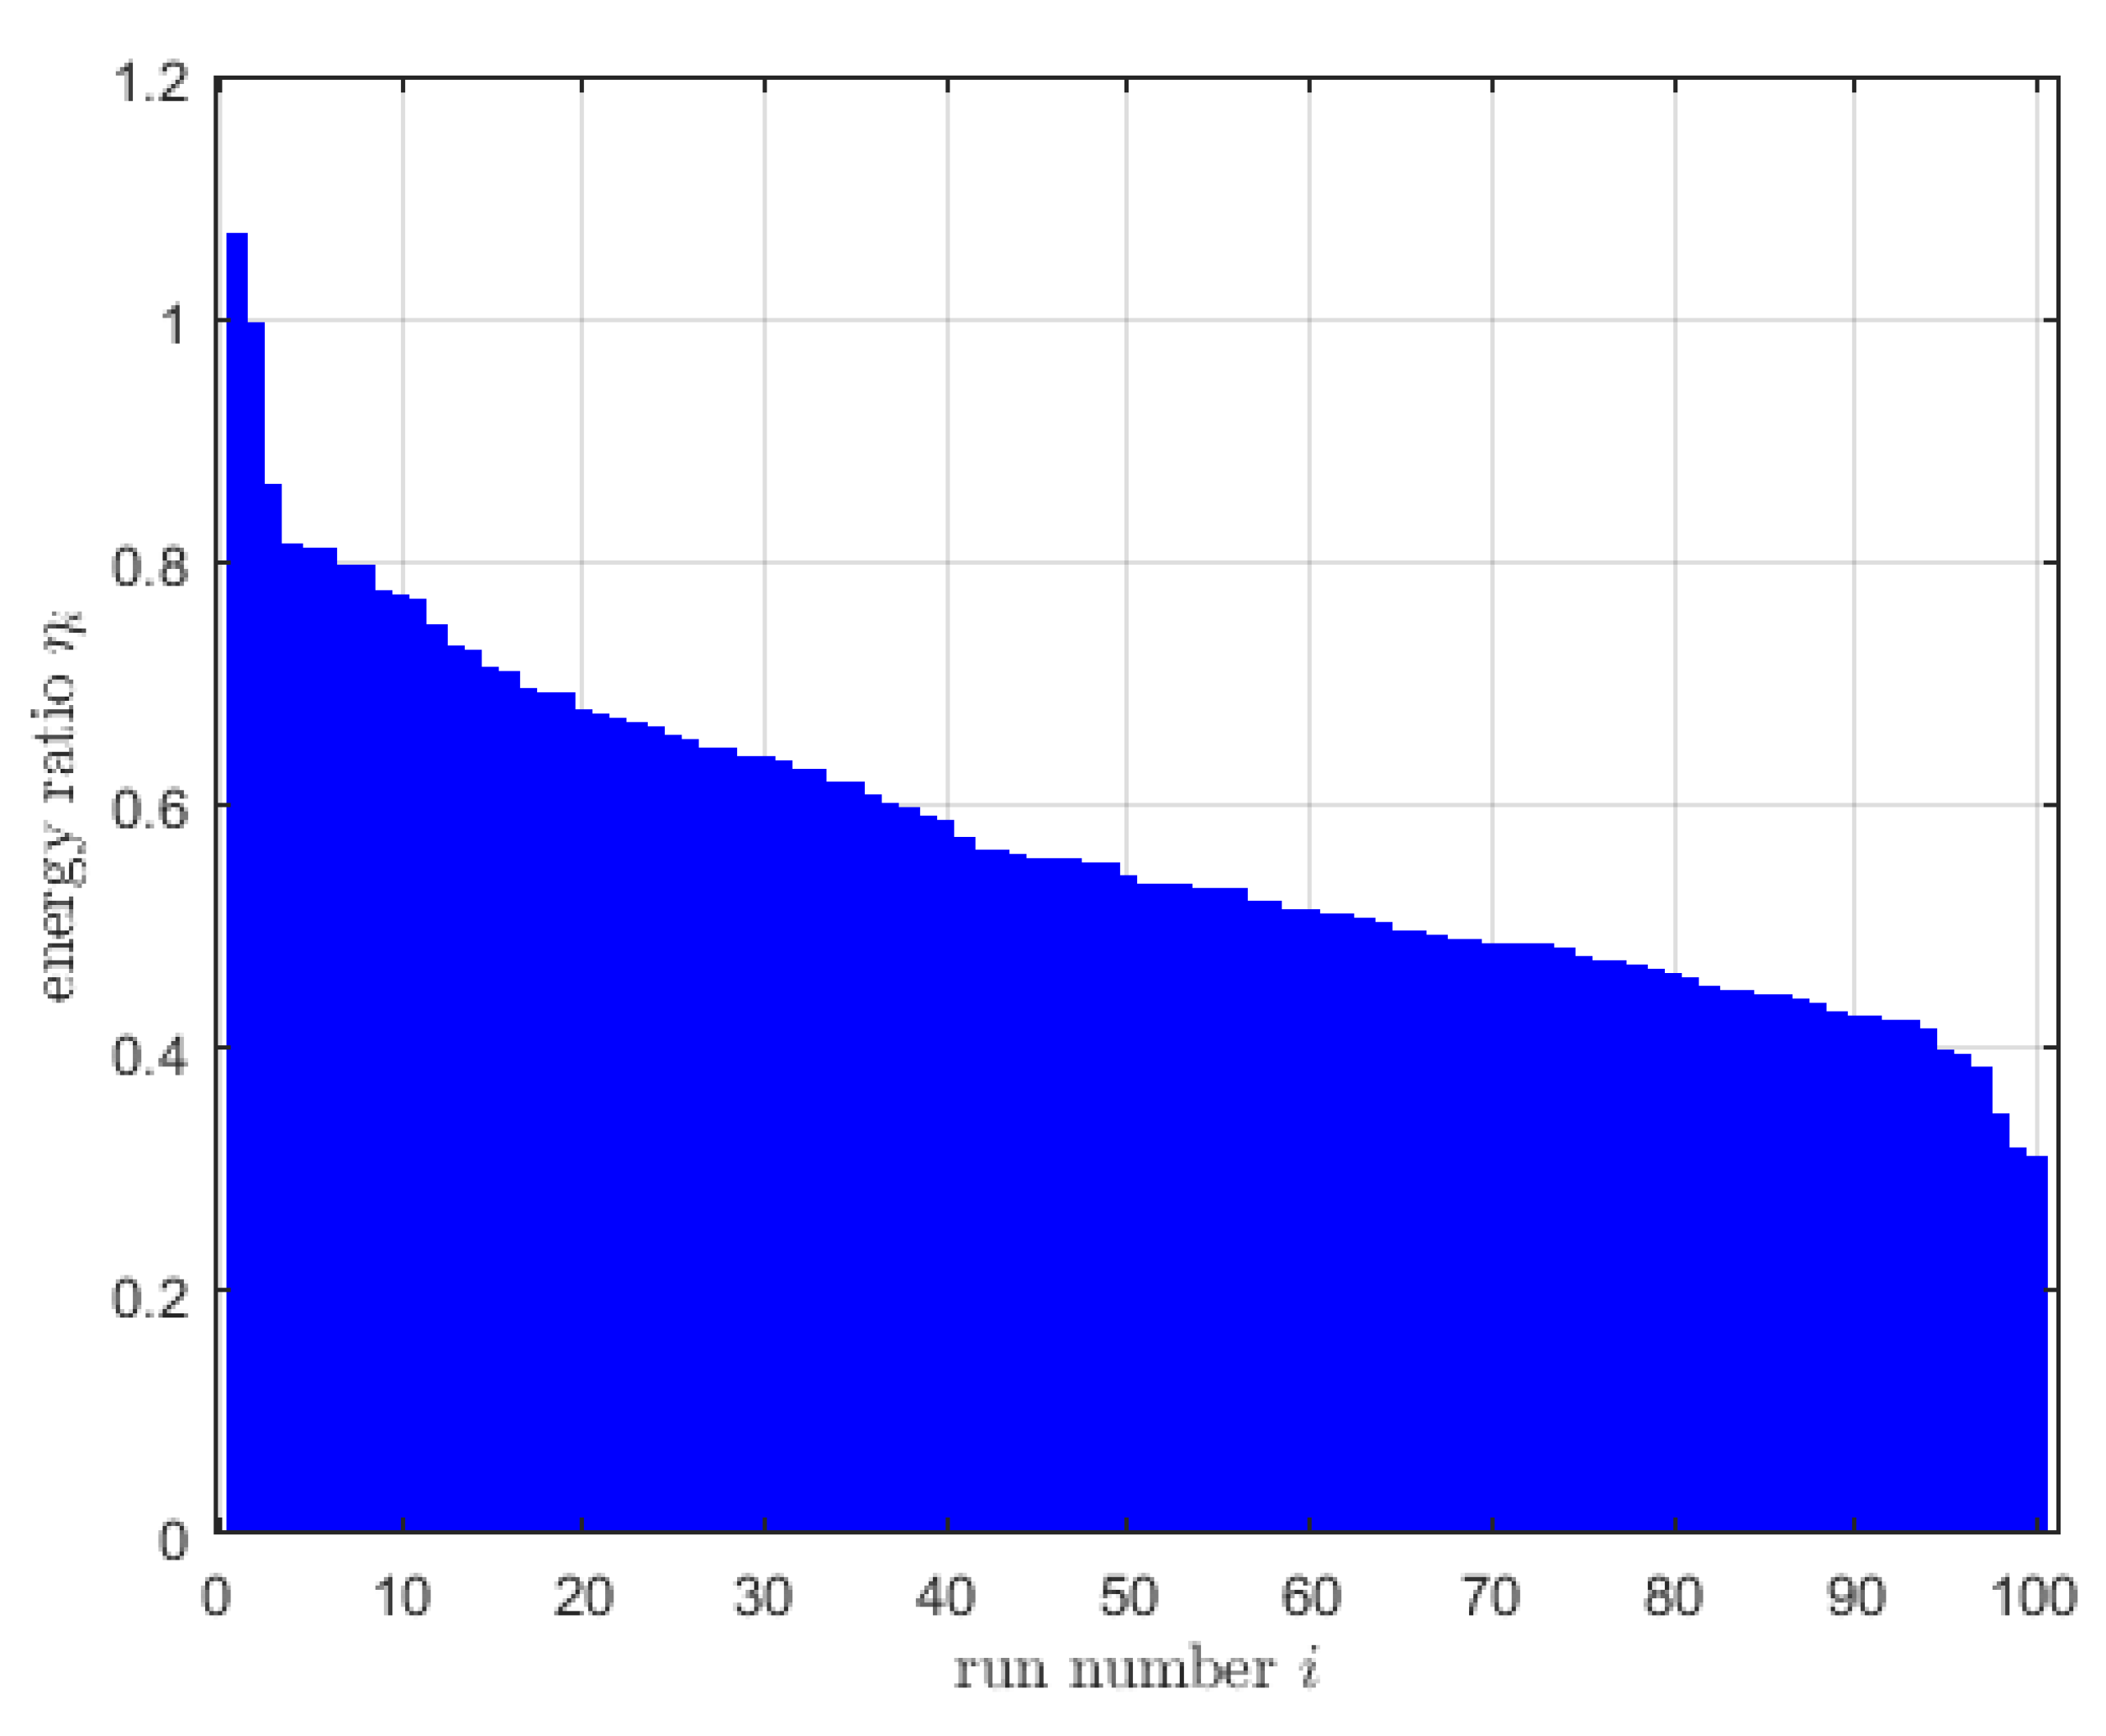
Section 3, the energy optimum is compared to energy consumption of various train runs on a specific railway line in real-life operation. As a result, the optimal strategy consumed only 63 % of the average energy demand of the unassisted runs in real operation.
2. Materials and methods
2.1. Model of train motion
The equation of motion of a train with an electric engine and both regenerative and mechanical brake can be given by
where
is tractive force,
is the force applied by the regenerative brake,
is the force of the mechanical brake,
is air drag,
is rolling friction,
is the downhill slope force,
is a coefficient representing rotating masses,
m is the mass and
a the acceleration of the train. This is Newton’s second law of motion with the extension that rotating masses as, for example, the wheels of the train, are accounted for by a factor
. A model of this type is commonly be used for train motion, see for example the review article of Scheepmaker, Goverde, and Kroon [
10] or the textbook of Ihme [
36]. According to Ihme [
36],
for passenger trains, depending on their length, where longer trains will generally have smaller values of
.
The tractive force
is limited by both engine power and rail friction (adhesion). According to Fassbinder [
37],
where
is the mechanical engine power used for traction,
v is the velocity of the train,
is the adhesion coefficient,
g is gravity, and
the mass of the locomotive. The adhesion coefficient
has been obtained experimentally in 1943 by Curtius and Kniffler [
38], see, e.g., Schlecht [
39], leading to the empirical relation
The adhesion coefficient attains a maximum value of when .
The regenerative brake force
is, as the tractive force, restricted by engine power and rail adhesion. However, it must be further limited to avoid a derailing of coaches behind the braking locomotive. Thus, for the regenerative brake force there holds
where
is the mechanical engine power for regenerative braking, and
is the additional limit to avoid derailing. In general,
will hold. According to [
40], the limit force
has been recently enlarged in Germany from
to
, a value that is also considered in Scheepmaker and Goverde [
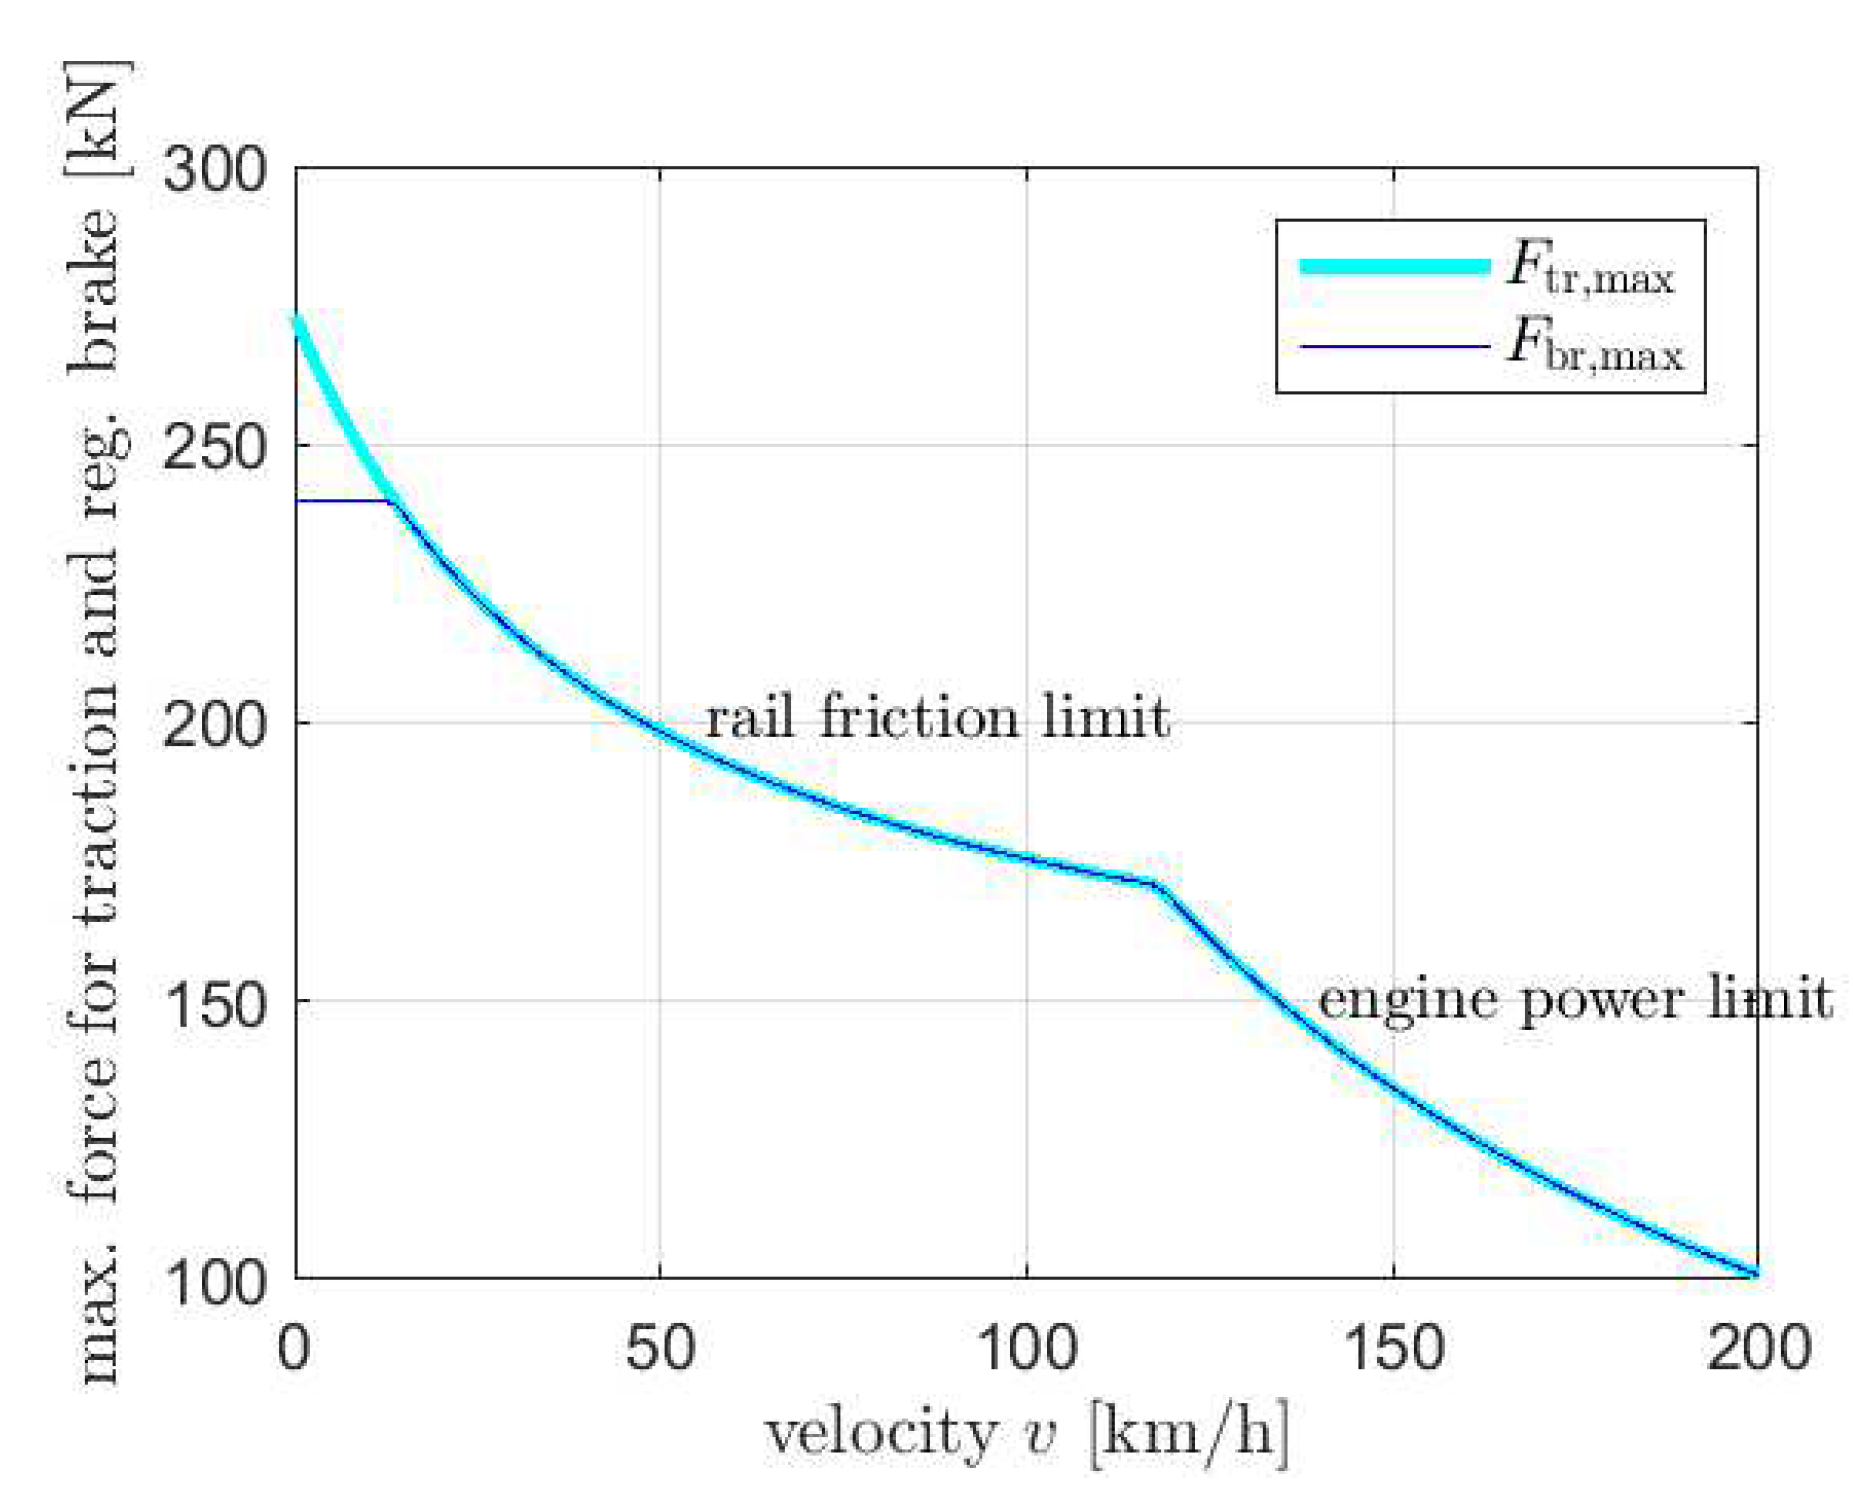
25]. The maximum forces
and
are shown in
Figure 1.
Remark. In practical operation, regenerative braking of trains is not possible when the speed is too small, meaning that for a final halt, the mechanical brake always has to be applied. This has been pointed out by Scheepmaker and Goverde [
25], who have estimated a minimum speed of
for application of regenerative braking based on data from Netherlands Railways. However, since kinetic energy below
is relatively small, we have neglected this consideration in our model.
When a train brakes, using the regenerative brake is clearly advantegeous with respect to saving energy. However, the force of the regenerative brake is limited and, especially for long freight trains, much weaker than the force of the mechanical brake. This is due to the fact that regenerative braking applies only to the wheels of the locomotive, while the mechanical brake acts on every wheel of the train. If the time required by timetable is too short for a certain distance, purely regenerative braking might not be sufficient. But, as Scheepmaker and Goverde [
25] have proven by means of optimal control theory, the mechanical brake is always ‘second choice’ in an energy-minimising solution. This means that mechanical braking is only applied when regenerative braking is operating at maximum force, i.e., when
holds. In the optimisation method presented here, the mechanical brake is not incorporated into the theory and will only be considered in the calculation of the fastest possible motion. This will be explained in more detail in the following sections.
The mechanical work applied for traction is given by
where
s is track length and
t is time. The electric energy required for traction is
The efficiency
of electric locomotives is usually given in a range of 83 to 87 percent [
25,
37,
41]. Within this paper, we will use an intermediate value of
. Likewise, the mechanical work applied for regenerative braking is
and the electric energy returned will be
We use a braking efficiency
according to Fassbinder [
37]. The difference
is called the net energy, which should be minimised.
In real operation, additional energy will be required that is not directly related to traction or brake, including energy for air commpression, air conditioning, lighting and so on. However, since this additional energy is mainly a function of time, it can not be reduced by a driving strategy when the total time is constant as given by the train’s timetable. Therefore, the additional energy does not enter the net energy minimisation problem and can be excluded here.
For air drag, Ihme [
36] recommends the so called
Hanover Formula that goes back to Voß, Gackenholz and Wiebels [
42]. It takes the form
with air density
. In this formula,
is
not the cross-sectional area of the train, but a reference area of
. The air drag coefficient
is calculated according to
n being the number of coaches. Ihme [
36] gives the values
,
,
,
as appropriate for Intercity coaches.
The rolling friction can be modelled by
with
according to Ihme [
36]. The downhill slope force is given by
where
z is the altitude of the track.
2.2. The maximum principle
The problem of minimising the net energy of a scheduled train can be formulated as an optimal control problem, as it has been proposed by Khmelnitsky [
1] who also presented an algorithm to obtain the unique net energy minimum. The algorithm of Khmelnitsky is essentially based on the maximum principle of optimal control theory that has been developed by Pontryagin, Boltyanskii, Gamkrelidze, and Mishchenko [
11,
12]. A variety of formulations of the maximum principle can be found in Hartl, Sethi, and Vickson [
35]. While some of the results of the maximum principle for the particular problem of a minimum energy train ride are already given in Khmelnitsky’s paper [
1], a direct derivation from the more general formulation of the maximum principle as presented in Hartl, Sethi and Vickson [
35] is not included in Khmelnitsky. We are, therefore, going to show this derivation here. In
Section 2.2, the maximum principle will be presented, based on the ‘Informal Theorem 4.1’ in [
35]. The subsequent
Section 2.3 contains the application to the train problem. Equipped with this general framework, extensions of the theory (for example the inclusion of the mechanical brake) are possible.
We consider the following problem: Let
s be the track length coordinate between two stations at
and
. The motion of the train is described by the time
it takes for the train to move from the first station to position
s. We assume
and a fixed duration
given by the timetable. The velocity
v of the train is restricted by a piecewise constant function
that accounts for speed limits on the track. Tractive and regenerative brake force,
and
, are limited according to (
2) and (
4), respectively. The optimisation problem is to find a motion, i.e., a function
, that minimises the net energy
.
We introduce some notation, closely following Khmelnitsky [
1]. Let
be the kinetic energy of the train. Dividing by
leads to a specific kinetic energy
limited by speed restrictions:
. Likewise, a specific potential energy is defined by
A total specific mechanical energy is then given by
. In the same way, specific forces are defined as
A total recuperation efficiency is given by
. The aim of minimising the net energy
is equal to maximising
With this notation, the optimisation problem can be written in the following canonical form:
state vector
control vector
state differential equations
state boundary conditions
state constraint
control constraints and
Remark. Further constraints could be added here, especially and . However, will always hold for the energetic optimum solution inside the intervall . The condition follows from (21), (23), and . Therefore, conditions and need not be set explicitly as a constraint. Simultaneous traction and brake, i.e. and for the same s, is also not explicitly prevented by a constraint since such a solution will surely not be energetically optimal.
Remark. In equation (
20), we have excluded mechanical braking. This means that, in accordance with Khmelnitsky [
1], we formulate the optimisation problem only for purely regenerative braking. An extension of the presented theory to the case with simultaneous application of both regenerative and mechanical brake is possible in a straightforward manner, and is, in a slightly different formulation, given by Scheepmaker and Goverde [
25].
Introducing the notation
we have an optimisation problem of the form given in Hartl, Sethi and Vickson [
35]:
In Hartl, Sethi, and Vickson [
35], the problem is formulated with a time
t being the independent variable instead of
s. This is due to the fact that many practical optimisation problems are formulated in a time-dependent way. In our case, however, the position-dependent formulation has some advantages, especially since also the speed restriction depends on position, not on time.
The function
with Lagrange multipliers
is called the
Hamiltonian of problem (
31)-(34). (Here and in the following,
means the transposed of a column vector, i.e.
is the scalar product of vectors
and
.) The Lagrange multipliers
are also called the
costates of the problem. In order to agree with the notation of Khmelnitsky [
1], we denote the costates according to
Furthermore, the
Lagrangian is introduced by
where
and
are also called Lagrange multipliers. The Lagrange multipliers
,
and
are continuous functions in
s, except for positions
where
.
The ‘Informal Theorem 4.1’ of Hartl, Sethi, and Vickson [
35] states the following necessary conditions for
to be a solution of the optimisation problem (
31)-(34):
The control vector
maximises the Hamiltonian
H pointwise for any
.
The
costate equation
is satisfied.
Let
be the components of vector
, and
be the components of vector
. There holds
for all
i and all
. This is called
complementary slackness in Khmelnitsky [
1].
Another complementary slackness condition,
holds for all
.
-
The following jump condition is satisfied: At every point
where
is discontinuous, there exists a number
with
Here, the argument
corresponds to the left-hand limit, and
to the right-hand limit at
. The vector equation (
43) is meant component-wise.
The Hamiltonian maximisation condition (
38) is called the
Pontryagin Maximum Principle, and equations (
39)–(
42) are referred to as the
Karush-Kuhn-Tucker (KKT) conditions [
43,
44]. In Hartl, Sethi, and Vickson [
35], the maximum principle is presented also for the case of multiple state constraints, i.e., when
h is extended to a vector. The maximum principle does not, as we shall see, tell the solution to the energy minimisation problem directly, but it provides essential information such that a construction of the solution becomes possible in an iterative trial-and-error process.
2.3. Application of the maximum principle to the energy minimisation problem
From the costate equation (
40) it follows for the second component of
since
L does not depend explicitly on
t. Equation (
43) gives, again for the second vector component,
Thus, the Lagrange multiplier
is a constant. Equation (
39) results in
From the costate equation (
40), first component, we have
When travelling below the speed limit, i.e.
, then
holds due to (
42). (In Khmelnitsky’s notation,
and
are called
and
, respectively.) We now apply a case distinction to the multiplier
, and evaluate
,
, and the
using the conditions (
38), (
41), (
48), (49), and the continuity of the multipliers. The results are given in
Table 1.
From the values given in
Table 1 it follows that, in the interior of the state domain,
and
can be directly expressed in terms of
:
The cases indicated in
Table 1 are the only driving modi that are possible for the optimum solution of the problem. This means that the interval
can be completely segmented into subintervals
with
, where every subinterval
corresponds to one of the drive modi
full traction,
partial traction,
coasting,
partial regenerative brake, and
full regenerative brake. The cases
full traction,
coasting, and
full regenerative brake are regular in the sense that the control variables
and
are both defined, and therefore the equation of motion is completely given by the underlying physics. On the contrary, the modi
partial traction and
partial brake are singular, meaning that here only one control variable is defined. Therefore, they need some additional consideration. We will distinguish the following four cases:
Case 1: partial traction below speed limit. Let
be an interval of
partial traction in the interior of the state domain, i.e., an interval where
and
hold. It follows
on this interval, see
Table 1. The costate equation (
50) reduces to
with
being a known and monotonely increasing function in
K. Moreover, the function value
is strictly positive for
. Since
is constant, we have
where
stands for the inverse function of
R. This means that, for the optimal solution,
partial traction in the interior of the state domain is only possible at constant speed with
. From equation (
54) it follows that
must hold.
Case 2: partial regenerative brake below speed limit. Likewise, if
be an interval of
partial regenerative brake in the interior of the state domain, then
and
will hold, and the costate equation now reads
Since
is constant,
holds, meaning that
partial regenerative brake in the interior of the state domain is only possible at constant speed with
. (In Khmelnitsky [
1], the constants
and
are called
and
, respectively.)
Case 3: partial traction on the speed limit. Let be an open interval of partial traction on the speed limit. Then for . Both and are unknown, but the equation of motion is entirely determined by the speed limit with and . Since is piecewise constant, and v can not be discontinuous, v, , K, and must be constant in the interval .
Case 4: partial regenerative brake on the speed limit. Likewise, if is an open interval of partial regenerative brake on the speed limit, then for . Both and are unknown in this case, but the equation of motion is again entirely determined by the speed limit with and . Both and must be constant on , using the same argument as in Case 3.
Remark. In recent literature (not in Khmelnitsky), the constant speed driving regimes are often called cruising.
2.4. The algorithm of Khmelnitsky for fixed
In this section we are going to desribe the algorithm of finding a solution to the optimisation problem under the assumption that the Lagrange multiplier
is a given number. Then,
and
are defined according to (
54) and (
56), respectively. Following Khmelnitsky [
1], we define intervals with possible constant speed that correspond to the four cases studied in
Section 2.3. In the case of constant speed,
holds, and the state differential equation (
20) takes the form
Definition 1.
A sub-interval I of with
for all that cannot be extended, i.e., any enlargement of the interval would violate (58), is called a PT-interval. PT stands for partial traction.
Definition 2.
A sub-interval I of with
for all that cannot be extended is called a PB-interval. PB stands for partial regenerative brake.
Definition 3.
A sub-interval I of with
for all that cannot be extended is called a PT-SL-interval. PT-SL stands for partial traction on speed limit.
Definition 4.
A sub-interval I of with
for all that cannot be extended is called a PB-SL-interval. PB-SL stands for partial regenerative brake on speed limit.
Intervals of type PT, PB, PT-SL, and PB-SL are intervals where a constant speed motion of the optimum solution would be allowed by the control constraints. Those intervals are summarised under the name
pcs-intervals, meaning ‘possible constant speed’. (In Khmelnitsky [
1], PT is called
minor grade, PB is called
steep fall, PT-SL is called
minor grade imitation, and PB-SL is called
steep fall imitation.) Due to their definition, pcs-intervals will never intersect. In this paper, the start point at
, the pcs-intervals, and the stop point at
are summarised under the name
ports. Additional
speed limit ports might be introduced as will be explained later. All ports are numbered in the order of increasing
s.
The optimal solution is found by connecting ports by trajectories of regular motion, namely full traction, coasting, or full regenerative brake. Below the speed limit, regular motion is governed by the differential equations
with
and
and
as defined in (
51) and (), respectively. Equation (
62) follows from (
20) and
Table 1, while () results from (
50). Since
u is discontinuous at
and
, the trajectory of
K will have a kink point whenever
crosses these values.
It follows from the maximum principle that if the optimal solution touches the speed limit at a position
, then
and
might be positive by equation (45). This means for the first component of equation (
43),
i.e.,
might have a positive jump whenever the speed limit is attained. The height of this jump, however, is not defined in the maximum principle. It must be found by one-dimensional search.
If one tries to connect the ports A and B by a trajectory of regular motion, and this trajectory violates the speed limit, then a connection from A to B is not possible by this trajectory. In this case, one looks for a connection to the speed limit itself. If a trajectory is found that touches the speed limit in a single point, a new port is inserted there. It is called a speed limit touchpoint (SL-TP). Ports are now renumbered to be in the order of increasing s again. If the new speed limit touchpoint is located between the begin and the end position of a pcs-interval, then numbering is done such that the speed limit touchpoint comes first. If the speed limit touchpoint has number i, the -value of the incoming trajectory is stored as . At the speed limit touchpoint, is allowed to have a positive jump. A connection of ports in order to construct the optimal solution is only allowed in the direction of increasing port numbers.
When a trajectory of regular motion leaves a port, it is called a take-off, when it arrives at a port, it is called a landing. When trying to connect a port A with a port B by a trajectory of regular motion, there is always one of the variables s, K, and not fixed at both take-off and landing. These variables can be adjusted to make the connection possible. The following cases of take-off and landing can exist:
(T1): take-off from the start point at with . The value of is not fixed, but must be greater than 1 since full traction is applied.
(T2): take-off from interval of type PT with and , with some small . Since is discontinuous at , the trajectories of K will leave in different directions depending on the choice of slightly above or below 1, so both must be checked. The take-off position s is not fixed.
(T3): take-off from interval of type PB with and , again with some small . The take-off position s is not fixed.
(T4): take-off from interior of a PT-SL interval with and . The take-off position s is not fixed.
(T5): take-off from the end of a PT-SL interval with and , since a jump in is allowed here.
(T6): take-off from interior of a PB-SL interval with and . The take-off position s is not fixed.
(T7): take-off from the end of a PB-SL interval with and , since a jump in is allowed here.
(T8): take-off from an SL-TP with number i: start with and , since a jump in is allowed here.
(L1): landing on PT interval with and . The landing position s is not fixed.
(L2): landing on PB interval with and . The landing position s is not fixed.
(L3): landing on the start of a PT-SL interval with and . Then, a new speed limit touchpoint is inserted at the landing position, is connected with the PT-SL interval, and port renumbering is done such that the new speed limit touchpoint comes before the PT-SL interval. If the new speed limit touchpoint has number i, the -value of the incoming trajectory is stored as .
(L4): landing on the start of a PT-SL interval with and . Since any jump of here would lead to full traction, it would violate the speed limit. Therefore, no new speed limit touchpoint is inserted.
(L5): landing on the interior of a PT-SL interval with and . The landing position s is not fixed.
(L6): landing on the start of a PB-SL interval with and . Then, a new speed limit touchpoint is inserted at the landing position, is connected with the PB-SL interval, and port renumbering is done such that the new speed limit touchpoint comes before the PB-SL interval. If the new speed limit touchpoint has number i, the -value of the incoming trajectory is stored as .
(L7): landing on the start of a PB-SL interval with and . Since any jump of here would lead to coasting, it would violate the speed limit. Therefore, no new speed limit touchpoint is inserted.
(L8): landing on the interior of a PB-SL interval with and . The landing position s is not fixed.
(L9): landing on an SL-TP with . The -value of the incoming trajectory is stored, and is allowed to jump here.
(L10): landing on the end point at with . The value of is not fixed.
The construction of an optimal solution is best illustrated using a numerical example.
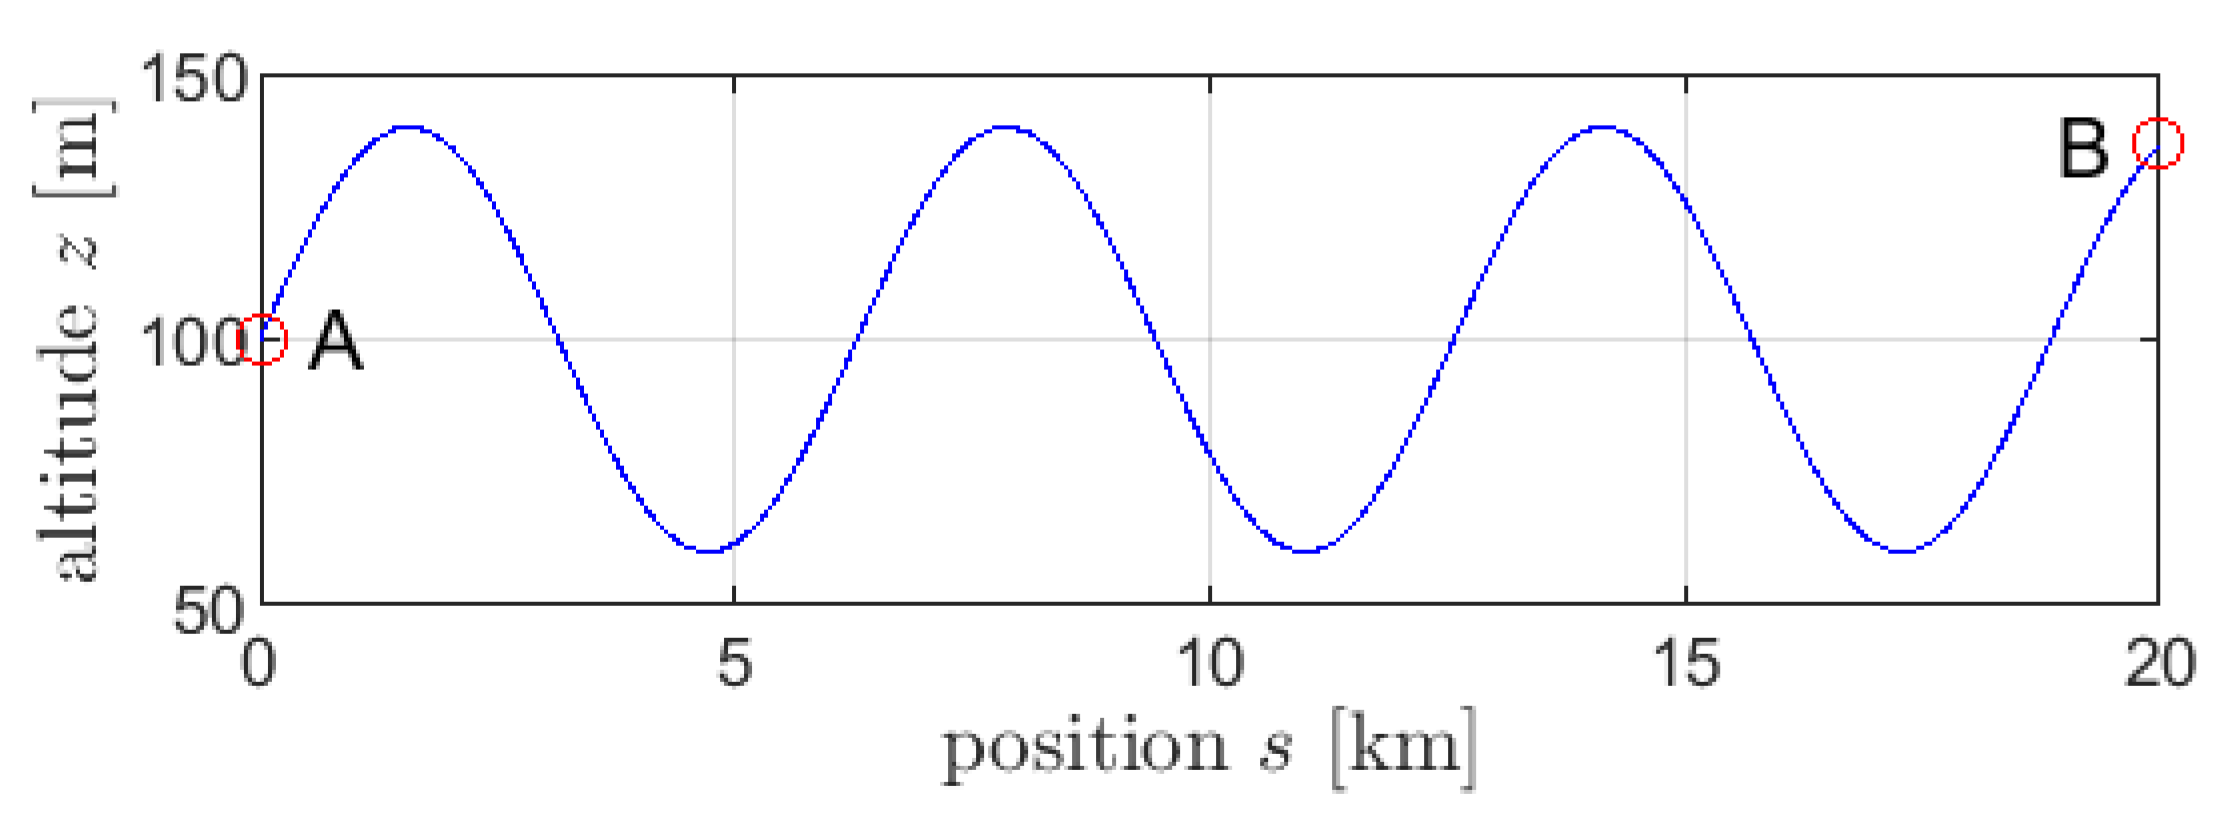
Example 1. A train is driven from Station A at
to Station B at
. The altitude is given by
, see
Figure 2. Parameters are set according to
Table 2.
In Example 1, no speed limit is assumed, and we consider the case
. Equations (
54) and (
56) lead to
and
.
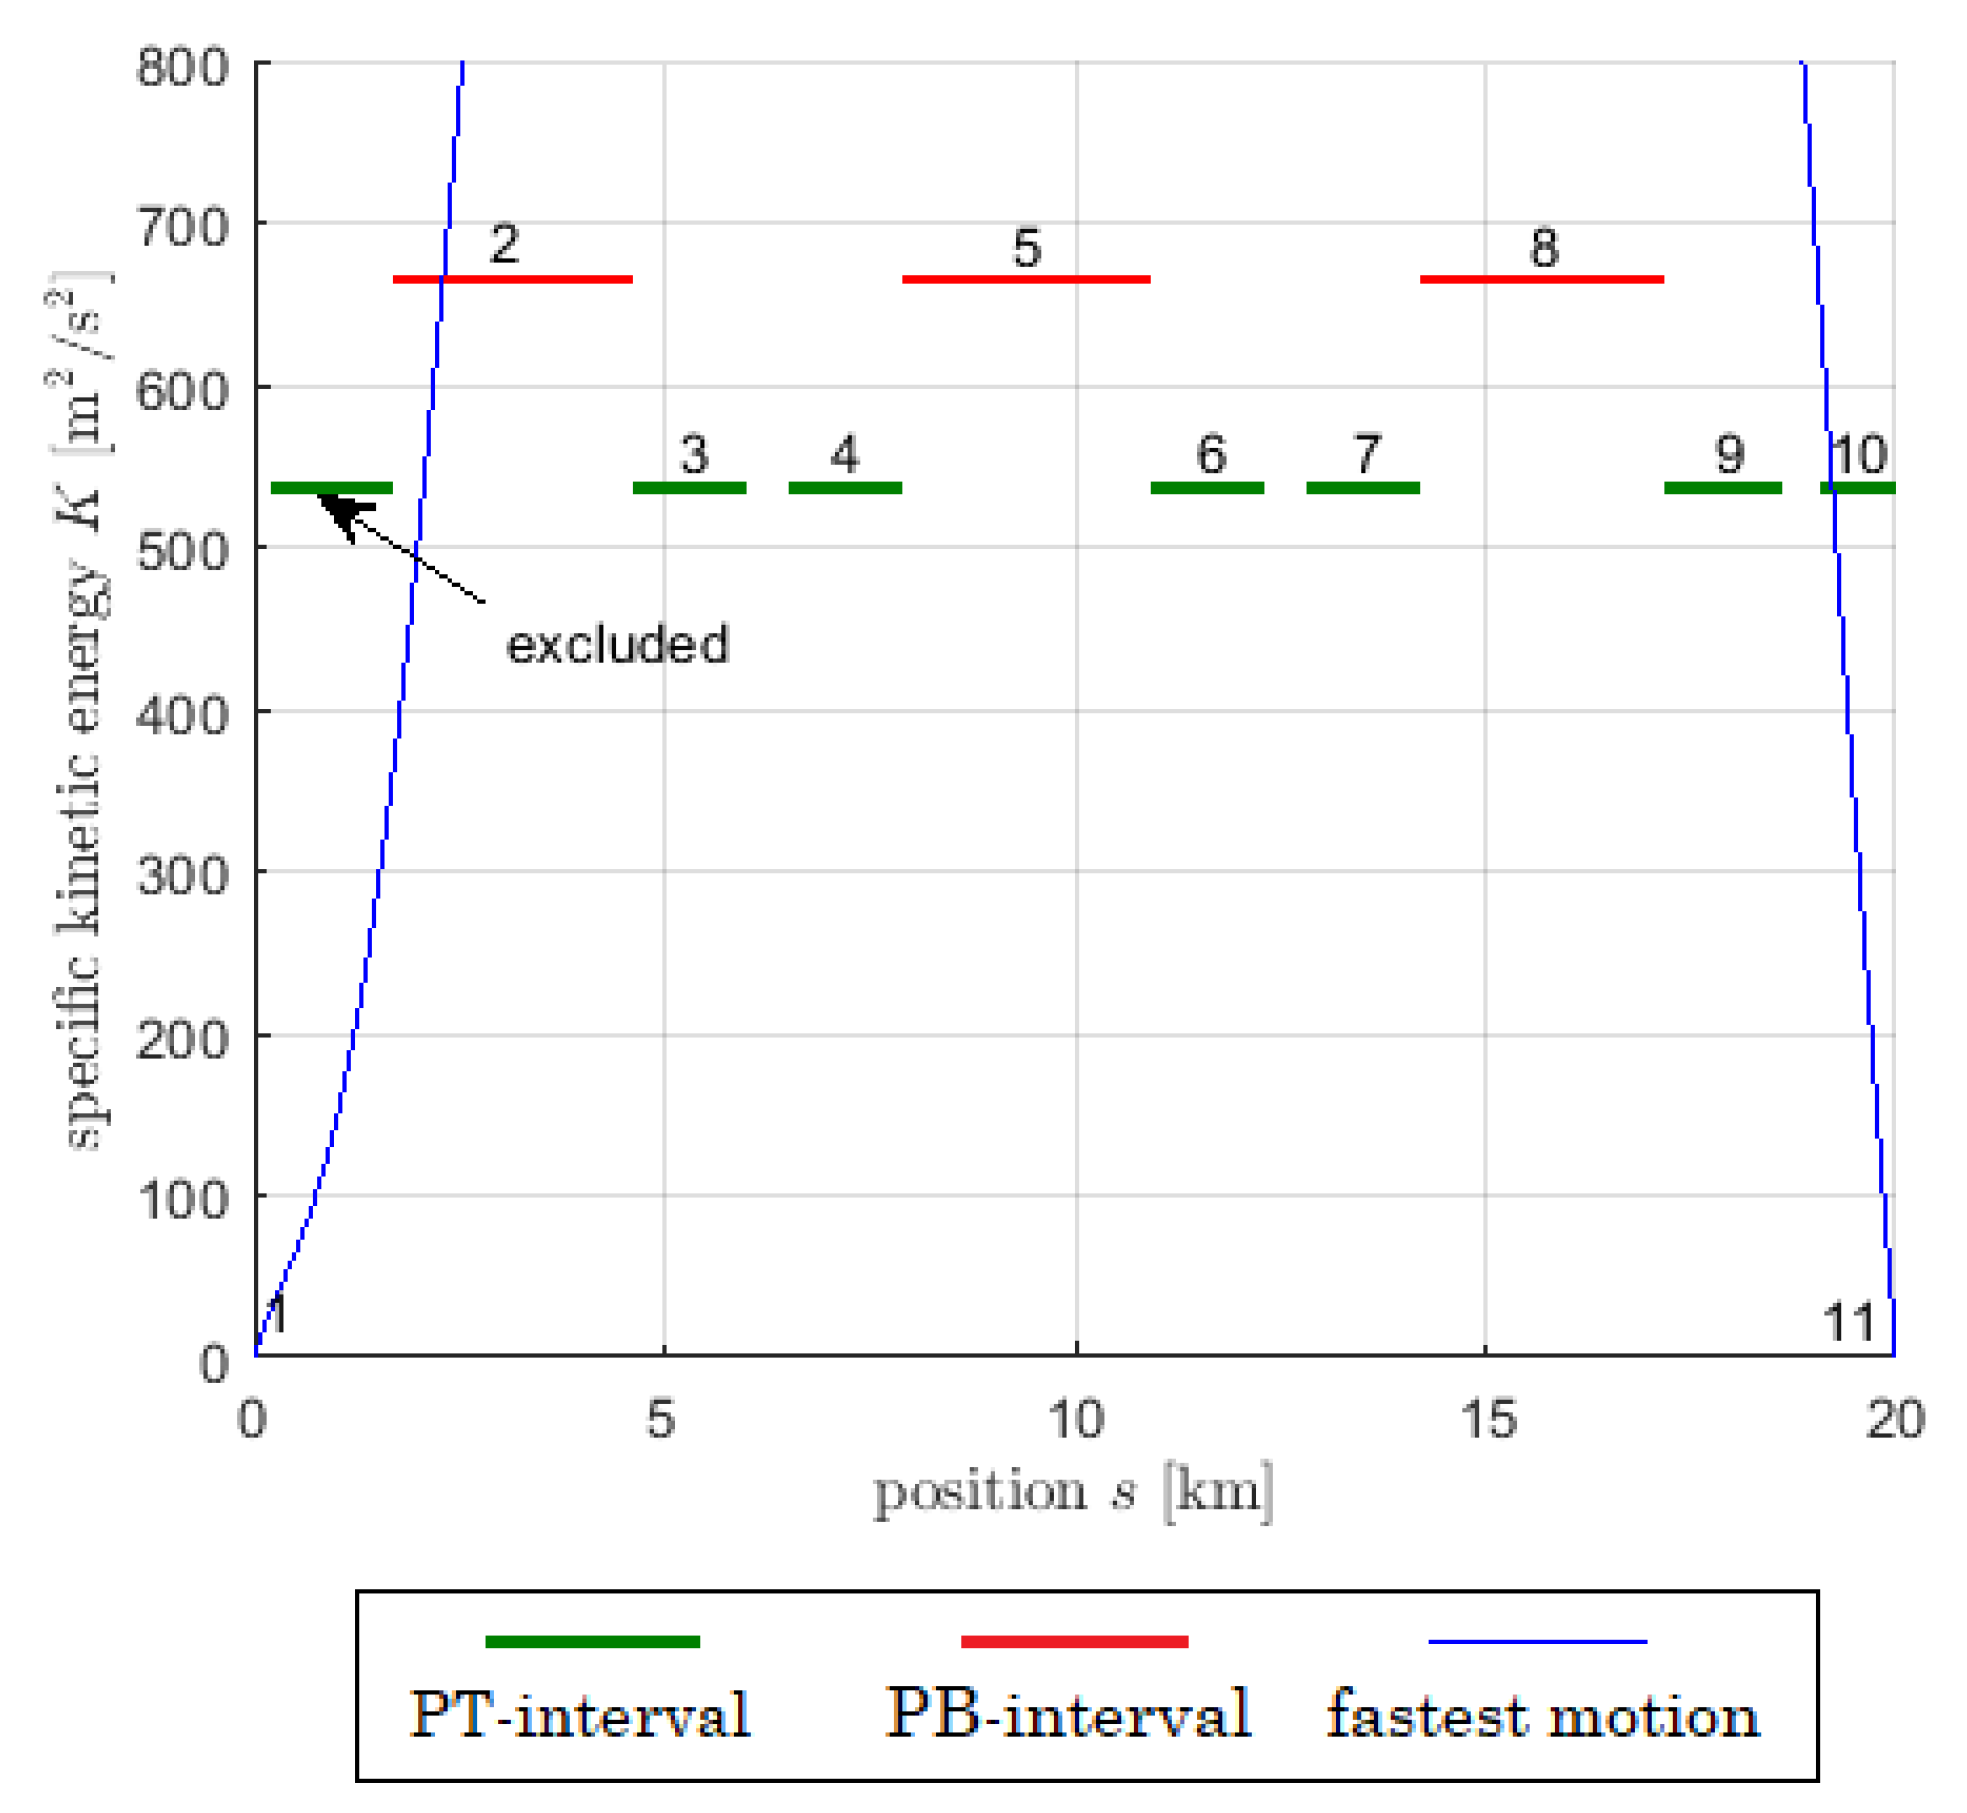
Figure 3 shows the pcs-intervals calculated with equations (
58) to (
61), together with the kinetic energy of fastest motion. In our example, this leads to the exclusion of the first PT-intervall since it cannot be reached.
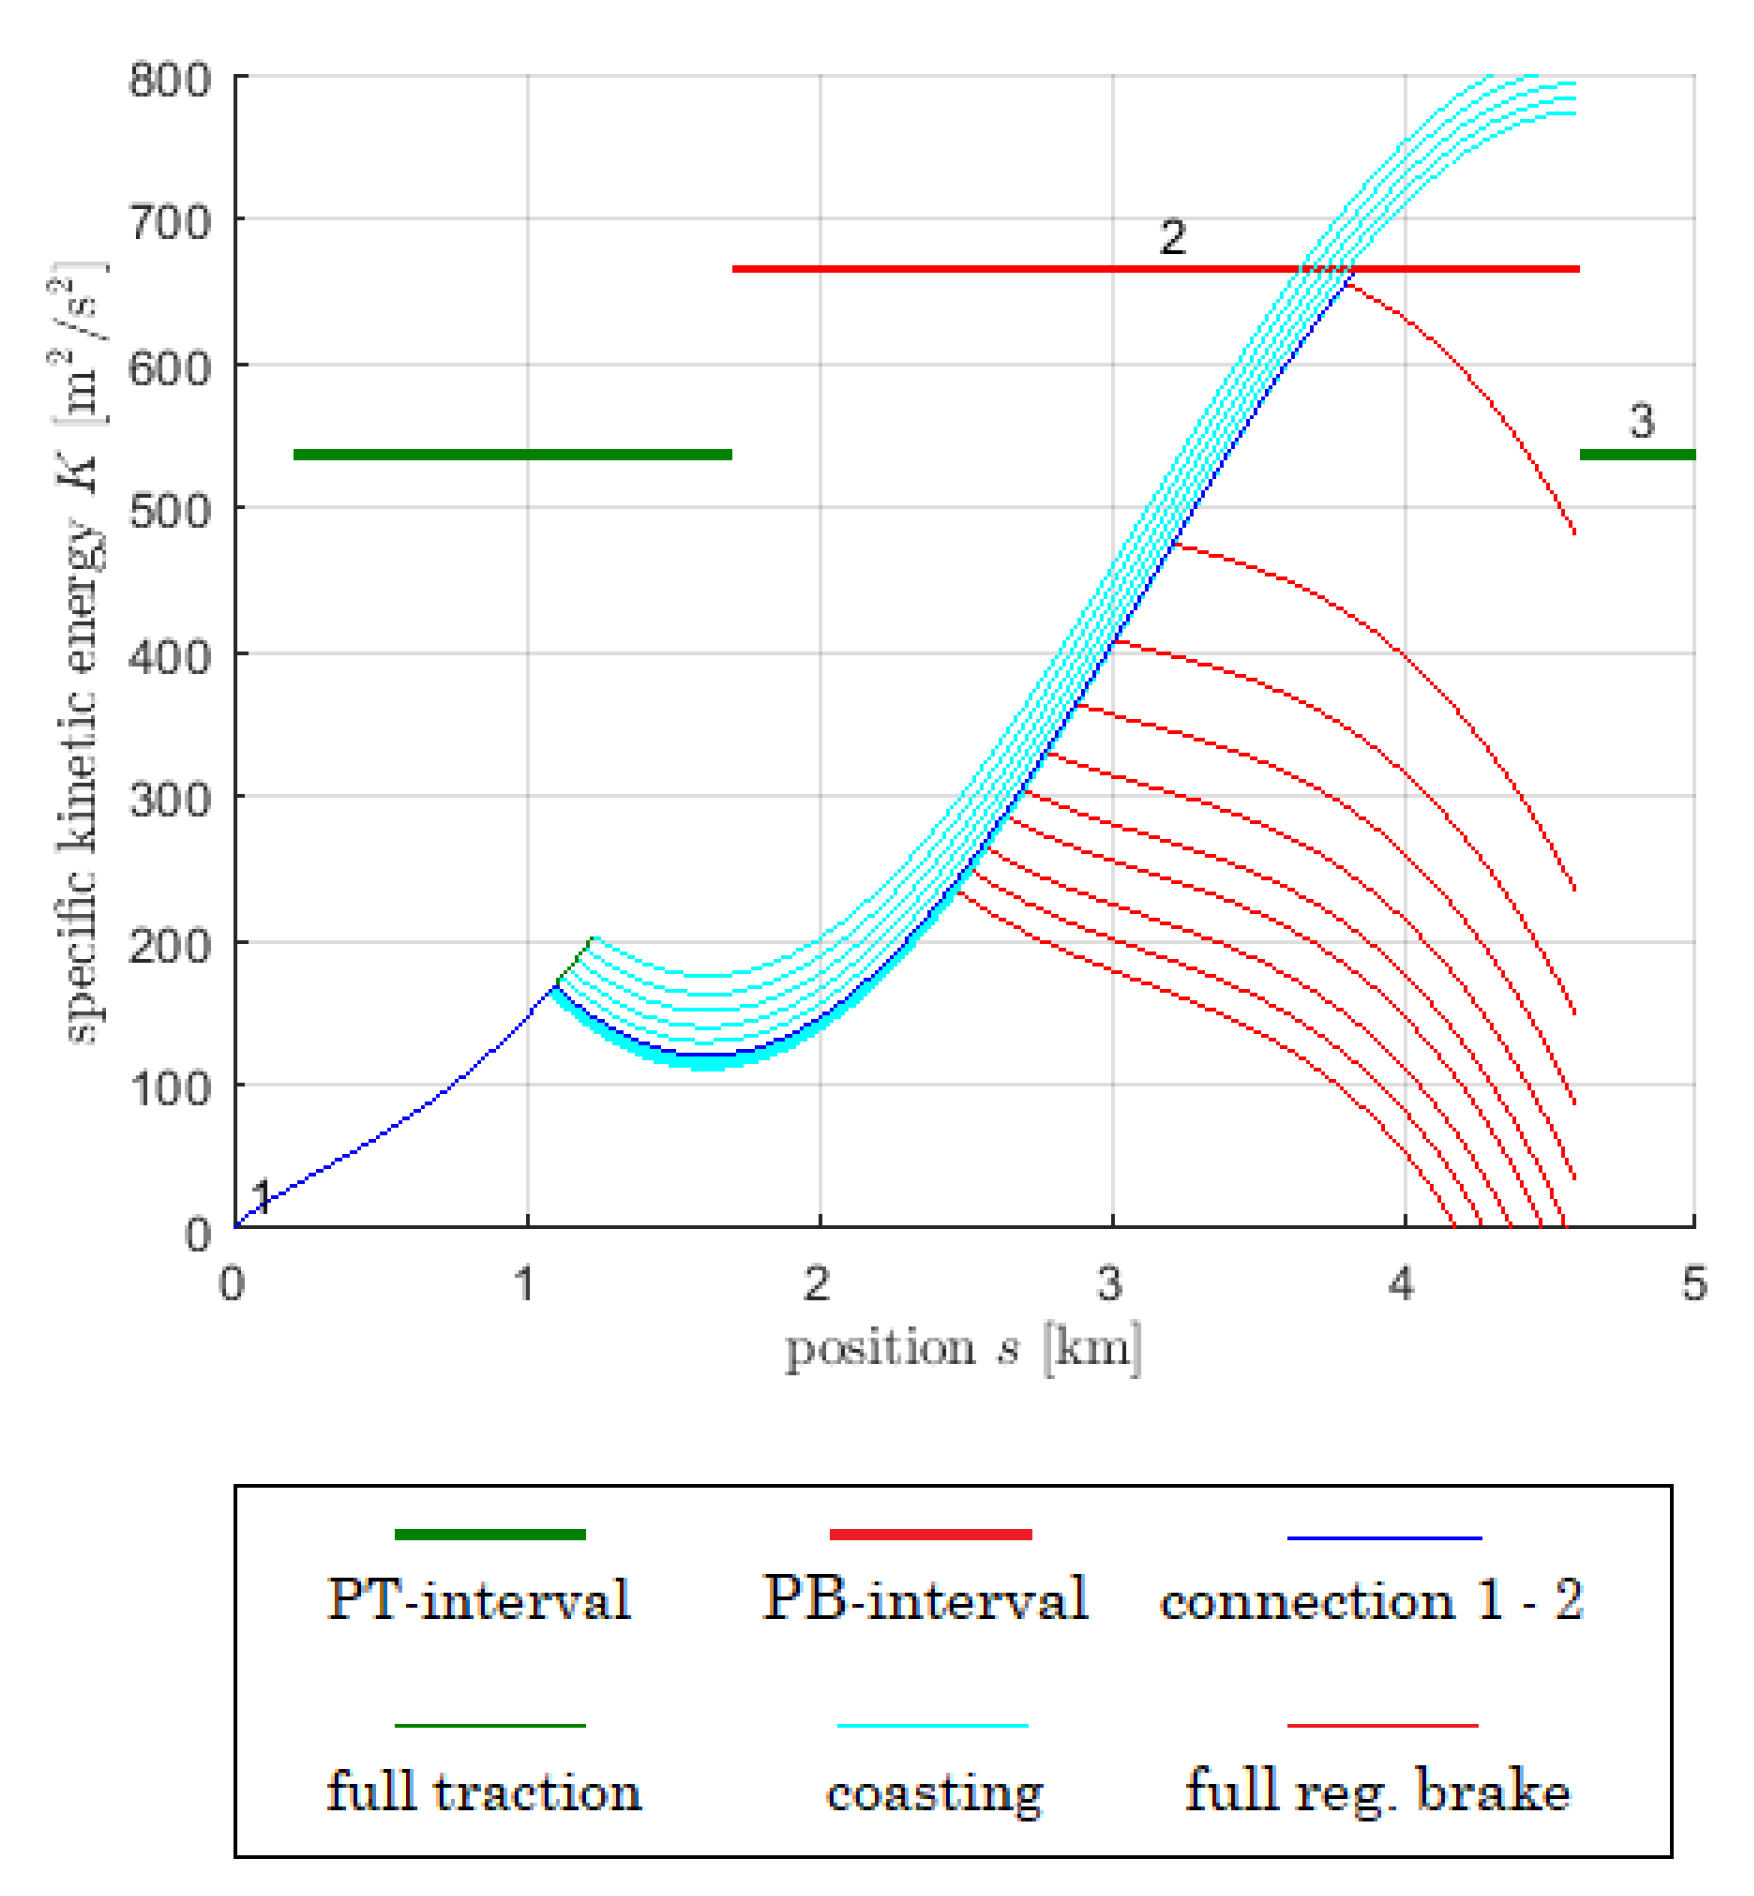
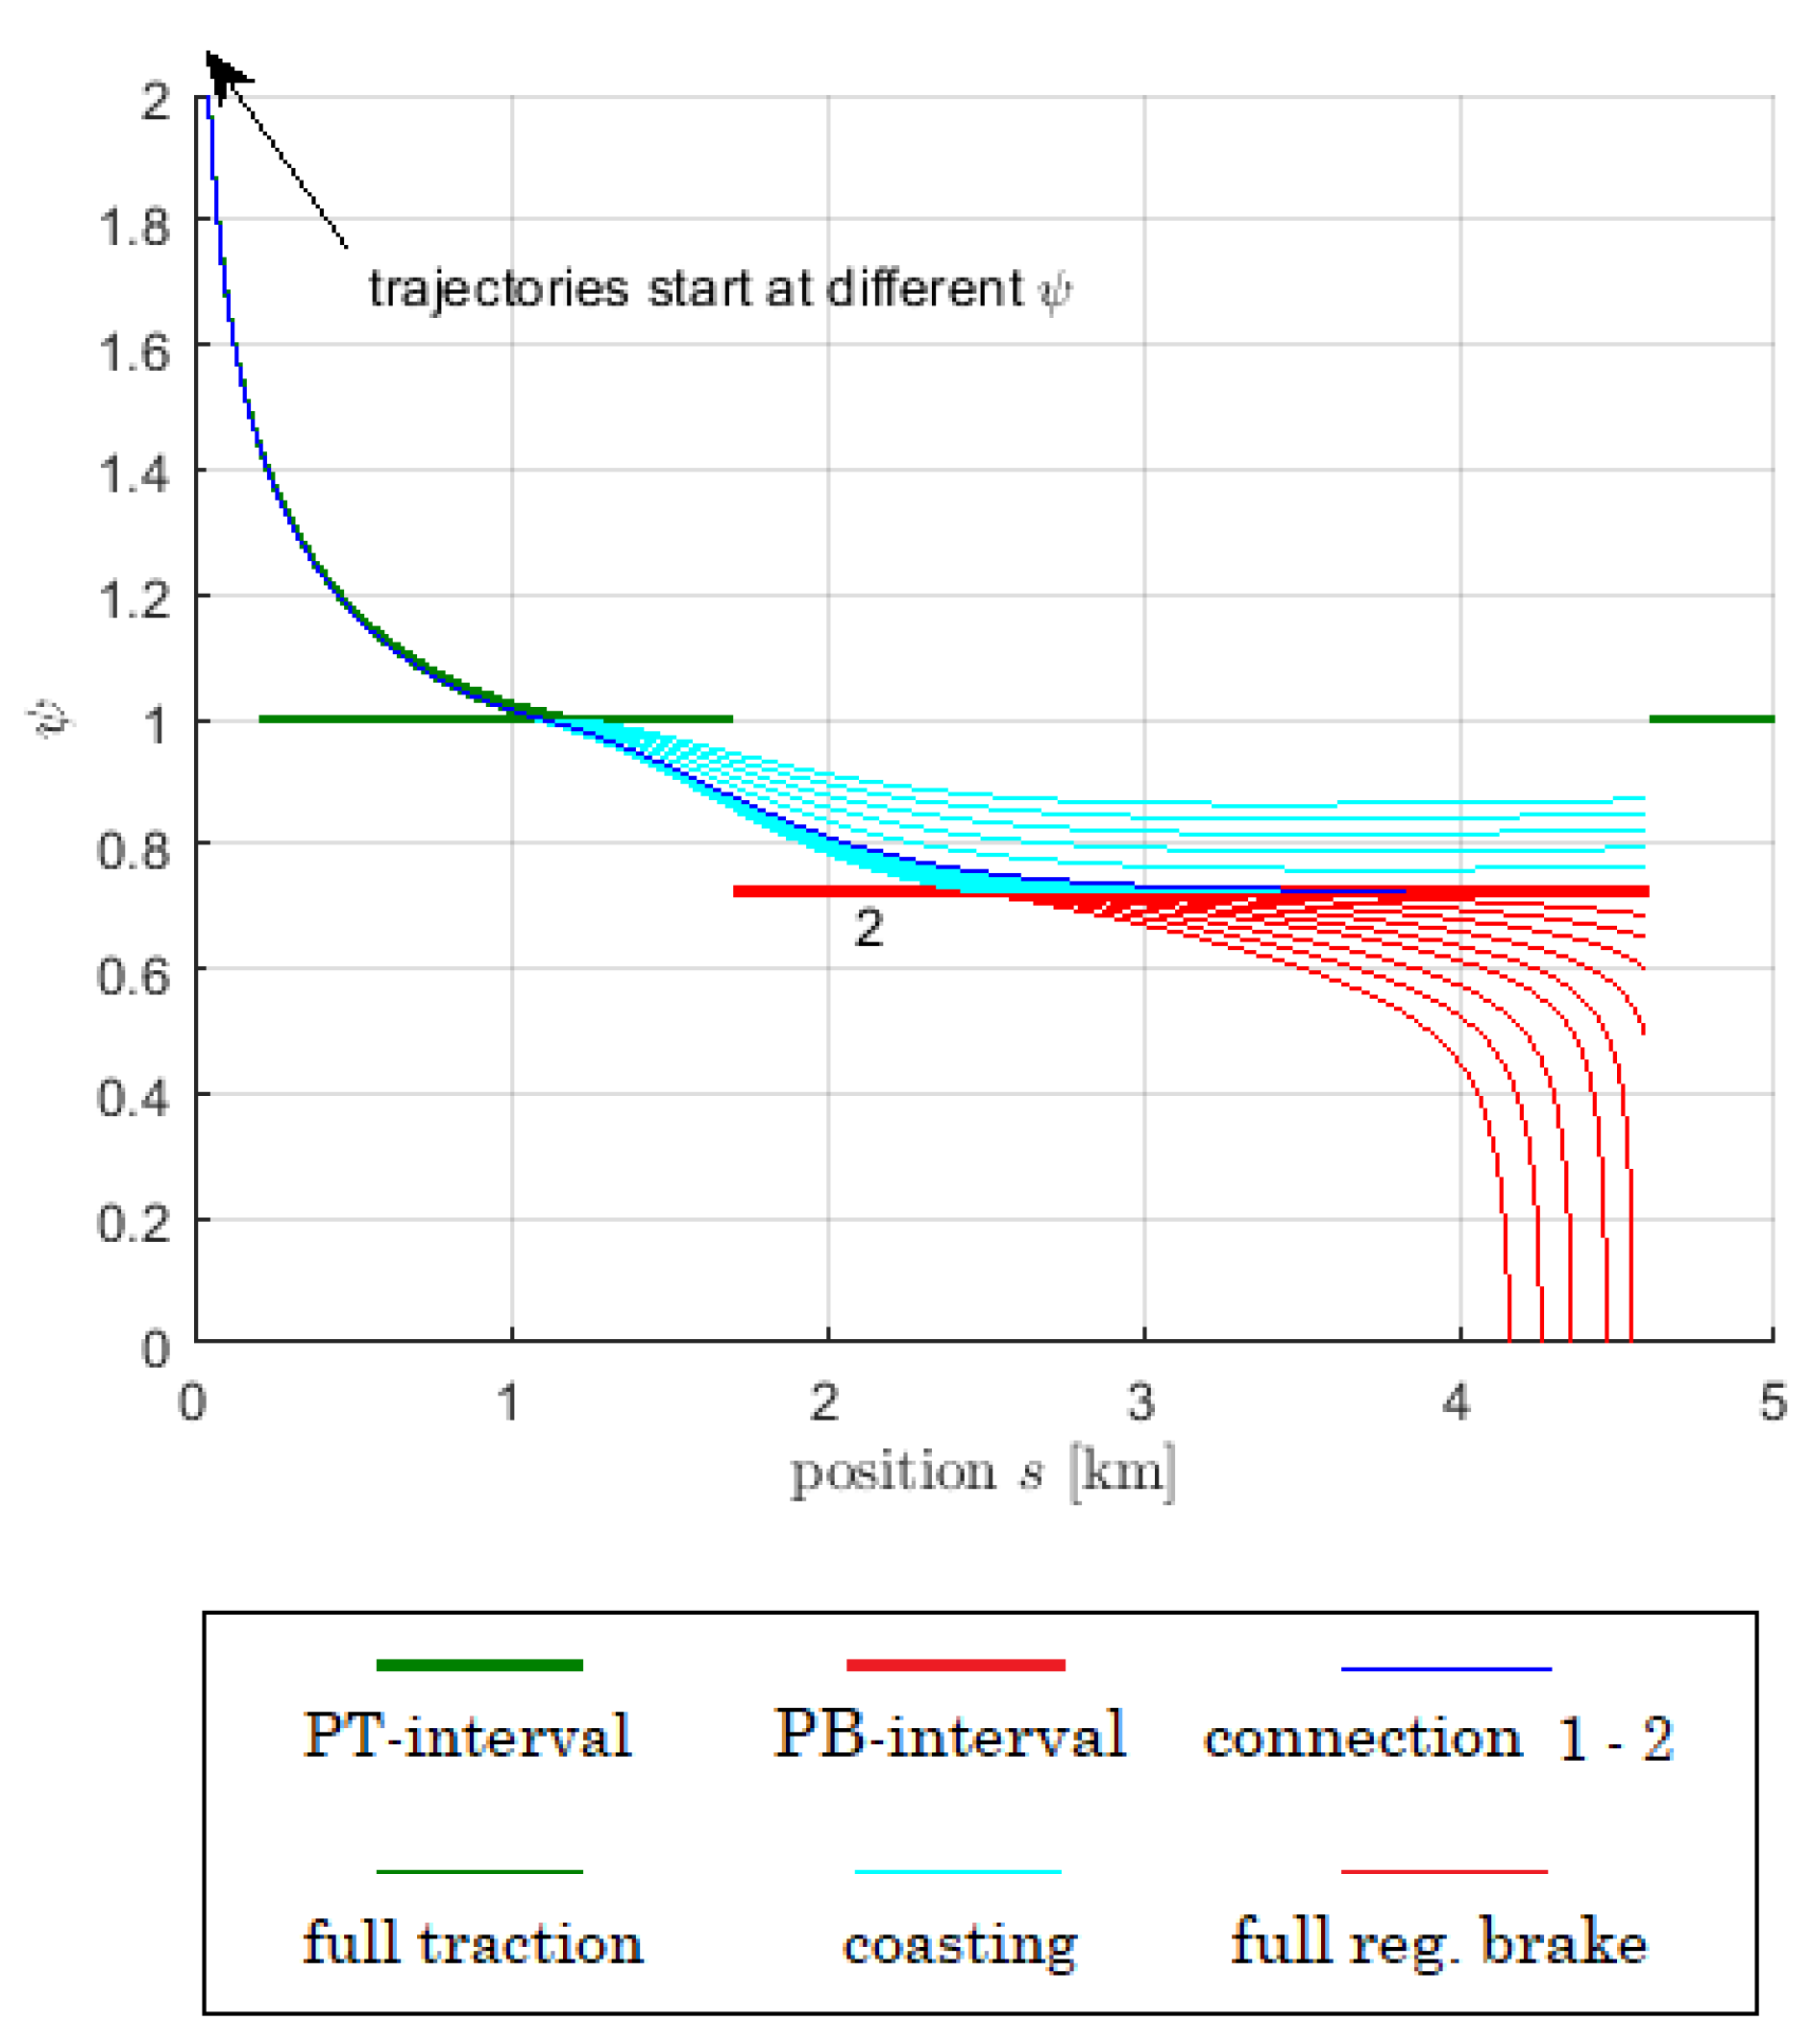
The first step in connecting ports would be the take-off from the start point at
. This is take-off case (T1). The trajectories of
K and
are calculated according to equations (
62) and (63). Different values of
at
lead to different trajectories that are shown in
Figure 4 and
Figure 5. When the
-trajectory crosses the value 1, full traction changes to coasting, and the corresponding
K-trajectory has a kink point. When the
-trajectory crosses the value
, coasting changes to full regenerative brake, and the corresponding
K-trajectory has a kink point again. The blue line marks the only trajectory that would land on the PB-interval with number 2 (landing case (L2)). It is found by iterative bisection of the
-values at
.
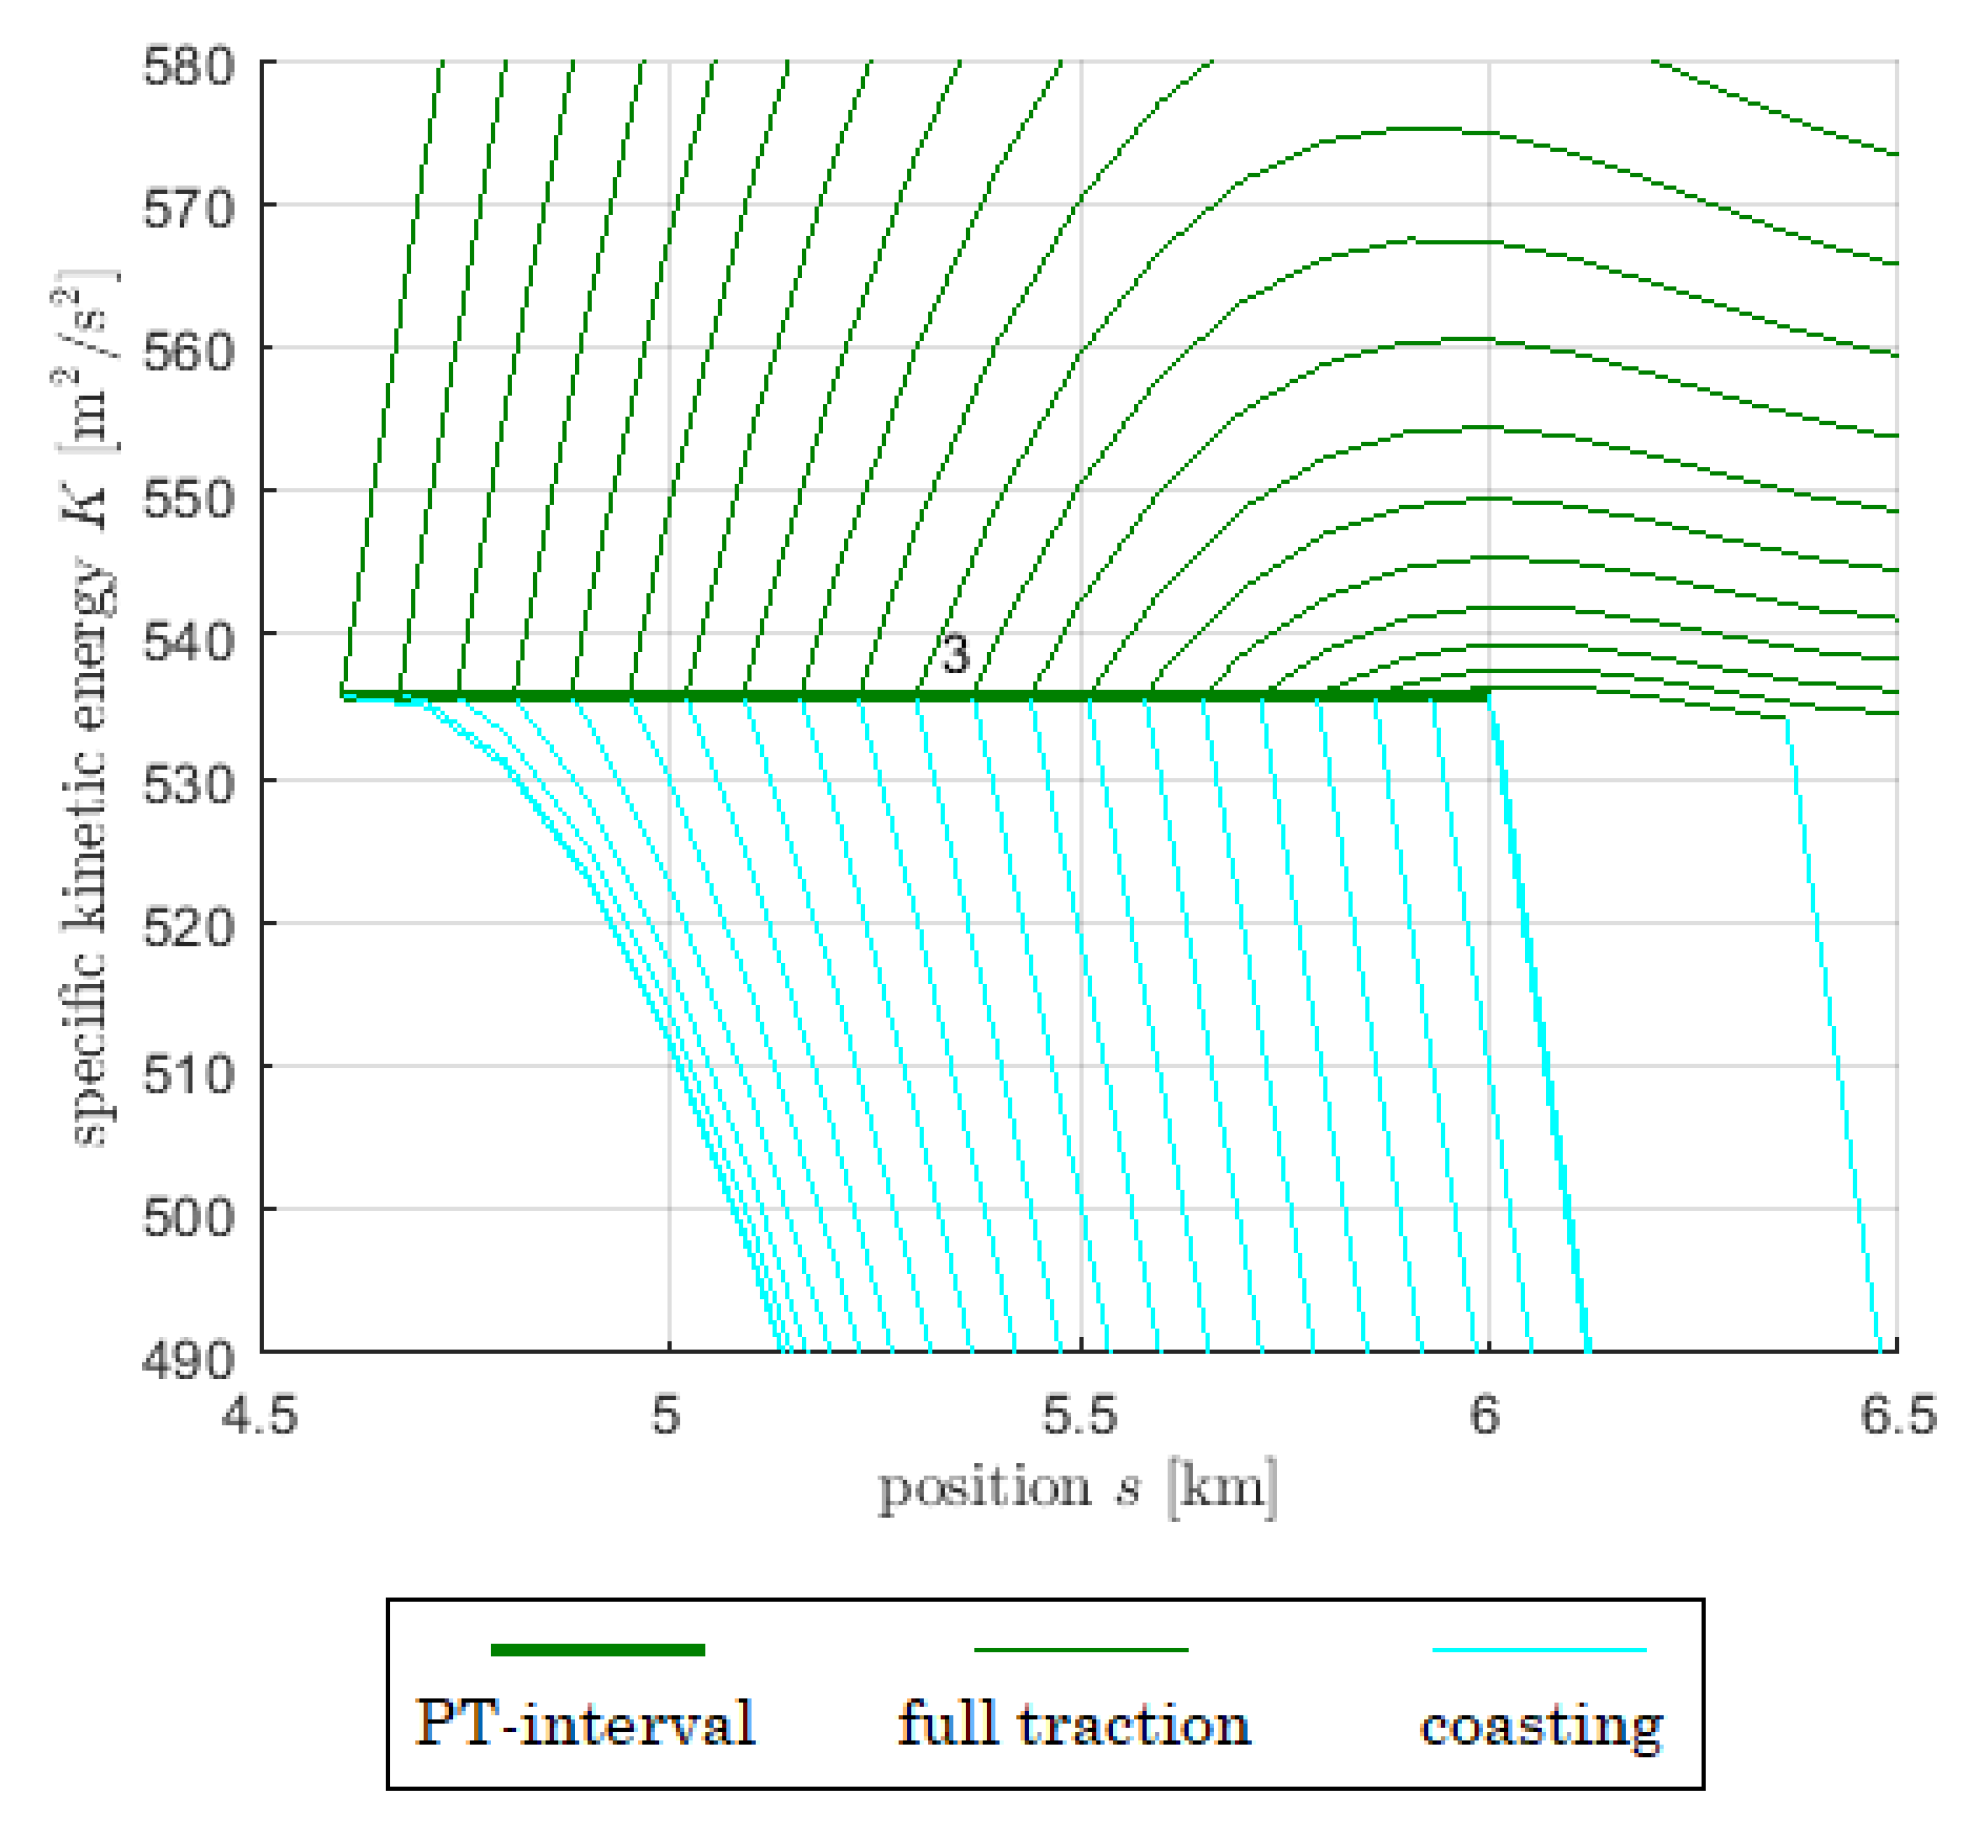
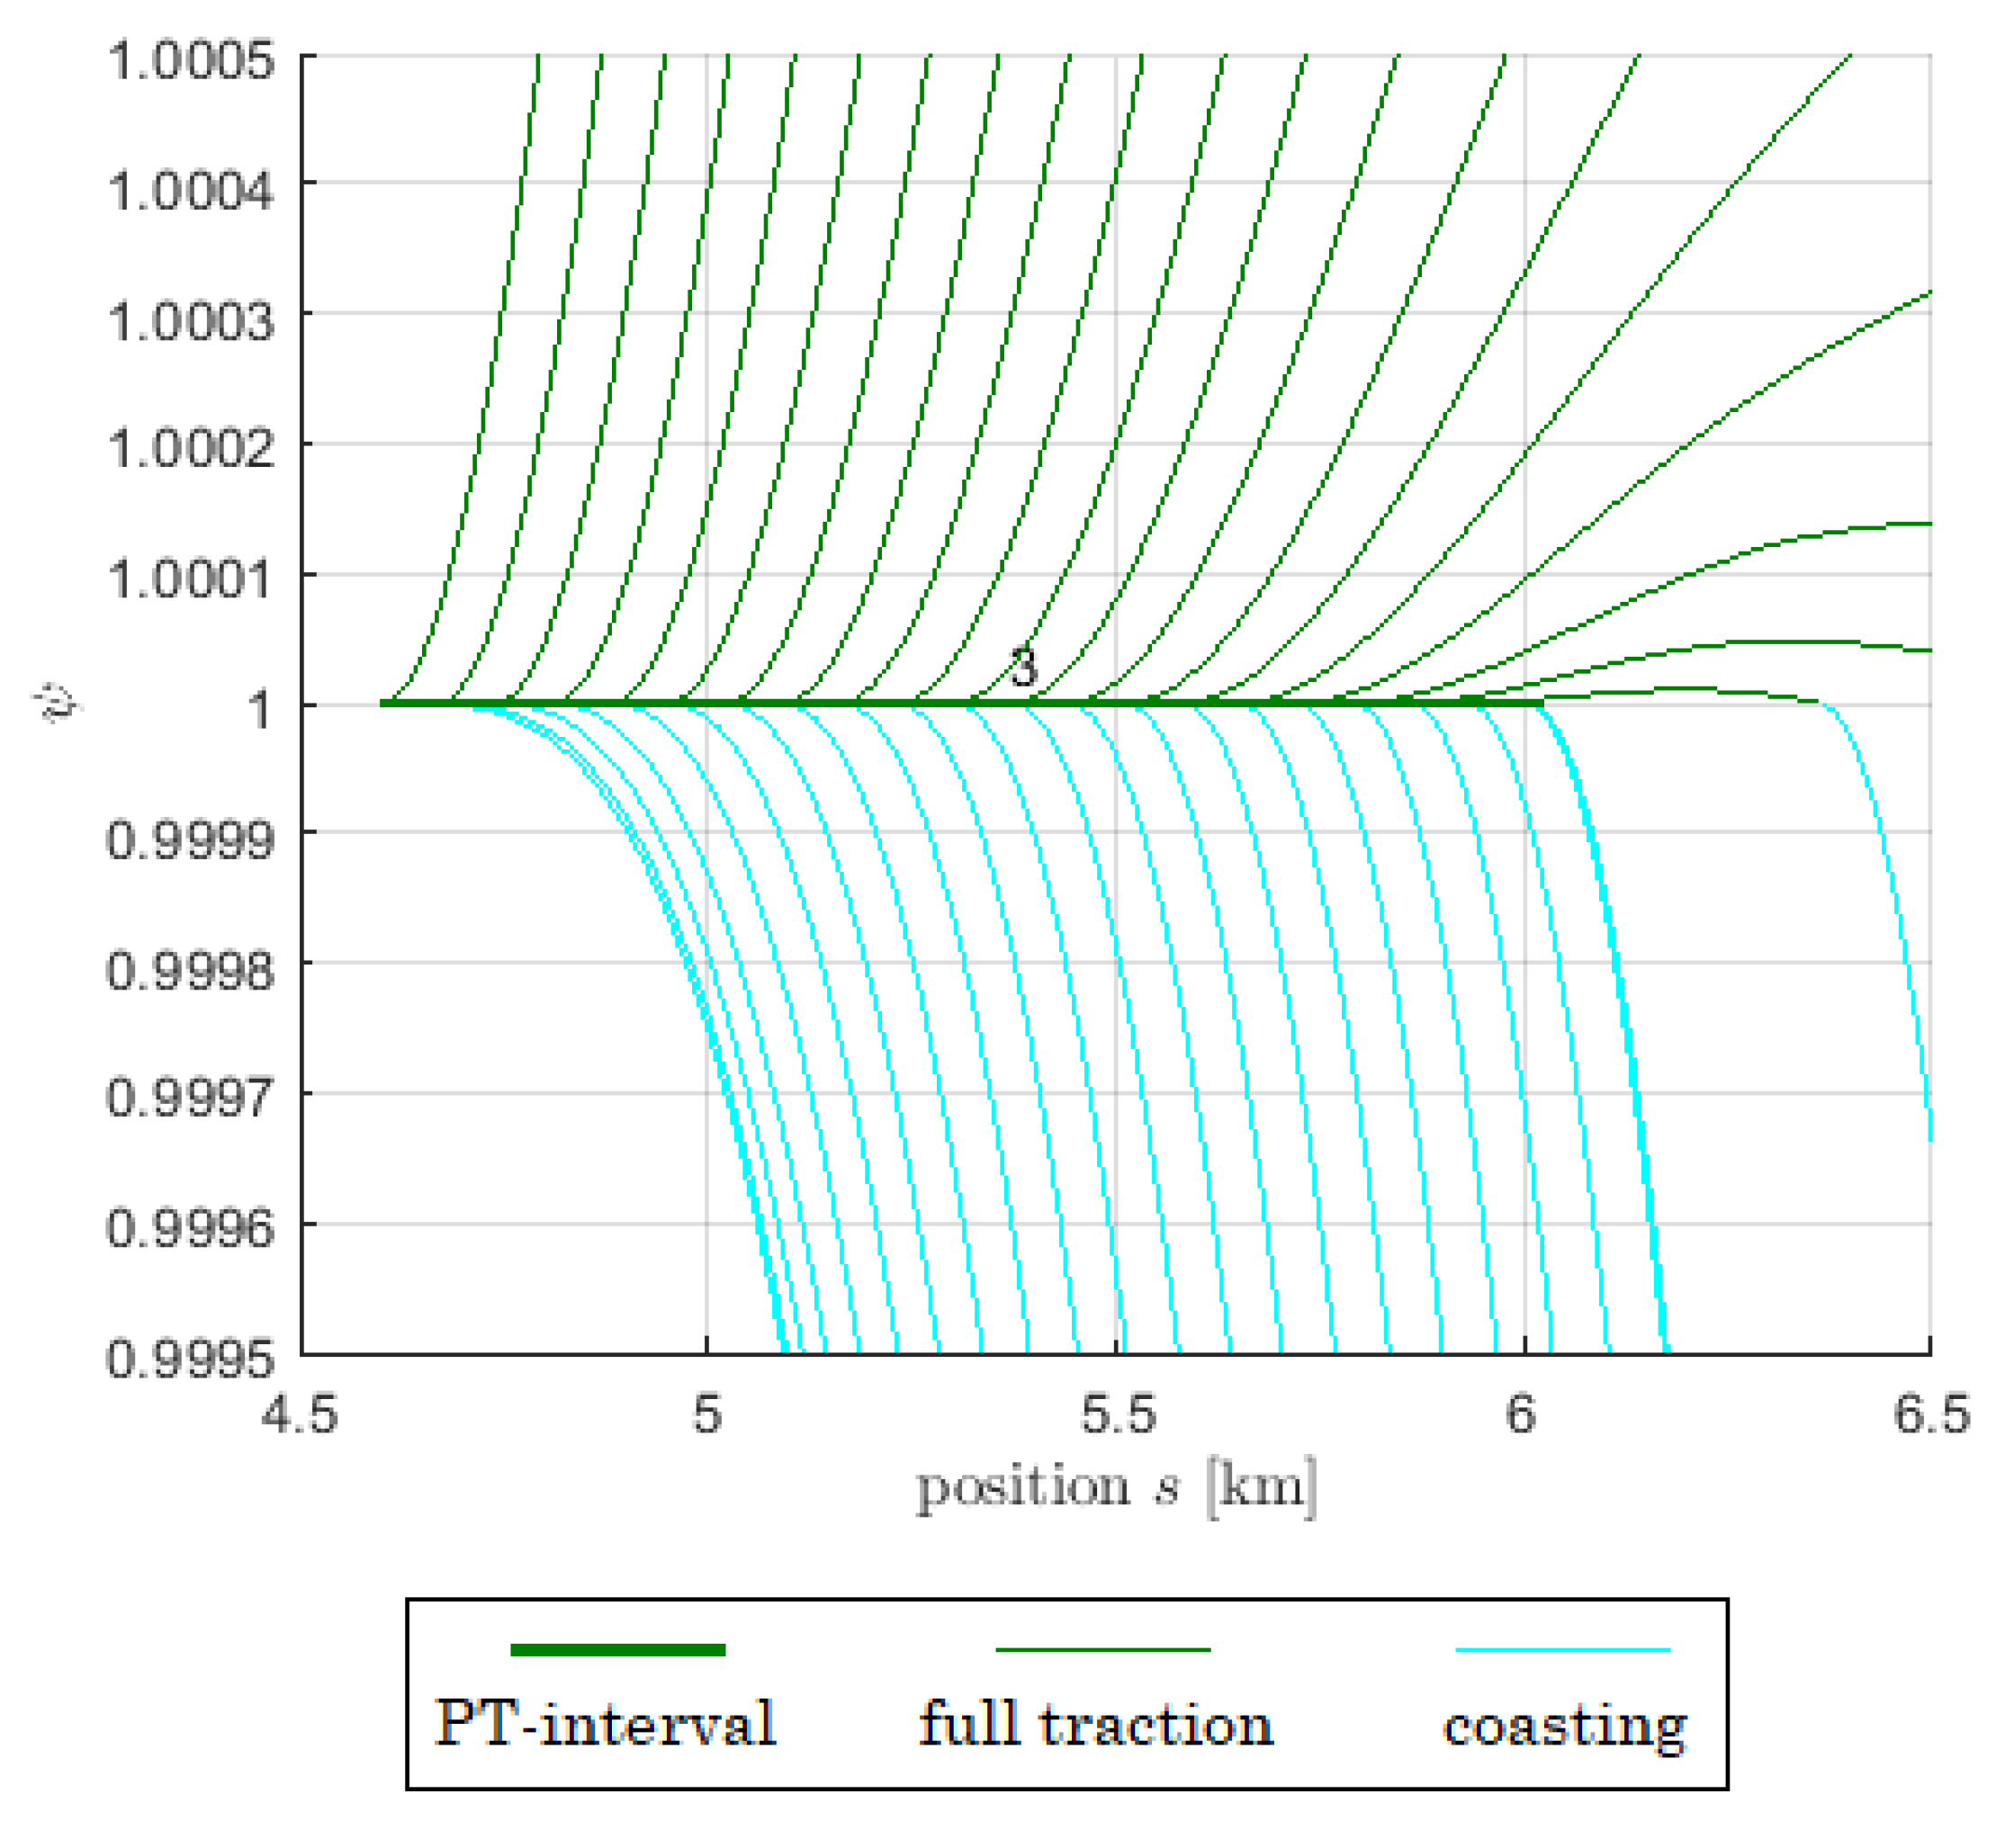
Figure 6 and
Figure 7 show the take-off from the PT-interval number 3. This is take-off case (T2). On the interval, the trajectories show an unstable behaviour with respect to
. If
is slightly above the value of 1, both
K and
will move upwards. If
is slightly below the value of 1, both
K and
will move downwards. Note that
takes off tangentially on the entire interval while
K does so only from the ends of the interval. Close to the right end of the interval, the upwards moving
K- and
-trajectories will soon turn downwards, and by that change the driving modus from full traction to coasting. This is a typical picture for take-off from PT- and PB-intervals.
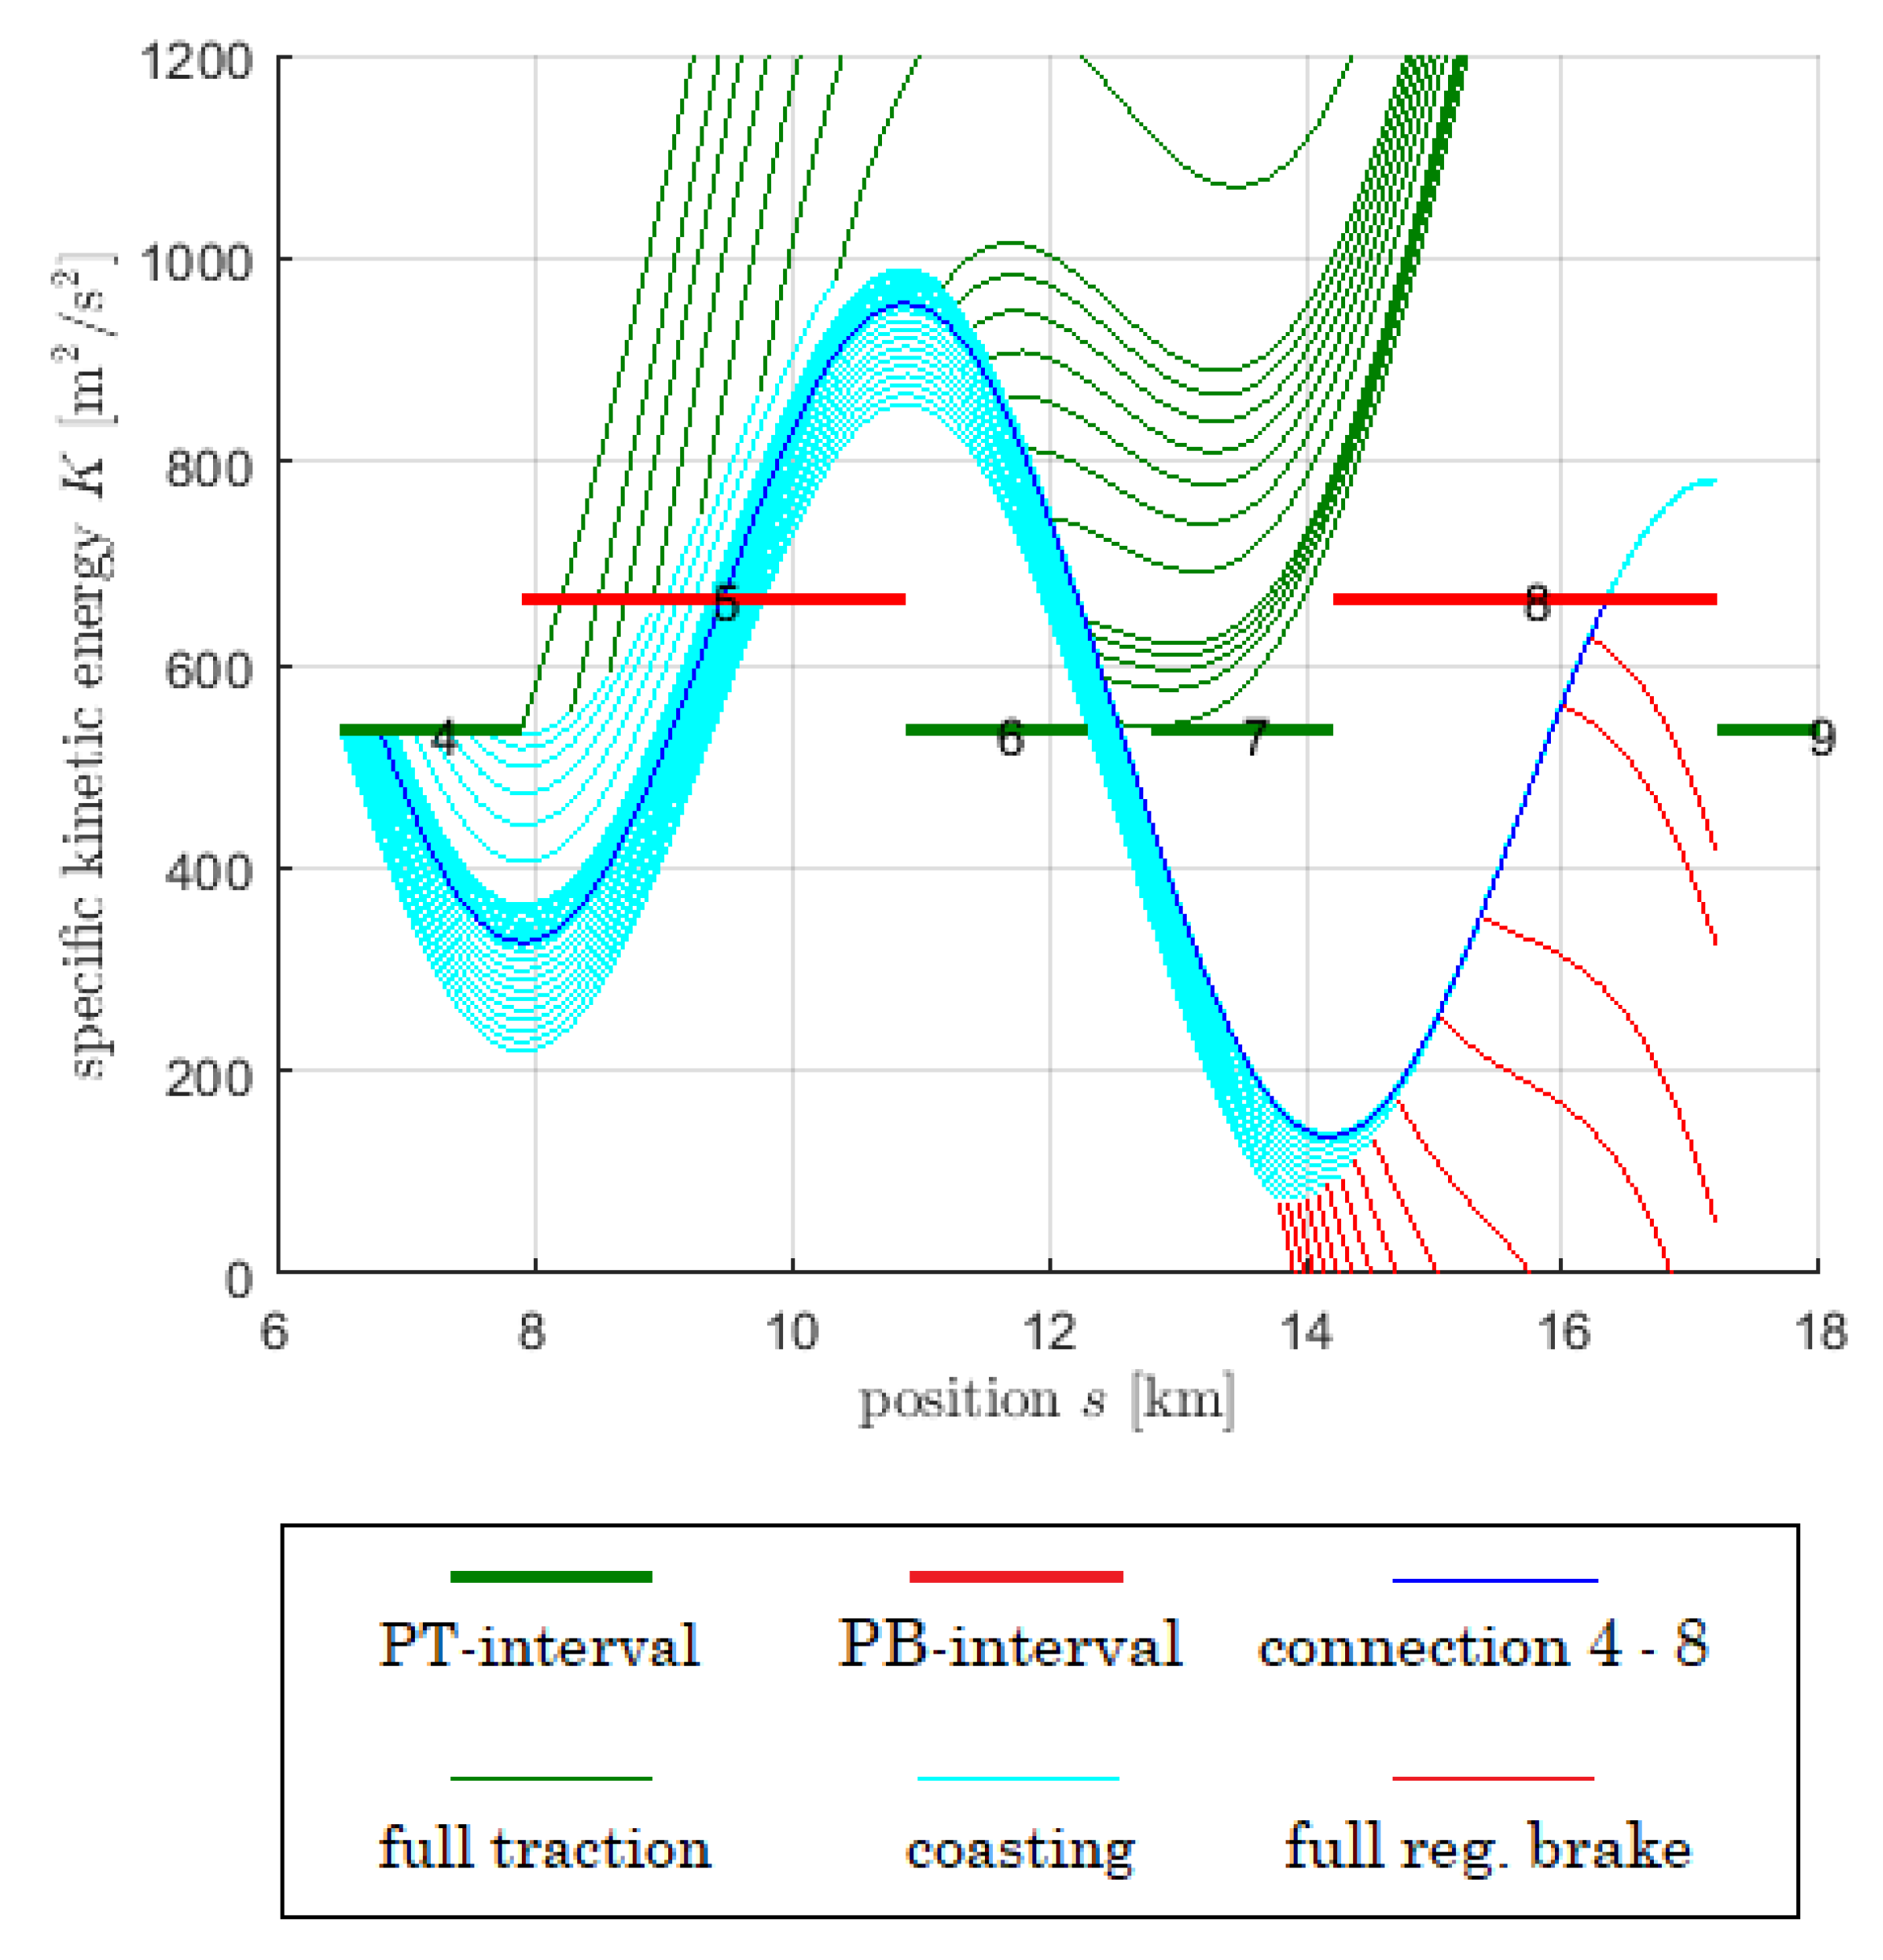
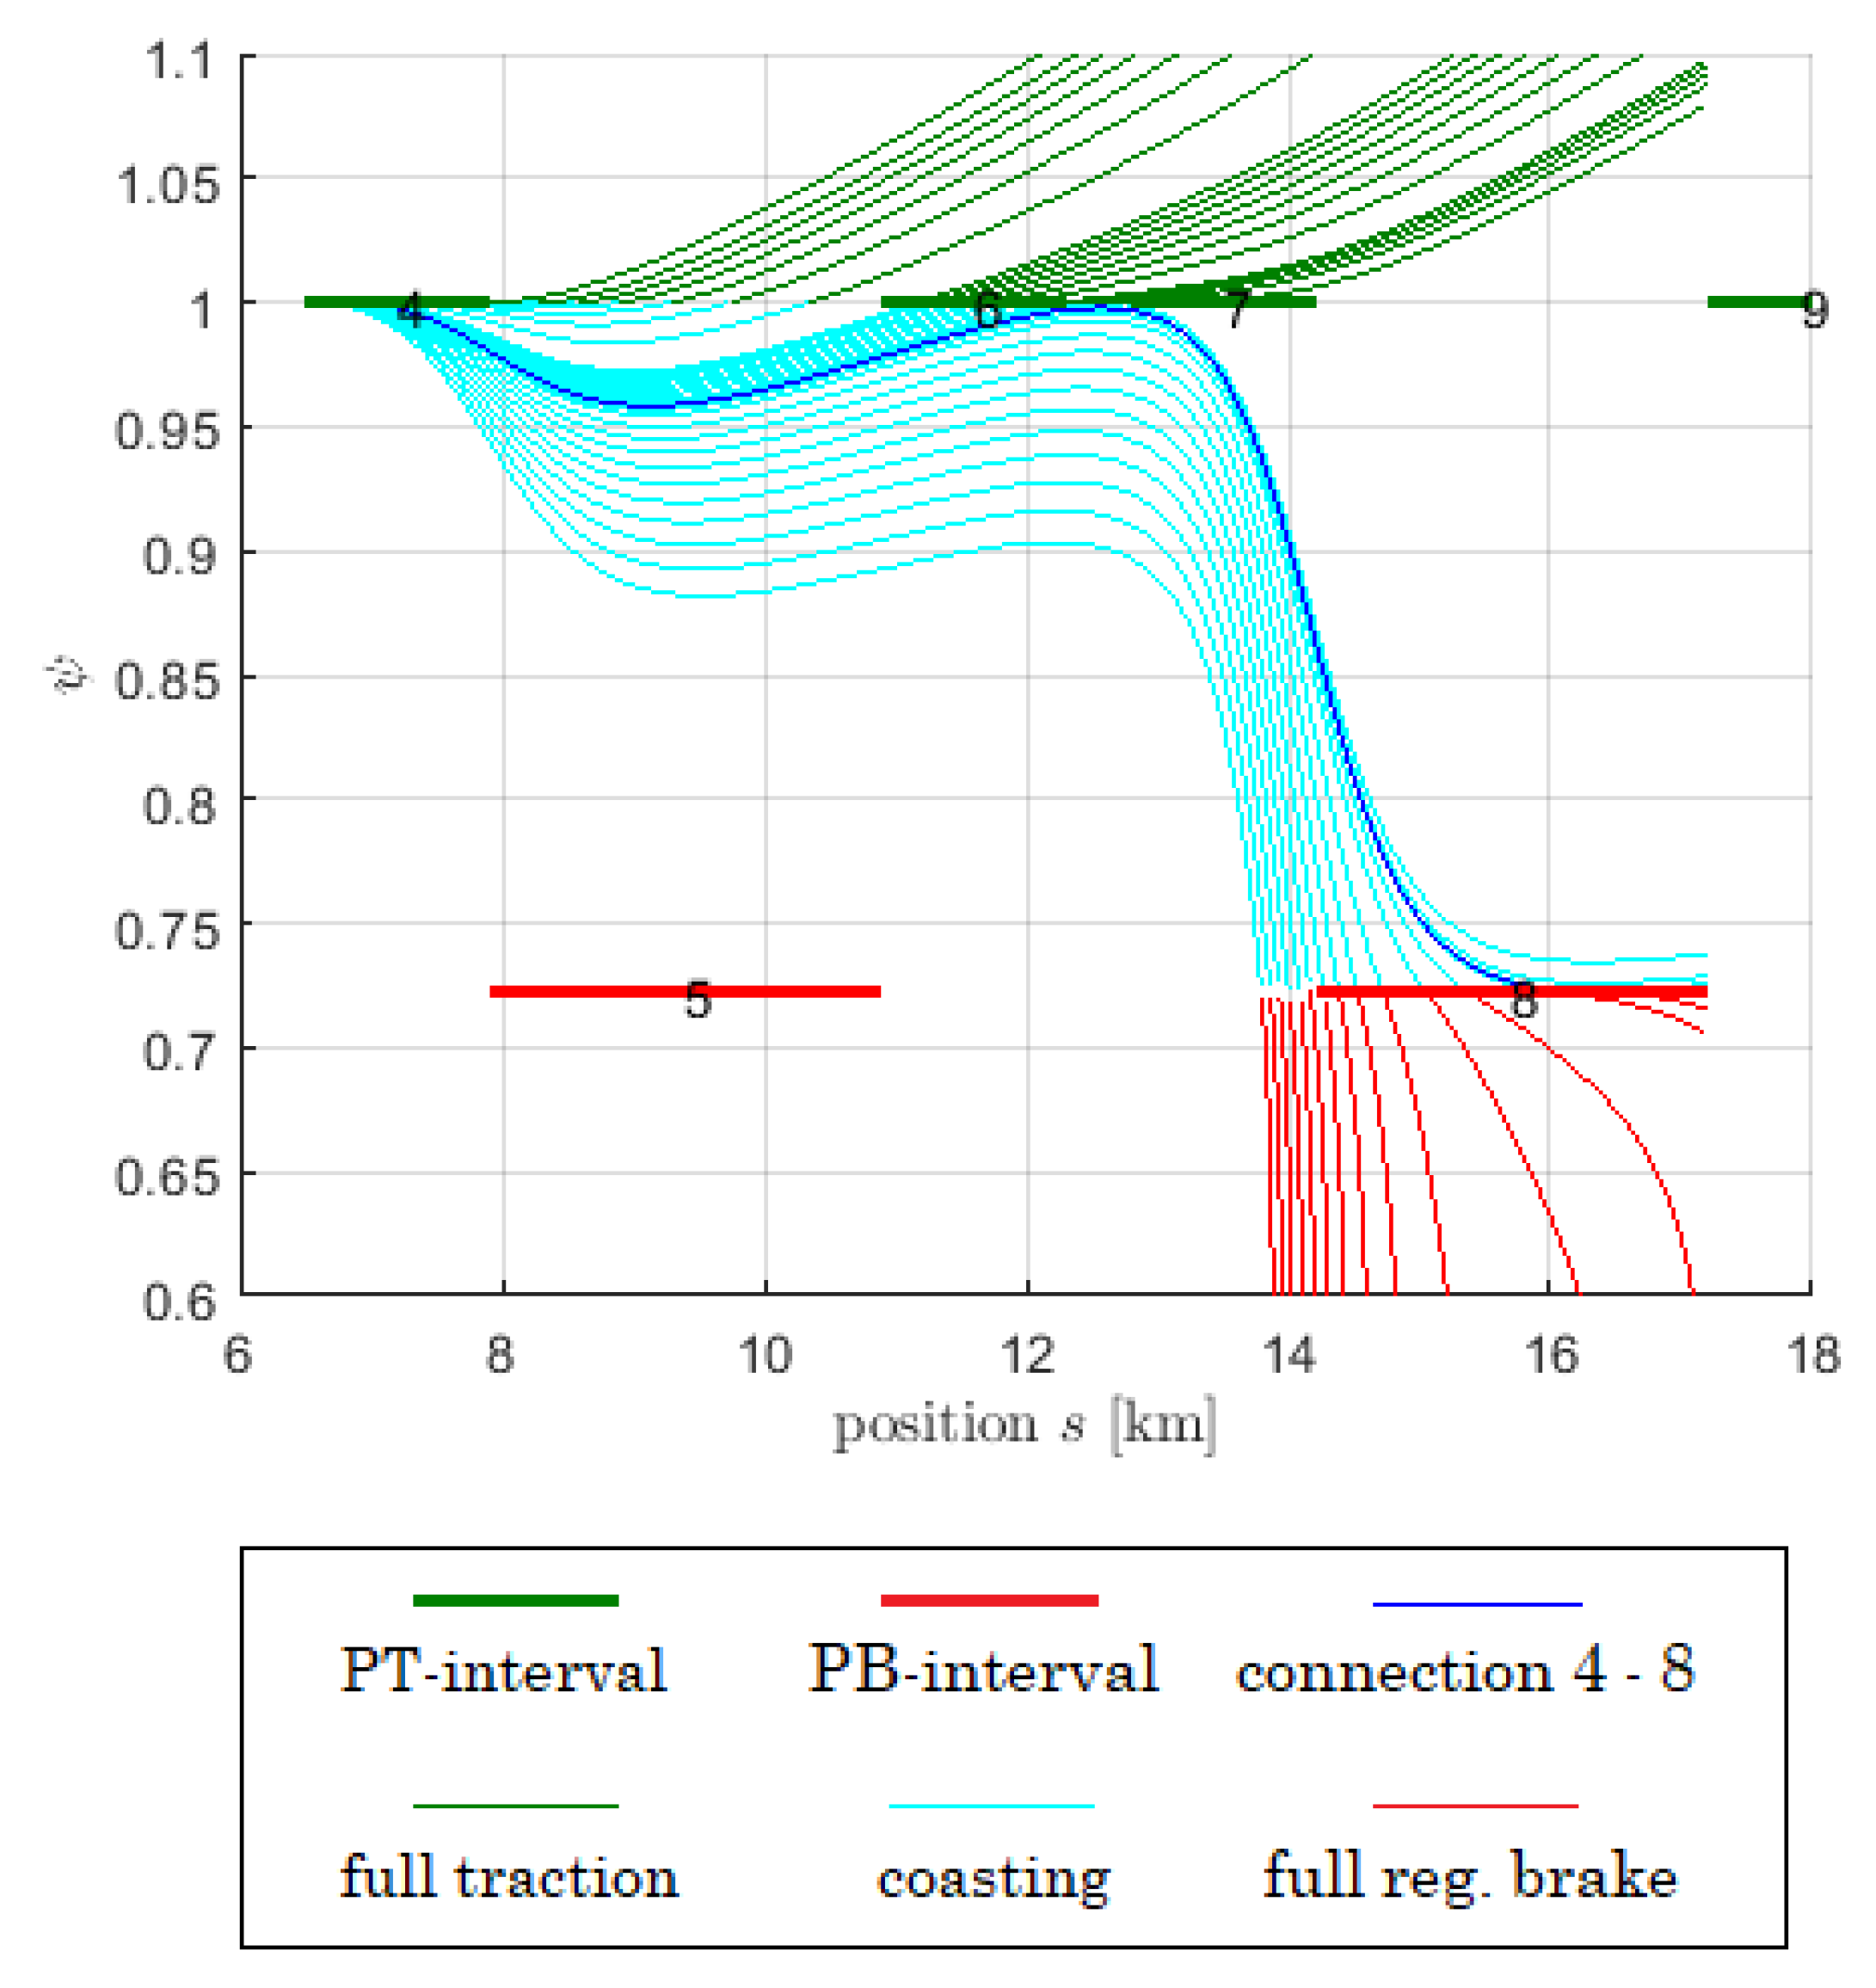
Figure 8 and
Figure 9 show the
K- and
-trajectories when trying to connect intervals 4 and 8. The
K-trajectories have a kink point when the driving modus changes from coasting to full traction or full regenerative brake, corresponding to
crossing the values 1 or
. Both the
K- and
-trajectories are able to cross pcs-intervals, but the trajectory field often splits at pcs-intervals, as here at interval 7, where a shadowed region lies behind that cannot be reached by the trajectories.
Remark. There is great potential for speeding-up the algorithm by detection of those shadowed regions. For example, one can conclude immediately from
Figure 4 that interval 3 cannot be reached from starting point 1, and from
Figure 8 that interval 9 cannot be reached from interval 4. When solving the optimisation problem, it will always pay-off to invest into good statistics, showing which connections should be checked and which ones can safely be excluded.
Example 2. We consider Example 1, but now with a speed limit according to
Table 3.
The multiplier
is again set to
.
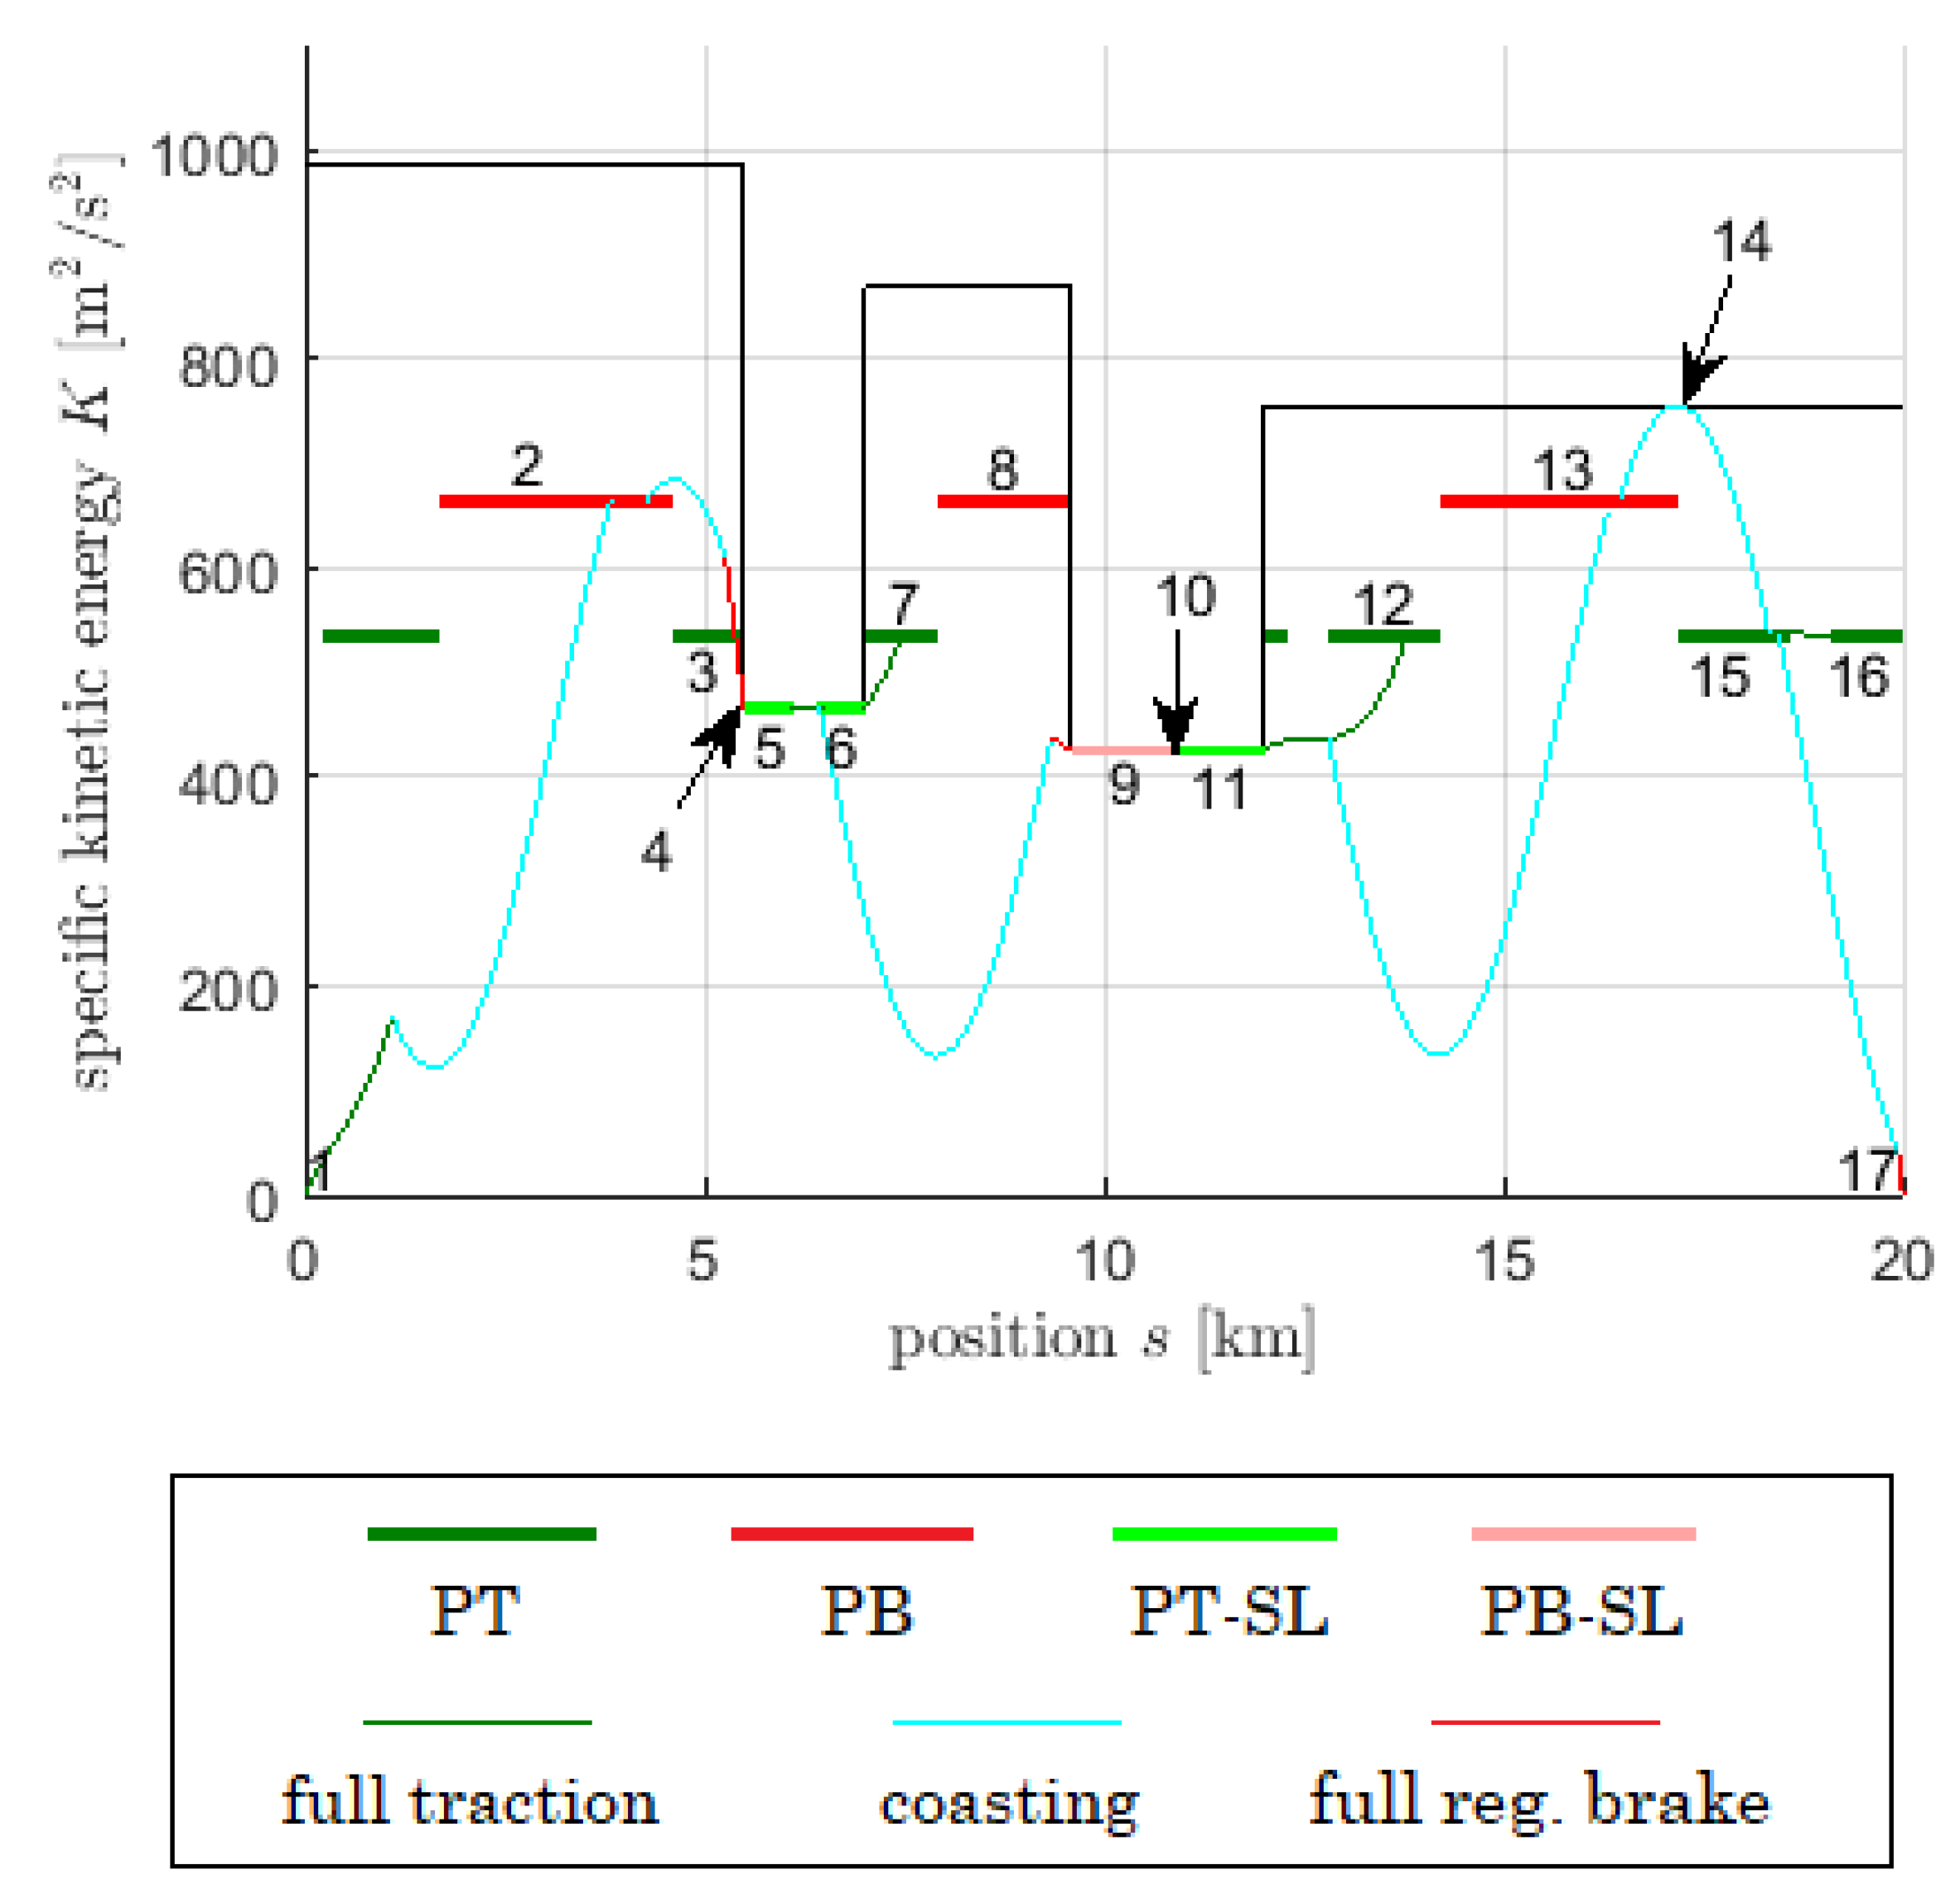
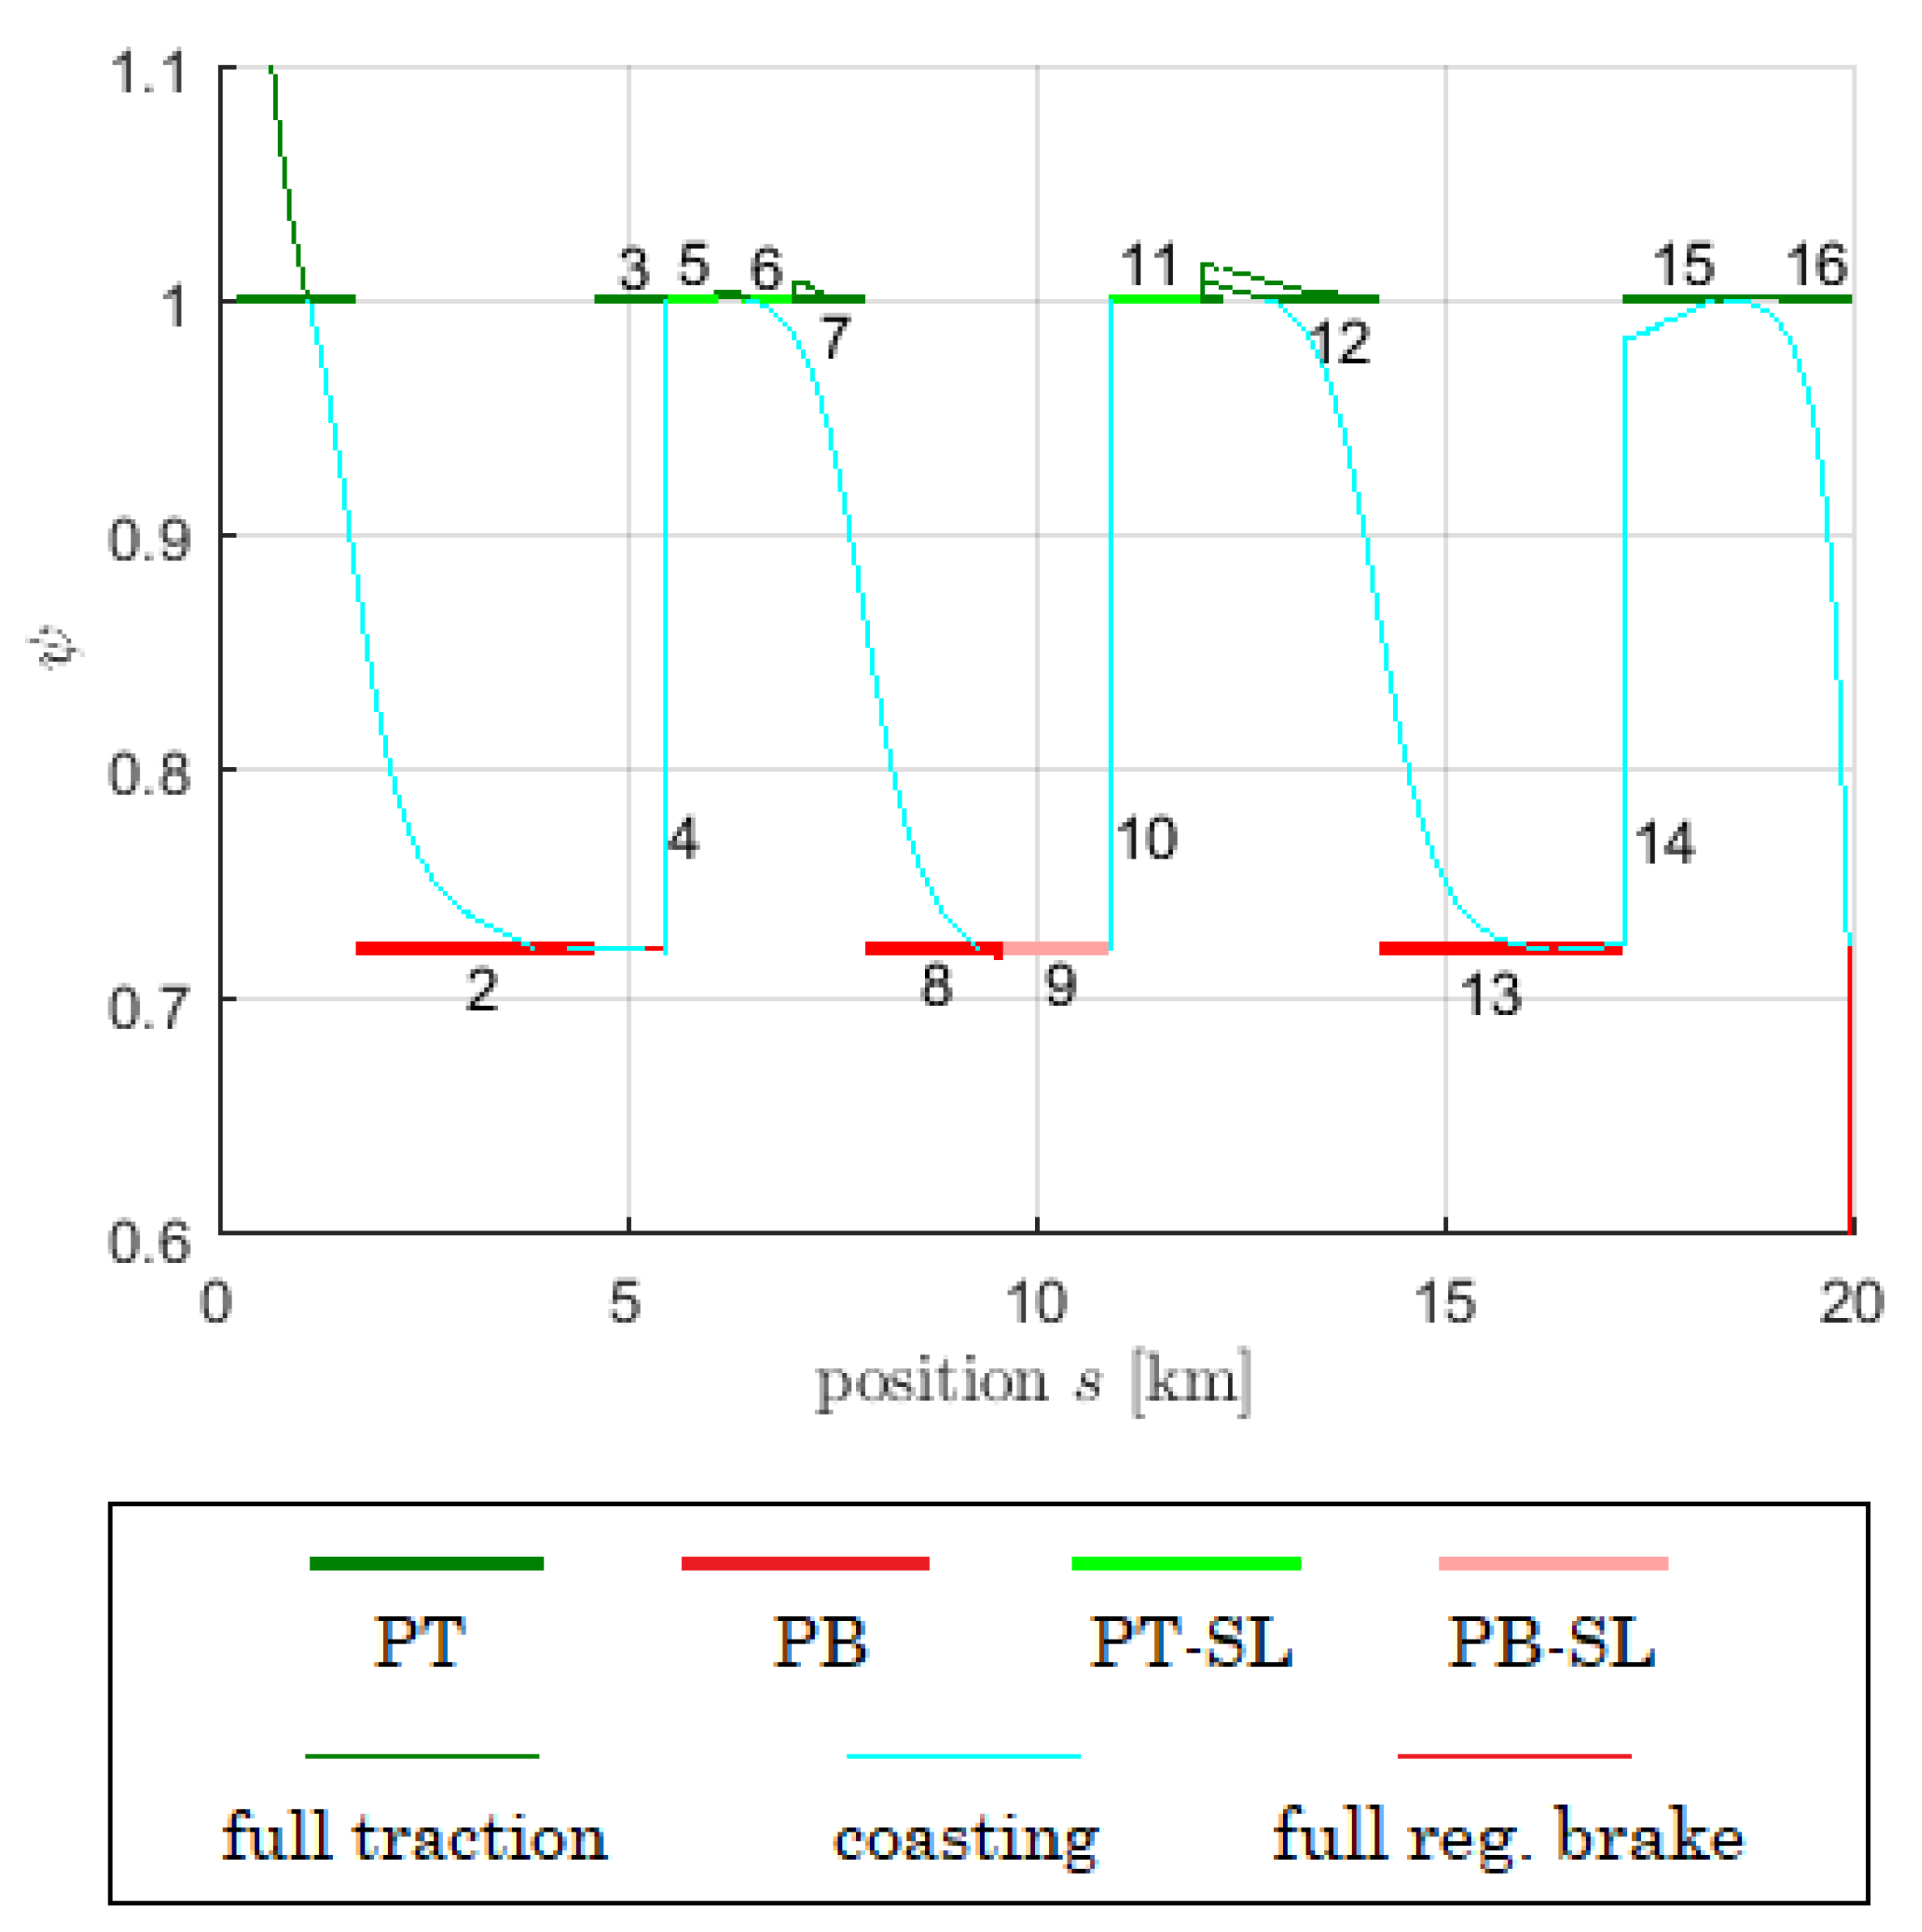
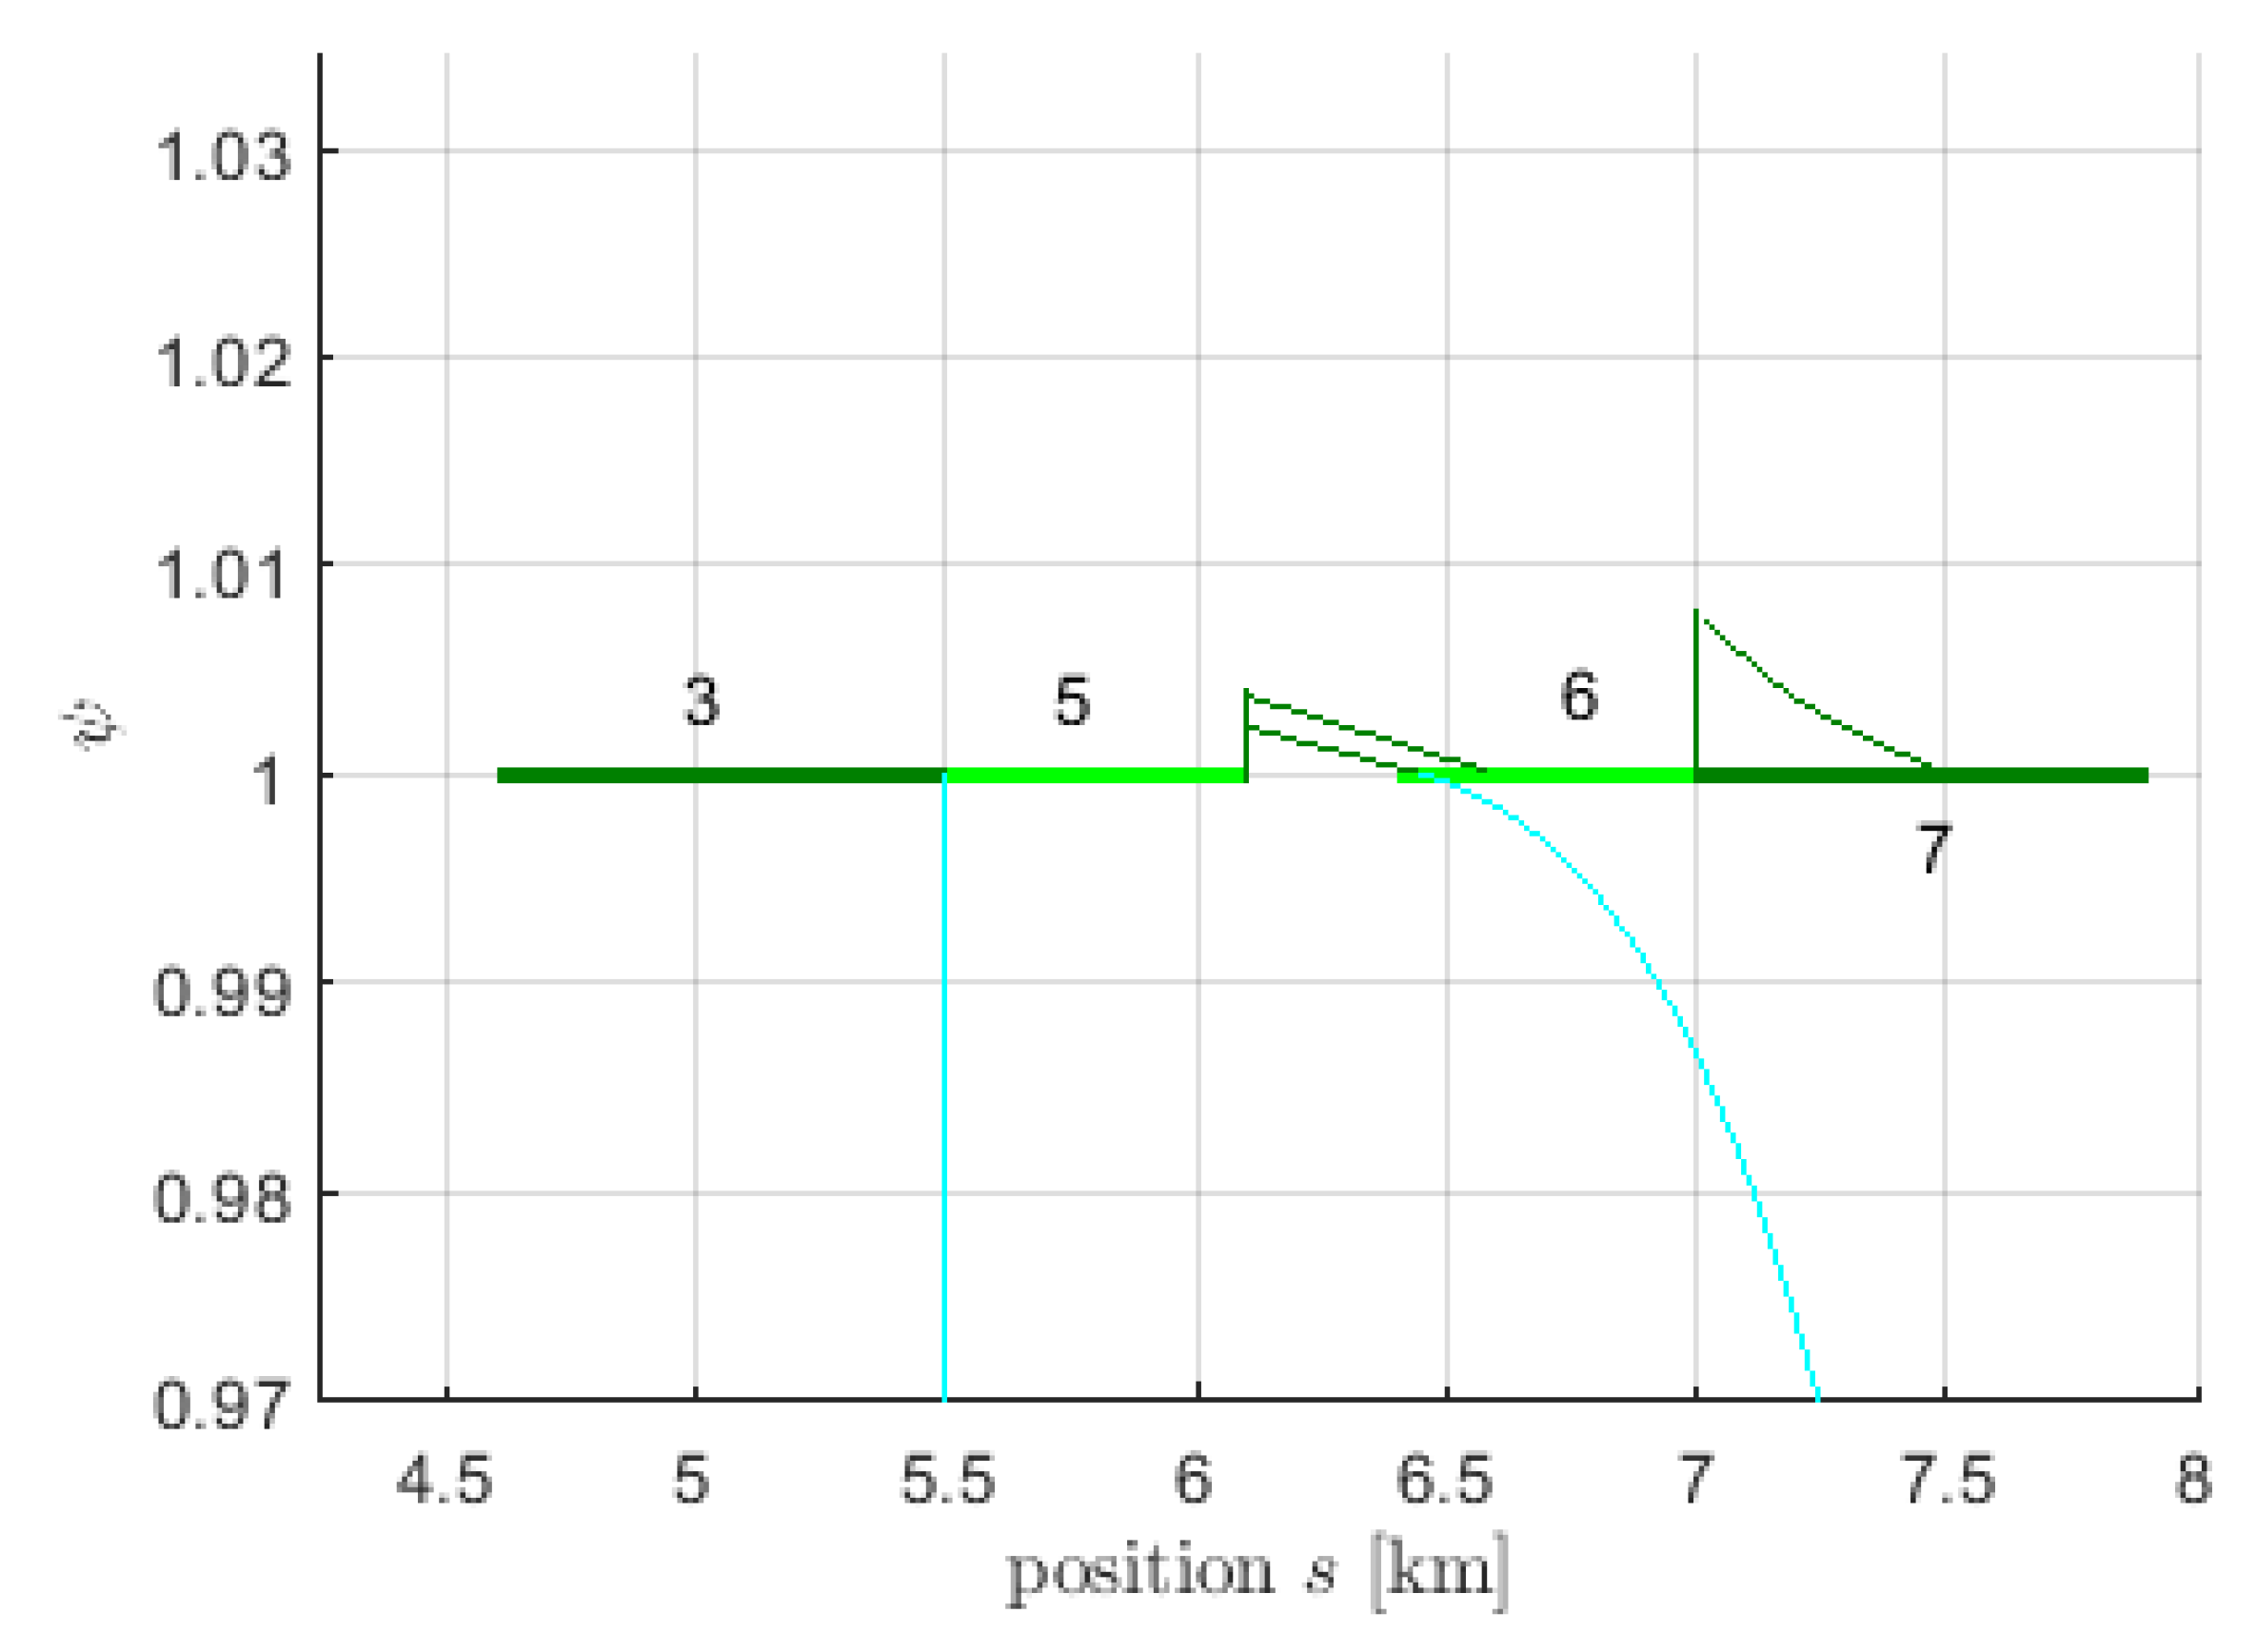
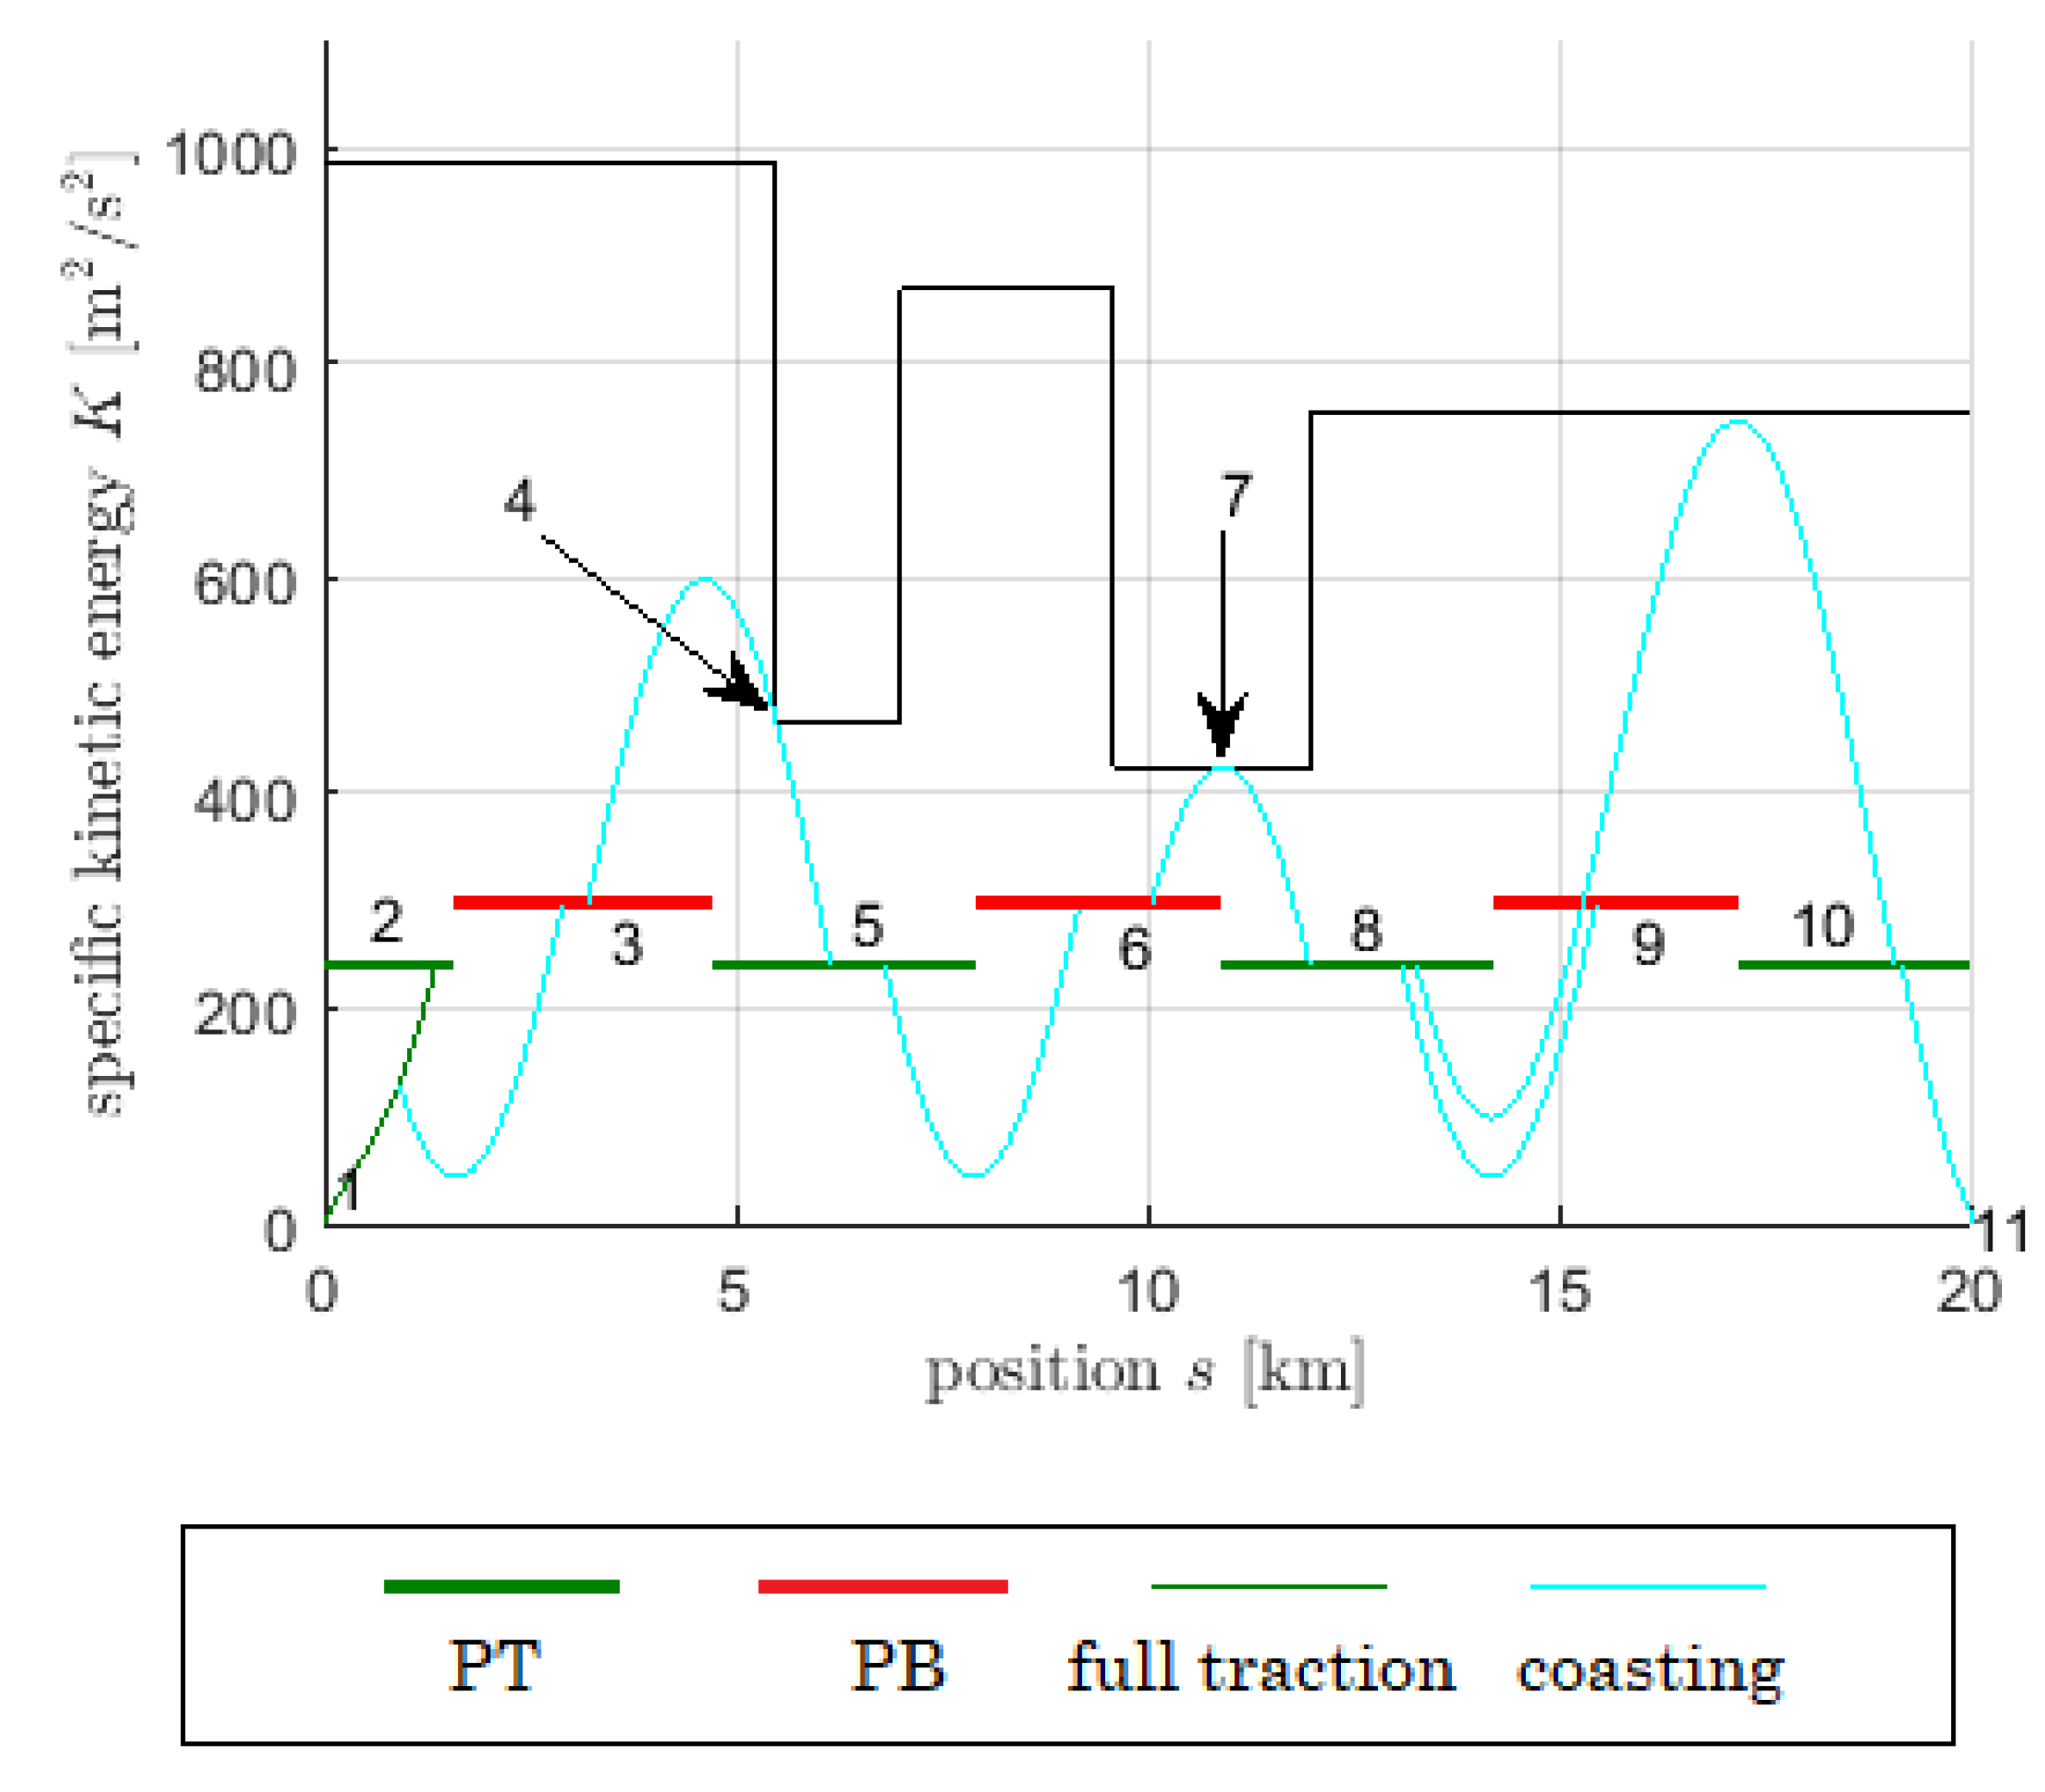
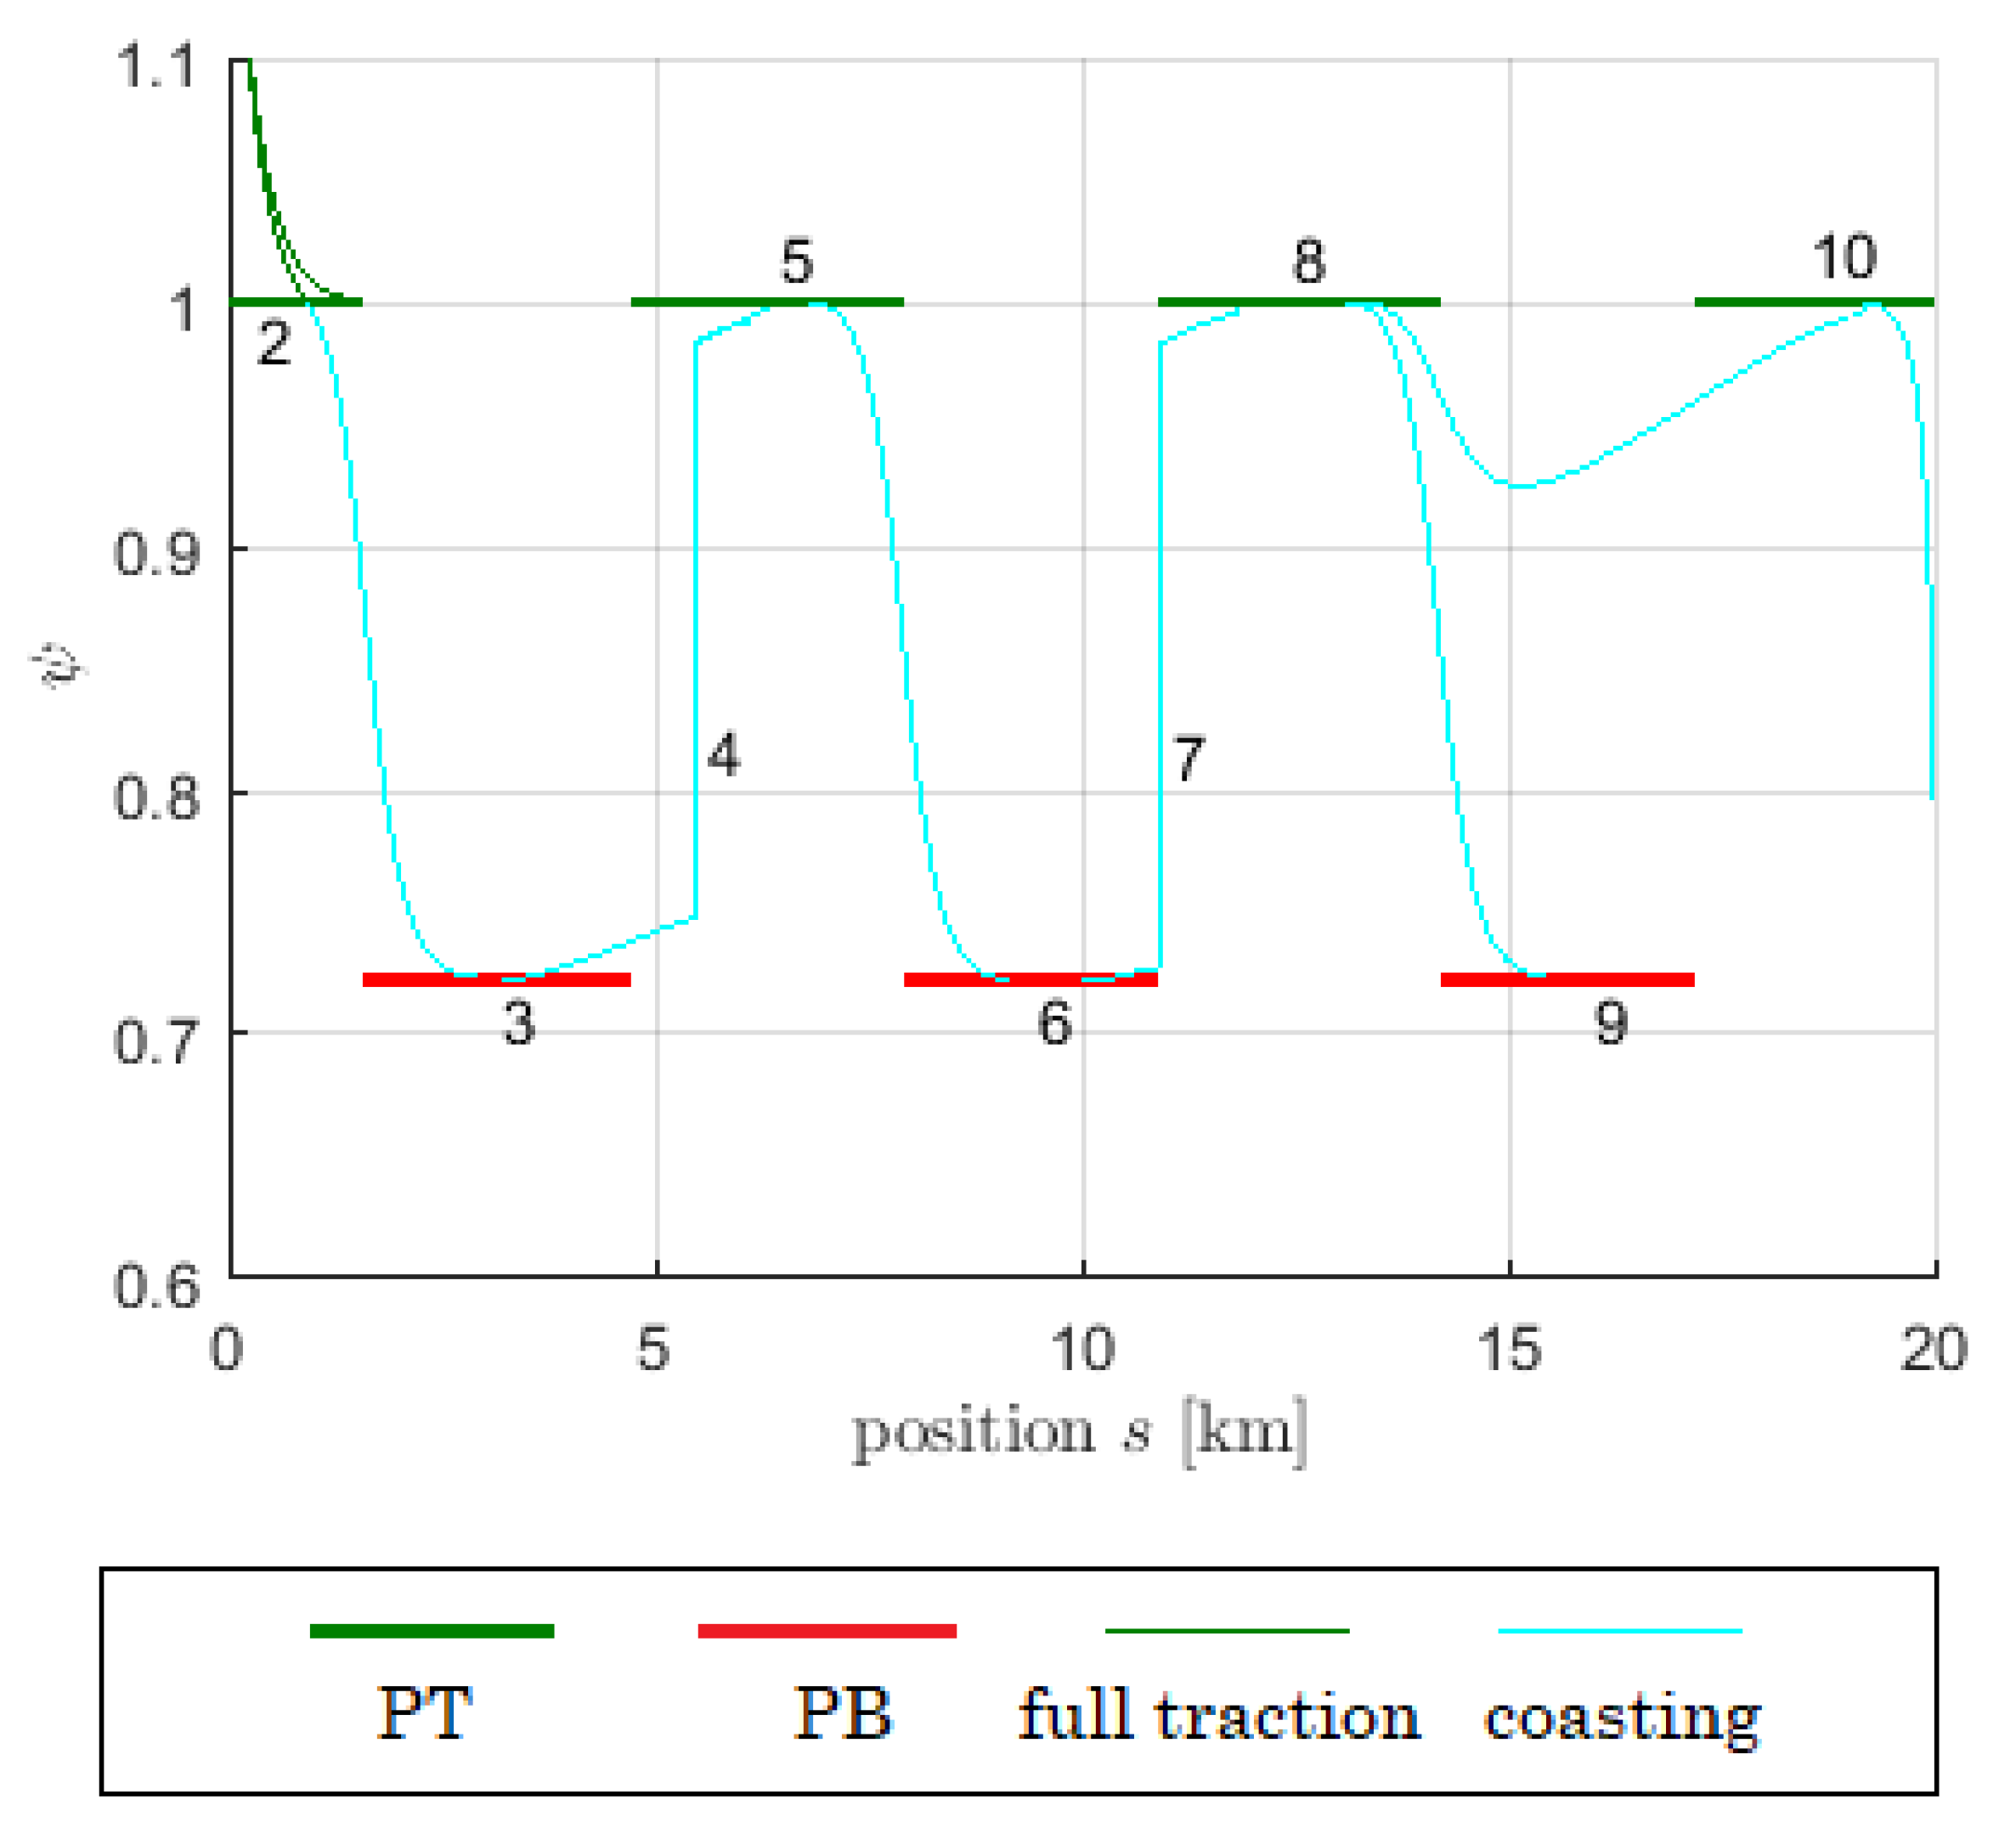
Figure 10,
Figure 11 and
Figure 12 show that all types of pcs-intervals occur. The speed limit touchpoints 4, 10, and 14 have been inserted during the run of the algorithm.
Table 4 shows the possible port connections in Example 2.
It has been shown by Khmelnitsky [
1] that there exists always exactly one connection from the start point (1) to the stop point (here 17). In Example 2, this is the connection
. The total time
required on this connection is not known a priori, but can be calculated from the
K-curve. Since
is the specific kinetic energy,
holds.
Remark. Here, we distinguish between the scheduled time
T, and the time
that is evaluated from the algorithm. The final goal of the algorithm is to match
to the prescribed
T by variation of
. This will be explained in
Section 2.5.
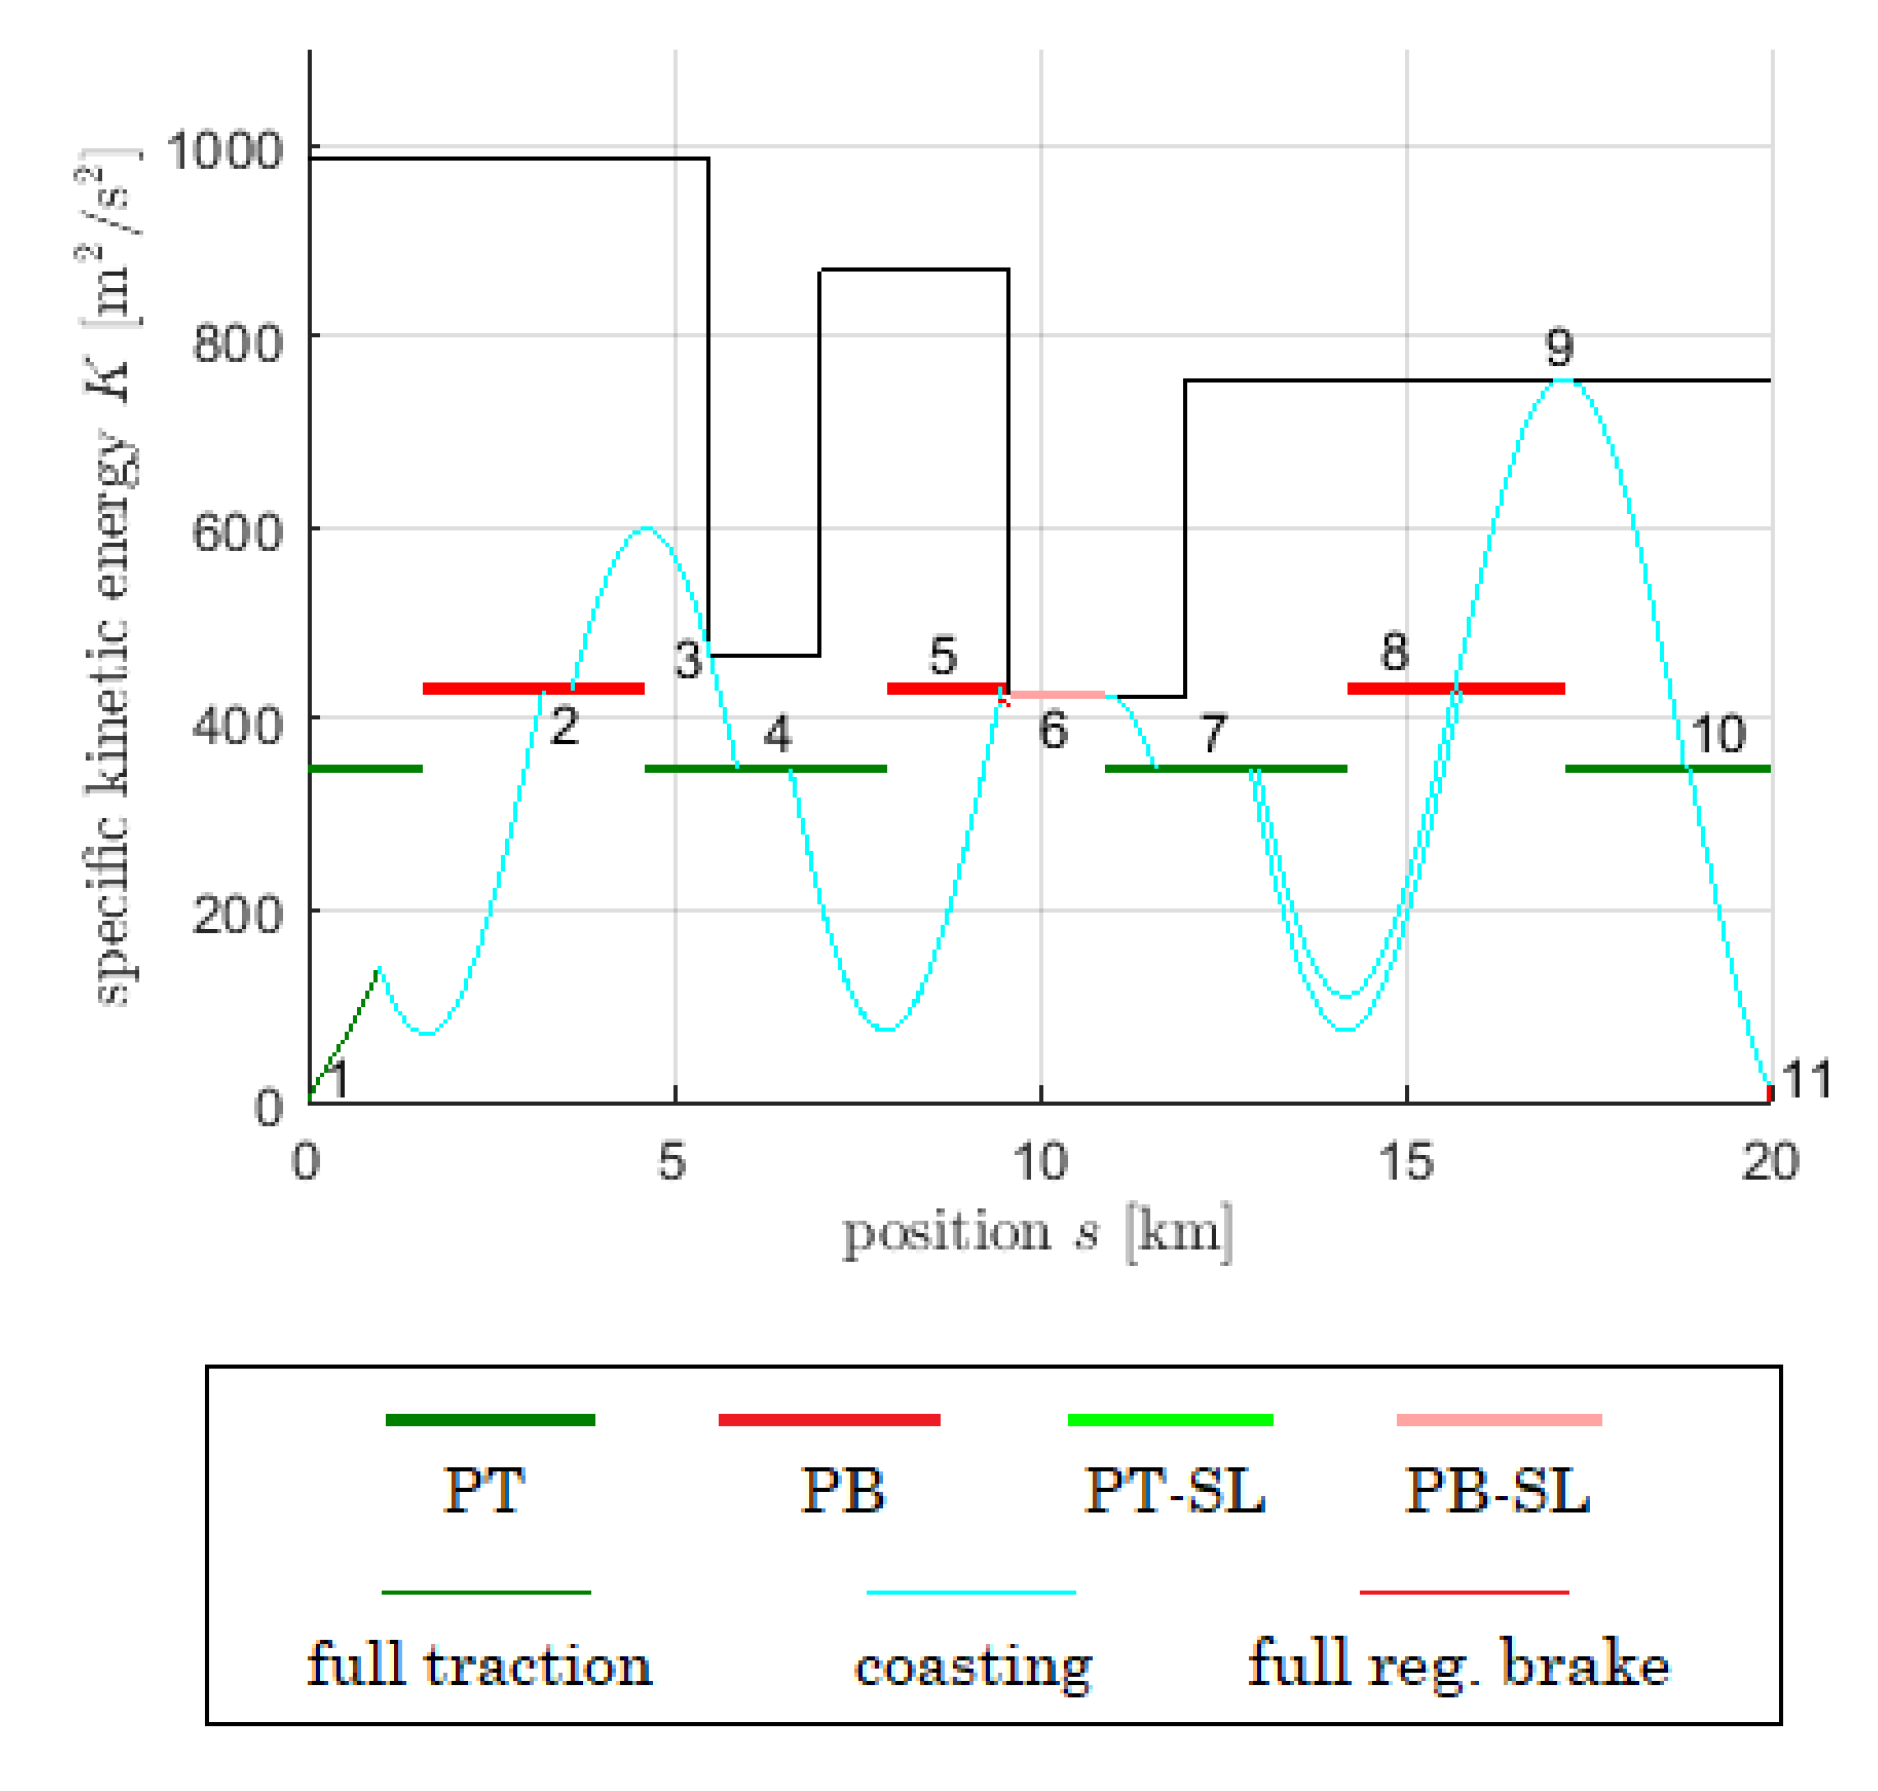
Example 3. We consider Example 2, but now with
. Trajectories of
K and
are illustrated in
Figure 13 and
Figure 14, respectively.
2.5. The algorithm of Khmelnitsky: variation of the multiplier
Khmelnitsky [
1] has shown that the time
between two stops of the train is a strictly monotonously increasing function of the Lagrange multiplier
. Moreover,
and
hold. Therefore, whenever the scheduled time
T is possible to be driven on a track section by a particular train, it can be approached by the optimisation algorithm by adjusting
with iterative bisection. The complete algorithm for the minimum energy operation would read as follows:
Consider a track section with stops at and to be driven in a scheduled duration T.
Step 1: Calculate the fastest possible motion on the track section with purely regenerative braking. If the time needed for that is larger than the scheduled time T, add mechanical braking and leave the algorithm. If , choose an arbitrary negative value for and proceed the algorithm with Step 2.
Step 2: Calculate
by (
54),
by (
56), and evaluate the pcs-intervals PT, PB, PT-SL, PB-SL by (
58)–(
61). Skip pcs-intervals that cannot be reached by fastest motion. Numerate the ports, i.e., the remaining pcs-intervals, the start at
, and the stop at
, in the order of ascending
s.
Step 3: Try to connect ports by regular motion with equations (
62) and (). Use one of the take-off cases (T1)–(T8) and one of the landing cases (L1)–(L10). Add speed limit touchpoints if necessary, according to the instructions given above. Step 3 is complete when a connection from the start point at
to the stop point
has been found.
Step 4: Calculate
according to (
66). If
is sufficiently close to
T, the algorithm is successfully completed. If not, adjust
and proceed with Step 2.
If n is the number of ports then a maximum of possible connections has to be checked, unless the start-stop connection is found earlier. This means that the number of possible connections grows quadratically with n. The algorithm can be seen as a search tree, with port connections being the branches of the tree that need to be checked. Therefore, it is crucial to follow a clever search strategy to keep computing time at an acceptable level. We mention four important measures that dramatically shortened computing time when the code was developed:
Parallel path exclusion. Khmelnitsky [
1] has shown that any two ports can only be connected by a at most one path. Therefore, it is wise to exclude all parallel paths in the search tree. For example, if a connection
has been established, the parallel direct link
is not possible and need not be checked.
Start from the treetop. When choosing the next connection to check for in Step 3, start at the highest port number that is connected to port 1 and not a known dead end. This strategy usually leads to an early discovery of the start-stop connection.
Look out for shadowed ports. If ports lie in shadow, exclude impossible connections. See the remark in the discussion of Example 1 in
Section 2.3.
Estimate by interpolation. The adjustment of in Step 4 can be sped up using interpolation techniques.
Example 4. Example 4 is equal to Examples 2 and 3, except that is not prescribed, and T is set to 16 minutes.
Applying the algorithm,
converges to
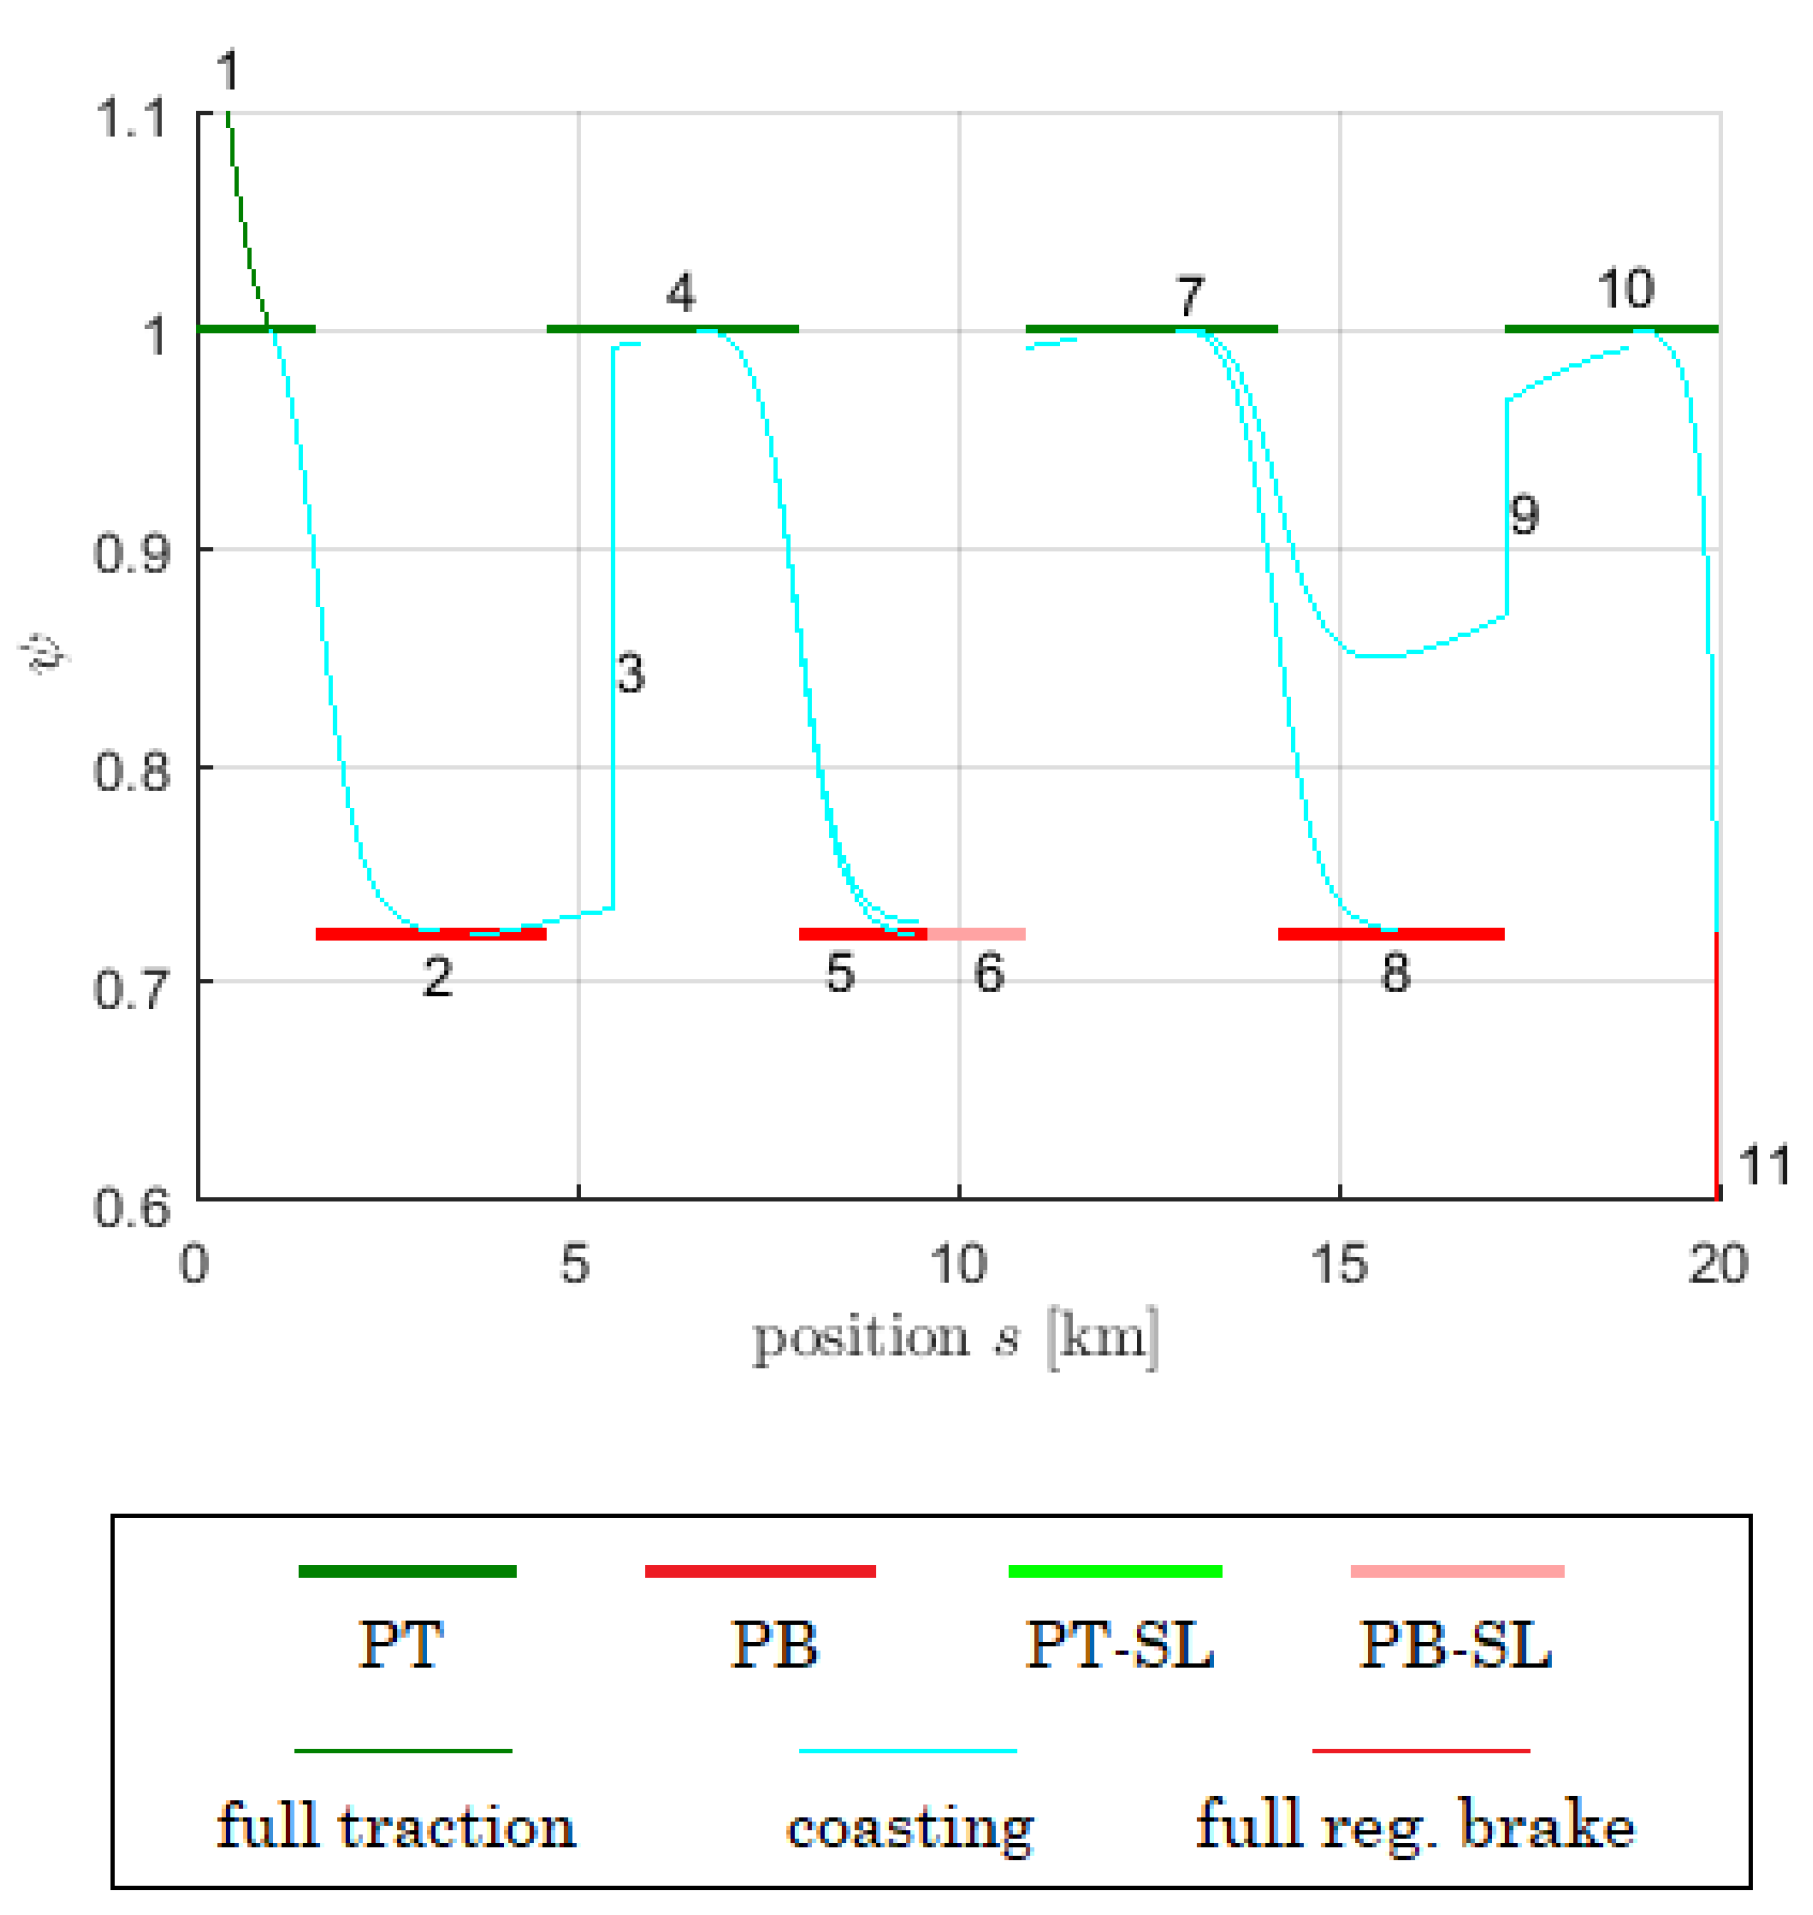
. The final
K- and
-trajectories are shown in
Figure 15 and
Figure 16.
Connections and type of take-off and landing are given for the final value
in
Table 6.
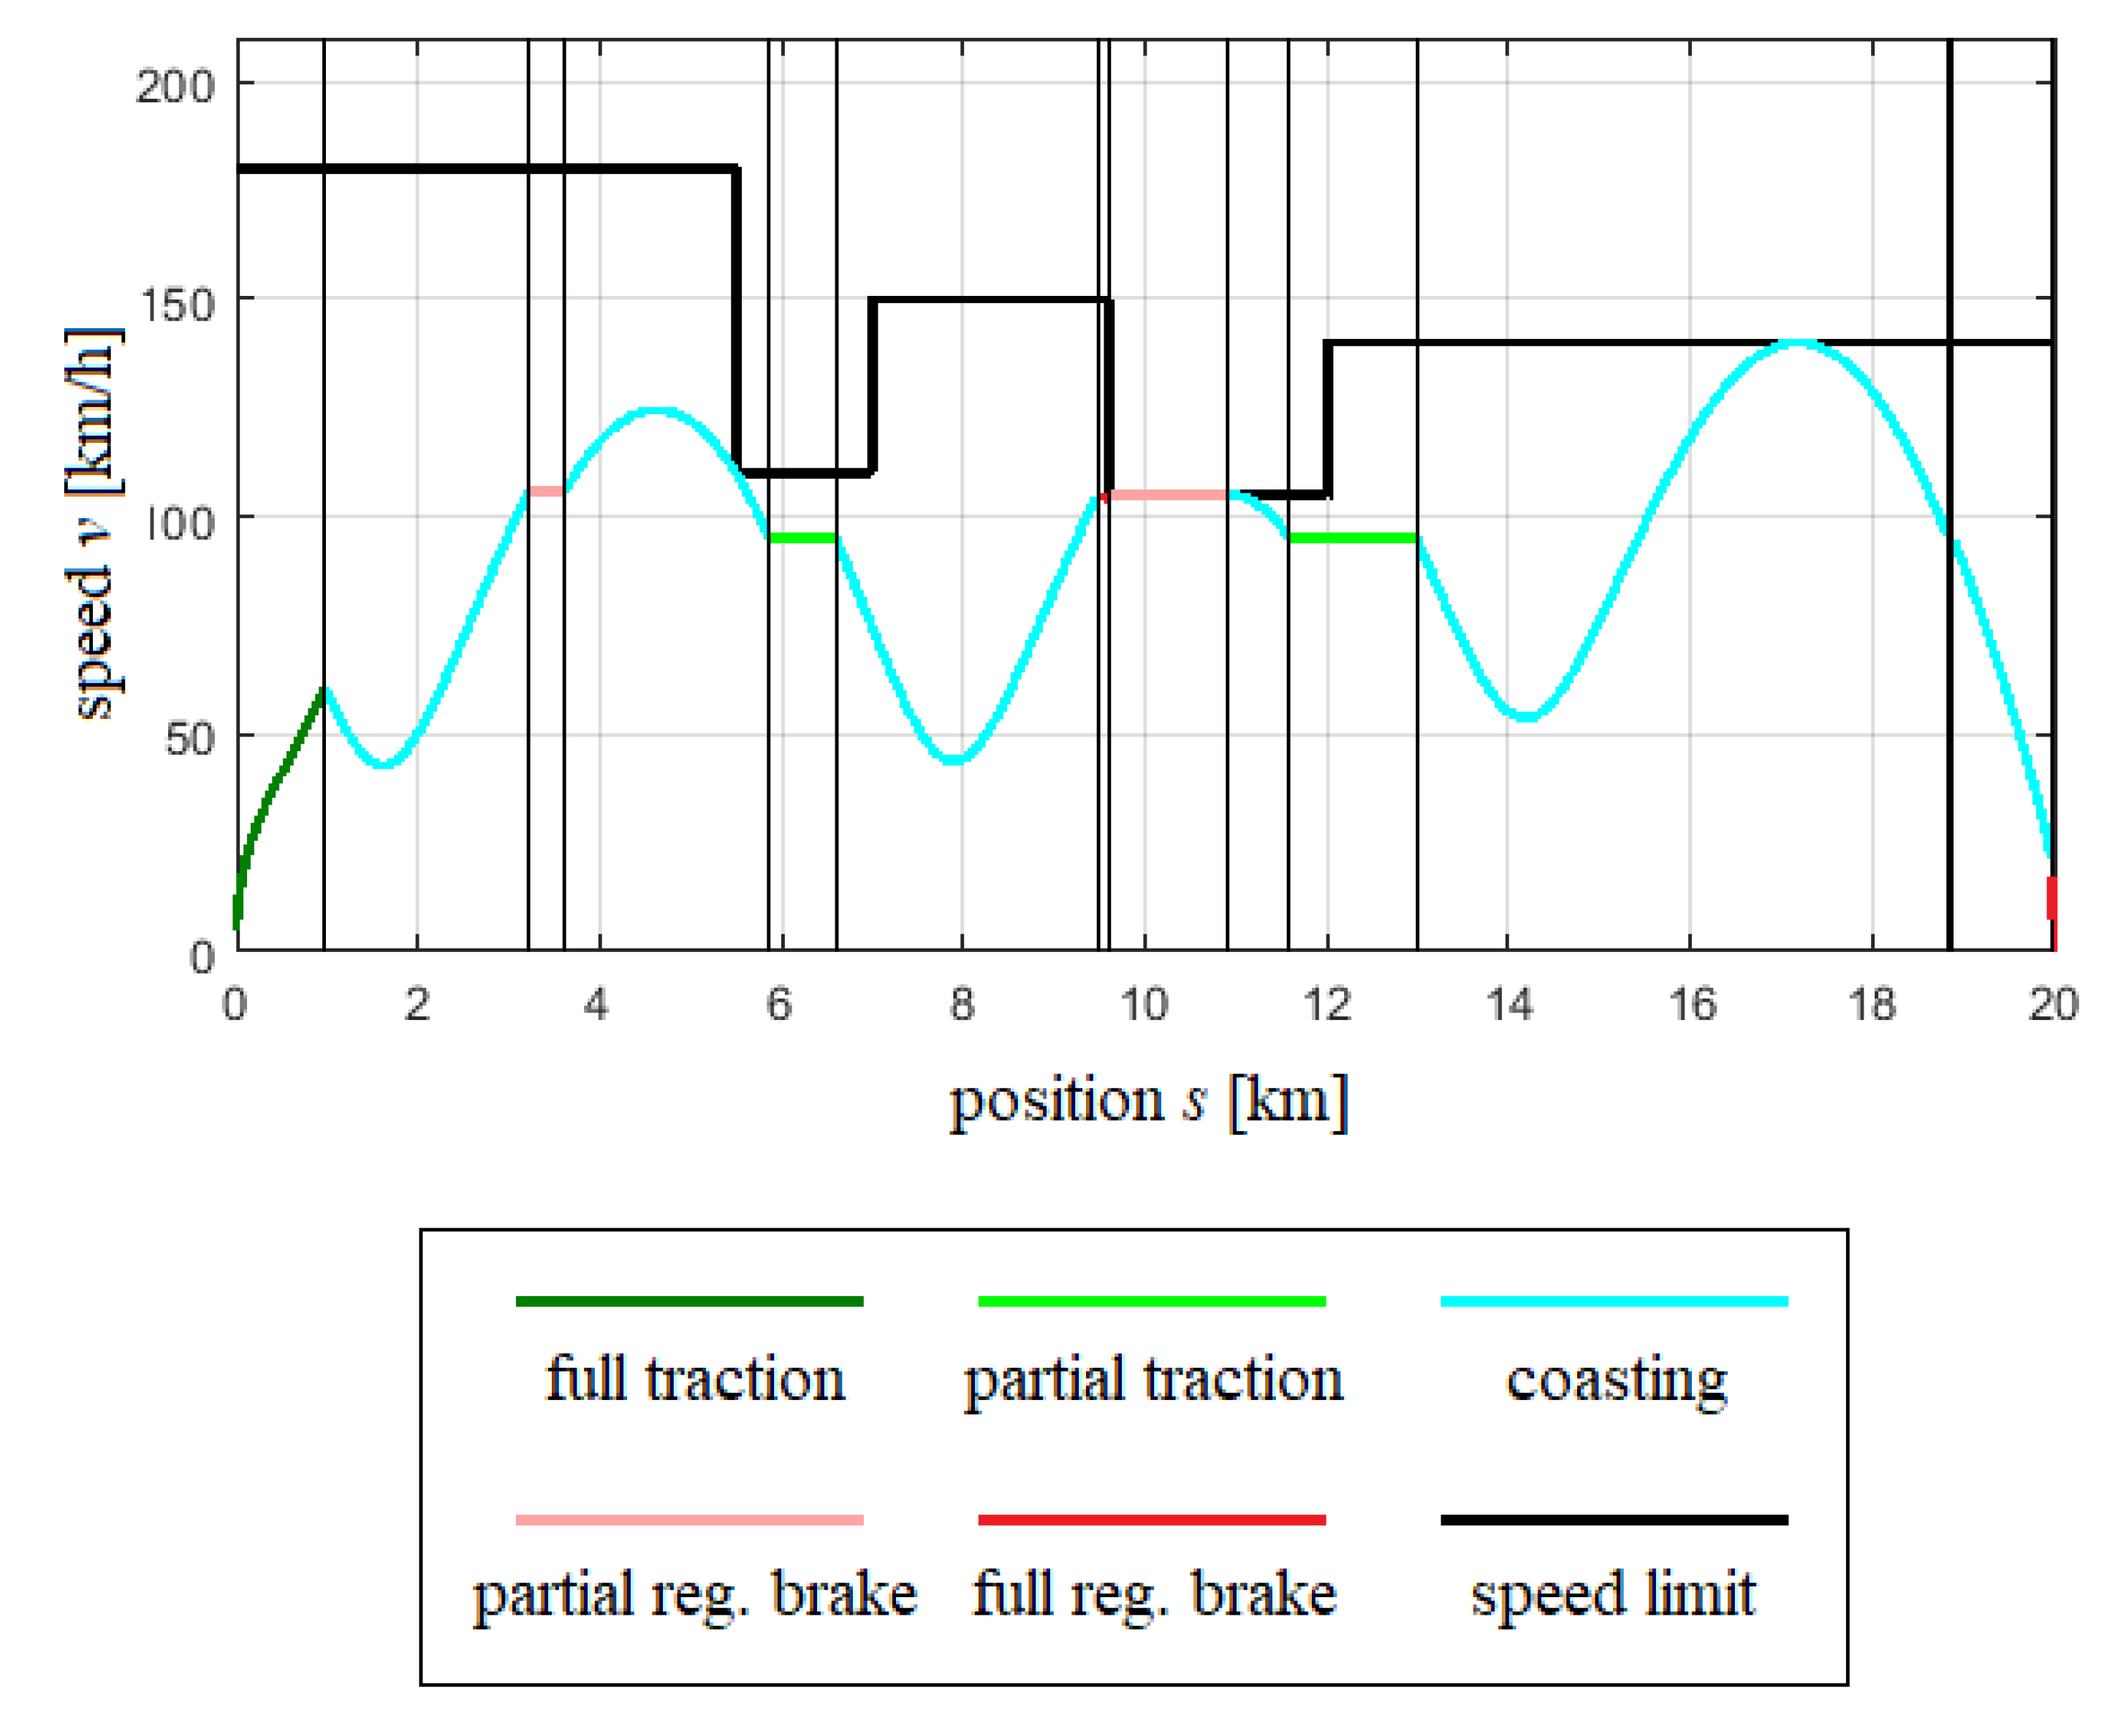
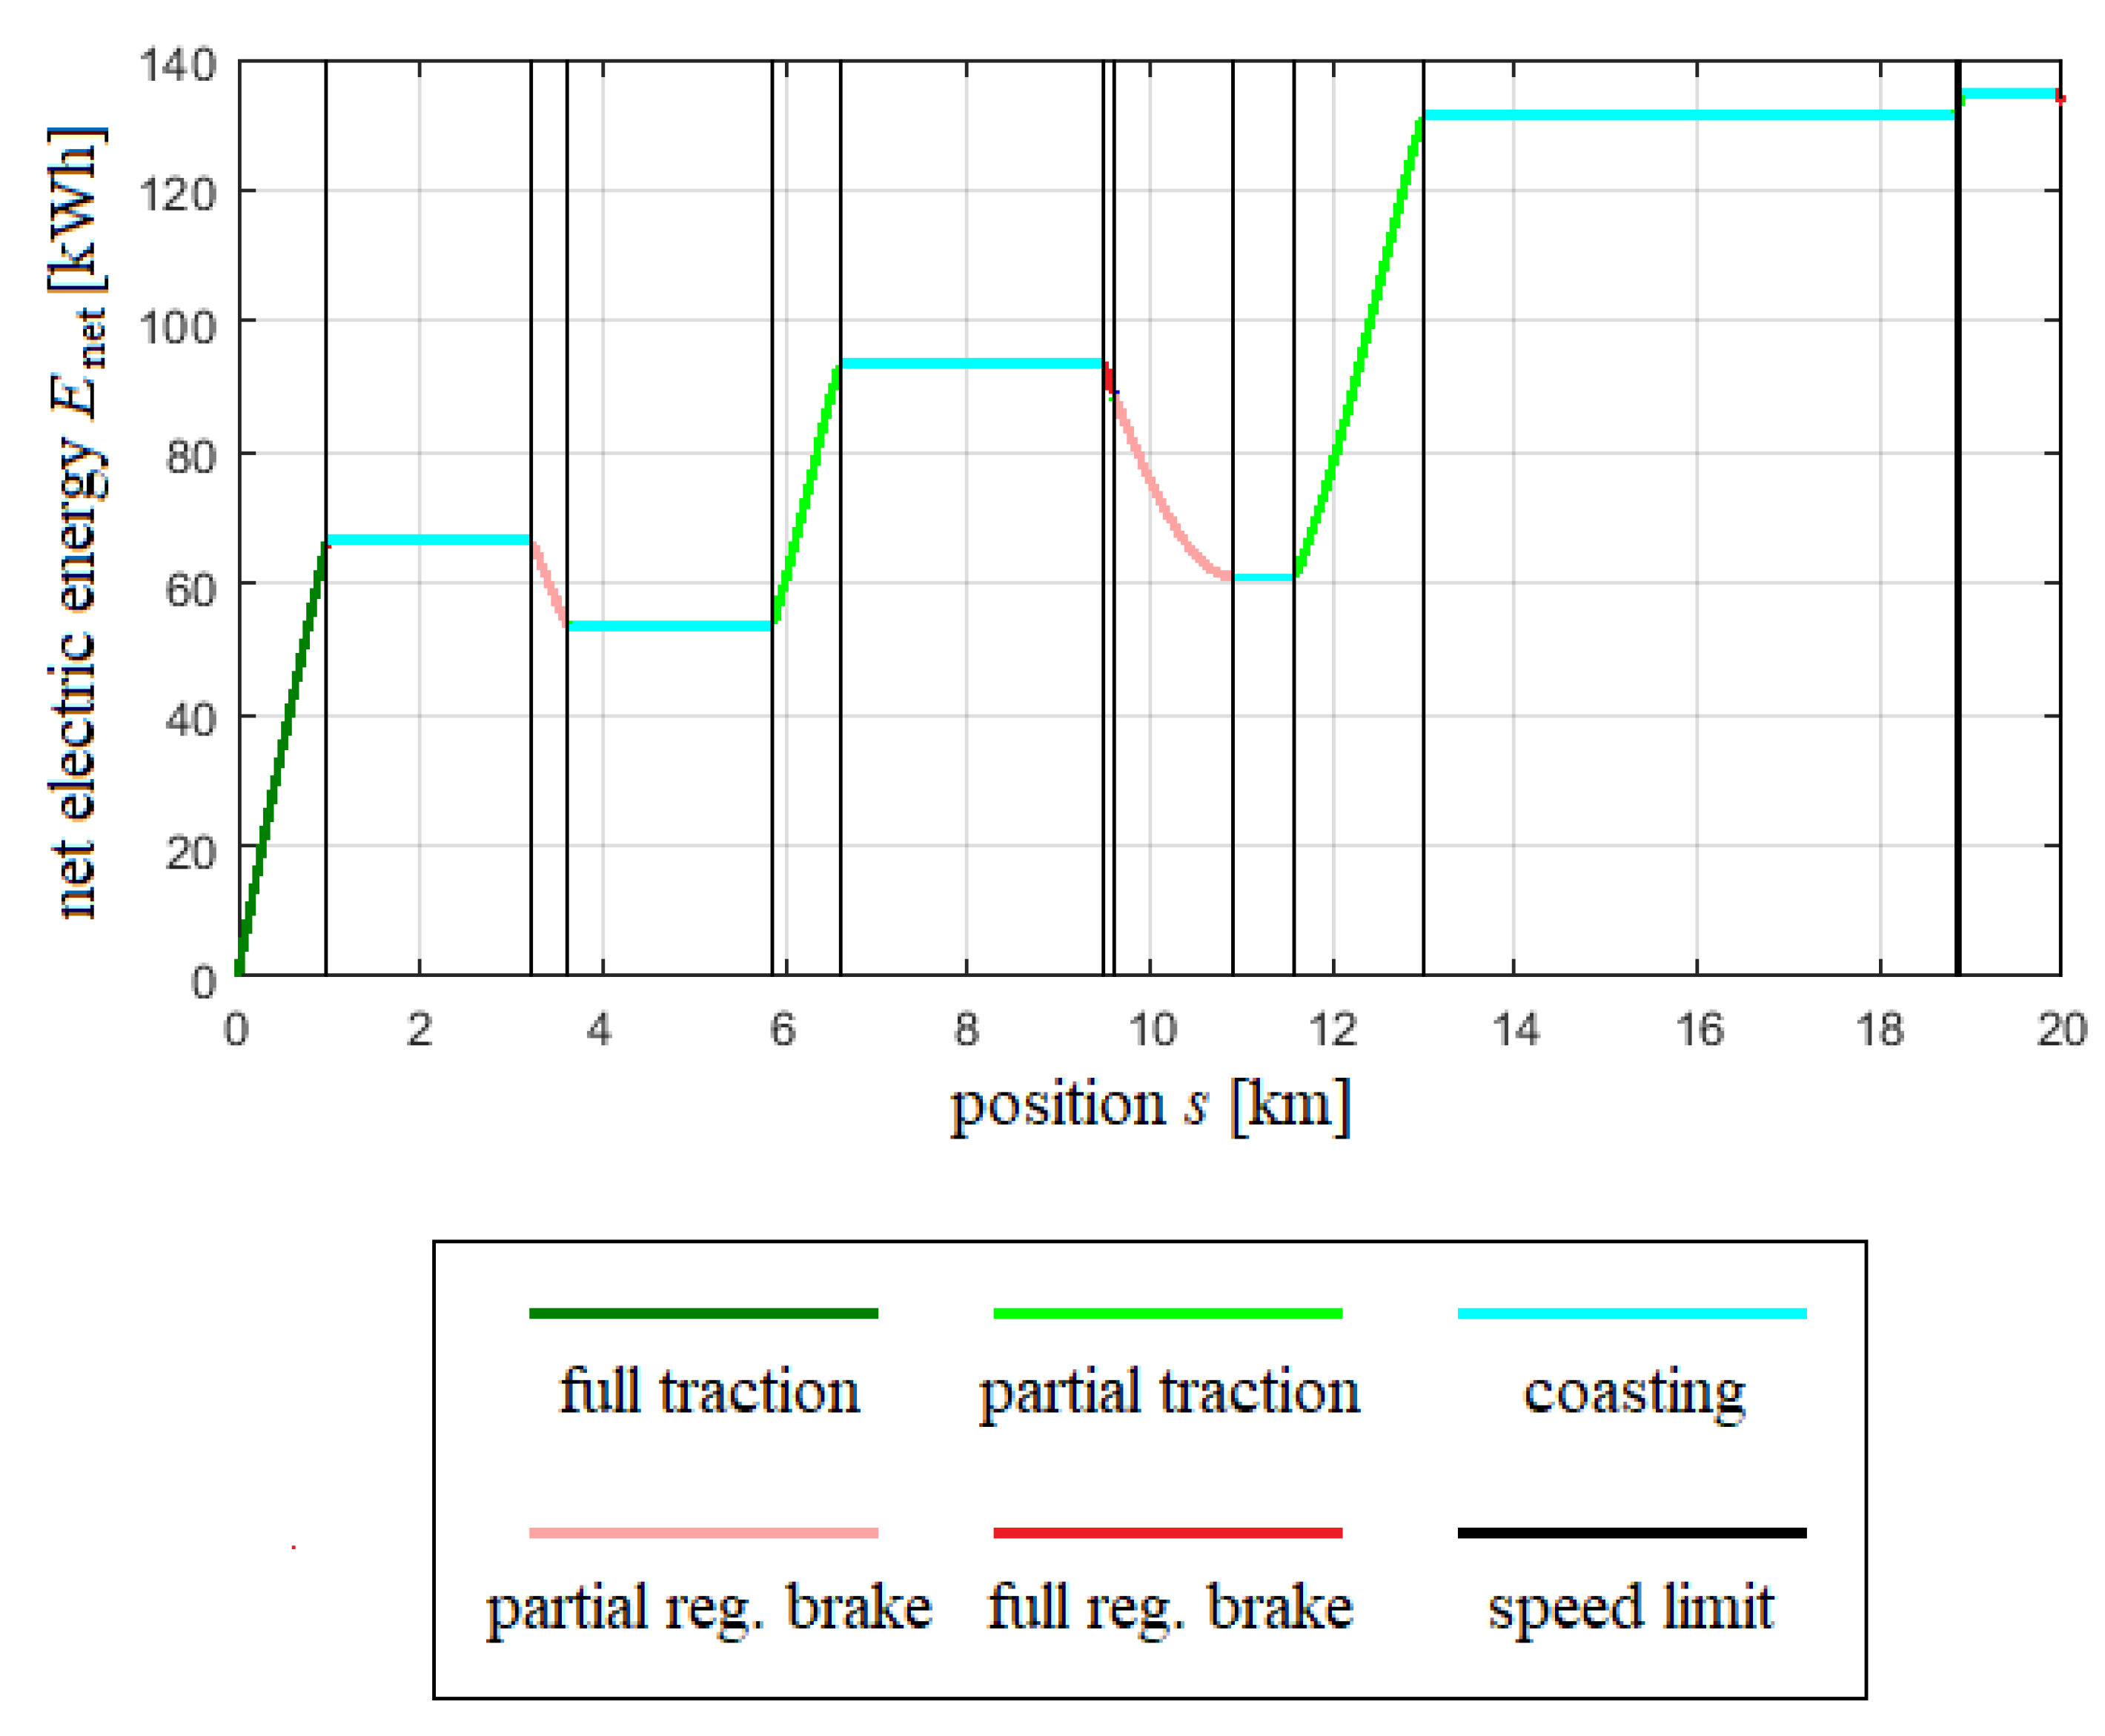
In
Figure 17 and
Figure 18, speed and electric energy are shown for Example 4 at
.
Figure 1.
Maximum force for traction and regenerative brake.
Figure 1.
Maximum force for traction and regenerative brake.
Figure 2.
Track altitude in Example 1.
Figure 2.
Track altitude in Example 1.
Figure 3.
Example 1: pcs-intervals PT and PB, fastest motion, and numbering.
Figure 3.
Example 1: pcs-intervals PT and PB, fastest motion, and numbering.
Figure 4.
Example 1: K-trajectories starting from (port 1) for various values of at . Trajectories change from full traction to coasting and then to full regenerative braking. The blue trajectory connects port 1 with port 2.
Figure 4.
Example 1: K-trajectories starting from (port 1) for various values of at . Trajectories change from full traction to coasting and then to full regenerative braking. The blue trajectory connects port 1 with port 2.
Figure 5.
Example 1: -trajectories starting from (port 1) for various values of at . Trajectories change from full traction to coasting and then to full regenerative braking. The blue trajectory connects port 1 with port 2.
Figure 5.
Example 1: -trajectories starting from (port 1) for various values of at . Trajectories change from full traction to coasting and then to full regenerative braking. The blue trajectory connects port 1 with port 2.
Figure 6.
Example 1: K-trajectories starting from PT-interval with number 3.
Figure 6.
Example 1: K-trajectories starting from PT-interval with number 3.
Figure 7.
Example 1: -trajectories starting from PT-interval with number 3.
Figure 7.
Example 1: -trajectories starting from PT-interval with number 3.
Figure 8.
Example 1: K-trajectories starting from interval 4, heading for interval 8.
Figure 8.
Example 1: K-trajectories starting from interval 4, heading for interval 8.
Figure 9.
Example 1: -trajectories starting from interval 4, heading for interval 8.
Figure 9.
Example 1: -trajectories starting from interval 4, heading for interval 8.
Figure 10.
Example 2: K-trajectories.
Figure 10.
Example 2: K-trajectories.
Figure 11.
Example 2: -trajectories.
Figure 11.
Example 2: -trajectories.
Figure 12.
Example 2: zoom into -trajectories.
Figure 12.
Example 2: zoom into -trajectories.
Figure 13.
Example 3: K-trajectories.
Figure 13.
Example 3: K-trajectories.
Figure 14.
Example 3: -trajectories.
Figure 14.
Example 3: -trajectories.
Figure 15.
Example 4: K-trajectories.
Figure 15.
Example 4: K-trajectories.
Figure 16.
Example 4: -trajectories.
Figure 16.
Example 4: -trajectories.
Figure 17.
Example 4: train speed.
Figure 17.
Example 4: train speed.
Figure 18.
Example 4: net electric energy.
Figure 18.
Example 4: net electric energy.
Figure 19.
Total energy demand over reference time T for track section 1.
Figure 19.
Total energy demand over reference time T for track section 1.
Figure 20.
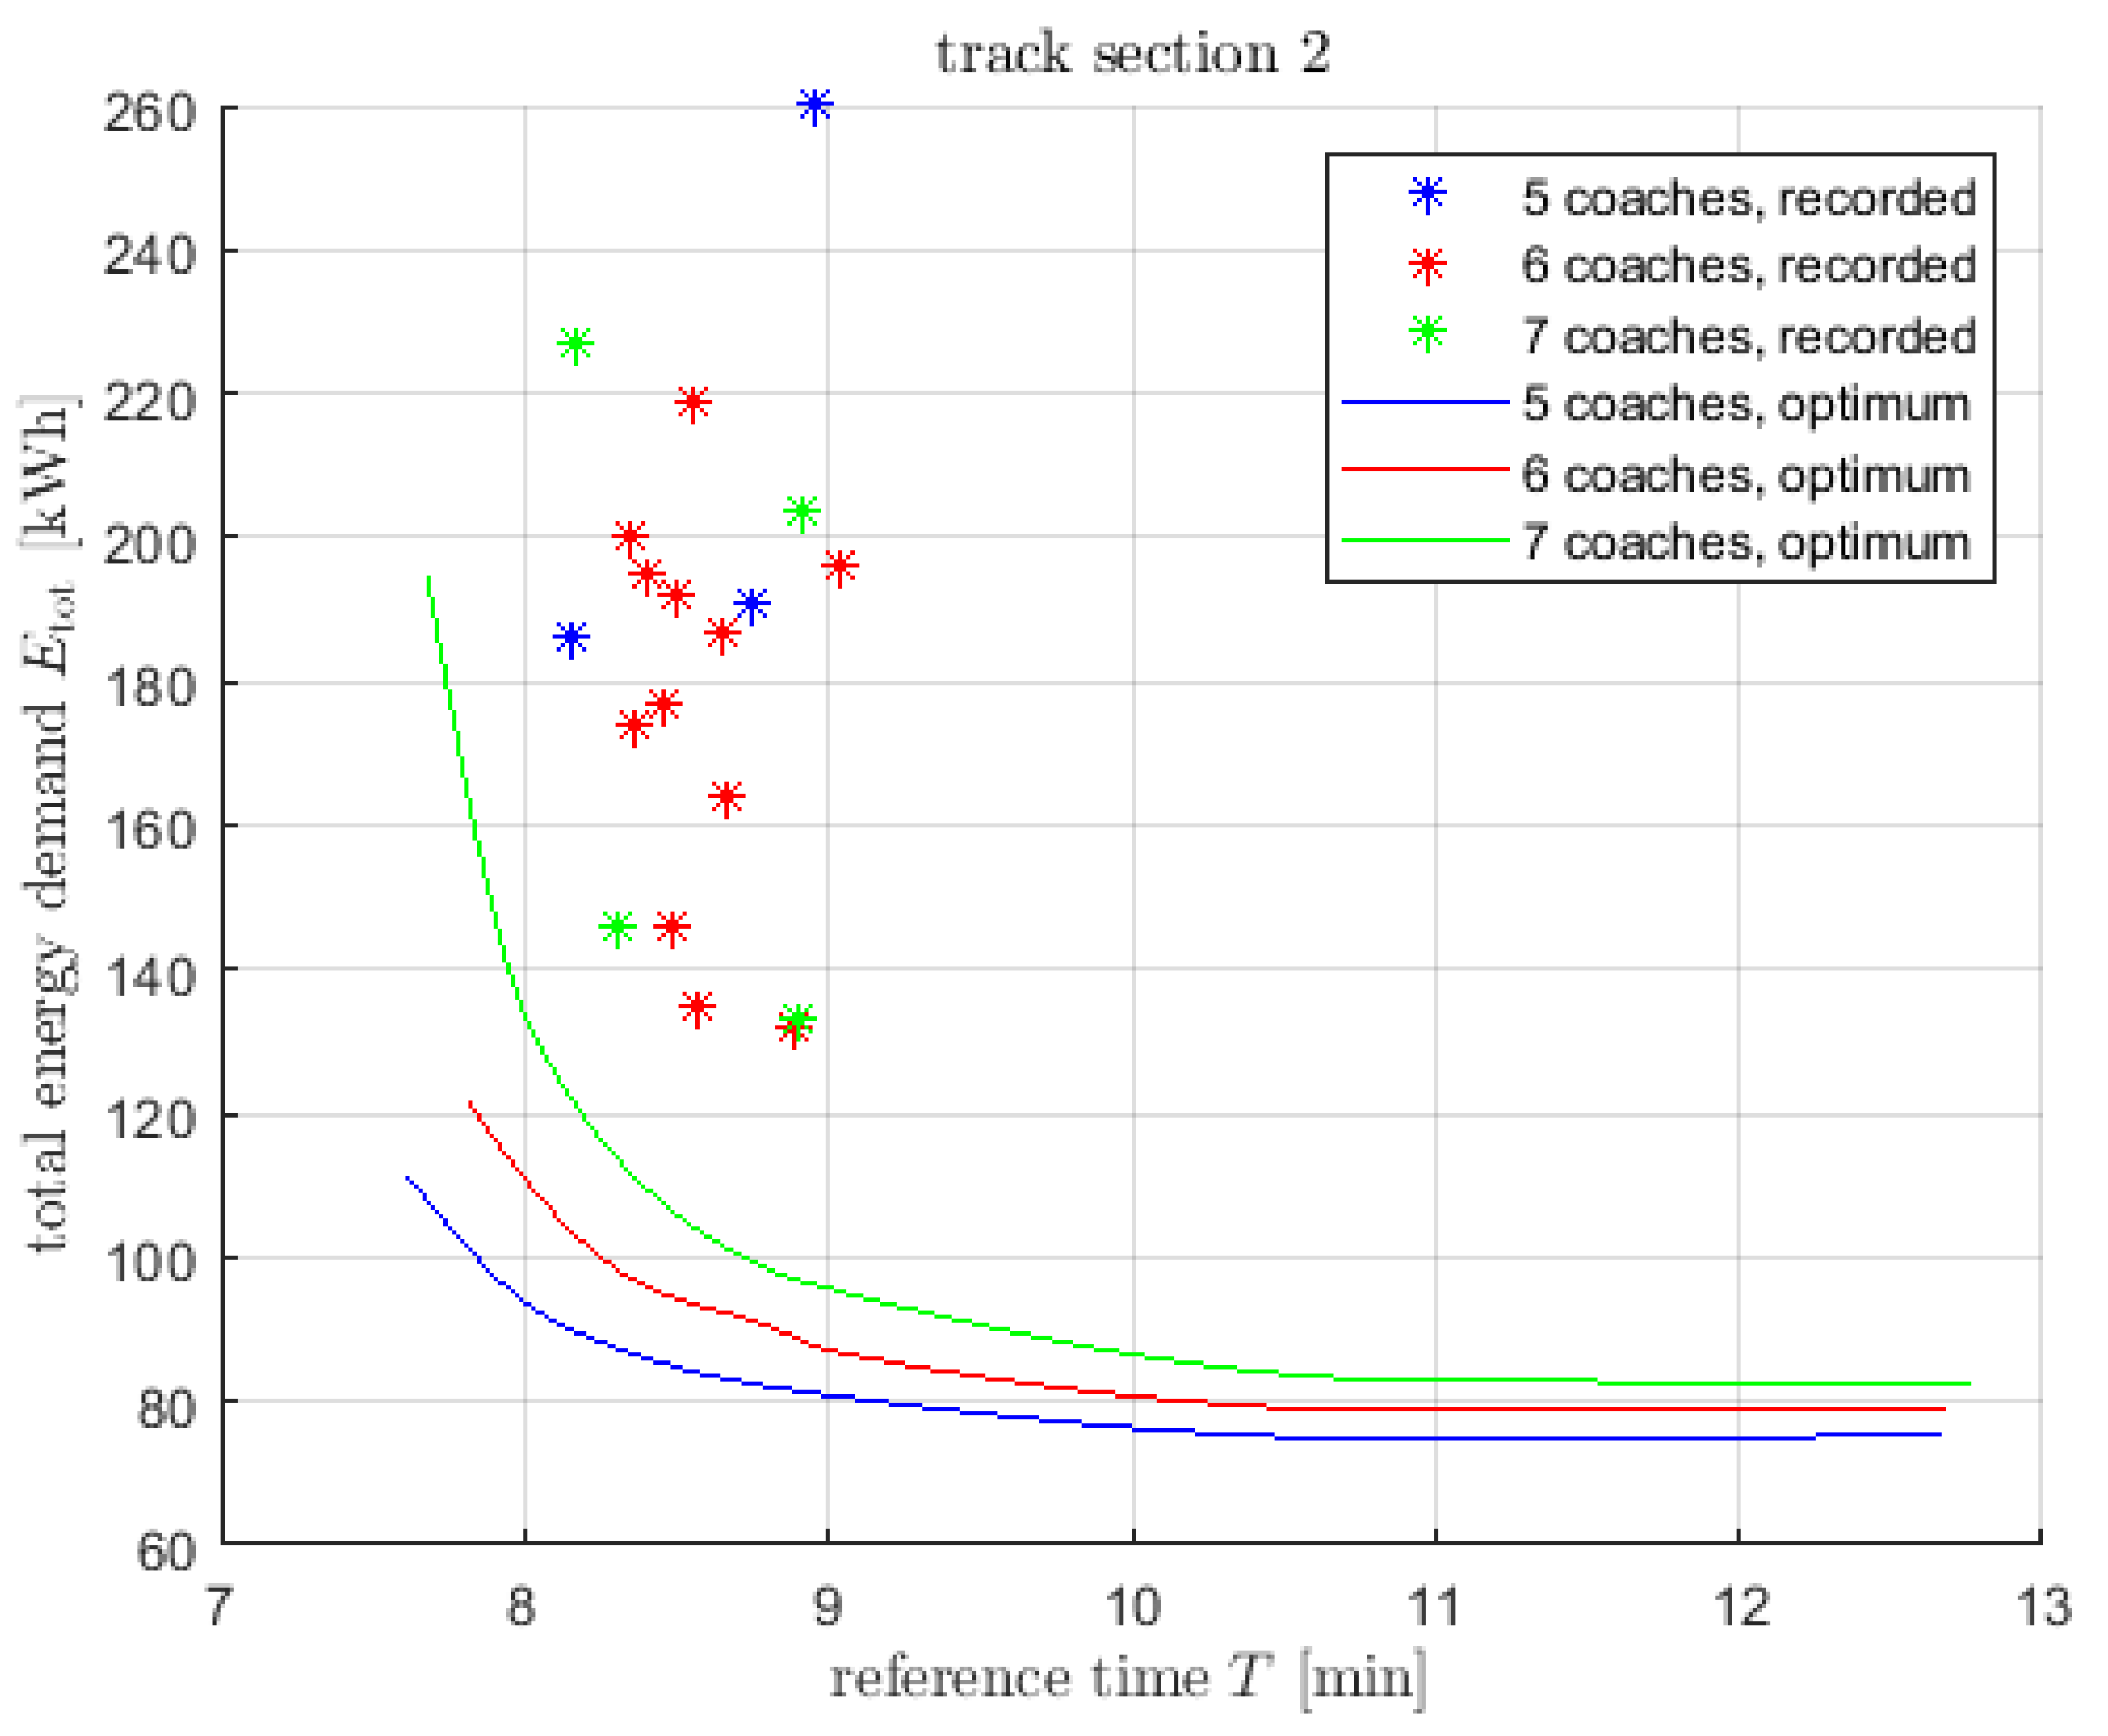
Total energy demand over reference time T for track section 2.
Figure 20.
Total energy demand over reference time T for track section 2.
Figure 21.
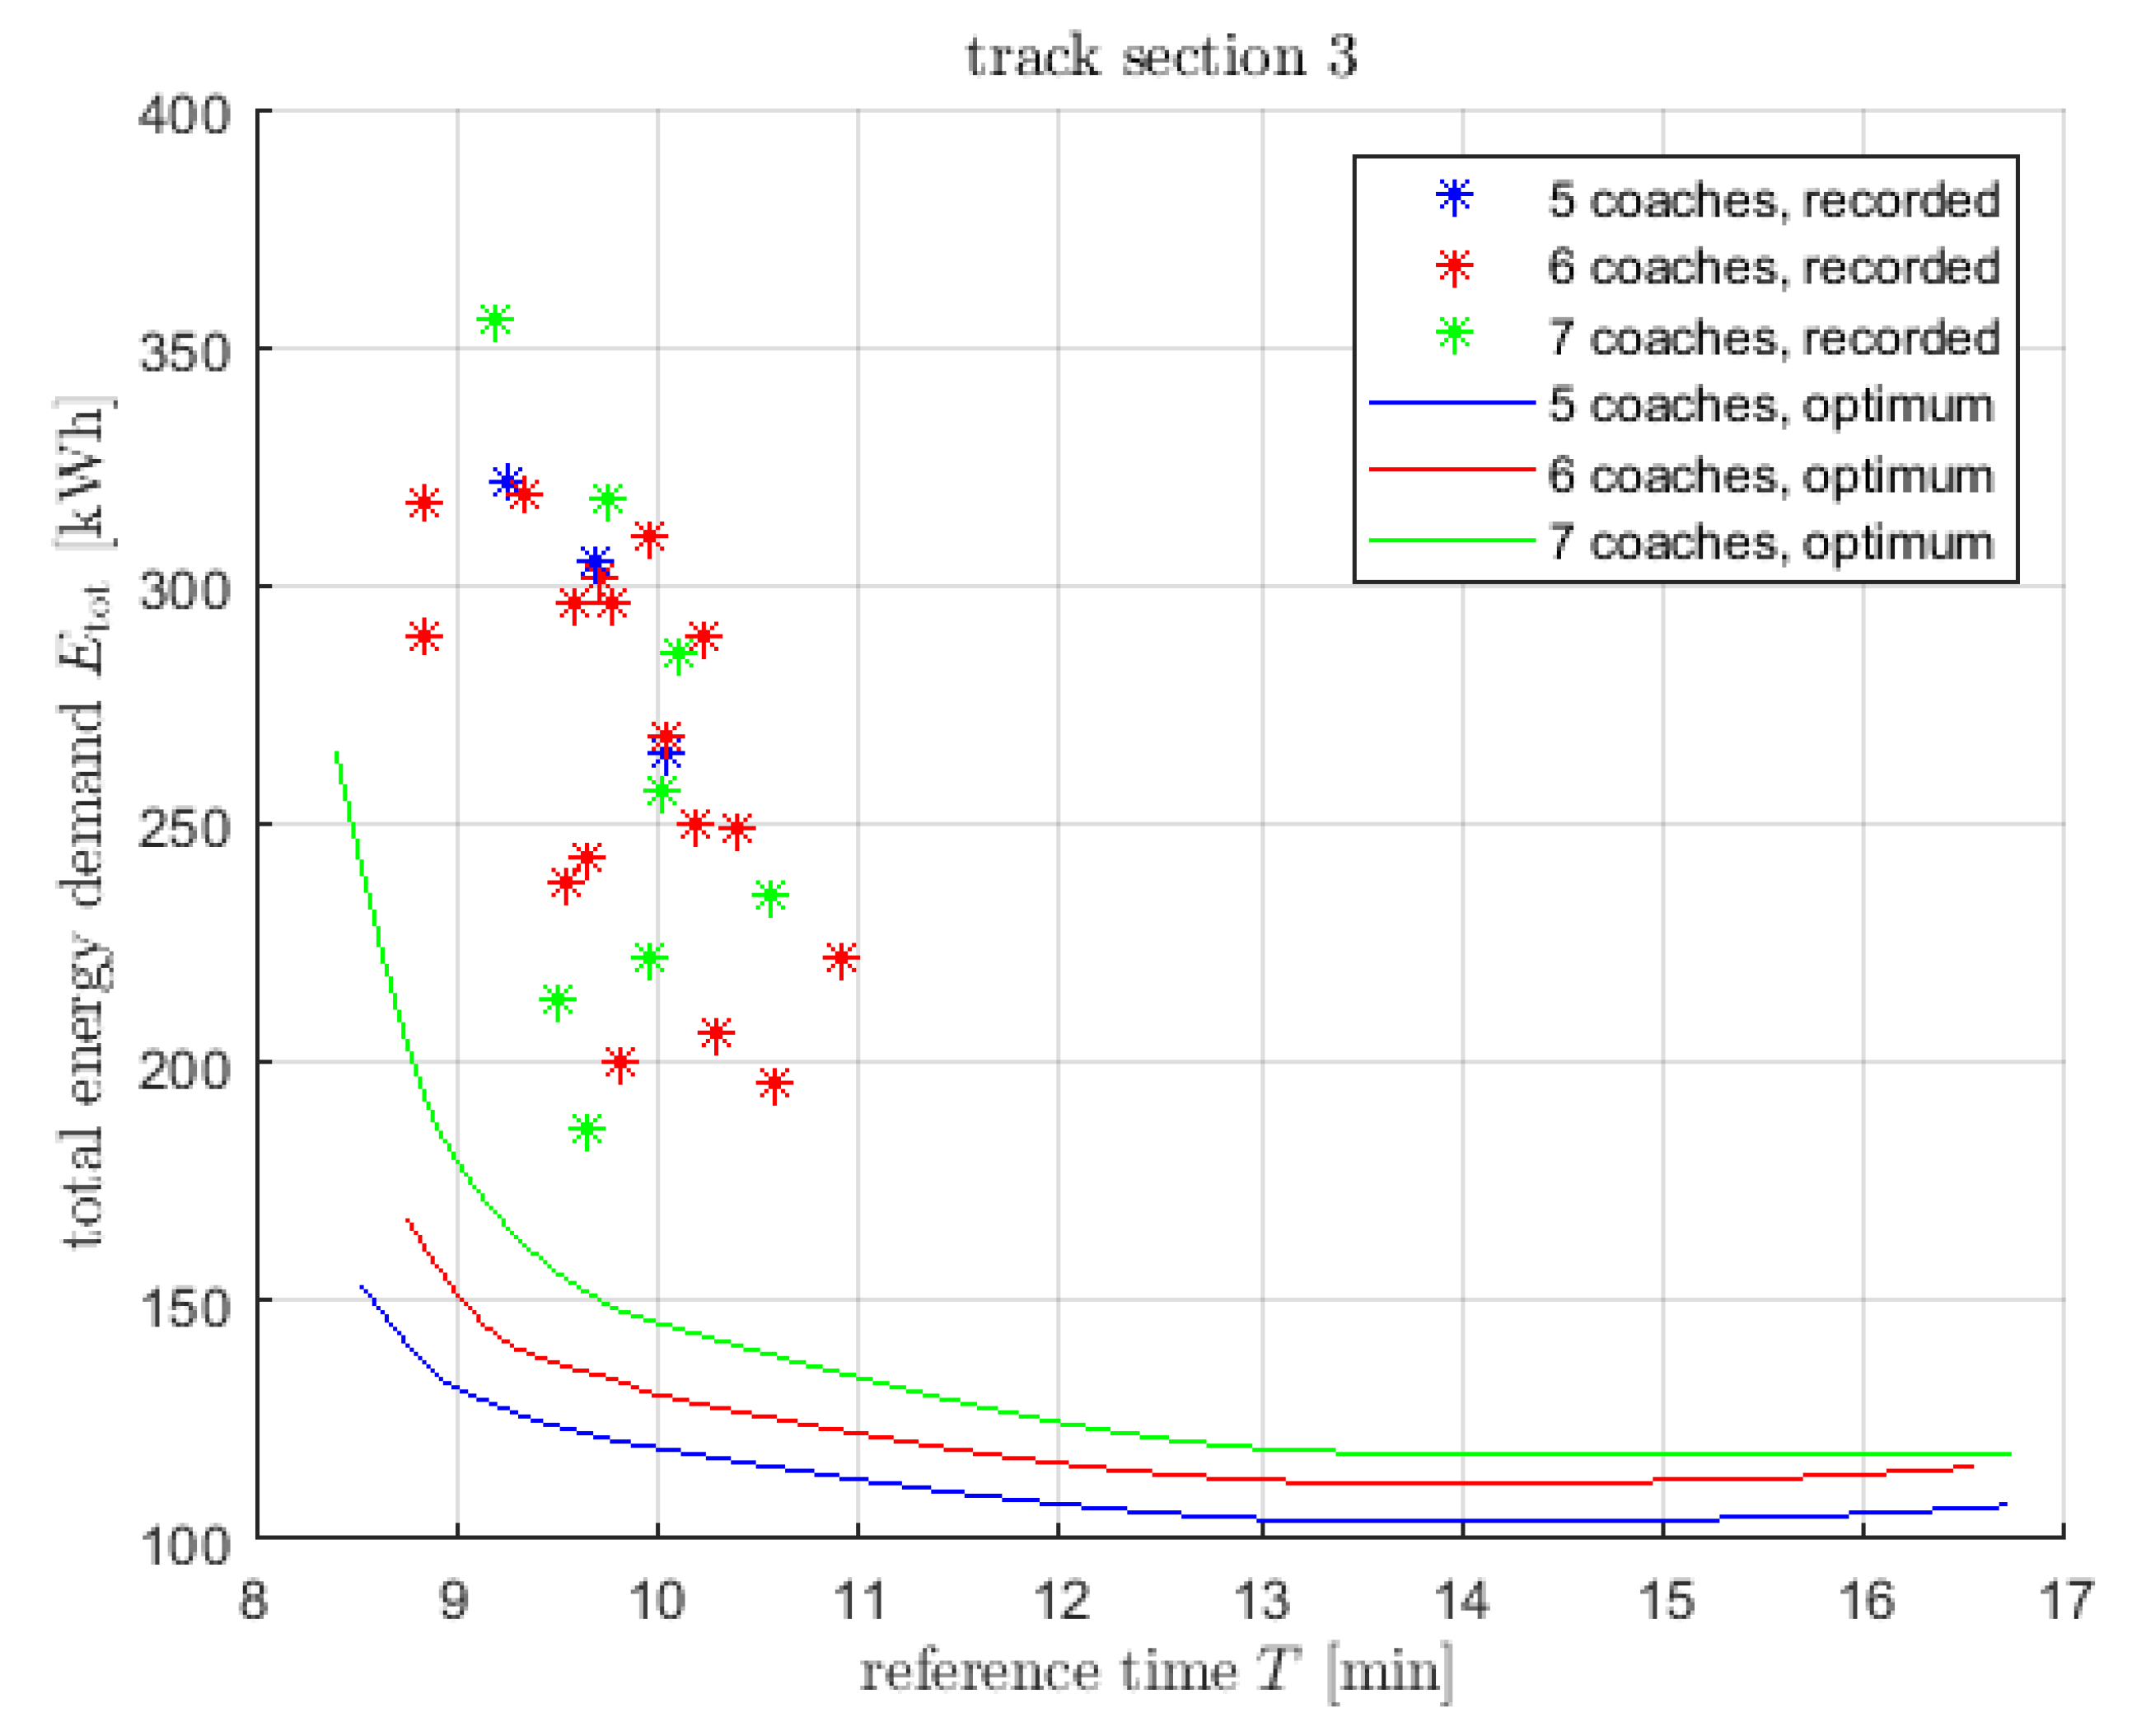
Total energy demand over reference time T for track section 3.
Figure 21.
Total energy demand over reference time T for track section 3.
Figure 22.
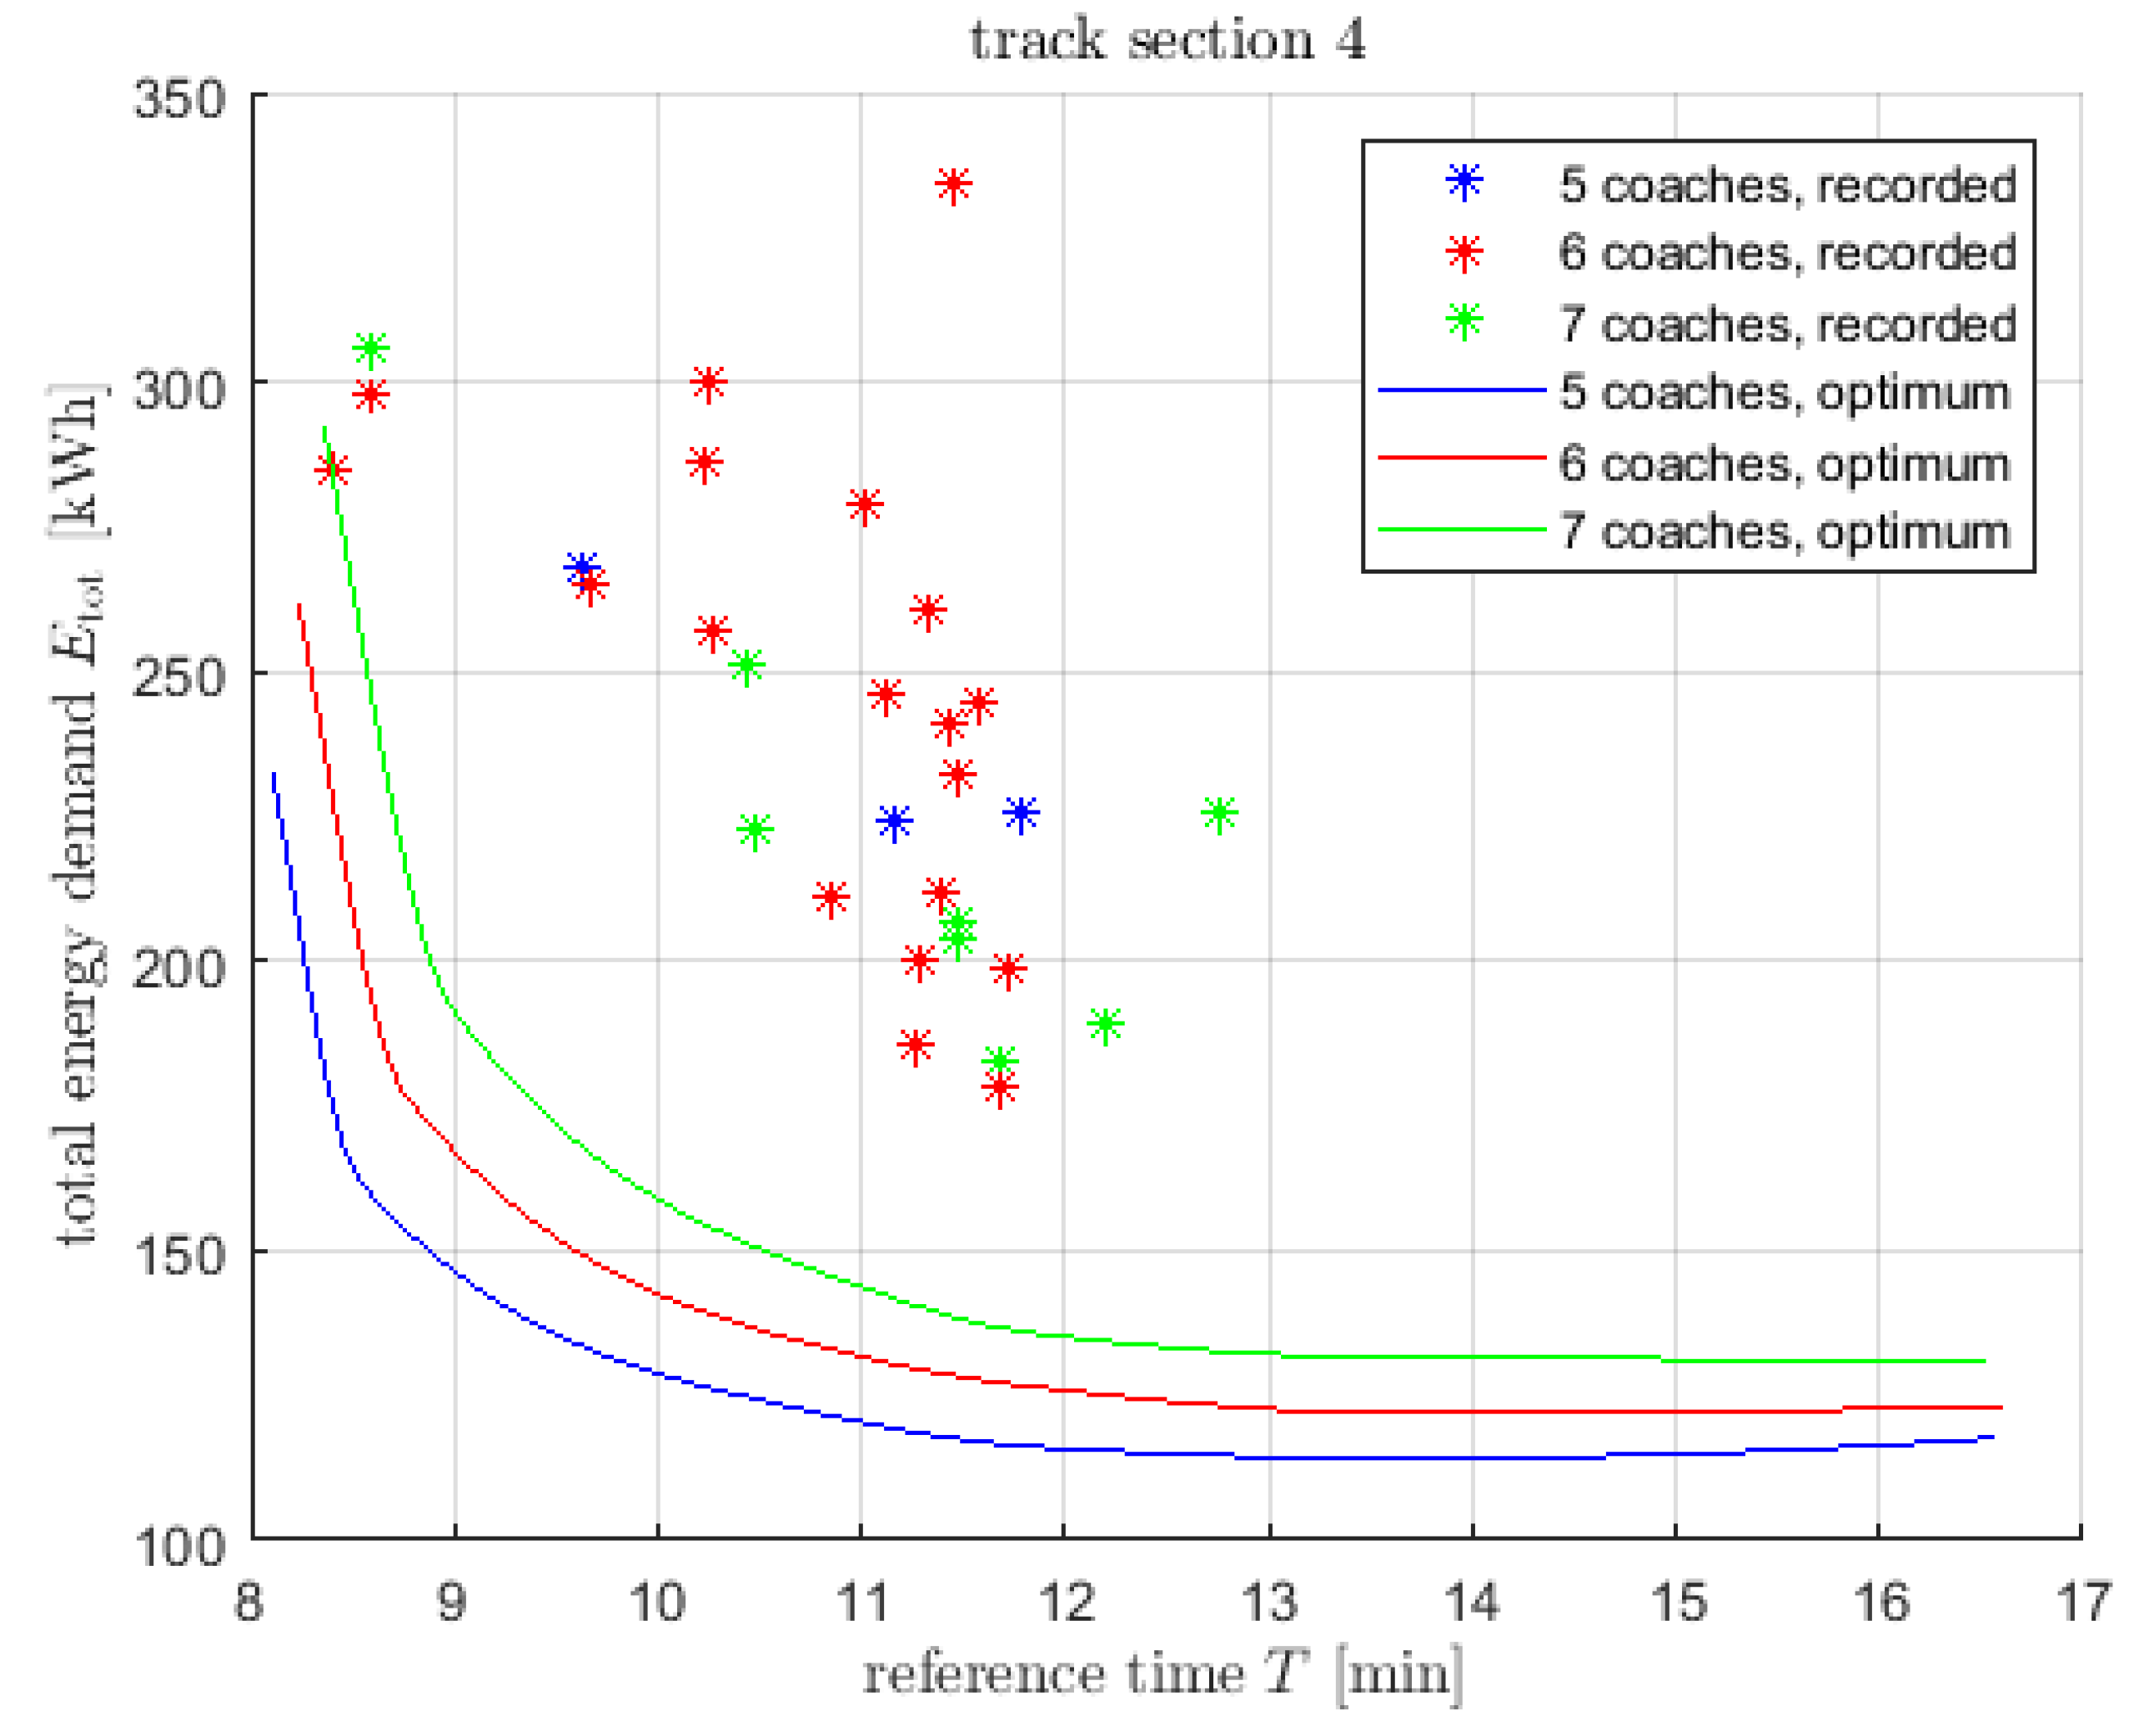
Total energy demand over reference time T for track section 4.
Figure 22.
Total energy demand over reference time T for track section 4.
Figure 23.
Energy ratio for each run, shown in descending order.
Figure 23.
Energy ratio for each run, shown in descending order.
Table 1.
Case distinction for . ‘cont.’ means that the continuity of the Lagrange multipliers has been exploited. The corresponding value is only valid in the interior of the state domain, i.e., when .
Table 1.
Case distinction for . ‘cont.’ means that the continuity of the Lagrange multipliers has been exploited. The corresponding value is only valid in the interior of the state domain, i.e., when .
| case |
|
|
|
|
|
|
|
|
0 |
0 |
|
|
0 |
| (full traction) |
(38) |
(38) |
(41) |
(49) |
(48) |
(41) |
|
− |
0 |
0 |
|
0 |
0 |
| (partial traction) |
|
(38) |
cont. |
(49) |
cont. |
(41) |
|
0 |
0 |
|
|
0 |
0 |
| (coasting) |
(38) |
(38) |
(48) |
(41) |
(41) |
(41) |
|
0 |
− |
|
0 |
0 |
0 |
| (partial reg. brake) |
(38) |
|
(48) |
cont. |
(41) |
cont. |
|
0 |
|
|
0 |
0 |
|
| (full reg. brake) |
(38) |
(38) |
(48) |
(41) |
(41) |
(49) |
Table 2.
Parameters of Example 1.
Table 2.
Parameters of Example 1.
| parameter |
symbol |
value |
| number of coaches |
n |
6 |
| mass of locomotive |
|
|
| total mass of train |
m |
|
| engine efficiency |
|
|
| efficiency of regenerative brake |
|
|
| max. mechanical power for traction |
|
|
| max. mechanical power for regenerative brake |
|
|
| max. force of regenerative brake |
|
|
| air drag coefficient for locomotive |
|
|
| air drag coefficient for first coach |
|
|
| air drag coefficient for middle coaches |
|
|
| air drag coefficient for last coach |
|
|
| rolling friction coefficient |
|
|
| coefficient accounting for rotating masses |
|
|
Table 3.
Speed limits in Example 2.
Table 3.
Speed limits in Example 2.
| from position s [km] |
to position s [km] |
max. speed [km/h] |
| 0 |
5.5 |
160 |
| 5.5 |
7.0 |
110 |
| 7.0 |
9.6 |
150 |
| 9.6 |
12.0 |
105 |
| 12.0 |
20.0 |
140 |
Table 4.
Port connections in Example 2.
Table 4.
Port connections in Example 2.
| port connection |
take-off and landing type |
remark |
|
(T1), (L2) |
K has kink point when full traction changes to coasting. |
|
(T3), (L3) |
New SL-TP 4 included, connected to 5, jumps at 4. |
|
(T5), (L5) |
jumps at end of 5. |
|
(T5), (L4) |
jumps at end of 5. Since at the beginning of interval 9, no new speed limit touchpoint is included. |
|
(T5), (L1) |
jumps at end of 6. |
|
(T7), (L3) |
A connection with constant speed, but with a jump of at new SL-TP 10, which is connected to 11. |
|
(T5), (L1) |
jumps at end of 11. |
|
(T5), (L2) |
jumps at end of 11. Same K-trajectory as at the beginning, but then change to coasting. |
|
(T3), (L9) |
Landing at newly included SL-TP 14. |
|
(T8), (L1) |
Take-off from SL-TP 14 with -jump. |
|
(T2), (L1) |
Full traction. |
|
(T2), (L10) |
Coasting to stop. |
Table 5.
Port connections in Example 3.
Table 5.
Port connections in Example 3.
| port connection |
take-off and landing type |
remark |
|
(T1), (L1) |
|
|
(T1), (L2) |
K-trajectories of and coincide at the beginning. |
|
(T3), (L9) |
New SL-TP 4 is inside the s-range of interval 5. SL-TP 4 needs to come first in numbering. |
|
(T8), (L1) |
jumps at SL-TP 4. |
|
(T2), (L2) |
|
|
(T3), (L9) |
SL-TP 7 is inserted, lying exactly between intervals 6 and 8. |
|
(T8), (L1) |
jumps at SL-TP 7. |
|
(T2), (L2) |
|
|
(T2), (L1) |
Trajectory is close to speed limit but does not touch. |
|
(T2), (L10) |
Coasting to stop. |
Table 6.
Port connections in Example 4 at final value .
Table 6.
Port connections in Example 4 at final value .
| port connection |
take-off and landing type |
remark |
|
(T1), (L2) |
|
|
(T3), (L9) |
New SL-TP 3 is inside the s-range of interval 4. The SL-TP 3 needs to come first in numbering. |
|
(T8), (L1) |
jumps at SL-TP 3. |
|
(T2), (L2) |
|
|
(T2), (L7) |
Landing on start of interval 6 with . Any jump of here would lead to coasting and violate speed limit. Therefore, no new speed limit touchpoint is inserted. |
|
(T7), (L1) |
jumps at end of PB-SL 6. |
|
(T2), (L2) |
|
|
(T2), (L9) |
New SL-TP 9 is exactly between intervals 8 and 10. |
|
(T8), (L1) |
Take-off from SL-TP 9. |
|
(T2), (L10) |
Coasting and finally full regenerative braking to stop. |
