Submitted:
10 August 2023
Posted:
11 August 2023
You are already at the latest version
Abstract
Keywords:
1. Introduction
2. Experimental
2.1. Materials
2.2. Synthesis of PBMG and PBMG/CNC
2.3. Preparation of PLA/PBMG/CNC Blends
2.4. Measurement and Characterization
3. Results and Discussion
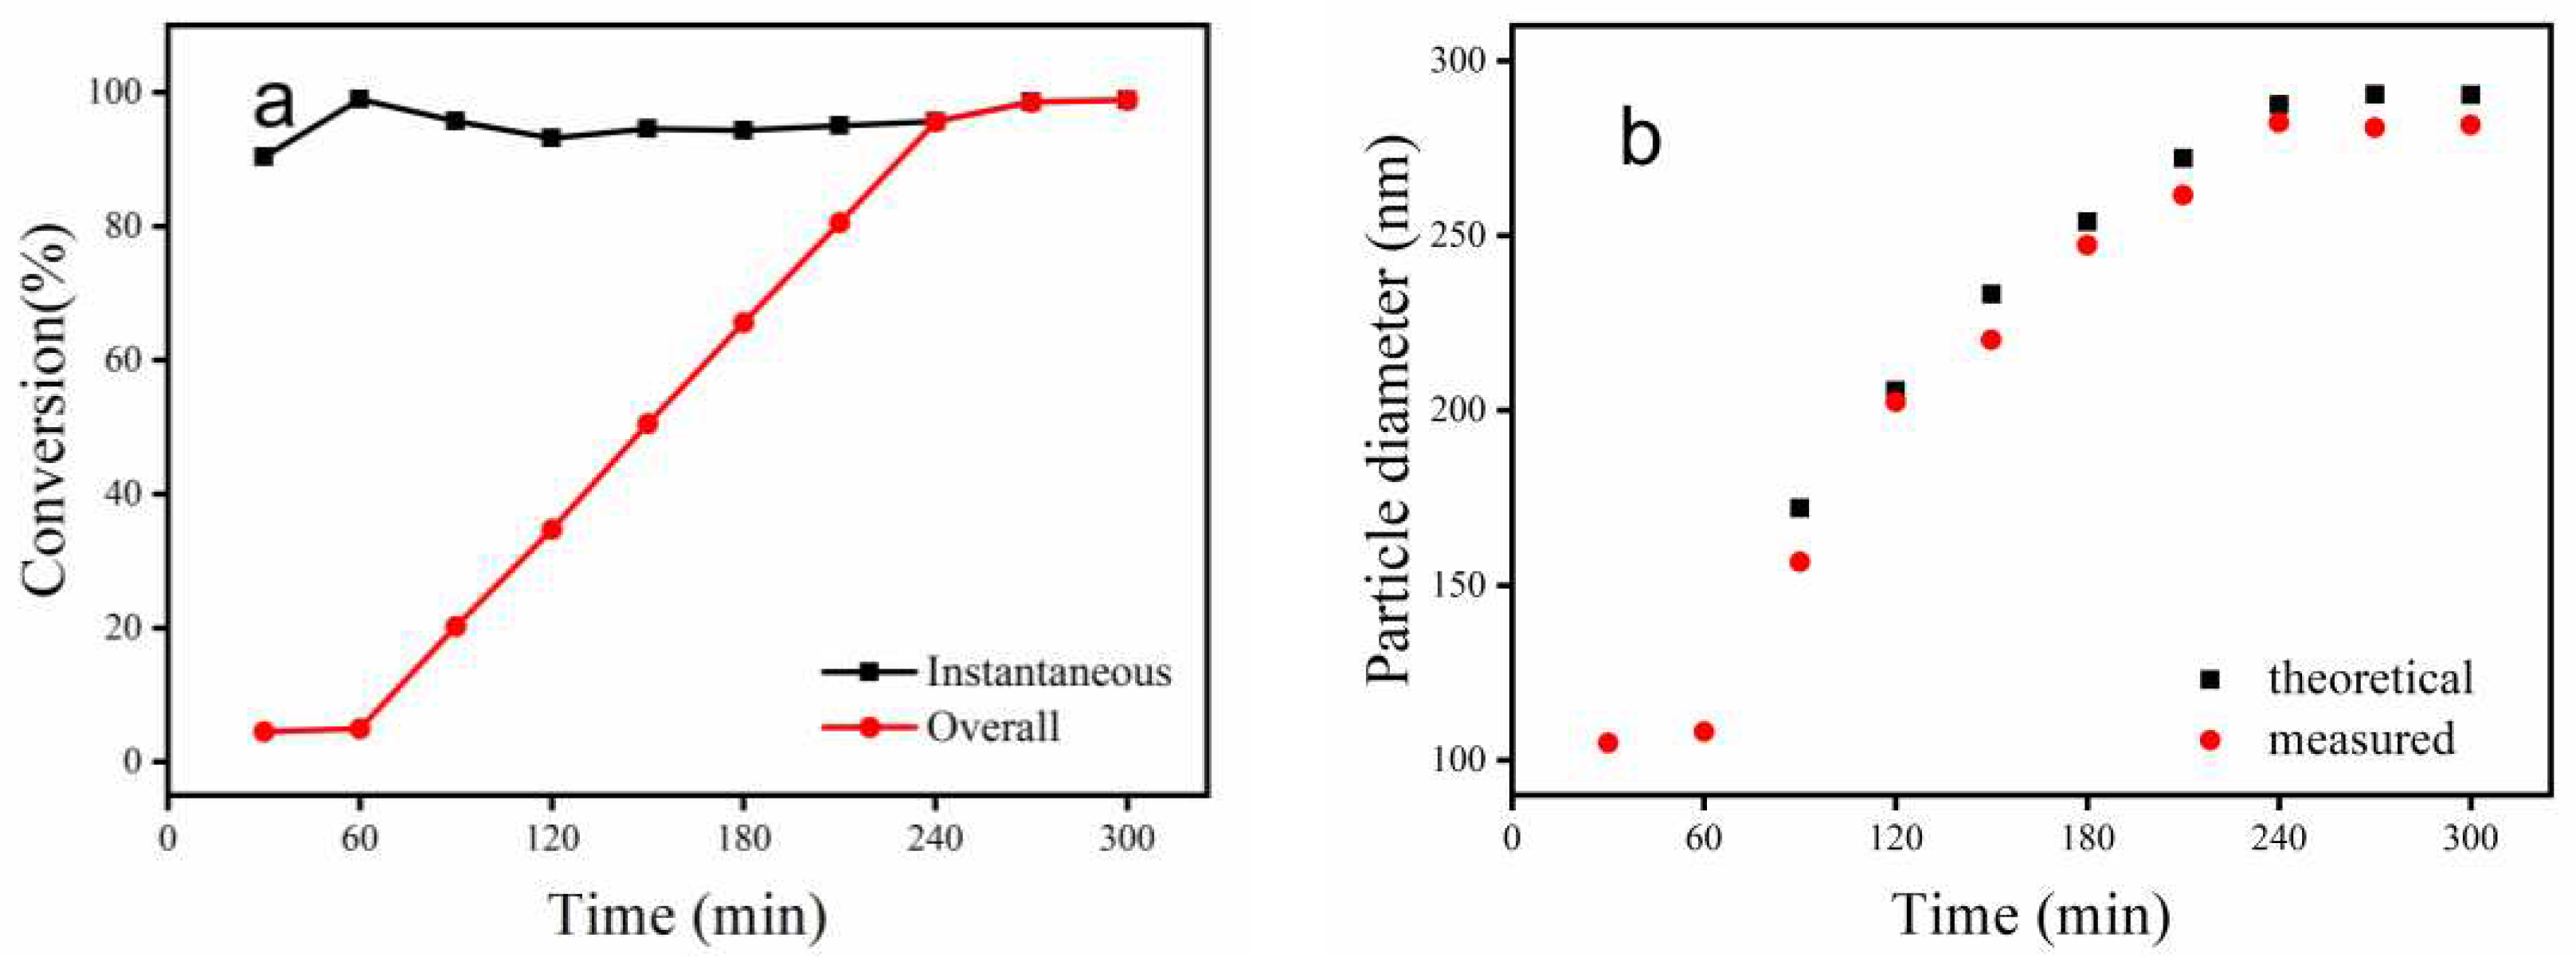
3.1. Conversion and Particle Diameter Analysis of Emulsion Polymerization
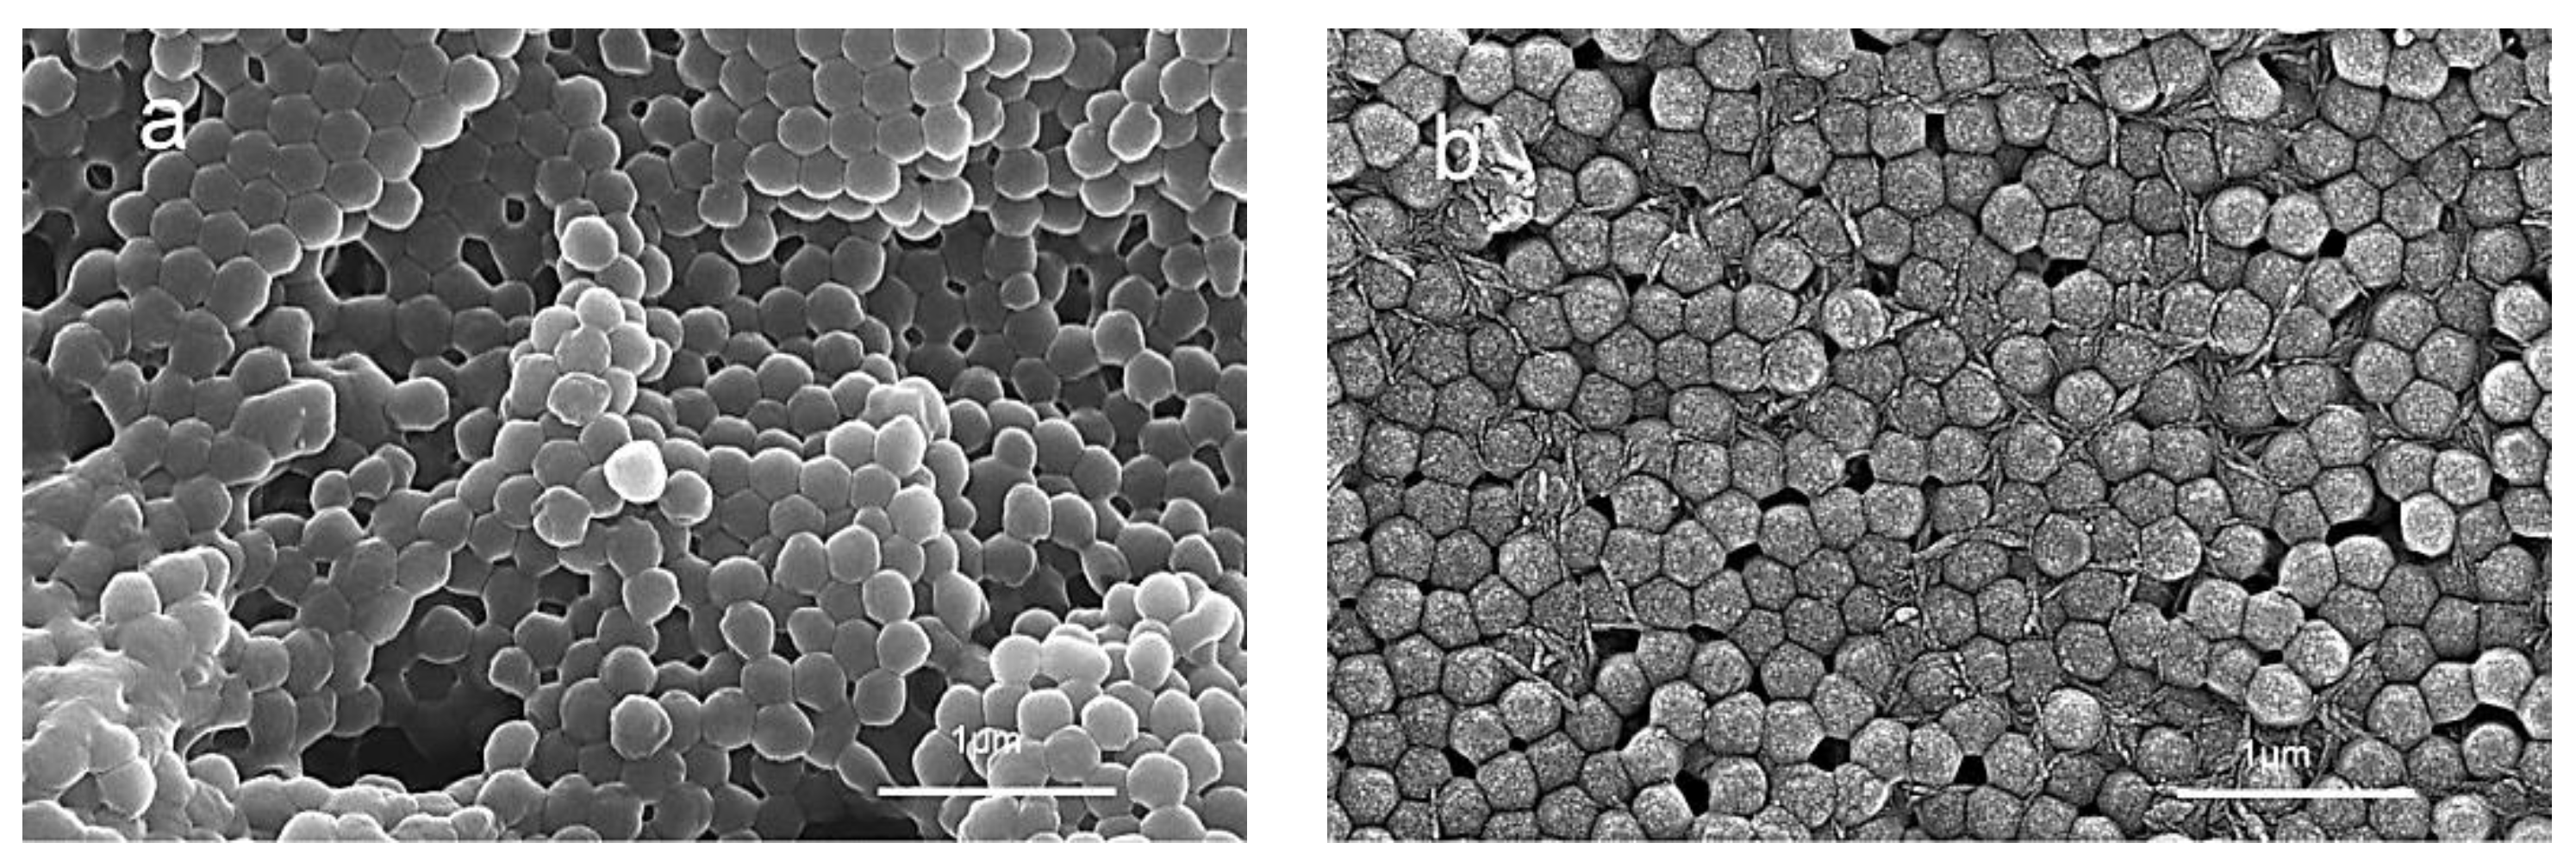
3.2. Particle Morphology and Structure
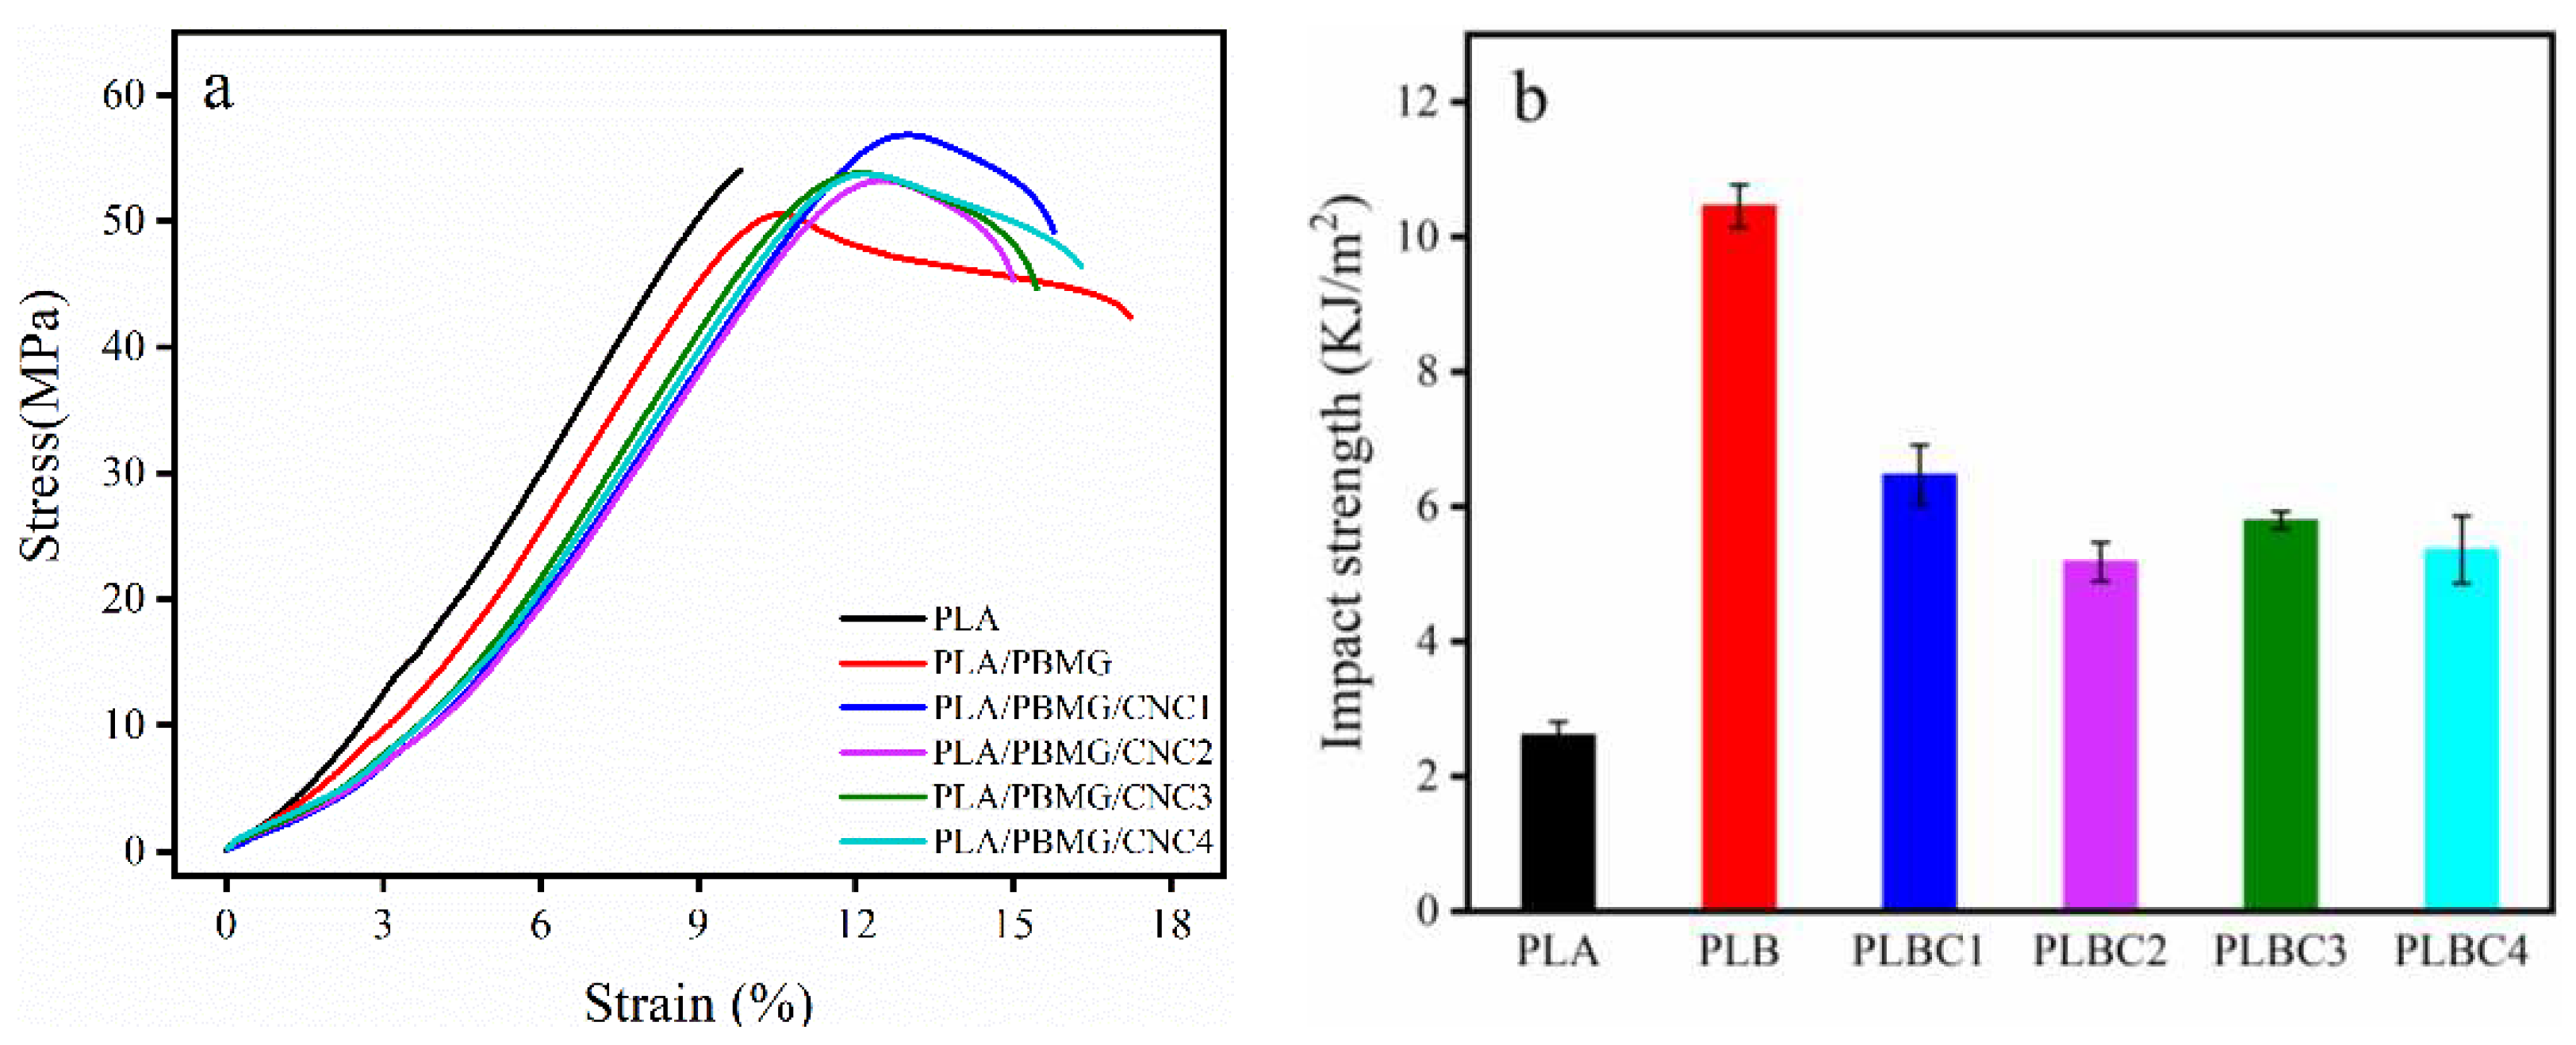
3.3. Mechanical Properties
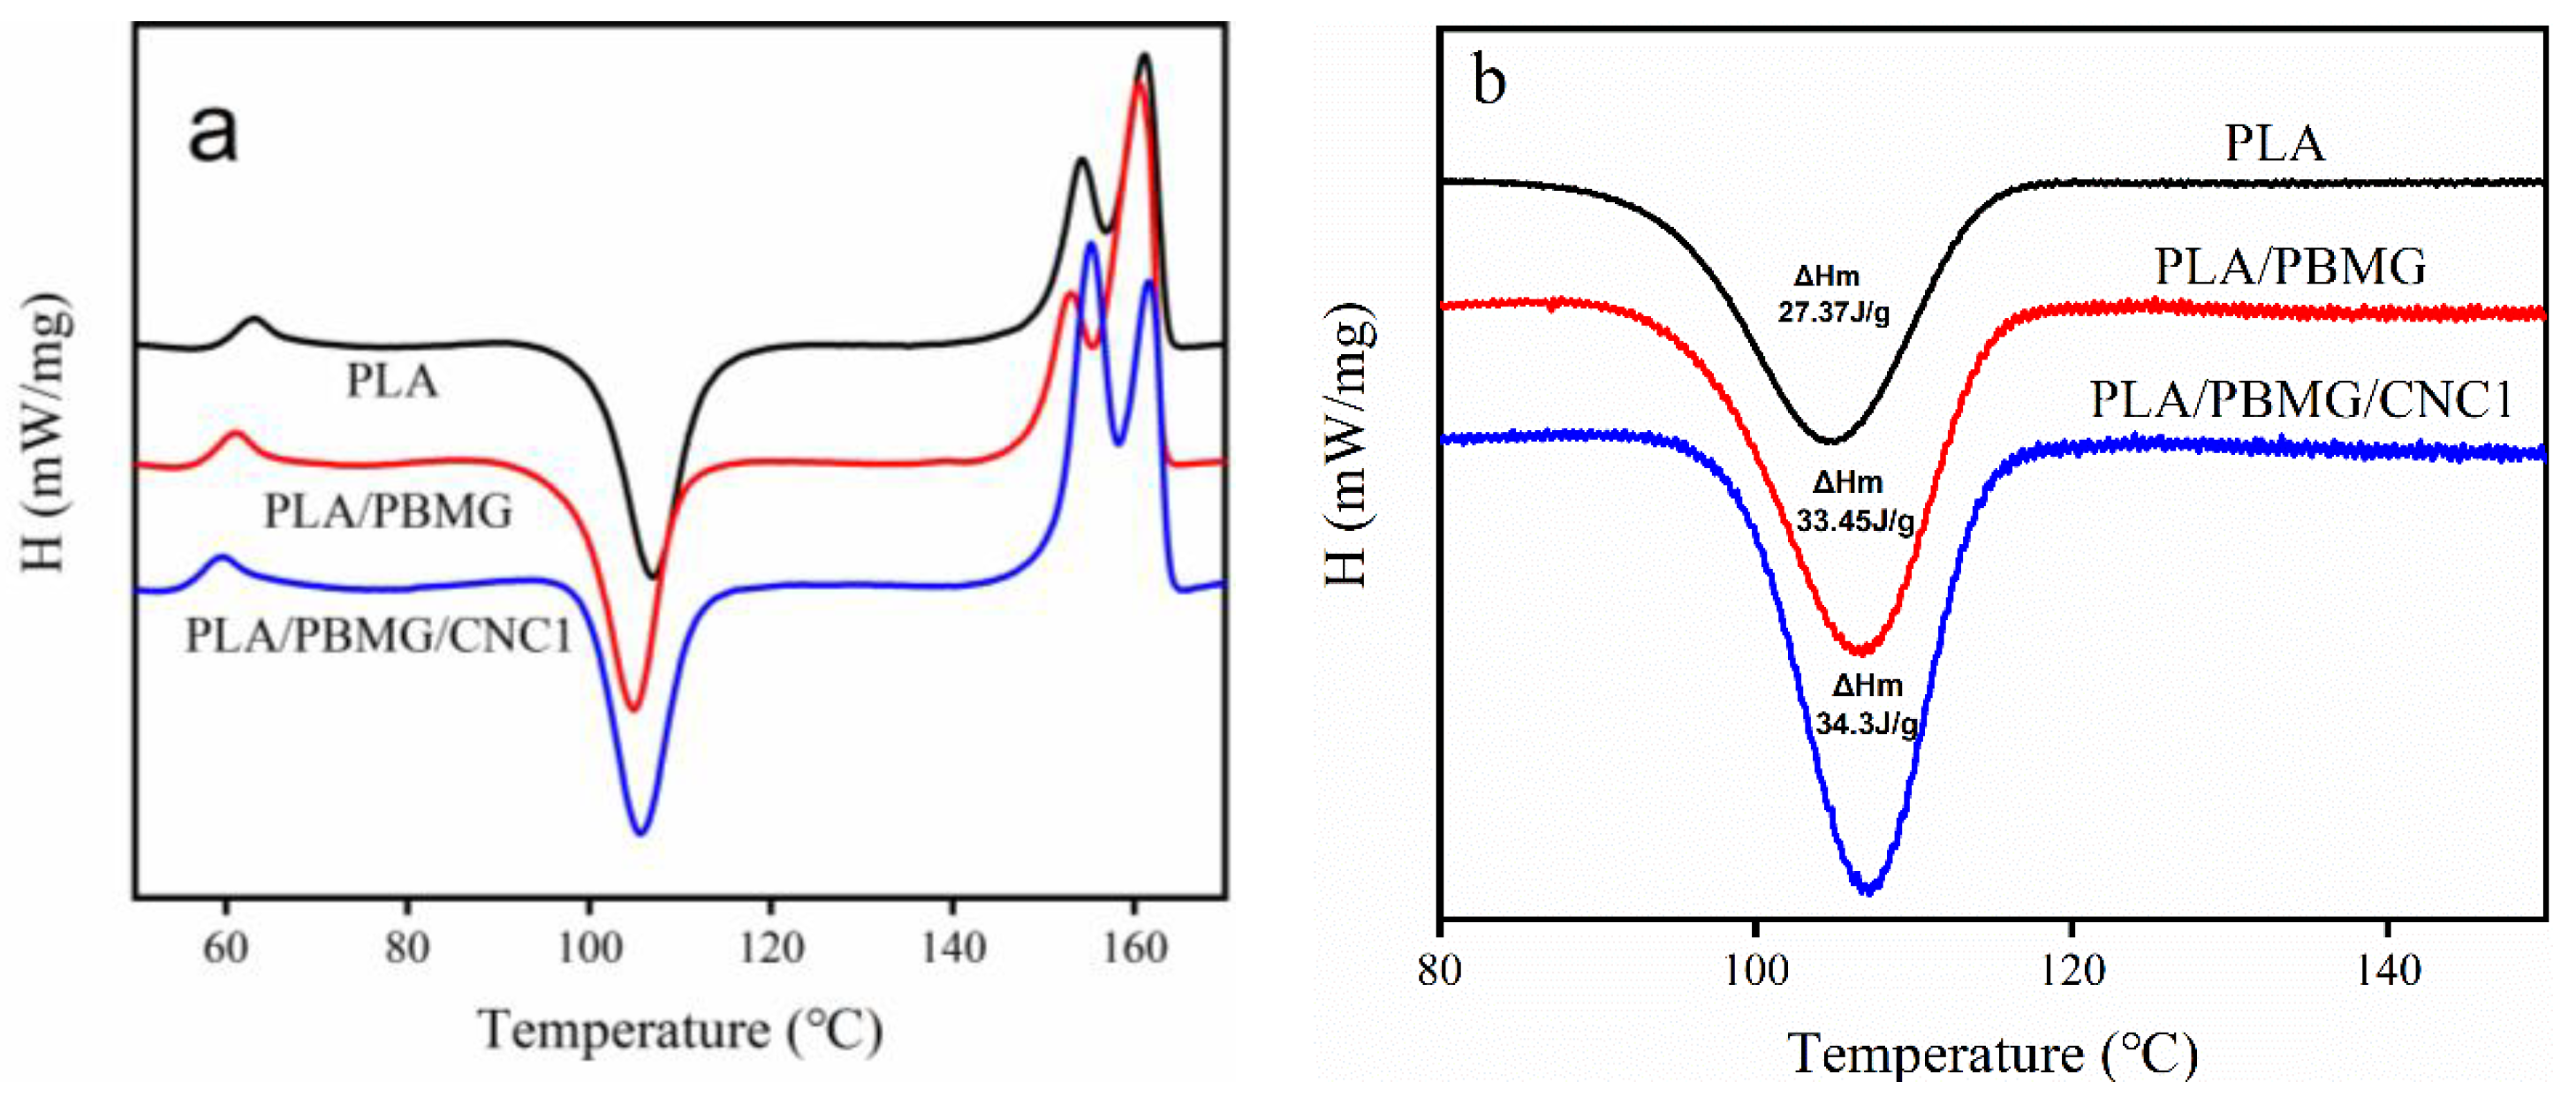
3.4. Crystallization
3.5. Nonisothermal crystallization kinetics
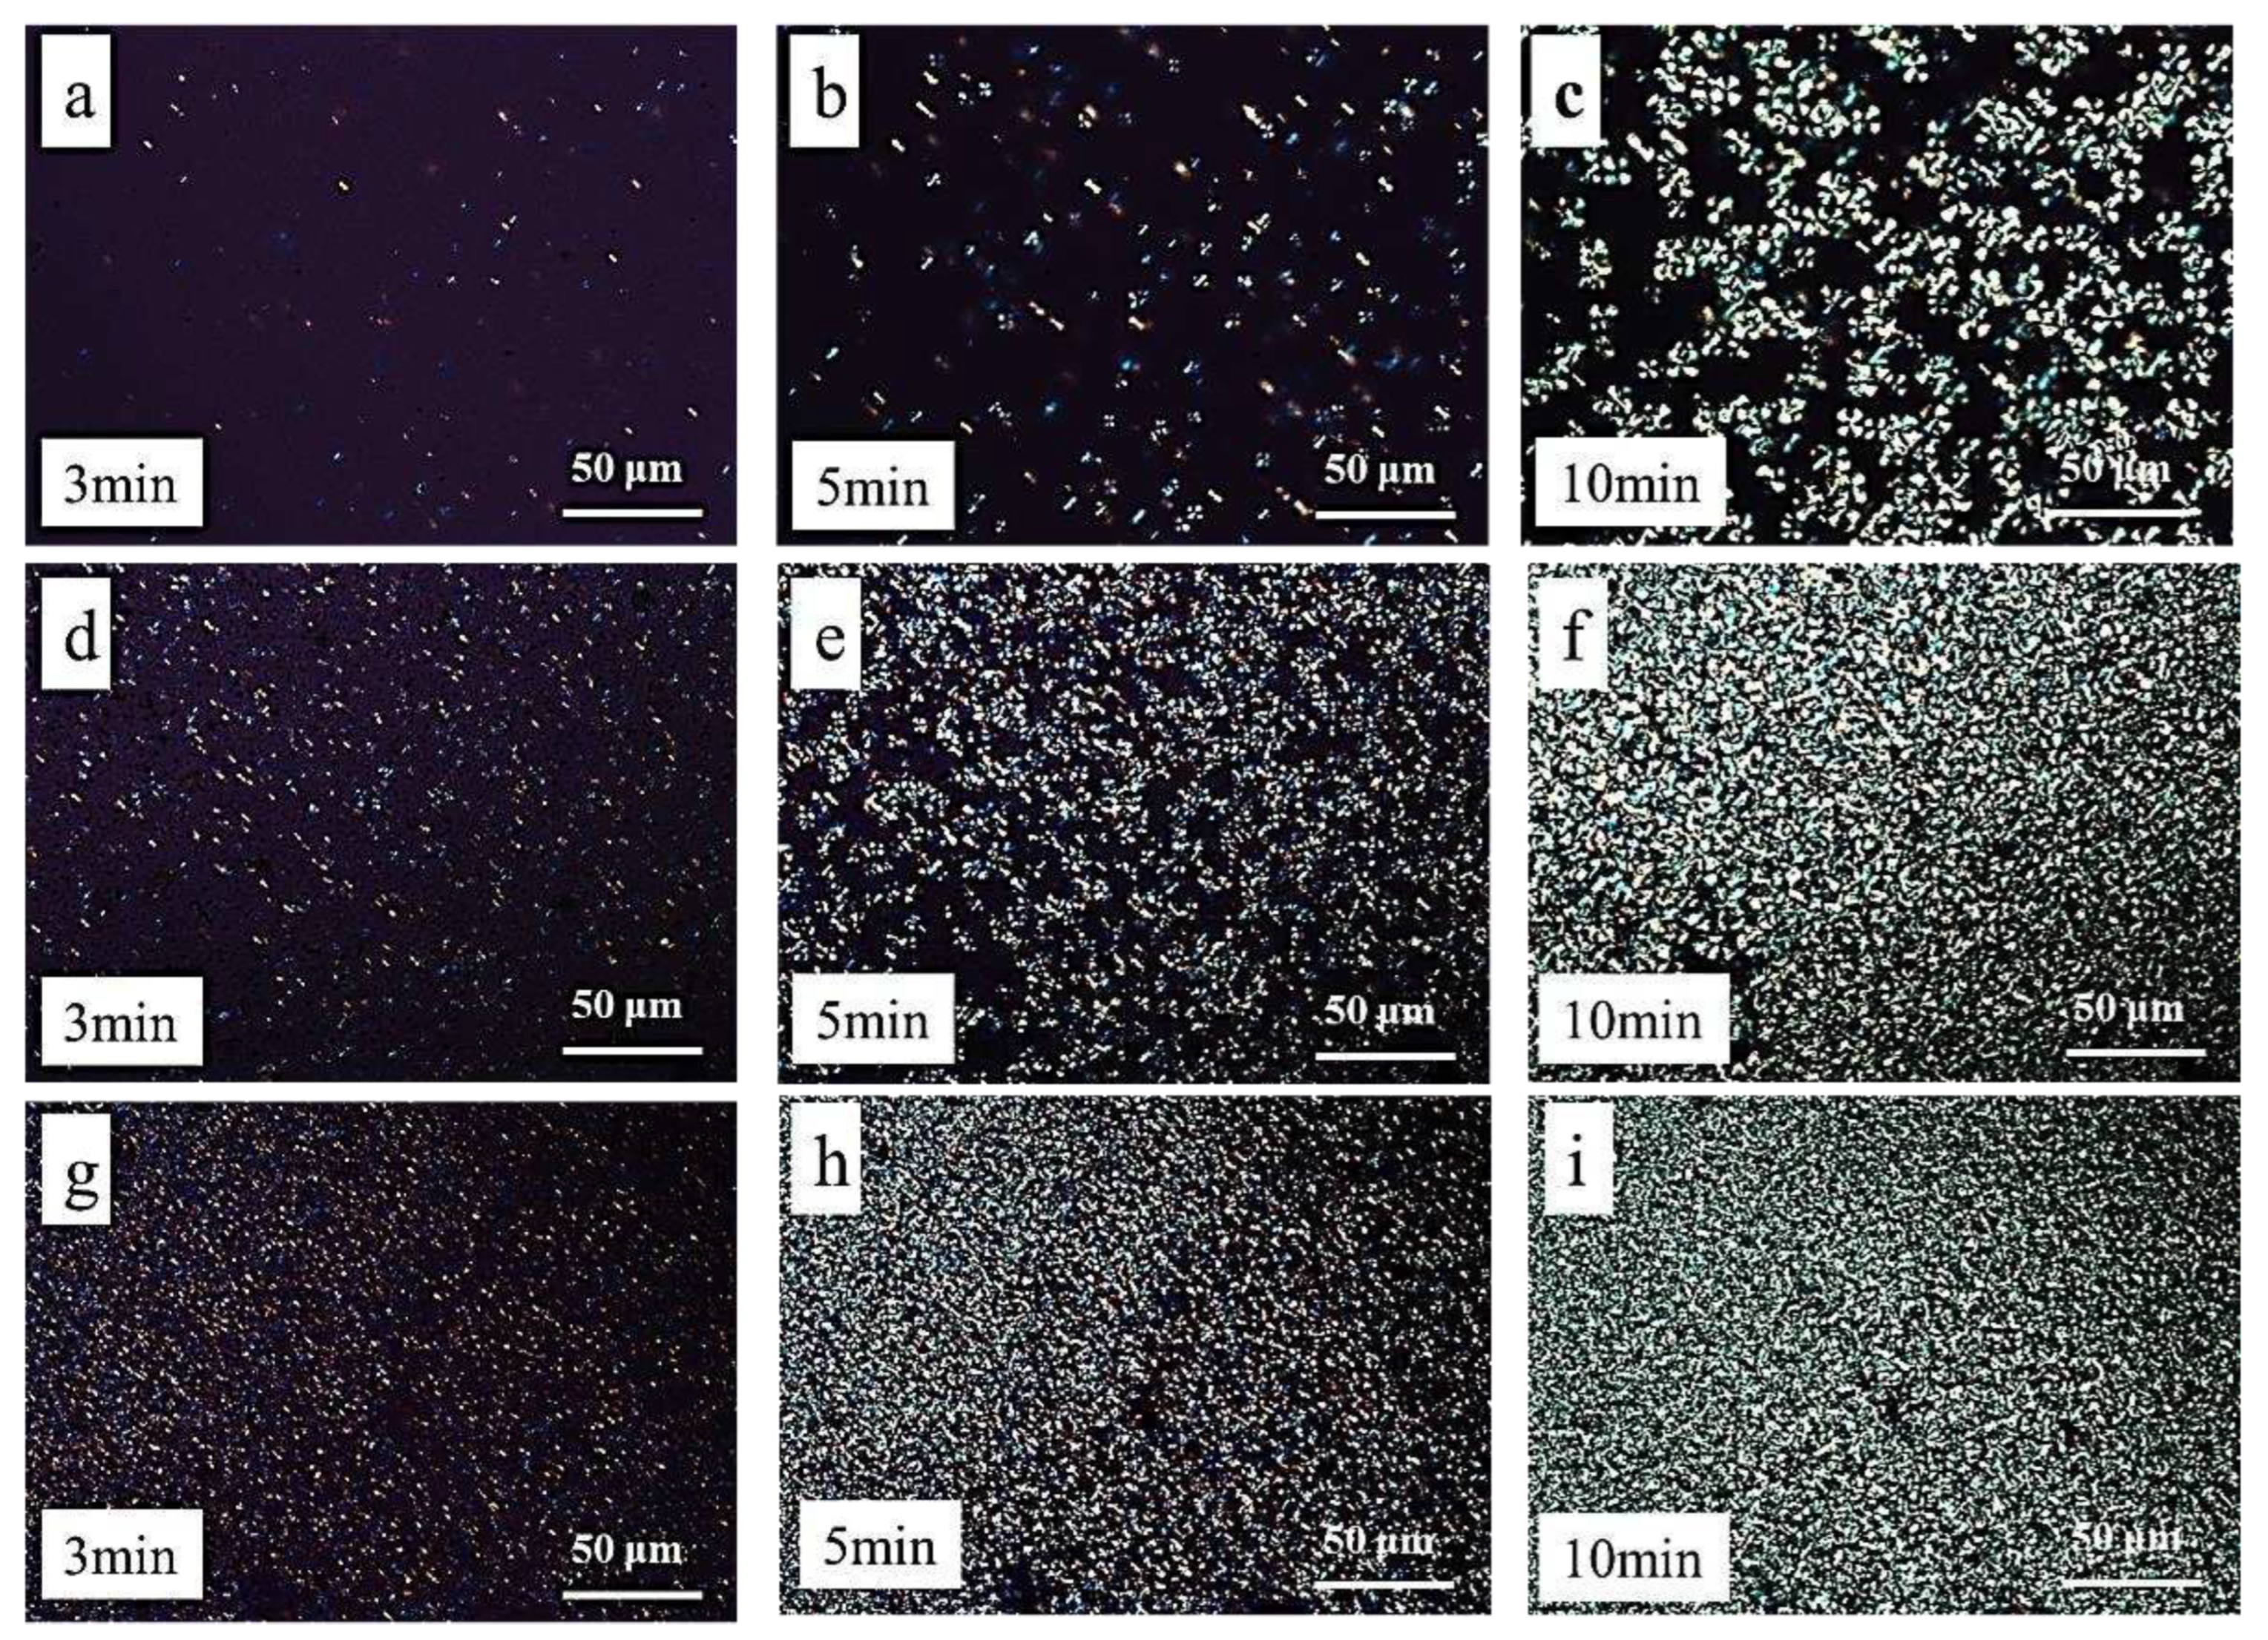
Polarizing Microscope
4. Conclusions
Acknowledgments
References
- Rasal, R. M.; Janorkar, A.V.; Hirt, D. E. ; Poly(lactic acid) modifications. Prog. Polym. Sci. 2010, 35, 338–356. [Google Scholar] [CrossRef]
- Gupta, B.; Revagade, N.; Hilborn, J. ; Poly(lactic acid) fiber: An overview. Prog. Polym. Sci. 2007, 32, 455–482. [Google Scholar] [CrossRef]
- Chen, Y.; Han, L.; Chen, H.; Jia, S.; Dong, L. ; Effect of nanoscale dispersed silica on the fabrication of microporous poly(L-lactic acid) by uniaxial stretching. Compos. Part A-Appl. S. 2018, 112, 423–431. [Google Scholar] [CrossRef]
- Tan, B. H.; Muiruri, J. K.; Li, Z.; He, C. ; Recent progress in using stereocomplexation for enhancement of thermal and mechanical property of polylactide. ACS Sustain. Chem. Eng. 2016, 4, 5370–5391. [Google Scholar] [CrossRef]
- Saeidlou, S.; Huneault, M. A.; Li, H.; Park, C. B. ; Poly(lactic acid) crystallization. Prog. Polym. Sci. 2012, 37, 1657–1677. [Google Scholar] [CrossRef]
- Qiu, J.; Liu, F.; Zhang, J.; Na, H.; Zhu, J. ; Non-planar ring contained polyester modifying polylactide to pursue high toughness. Compos. Sci. Technol. 2016, 128, 41–48. [Google Scholar] [CrossRef]
- Yang, Y.; Zhang, L.; Xiong, Z.; Tang, Z.; Zhang, R.; Zhu, J. ; Research progress in the heat resistance, toughening and filling modification of PLA. Sci. China Chem. 2016, 59, 1355–1368. [Google Scholar] [CrossRef]
- Mazidi, M. M.; Edalat, A.; Berahman, R.; Hosseini, F.S. ; Highly-toughened polylactide-(PLA-) based ternary blends with significantly enhanced glass transition and melt strength: tailoring the interfacial interactions, phase morphology, and performance. Macromolecules 2018, 51, 4298–4314. [Google Scholar] [CrossRef]
- Zhao, J.; Pan, H.; Yang, H.; Bian, J.; Zhang, H.; Gao, G.; Dong, L. ; Study on miscibility, thermal properties, degradation behaviors, and toughening mechanism of poly(lactic acid)/poly (ethylene-butylacrylate-glycidyl methacrylate) blends. Int. J. Biol. Macromol. 2020, 143, 443–452. [Google Scholar] [CrossRef] [PubMed]
- Yeo, J. C. C.; Muiruri, J. K.; Koh, J. J.; Thitsartarn, W.; Zhang, X.; Kong, J.; Lin, T. T.; Li, Z.; He, C. ; Bend, twist, and turn: first bendable and malleable toughened PLA green composites. Adv. Funct. Mater. 2020, 30, 2001565. [Google Scholar] [CrossRef]
- He, H.; Duan, Z.; Wang, Z. ; Anomalously enhanced toughness of poly(lactic acid) nanocomposites by core-shell particles with high thickness soft shell. Compos. Part A-Appl. S. 2020, 128, 105676. [Google Scholar] [CrossRef]
- Rasselet, D.; Caro-Bretelle, A.-S.; Taguet, A.; Lopez-Cuesta, J.-M. ; Reactive compatibilization of PLA/PA11 blends and their application in additive manufacturing. Materials 2019, 12, 485. [Google Scholar] [CrossRef]
- Lee, J. Y.; Kwon, S. H.; Chin, I.-J.; Choi, H. J. ; Toughness and rheological characteristics of poly(lactic acid)/acrylic core-shell rubber blends. Polym. Bull. 2019, 76, 5483–5497. [Google Scholar] [CrossRef]
- Jariyasakoolroj, P.; Rojanaton, N.; Jarupan, L. ; Crystallization behavior of plasticized poly(lactide) film by poly(l-lactic acid)-poly(ethylene glycol)-poly(l-lactic acid) triblock copolymer. Polym. Bull. 2020, 77, 2309–2323. [Google Scholar] [CrossRef]
- Ritchie, R. O. ; The Conflicts between strength and toughness. Nat. Mater. 2011, 10, 817–822. [Google Scholar] [CrossRef]
- Chen, P.-Y.; Lian, H.-Y.; Shih, Y.-F.; Chen-Wei, S.-M.; Jeng, R.-J. ; Preparation, characterization and crystallization kinetics of kenaf fiber/multi-walled carbon nanotube/polylactic acid (PLA) Green Composites. Mater. Chem. Phys. 2017, 196, 249–255. [Google Scholar] [CrossRef]
- Jin, X.; Chen, X.; Cheng, Q.; Zhang, N.; Cai, S.; Ren, J. ; Non-isothermal crystallization kinetics of Ramie fiber-reinforced polylactic acid biocomposite. RSC Adv. 2017, 7, 46014–46021. [Google Scholar] [CrossRef]
- Klemm, D.; Kramer, F.; Moritz, S.; Lindstrom, T.; Ankerfors, M.; Gray, D.; Dorris, A. ; Nanocelluloses: A new family of nature-based materials. Angew. Chem. Int. Edit. 2011, 50, 5438–5466. [Google Scholar] [CrossRef]
- Maiti, S.; Jayaramudu, J.; Das, K.; Reddy, S.M.; Sadiku, R.; Ray, S.S.; Liu, D. ; Preparation and characterization of nano-cellulose with new shape from different precursor. Carbohyd. Polym. 2013, 98, 562–567. [Google Scholar] [CrossRef]
- Habibi, Y.; Lucia, L.A.; Rojas, O.J. ; Cellulose nanocrystals: chemistry, self-assembly, and applications. Chem. Rev. 2010, 110, 3479–3500. [Google Scholar] [CrossRef]
- Abitbol, T.; Rivkin, A.; Cao, Y.; Nevo, Y.; Abraham, E.; Ben-Shalom, T.; Lapidot, S.; Shoseyov, O. ; Nanocellulose, a tiny fiber with huge applications. Curr. Opin. Biotech. 2016, 39, 76–88. [Google Scholar] [CrossRef]
- Gong, J.; Mo, L.; Li, J. ; A comparative study on the preparation and characterization of cellulose nanocrystals with various polymorphs. Carbohyd. Polym. 2018, 195, 18–28. [Google Scholar] [CrossRef]
- Samir, M.; Alloin, F.; Dufresne, A. ; Review of recent research into cellulosic whiskers, their properties and their application in nanocomposite field. Biomacromolecules 2005, 6, 612–626. [Google Scholar] [CrossRef]
- Fortunati, E.; Armentano, I.; Zhou, Q.; Iannoni, A.; Saino, E.; Visai, L.; Berglund, L.A.; Kenny, J.M. ; Multifunctional bionanocomposite films of poly(lactic acid), cellulose nanocrystals and silver nanoparticles. Carbohyd. Polym. 2012, 87, 1596–1605. [Google Scholar] [CrossRef]
- Borkotoky, S.S.; Dhar, P.; Katiyar, V. ; Biodegradable poly(lactic acid)/cellulose nanocrystals (CNCs) composite microcellular foam: effect of nanofillers on foam cellular morphology, thermal and wettability behavior. Int. J. Biol. Macromol. 2018, 106, 433–446. [Google Scholar] [CrossRef]
- Dhar, P.; Tarafder, D.; Kumar, A.; Katiyar, V. ; Effect of cellulose nanocrystal polymorphs on mechanical, barrier and thermal properties of poly(lactic acid) based bionanocomposites. RSC Adv. 2015, 5, 60426–60440. [Google Scholar] [CrossRef]
- Ruiz, M. M.; Cavaille, J. Y.; Dufresne, A.; Gerard, J. F.; Graillat, C. ; Processing and characterization of new thermoset nanocomposites based on cellulose whiskers. Compos. Interface. 2000, 7, 117–131. [Google Scholar] [CrossRef]
- Cao, L.; Liu, C.; Zou, D.; Zhang, S.; Chen, Y. ; Using cellulose nanocrystals as sustainable additive to enhance mechanical and shape memory properties of PLA/ENR thermoplastic vulcanizates. Carbohyd. Polym. 2020, 230, 115618. [Google Scholar] [CrossRef]
- Borkotoky, S. S.; Chakraborty, G.; Katiyar, V. ; Thermal degradation behaviour and crystallization kinetics of poly(lactic acid) and cellulose nanocrystals (CNC) based microcellular composite foams. Int. J. Biol. Macromol. 2018, 118, 1518–1531. [Google Scholar] [CrossRef]
- Lebarbe, T.; Grau, E.; Alfos, C.; Cramail, H. ; Fatty acid-based thermoplastic poly(ester-amide) as toughening and crystallization improver of poly(L-lactide). Eur. Polym. J. 2015, 65, 276–285. [Google Scholar] [CrossRef]
- Feng, F.; Ye, L. ; Morphologies and mechanical properties of polylactide/thermoplastic polyurethane elastomer blends. J. Appl. Polym. Sci. 2011, 119, 2778–2783. [Google Scholar] [CrossRef]
- Han, J.-J.; Huang, H.-X. ; Preparation and characterization of biodegradable polylactide/thermoplastic polyurethane elastomer blends. J. Appl. Polym. Sci. 2011, 120, 3217–3223. [Google Scholar] [CrossRef]
- Kulinski, Z.; Piorkowska, E. ; Crystallization, structure and properties of plasticized poly(L-lactide). Polymer 2005, 46, 10290–10300. [Google Scholar] [CrossRef]
- Liu, G.; Zhang, X.; Wang, D. ; Tailoring crystallization: towards high-performance poly(lactic acid). Adv. Mater. 2014, 26, 6905–6911. [Google Scholar] [CrossRef] [PubMed]
- Gao, W. S.; Li, C.; Li, J. W.; Zhang, Q. X.; Wang, N. Y.; Abdel-Magid, B.; Qu, X. W. ; Effect of the crosslinking agent content on the emulsion polymerization process and adhesive properties of poly(n-butyl acrylate-co-methacrylic acid), J. Adhes. Sci. Technol., 2019, 33, 2031–2046. [Google Scholar] [CrossRef]
- Xu, C.; Qu, T. G.; Zhang, X. J.; Qu, X. W.; Wang, N. Y.; Zhang, Q. X.; Abdel-Magid, B.; Li, G. H. ; Enhanced toughness and thermal conductivity for epoxy resin with a core–shell structured polyacrylic modifier and modified boron nitride. RSC Adv. 2019, 9, 8654–8663. [Google Scholar] [CrossRef]
- Fu, N.; Li, G.; Yao, Y.; Wang, N.; Grami, M. E.; Zhang Q., X.; Qu, X. W. ; Super-tough poly(butylene terephthalate) materials: blending with CSSP nanoparticles, Soft Mater. 2015, 13, 86-92. /: https. [CrossRef]
- Qu, X.; Wang, N.; Lovell, P. A. ; Preparation and characterization of the latexes with different particle sizes by semibatch emulsion polymerization and the influence on properties of waterborne pressure-sensitive adhesives. J. Appl. Polym. Sci. 2009, 112, 3030–3040. [Google Scholar] [CrossRef]
- Pei, A.; Zhou, Q.; Berglund, L.A. ; Functionalized cellulose nanocrystals as biobased nucleation agents in poly(L-lactide) (PLLA)-crystallization and mechanical property effects. Compos. Sci. Technol. 2010, 70, 815–821. [Google Scholar] [CrossRef]
- Clarkson, C. M.; Azrak, S. M. E. A.; Chowdhury, R.; Shuvo, S. N.; Snyder, J.; Schueneman, G.; Ortalan, V.; Youngblood, J. P. ; Melt spinning of cellulose nanofibril/polylactic acid (CNF/PLA) composite fibers for high stiffness. ACS Appl. Polym. Mater. 2019, 1, 160–168. [Google Scholar] [CrossRef]
- Vatansever, E.; Arslan, D.; Sarul, D.S.; Kahraman, Y.; Gunes, G.; Durmus, A.; Nofar, M. ; Development of CNC-reinforced PBAT nanocomposites with reduced percolation threshold: a comparative sudy on the preparation method. J. Mater. Sci. 2020, 55, 15523–15537. [Google Scholar] [CrossRef]
- Arslan, D.; Vatansever, E.; Sarul, D. S.; Kahraman, Y.; Gunes, G.; Durmus, A.; Nofar, M. ; Effect of preparation method on the properties of polylactide/cellulose nanocrystal nanocomposites. Polym. Compos. 2020, 41, 4170–4180. [Google Scholar] [CrossRef]
- Yu, H.-y.; Qin, Z.-y.; Zhou, Z. ; Cellulose nanocrystals as green fllers to improve crystallization and hydrophilic property of poly(3-hydroxybutyrate-co-3-hydroxyvalerate). Prog. Nat. Sci-Mater. 2011, 21, 478–484. [Google Scholar] [CrossRef]
- Dhar, P.; Bhasney, S.M.; Kumar, A.; Katiyar, V. ; Acid functionalized cellulose nanocrystals and its effect on mechanical, thermal, crystallization and surfaces properties of poly(lactic acid) bionanocomposites films: a comprehensive study. Polymer 2016, 101, 75–92. [Google Scholar] [CrossRef]
- Suksut, B.; Deeprasertkul, C. ; Effect of nucleating agents on physical properties of poly(lactic acid) and its blend with natural rubber. J. Polym. Environ. 2011, 19, 288–296. [Google Scholar] [CrossRef]
- Avrami, M. Kinetics of phase change. I General theory. J. Chem. Phys. 1939, 7, 1103–1112. [Google Scholar] [CrossRef]
- Kuo, M.C.; Huang, J.C.; Chen, M. ; Non-isothermal crystallization kinetic behavior of alumina nanoparticle filled poly(ether ether ketone). Mater. Chem. Phys. 2006, 99, 258–268. [Google Scholar] [CrossRef]
- Jeziorny, A. ; Parameters characterizing the kinetics of the non-isothermal crystallization of poly (ethylene terephthalate) determined by DSC. Polymer 1978, 19, 1142–1144. [Google Scholar] [CrossRef]
- Jain, S.; Goossens, H.; van Duin, M.; Lemstra, P. ; Effect of in situ prepared silica nano-particles on non-isothermal crystallization of polypropylene. Polymer 2005, 46, 8805–8818. [Google Scholar] [CrossRef]
- Battegazzore, D.; Bocchini, S.; Frache, A. ; Crystallization kinetics of poly(lactic acid)-talc composites. Express Polym. Lett. 2011, 5, 849–858. [Google Scholar] [CrossRef]
- Ozawa, T. ; Kinetics of non-isothermal crystallization. Polymer 1971, 12, 150–158. [Google Scholar] [CrossRef]
- Xu, W. B.; Ge, M. L.; He, P. S. ; Nonisothermal crystallization kinetics of polypropylene/montmorillonite nanocomposites. J. Polym. Sci. Part B-Polym. Phys. 2002, 40, 408–414. [Google Scholar] [CrossRef]
- Qiao, Y.; Jalali, A.; Yang, J.; Chen, Y.; Wang, S.; Jiang, Y.; Hou, J.; Jiang, J.; Li, Q.; Park, C.B. ; Non-isothermal crystallization kinetics of polypropylene/polytetrafluoroethylene fibrillated composites. J. Mater. Sci. 2021, 56, 3562–3575. [Google Scholar] [CrossRef]
- Xu, X.; Zhen, W. ; Preparation, performance and non-isothermal crystallization kinetics of poly(lactic acid)/amidated humic acid composites. Polym. Bull. 2018, 75, 3753–3780. [Google Scholar] [CrossRef]
- Liu, T.; Mo, Z.; Wang. S.; Nonisothermal melt and cold crystallization kinetics of poly(aryl ether ether ketone ketone). Polym. Eng. Sci. 1997, 37, 568–575. [Google Scholar] [CrossRef]
- Layachi, A.; Frihi, D.; Satha, H.; Seguela, R.; Gherib, S. ; Non-isothermal crystallization kinetics of polyamide 66/glass fibers/carbon black composites. J. Therm. Anal. Calorim. 2016, 124, 1319–1329. [Google Scholar] [CrossRef]
- Kissinger, H. E. ; Variation of peak temperature with heating rate in differential thermal analysis. J. Res. Natl. Bur. Stand. 1956, 57, 217–221. [Google Scholar] [CrossRef]
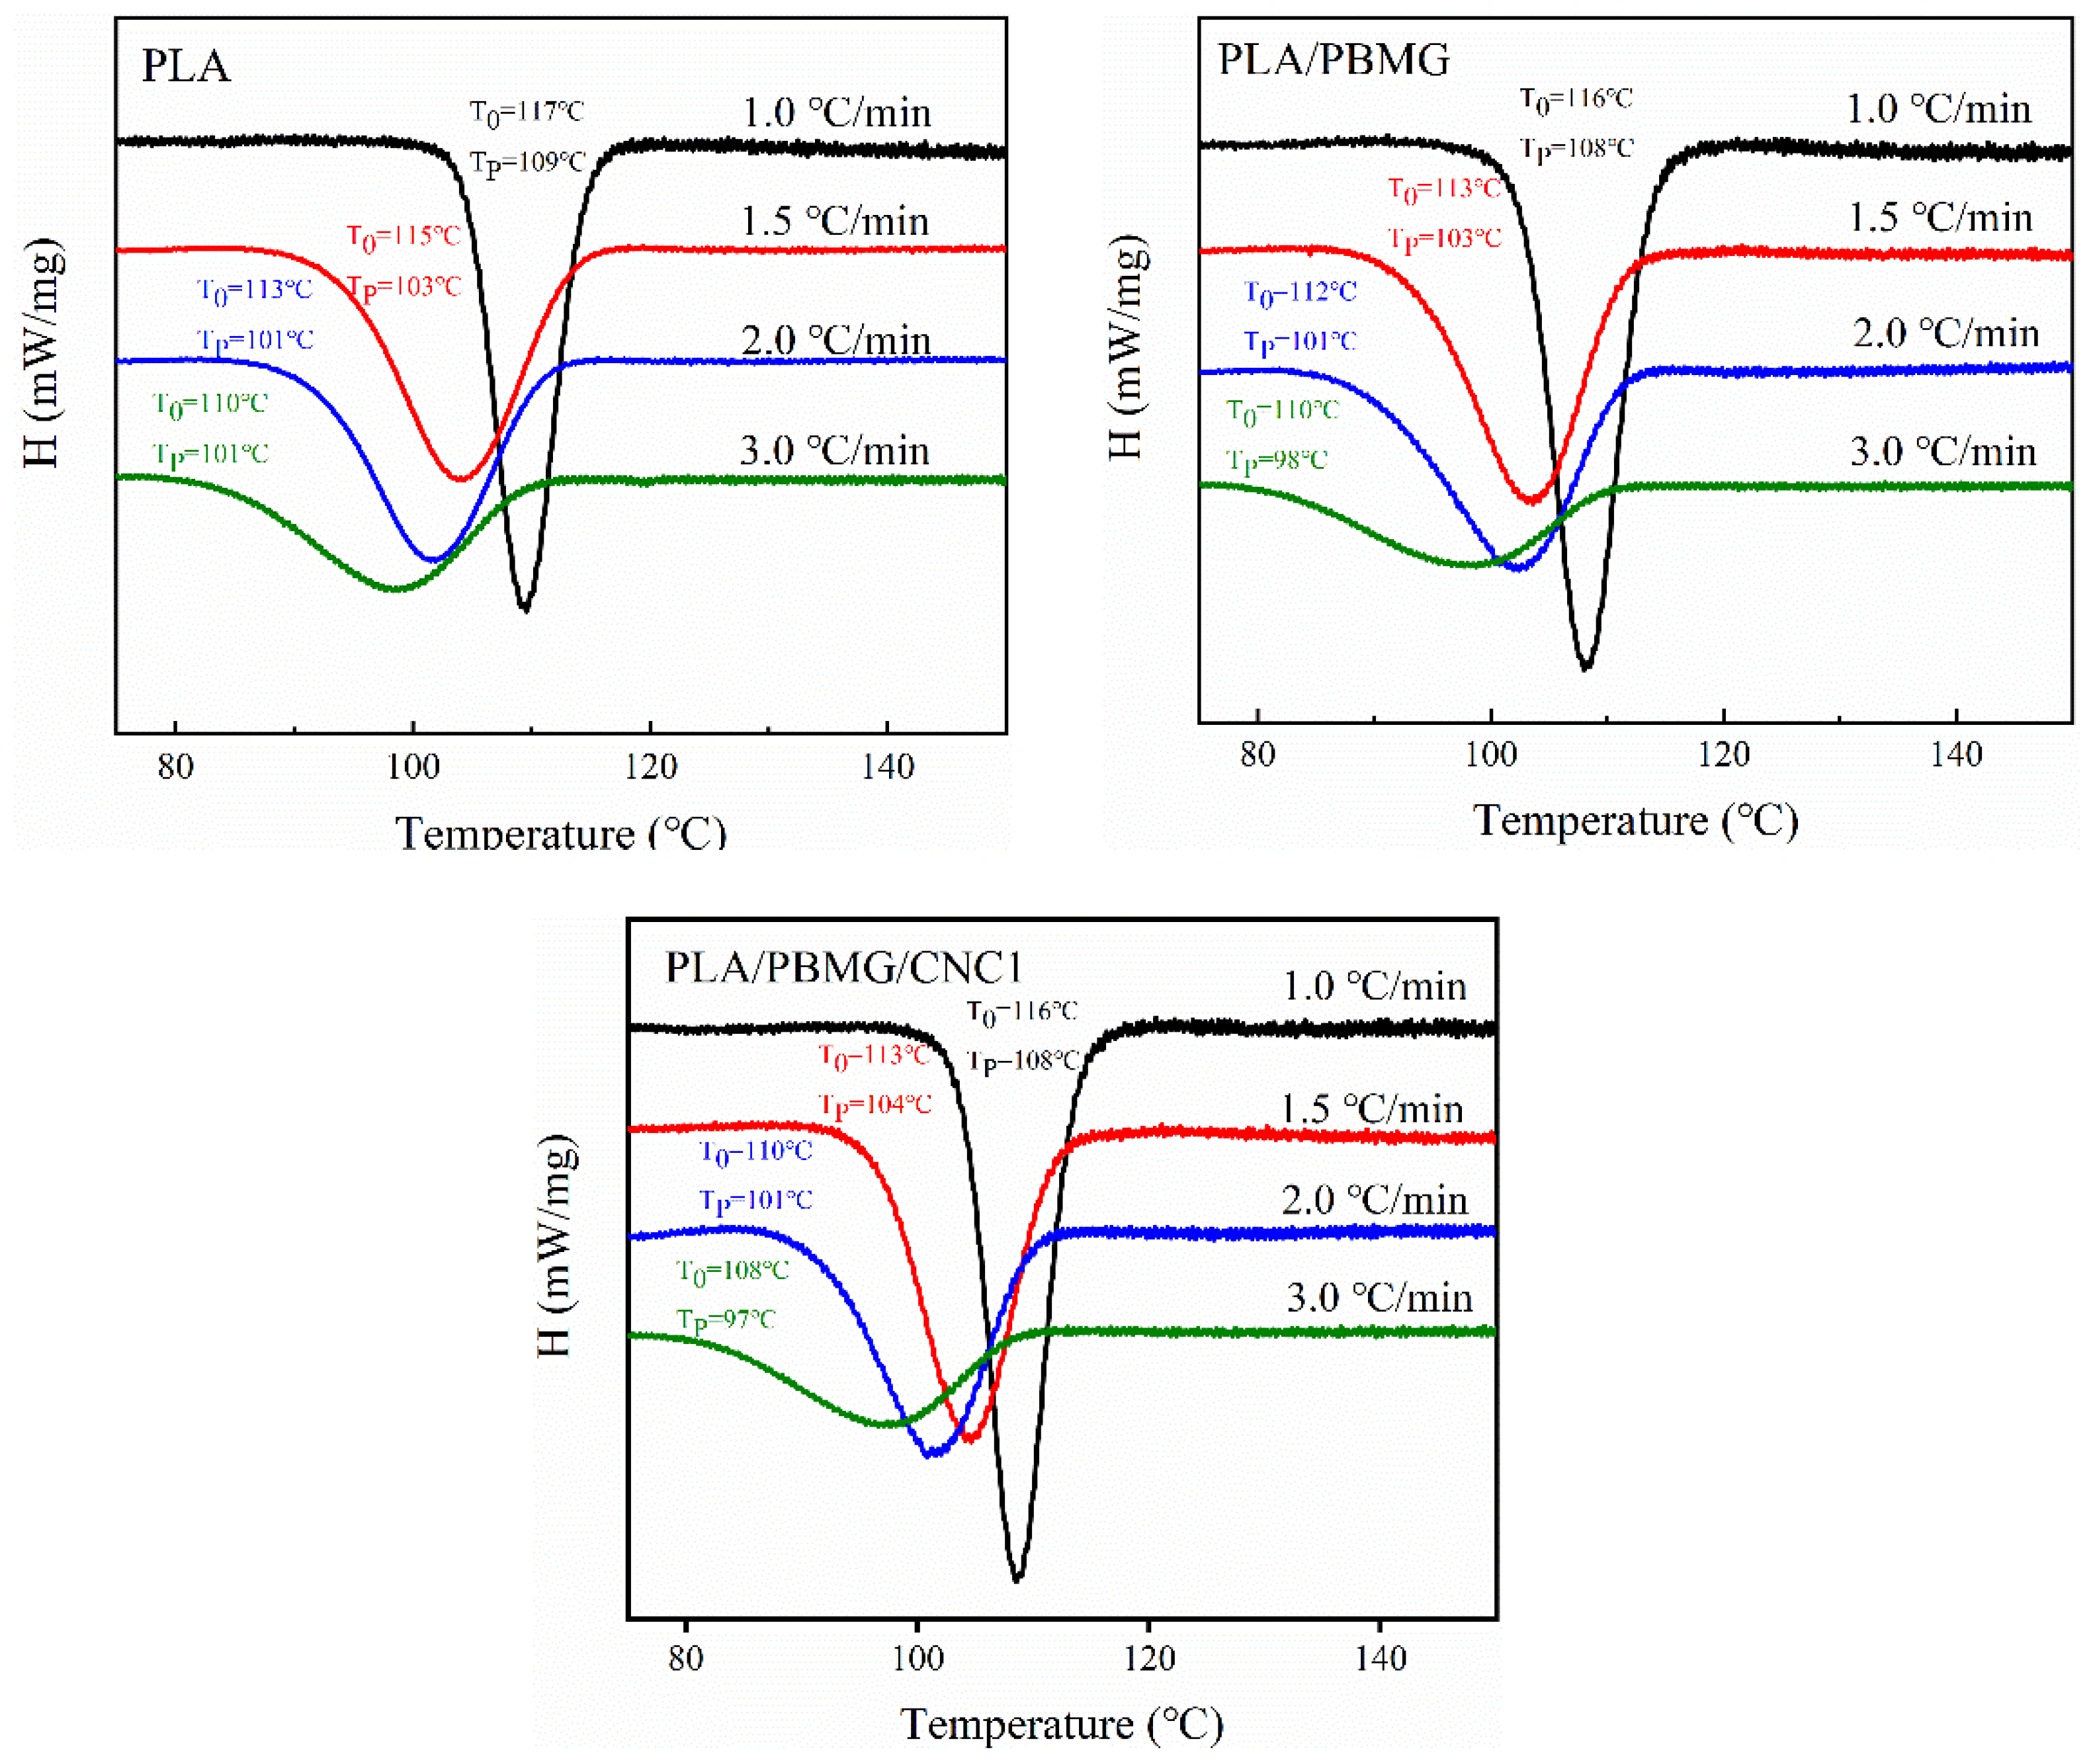
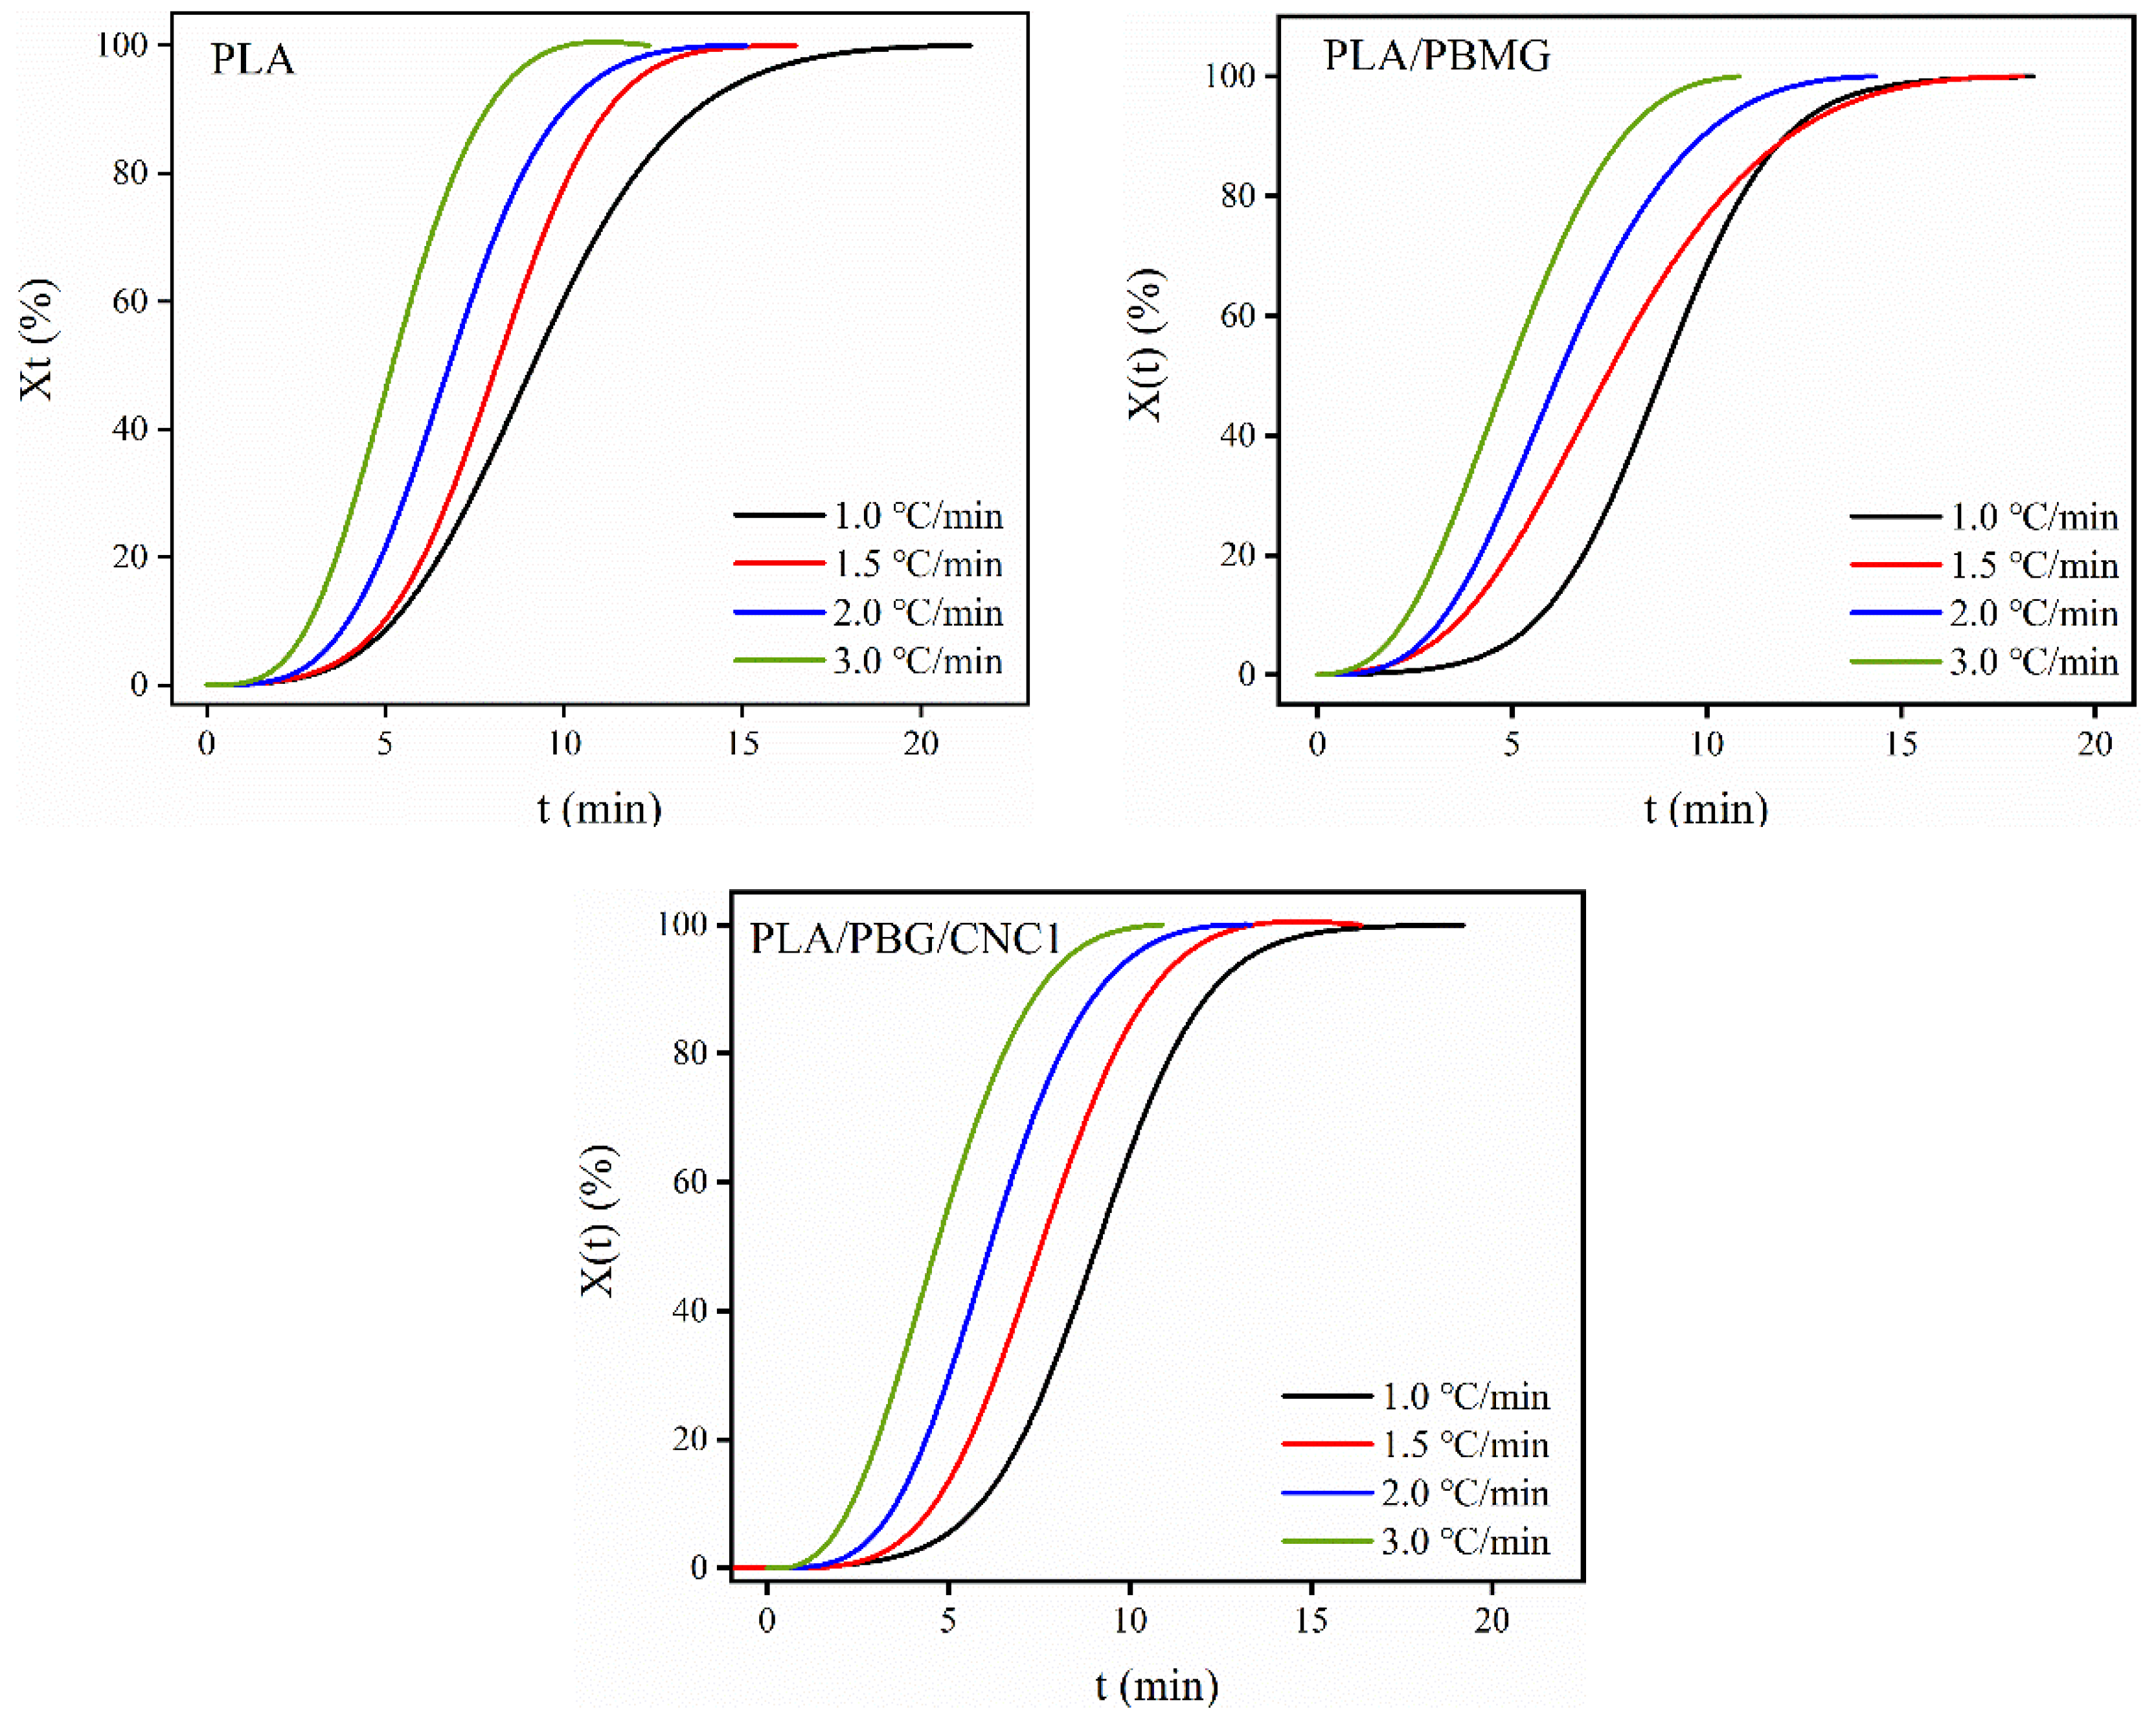
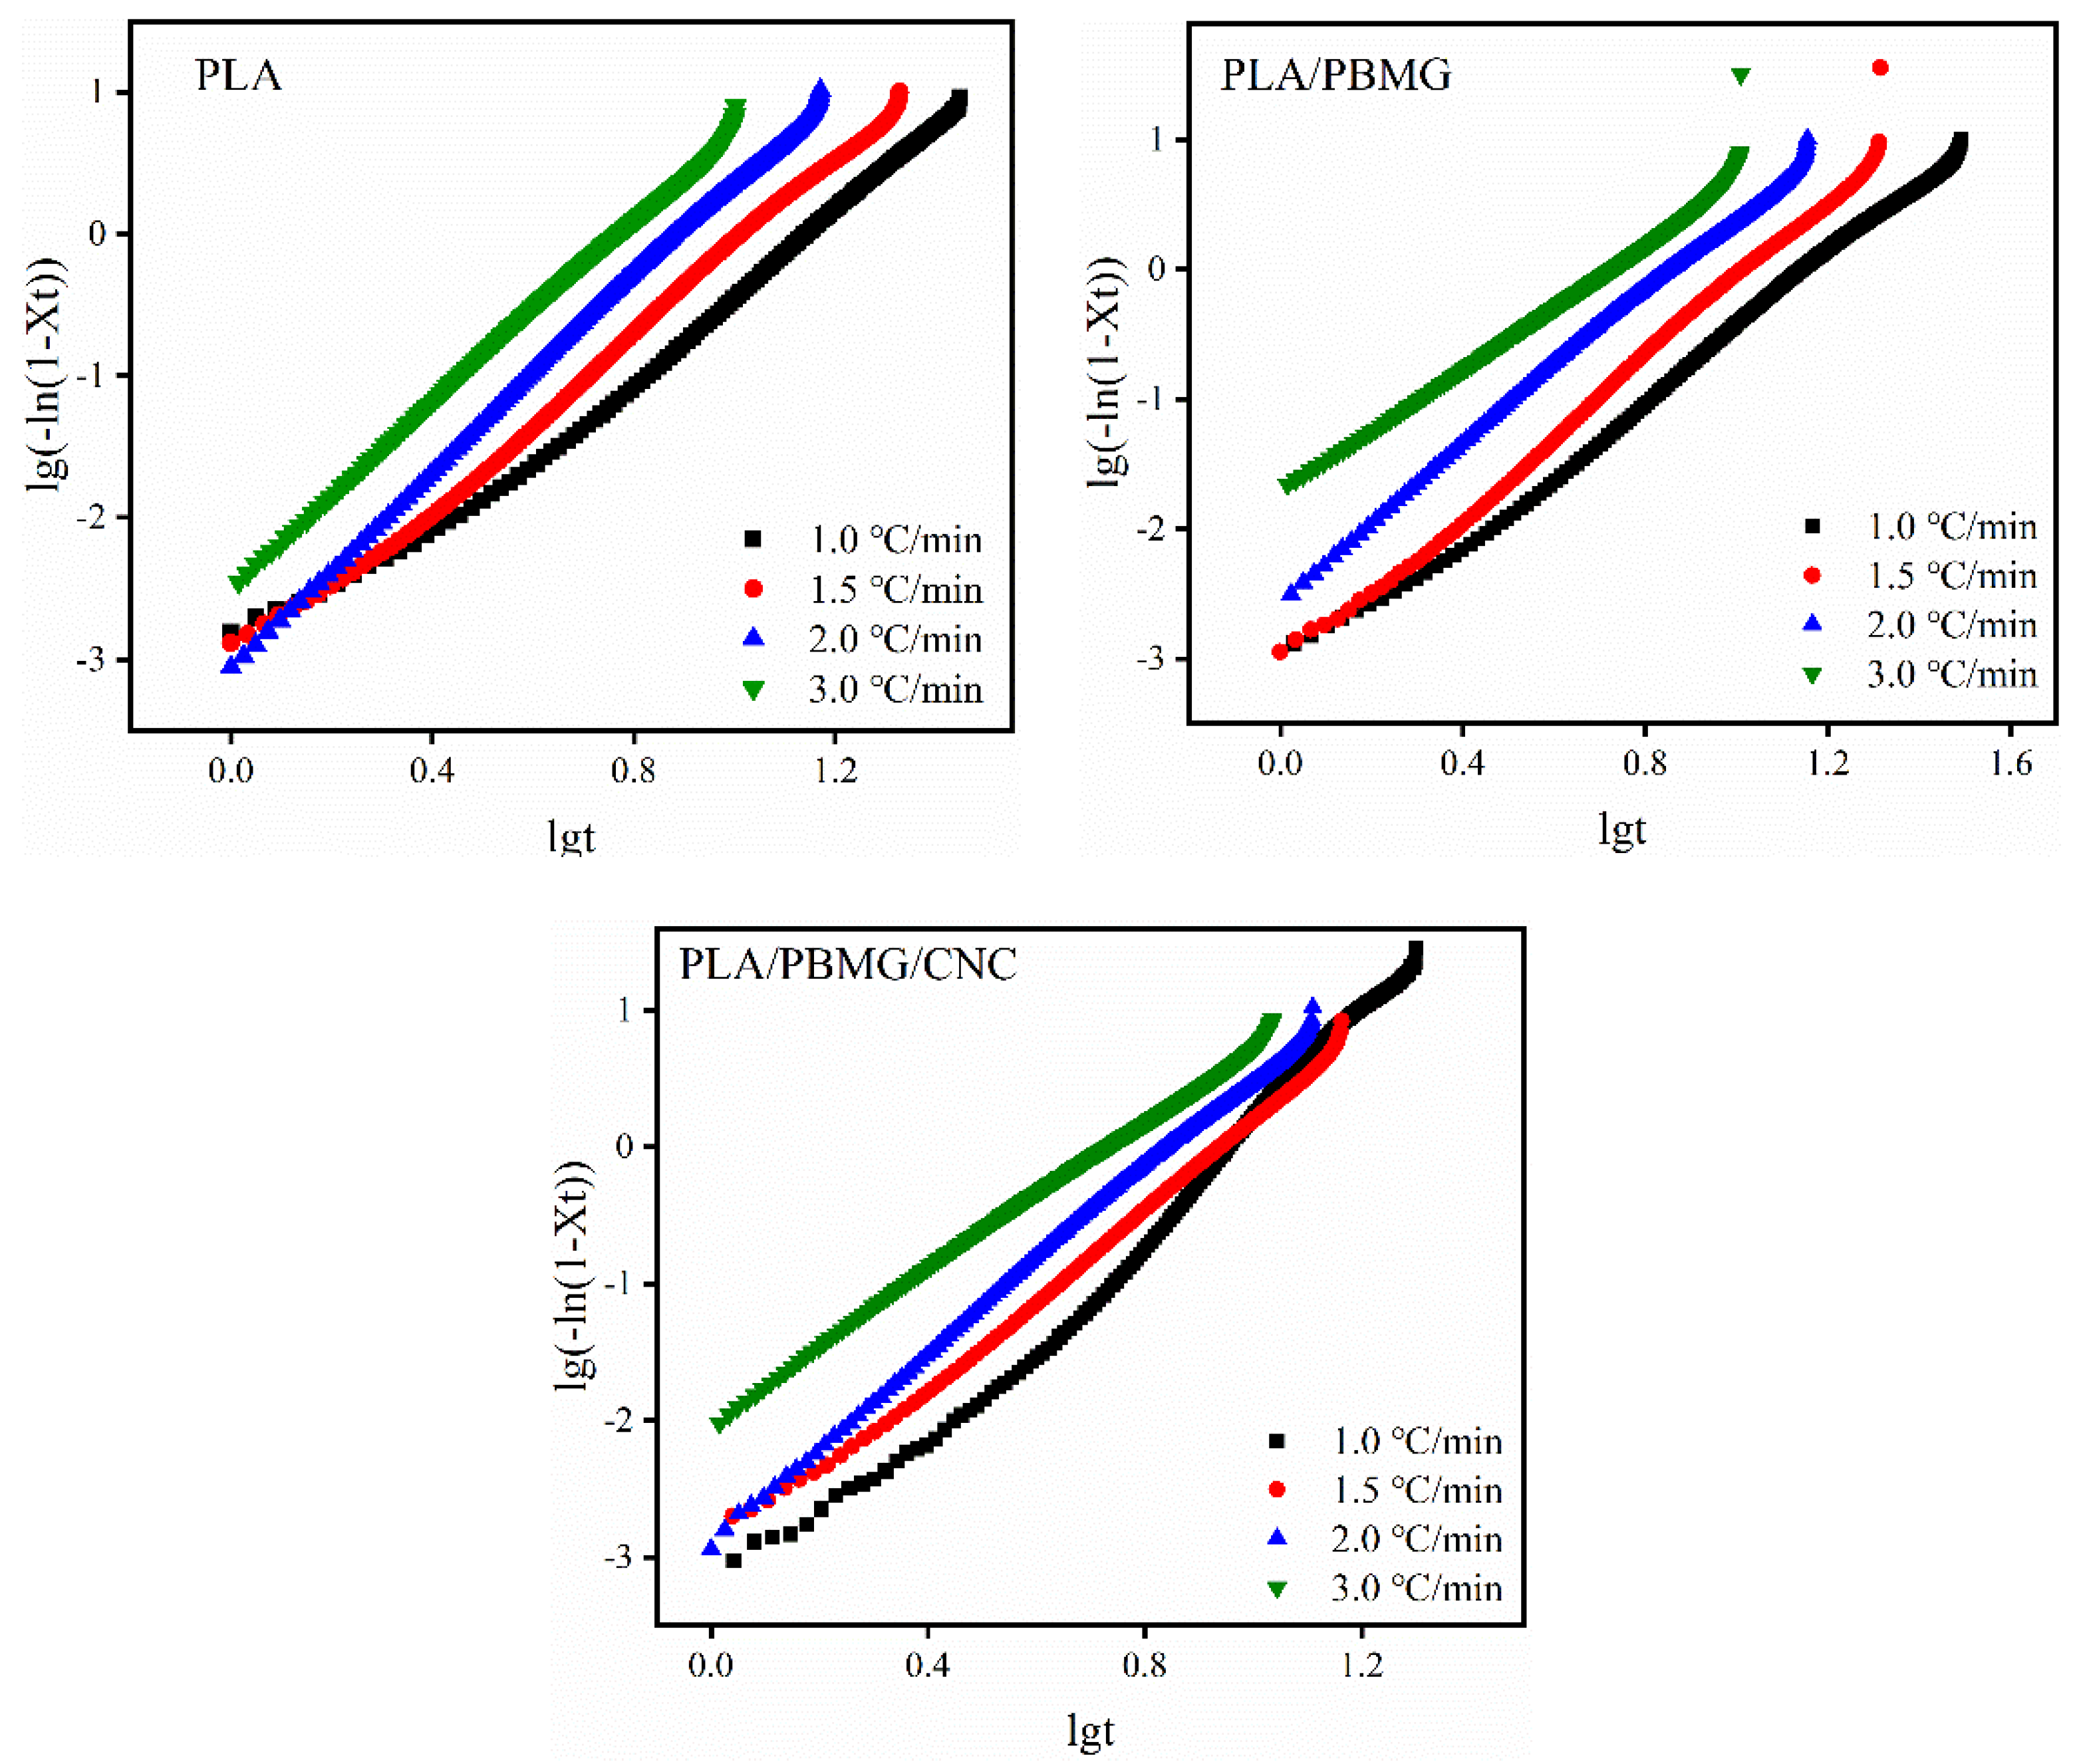
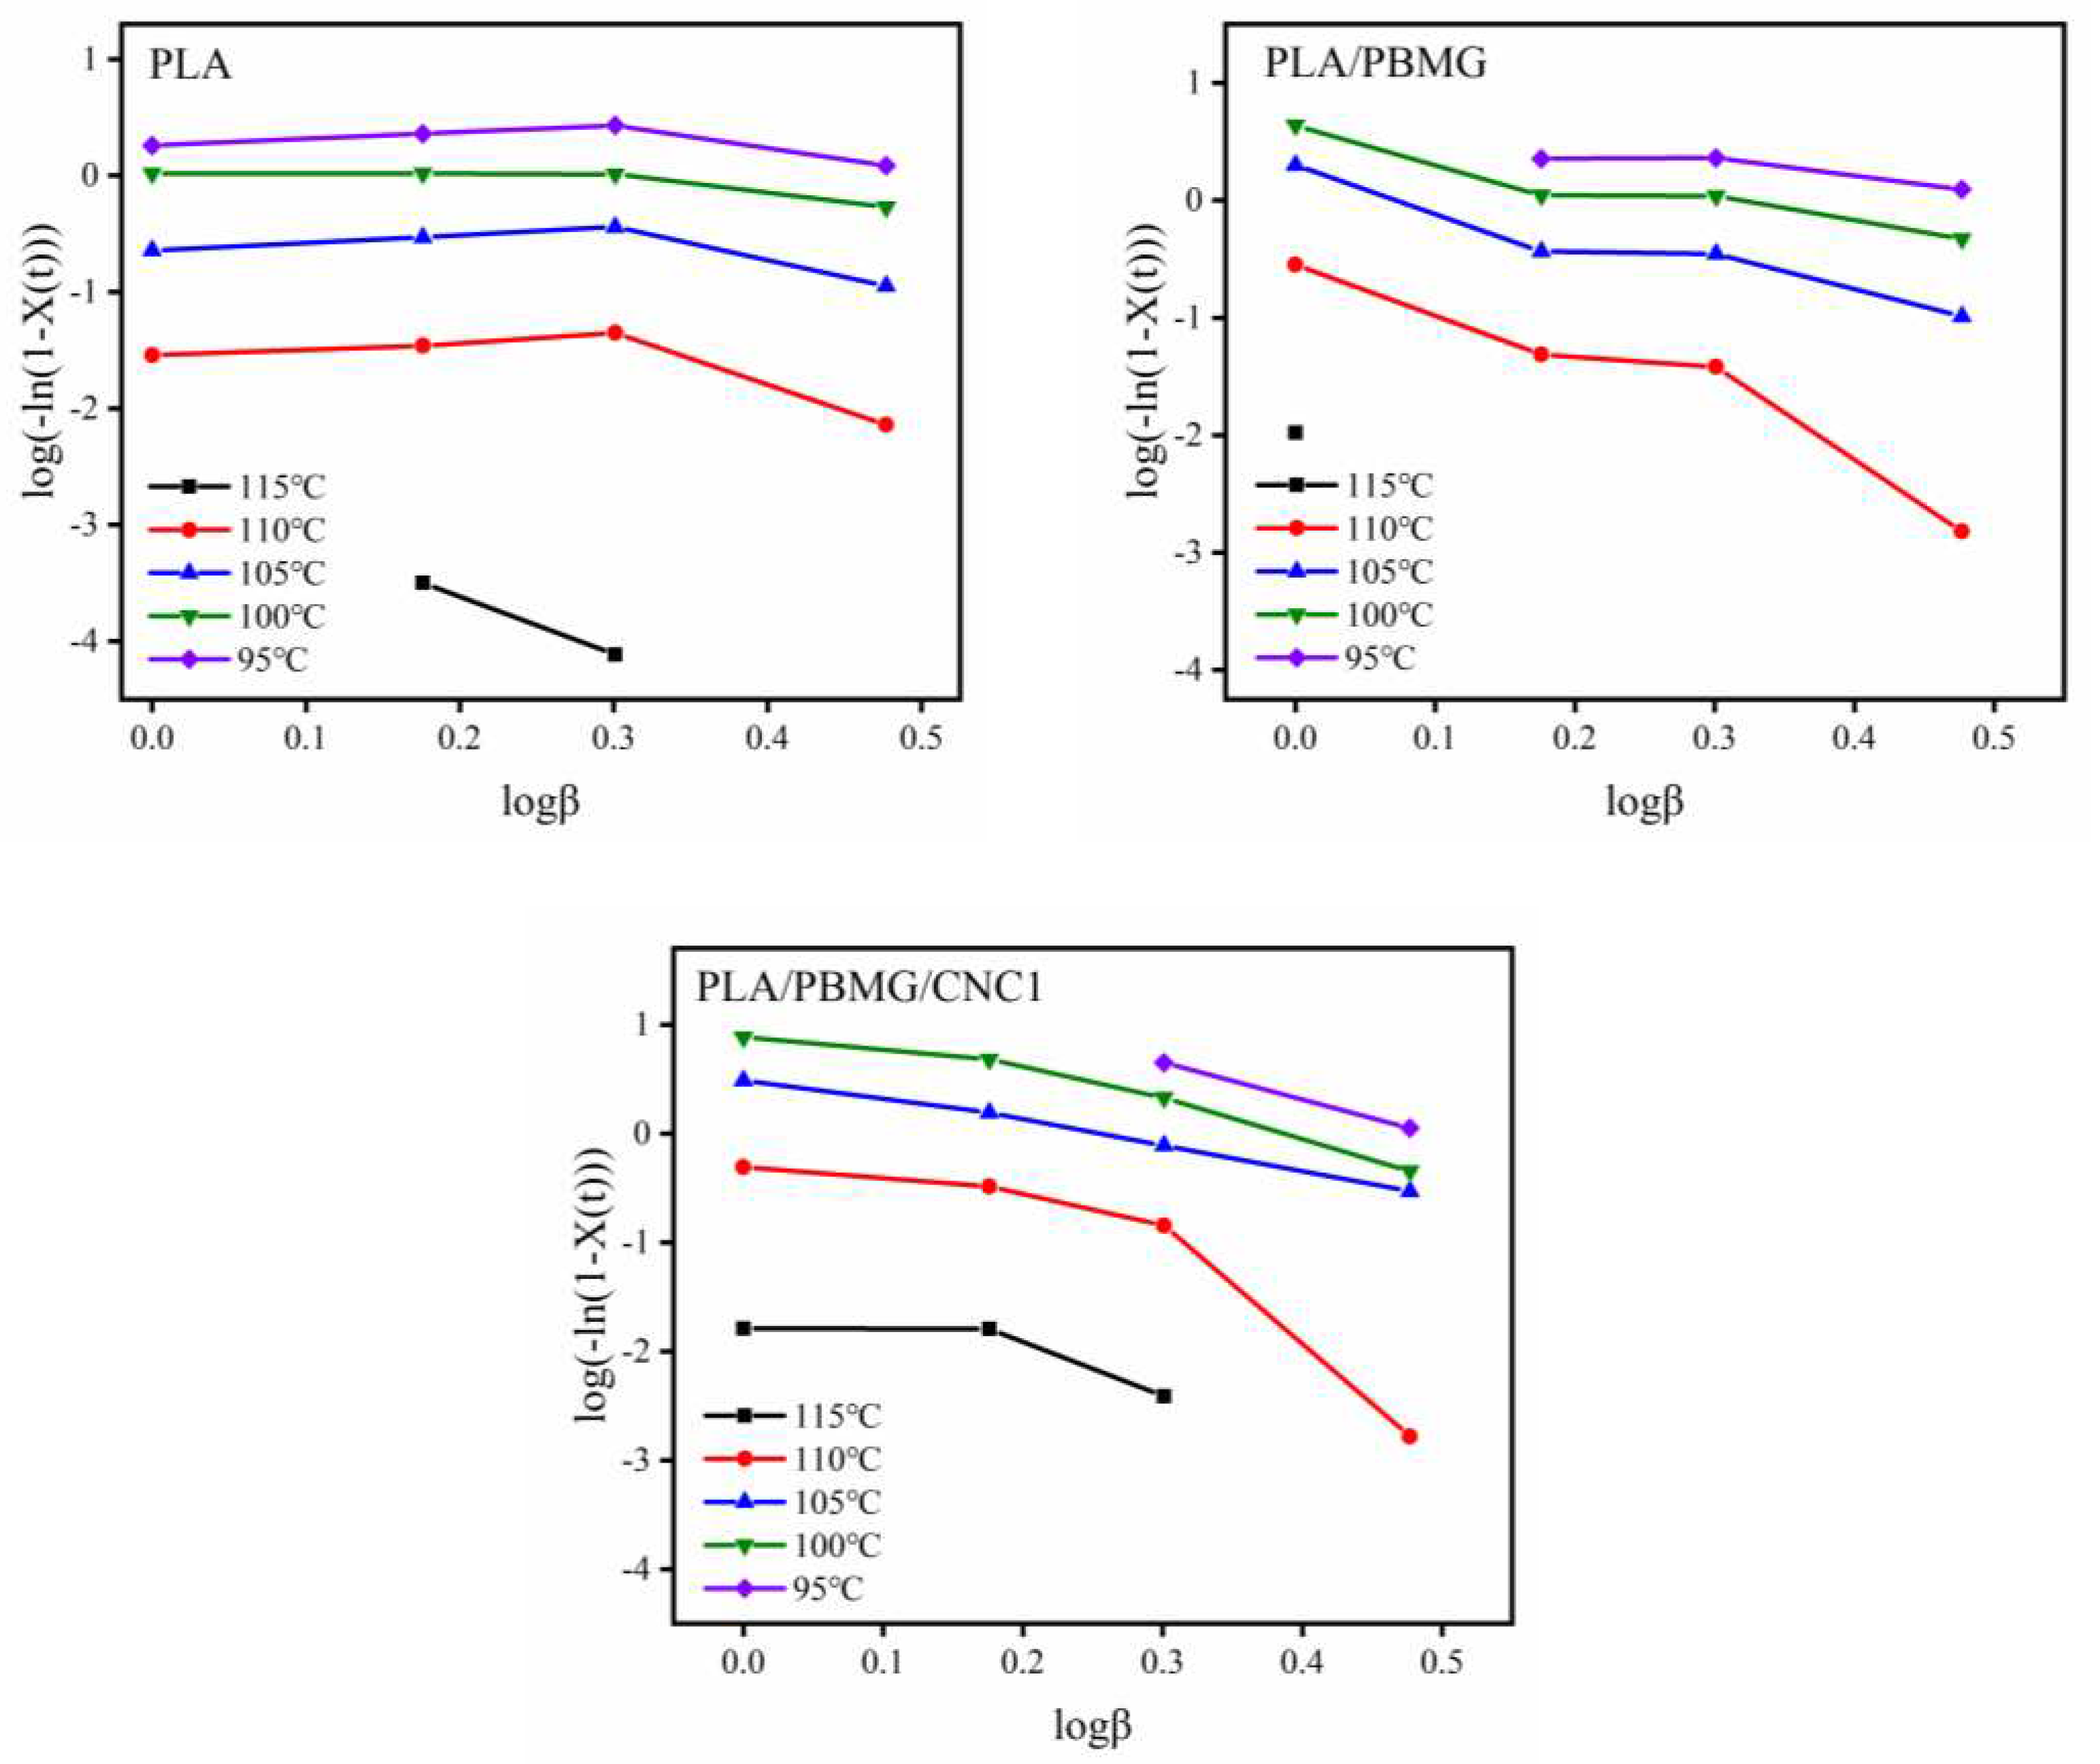
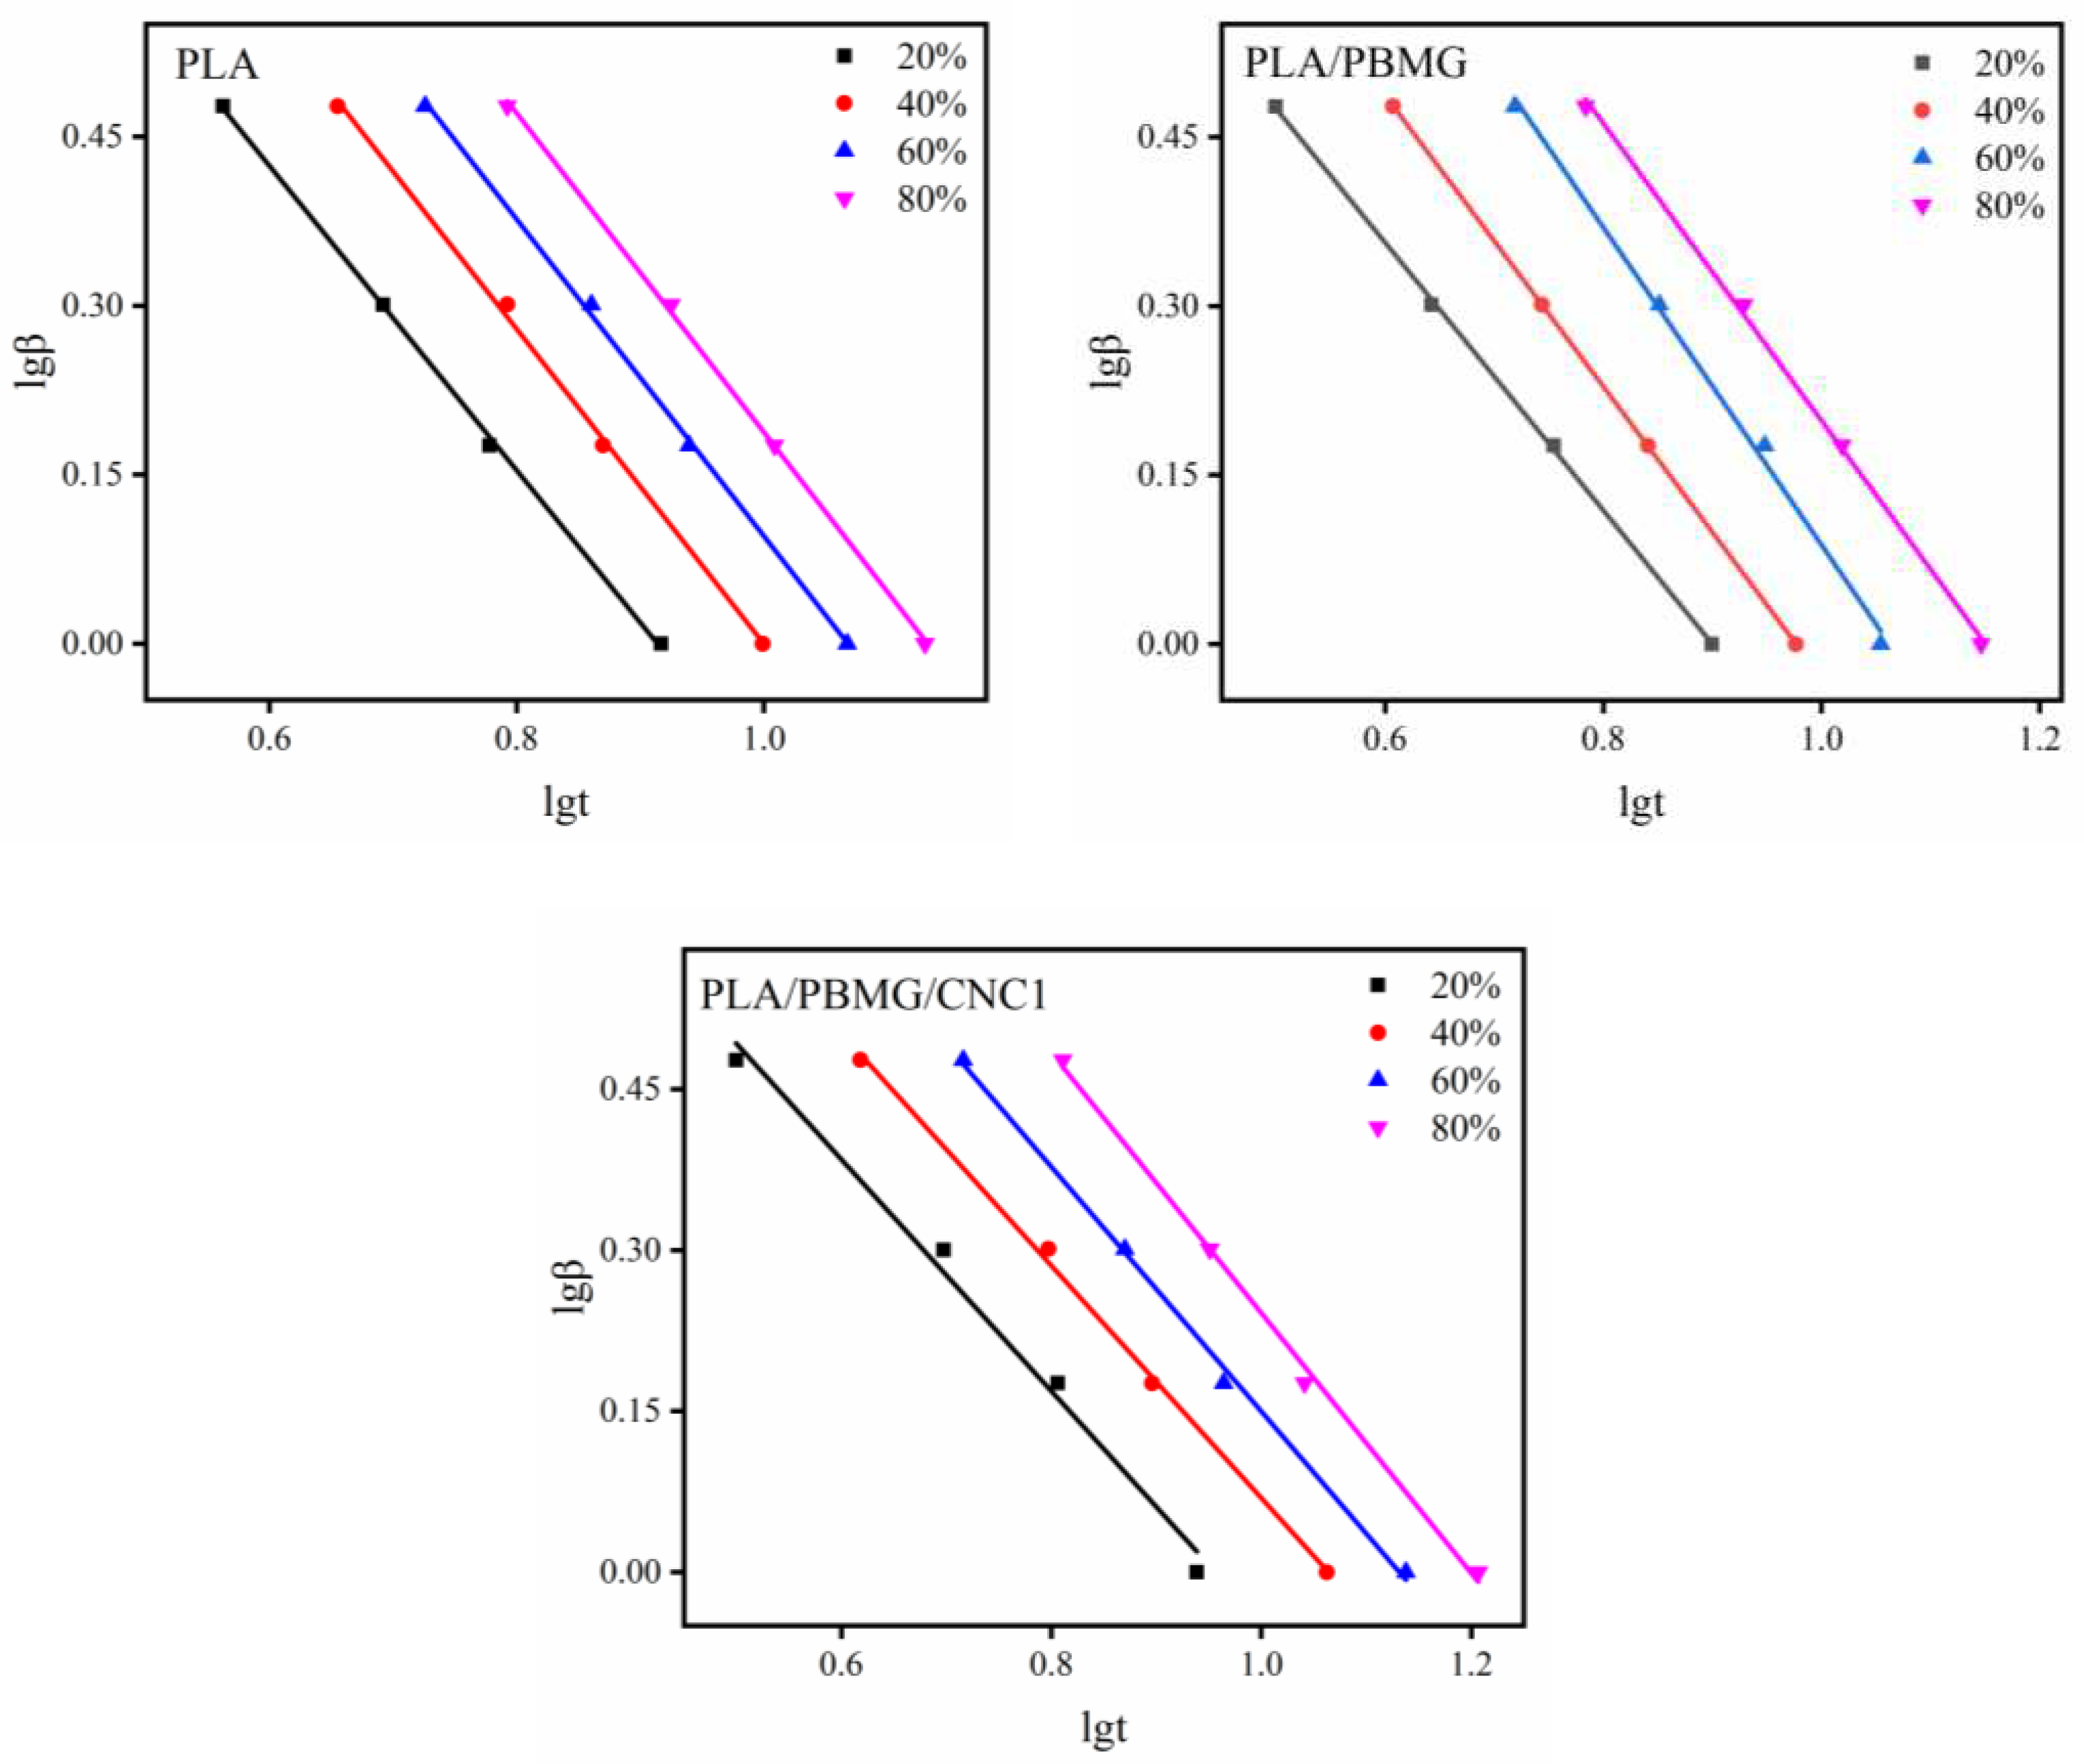
| Tg(oC) | Tcc(oC) | Tm (oC) | ΔHc ((J/g) | ΔHm (J/g) | Xc (%) | |
| PLA | 63.62 | 107.43 | 161.43 | 23.7 | 27.37 | 4.35 |
| PLA/PBMG | 60.75 | 104.70 | 160.30 | 22.78 | 33.45 | 12.65 |
| PLB/PBMG/CNC1 | 59.52 | 105.63 | 155.15 | 22.45 | 34.30 | 14.05 |
| t1/2(min) | |||
| PLA | PLA/PBMG | PLA/PBMG/CNC1 | |
| 1.0oC/min | 9.16 | 8.86 | 9.10 |
| 1.5oC/min | 8.14 | 7.48 | 7.50 |
| 2.0oC/min | 6.80 | 6.18 | 6.14 |
| 3.0oC/min | 5.18 | 4.84 | 4.59 |
| β (oC/min) | n | K | Kc | t1/2 | |
| PLA | 1.0 | 3.20 | 0.0003 | 0.0003 | 11.25 |
| 1.5 | 3.20 | 0.0006 | 0.0071 | 9.06 | |
| 2.0 | 3.39 | 0.0010 | 0.0317 | 6.88 | |
| 3.0 | 3.20 | 0.0034 | 0.1503 | 5.27 | |
| PLA/PBMG | 1.0 | 3.15 | 0.0006 | 0.0006 | 9.38 |
| 1.5 | 3.10 | 0.0008 | 0.0086 | 8.86 | |
| 2.0 | 2.93 | 0.0030 | 0.0547 | 6.41 | |
| 3.0 | 2.36 | 0.0195 | 0.2693 | 4.54 | |
| PLA/PBMG/CNC1 | 1.0 | 3.27 | 0.0004 | 0.0004 | 9.78 |
| 1.5 | 3.32 | 0.0008 | 0.0086 | 7.67 | |
| 2.0 | 3.40 | 0.0013 | 0.0362 | 6.33 | |
| 3.0 | 2.78 | 0.0107 | 0.2205 | 4.48 |
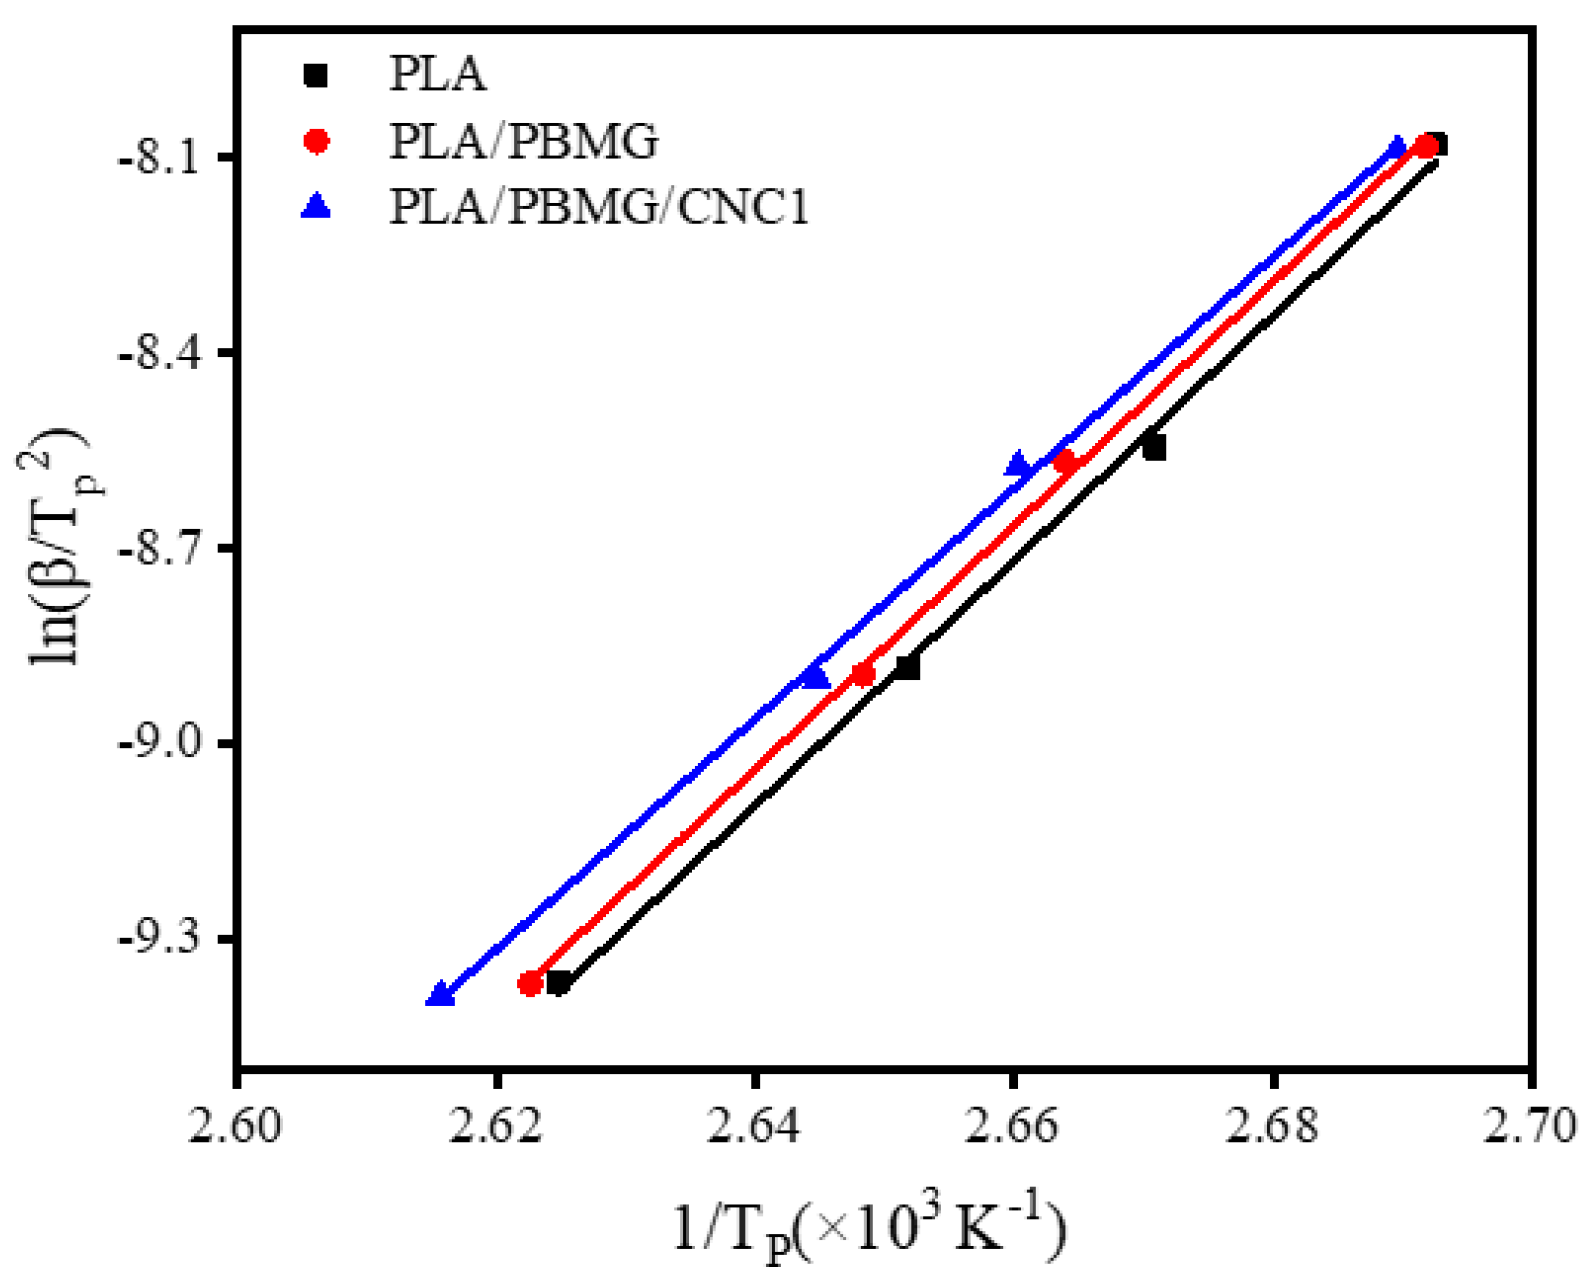
| X(t) (%) | α | log Z | Z | ΔE (KJ/mol) | |
| PLA | 20 | 1.18 | 1.1351 | 13.65 | -156.64 |
| 40 | 1.14 | 1.2190 | 16.56 | ||
| 60 | 1.12 | 1.2800 | 19.05 | ||
| 80 | 1.05 | 1.3030 | 20.09 | ||
| PLA/PBMG | 20 | 0.96 | 0.9387 | 8.68 | -155.80 |
| 40 | 1.08 | 1.1515 | 14.17 | ||
| 60 | 1.16 | 1.2129 | 16.33 | ||
| 80 | 1.17 | 1.2849 | 19.27 | ||
| PLA/PBMG/CNC1 | 20 | 1.12 | 1.0791 | 11.75 | -147.57 |
| 40 | 1.11 | 1.1741 | 14.79 | ||
| 60 | 1.34 | 1.2166 | 16.47 | ||
| 80 | 1.54 | 1.2891 | 19.46 |
Disclaimer/Publisher’s Note: The statements, opinions and data contained in all publications are solely those of the individual author(s) and contributor(s) and not of MDPI and/or the editor(s). MDPI and/or the editor(s) disclaim responsibility for any injury to people or property resulting from any ideas, methods, instructions or products referred to in the content. |
© 2023 by the authors. Licensee MDPI, Basel, Switzerland. This article is an open access article distributed under the terms and conditions of the Creative Commons Attribution (CC BY) license (http://creativecommons.org/licenses/by/4.0/).


