1. Introduction
Iron tailings are the waste that remains after separation of the iron ore concentrate in the beneficiation process. Iron tailings are usually dumped for a long time due to technical limitations. Dumping the iron tailings not only occupies land, but also causes environmental pollution and safety problems. Therefore, the best solution is to reuse the iron tailings [
1].
Blast furnace (BF) slag is a by-product of the ironmaking process and could be used to produce slag fibers by adding iron ore tailings [
2]. This method can not only efficiently utilize the sensible heat of the slag, which is currently unutilized [
3], but also significantly increase the value added of blast-furnace slag utilization. The crystallization behavior of the modified BF slag is important for the fiberization process. However, due to the difficulty of measuring the high-temperature process, the process cannot be applied industrially, and the melting characteristics of ferrous scrap under high-temperature conditions need more in-depth research.
At present, the relevant studies mainly focus on the dissolution behavior of CaO, MgO, SiO
2, Al
2O
3 in slag and the influence of various factors on its melting behavior[4, 5], while few studies have been conducted on the homogenization behavior. The homogenization process includes two processes, melting and diffusion, both of which are very important in homogenizing the conditioned slag. The melting process was investigated by in-situ observation experiment [
6] to study the dissolution behavior of the modifier in BF slag and to analyze the dynamic factors.
To investigate the influence of basicity on the crystallization behavior, BF slag was modified by the addition of iron ore tailings at room temperature and melted at 1500 °C by Ren et al. [
7]. The influence of basicity on the initial crystallization temperature during cooling was investigated using various techniques such as X-ray diffraction (XRD), scanning electron microscope backscattered electron imaging (SEMBSE), energy dispersive spectrometer (EDS), and hot thermocouple technique (HTT), etc. The effect of acidity coefficient on the crystallization behavior of modified BF slag was investigated by Cai et al. [
8] using Factage software, HTT and XRD, with the conclusion that the crystal growth rate is controlled by diffusion driving force and undercooling driving force. Most of the above similar studies focus on experimental measurement, which is difficult to operate and requires high demands on instruments and equipment. Studying the melting dynamic process requires repeated rapid cooling of the sample, which results in wasted experimental cost and time. More importantly, it is difficult to repeat an experiment many times to ensure that other conditions (such as particle size, the state of two-phase flow during the dissolution process, cooling rate, etc.) are exactly the same.
The main component of the iron tailings is SiO
2, and SiO
2 is the most difficult part of the iron tailings to melt, and the melting behavior of the iron tailings can be expressed by the melting behavior of SiO
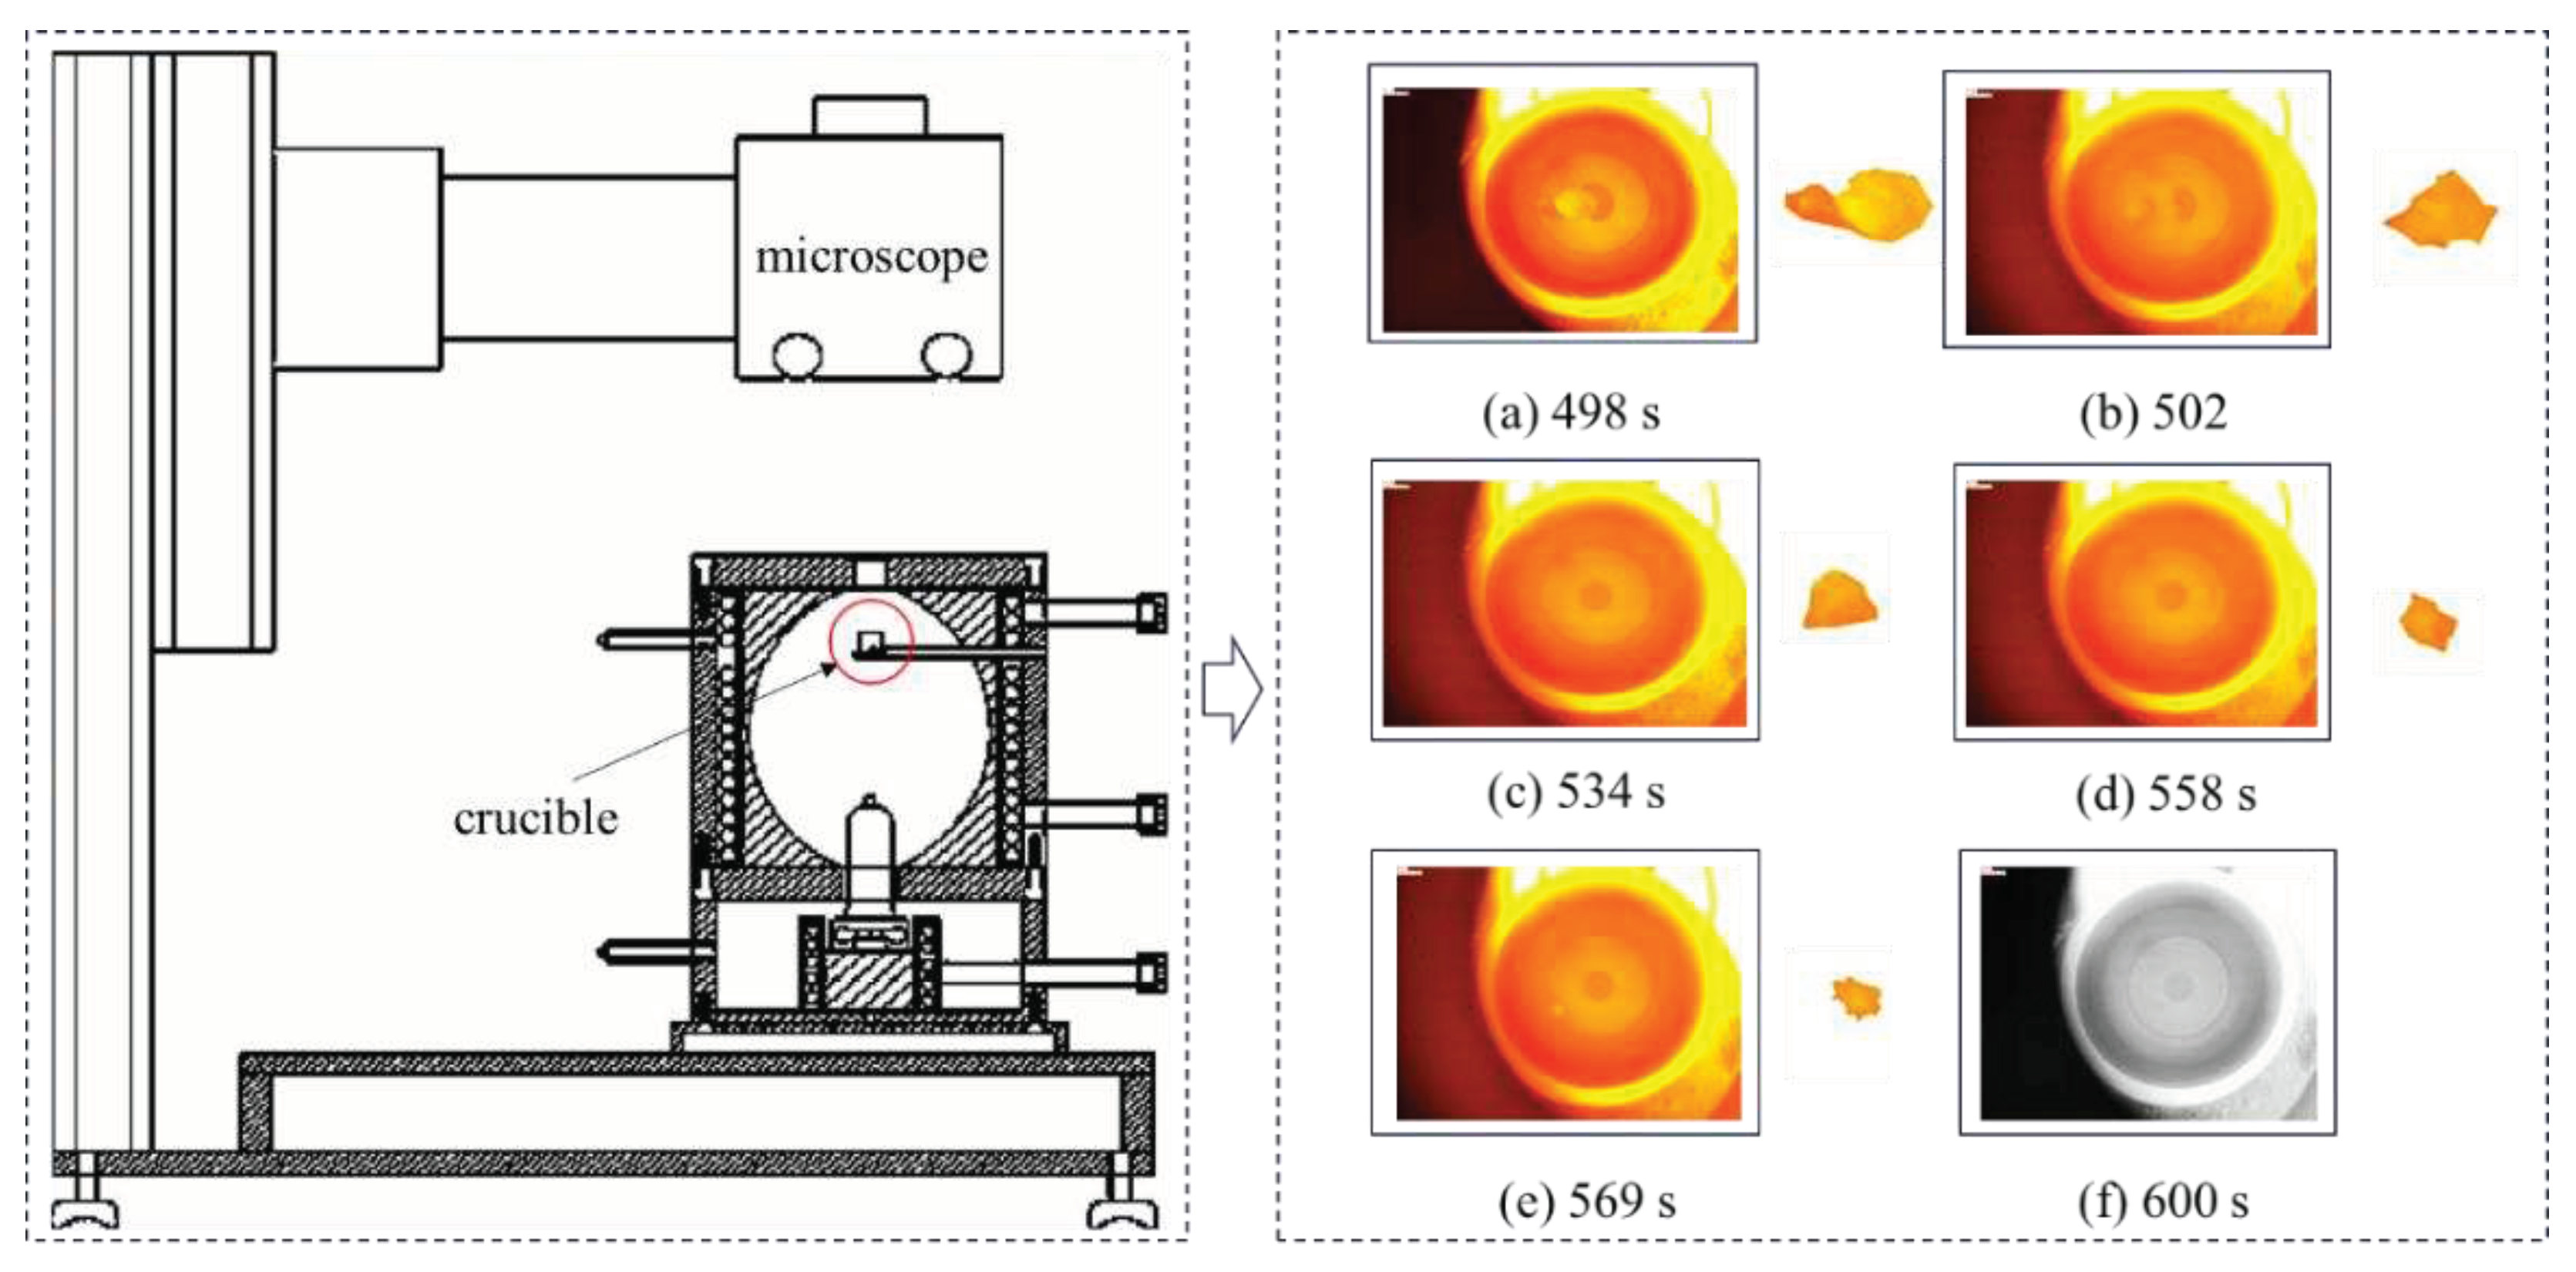
2. However, the temperature of the high-temperature melting groove is more than 1500℃, and the service life of the conventional testing equipment in this environment is very short. To solve this problem, high-temperature laser scanning confocal microscopy (CSLM) [
9] is usually used to obtain dynamic visualization data of SiO
2 in the high-temperature melting pool in a non-contact way, observe the dissolution phenomenon in situ during the high-temperature process, and observe the melting state of SiO
2 in time series in real time through video analysis.
For the same problem, some scholars have used different methods to conduct research, such as: Dai et al. [
10] proposed to use image matching, moving state target tracking, gray scale and binary method to build a multiple linear regression model to study the melting process of silica, use generalized radius and area to reflect the changes in the melting process of silica, and finally get the melting rate of silica. Sun et al. [
11] selected shape, perimeter, area and generalized radius as objects. By independently analyzing the influence of these four indices on the melting rate, area and shape were selected as the characteristic parameters of the edge profile of silica particles. Then, the actual melting rate of silica was estimated by using the characteristic index of the edge profile. Ma et al. [
12] established the piecewise function and exponential function of the angle between the crucible center of mass and the crucible center, studied the position of the center of mass and its motion trajectory, used the generalized diameter method to effectively describe the morphology and area of SiO
2 in the melting process, used the microelement method to calculate the phase between the generalized diameter and the velocity, and used the correlation function to quantitatively characterize the melting rate at different times. Zhu et al. [
13] used the optimized convolutional neural network (CNN) to track the moving target in the charge-coupled device (CCD) camera system, and used the coordinate translation transformation theory to describe the melting behavior of SiO
2. The characteristic parameters of SiO
2 melting process were extracted by hierarchical clustering (HAC) and Delaunay triangulation. Least square fitting (LSF) and dimensional analysis are used to establish the prediction model of the melting rate of SiO
2 at high temperature, and the actual melting rate of SiO
2 is compared with that obtained by experiment. By establishing a pixel clustering model, Guo et al. [
14] analyzed the contour changes in the melting process of silica, proposed the centroid calculation method, plotted the centroid trajectory, established the change model of silica sample area and perimeter over time, and then obtained the change rate of silica mass. Zheng et al. [
15] used the snake active contour algorithm combined with the Sobel operator to extract indicators representing the edge contour characteristics of silica during the melting process, including shape, perimeter, and area. Using the extracted skeleton features, a 3D skeleton generation model was built. From the skeleton data, the volume of silica was estimated and the parameter formula of the actual melting rate of silica was determined. For the same issue, Yang et al. [
16] constructed the 3D image according to the 2D image by constructing a shape from shading (SFS) model. The melting rate of silica was calculated by polynomial curve fitting. The above literatures all use image processing related methods to study the melting rate of SiO
2, and the differences in the research methods are mainly reflected in the determination of the position of the center of mass and the solution of the area.
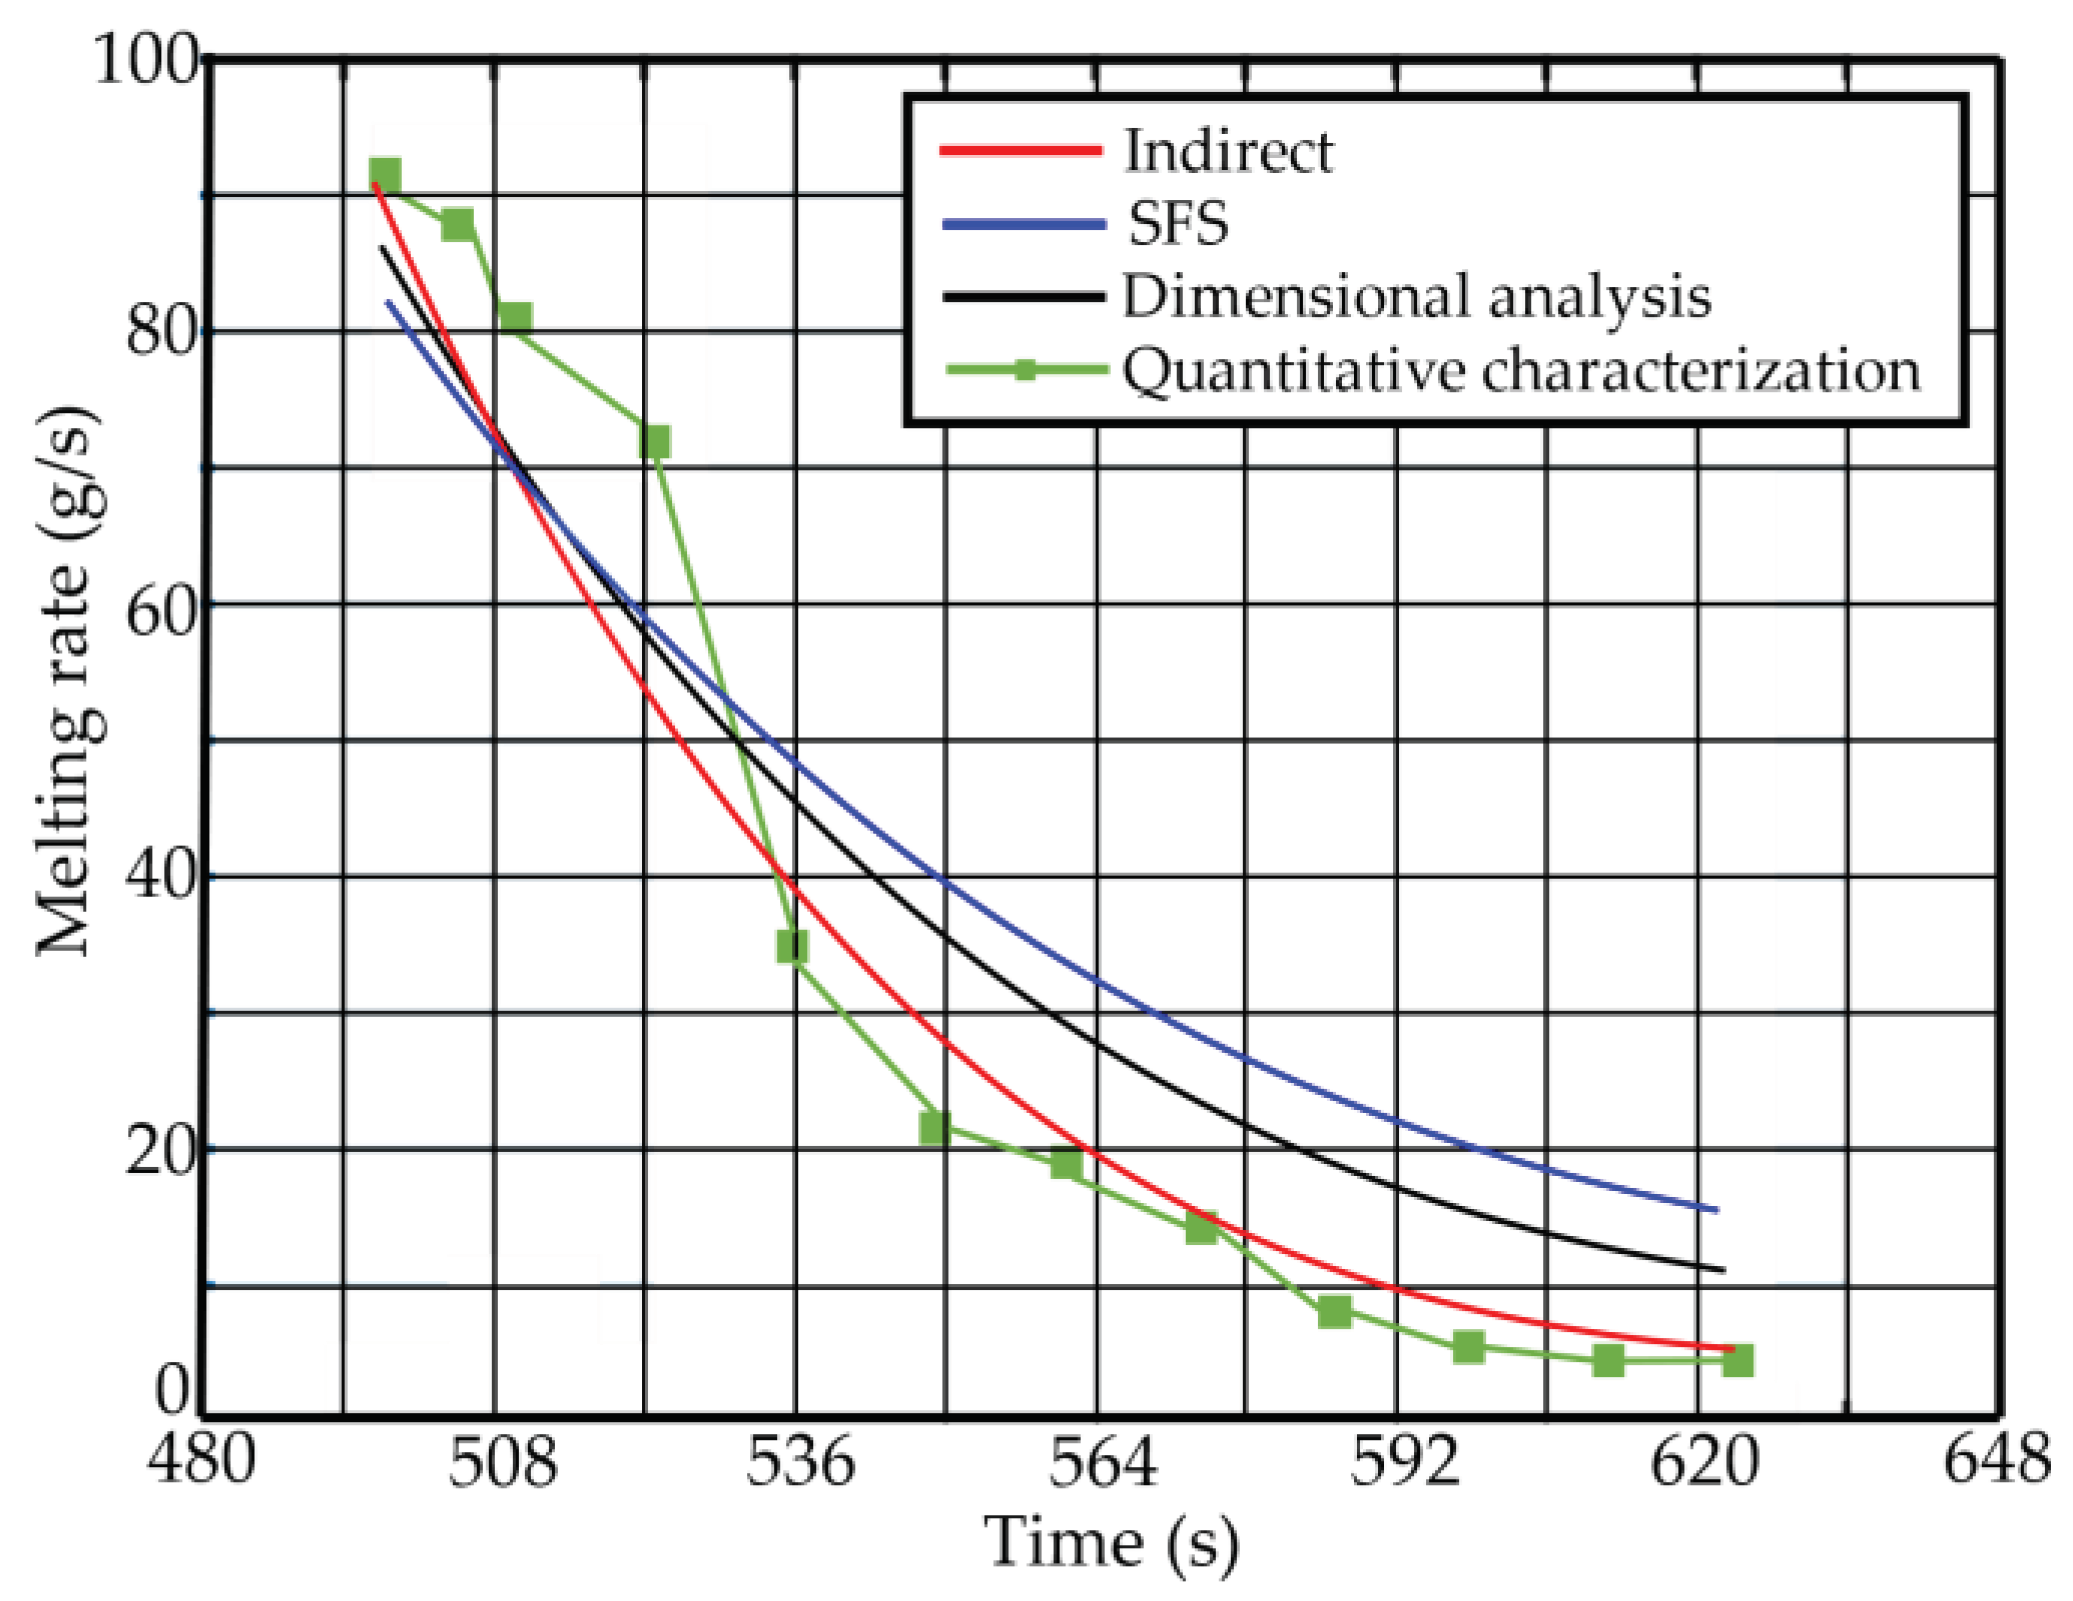
The solution methods for determining the volume and mass of SiO2 are relatively straightforward, yet their accuracy and applicability warrant an in-depth examination and potential refinement. Building upon the aforementioned research approaches, this paper introduces an indirect method to ascertain the volume of SiO2 during the iron waste melting process. Subsequently, it investigates the dissolution rate of SiO2 through exponential fitting and contrasts the outcomes with the previously discussed primary algorithms. The key contributions of this paper are outlined as follows:
Utilization of image processing technology: The extraction of SiO2 contours, centroid tracking, and area determination are facilitated through advanced image processing techniques.
Introduction of the indirect method: The paper introduces an indirect approach to derive the volume and mass of SiO2, subsequently estimating the SiO2 melting rate over a defined time sequence. These outcomes are compared against those generated by three other methods.
The paper's structure is as follows:
Section 2 elaborates on the data sources and the data collection procedures employed in the research.
Section 3 details the methods used for calculating SiO
2's area, volume, and melting rate, accompanied by the entire modeling process.
Section 4 provides a presentation of the obtained results. In
Section 5, the outcomes of the two different methods are discussed, the proposed model's performance is juxtaposed with other typical advanced methods, and the model's validity and accuracy are scrutinized. Lastly,
Section 6 concludes the full-text by summarizing the findings and looking ahead to future research directions.
3. Methods
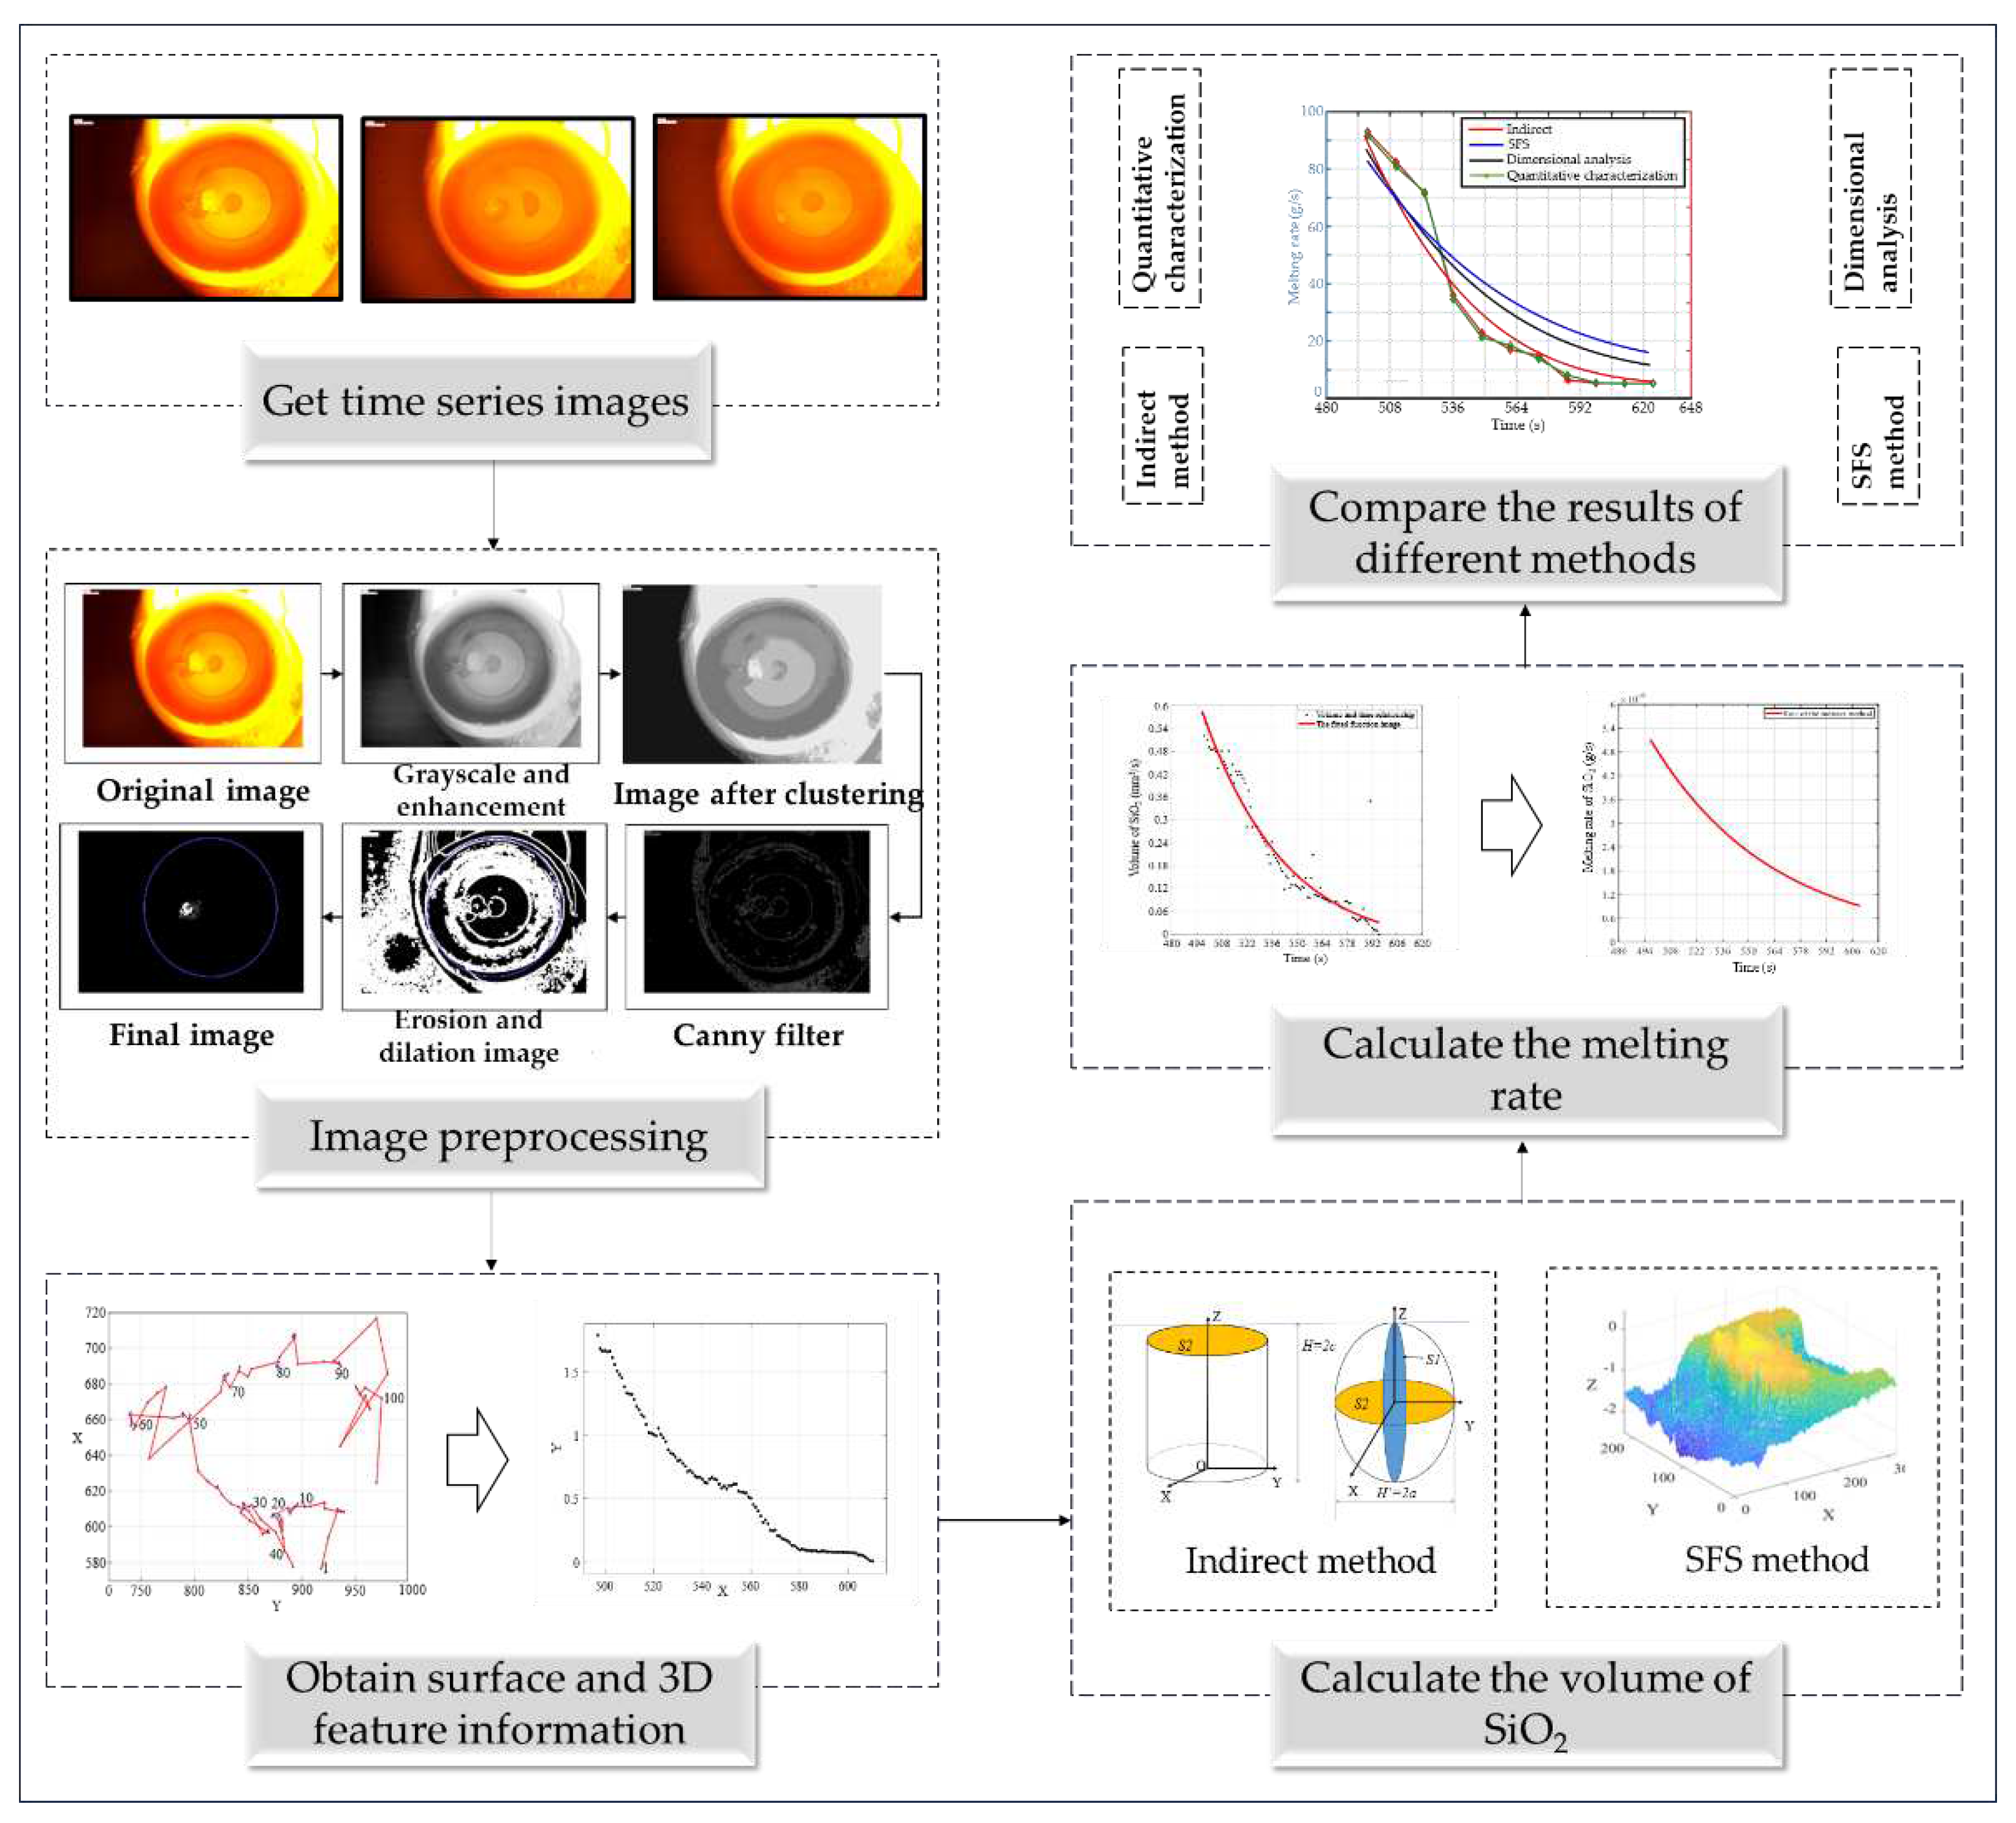
The images of SiO
2 melting are first classified according to their time series, and then image processing technology is used to perform a series of processing on the given images, extract feature information from the images, and solve the volume of SiO
2. The structural block diagram investigated in this paper is shown in
Figure 2.
To extract SiO
2 contours, a series of processing on the original image data is required. Since not all the existing data are grayscale images, grayscale image processing and enhancement are first performed on the image [
18], and then K-means clustering algorithm [
19] is used to further process the image. Finally, Canny filter function [
20] and expansion corrosion are used to smooth the image [
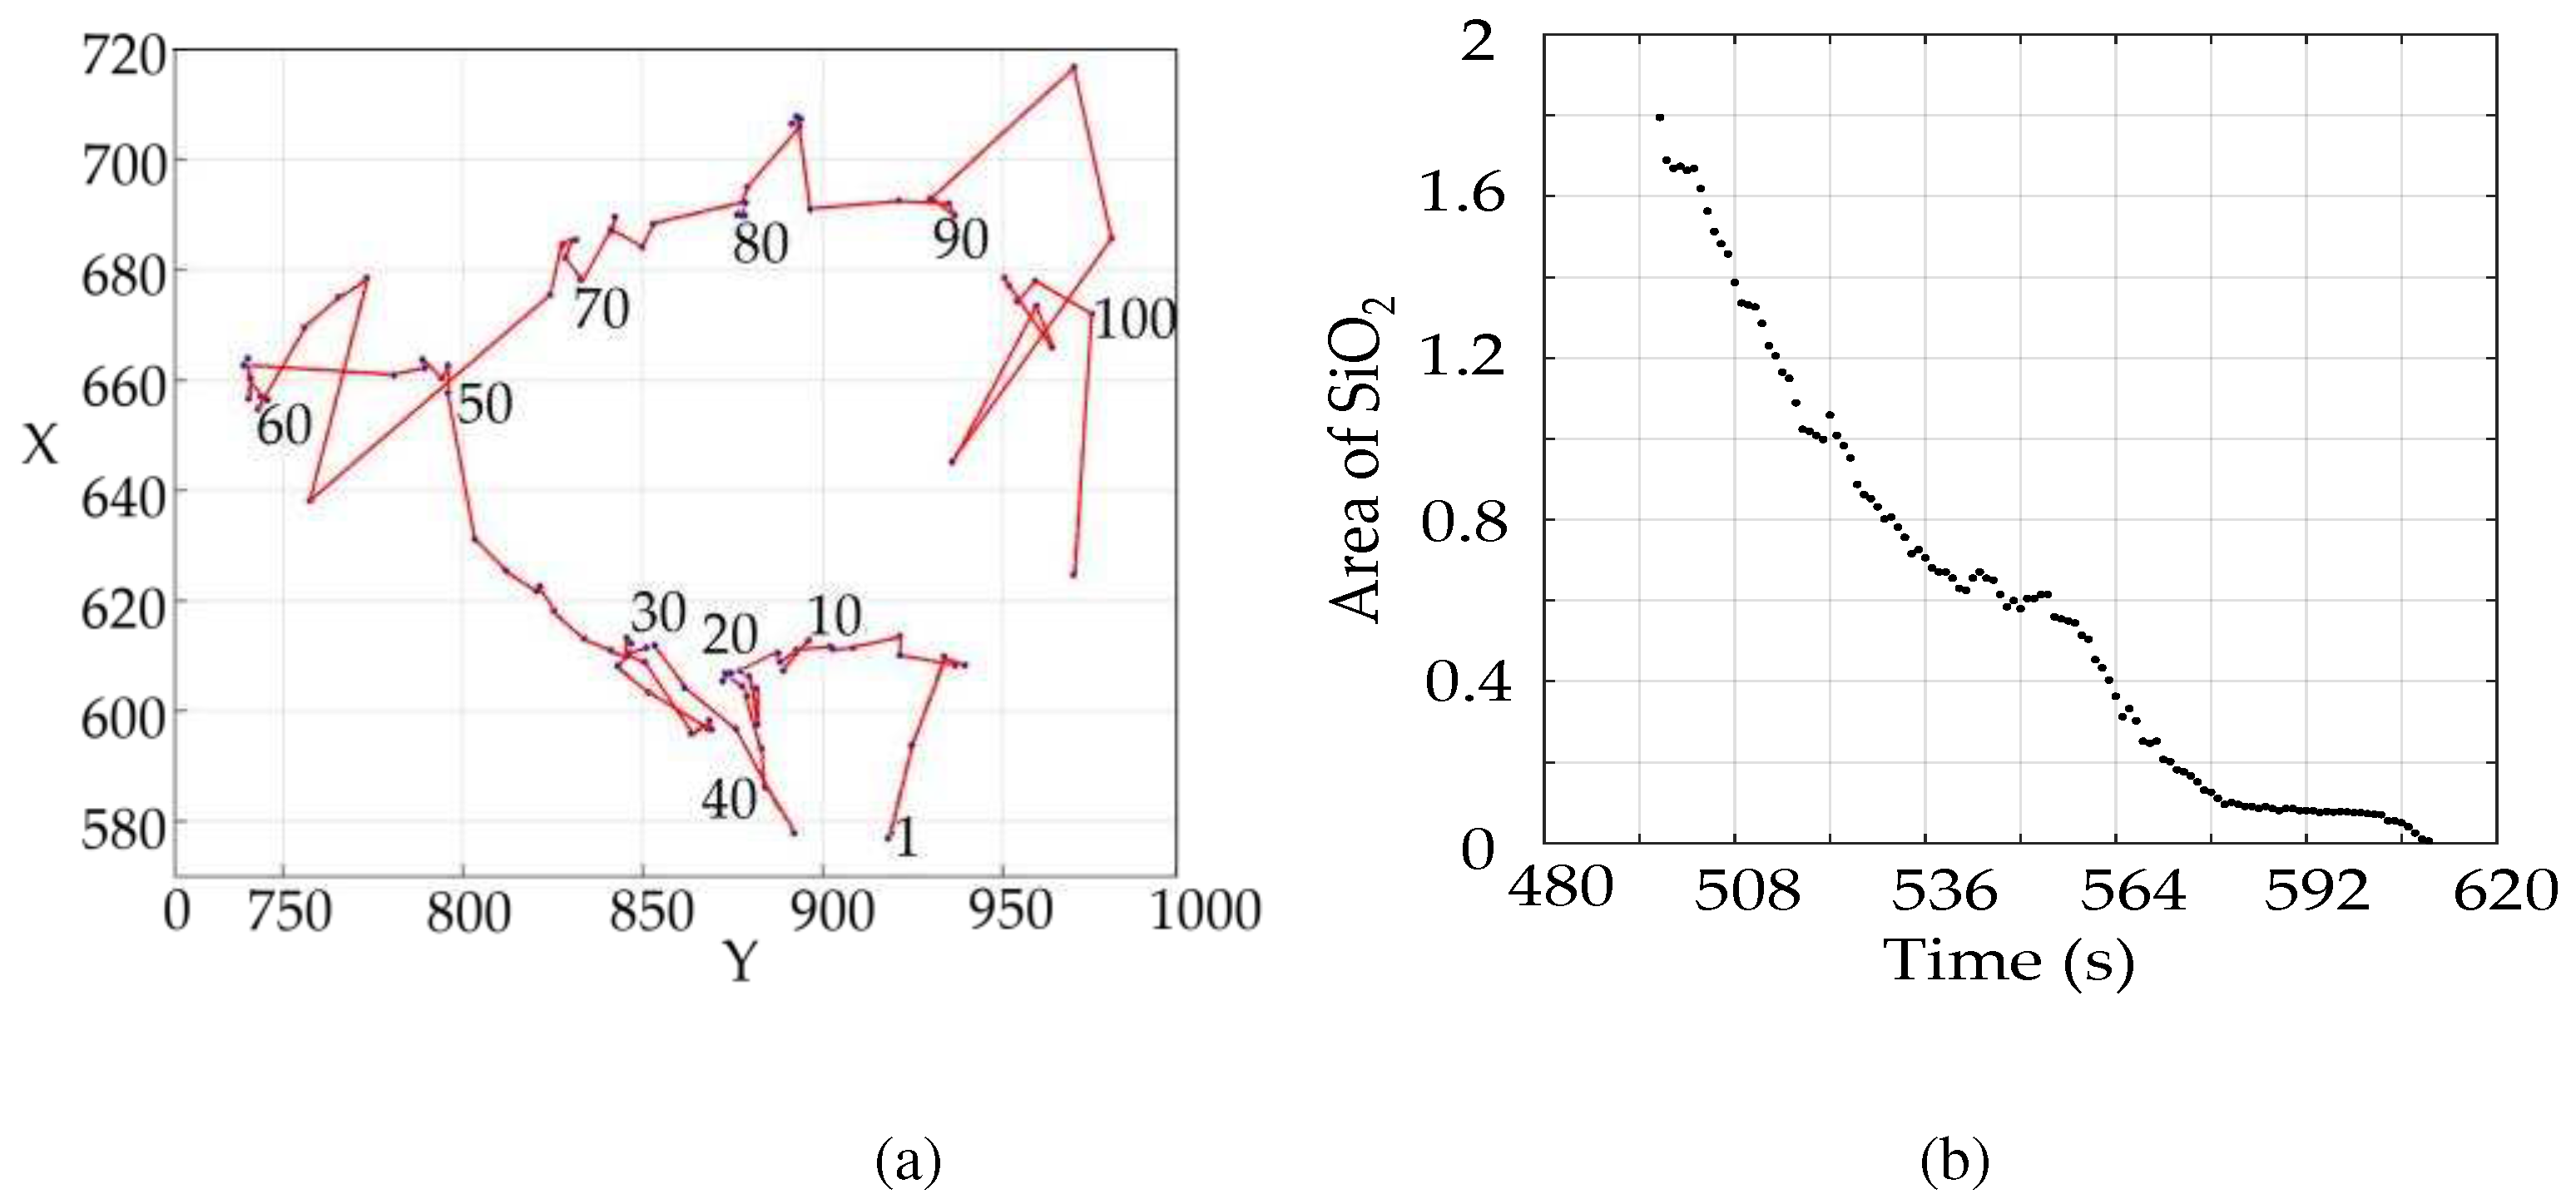
21]. To calculate the motion trajectory of the center of mass, first, a rectangular coordinate system based on the whole image system is set up so that one pixel represents one coordinate, and then the center of mass position model is set up to minimize the convolution integral of the horizontal and vertical coordinates, respectively, and the position of the center of mass is obtained. After the position of the center of mass is obtained, the edge contour of SiO
2 is extracted, and the cross-sectional area of SiO
2 in the melting process is calculated according to the ratio of pixels equal to the ratio of area. Before solving the melting rate, it is necessary to calculate the volume of SiO
2. The gray value difference between each pixel is used to assume the height of each point, and the volume of SiO
2 is solved by using the method of large volume reduction groove. However, this method can only obtain the volume of the upper half of SiO
2, assuming that SiO
2 is symmetrical about the maximum section plane in the melting process. After obtaining the volume data, the density is multiplied and the equation is obtained by fitting. The melting rate of SiO
2 can be obtained by deriving the equation.
3.1. Determination of the contour area of SiO2
First, K-means algorithm is used to process the image to get the approximate contour, then Canny filtering technology is used to eliminate the noise outside the contour, and corrosion operation is used to eliminate the burrs around the contour to get the specific contour. The horizontal and vertical coordinates of the center of mass are determined by binarization and convolution. Then find out the contour of the crucible, get the relationship between SiO2 and the cross-sectional area of the crucible, through the binary image digital matrix to represent the area of SiO2.
3.1.1. Extraction of the SiO2 profile
First, the original image is converted to a grayscale image so that the image becomes a classic grayscale image. Since the obtained gray image contrast is low, that is, the difference between the SiO2 image and the background image is small, image enhancement is needed for low contrast images to highlight the difference between the SiO2 image and the background image. In this paper, an image enhancement method based on fuzzy sets is adopted to extract fuzzy features of gray image, and a mathematical model of conversion from spatial domain to fuzzy domain is established. Then, the K-means algorithm is used to divide the existing data into many different categories through multiple iterations, and the clustering center is gradually updated several times to achieve the expected goal. The data similarity in the sample cluster is calculated. Assuming that the data sample has k clustering subsets, the data object is randomly assigned to k sample clusters, and the average value of each cluster is further calculated. That's the eigenvalue of that cluster. Finally, in the process of applying the model, it is found that after image segmentation, there are still some interference factors such as burrs and noise in the contours of SiO2 images, and it is difficult to extract effective information from the images. To solve this problem, the Canny filter function is used to eliminate the noise outside the contour, and the corrosion operation technology is used to basically eliminate the burrs around the contour. To modify the shadow part of the SiO2 image, this paper uses the expansion theory to effectively fill the shadow part and improve the accuracy of the effective area. To improve the SiO2 shadow and ensure the integrity of the image, morphological open and close operations are performed on the later image, and elements C and D of two different structures are recorded.
3.1.2. Extraction of the SiO2 profile
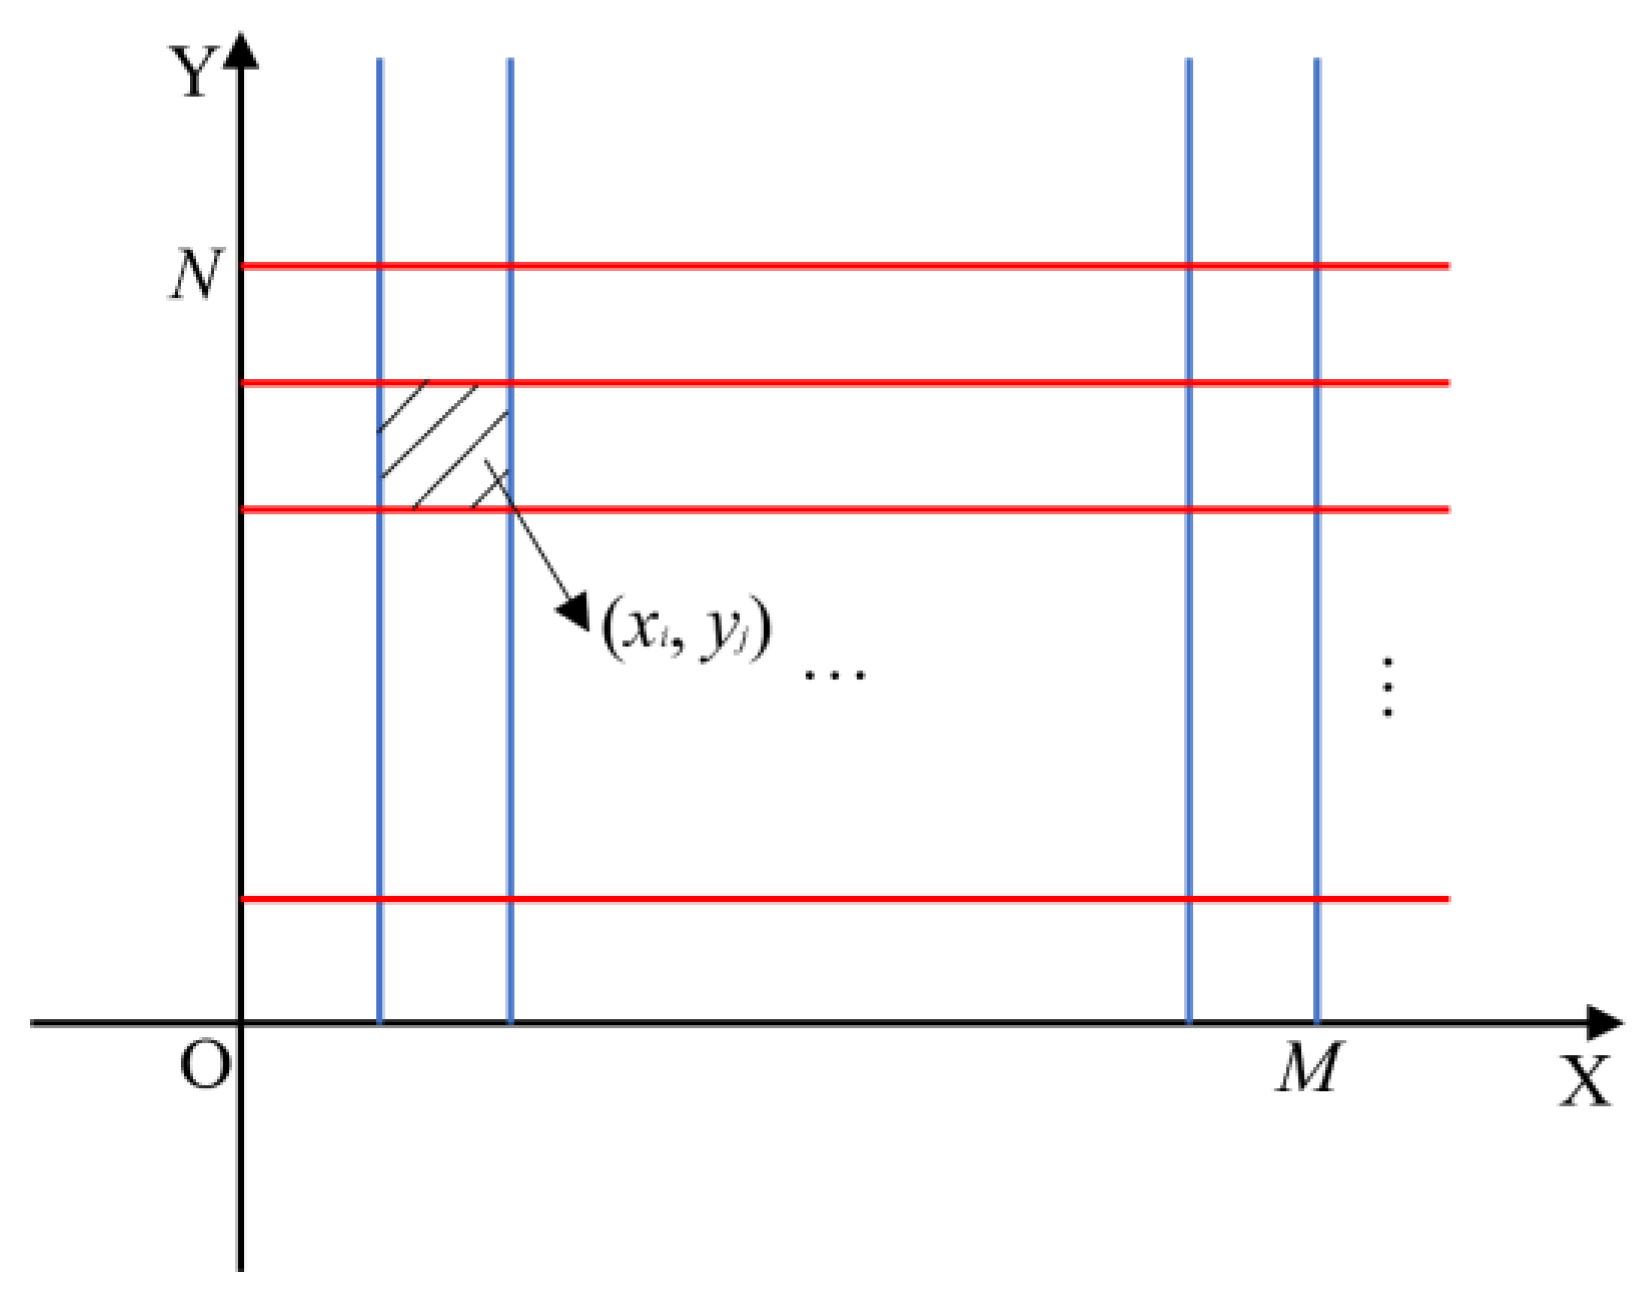
Since the image size processed by this model is
M×
N, a two-dimensional planar rectangular coordinate system XOY is established to divide the image into
M×
N grids, where each pixel block represents a coordinate (
xi,
yj) (
i=1, 2, ... ,
M,
j=1, 2, ... ,
N), as shown in
Figure 3.
In the process of image processing, the feature contour of SiO
2 image is
A binary image, assuming that the binary image is
R(
xi,
yj), the white area in the image is
A, the black area is
B, and the area
A and area
B can be expressed as:
Assuming that the centroid coordinate of SiO
2 is
R0(
x0,
y0), its horizontal and vertical coordinates are defined as:
The position of any point in a region is represented by
R(
m,
n), then the convolution integral of the shortest distance between any two points in the horizontal coordinate is defined as:
Similarly, the convolution integral of the ordinate is expressed as:
When the two convolution integrals are minimum values, k and l are the horizontal and vertical coordinates of the image center, respectively.
3.1.3. Modeling of SiO2 area
Based on the effective segmentation image obtained above, image processing technology is first used to remove the black background of the entire image, and only the crucible outline image and the SiO
2 outline image are retained. After segmentation, an image containing only the SiO
2 profile and an image containing only the crucible profile can be obtained to facilitate the subsequent solution of the area of the crucible and the SiO
2 profile. The ratio of the cross-sectional area of the SiO
2 to the cross-sectional area of the crucible is equal to the ratio of the number of pixels of the two, which can be expressed as:
where
λ0 is the proportional coefficient between
Sc and
Sd;
Sc is the cross-sectional area of the crucible;
Sd is the area surrounded by the contour edge of SiO
2,
ni is a number of possible contour areas of SiO
2, this is because some of the edge contour of the silica image is not completely closed, then it is necessary to separate the small contour and the main contour of the sum to achieve higher accuracy.
If the radius of the crucible is defined as
R', the expression for the cross-sectional area of the crucible is:
By substituting formula (6) into formula (5), the relationship between SiO
2 and the cross-sectional area of the crucible is as follows:
The binary digital image is represented by a matrix to realize the effective number of pixels, and its matrix is represented as:
where,
Gij=0 or
Gij=1. According to this binary principle, the computer is made to search the entire image field for the numerical values "0" and "1" of the binary image. The digital value "1" represents the image within the SiO
2 contour in the entire image area. When the computer searches for the digital value "1", it records the coordinates of the pixel. Then the search continues, and the number of coordinate points calculated is the number of pixels. In the same way, you can get the number of pixels in the crucible.
3.2. Establishment of a volume solution model for SiO2
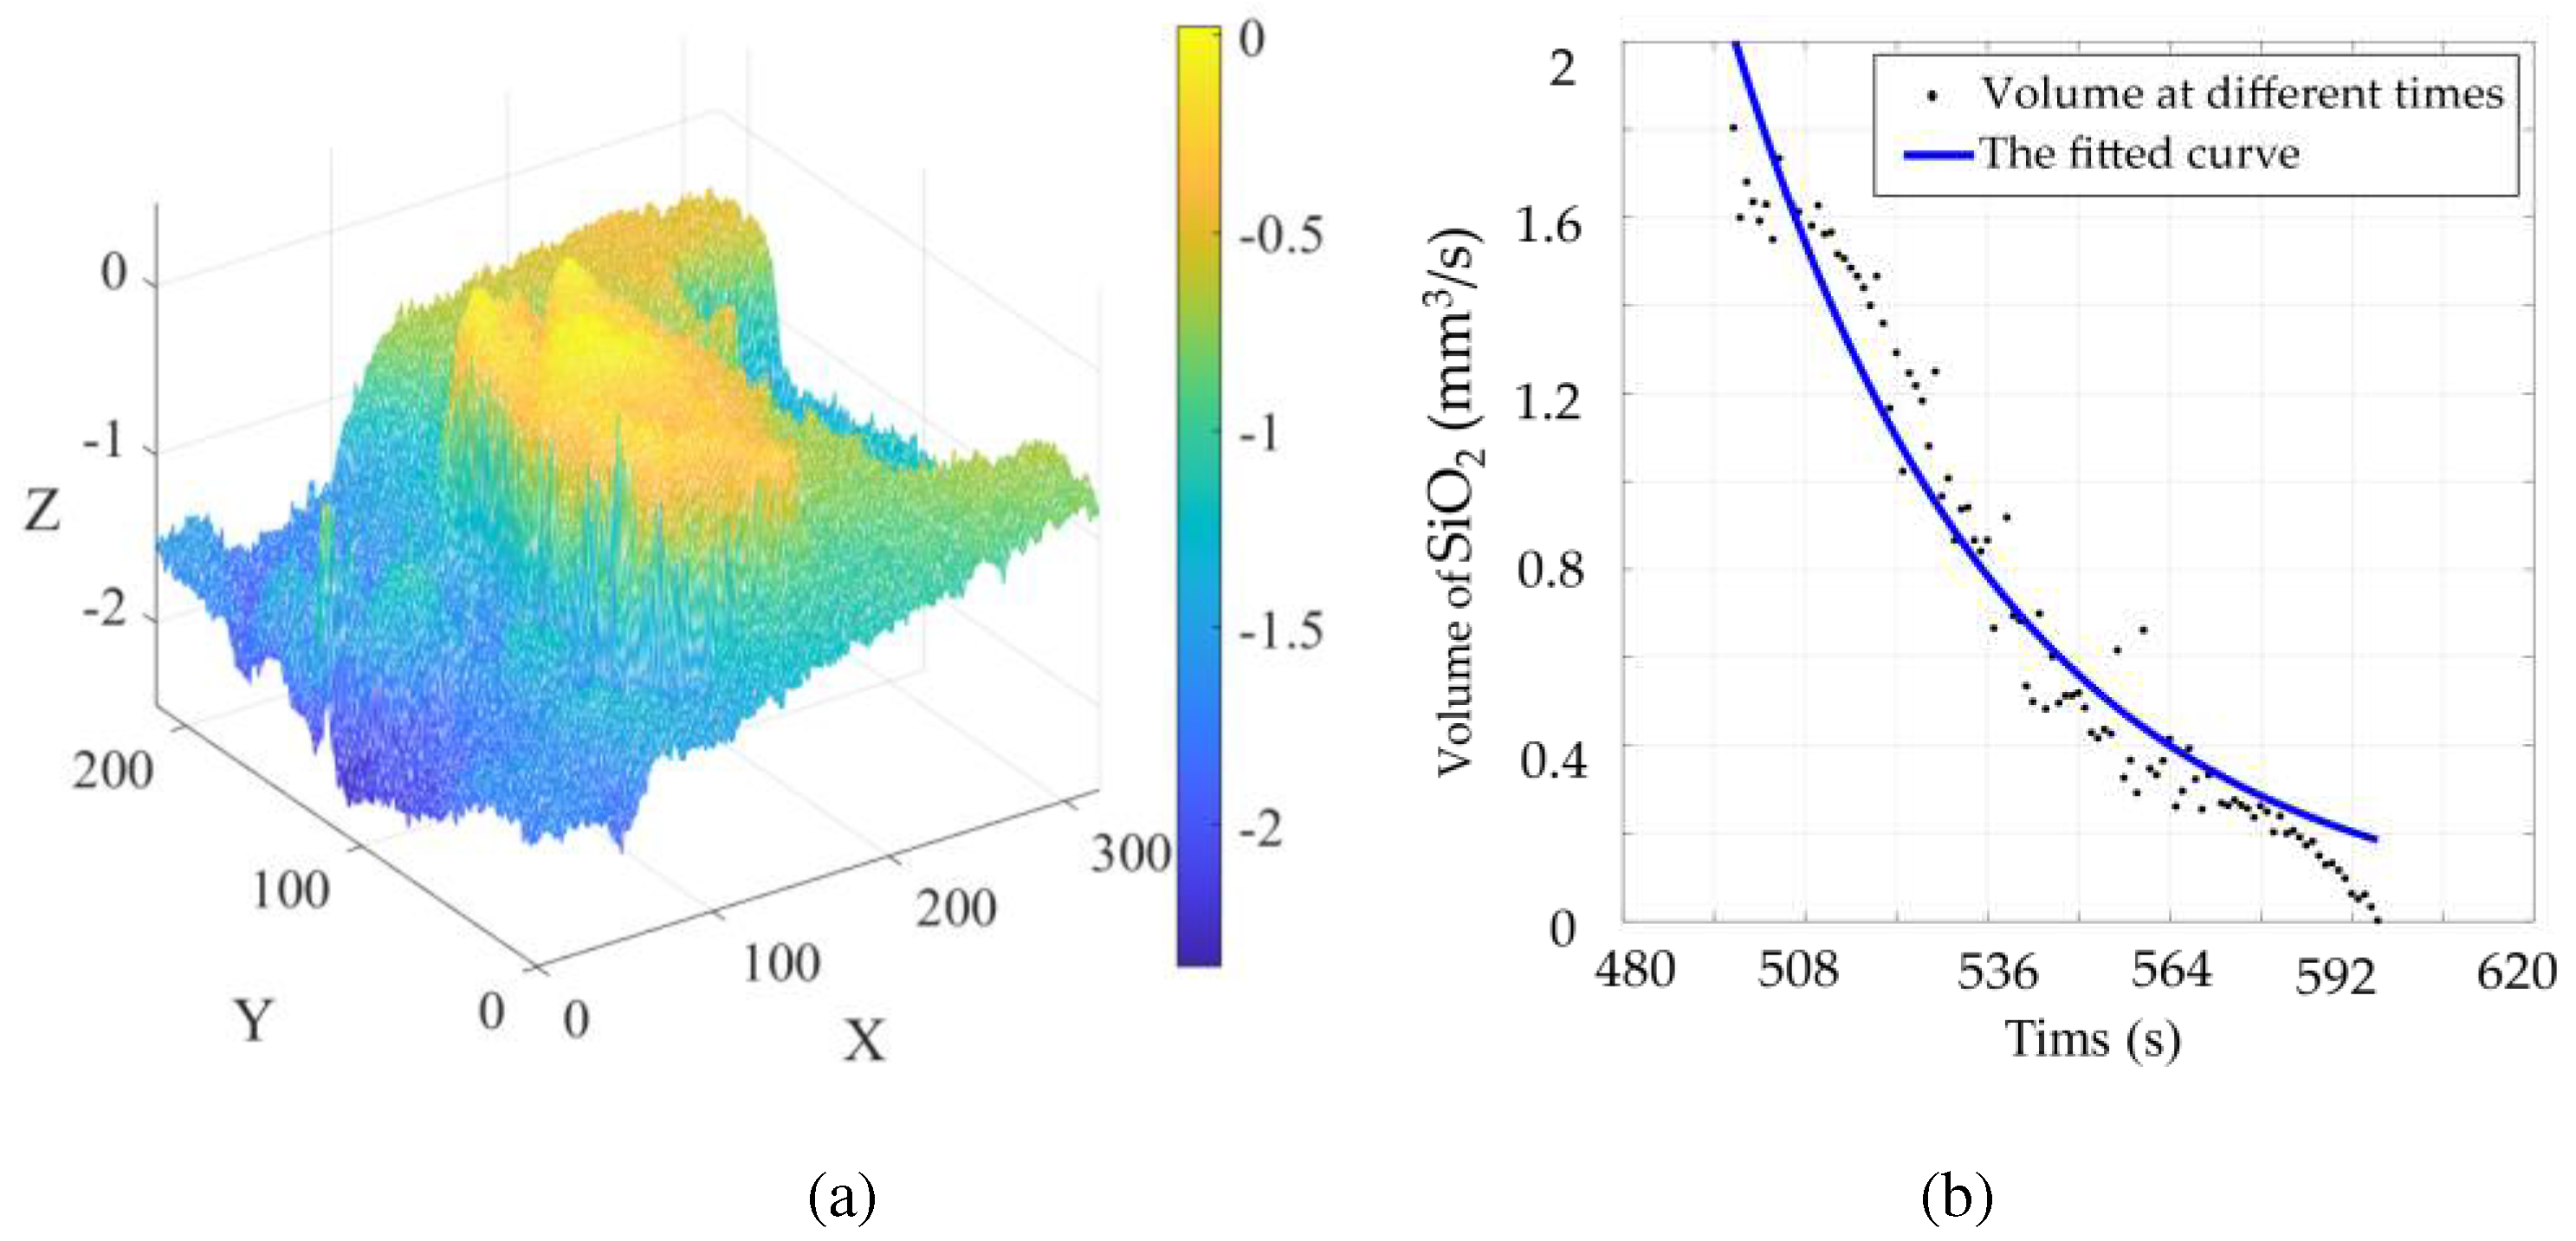
In establishing the SiO2 volume model, the indirect method is used to solve the SiO2 volume, and the obtained volume is plotted on a scatter plot. The relationship between the volume and time of SiO2 is obtained by using function fitting in MATLAB.
3.2.1. Image processing
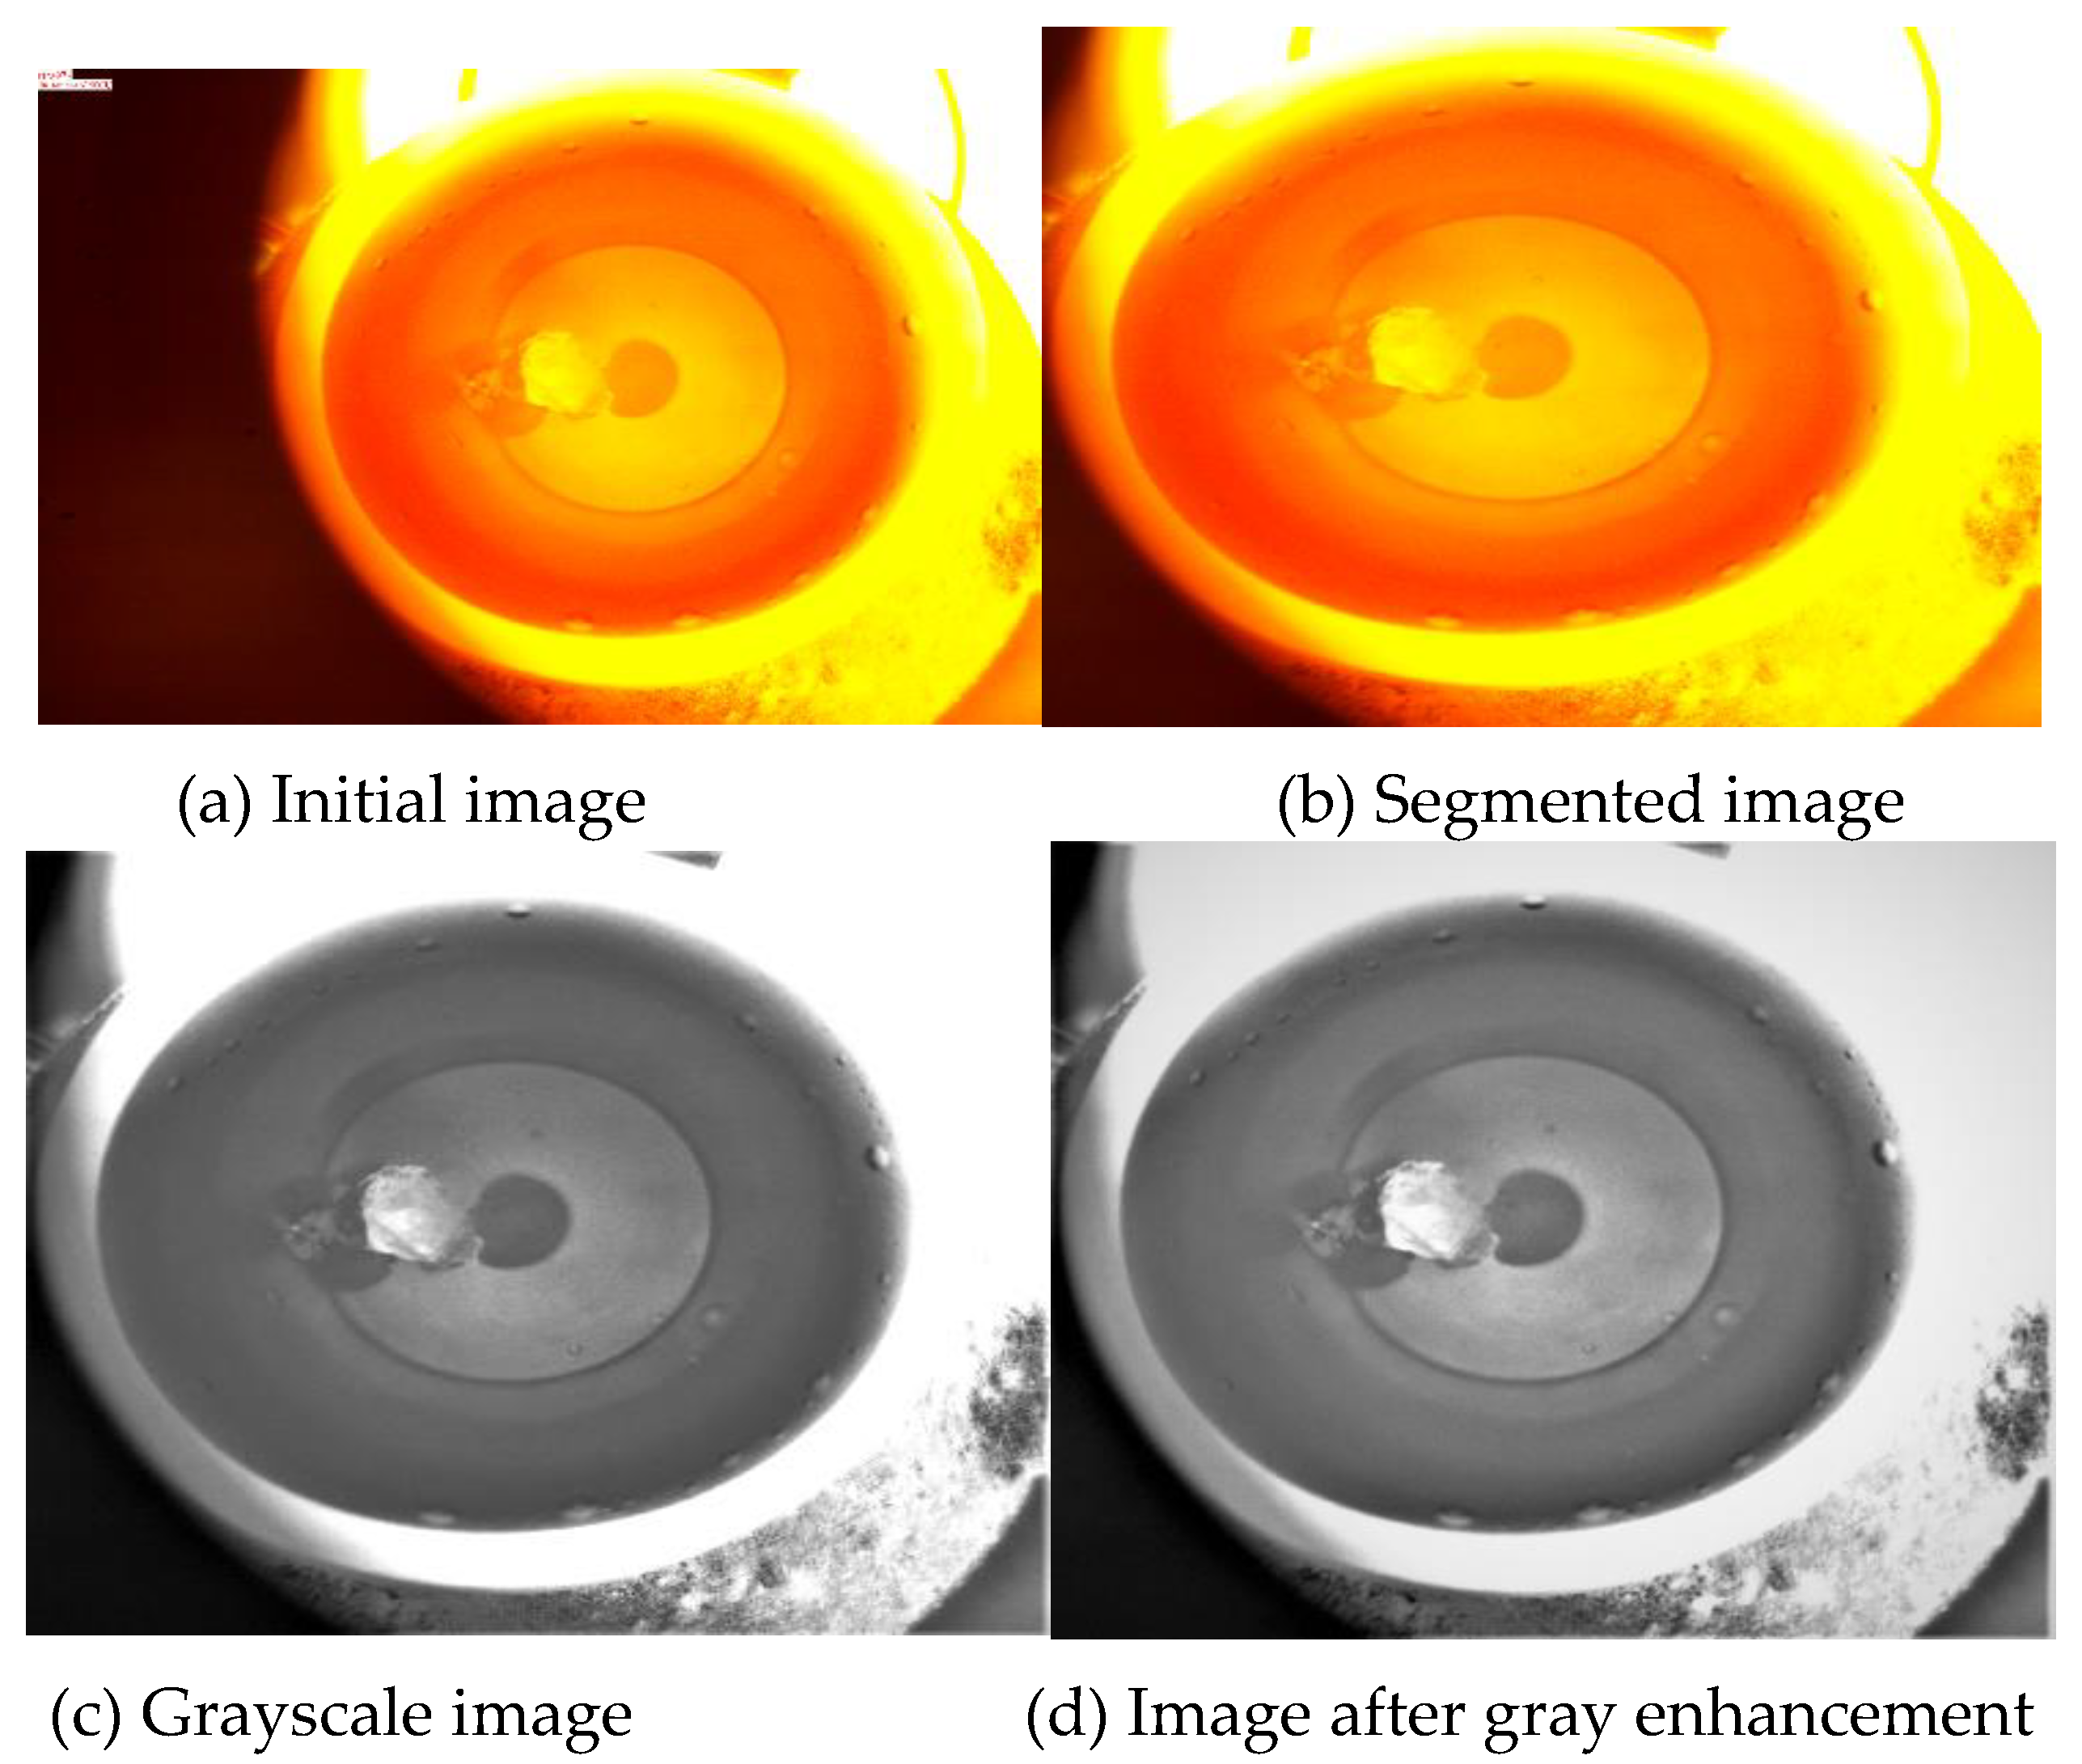
First, the piecewise linear transformation is performed. The matplotlib library of the PYTHON software [
22] was used to obtain the histogram of the image, highlighting the desired gray intervals, and reducing other gray intervals. First, the image is cropped and the unwanted black areas are subtracted. The color image is extracted, then the gray value obtained by the averaging method replaces the value of the three primary colors in the original color image, and the processed image is pasted back into the original position. Taking the 0497 image modification as an example, the modification process is shown in
Figure 4.
The hist function in PYTHON's matplotlib library is used to extract the gray values in the image, and the resulting gray values are plotted in a histogram. The gray values in the SiO2 profile determined above are plotted as a separate histogram. By analyzing the histogram, it can be seen that the difference in gray values is large, and the place with large gray values is the gully, which needs to be highlighted. For other gray values that are not needed, interval compression can increase the gray value difference of the image so that the discrimination of SiO2 in the image is higher.
3.2.2. Indirect solver-based volume solution model
The gray value difference between each pixel is used to define the height of each point, and the volume of SiO
2 is solved by subtracting the groove with large volume. This model can only obtain the volume above and below the cross section. Here it is assumed that the volume above and below the cross section is symmetrical with respect to the cross section. As shown in
Figure 5, at some point the plane is artificially assigned a spatial height
H. If
H is a constant, then the volume of the SiO
2 particles can be expressed as the volume of a cylinder:
Sd is the area of the SiO
2 profile. Note that the cylinder volume is the direct volume of the SiO
2 particles, not the actual volume of the SiO
2 particles, but the direct volume and the actual volume have the same geometric height H, as shown in
Figure 5:
The graph is filtered twice using the edge filtering technique. The purpose of this filtering is to mine the undetected spatial region in the binary image to obtain the gullies on the surface of the SiO
2 stereoscopic image, which indirectly plays the role of mining the three-dimensional coordinates of the image surface. The effective volume of the direct volume, also subtracted from the volume of its surface gully, is expressed as:
where,
H is the average height of the trench;
Sg is the area at the bottom of the trench. The bottom area of the trench is generally considered to be a finite pixel band, so the specific calculation method of the bottom area is consistent with
Sd, which must be related to the crucible cross-sectional area and the number of pixels, expressed as:
In formula (12), the contents in parentheses represent the total number of pixels contained in the bottom region of the trench. For the sake of simplicity, the actual volume of SiO
2 is standardized. Assuming that the actual volume of SiO
2 is an ellipse, its volume is expressed as:
Subtracting the trench volume gives the actual effective volume of SiO
2:
When the CCD camera is facing the
S2 plane, the height
h of the trench can be related to the height
H of the ellipsoid, expressed as:
Substituting equation (15) into equation (14),
Vc can be expressed as:
If
H=2
c and
Sd=π
ab, the actual effective volume of SiO
2 can be further expressed as:
When
R' and
H are connected, we get:
where,
NR' and
NH are image elements of crucible radius
R' and stereoscopic image height
H, respectively. Substituting the formula into
Vc, we obtain:
In the above formula,
R' is a known quantity, and other parameters represent the corresponding image parameters that can be directly counted by the computer. On this basis, the actual volume of SiO
2 corresponding to different times can be calculated. If the density of SiO
2 is
ρ, then the mass μ per second of SiO
2 can be expressed as:
3.3. Modeling of SiO2 melting rate
The dissolution behavior of oxide in slag has a major impact on metal cleanliness, refractory erosion and slag formation in metallurgical processes. For example, to reduce refractory erosion, a slow and indirect melting model can be established to improve refractory life. For typical clean steel production, the oxides must melt quickly into the slag phase, and if the melting is not fast enough, the undissolved inclusions will remain near the slag/steel interface, increasing the risk of entrainment of the molten steel. Therefore, the melting rate model of SiO2 is established to study its melting behavior.
Set the density of SiO
2 as
ρ and the mass of SiO
2 as
μ, given the volume
Vc of SiO
2 when it is melted:
The function of SiO
2 volume change with time
t can be expressed as:
where, λ, γ are the parameters of the function, SiO
2 mass
μ change function with time:
By deriving equation (23), the melting rate function of SiO
2 can be obtained:
6. Conclusions
Aiming at the melting behavior of iron tailings in high-temperature molten pool, this paper uses a non-contact CCD video recording system to obtain dynamic visual data (video stream) of solvent dissolution in high-temperature molten pool. With the help of computer vision recognition technology and data modeling theory, the indirect solution method is applied to analyze the melting process of iron tailings in molten slag. The rate is determined to provide theoretical and technical support for the direct fiber forming process of BF slag. Through the research of this paper, the following aspects are completed: (1) The image processing technology is used to solve the centroid and area of SiO2; (2) An indirect solution method is proposed, and the volume of SiO2 is well obtained, and the melting rate of SiO2 is obtained by exponential fitting. (3) The current relevant methods are fully compared, and the results show that the indirect solution method or SFS method with exponential fitting has a relatively good effect.
This study still has some shortcomings: (1) In the discussion section, the possible sources of error of different methods are explained. Although the results of different methods are compared, due to the nature of the problem, each method has its advantages and disadvantages. Under different backgrounds, it is difficult to evaluate which method is the best, and the overall error is controllable, but the error still exists. In the future, research on the accuracy of different evaluation methods can be considered to better evaluate the accuracy of different methods. (2) There is still room for improvement and perfection of the correlation fitting method. Polynomial fitting is not very suitable for solving the melting rate, but whether exponential fitting is perfect can also be further discussed. (3) The study proposed in this paper used only images of one cycle and did not compare images of multiple sets of parallel experiments. Although one set of experimental images may support the conclusions of this paper, the study of multiple sets of parallel control groups is also a direction worth exploring in the future.
Author Contributions
Conceptualization, C.L., J.C.; methodology, C.L., J.C.; software, Y.Z., J.Z and. W.S.; validation, C.L., Y.Z, W.S. and Q.Z.; formal analysis, C.L., Y.Z, J.Z., W.S. and J.C.; investigation, C.L., Y.Z, J.Z., W.S. and J.C.; resources, J.C.; data curation, C.L. and J.C.; writing—original draft preparation, M.Z., C.L. and J.C.; writing—review and editing, C.L., M.Z. and J.C.; visualization, C.L. and J.C.; supervision, J.C.; project administration, A.X., J.C.; funding acquisition, C.L., A.X., J.C. All authors have read and agreed to the published version of the manuscript.
