1. Introduction
Brass when subjected to a corrosive media, undergo a special type of corrosion and associated with de alloying of zinc. This process is known as dezincification (Gupta et al. 1983a; Robert et al. 2013) and it results into preferential dissolution of zinc leaving spongy mass of copper. This type of corrosion has been a subject of extensive study and many methods have been tried to minimizing corrosion. The use of inhibitors is one of which them. The effectiveness of inhibitor varies with its concentration, corrosive media and surface properties of the alloy.
Various organic compounds containing N and S atoms in the molecule have been found to be efficient inhibitors for protection of copper and its alloys (Zhang et al. 2023a; Siti 2021). In the present investigation, inhibitive action of towards the corrosion of 70/30 brass in hydrochloric acid has been reported. It is highly corrosive towards the corrosion of brasses and the rate of corrosion is considerably influenced by the dissolved oxygen and other gases ( Papadopoulou and Vassiliou 2021) in the solution.
The corrosion and inhibition process were examined at room temperature (25oC) using gravimetric method (PIT) and some electrochemical methods like galvanostatic and potentiodynamic polarization measurements. It is a known fact that the rate of corrosion is very fast initially, which goes on decreasing with due course of time. The above mentioned methods prevalent in the field of corrosion rate determination furnish only an average value for a long time period (Kálmán et al. 1993 and Telegdi et al. 1993). However, looking at the sensitivity and minimum detection limits and (Jyotsna Shukla and Pitre 1996) of polarography and voltammetry we have developed differential pulse polarographic (DPP) and differential pulse anodic stripping voltammetric (DASV) methods for the determination of corrosion rates at short time intervals, the results of which have also been discussed in the paper.
2. Experimental
All the chemicals used were of AR/BDH grade. The experiments were carried out in 1N HCl solution. For this study annealed 70/30 brass specimen (surface area 21.37 (Cm2) Cu-69.3%, Zn-30%, Fe-trace, were used. These Specimens were polished following the routine procedure (Gupta and Mishra 2013).
Babul's bark is collected from rural areas of Bhopal. Immediately after cleaning, place the plant in the shade to dry. The main purpose of drying is to remove water from the bark so that the plant material can be preserved. Grind the dry leaves into a fine powder using an electric machine and a sieve and pack them in polythene bags for later use.
2.2. The Chemical Make-Up of ESBB
Barks were extracted by maceration method. The air-dried powdered of bark of babul were subjected to extraction with methanol: water in ratio of 80:20 v/v. The resultant content was filtered with whatman filter paper no.1 and kept for evaporation of solvent to get the dry concentrated extract (Khandelwal 2002).
2.3. Phytochemical Screening
Were carried out as per the following standard methods (Sivanandan and Pimple 2018).
i. Detection of alkaloids: Extracts dissolved individually in dilute HCl acid and filtered. Hager’s Test: Filtrates were treated with Hager’s reagent (saturated picric acid solution). Alkaloids confirmed by the formation of yellow coloured precipitate.
ii. Detection of carbohydrates: Extracts were dissolved individually in 5 ml distilled water and filtered. The filtrates were used to test for the presence of carbohydrates.
One milliliter (1ml) of aqueous solution of the extract and 1ml of Barfoed’s reagent were added into a test-tube, heated in a water bath for about 2 min. Red precipitate showed the presence of monosaccharide.
a) Fehling’s Test: Filtrates were hydrolyzed with dil. HCl, neutralized with alkali and heated with Fehling’s A & B solutions. Formation of red precipitate indicates the presence of reducing sugars.
iii. Detection of glycosides: Extracts were hydrolysed with dil. HCl, and then subjected to test for glycosides. Legal’s Test: Extracts were treated with sodium nitropruside in pyridine and sodium hydroxide. Finding of pink to blood red colour indicates the presence of cardiac glycosides.
iv. Detection of saponins by Froth Test: Extracts were diluted with distilled water to 20ml and this was shaken in a graduated cylinder for 15 minutes. Formation of 1 cm layer of foam indicates the incidence of saponins.
v. Detection of phenols using Ferric Chloride Test: Extracts were treated with 3-4 drops of ferric chloride solution. Formation of bluish black colour indicates the presence of phenols.
vi. Detection of flavonoids by Lead acetate Test: Extracts were treated with few drops of lead acetate solution. Formation of yellow colour precipitate indicate the occurrence of flavonoids.
vii. Detection of proteins Xanthoproteic Test: The extracts were treated with few drops of conc. Nitric acid. Formation of yellow colour indicates the presence of proteins.
viii. Detection of diterpenesby Copper acetate Test: Extracts were dissolved in water and treated with 3-4 drops of copper acetate solution. Formation of emerald green colour indicates the presence of diterpenes.
2.4. Separation and Identification of Phytoconstituents by TLC
One dimensional ascending method using silica gel 60F254, 7X6 cm (Merck) was cut with ordinary household scissors. Plate markings were made with soft pencil. Glass capillaries were used to spot the sample for TLC applied sample volume 1-micro liter by using capillary at distance of 1 cm at 5 tracks. In the twin trough chamber with different solvent system toluene: ethyl acetate: formic acid (5:4:1) solvent system used (Singh et al. 2010). After pre-saturation with mobile phase for 20 min for development were used. The movement of the active compound was expressed by its retention factor (Rf), values were calculated for different samples. The developed thin layer chromatographic plates were visualized in normal light, short UV light (254nm), and long UV light (365nm) using TLC cabinet (Electronic India). Rf value were calculated
2.5. Gravimetric Method
Three polished, weighted testing coupons of brass were used in the measurement. The variation of metal corrodibility, solution corrosives and corrosion rate as a function of time were investigated using the PIT technique (Gillard 1989). After the testing, the coupons were cleaned with water and acetone, weighed and from weight loss measurements, the corrosion rates were calculated. Similar experiment was performed in the presence of ESBB inhibitor.
2.6. Galvanostatic Polarization Measurements
Galvanostatic polarization curves were drawn on the 10cm2 cylindrical surface of the working electrode. A Saturated calomel electrode was used as a reference electrode. An AJCO-Electronics (model VT 85016) coupled with multiflex galvanometer was used for galvanostatic studies. The polarization currents were measured by using a cycle of 10S and changing potential by 50 mV. Alternating anodic and cathodic cycles were measured and corrosion current density was plotted against the applied potential.
2.7. Potentiodynamic Polarization Measurements
The brass coupons molded with epoxy resin to coat the all sides of the rod, while the circular cross section area of the cylinder is exposed to the solution. The coupons were polished and rinsed with distilled water earlier the experiment. The scan potential path was 50 mV/5min. The measured currents were plotted against the potentials.
2.8. Voltammetric and Polarographic Methods
An Elico Pulse Polarograph model CL362 assembled with HP DeskJet Printer 640 C was used for polarography and voltammetry. A cell has comprised with three electrodes viz. SCE as reference, a coiled platinum wire as an auxiliary and a DME as working electrode. The pulse amplitude used for voltammetric measurements was 25 mV. The testing coupons were polished as previously described and one of them was suspended in a 1N HCl solution at 26±1º C (room iemprature). Nitrogen gas was bubbled in the solution throughout the experiment to prevent the oxidation of dissolved metals. In a short time i.e. 5, 10, 20 minutes, a definite aliquot of solution was withdrawn from the test solution then polarograms and voltammograms were recorded in dearated 0.1 M KCl and 0.001% gelatin at pH 5.0±0.1(adjusted using HCl/ NaOH solution). The same process nt was repeated in the presence of 0.25g/1 ESBB in 1 N HCl solution.
3. Results and Discussion
3.1. Identifiaction and Confirmation of Essb
3.1.1. Phytochemical Screening
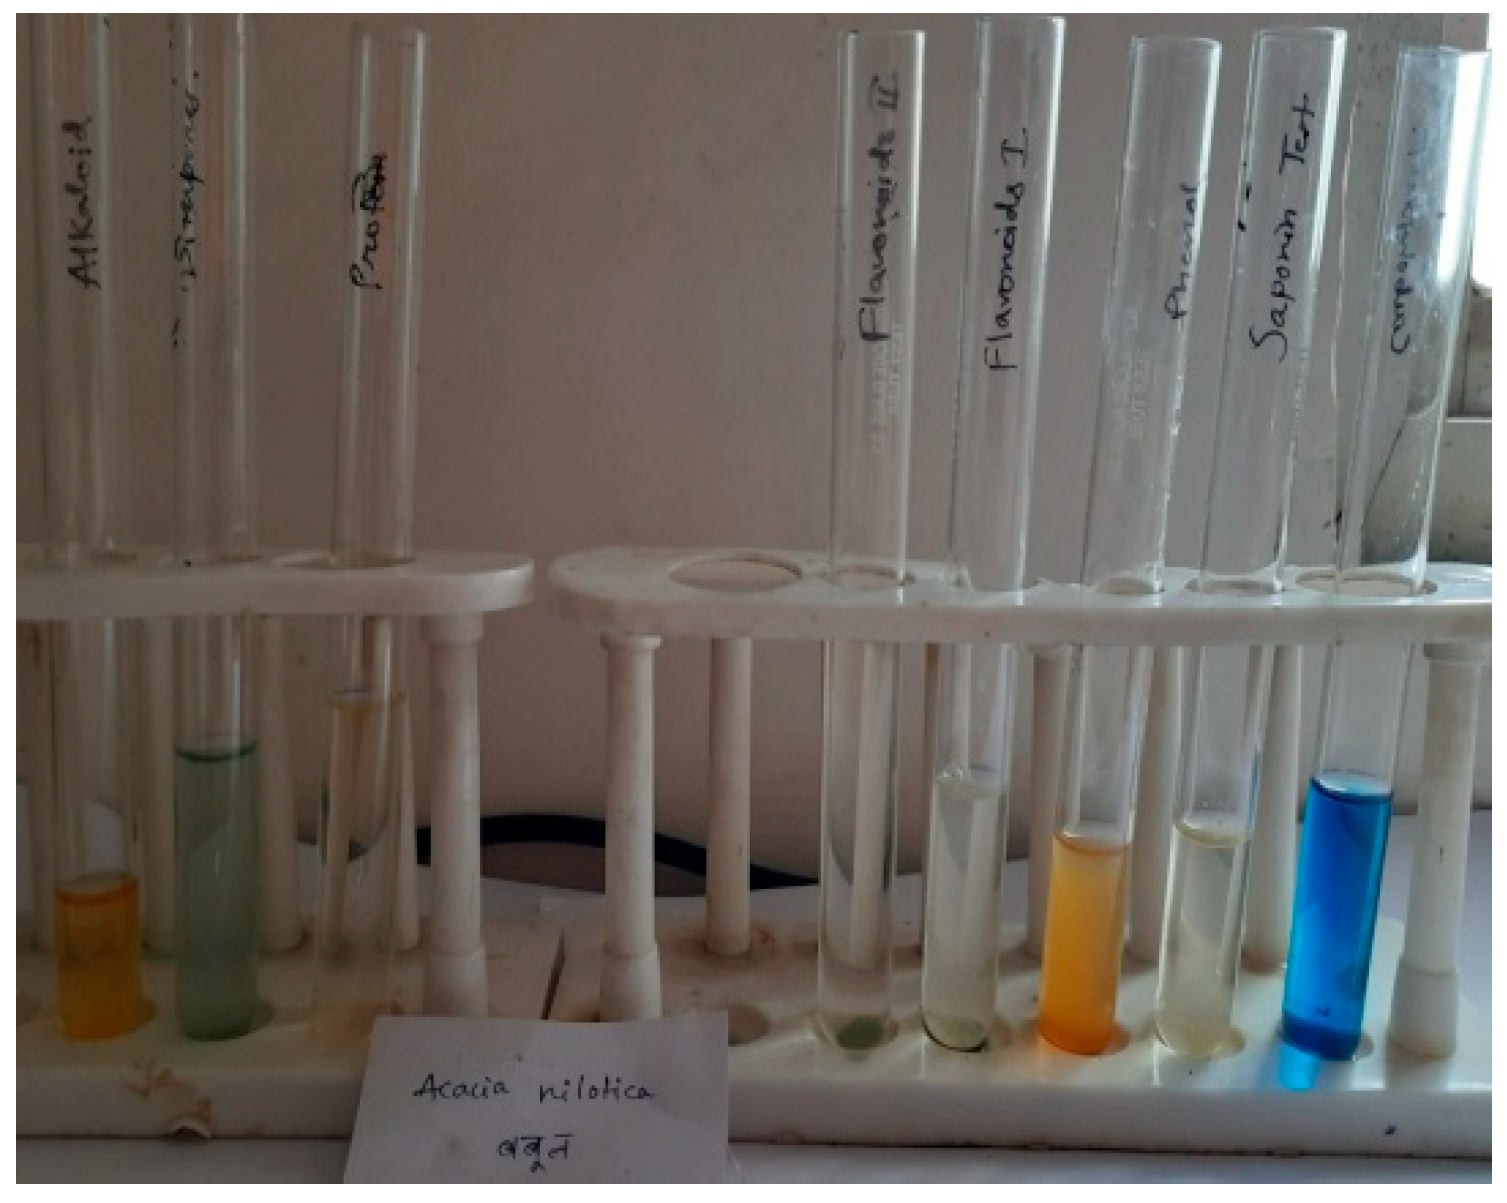
The results (
Figure 1) of phytochemical analysis in the presence and absence of ESSB inhibitor in 1N HCl solution are shown in
Table 1 and
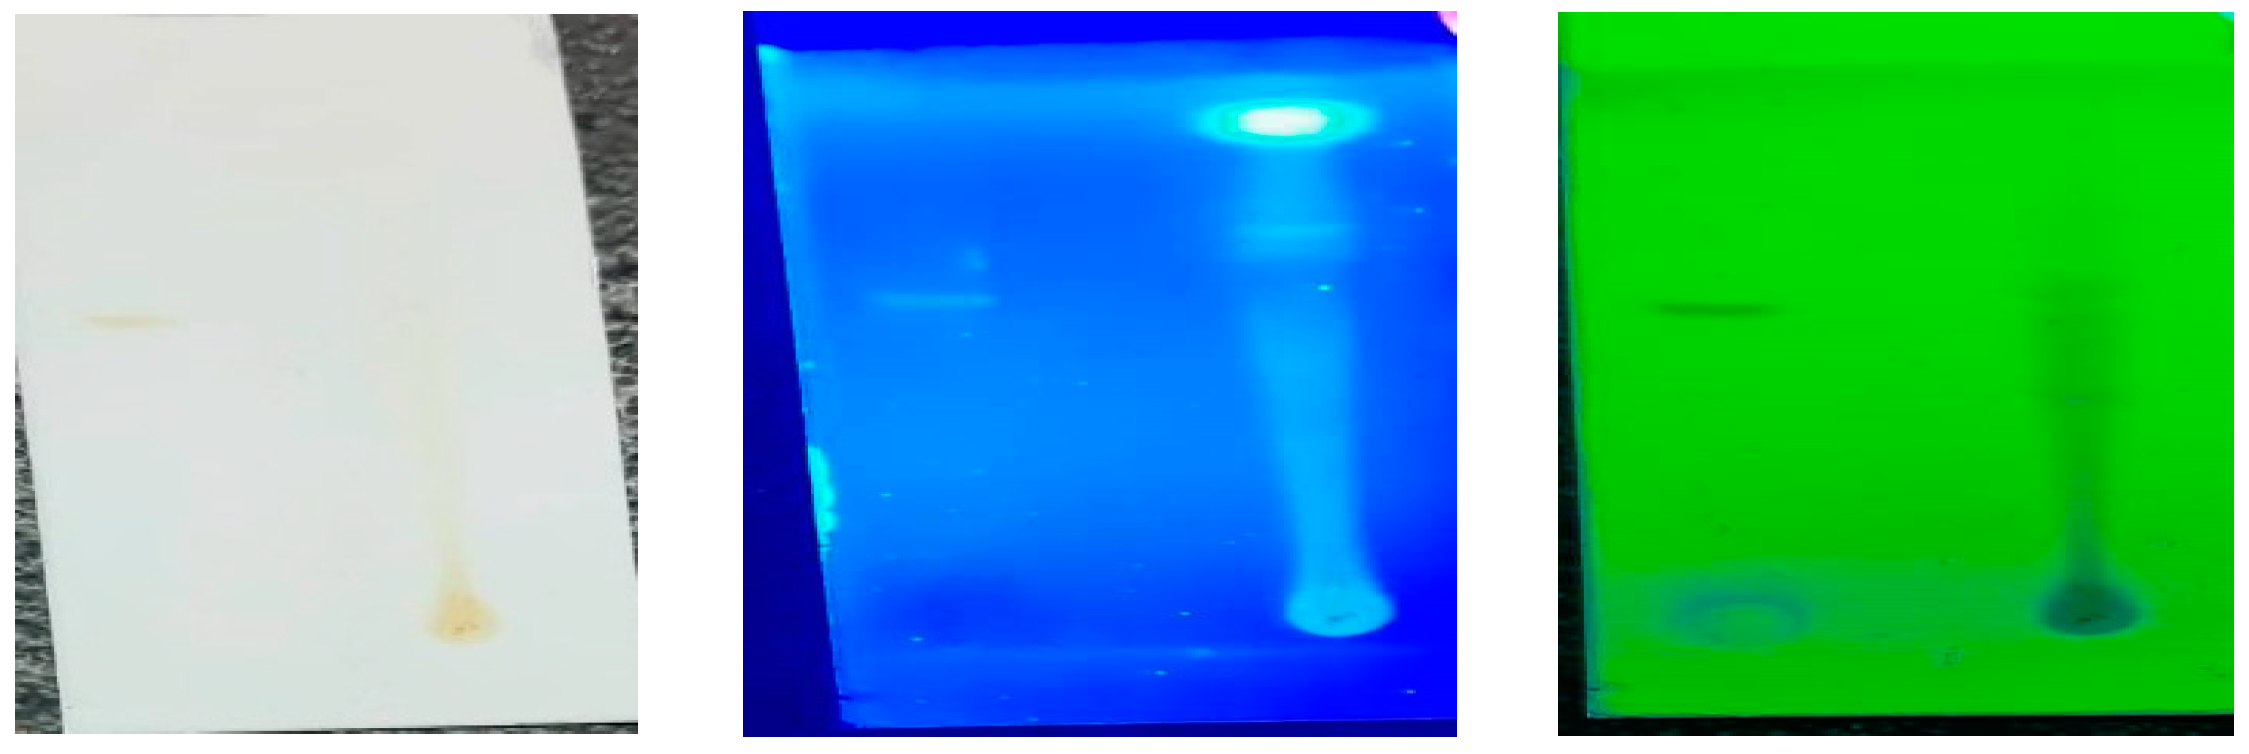
Table 2. The results clearly show that powdered plant sample was successively extracted with different solvents in increasing polarity order such as chloroform, ethyl alcohol methanol and water. Finally extract was dried at 40°C under pressure and stored at 4°C until use. The R
f value of the different compounds present in the extract was found to be 0.53, 0.89, 0.88, 0.49, 0.74 respectively. Among them peaks were found to contain Glycosidal, alkaloids, flavonoids, tannins compounds. This will increase the adhesive property of the coating matrix.
3.1.2. IR Spectrometric Analysis
On the basis of obtained results, it is also evident that the C-O stretch, at1233.7cm-1, was shifted to 1062.3cm-1, the –C=C- stretch, at 1617.7 cm-1, was shifted to 1517.7 cm-1; the C-H (Alkenes stretching), at 2918.5 cm-1, was shifted to 2851.4 cm-1, the aromatic C=O, at 1722.0 cm-1, was shifted to 1722.8 cm-1; the N=O (R- NO2), at 1518.3cm-1, was shifted to 1384.2cm-1, and the phenolic -OH stretching, at 3283.8 cm-1, was shifted to 3362.1cm-1. These shifts in frequencies also indicate that there is an interaction between the inhibitor and the metal surface (Fenot et al.1989). It is also evident from the obtained data that the C-O stretch, at 1159.2 cm-1, as well as N=O (R-NO2), at 1364.2 cm-1, were missing, suggesting that these bond frequencies might have been used for bonding between the Fe vacant d-orbital and the inhibitor (Nakamoto 1949). Therefore, bark of babul extract was adsorbed onto the mild steel surface through these functional groups.
3.1.3. Polarographic Study of Extracted Sample of Babul Bark
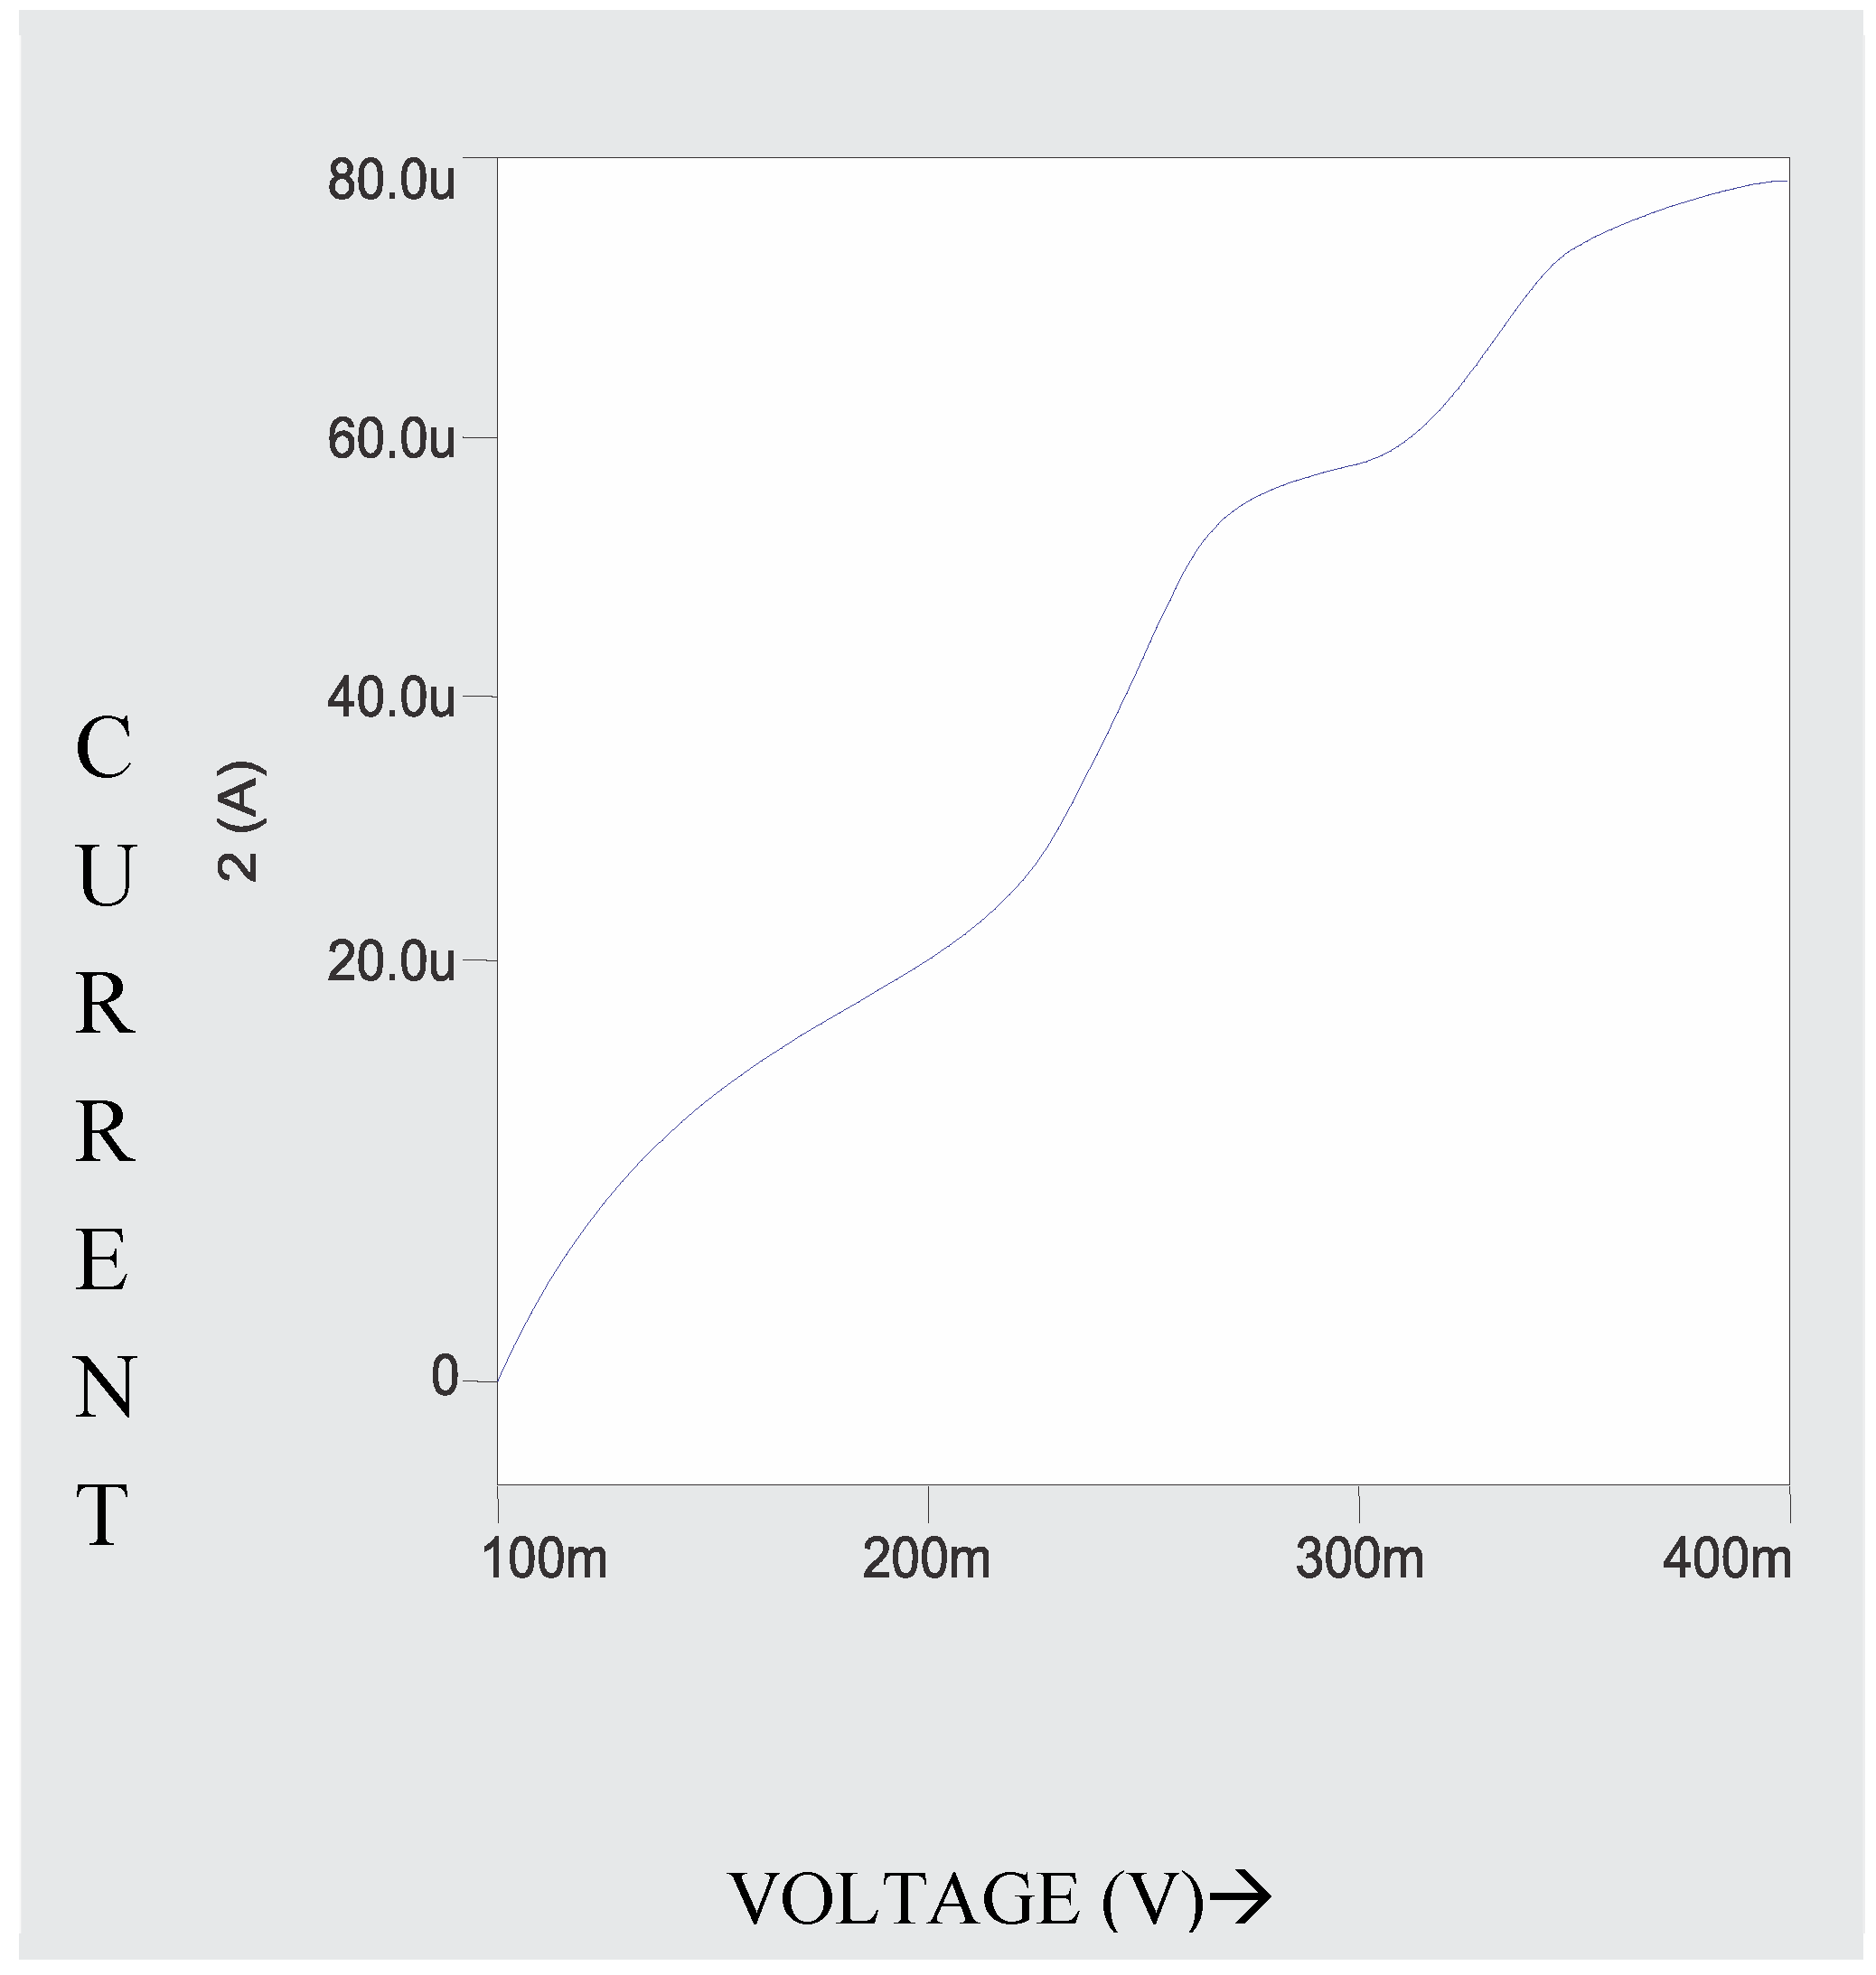
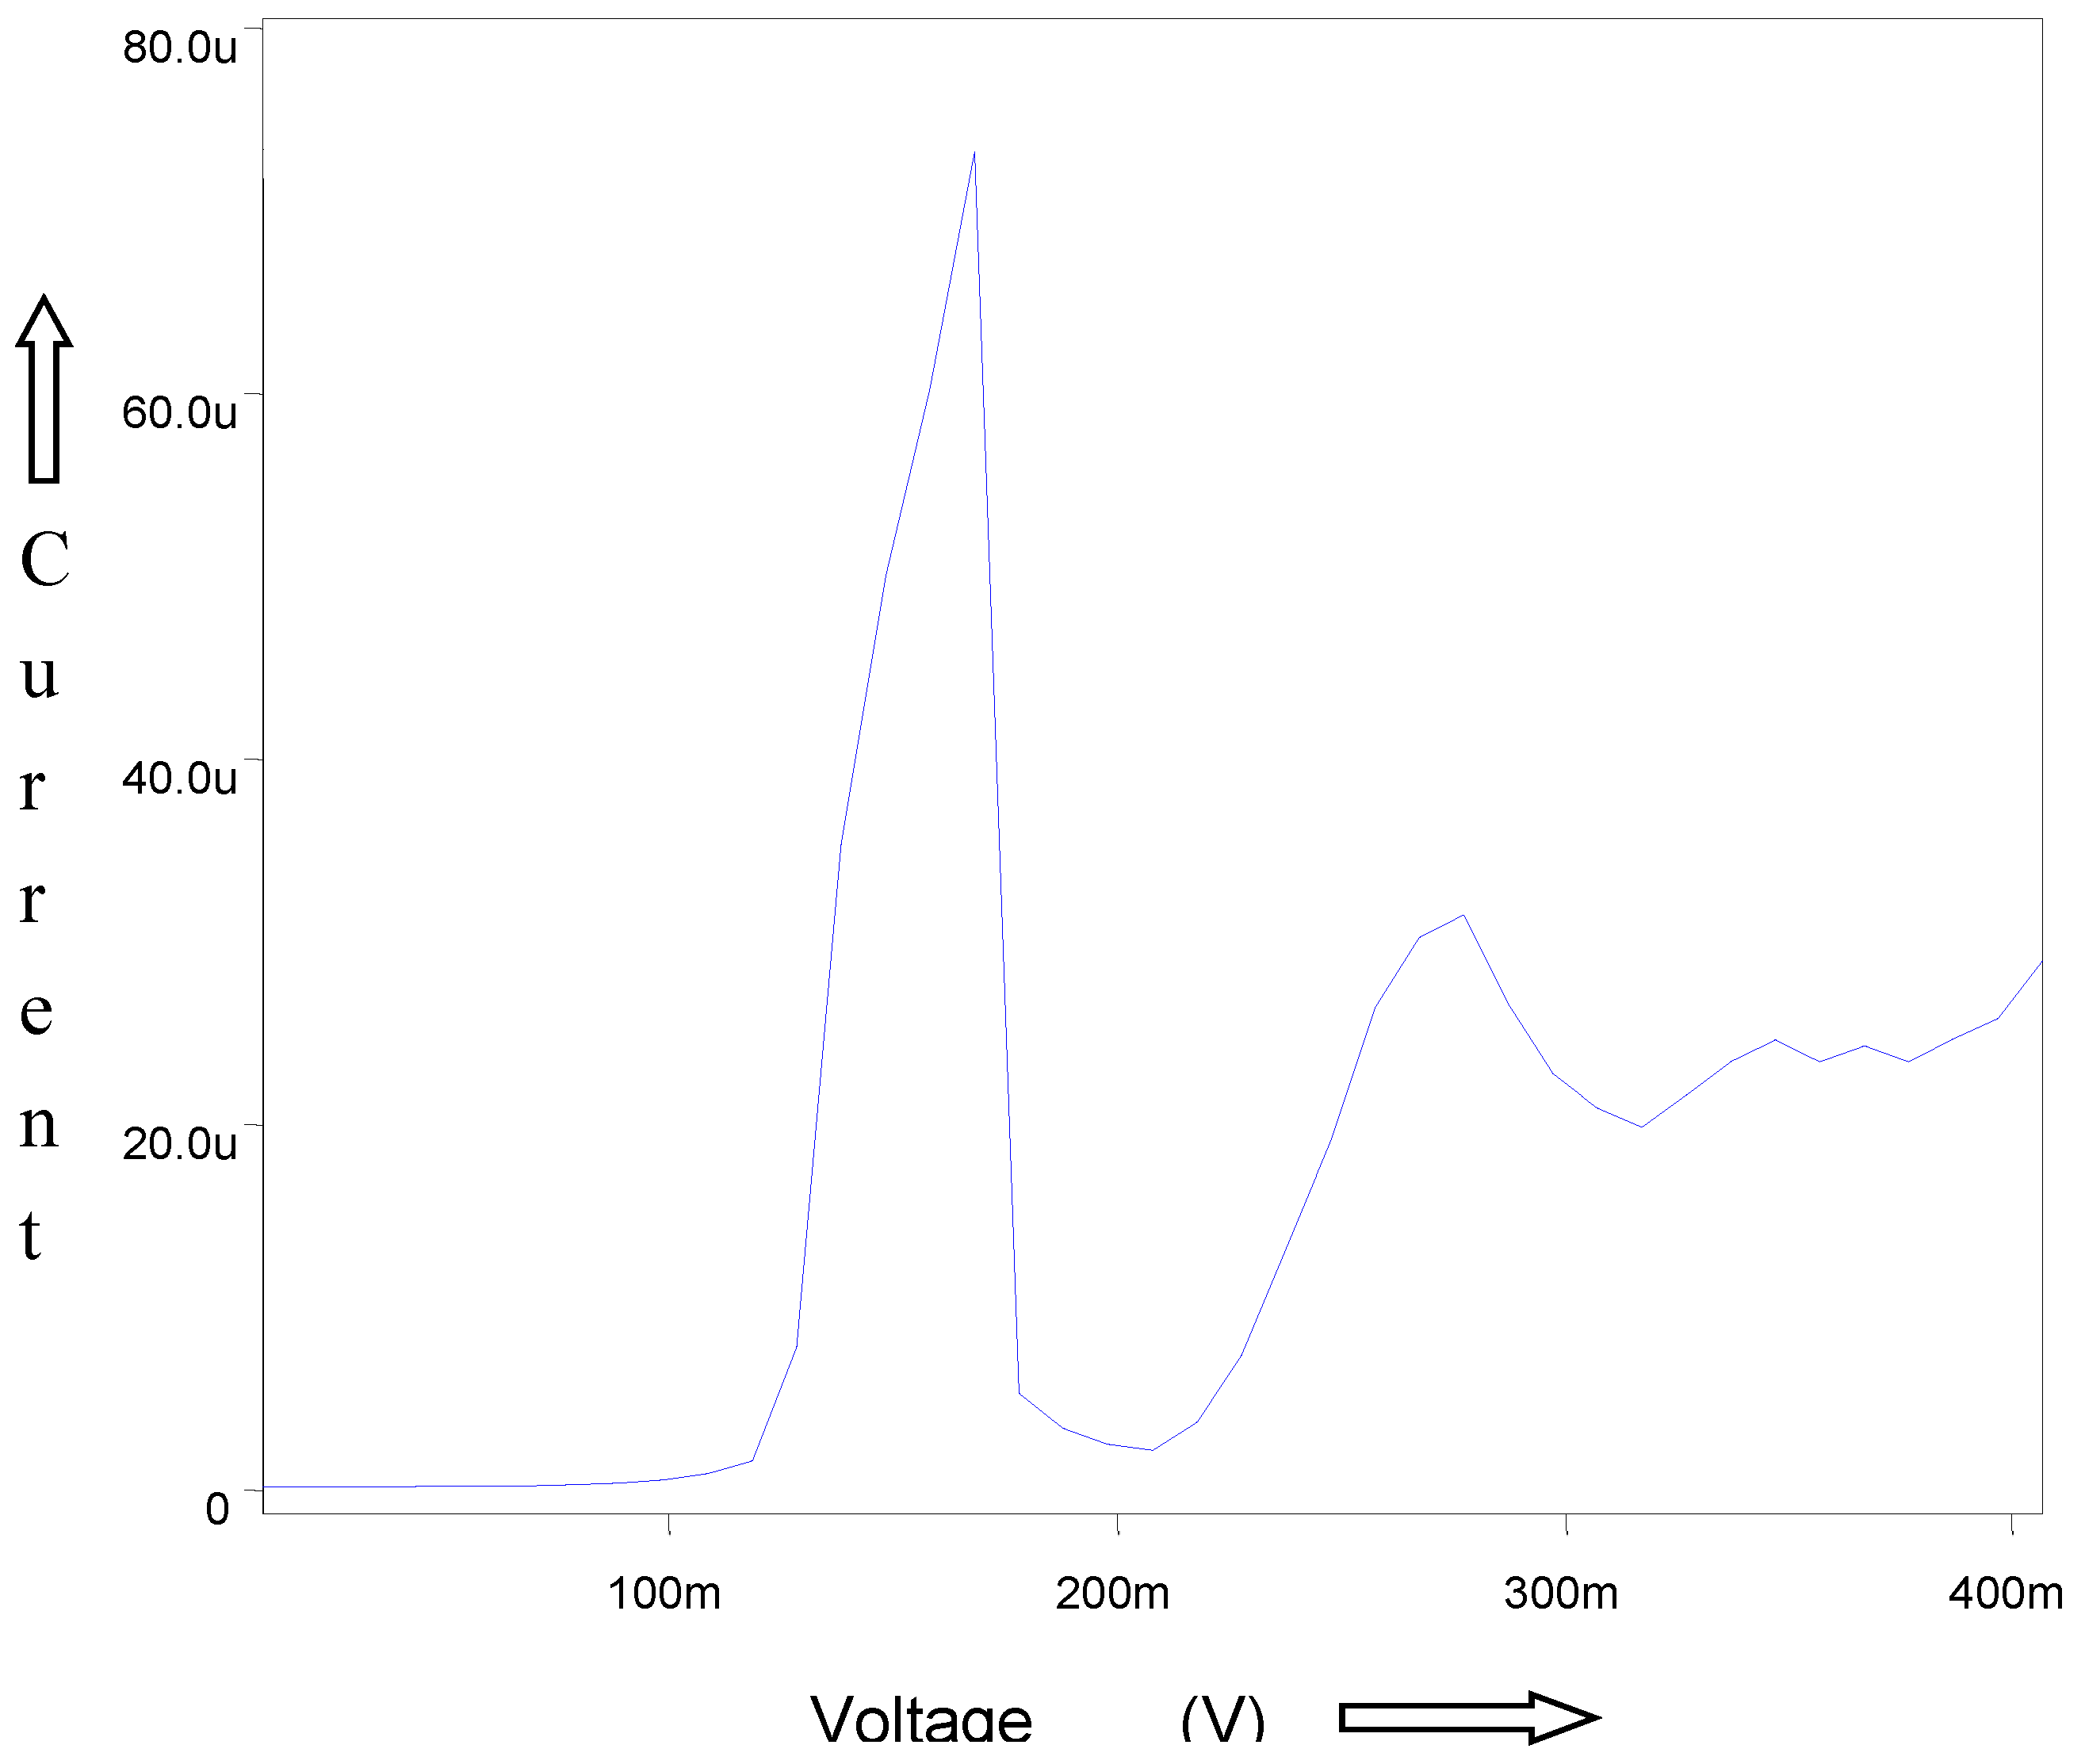
A known concentration (10ml) of extracted sample was taken in a 0.1M ammonium tartarte and 0.001% gelatin used as supporting electrolyte for the polarographic analysis of Babul bark. The рН 9.5±0.1 (adjusted by using buffer solutions ammonia-ammonium chloride). This solution is taken in a polarographic cell and nitrogen gas was bubbled for 5 minutes for deaeration. DC and DP Polarograms (
Figure 3 and
Figure 4) of ESBB shows well defined wave and peak with E ½ -0.72V and Ep -0 7.2V vs. SCE. For confirmation of the analysis external spiking method is used. The resulting DCP and DPP curves of spiked analyte showed a peak with no change in E ½ and Ep values but peak height increases (Moubaraki et al. 2022). Thus confirming the presence of babul in extracted sample of tree and also enabling the use of developed procedure for an accurate qualitative and quantitative analysis of different origin sample especially for plant extracted samples. Thus the developed polarographic could be successfully used for accurate analysis of such type of sample. The standard deviation never exceeded 0.03 confirming the reliability of the analysis.
3.2. Determination of Corrosion and Inhibition Rate
3.2.1. Gravimetric Method
The results of corrosion and inhibition rates are shown in presence and absence of ESSB inhibitor in
Table 3. Results obtained during the periods A
1 and B show that solution corrosiveness increases in the base solution and decreases in the presence of ESBB. (B<A
1). The higher corrosivity of the solution can be attributed to the increased concentration of Cu (II) ions in the solution; it is also confirms that ESSB molecules reduce the stimulating effect of Cu (II) and Zn (II). From the data obtained for B and A periods, it can be concluded that metal corrodibility decreases with time in the presence of ESBB. This indicates that the formation of an inhibitory film takes some time that is an inhibition process has an induction period. The improved inhibition efficiency of ESBB may be due to the formation of complexes with metal ions and also these complex film covered the metal surface (Wenchao 2023).
ESBB gives 65, 85 and 96% inhibition efficiency after 24 h for the dissolution of brass at concentration 0.15, 0.18 and 0.25 g/l 1N HCl solution respectively. Above this concentration, inhibition efficiency does not increase. As such 0.25g/l concentration of ESBB of test solution has been selected to be the best inhibition efficiency.
3.2.2. Galvanostartic Polarization Measurements
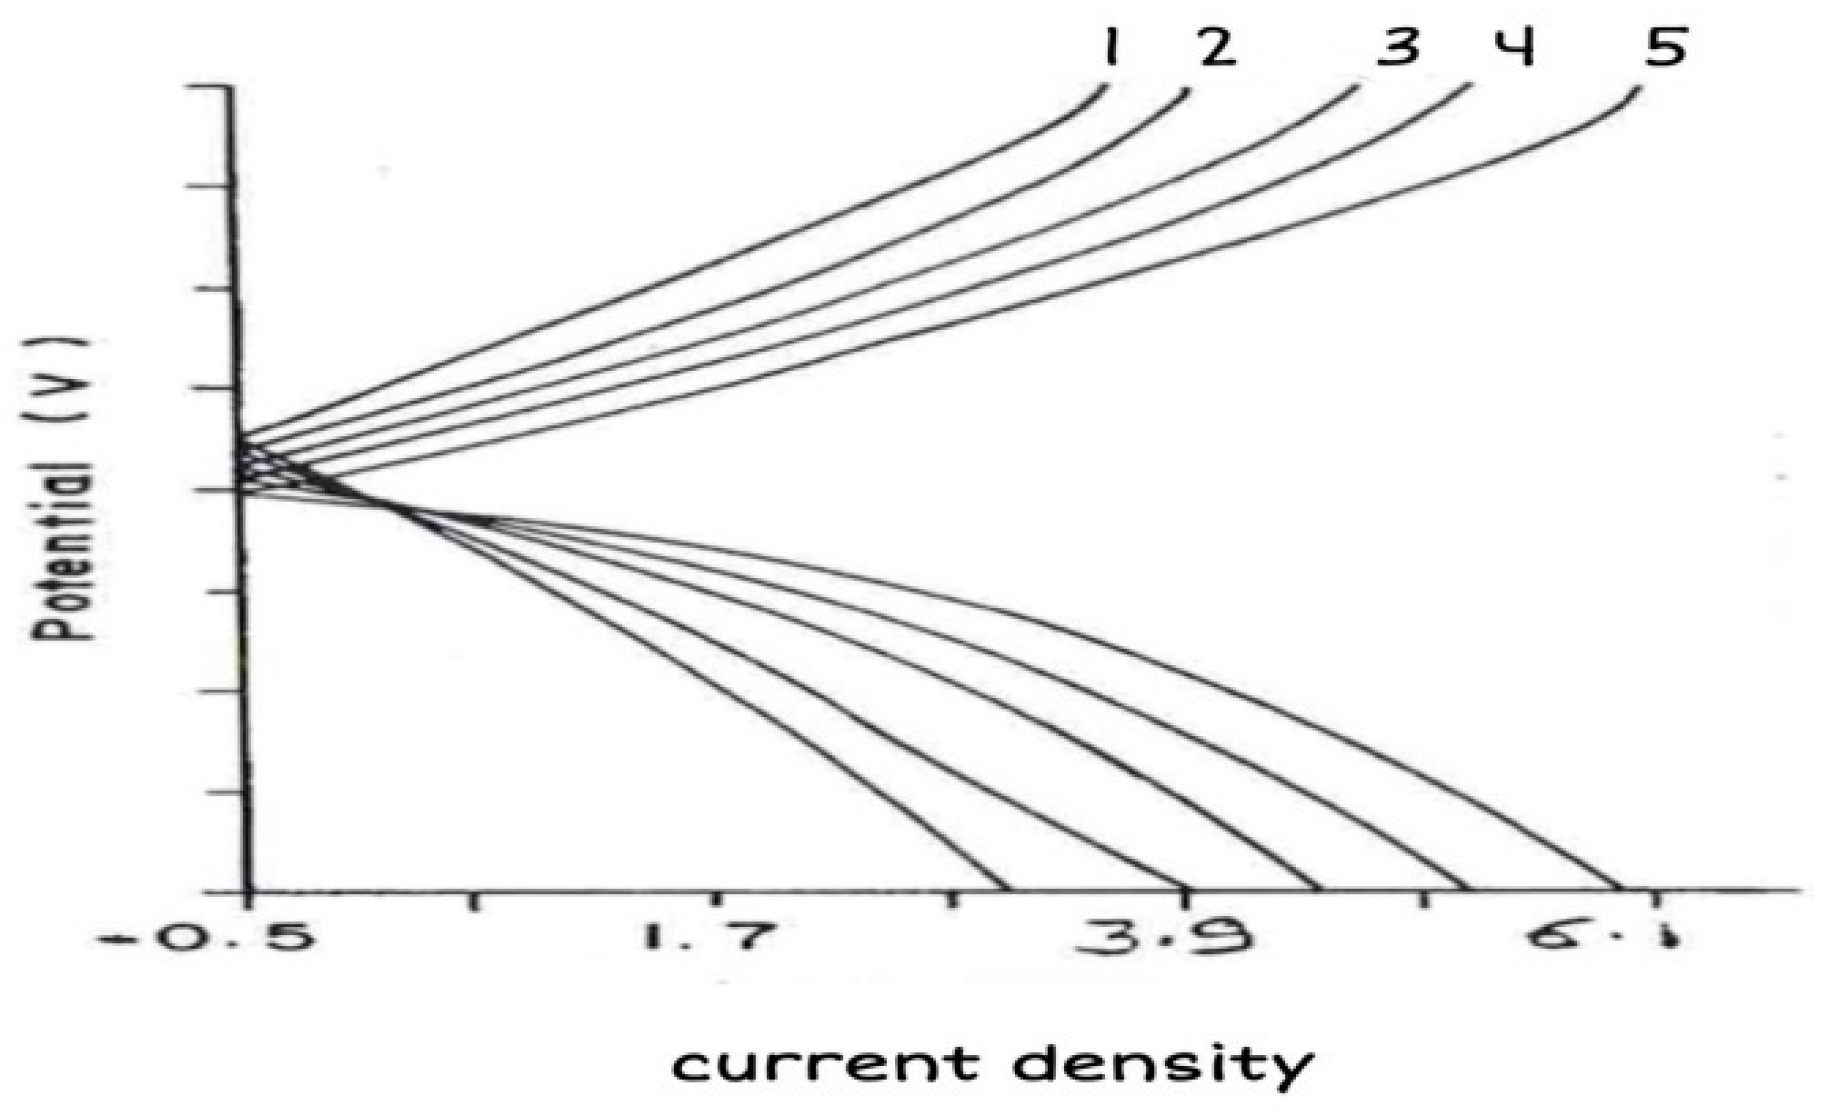
The anodic and cathodic curves (
Figure 5) of brass in 1N HCl solution without and with inhibitors showed no passivation in the absence of inhibitors, whereas good passivation was observed in the presence of ESBB. Both anodic and cathodic currents are redused in the presence of ESBB inhibitor. These results confirms that ESBB is mixed type of inhibitor as described earlier by Lateef
et al. (2016).
3.2.3. Potentiodynamic Polarization Measurements
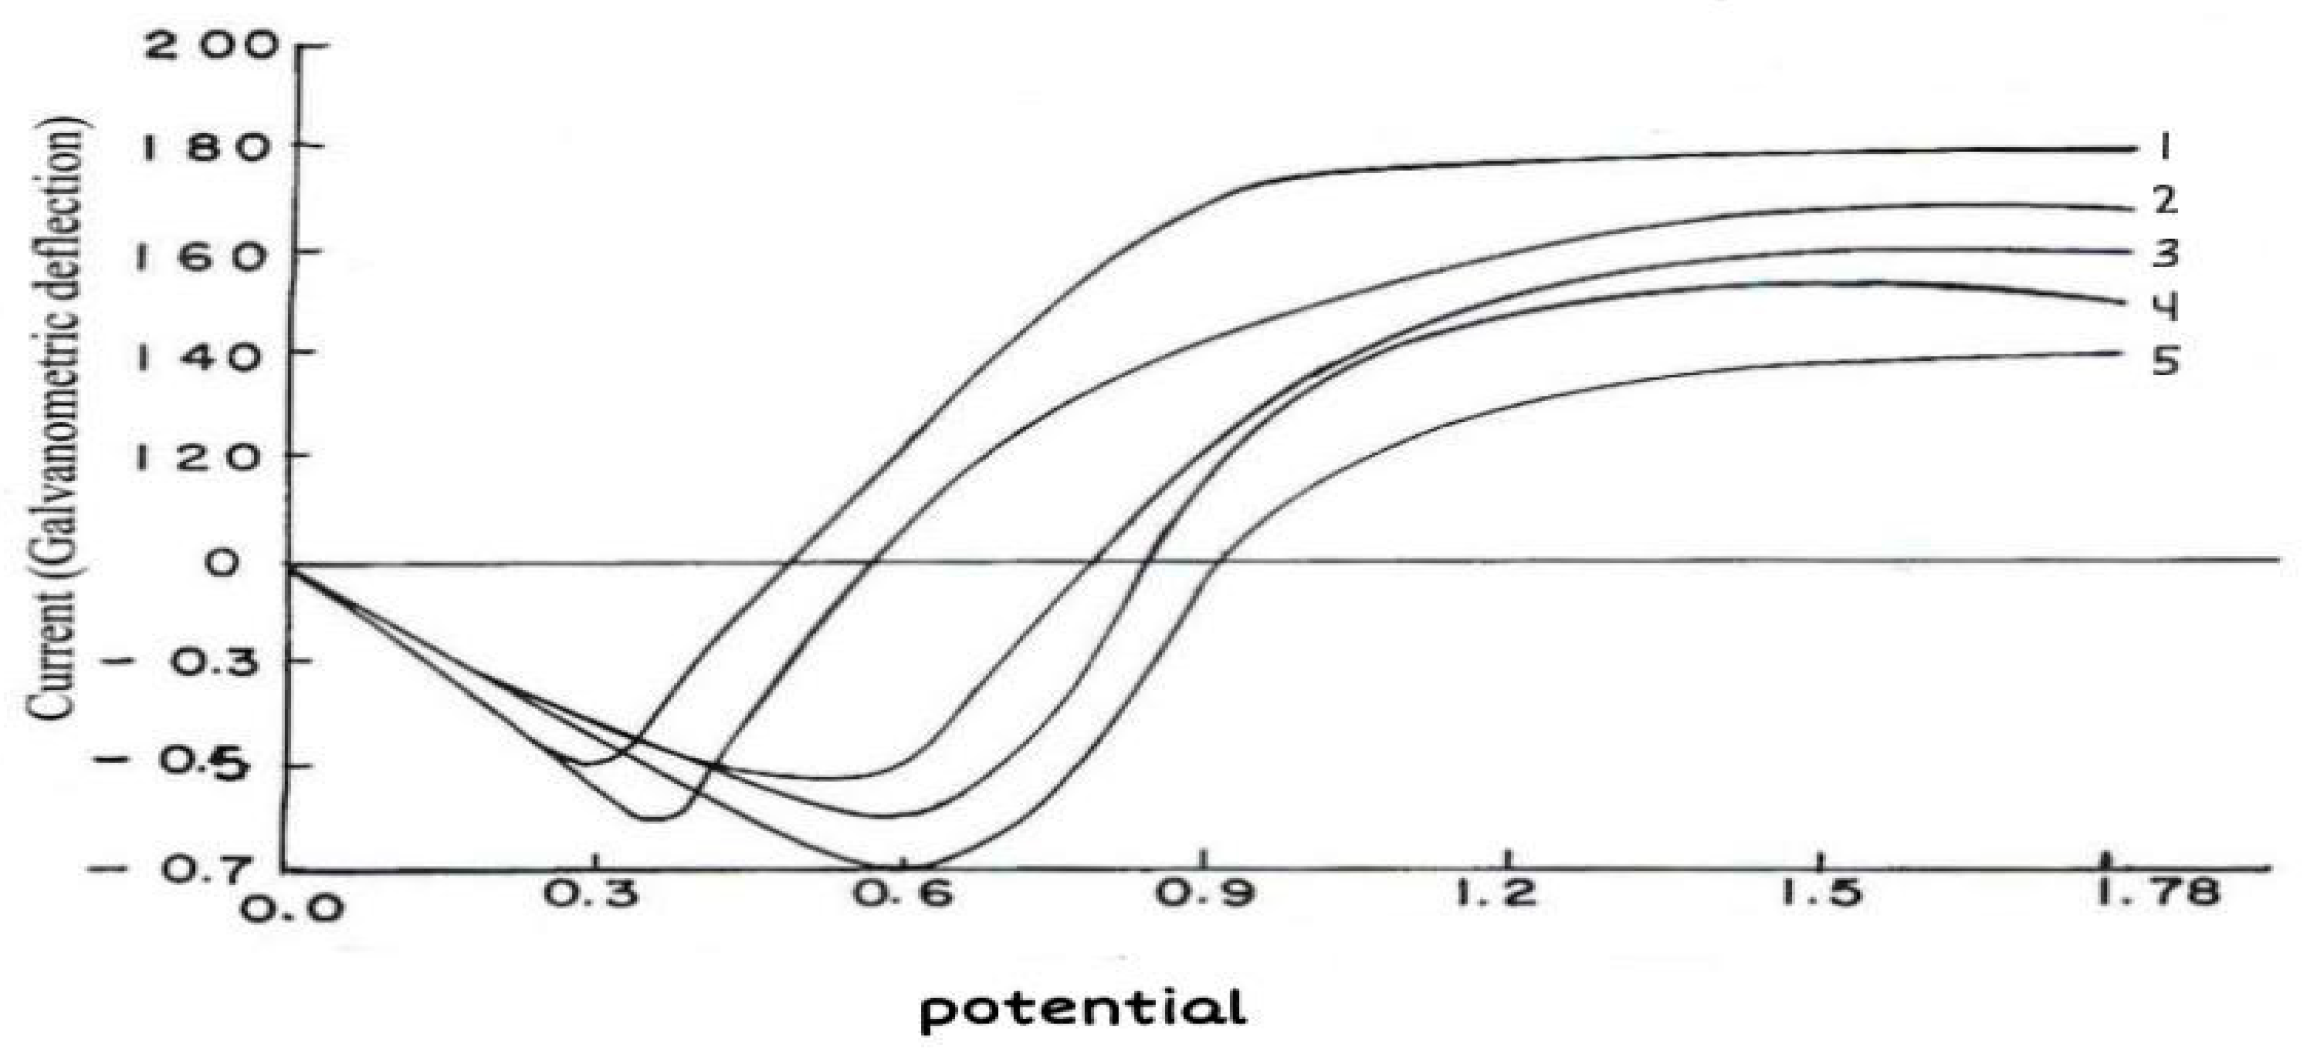
In the absence and presence of inhibitor, potentiodynamic polarization measurements (
Figure 6) show that the inhibitor enhances the polarization resistance to achieve the same current density I, a higher polarization (E
1 to E
2) is needed in the inhibited system. It can be concluded that the inhibitor affects the anodic and cathodic part of the corrosion reaction means this inhibitor acts as mixed inhibitor in acidic medium i.e. 1 N HCl for corrosion of brass.
3.2.4. Voltammetric and Polarographic Measurements
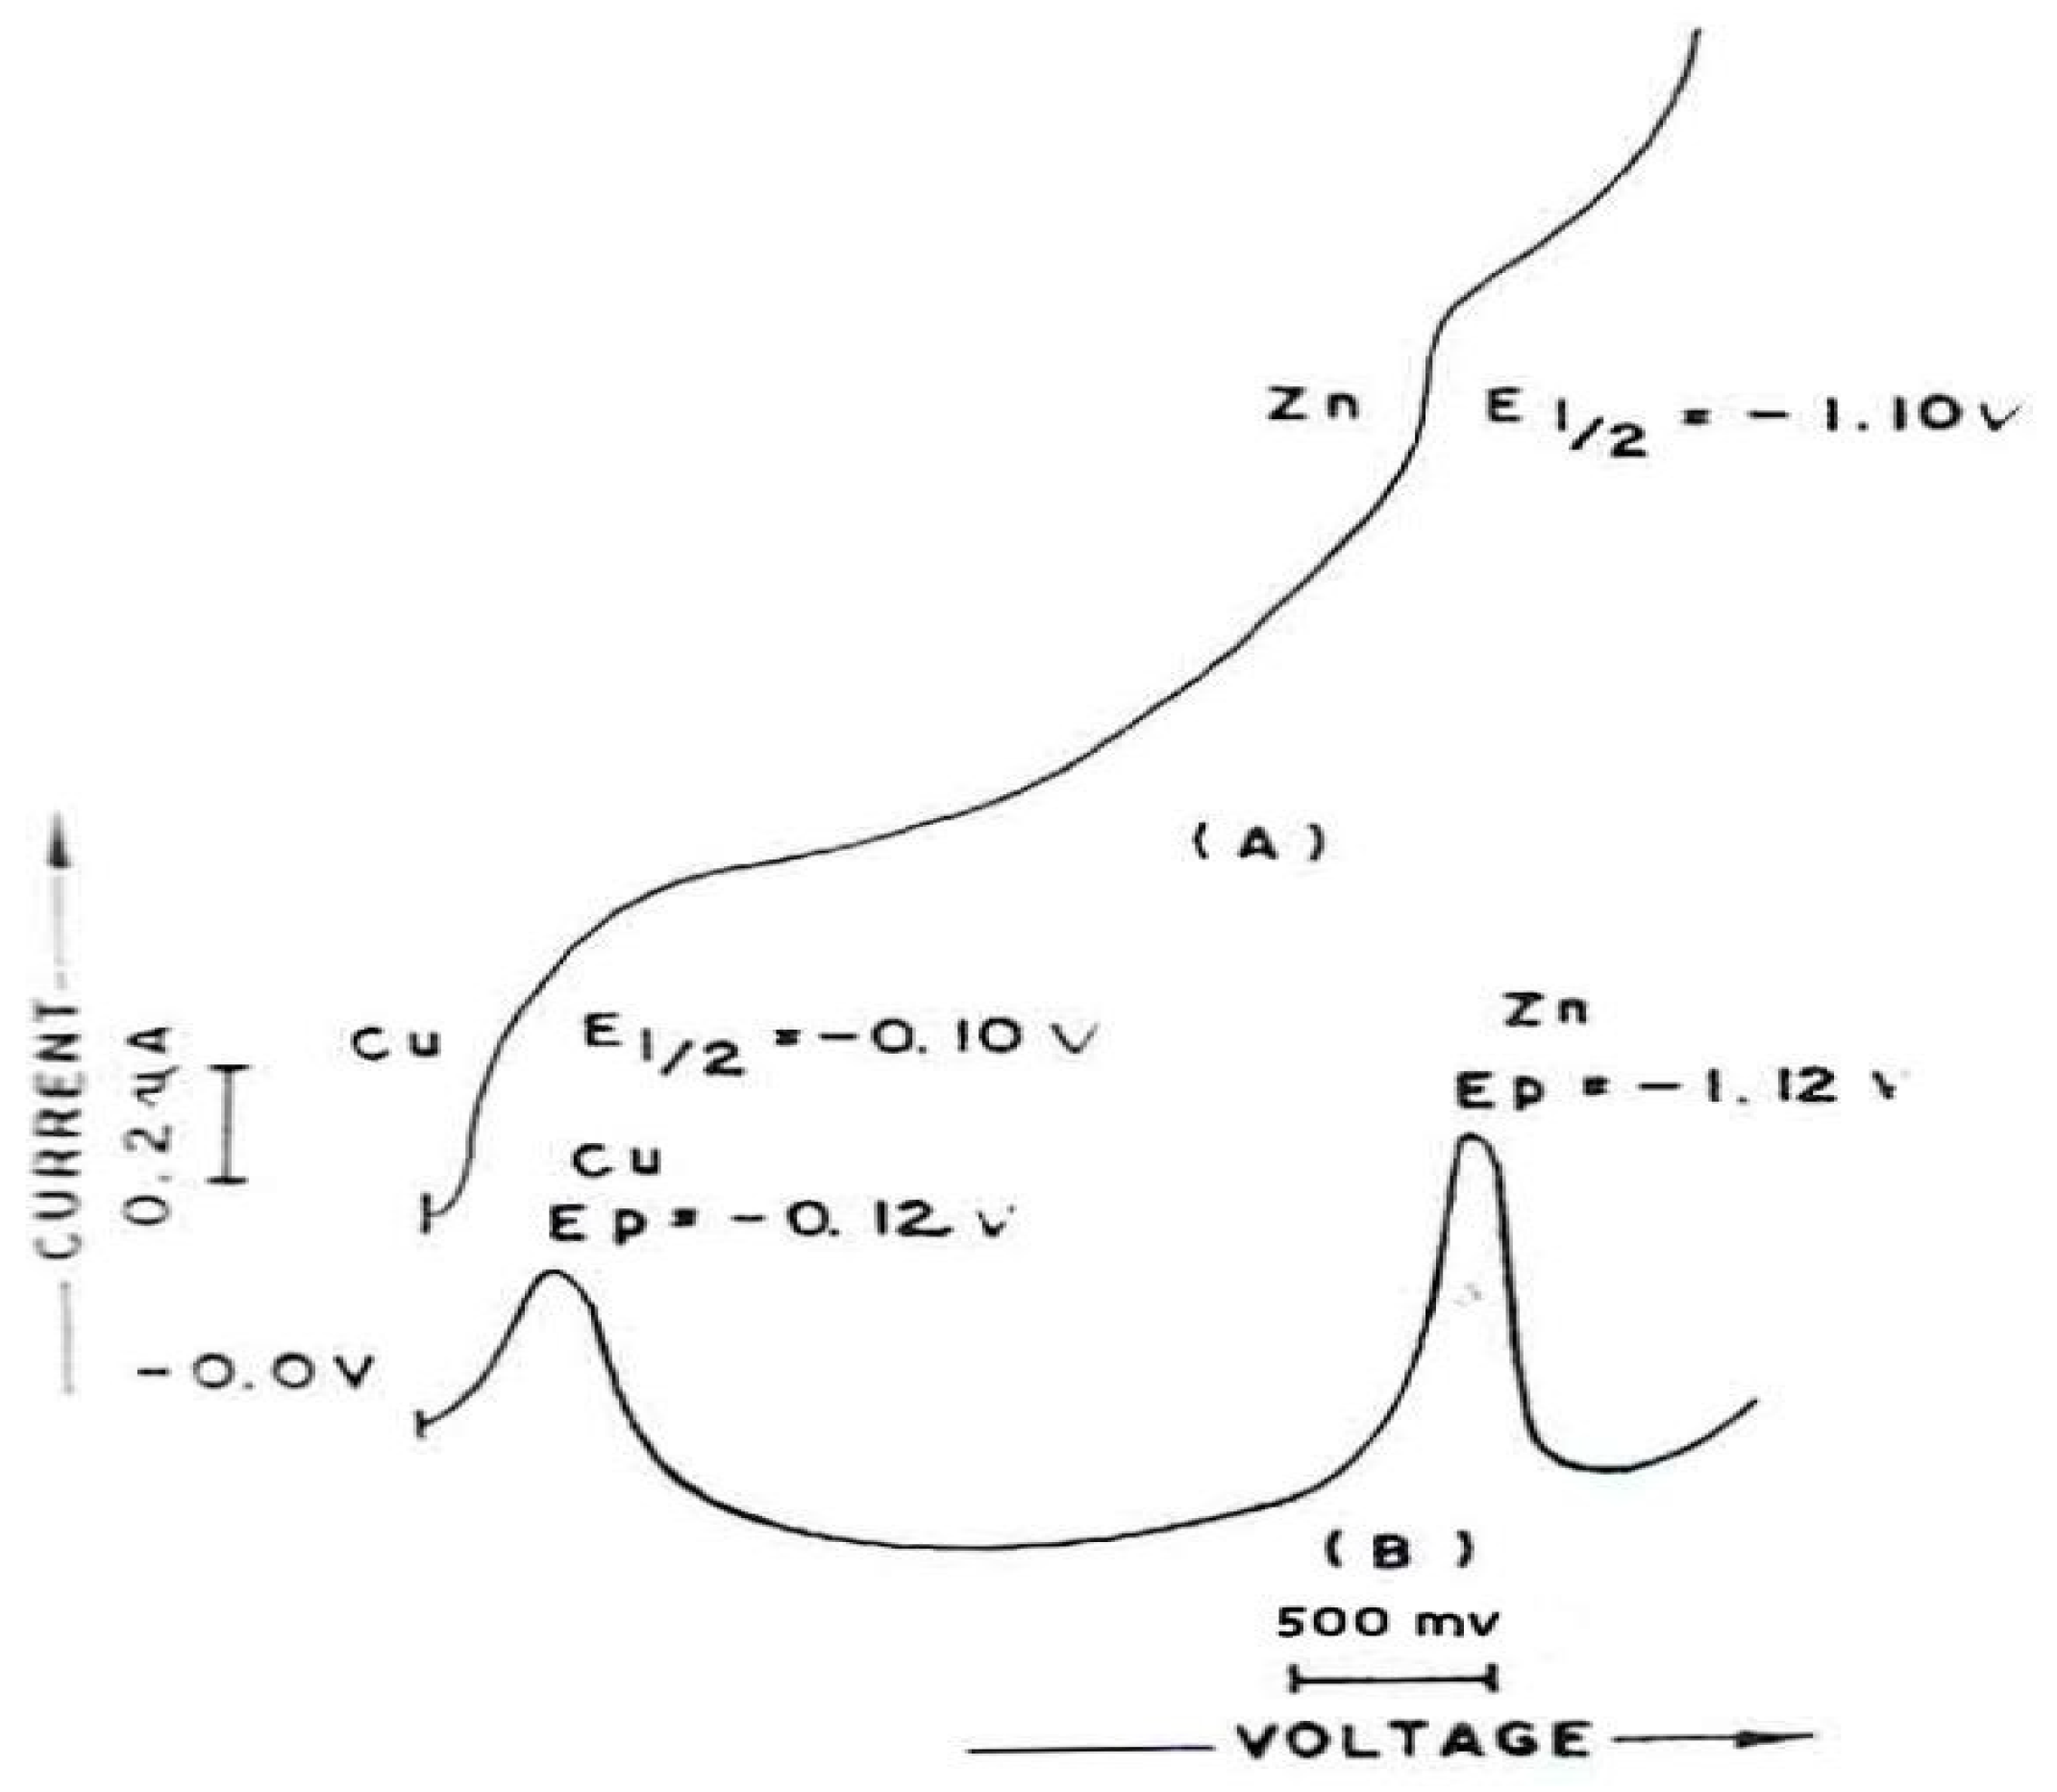
The DCP/DPP and DPASV (
Figure 7A–C) for corrosion sample after 5 min in 0.1 M KC1 + 0.001% gelatin at pH 5.0 +0.1 show the E
1/2/E
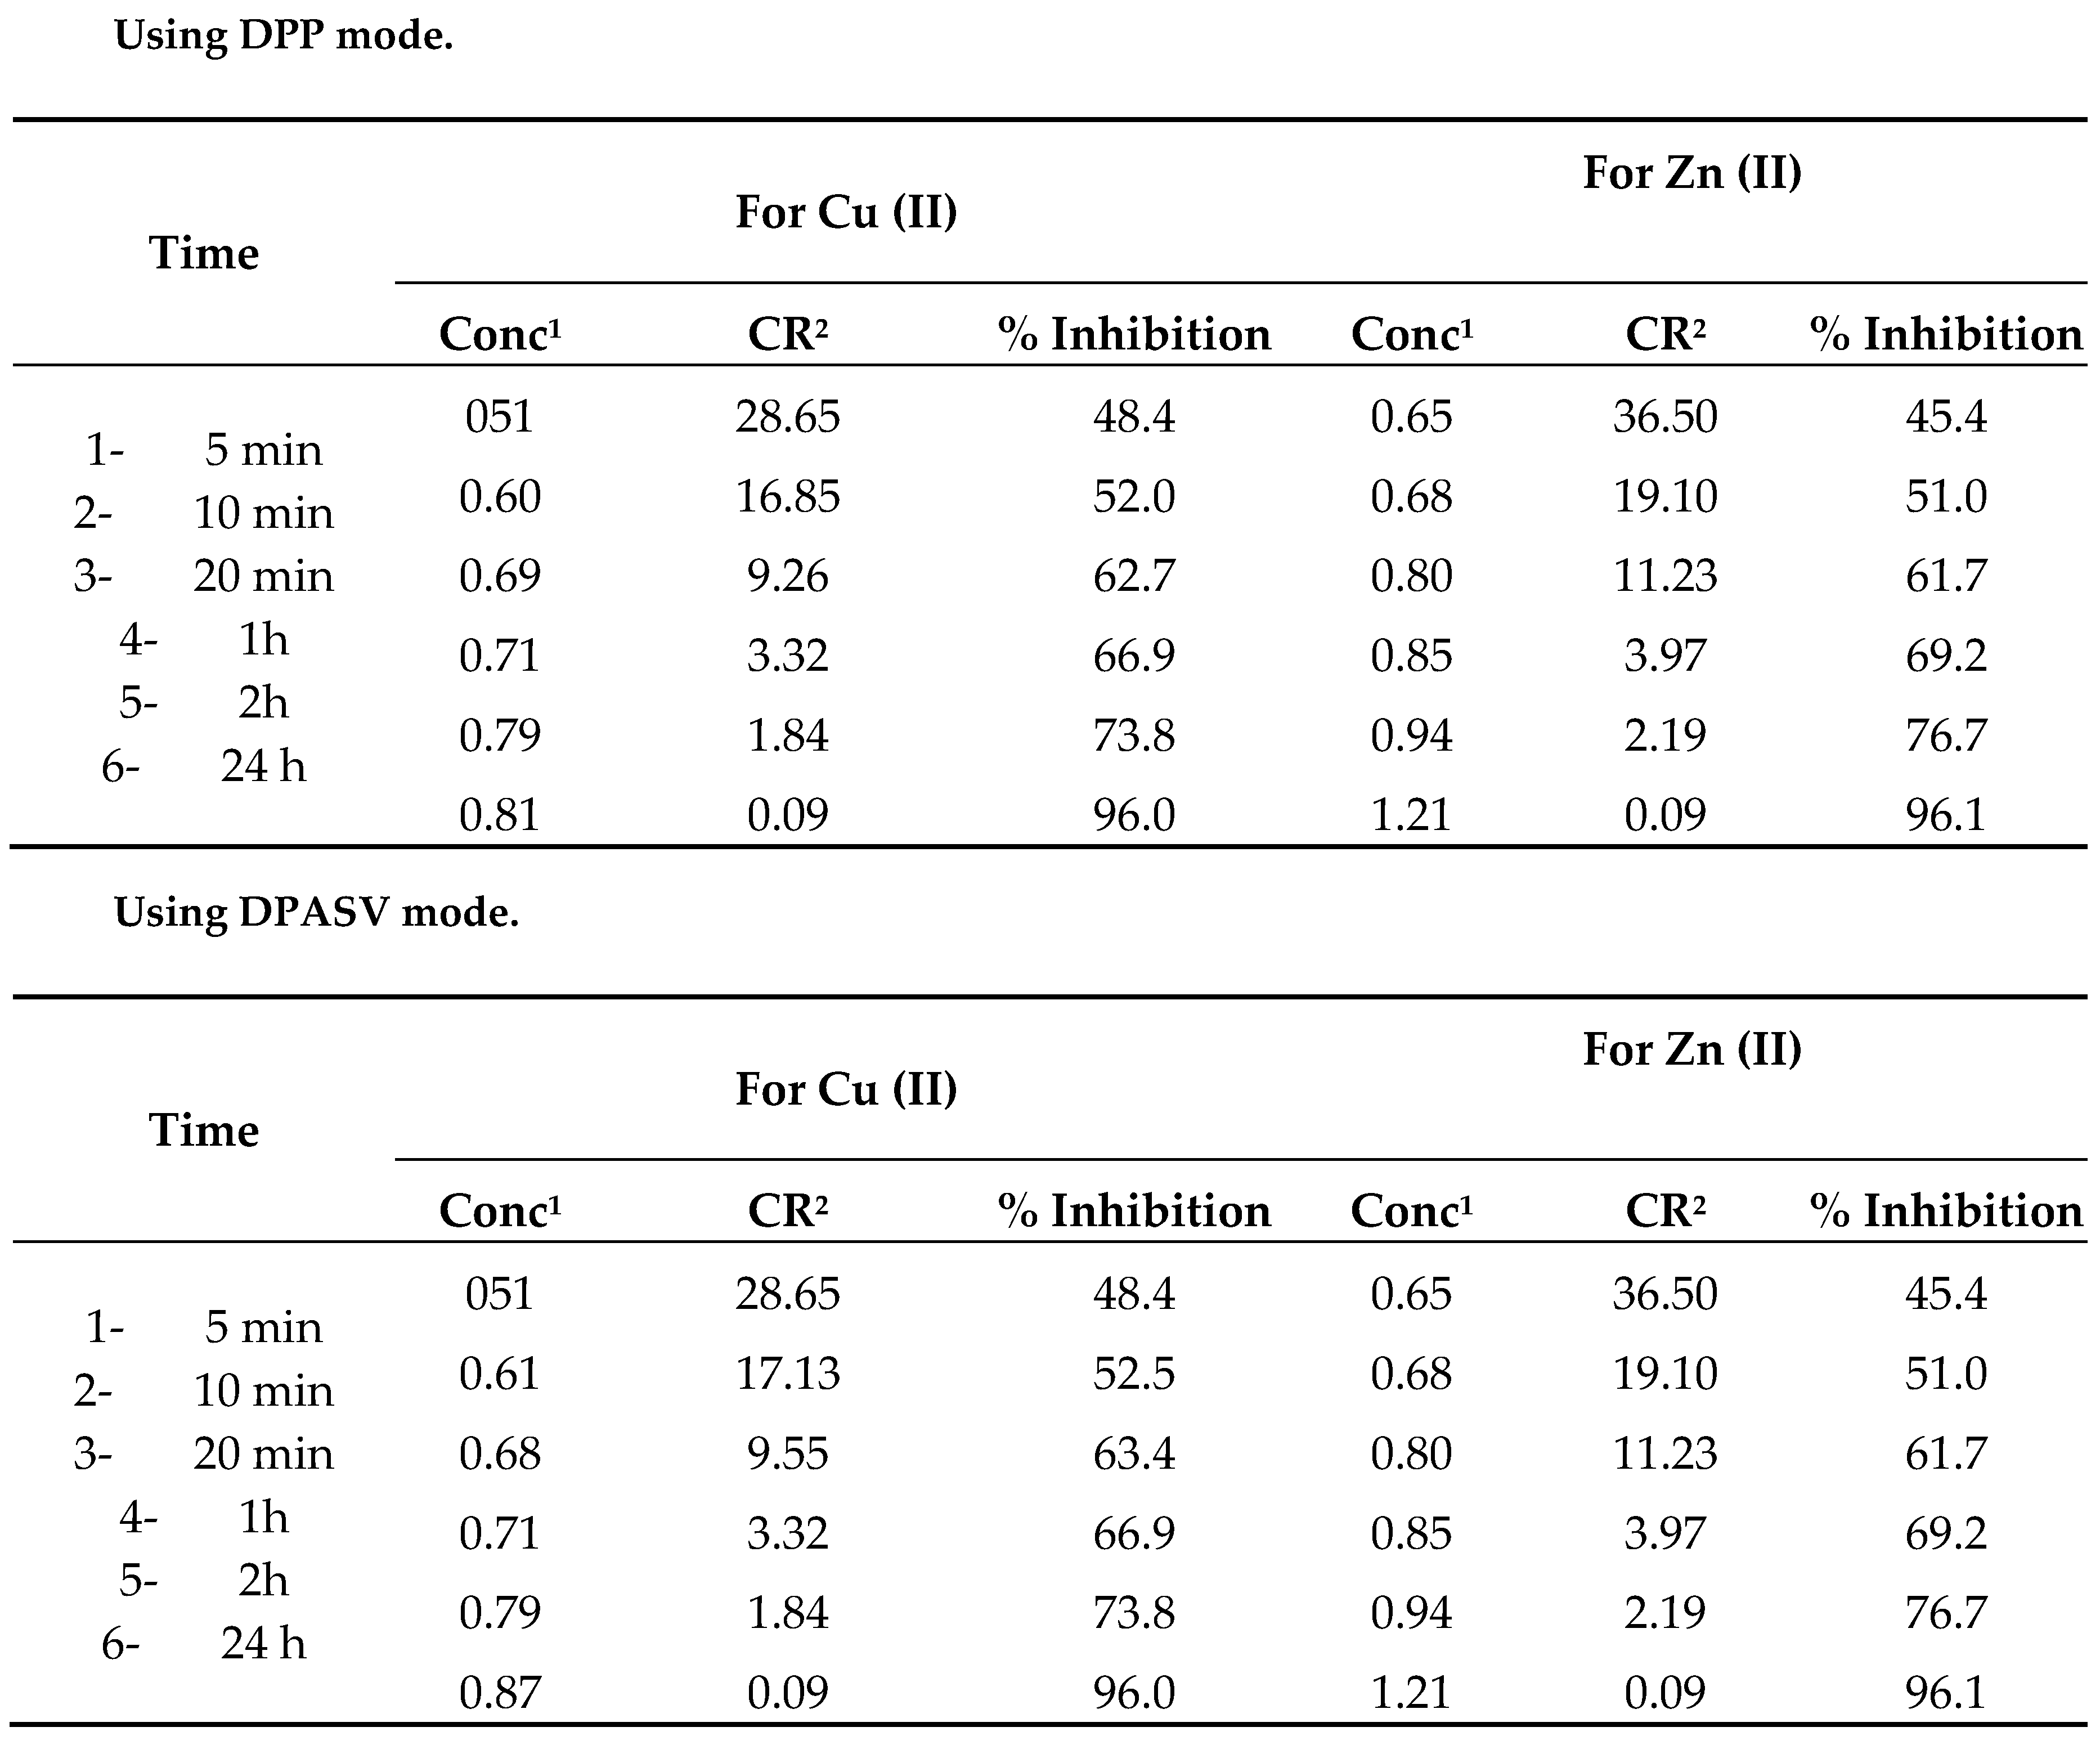
P values for Cu (II) and Zn (II) are as -0.01/-0.12 and -1.10/-1.12 V and – 0.14 V respectively (Meites 1965). The diagram shows that the presence of Cu (II) and Zn (II) in solution can be analyzed simultaneously using polarography and voltammetry. Cu (II) and Zn (II) produced two distinct, well defined polarographic waves and peaks in each case. The peak heights of Cu Zn are proportional to their concentrations over the entire of the work concentration range for all the three modes.
Table 4 shows the corrosion rates of Cu (II) and Zn (II) at different periods of time.
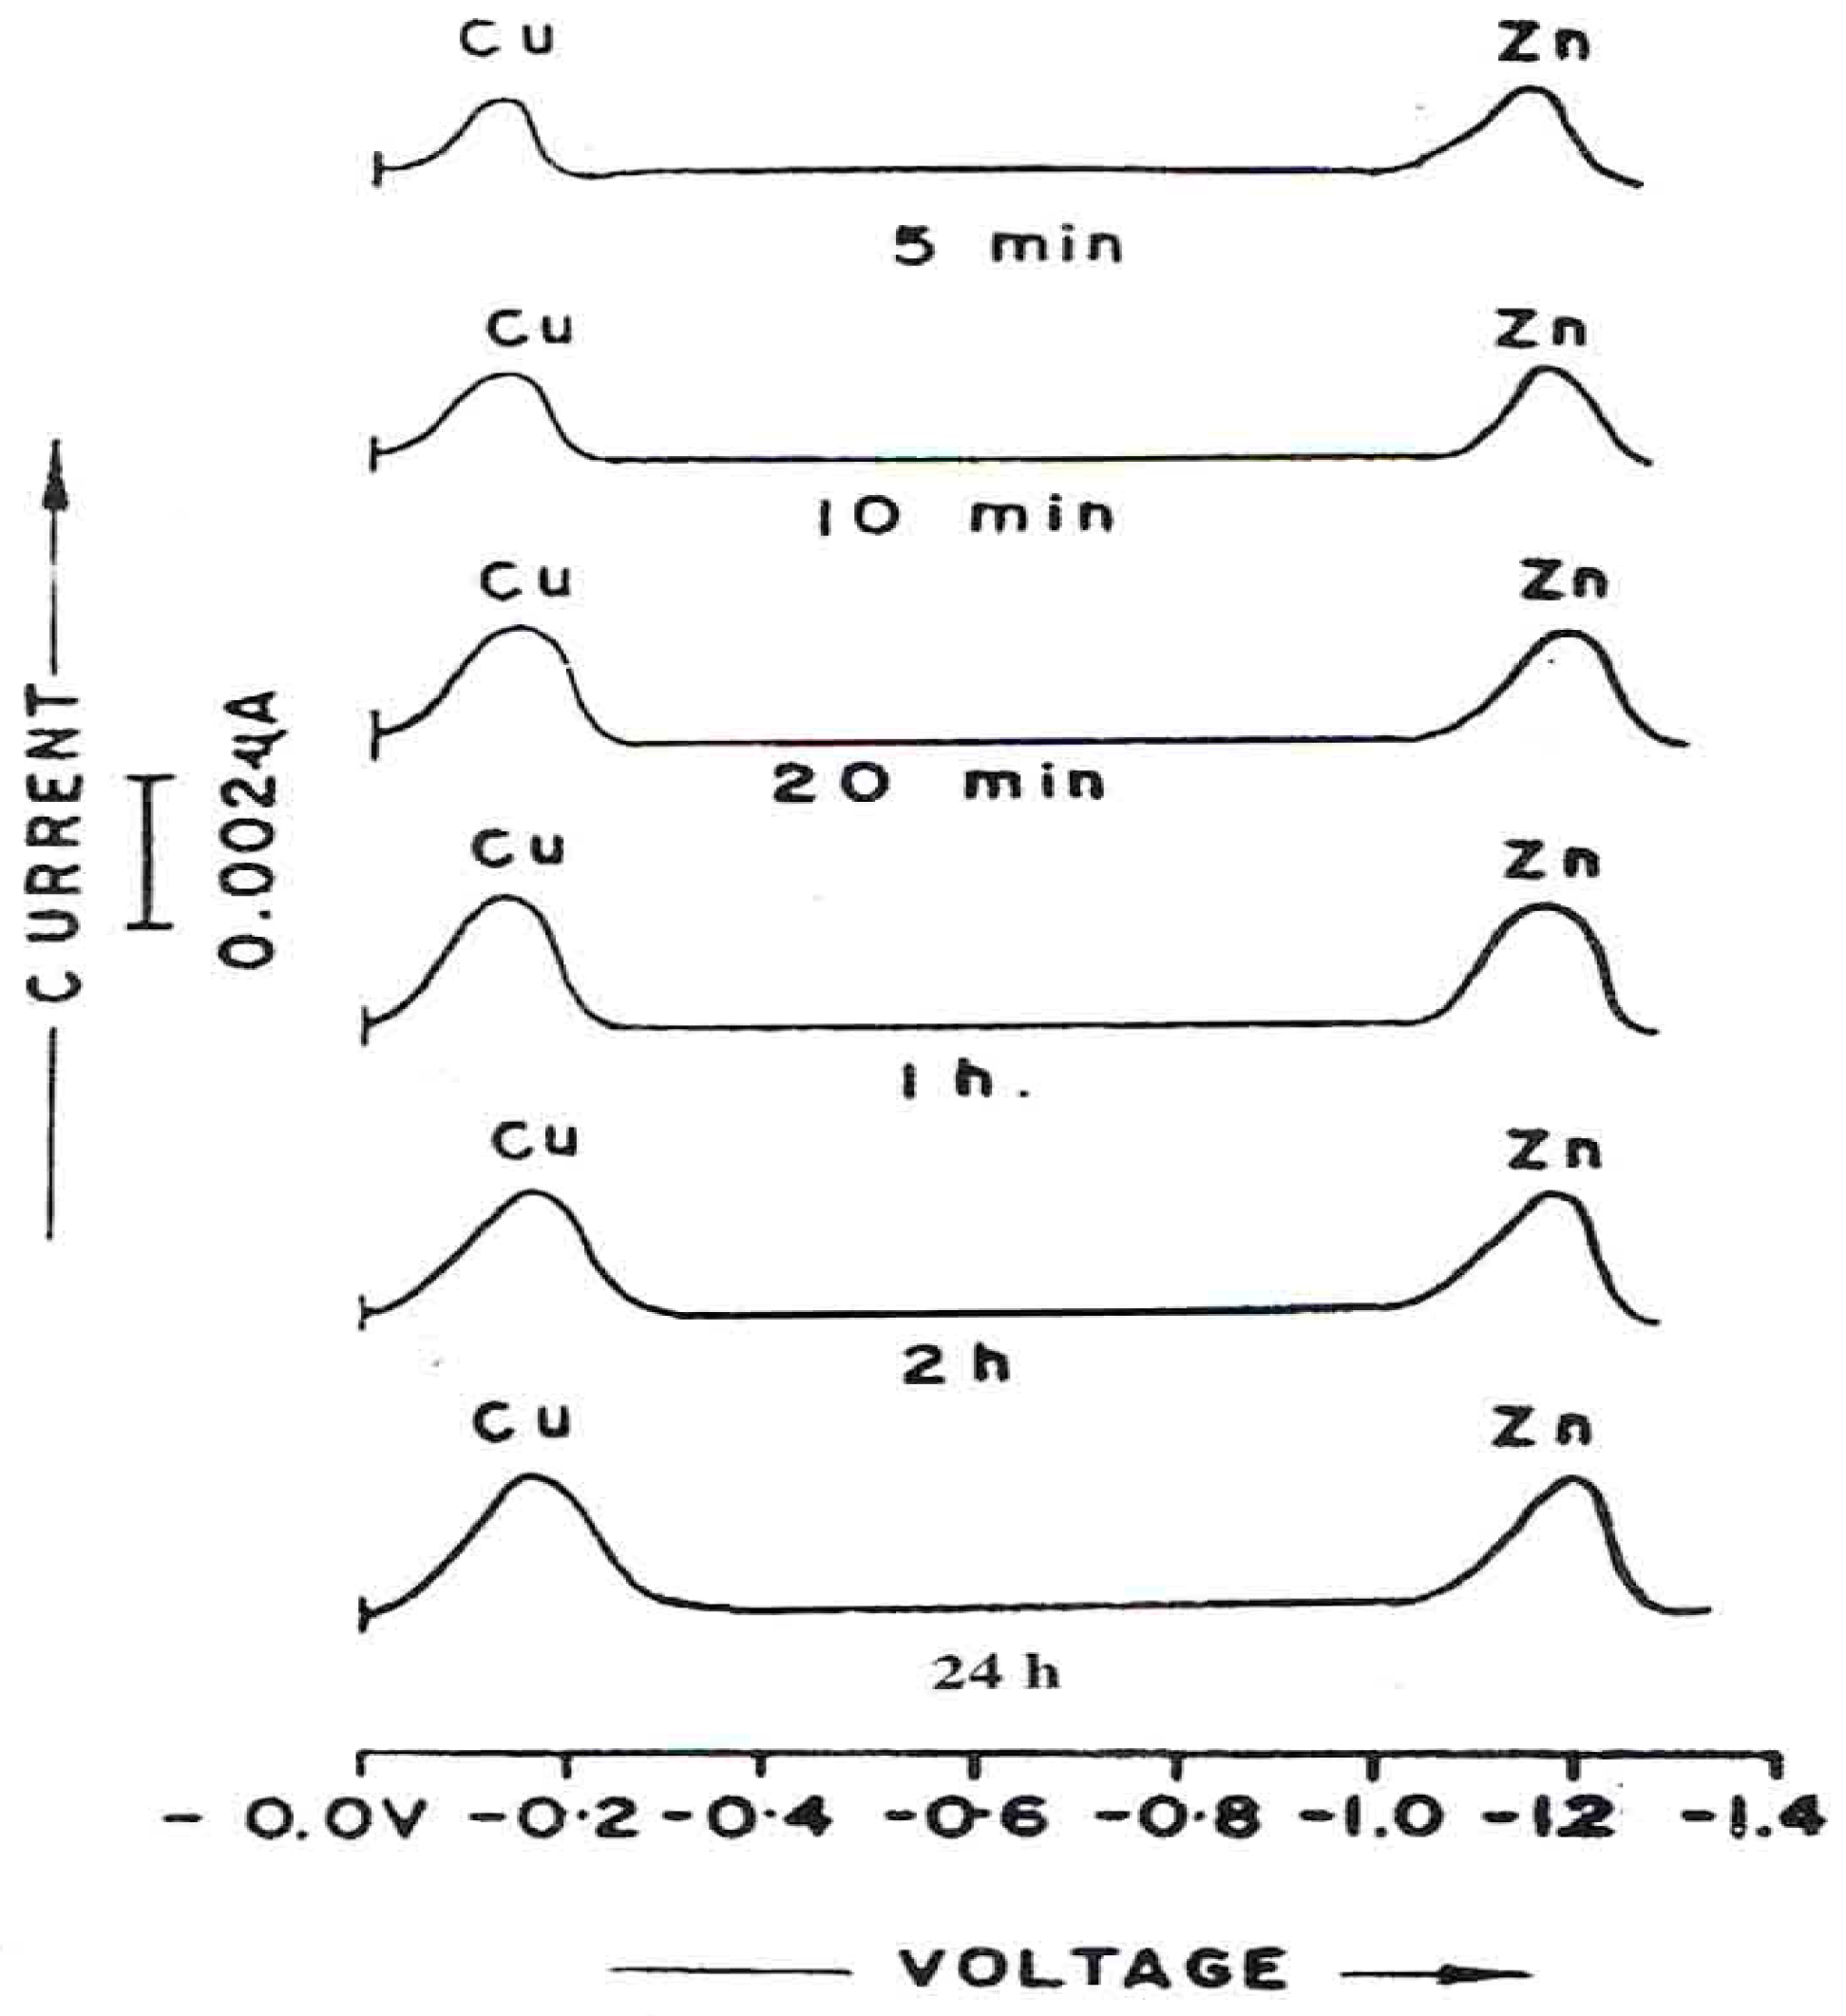
DPP curves (
Figure 8) for the corrosion in which ESSB (0.25g/1) has been added clearly shown the shifting of potentials. A shift in the E
p values for each of the Cu (II) and Zn (II) indicates the M: ESBB complex formation in the solution. The corrosion rates in the presence of ESBB are reported in
Table 5.
A perusal of the data in
Table 4 and
Table 5 clearly show that the corrosion rate was very fast at the start of the experiment, and decreasing with time. After 24 hours, the corrosion inhibition efficiency of ESSB is 96% after 24 h. Comparing corrosion and inhibition rate data as calculated by Voltammetry, Polarography, potentiodynamic and galvanostatic polarization measurements, the gravimentric PIT method clearly demonstrates the utility of ESBB as corrosion inhibitor for corrosion of brass in 1 N HCl solutions.
4. Conclusions
From the figures and tables if can be concluded that Polarography and Voltammetry can provide reliable information about the corrosion rates of brass in a short time. The methods are also suitable for determining the corrosion rate of any species present in solution, for example Cu (II) and Zn (II) for corrosion of brass in present paper. Although all the above methods used in the field of corrosion rate determination furnish an average value for a long time period, but the proposed polarographic and voltammetric methods are highly sensitive for corrosion rate determination at short span of time and that too with respect to each species present in the solution in one run which is otherwise not possible using methods prevalent in the field of corrosion rate determination (Lavale, and Pitre (1982) also in the field of trace analysis.
Acknowledgments
We are thankful to Ratnesh Das, Associate Professor, Dr. HSG University, Sagar, MP for providing laboratory facilities in conducting the study. The authors are also thankful to Vijay Singh, Registrar, RNTU, Bhopal, MP for financial support.
Conflicts of Interest
The authors declare no conflict of interest regarding this research paper.
References
- Abd El-Lateef, H.M.; Abo-Riya, M.A.; Tantawy, A.H. Empirical and quantum chemical studies on the corrosion inhibition performance of some novel synthesized cationic Gemini surfactants on carbon steel pipelines in acid pickling processes. Corros Sci 2016, 108, 94–110. [Google Scholar] [CrossRef]
- Ali, Z.; Einaz, B.; et al. Corrosion Communication Plant extracts as sustainable and green corrosion inhibitors for protection of ferrous metals in corrosive media: A mini review. 2022, 5, 25–38. [Google Scholar] [CrossRef]
- Chitale, V.K.; Pitre, K.S. Analytical polarographic separation of cu(ii)-cd and cu(ii)-ni by differential complexation with salicyclic acid and iminodiacetic acid. Review Analytical Chemistry 1982, 6, 169–176. [Google Scholar] [CrossRef]
- Fenot, P.; Darriet, J.; Garrigou-Lagrange, C.A. Étude ristallographique etvibrationnelle de complexes metalliques de l'acide aminométhylphosphonique. Molecular Structure 1978, 43, 49–60. [Google Scholar] [CrossRef]
- Gillard, R.D.; Newman, P.D.; Collins, J.D. Speciation in aqueous solutions of di-ethylenetriamine-N,N,N′,N″,N″-penta methylene phosphonic acid and some metal complexes. Polyhedron 1989, 8, 2077–2086. [Google Scholar] [CrossRef]
- Gupta Maneesh Shukla Jyotsna Pitre, K.S. Corrosion and Inhibition effects of mild steel in hydrochloric acid solution containing organophosphonic acid. International J Corrosion 2013, 3, 50. [Google Scholar] [CrossRef]
- Gupta, P.; Choudhary, R.S.; Namboodhiri, T.K.G.; Prakash, B. The inhibitive action of some azoles towards the corrosion and dezincification of 70 copper 30 zinc brass in ammonia solution. Corrosion Science 1983, 1361–1371. [Google Scholar] [CrossRef]
- Heiderspack, R.H.; Vernik, E. The dezincification of alpha and beta brasses. Corrosion 1972, 28, 397–418. [Google Scholar] [CrossRef]
- Kalman, E.; Karman, F.H.; Telegdi, J.; Varhegyi, B.; Balla, J.; Kiss, T. Inhibition efficiency of N-containing carboxylic and carboxy-phosphonic acids. Corrosion Science 1993, 35, 1477–1482. [Google Scholar] [CrossRef]
- Meites, L. Polarographic techniques. 2nd Ed Inter Science Pub 1965; p. 661.
- Nakamoto, K. Infrared and Raman Spectra of Inorganic and Coordination Compound. Willey Inter science Publication New York. 1949; p. 88.
- Popadopoulou, O.; Vassiliou, P. The Influence of Archaeometallurgical Copper Alloy Castings Microstructure towards Corrosion Evolution in Various Corrosive Media. Corrosion Mater Degrad 2021, 2, 227–247. [Google Scholar] [CrossRef]
- Santhy Sand Pimple, S. Molecular Docking Studies of Alpinia galanga Phytoconstituents for Psychostimulant Activity. Advances in Biological Chemistry 2018, 8, 1–16. [Google Scholar] [CrossRef]
- Singh, A.; Singh, V.K. Quraishi. Aqueous Extract of Kalmegh leaves as green inhibitor for mild steei in hydrochloric solution. International J Corrosion 2010, 10, 1–11. [Google Scholar] [CrossRef]
- Siti, Z.S.; Abdul H, e.t. al Plant extracts as green corrosion inhibitor for ferrous metal alloys: A review. J Cleaner Production 2021, 304, 127030–127034. [Google Scholar] [CrossRef]
- Shukla, J.; Pitre, K.S. Electrochemical analysis of gold in ore sample. Analyst 1996, 121, 81. [Google Scholar] [CrossRef]
- Telegdi, J.; Kalman, E.; Karman, F.H. Corrosion and scale inhibitors with systematically changed structure. Corrosion science 1992, 33, 1099–1103. [Google Scholar] [CrossRef]
- Li, W.; Liu, K.; et al. Numerical simulation of carbon steel atmospheric Corrosion under varying electrolyte-film thickness and corrosion product porosity. Materials Degradation 2023, 7, 1–12. [Google Scholar] [CrossRef]
- Zhang, X.; Wan, M.; Huang, L.; Tao, J.; Xiong, Y.; Wang, Z. Galvanic corrosion behavior of 5083 alloy/H62 brass couple under magnetic field. J Material Research Tech 2023, 22, 192–205. [Google Scholar] [CrossRef]
|
Disclaimer/Publisher’s Note: The statements, opinions and data contained in all publications are solely those of the individual author(s) and contributor(s) and not of MDPI and/or the editor(s). MDPI and/or the editor(s) disclaim responsibility for any injury to people or property resulting from any ideas, methods, instructions or products referred to in the content. |
© 2023 by the authors. Licensee MDPI, Basel, Switzerland. This article is an open access article distributed under the terms and conditions of the Creative Commons Attribution (CC BY) license (https://creativecommons.org/licenses/by/4.0/).
