1. Introduction
One of the most well-known and important sources of clean water, with unrivalled importance for the biosphere, is river ecosystems [
1]. Like all other clean water sources, rivers are under threat from natural and anthropogenic pressures [
2]. As a result, it is important to define these pressures and to identify the pollutant burden they cause [
3]. One of the most accurate tools to make these identifications is hydrological models. Hydrological models to be applied at basin scale provide cost and time savings with results that can be obtained from available data, even in areas where parameter measurement is difficult [
4]. With the use of hydrological models, precautions can be taken to protect urban and environmental health and it becomes easier to overcome problems that will be experienced [
5,
6].
Hydrological modelling involves tools allowing the opportunity to solve equations mathematically that are closest to reality with assumption-based simplification of surface water systems [
7]. At the same time, due to being able to model water quality parameters, they are important to predict movement of pollutants in aqueous environments even in unaccessible areas without requiring large-scale, expensive chemical analyses and large labor force and to identify steps to be taken in the future to prevent water-environmental pollution [
8,
9,
10]. There are several different software programs available based on pollutant features for hydrological modelling [
11,
12,
13].
Hydrological model software may be chosen according to the available data, type of problem and solution to be implemented [
14]. In the field of environmental health, the SWAT model, which can be used effectively to identify, monitor and solve problems causing damage in a serious sense to environmental health, like water pollution, particle/sediment transport and nutrients with the movement of water in nature, comes to the forefront [
15,
16,
17,
18].
The hydrological model inputs for SWAT comprise easily accessible data. These data may be grouped as climatic (rainfall, temperature, solar radiation and relative humidity), physical (land use, soil features, topography and slope), hydrological (flow discharge rates, water levels) and chemical (point and distributed pollutant burden) [
19,
20]. After calibration and sensitivity analysis performed according to observed values defined in the model, these data may provide model outputs related to daily, monthly or annual time periods for flow and water quality on a basin scale [
21,
22].
The main aim of this study, encompassing the years 2020-2022, is to present alternative solution recommendations about the use of hydrological models to predict and monitor problems that may occur related to water quality in the field of environmental health and to investigate the behavior in nature, distribution and sources of pollutants disrupting water quality [
23,
24]. In line with this aim, the target was to define the hydrological system with a SWAT model, determine the current water quality status, create a foundation for analysis of pollutant burden that may threaten environmental health in the future and provide the opportunity to be able to produce effective solutions for possible negative scenarios for the Tatlıçay river ecosystem, an important water resource in Çankırı province with moderate population density located in the Central Anatolia region of Türkiye.
2. Materials and Methods
2.1. Study Area
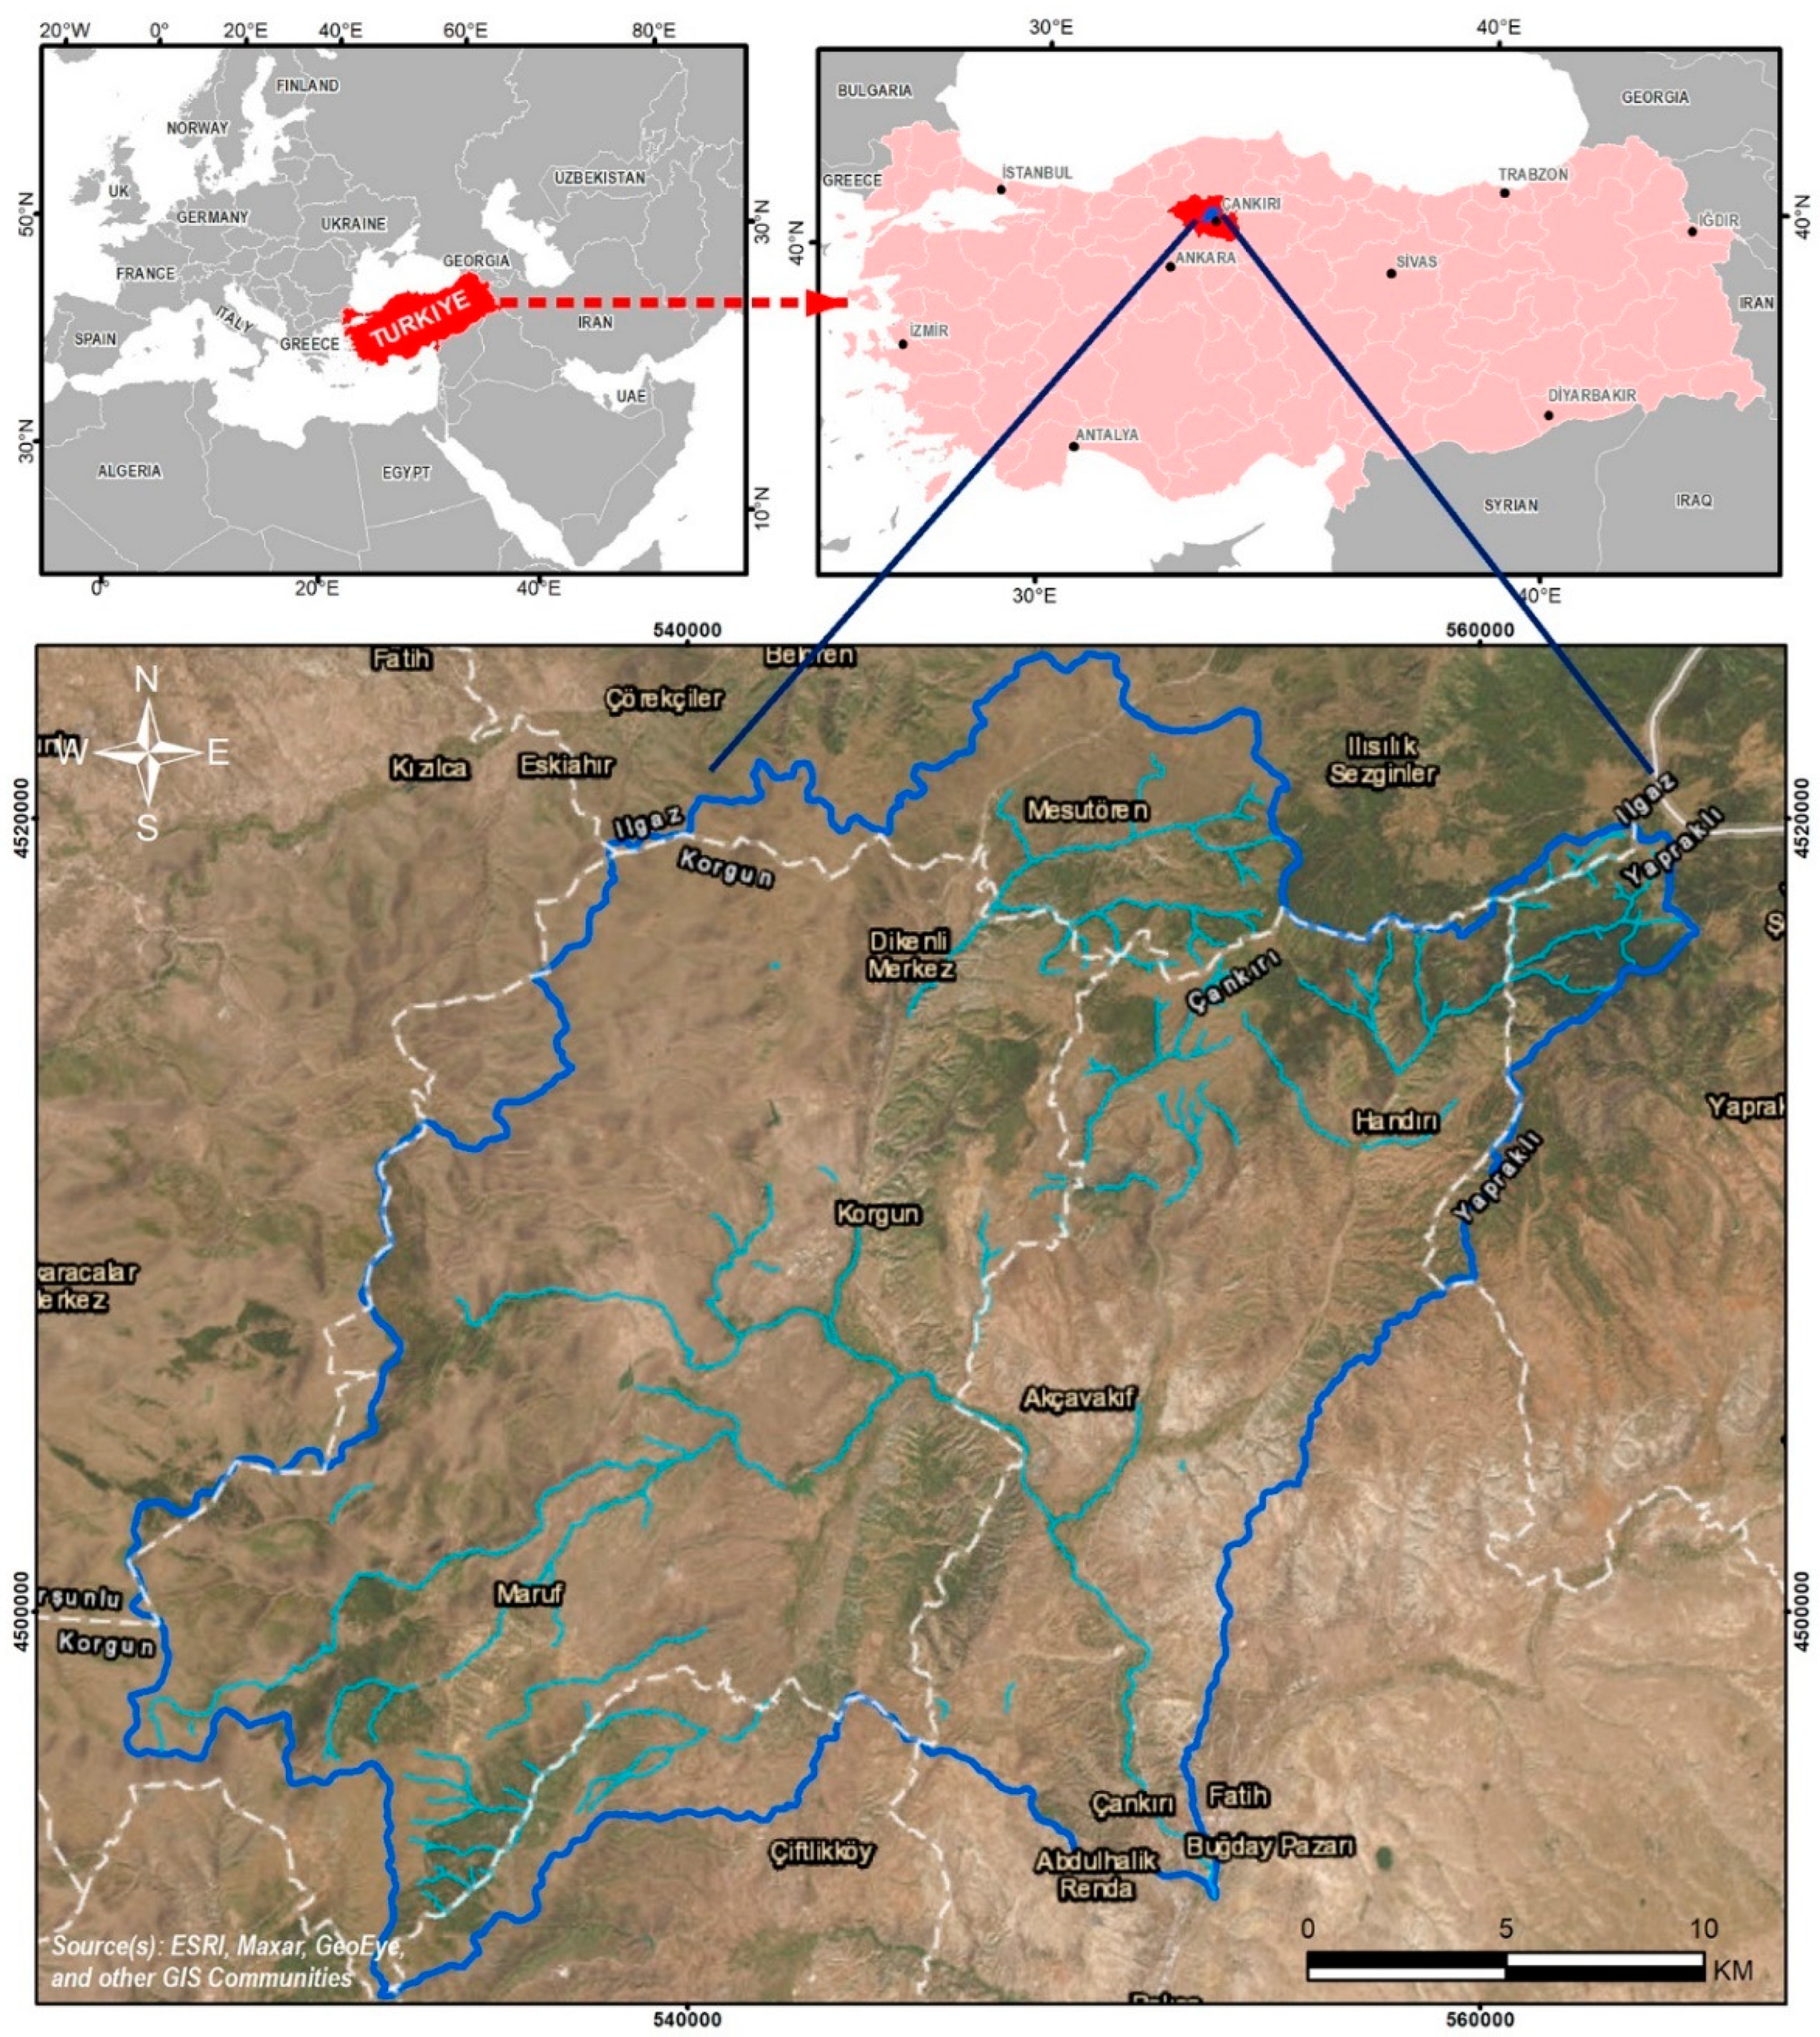
The study area was chosen as the Tatlıçay Basin in the Central Anatolia region of Türkiye, within Çankırı province. The dominant plant cover is Iranian-Anatolian steppe and continental climate dominates (
Figure 1). The study area represents a sub-basin of the Kızılırmak, one of the most important rivers in Türkiye.
The Tatlıçay river ecosystem, chosen as example study area for SWAT model implementation, contains elements of pressure affecting environmental health with anthropogenic source like agricultural practices and urban waste discharge. For agricultural irrigation, water collection for use of river water for gardening and agriculture in plains and in irrigation ponds within the basin lower the flow of the Tatlıçay and cause low water quality. Agricultural practices in the basin use intense fertilizer and pesticide, which suppress the Tatlıçay river ecosystem. Additionally, urban discharge from settlement areas with dense population in the Tatlıçay Basin discharges into the rivers without any treatment process. All these pressure elements negatively affect environmental health and cause poor water quality in the Tatlıçay river ecosystem. Direct irrigation from the river with poor water quality affects public health in the same way, through the use of the products grown with this water. Considering pollution burden in the Tatlıçay Basin in Cankiri, annual total nitrogen (TN) burden is 130 tons, while annual total phosphorus (TP) burden is 17 tons.
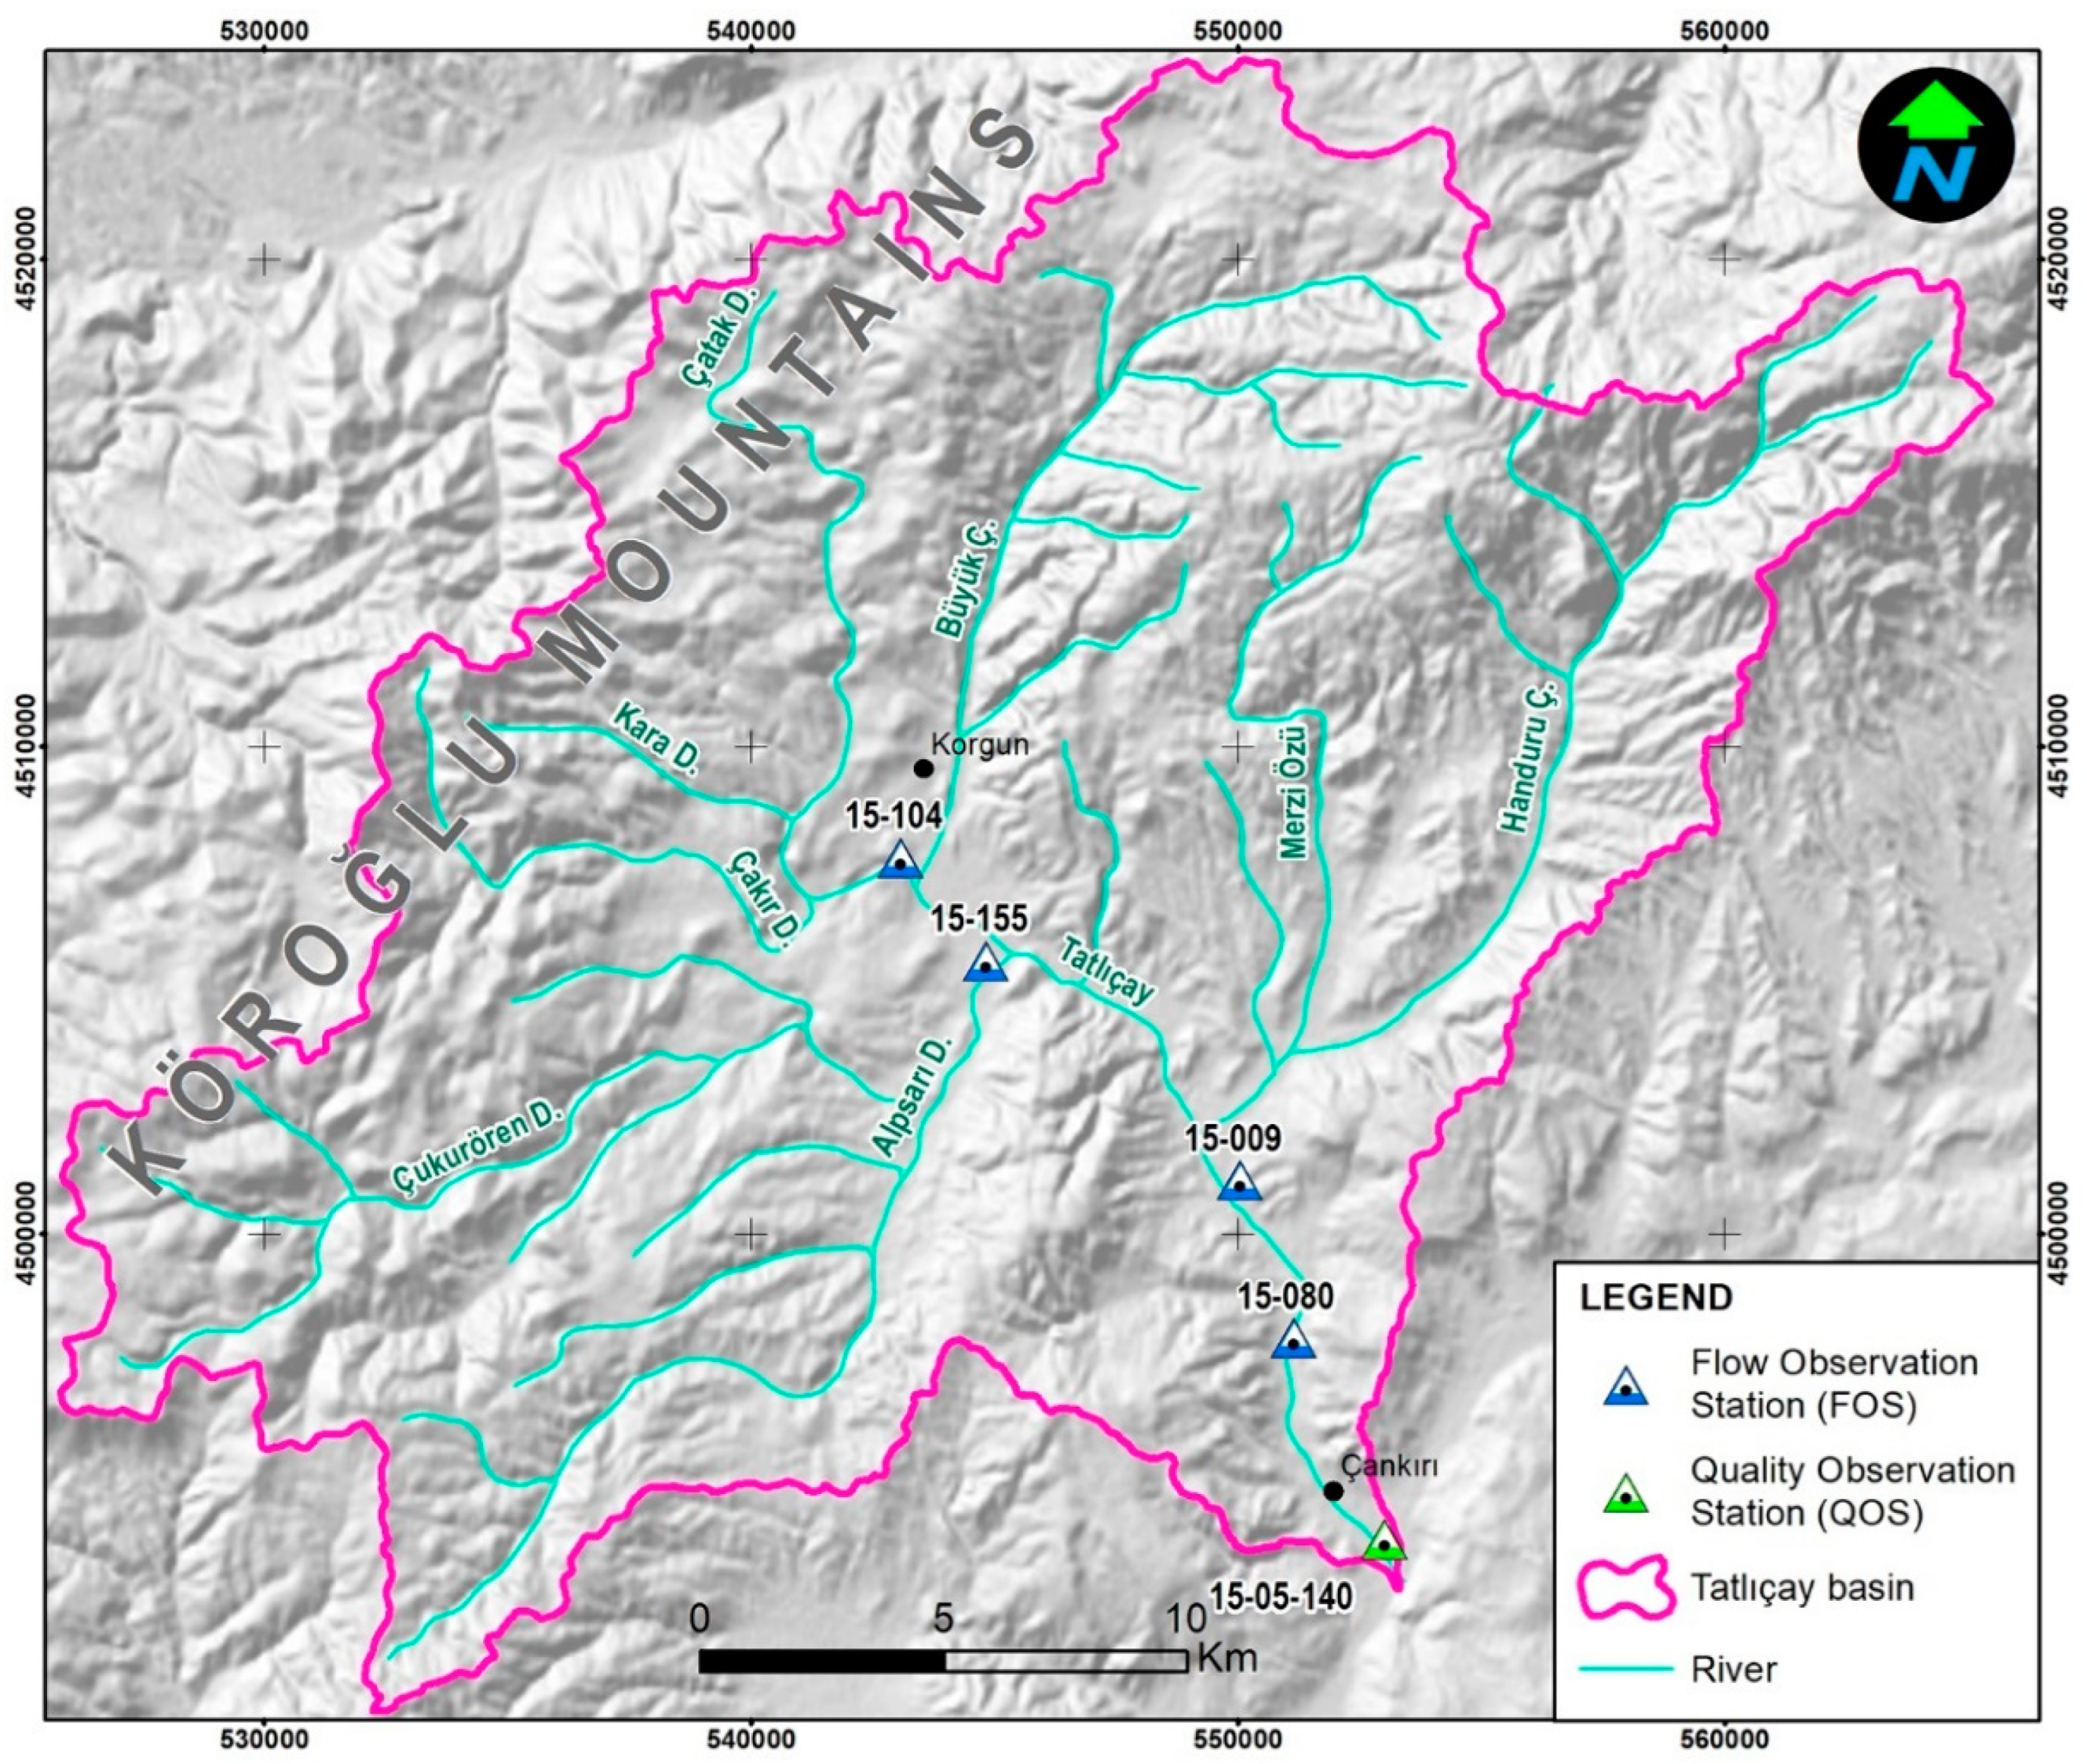
There are no flow monitoring stations performing current measurements on the Tatlıçay with 674.2 km
2 water collection basin (
Figure 2).
However, Tatlıçay water quality station no. 15-05-140 operated by the General Directorate of State Hydraulic Works (DSI) measures 400 different parameters and is located at the outlet of the Tatlıçay Basin [
25]. At this station, instantaneous flow values and quality parameters were measured in monthly or 3-monthly periods from 2016 to 2020 [
26].
When the total nitrogen (TN) and total phosphorus (TP) values for 2016-2019 at DSI quality monitoring station no. 15-05-140 are examined, it appears loading that may negatively affect environmental health occurred in January, February and March (
Table 1 and
Table 2).
2.2. SWAT Model Application
SWAT is commonly used to assess land use, to estimate the effects of land management applications and climate change on the environment, and to assess erosion prevention and control, diffuse source pollution control and regional and watershed management. The software is frequently chosen due to rapid creation of the model, user-friendly interface, easily accessible data requirements and offering GIS solution support [
16]. Models created using SWAT software pay attention to basic hydrological principles like the water cycle when assessing climatic and physical conditions together.
In the model to be created with SWAT, firstly information about the digital elevation map for the topic of the study, land use and soil properties maps, meteorological data (rainfall, temperature, relative humidity, solar radiation and mean wind speed), management implementations in the basin and ponds/reservoirs located within the study area are needed [
27]. After presenting this data as input for the model, the SWAT basin is firstly divided into sub-basins and then each sub-basin is divided into units comprising homogenous land use/management, topographic features and soil properties called a hydrologic response unit (HRU) [
28]. Later, the hydrological cycle is simulated on a daily basis using the equation given below.
After accurately expressing the operation of the hydrological system in the modelled basin, negative mechanisms on the system are defined and the current status of pollution in the area may be modelled [
29].
During the natural water cycle, there are natural and anthropogenic-derived pressures affecting water quality. In addition to natural events like climate change, floods, storms and earthquakes, anthropogenic-derived pressures significantly affect water quality [
1]. These threats may be listed as water structures like dams, ponds, etc. that change the natural flow of water and the climatic features of the environment, bad implementations in agriculture, carbon release, unplanned urbanization and industrialization, changes to plant patterns, leaching from waste storage sites and urban discharge. The nutrient cycle is linked to chemical conversions involving nitrogen and phosphorus compounds in the soil. It is possible to model the whole nutrient cycle for nitrogen and phosphorus using the SWAT model. The nitrogen cycle is a dynamic system involving water, air and soil environments. Plants require more nitrogen than other basic elements, apart from carbon, oxygen and hydrogen. Nitrogen and phosphorus may be modelled in the soil profile and shallow aquifers by SWAT [
16].
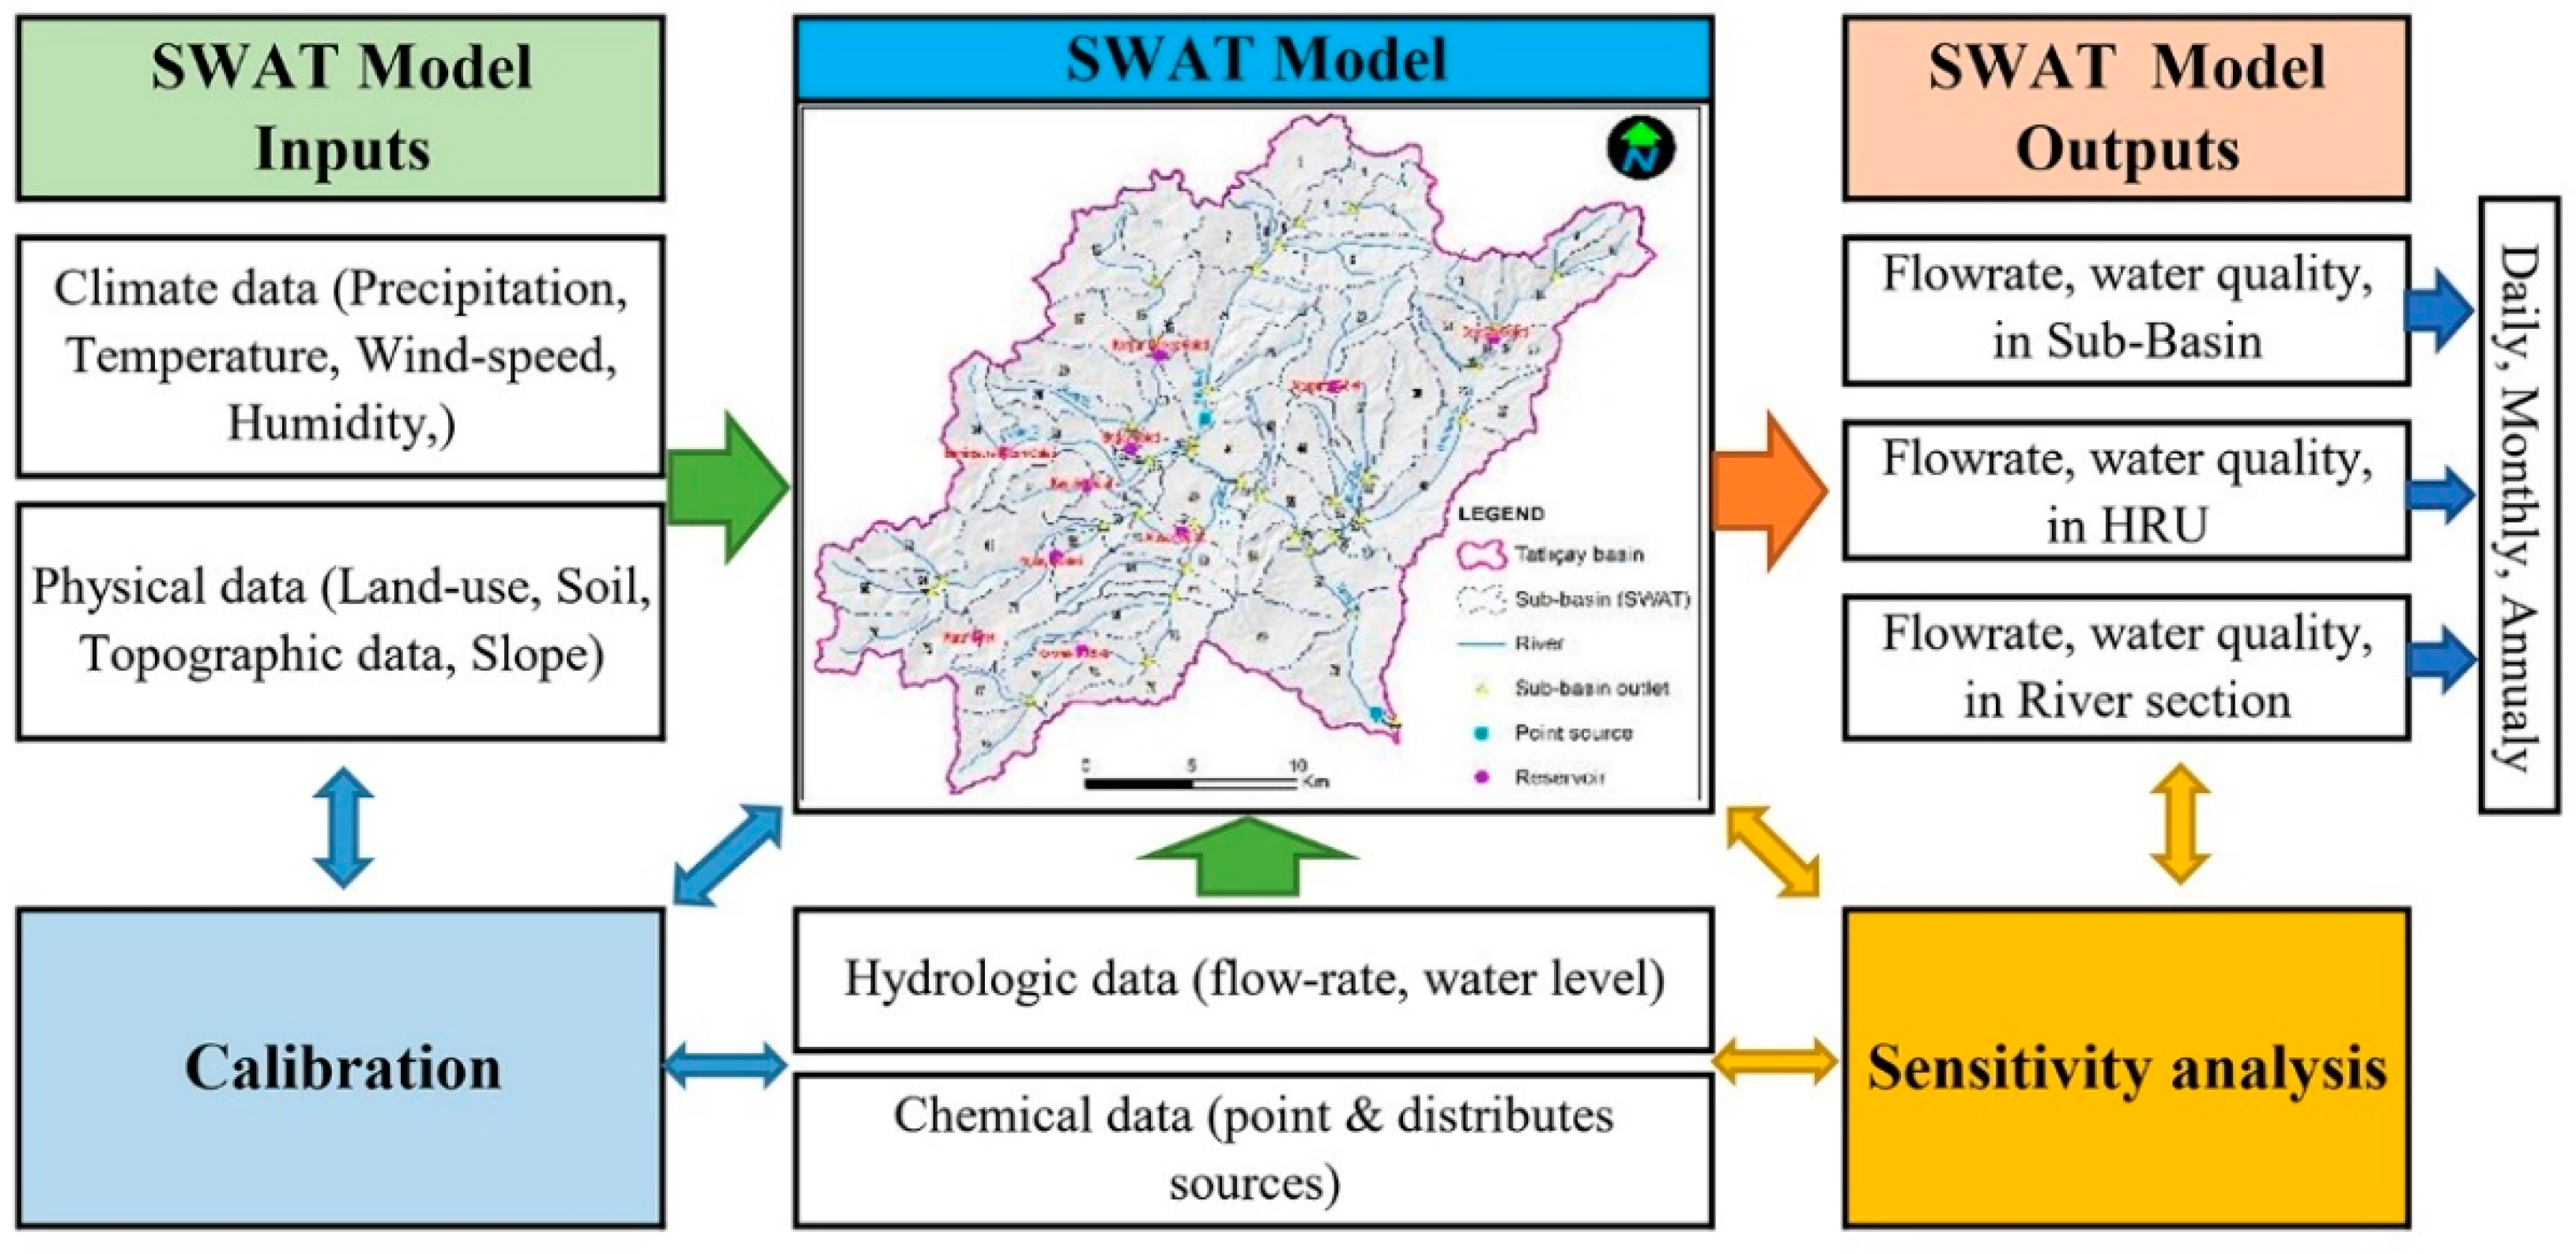
The Tatlıçay SWAT model was completed using the ArcSWAT Version 2012 developed by Texas A&M University (TAMU) operating on ArcGIS 10.5 (
Figure 3).
2.3. Model Setup
2.3.1. Data definition
Data and sources uploaded to the SWAT model of the Tatlıçay river ecosystem are given in
Table 3.
2.3.2. Watershed delineations
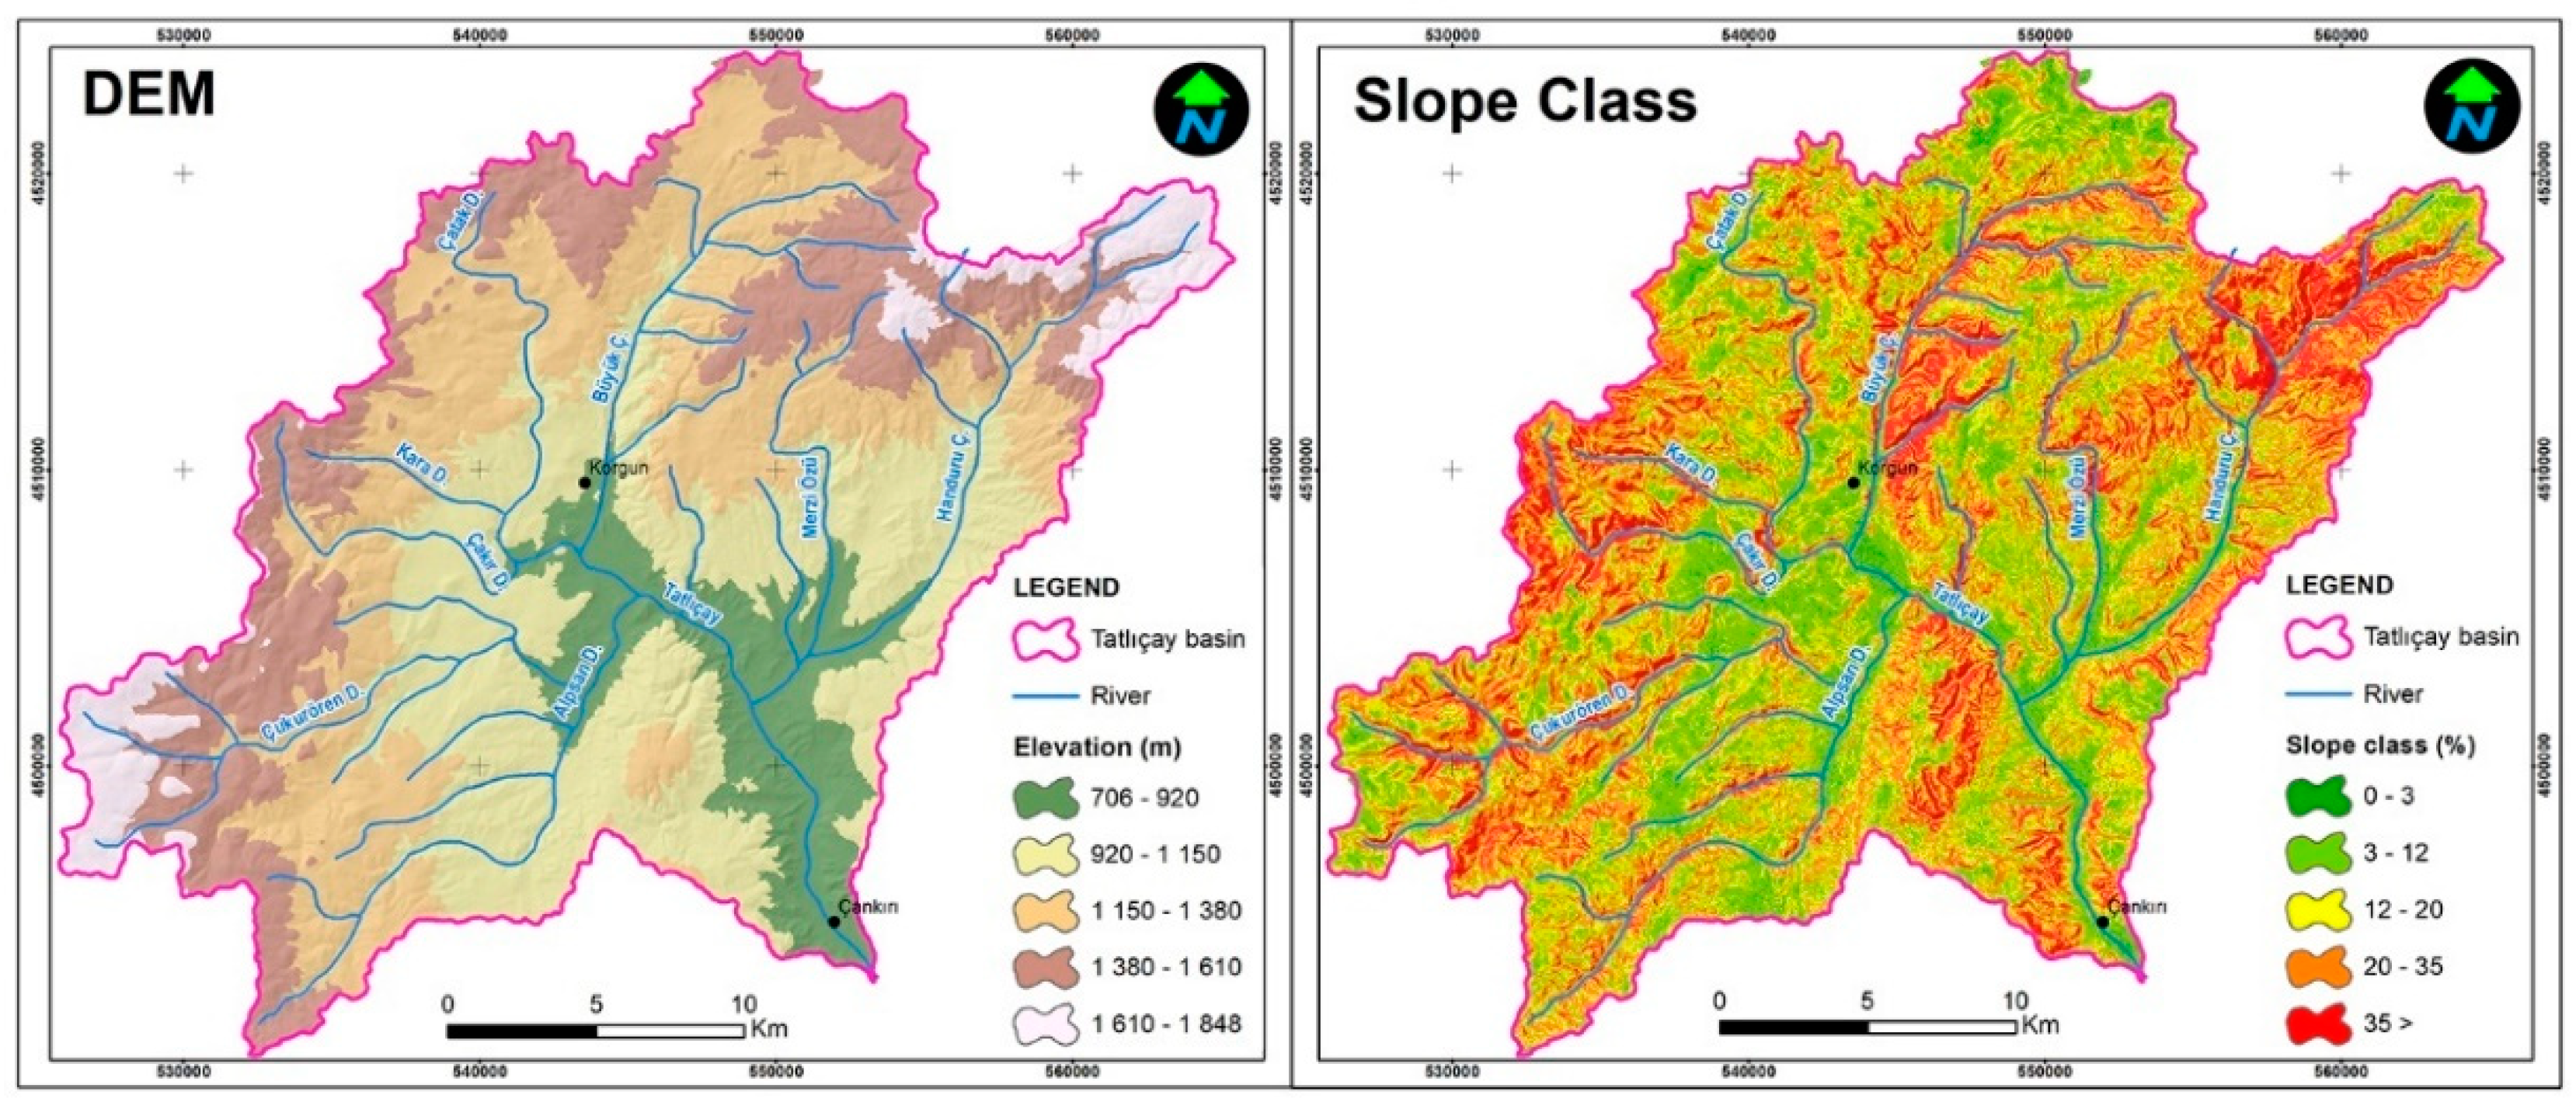
For the study area, 30-m resolution SRTM data from [
34] was used as digital elevation model. The elevations in the Tatlıçay Basin vary from 706 m to 1848 m. Çankırı city is located at the lowest elevation in the basin (
Figure 4).
CORINE data prepared by the European Environment Agency (EAA) in 2018 were used to classify land cover and use in the Tatlıçay Basin [
35].
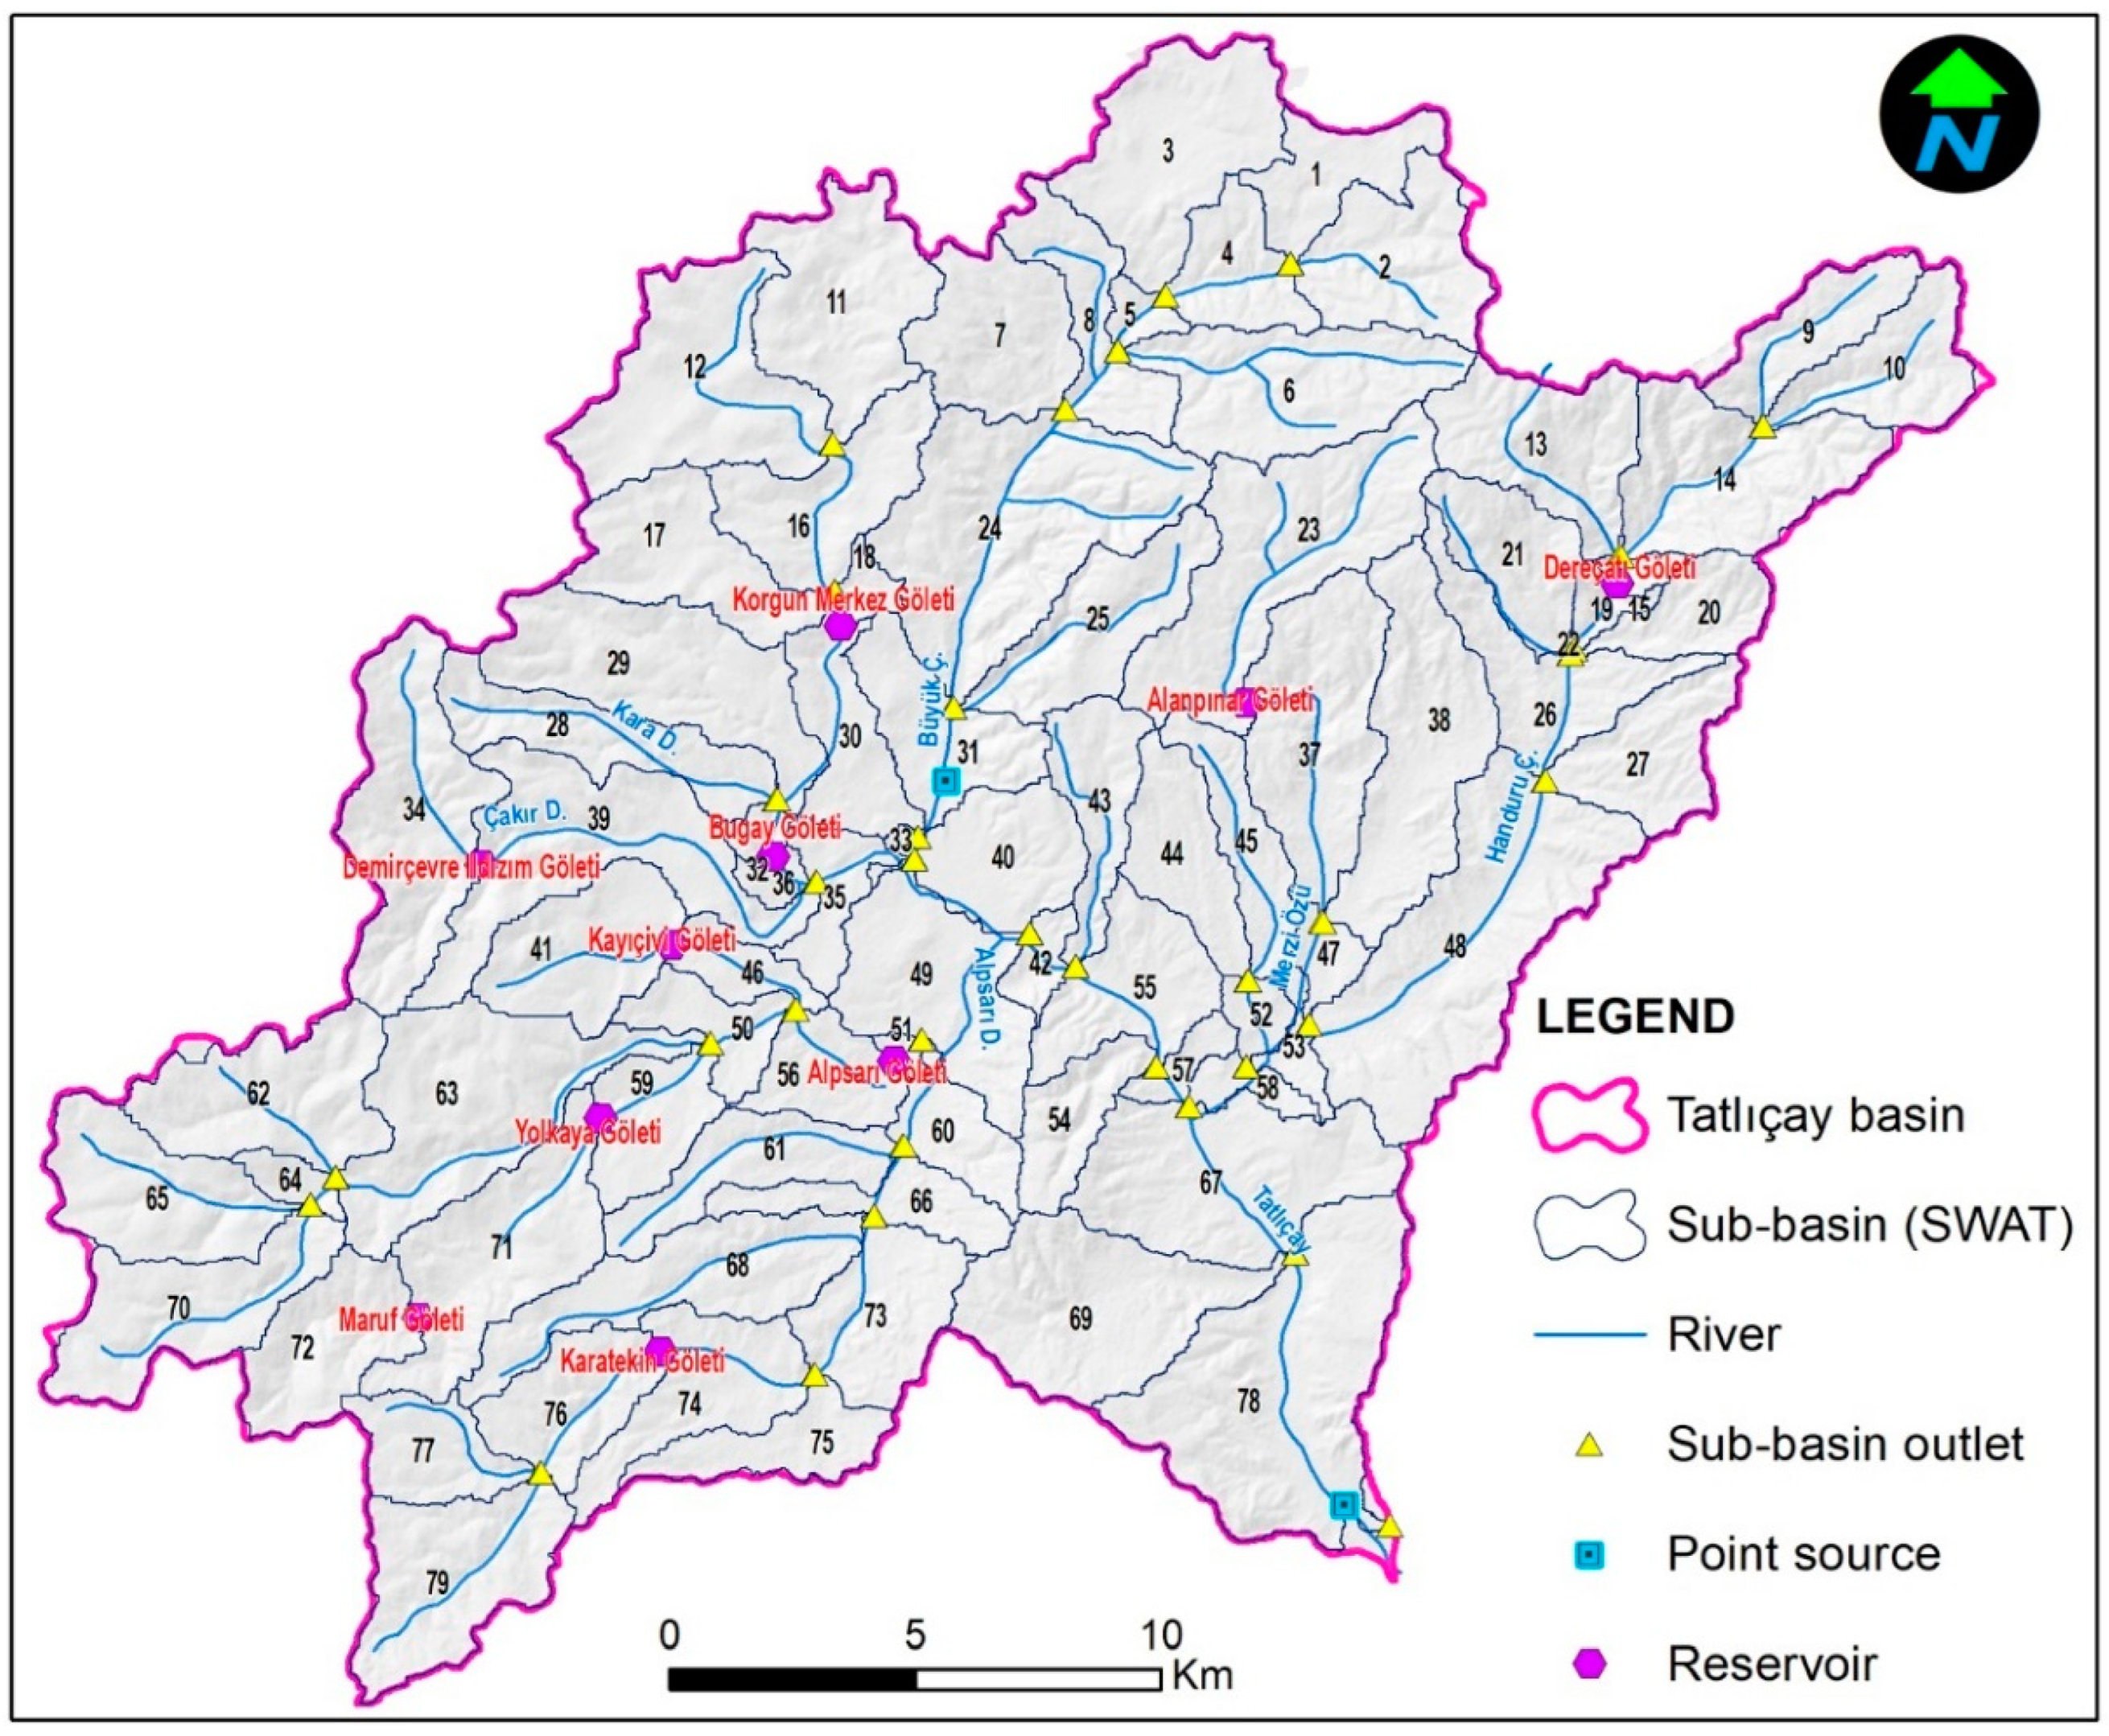
For the Tatlıçay SWAT model, the basin division tool was used with DEM data in the ArcSWAT interface in the stage of dividing the basin. The basin was divided into 79 sub-basins, each with 500 ha area. Two points pollutant discharge points of Korgun and Çankırı settlements and 10 current and planned ponds were defined in the model of the basin (
Figure 5).
2.3.3. HRU definition
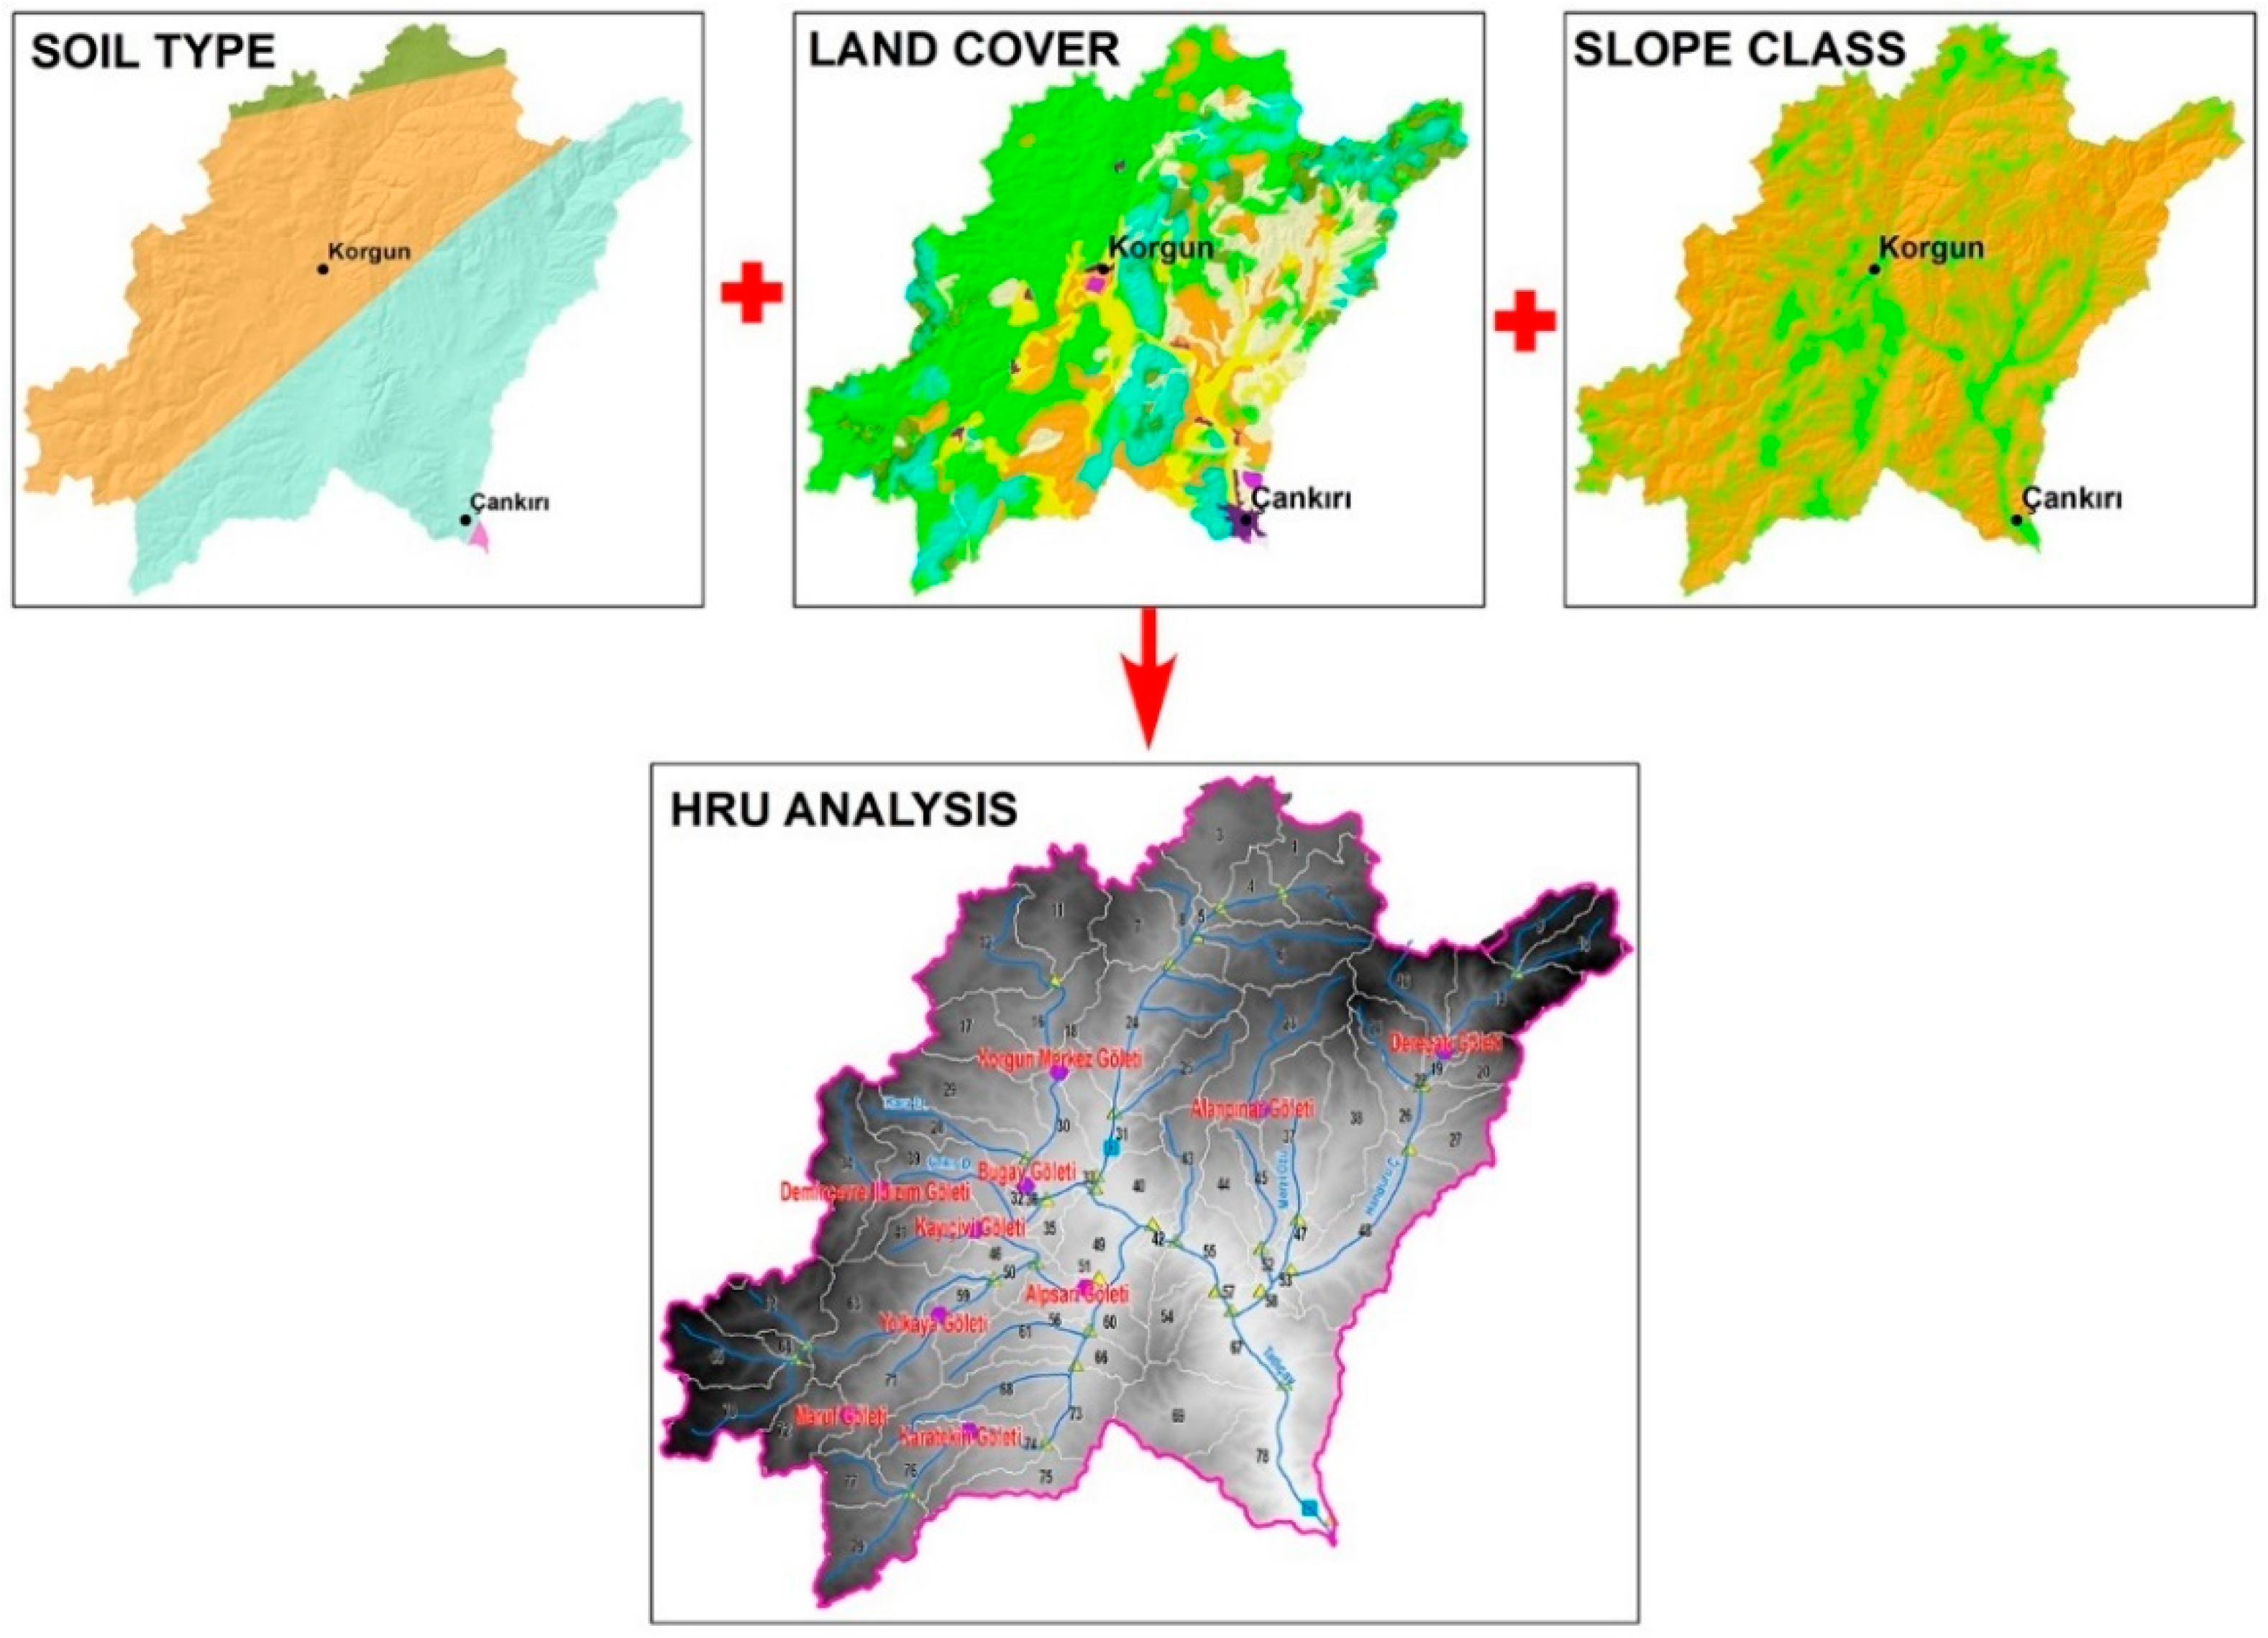
For the Tatlıçay SWAT model, a total of 269 HRU were defined paying attention to land use, slope, soil structure data and spatial distribution [
28]. The criteria used to define HRU and the flow scheme are summarized in
Figure 6.
2.4. Climatic Parameters
In this study, the climatic parameter inputs for the SWAT model were obtained from meteorology station no. 17080 in Çankırı provincial center representing the basin. Hydrometeorological features used included daily rainfall (mm), temperature (max/min
oC), relative humidity (%), wind speed (m/s), solar radiation (MJ/m
2) and evapotranspiration (mm) for the years 2013 to 2020 (
Figure 7).
3. Results
3.1. Sensitivity Analysis, Calibration and Validation
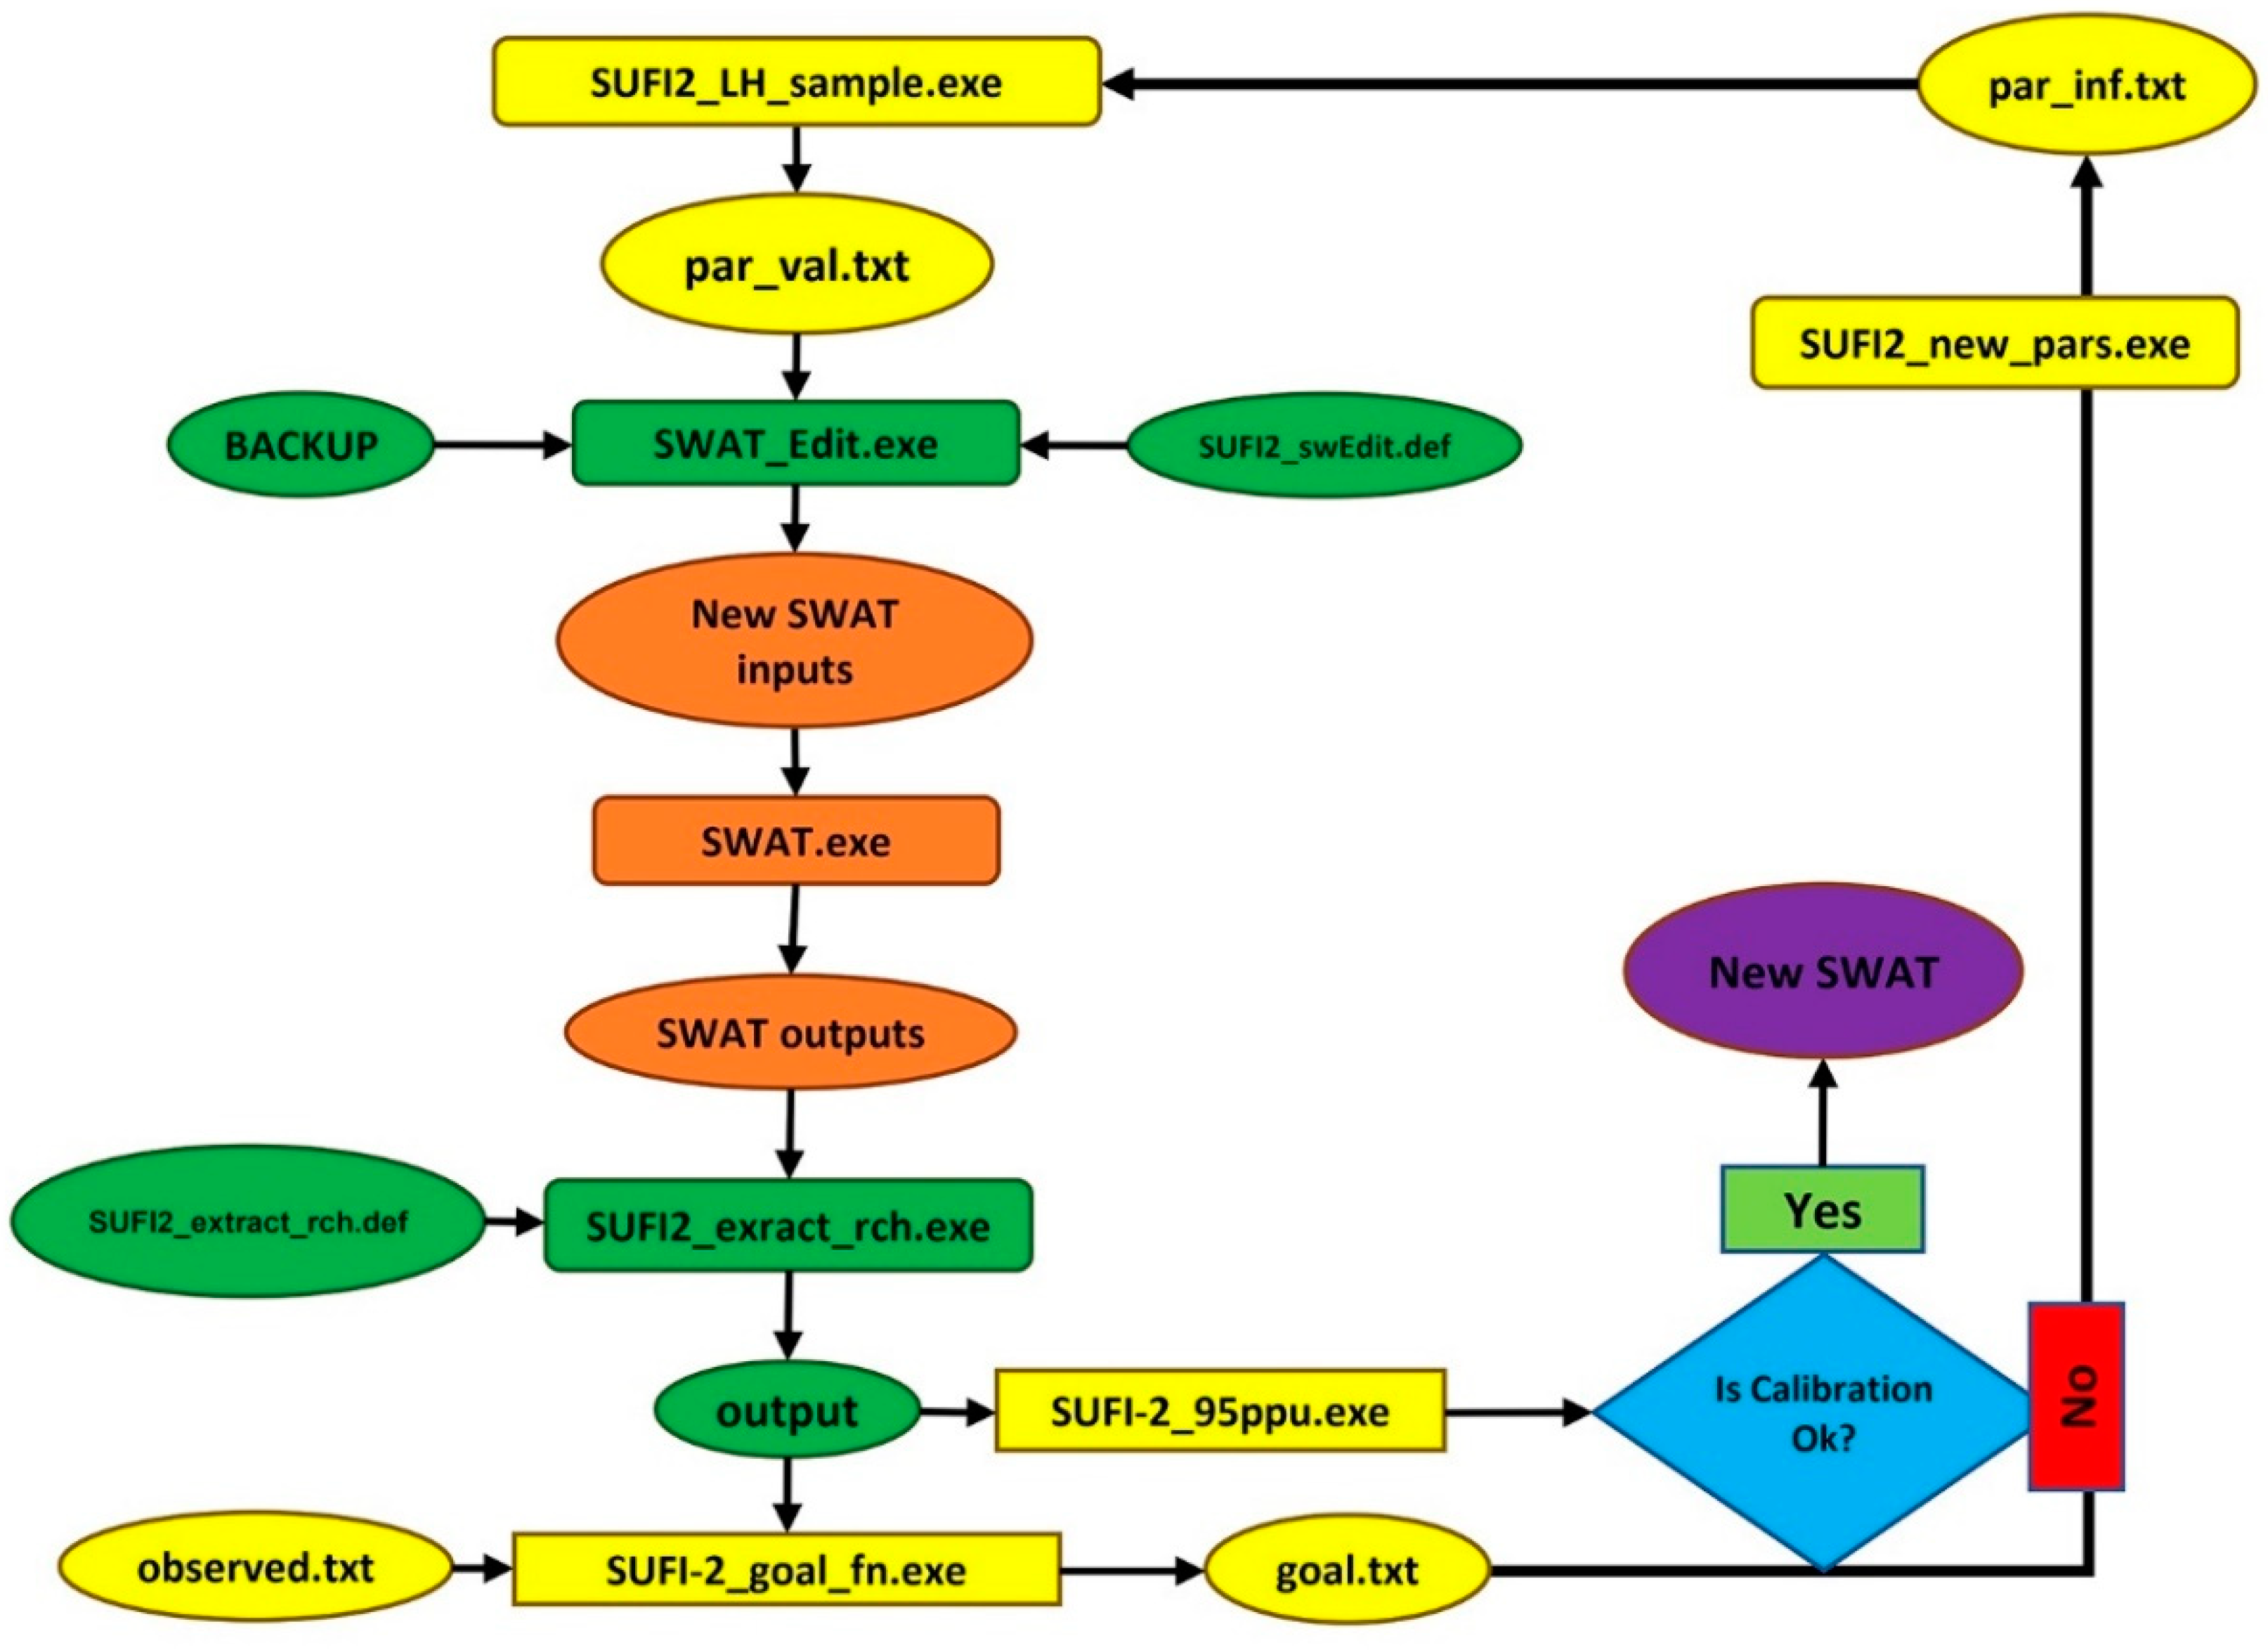
SWAT-CUP software was used for sensitivity analysis, calibration and validation. The SWAT-CUP software ensures analysis of basin parameters in model results with the sequential uncertainty fitting (SUFI-2) algorithm. The uncertainty concept in the SUFI-2 algorithm defines the parameter uncertainty for variables like conceptual model parameters and measured data [
36]. This parameter uncertainty is defined by measures named 95PPU, d factor and p-factor [
37]. The SUFI-2 algorithm in SWAT-CUP operates as shown in
Figure 8.
The identified sensitive parameters are manually changed by (±)10% to (±)20% considering the effect on the natural system in the ArcSWAT software and transferred to the SWAT-CUP software to identify the most appropriate values for the parameters.
With sensitivity analysis, the parameters ALPHA_BF, ESCO, GWQMN, ESCO, SLSUBSN, and HRU_SLP were identified to be sensitive (
Table 4). It appears that these parameters directly affected the surface flow and nutrient matter (TN and TP) burden.
According to the value intervals given in
Table 5, 1000 runs were performed using the SUFI-2 algorithm with SWAT-CUP software and fit values were found.
When the success statistics for the model according to SUFI-2 algorithm in SWAT-CUP software for the time periods for calibration and validation of 2016-2017 and 2018-2019, respectively, are investigated, though the observation data are for a short period, the model appears to provide successful results.
The calibration and validation stages in modelling applications assess the model performance statistics based on connection values between the observed and model outcomes. In hydrological models, it is recommended to use the Nash-Sutcliff efficacy statistic-NSE [
39], coefficient of prominence (R
2) and percentage error statistic (PBIAS), along with both direct and derived statistical methods to more comprehensively assess model performance and ensure reliability of model outputs [
40].
Table 6 gives the interval values for model success statistics for flow and nutrient matter SWAT models.
Using the SUFI-2 algorithm with the SWAT-CUP software, 1000 runs were performed. It was identified that the values obtained as a result of the 792nd run provided the best performance. The performance statistics (R
2, NSE and PBIAS) for the SWAT-CUP models for flow, TN and TP are presented in
Table 7.
4. Discussion
In this study, the sample study area of Tatlıçay river ecosystem located within Çankırı province in the Central Anatolia region of Türkiye was modelled with the hydrological modelling SWAT software. There is no flow monitoring station recording daily in the Tatlıçay Basin. There is one quality monitoring station measuring at monthly periods located at the outlet of the Çankırı basin. The lack of one or more stations providing current daily data over many years lowers model quality. For modelling of the Tatlıçay river ecosystem, the model was set up with flow and nutrient matter (TN and TP) data from the quality monitoring station in Çankırı city center.
4.1. Flow Model
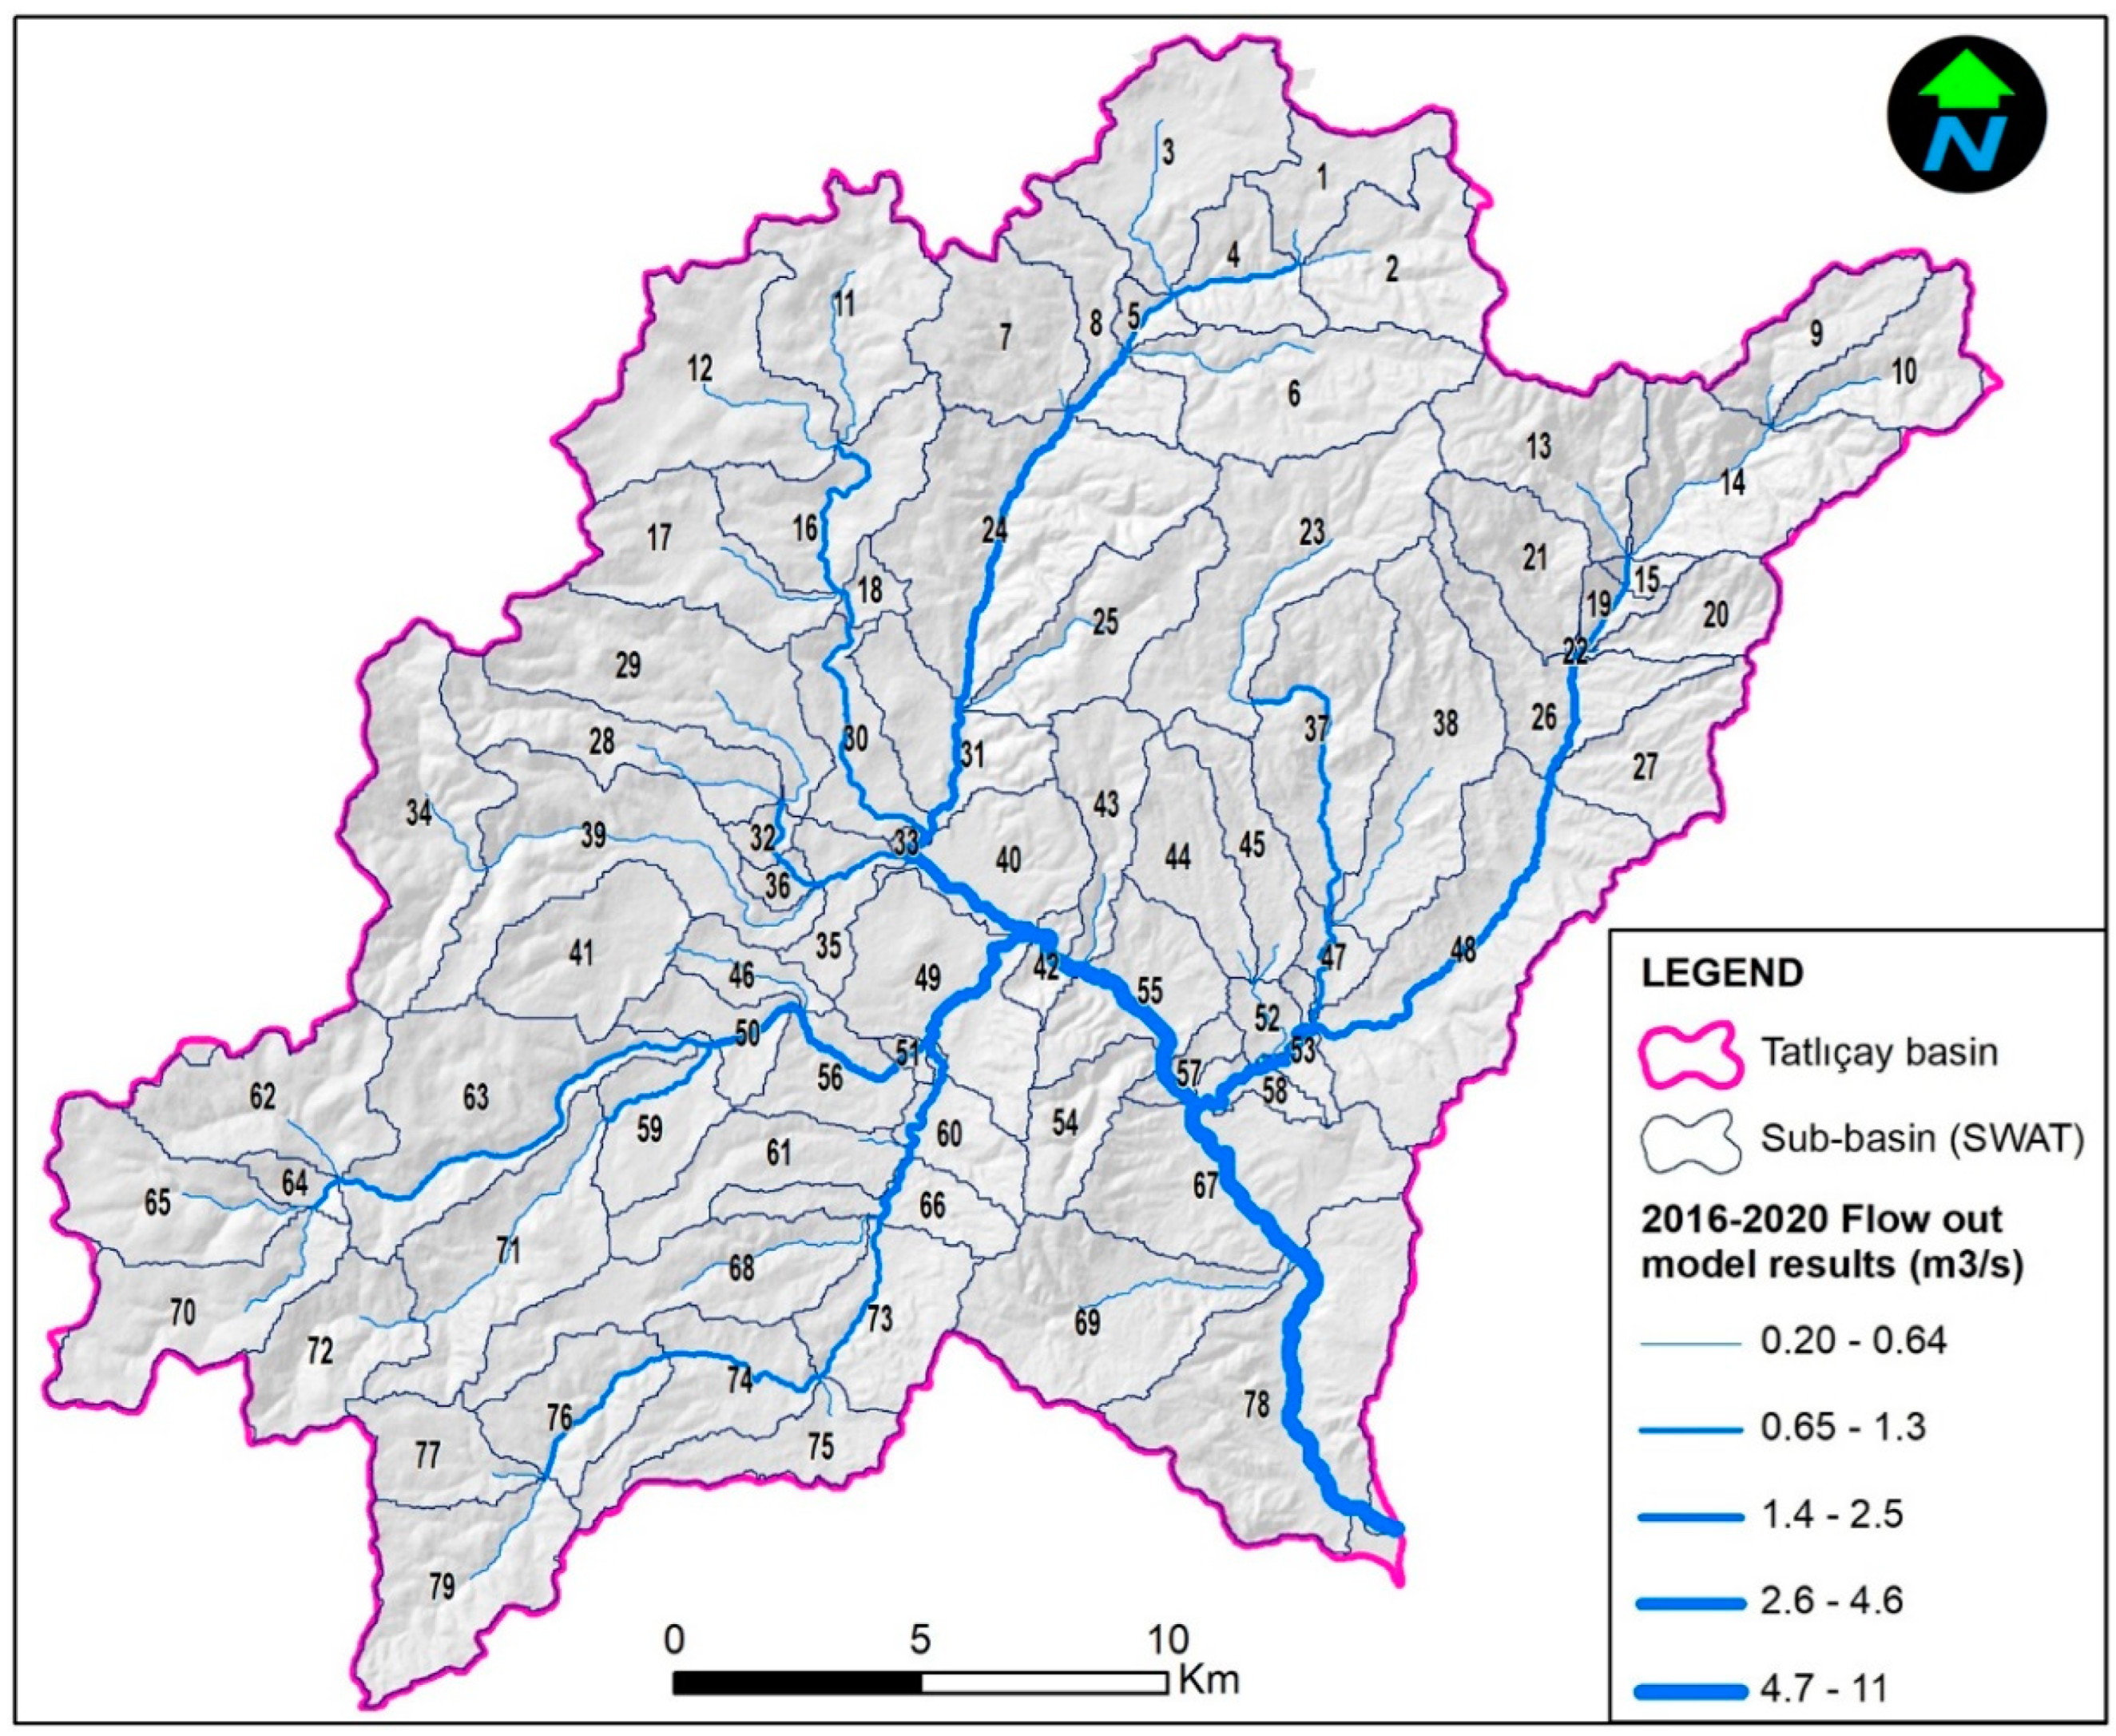
The calibration and validation results for the flow model from 2016-2020 and comparative graph with rainfall are given in
Figure 9. The mean flow distribution for the whole river ecosystem from 2016-2020 is presented in
Figure 10.
The model success statistics for calibration and validation results of the flow model were compared. The R
2 values in the validation stage appeared to increase compared to the calibration stage. This increase in R
2 means that the model’s capacity to estimate the future increased during validation [
42]. In the validation stage, the NSE value appeared to increase compared to the calibration stage. This increase in the NSE value means the accuracy rate for model predictions were higher than during the validation process. The PBIAS value during calibration showed the model data overestimated compared to the observed data. However, though this value reduced in a negative way during the validation stage, it was close to 0 at the end of calibration, so it may be said to make successful predictions [
43].
When flow model results are compared to monthly mean rainfall data from Çankırı Meteorological Monitoring station (MMS), it appears the flow in the river ecosystem was compatible with rainfall data (see
Figure 9). Considering the whole river ecosystem given in
Figure 10, the continuation of regular accumulation of flow in all river tributaries supports this situation.
4.2. Nutrient (TN and TP) Pollution Model Findings
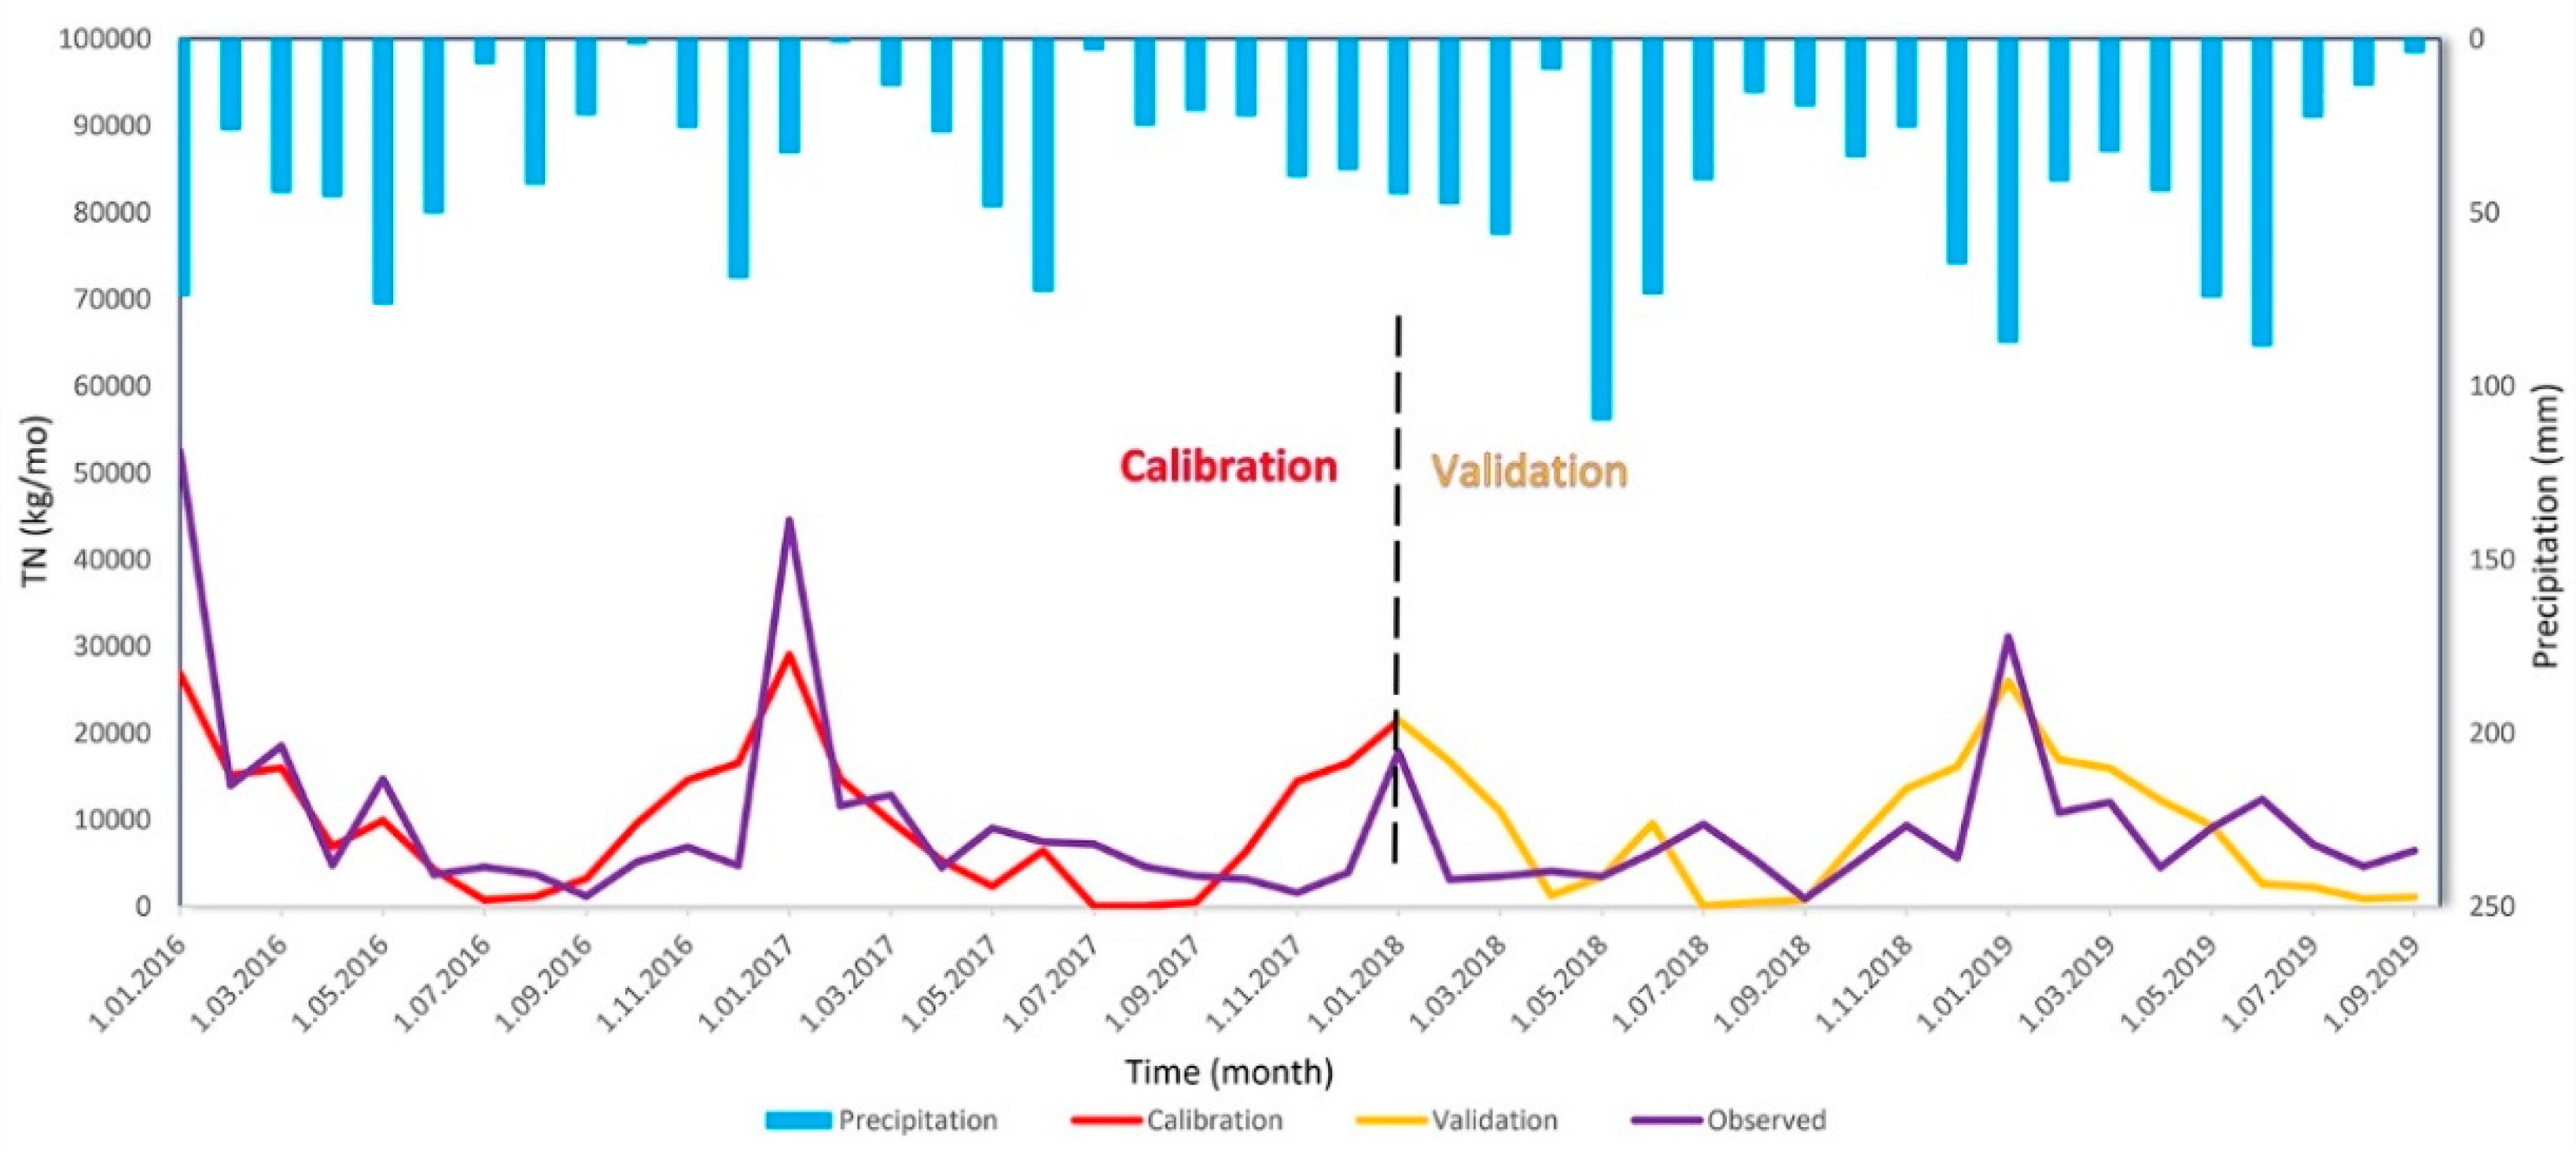
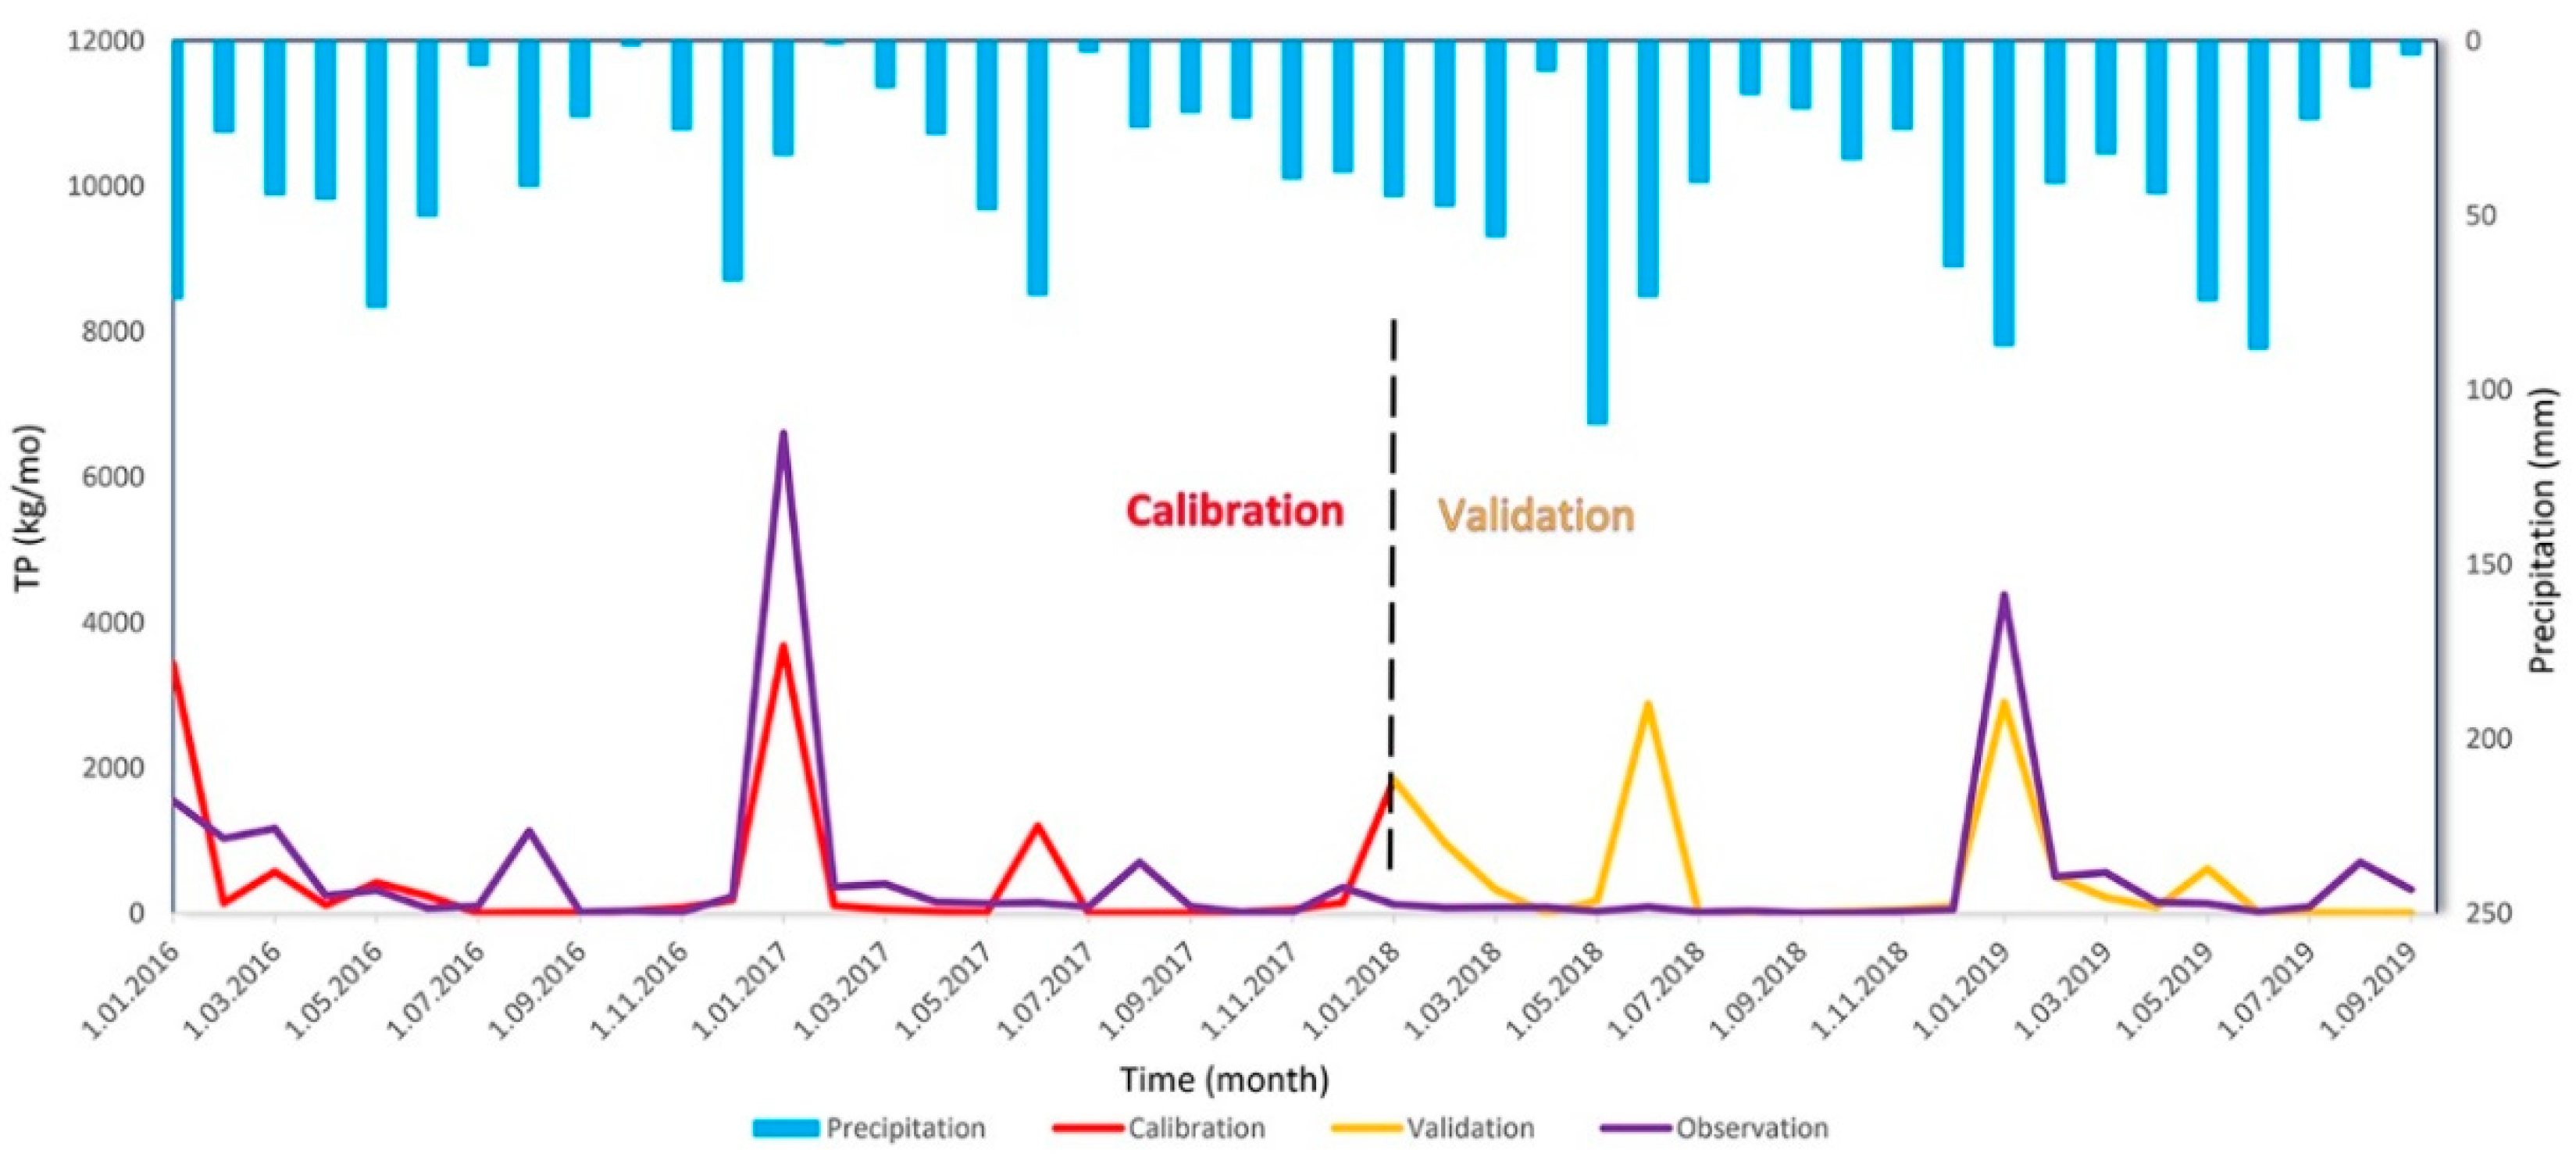
The calibration and validation results for the TN model from 2016-2020 and comparison with rainfall graphs are given in
Figure 11, with the same comparison for the TP model given in
Figure 12.
When the model statistics for calibration and validation results for the TP and TN models are compared, the R
2 value in the validation stage appears to reduce compared to the calibration stage. This means the model had reduced estimation capacity for the future [
44]. The NSE value in the validation stage was calculated to be lower compared to the calibration stage. This situation was accepted as valid considering other statistical performances due to the shortness of the model period, though it means there were deviations in the predictions. In the calibration stage, the PBIAS value showed predictions were at higher values than the observed data, while in the validation stage, values were predicted to be much lower than the observed values.
When the TN and TP model results are compared with the monthly mean rainfall data from Çankırı MMS, it appears the TN and TP in the river ecosystem were not compatible with the rainfall data (see
Figure 11 and
Figure 12). Considering the whole river system, the TN and TP burden in all stream tributaries increased in town centers and in the main branch of the Tatlıçay with low slope.
This modelling study obtained successful results in the calibration and validation process with very few observed data. When the model results are assessed, it appears the sources of the TN and TP burden in the Tatlıçay are anthropogenic effects like agricultural activities and urban discharge [
43,
45,
46].
5. Conclusions
This section is not mandatory but can be added to the manuscript if the discussion is unusually long or complex.
Water is one of the most important headings in the environmental health area. This study was performed with the aim of presenting alternative solution recommendations and investigating the behavior of water in nature, distribution and sources of pollutants disrupting water quality by using a hydrological model for prediction and monitoring of problems that may occur related to water quality. In line with this a SWAT model was calibrated and validated with acceptable error statistics for the Tatlıçay river ecosystem. Model calibration studies obtained high accuracy rate even for the Tatlıçay basin, with few measurement stations providing flow and water quality data. A model emerged that may produce effective solutions in future scenarios and in negative situations that threaten environmental health.
The topic of hydrological modelling with high accuracy, even in areas where water quality cannot be measured or is difficult to measure, is included in the literature mainly in engineering fields like hydrology, hydrogeology, construction and environmental engineering. Additionally, hydrological modelling with water quality studies are included in the global environmental health literature. However, in Türkiye, there are academic studies about determining point water quality in certain regions and national and local projects like the Environmental Health Information System. With this research, a great contribution is offered to the environmental health literature, with very few examples in Türkiye about the topic of hydrological modelling. Additionally, hydrological models included in ecosystem-based water quality management will benefit the development of information systems for national and local administrations.
Due to surface water models being dynamic, accuracy rates of predictions should be improved by long-term daily or monthly flow and water quality measurements. Additionally, uncertainties should be resolved and effect assessments should be performed for pollutant sources disrupting environmental health.
The model results show the causes of poor water quality in the Tatlıçay river system are urban discharge and agricultural use. To prevent these causes of poor water quality in the Tatlıçay basin, it is recommended to construct packet water treatment facilities in settlement areas with dense population and water treatment facilities according to future population projections for Çankırı provincial center. Additionally, it is recommended to perform good agricultural practices for fertilization and irrigation implementations during agricultural activities.
Author Contributions
This study is an original research article that has been prepared for publication by compiling the outstanding results of the master's thesis titled as “Application of SWAT Model In Water Quality Assessment In The Lotic Ecosystem: A Case Study In Tatlıçay Basin (Çankırı, Türkiye)” conducted by the first author Eren Germeç, under the supervision of Okan Ürker. All authors contributed to the study conception and design. Material preparation, data collection and analysis were performed by Eren Germeç and Okan Ürker. The first draft of the manuscript was written by Eren Germeç and all authors commented on previous versions of the manuscript. All authors read and approved the final manuscript. Research and publication ethics were complied with during the study. We declare that the figure or figures obtained from external sources within the study are materials that do not require copyright permission, by citing the relevant source.
Funding
“The authors declare that no funds, grants, or other support were received during the preparation of this manuscript.”
Institutional Review Board Statement
“Not applicable”
Informed Consent Statement
“Not applicable”
Data Availability Statement
The data used to support the findings of this study are included within the manuscript. The datasets generated during and/or analysed during the current study are available from the corresponding author on reasonable request.
Acknowledgements
We are very grateful to PhD Hatice Kılıç Germeç for her help during modelling and desktop work. We thank the Republic of Türkiye, the General Directorate of State Hydraulic Works (DSI) and Çankırı Municipality for scientific work permits and logistic support.
Conflicts of Interest
The authors declare that they do not have any conflict of interest. The authors declare that they have no known competing financial interests or personal relationships that could have appeared to influence the work reported in this paper.
References
- Saha, P.P.; Zeleke, K; Hafeez, M. Streamflow modeling in a fluctuant climate using SWAT: Yass River catchment in south eastern Australia. Environ Earth Sci. 2014, 71, 5241–5254. [CrossRef]
- Song, X; Zhang, J.; Zhan, C.; Xuan, Y.; Ye, M.; Xu, C. Global Sensitivity Analysis in Hydrological Modeling: Review of Concepts, Methods, Theoretical Framework, and Applications. Journal of Hydrolology 2015, 523, 739-757. [CrossRef]
- WHO. Mortality rate attributable to unsafe water, sanitation, and hygiene. 2022. Available online: https://ourworldindata.org/grapher/mortality-rate-attributable-to-wash (accessed on 10 November 2022).
- Germeç, E.; Ürker, O. Hydrological Modeling in Environmental Health: Role, Significance and Comparative Analysis of Application Methods. Review. The Turkish Journal of Health Science and Life 2020, 3 (3), 12-18. Retrieved from https://dergipark.org.tr/tr/pub/tjhsl/issue/59044/760115.
- Gleick, P.H. Water resources. In Encyclopedia of Climate and Weather. Oxford University Press. New York, USA, 1996; pp. 42-86.
- Singh, V.P.; Frevert, D.K. Watershed Models. CRC Press, New York, USA, 2010; 28, 678-678.
- FISRWG. Federal Interagency Stream Corridor Restoration Working Group. Stream Corridor Restoration. Principles, Processes, and Practices. USA, 2001; pp. 653. ISBN-0-9342 13-59-3.
- Gleick, P.H. Water in Crisis: A Guide to the World's Fresh Water Resources. Oxford University Press. New York, USA, 1993; pp. 504.
- Wang, G.; Li, S.B.; Qi, C.; Ding, F. A Review of Surface Water Quality Models. The Scientific World Journal 2013, vol. 2013. [CrossRef]
- Abell, J.M.; Hamilton, D.P.; Rutherford, J.C. Quantifying temporal and spatial variations in sediment, nitrogen and phosphorus transport in stream inflows to a large eutrophic lake. Environ. Sci.: Processes Impacts 2013, 15, 1137–1152. [CrossRef]
- Serengil, Y.; Augustaitis, A.; Bytnerowicz, A.; Grulke, N.; Kozovitz, A.R.; Matyssek, R.; Müller-Starck, G.; Schaub, M.; Wieser, G.; Aydin Coskun, A.; Paoletti, E. Adaptation of forest ecosystems to air pollution and climate change: a global assessment on research priorities. iForest 2011, 4: 44-48. [CrossRef]
- Wu, H.; Chen, B. Evaluating uncertainty estimates in distributed hydrological modeling for the Wenjing River watershed in China by GLUE, SUFI-2, and ParaSol methods. Ecol. Eng. 2015, 76, 110–121. [CrossRef]
- Wang, G.; Jager, H.I.; Baskaran, L.M.; Baker, T.F.; Brandt, C.C. SWAT Modeling of Water Quantity and Quality in the Tennessee River Basin, Spatiotemporal Calibration and Validation. Hydrology and Earth System Sciences Discussion 2016, 1, 33. [CrossRef]
- Koltsida, E.; Mamassis, N.; Kollioras, A. (2023) Hydrological modeling using the Soil and Water Assessment Tool in urban and peri-urban environments: the case of Kifisos experimental subbasin (Athens, Greece). Hydrology and Earth System Sciences 2023, 27, Issue-4, 917–931. [CrossRef]
- Gassman, P.W.; Reyes, M.R.; Green, C.H.; Arnold, J.G. The soil and water assessment tool: Historical development, applications, and future research directions. Transactions of the ASABE 2007, 50, No. 4, 1211–1250. [CrossRef]
- Neitsch, S.L.; Arnold, J.G.; Kiniry, J.R.; Williams, J.R. SWAT (Soil and Water Assessment Tool) Theoretical Documentation Version 2009. Texas Water Resources Institute Technical Report No. 406 Texas A&M University System, College Station, Texas, 2011, 77843-2118.
- Qiu, L.; Zheng, F.; Yin, R. SWAT-based runoff and sediment simulation in a small watershed, the loessial hilly-gullied region of China: capabilities and challenges. International Journal of Sediment Research 2012, 27, 226-234. [CrossRef]
- Jalowska, A.M.; Yuan, Y. Evaluation of SWAT Impoundment Modeling Methods in Water and Sediment Simulations. Journal of The American Water Resources Association 2018, 1–19. [CrossRef]
- Gassman, P.W.; Sadeghi, A.M.; Srinivasan, R. Applications of the SWAT Model Special Section, Overview and Insights. Journal of Environmental Quality 2014, 43, (1): 1–8. [CrossRef]
- Saddiqi, M.M.; Karpuzcu, M.E. Modeling of Lesser Meander Sub-Basin with SWAT. Çukurova University Journal of the Faculty of Engineering and Architecture 2019, 34 (4), 55-69, (In Turkish).
- Guse, B.; Reusser, D.E.; Fohrer, N. How to improve the representation of hydrological processes in SWAT for a lowland catchment – temporal analysis of parameter sensitivity and model performance. Hydrol. Process. 2014, 28, 2651–2670. [CrossRef]
- Me, W.; Abell, J.M.; Hamilton, D.P. Effects of hydrologic conditions on SWAT model performance and parameter sensitivity for a small, mixed land use catchment in New Zealand. Hydrol. Earth Syst. Sci. 2015, 19, 4127–4147. [CrossRef]
- Panagopoulos, Y.; Makropoulos, C.; Baltas, E.; Mimikou, M. SWAT parameterization for the identification of critical diffuse pollution source areas under data limitations. Ecological Modelling 2011, 222, No. 19, 3500–3512. [CrossRef]
- Irvem, A.; El-Sadek, A. Evaluation of Streamflow Simulation by SWAT Model for The Seyhan River Basin Seyhan. Çukurova J. Agric. Food Sci. 2018, 33 (2), 99-110.
- DSI (General Directorate of Water Affairs). Kızılırmak Basin Master Plan Report Preparation, Basin Master Plan Final Report, Dolsar Engineering, Türkiye, 2019; pp. 186-213, (In Turkish).
- Soil&Water Resources of DSI (General Directorate of Water Affairs). Available online: https://www.dsi.gov.tr/Sayfa/Detay/754 (accessed on 1 October 2022, In Turkish).
- Zhang, N.; He, H.M.; Zhang, S.F.; Jiang, X.H.; Xia, Z.Q.; Huang, F. Influence of Reservoir Operation in the Upper Reaches of the Yangtze River (China) on the Inflow and Outflow Regime of the TGR-Based on the Improved SWAT Model. Water Resources Management 2012, 26 (3): 691–705. [CrossRef]
- Her, Y.; Frankenberger, J.; Chaubey, I.; Srinivasan, R. Threshold Effects in HRU Definition of the Soil and Water Assessment Tool. Transactions of the American Society of Agricultural and Biological Engineers 2015, 58 (2): 367–78. [CrossRef]
- Raes, D. Reference Manual – ETo (Evapotranspiration from a reference surface) Calculator (Version 3.2, September 2012), FAO, Available online: https://www.ipcinfo.org/fileadmin/user_upload/faowater/docs/ReferenceManualV32.pdf (accessed on 1 August 2023).
- Nachtergaele, F.O.; van Velthuizen, H.T.; Verelst, L. Harmonized World Soil Database. FAO, Rome, Italy, and IIASA, Laxenburg, Austria (March 2009), Available online: https://www.fao.org/soils-portal/data-hub/soil-maps-and-databases/harmonized-world-soil-database-v12/en/ (accessed on 1 August 2023).
- FAO-UNESCO. Digital soil map of the world (DSMW), and derived soil properties. Rome, Italy: FAO, 2003. Available online: https://www.fao.org/land-water/land/land-governance/land-resources-planning-toolbox/category/details/en/c/1026564/ (accessed on 1 August 2023).
- TUIK. Türkiye 2040 Population Projections. Available online: tuik.gov.tr (accessed on 1 December 2022).
- TUIK. Address Based Population Registration System Results. Available online: tuik.gov.tr (accessed on 1 December 2022).
- USGS. Shuttle Radar Topography Mission (SRTM) 1 Arc-Second Global 2017, Rev.202. [CrossRef]
- EEA. (2020) CORINE Land Cover (CLC) 2018, Version 2020_20u1. Available online: https://www.copernicus.eu/en/access-data/copernicus-services-catalogue/corine-land-cover-2018-vector-version-202020u1-may-2020 (accessed on 1 August 2023).
- Athira, P.; Sudheer, K.P. Calibration of distributed hydrological models considering the heterogeneity of the parameters across the basin: a case study of SWAT model. Environmental Earth Sciences 2021, 80:13. [CrossRef]
- Abbaspour, K.C.; Vejdani, M.; Haghighat, S. (2007) SWATCUP calibration and uncertainty programs for SWAT. In Proc. Intl. Congress on Modelling and Simulation (MODSIM’07), L. Oxley and D. Kulasiri, eds. Melbourne, Australia: Modelling and Simulation Society of Australia and New Zealand, 2007; 1603-1609.
- Abbaspour, K.C. Calibration of hydrologic models: when is a model calibrated? In Zerger, A. and Argent, R.M. (eds) MODSIM 2005 International Congress on Modeling and Simulation. Modelling and Simulation Society of Australia and New Zealand, pp. 2449-12445. ISBN: 0-9758400-2-9. http://www.mssanz.org.au/modsim05/papers/abbaspour.pdf (December 2005).
- Nash, J.E.; Sutcliffe, J.V. River Flow Forecasting through Conceptual Model. Part 1—A Discussion of Principles. Journal of Hydrology 1970, 10, 282-290. http://dx.doi.org/10.1016/0022-1694(70)90255-6.
- Moriasi, D.N.; Zeckoski, R.W.; Arnold, J.G.; Baffaut, C.B.; Malone, R.W.; Daggupati, P.; Guzman, J.A.; Saraswat, D.; Yuan, Y.; Wilson, B.W.; Shirmohammadi, A.; Douglas-Mankin, K.R. Hydrologic and Water Quality Models: Key Calibration and Validation Topics. Transactions of the ASABE 2015, 58, 1609-1618. [CrossRef]
- Moriasi, D.N.; Arnold, J.G.; Van Liew, M.W.; Bingner, R.L.; Harmel, R.D.; Veith, T.L. Model Evaluation Guidelines for Systematic Quantification of Accuracy in Watershed Simulations. Transactions of the ASABE 2007, 50, 885-900. http://dx.doi.org/10.13031/2013.23153.
- Hasan, M.A.; Pradhanang, S.M. Estimation of flow regime for a spatially varied Himalayan watershed using improved multi-site calibration of the Soil and Water Assessment Tool (SWAT) model. Environmental Earth Sciences 2017, 76:787. [CrossRef]
- Cai, Y.; Zhang, F.; Shi, J.; Johnson, V.C.; Ahmed, Z.; Wang, J.; Wang, W. Enhancing SWAT model with modified method to improve Eco-hydrological simulation in arid region. Journal of Cleaner Production 2023, 403, 136891. [CrossRef]
- Rathjens, H.; Kiesel, J.; Winchell, M.; Arnold, J.; Ratchens, R.S. Technical note: Extending the SWAT model to transport chemicals through tile and groundwater flow. Hydrol. Earth Syst. Sci. 2023, 27, 159–167, 2023. [CrossRef]
- Allen, R.G.; Pereira, L.S.; Raes, D.; Smith, M. Crop evapotranspiration, guidelines for computing crop water requirements. FAO Irrig. and Drain. Paper 56, Food and Agric. Orgn. of the United Nations, Rome, Italy, 1998; 300 pp.
- Sharma, A.; Patel, P.L.; Sharma, P.J. Influence of climate and land-use changes on the sensitivity of SWAT model parameters and water availability in a semi-arid river basin. CATENA 2022, 215, 106298. [CrossRef]
|
Disclaimer/Publisher’s Note: The statements, opinions and data contained in all publications are solely those of the individual author(s) and contributor(s) and not of MDPI and/or the editor(s). MDPI and/or the editor(s) disclaim responsibility for any injury to people or property resulting from any ideas, methods, instructions or products referred to in the content. |
© 2023 by the authors. Licensee MDPI, Basel, Switzerland. This article is an open access article distributed under the terms and conditions of the Creative Commons Attribution (CC BY) license (http://creativecommons.org/licenses/by/4.0/).


