
You are currently viewing a beta version of our website. If you spot anything unusual, kindly let us know.
Preprint
Article
Stakeholders’ Perceptions of How Nurse-Doctor Communication Impacts Patient Care: A Concept Mapping Study
Altmetrics
Downloads
94
Views
34
Comments
0
A peer-reviewed article of this preprint also exists.


This version is not peer-reviewed
Abstract
There is some evidence that aspects of nurse-doctor communication are associated with the quality of care and treatment patients receive whilst they are in hospital. To date, no studies have examined stakeholder perceptions of how patient care is influenced by clinical communication between nurses and doctors. We conducted a concept mapping study to generate a deep understanding of how clinical communication impacts patient care. Concept mapping has six phases: preparation, idea generation, structuring, representation, interpretation, and utilization. Twenty patients, 21 nurses, and 21 doctors participated in the study. Brainstorming generated 69 discreet statements about how nurse-doctor communication impacts patient care. The structuring (rating and clustering) phase was completed by 48 participants. The data interpretation workshop selected a five-cluster solution: effective communication, trust, patient safety, impediments to patient care, and interpersonal skills. On the final concept map, the five clusters were arranged in a circle around the center of the map. Clusters were relatively equal in size suggesting, each concept makes a broadly equal contribution to how nurse-doctor communication influences patient care. Our study suggests that there are multiple aspects of clinical communication that impact patient care. Candidate interventions to enhance nurse-doctor communication may need to consider the complex nature of interprofessional working.
Registration: This study was prospectively registered with the Open Science Framework (OSF) (https://osf.io/9np8v/) prior to recruiting the first participant.
Keywords:
Subject: Public Health and Healthcare - Public Health and Health Services
Introduction
Nurses and doctors spend more time than any other professional groups providing direct patient care [1,2], spending on average between a quarter to half of their practice hours in this activity [3,4,5]. Around 90% of the care patients receive whilst they are in hospital are from nurses and doctors [1]. There is considerable overlap in the scope of practice between nurses and doctors underscoring the importance of effective and accurate interdisciplinary communication [6,7,8]. Patient care may be negatively impacted when nurse-doctor communication is inaccurate, distorted, or delayed [7,8].
Several authors have investigated the association between the quality of nurse-doctor communication and patient outcomes [9,10,11,12,13]. For example, Swiger et al. (2017) conducted a systematic review of 46 studies of nurse-doctor communication of which 14 were focused on associations with patient outcomes. The narrative synthesis indicated there was seemingly a consistent association between the quality of communication and reduced rates of medication errors and hospital-acquired pressure ulcers [13]. Kang et al. (2020) examined the association between the quality of nurse-doctor communication, determined using the Practice Environment Scale of the Nursing Work Index (PES-NWI), and 30-day mortality in surgical patients. The study involved 29,391 nurses and 1.32 million patients from 665 acute care hospitals (Kang et al., 2020). The authors report a one-unit increase in the quality of nurse-doctor communication was associated with a 5% reduction in hospital mortality [12].
Few studies have examined the association between the amount of nurse-doctor communication and patient outcomes [14,15,16,17] reporting inconsistent findings. Higgins et al. (1999), for example, reported no association between the amount of nurse-doctor communication and mortality and readmission in 175 patients admitted to Intensive Care. Conversely, Baggs et al. (1992) did report an association between the amount of nurse-doctor communication and patient outcomes. Rothberg et al. (2012) demonstrated an association between the amount of time doctors spend communicating with nurses and levels of agreement on patient care plans. However, there is a paucity of evidence that has examined how nurse-doctor communication impacts patient care. Developing a deeper understanding may inform the development of strategies to enhance interdisciplinary working [18].
Methods
Concept mapping is a mixed methods design extensively used to develop an understanding of complex problems [19,20]. There are six phases to concept mapping: preparation, idea generation (brainstorming), structuring (prioritization and clustering), representation (generation of concept map), interpretation, and utilization.
A protocol describing the methodology for this study has been previously reported [21]. We provide key details of the six phases of concept mapping that we followed.
Phase 1, Preparation
The aim of the first phase is to determine stakeholder groups that will be involved in the research and establish a focus question for the study. The three-stakeholder groups identified were patients, nurses, and medical doctors. The focus question was developed and refined through consultation with representatives of each of the stakeholder groups and members of the research team. We arrived at the focus question ‘How does nurse-doctor communication impact patient care?’
Stakeholder groups
For this research, we defined each of the three stakeholder groups as follows: we considered a patient to be anyone over the age of 18 that had been an inpatient in a medical or surgical ward for at least 24 hours within the last twelve months. Nurses and doctors were defined as registered health workers that spent at least one full day a week providing direct patient care in any clinical setting.
Recruitment and consent
We recruited participants by posting information about the research on various social media platforms (Supplementary Document S1, is the social media advert used for the study) including the “Doctors in Australia”, and “The Nurse break” social media groups. People interested in taking part in the research were asked to contact the study researcher who sent by email the participant information and consent form and arranged a meeting to explain the study and address any questions that they may have about the research. This conversation included a discussion about the possible risks associated with participating.
Participants willing to take part in the research provided an online electronic consent procedure using REDCap (Research Data Capture). We checked consent with all participants before each phase of concept mapping.
Immediately following the consent procedure participants were invited to provide basic demographic information (requested information listed in the protocol, Pantha et al., (2021)) by completing an online survey using REDCap.
Phase 2, Statement generation (Brainstorming)
Statement generation was conducted via video-conferenced individual interviews. The audio component of the interview was retained. Participants were asked to respond to the focus question, ‘How does nurse-doctor communication impact patient care?’ The researcher would invite participants to elaborate on responses by asking supplementary questions (e.g., can you tell me a bit more about...).
Each interview was listened to by a researcher, up to three times, to identify candidate statements. A statement was considered a sentence or phrase containing a single topic, that was easy to understand and did not contain any jargon or acronyms [22]. Statements from all study participants were then combined into a single document and duplicate or essentially similar statements were merged into a single item. Statements that did not relate to the focus question were removed. Statement reduction continued until there were fewer than 98 (the maximum number that can be analyzed by the concept mapping software we used).
Phase 3, Structuring of statements
Structuring of statements required participants to complete two tasks - prioritization and clustering - both undertaken using the online concept mapping software package “Ariadne”.
During the prioritization task, each statement was ranked on a five-point Likert scale from one, (least important) to five (most important). Participants were instructed to ensure that each point on the scale had an equal number (or as close to equal as was possible, if the number of statements was not divisible by five) of statements.
For the clustering task, participants were asked to group statements that seemed to belong together in up to 10 groups. Participants were advised that all statements cannot be piled up into a single cluster and there cannot be a ‘miscellaneous’ group. Additionally, they were asked to generate a label for each cluster.
Study participants were sent a link and a step-by-step guide (doi.org/10.26181/5f43450ce2999) to complete the structuring tasks. A follow-up email was sent after three days to check if there were any issues or problems completing the tasks or if additional support was required. If participants did not complete the task up to three reminder emails were sent.
Phase 4, Representation of the statements
In this phase, a series of candidate concept maps are generated from the clustering data using the “Ariadne” software package. There are three steps to data analysis: 1. Group Similarity Matrix, 2. Principal Component Analysis and 3. Hierarchical Cluster Analysis [23]. Clustering data are coded as a binary response (‘1′ when two statements are grouped, and ‘0′ when not grouped) to generate a group similarity matrix. A principal component analysis then transforms the group similarity matrix data into two-dimensional space, known as a ‘point map’. Each statement is represented as a dot on the map. Statements frequently grouped together appear closer; those infrequently arranged in a pair stay at a distance [24]. The objective of the principal component analysis is to flatten the multidimensional data into two-dimensional space without the loss of its structural integrity [25]. Finally, a hierarchical cluster analysis is computed to produce a series of maps with between two and 18 cluster solutions.
Phase 5, Data Interpretation
Data interpretation was undertaken in four steps. First, the research team reviewed each of the 17 candidate concept maps to eliminate cluster solutions that had overcrowding of statements in one cluster. In addition, concept maps with single statements forming separate clusters were also excluded. Next, we asked participants who completed the structuring phase if they would agree to participate in a single data interpretation workshop. Participants reviewed and discussed each of the candidate cluster solutions to agree on a final concept map that best represented the data. SP reviewed the point map to identify the theme reflected by the statements around the opposite extremes of the x and y axis and proposed labels to the idea captured by the four ends. The research team reviewed and determined the axis labels. The final step involved calculating an average importance rating for each cluster from the final concept map, overall and separately for each group.
Ethical Considerations
The La Trobe University human ethics committee reviewed and approved the study (HREC approval number 20172, 10th June 2020). The main ethical consideration for this study was the decision to reimburse participants for their time which may be considered an inducement to participate. Each participant was paid $25 for completing each phase of the study. The value of the payment was consistent with the Australian National Health and Medical Research Council guidance [26].
Potential study participants were sent written information about the study and then asked to provide consent electronically. There was no opportunity for researchers to check potential participants’ signing of the consent form. However, the study was considered low risk and our procedures for providing information and consent were considered appropriate by the research ethics committee.
Finally, it was possible that talking about the hospital experiences may have been distressing to some participants. Where this occurred, we had in place a stepped approach to provide additional support to participants.
Results
Fieldwork for the study was carried out between the 8th October 2020 and the 14th June 2021 (brainstorming interviews, 8th October 2020 through 5th February 2021 and structuring phase, 7th May through 14th June 2021). The data interpretation session was held on the 8th September 2021.
Figure 1 shows the flow of participants through the different phases of the study. Eighty-two people expressed an interest in participating. Of 78 who met our inclusion criteria, 68 provided written informed consent to take part in the research.
Table 1 shows the demographic characteristics of study participants overall and by stakeholder group. Most participants were female, in their mid-thirties and born in Australia. Around two-thirds were educated to a post-graduate level. Nurses and doctors who participated were generally trained in Australia. Nurses had almost a decade more clinical experience compared with doctors. There were no apparent systematic differences between participants that took part in the different phases of concept mapping.
Phase 2, Idea generation
Brainstorming
In total 62 participants generated 1,307 individual statements (a complete list of all statements is included in Supplementary Document S2). On average, brainstorming interviews lasted 26 minutes.
Statement reduction
Our first round of statement reduction removed 937 statements (Supplementary Document S3). A further 311 (Supplementary Document S4) statements were removed during the second round. The final list had 69 discreet statements (Supplementary Document S5). Statements were edited for clarity, retaining the original wording as far as possible [24].
Phase 3, Structuring of the statements
Fifty-two participants started structuring tasks (prioritization and clustering) that were completed by 48. One participant withdrew from the study after completion of both tasks, requesting their data be removed and destroyed. The final data set comprised data from 47 participants who completed both tasks. Participants organized statements into an average of six clusters. The importance rating (mean, standard deviation and 95% confidence interval) for each statement is shown in Table 2.
Phase 4, Representation of the statements
Figure 2 is the point map, produced from the clustering data, locating each statement (as a dot) on a two-dimensional space. Seventeen candidate concept maps were subsequently generated by “Ariadne” that can be accessed as Supplementary Document S6.
Phase 5, Data Interpretation
The research team reviewed each candidate concept maps (numbered two through 18 in Supplementary Document S6) and selected six (five to 10 cluster solutions) to take forward to the stakeholder interpretation workshop. Concept maps two to four were not considered for further discussion as many statements were not coherent. We removed concept maps 11 through 18 as multiple clusters comprised a single statement.
Five stakeholders (two patients, two nurses, and one doctor) participated in the data interpretation workshop, facilitated by one of the members of the research team (RG). The group reviewed each of the six candidate concept maps considering the strengths and limitations of each solution. The stakeholder group considered the five-cluster concept map as their preferred solution that best reflected the data. During the workshop participants also suggested possible labels for each cluster. However, participants were not able to finalise labels due to time restrictions. The research team made the final decision about the final cluster labels which was a deviation from the planned protocol (Pantha et al., 2021). Figure 3 is the final concept map.
Description of the axis
Concept maps locate individual statements and clusters on an X and Y-axis (Figure 2). The statements on the X-axis represented the quality of communication between nurses and doctors. Statements and clusters located toward the west suggest poor and the east good communication. The Y-axis reflected two concepts labelled, “patient-centered communication” located towards the north of the map and “barriers to effective communication” located on the south.
Description of the clusters
Figure 3 shows the final concept map with five clusters that circle the center of the map. The cluster rankings for all participants and by individual stakeholder group are shown in Table 2. The importance rating for all five clusters was towards the middle of the five-point scale. Figure 4 is a pattern match (or ladder) graph showing the rank order for the five clusters. There were no important differences between stakeholder groups as to which clusters were considered more or less important.
Cluster 1, Effective communication
“Effective communication” was the cluster rated as most important and included 20 statements. The cluster captured the importance of good communication between doctors and nurses to ensure high-quality, timely, patient care. The cluster was located toward the north and extreme east of the concept map. Example statements include “Precise communication is needed in emergency situations”, “A structured handover between nurses and doctors is important” and “Effective nurse-doctor communication ensures timely patient care”.
Cluster 2, Trust
Containing ten statements, the “Trust” cluster was in the centre and towards the north edge of the concept map. Statements in this cluster include “Doctors and nurses need to be honest with patients”, “Patient needs to fully understand their care and treatment”, and “Good communication will improve people’s faith in medicine”.
Cluster 3, Patient safety
The “Patient safety” cluster includes 15 statements. This cluster described how patient safety outcomes can be impacted by poor nurse-doctor communication. Example statements include “Important information about patient care gets lost if communication is poor”, “Poor communication can lead to worse health care outcomes in the longer term”, and “Dissatisfied patients will disengage with healthcare services.” The cluster was located on the extreme west of the concept map, across the x-axis.
Cluster 4, Impediments to patient care
There were nine statements in the cluster “Impediments to patient care”. The cluster reflects workplace factors that can potentially impact patient care. The cluster was located centrally towards the extreme south of the map. Statements in the cluster include “Workplace bullying impacts communication,” “Clinicians with heavy caseload can be less effective at communicating,” and “Critical comments negatively impact the quality of communication”.
Cluster 5, Interpersonal skills
Occupying the southeast quadrant of the concept map the “Interpersonal skills” cluster included 15 statements. The cluster encompassed interpersonal strategies that enhance nurse-doctor communication and include “Clinicians with more clinical experience are better at communicating”, “Finding time for informal discussions about patient care is important”, and “Using clinicians name in discussion improves communication.”
Discussion
This study used concept mapping to examine stakeholder perspectives on how nurse-doctor communication impacts patient care. Stakeholder groups identified that patient care was affected by the individual (e.g., clinical experience), interpersonal (e.g., trust) and workplace aspects (e.g., consistent shifts) of nurse-doctor communication. Broadly, all aspects of nurse-doctor communication were considered of equal importance by study participants.
The concepts identified in our study are consistent with those reported in previous reviews of nurse-doctor communication [27,28,29,30,31,32,33]. For example, a review of 38 studies by Bookey-Bassett et al. (2017) identified that effective communication and trust between clinicians facilitated enhanced management of long-term conditions. Similarly, Stutsky & Laschinger (2014) in their review of interprofessional communication found that trust, patient safety, and interpersonal skills were important in providing high-quality patient care.
Three features of our concept map require consideration. First, clusters were comparatively large but of approximately equal size, underscoring the observation that no one concept was more important than any other in terms of how nurse-doctor communication impacts patient care. The size of clusters could be due to important differences in how participants organized statements into groups during the clustering task. Second, statements within the cluster were not located close together suggesting clusters may lack a clear conceptual focus [24], underscoring the complexities of how patient care is impacted by nurse-doctor communication. Authors of reviews of interprofessional communication have also highlighted the complexity of interdisciplinary working [32,33,34]. Potentially our findings may explain why there are several examples in the literature where authors have focused on targeting a single aspect of nurse-doctor communication (e.g., joint clinical rounding, shared care planning) and failed to show improvements in patient outcomes [35,36]. Finally, two of the clusters (effective communication and interpersonal skills) were particularly close to each other, suggesting that they may be part of a single larger concept.
Limitations
There are several important limitations to consider when interpreting the findings of this study. First, participants were recruited through specific social media groups. It is plausible that there are important differences between people that do and do not engage with social media [37], potentially introducing selection bias. Around one in four participants did not complete the prioritizing and clustering tasks. However, our attrition rate was seemingly typical of concept mapping studies [20] and there did not appear to be a systematic reason for people dropping out of the research. We also note that concept mapping is a group process, and the final concept map is the reflection of the work of all participants rather than individuals per se. Concept maps produced by patients, nurses, and doctors were not analyzed separately. That said, we did not observe important differences between how the three stakeholders ranked individual statements and clusters. Finally, the axis and cluster labels were determined by the research team and not by study participants as is recommended in concept mapping [24]. Whilst stakeholders proposed cluster labels due to time constraints, consensus could not be reached. We acknowledge that the stakeholders could have labelled the clusters differently.
Conclusion
Patients, nurses, and doctors had broadly consistent views on how nurse-doctor communication may impact patient care. The relatively equal size and orientation of the clusters may suggest that all clusters are broadly of equal importance. There is a need for further research to develop insights into how patient care is influenced by clinical communication.
Supplementary Materials
The following supporting information can be downloaded at the website of this paper posted on Preprints.org. Supplementary Document S1, social media advert used for the study, Supplementary Document S2, complete list of all statements generated from the study, Supplementary Document S3, list of statements after first round of the reduction, Supplementary Document S4, list of statements removed during the second round of statement reduction, Supplementary Document S5, final list of 69 statements, Supplementary Document S6, 17 candidate concept maps generated using Ariadne software.
Author Contributions
All authors were involved in the conception of the study, development of the focus prompt. SP conducted brainstorming interviews, extracted statements from the interviews, and undertook the first and second round of statement reduction. All authors were involved in the final stages of statement reduction. SP facilitated communication with participants for rating and clustering tasks and analyzed Ariadne data to generate candidate concept maps. Maps were reviewed and shortlisted by all authors. RG facilitated the stakeholder meeting for data interpretation. SP prepared the first draft of the manuscript. RG undertook an extensive revision of the first draft of the manuscript. All authors reviewed and agreed to the final manuscript.
Funding
The corresponding author has received La Trobe University Postgraduate Research Scholarship (LTUPRS) and La Trobe University Full Fee Research Scholarship (LTUFFRS). There was no additional funding for the research. Participants were reimbursed a digital voucher of 25 AUD for each phase of the study. Fund for the reimbursement was supported by the HDR research grants for PhD study.
Institutional Review Board Statement
The study was approved by the La Trobe University human ethics committee (HEC – 20172).
Informed Consent Statement
All participants provided a written informed consent before the brainstorming interview. At each phase of the research, participants were asked if they still wanted to take part in the research.
Data availability statement
All data related to the research has been provided as Supplementary Materials (Supplementary Document S1 to S6).
Guidelines and Standards Statement
We searched the EQUATOR network website for the availability of a reporting guideline for concept mapping research. There is no reporting guideline available for the reporting of concept mapping research.
Conflicts of interest
Richard Gray is the editor-in-chief of nursing reports.
References
- Butler, R.; Monsalve, M.; Thomas, G.W.; Herman, T.; Segre, A.M.; Polgreen, P.M.; Suneja, M. Estimating Time Physicians and Other Health Care Workers Spend with Patients in an Intensive Care Unit Using a Sensor Network. The American Journal of Medicine 2018, 131, 972.e979–972.e915. [Google Scholar] [CrossRef] [PubMed]
- Wang, Y.-Y.; Wan, Q.-Q.; Lin, F.; Zhou, W.-J.; Shang, S.-M. Interventions to improve communication between nurses and physicians in the intensive care unit: An integrative literature review. International journal of nursing sciences 2018, 5, 81–88. [Google Scholar] [CrossRef] [PubMed]
- Song, X.; Kim, J.H.; Despins, L. Time-motion study in an intensive care unit using the near field electromagnetic ranging system. In Proceedings of Proceedings of the 2017 industrial and systems engineering conference, Pittsburgh, PA, USA.
- Wolff, J.; Auber, G.; Schober, T.; Schwär, F.; Hoffmann, K.; Metzger, M.; Heinzmann, A.; Krüger, M.; Normann, C.; Gitsch, G. , et al. Work time distribution of physicians at a German Hospital. Dtsch Arztebl Int 2017, 114, 705–711. [Google Scholar] [CrossRef] [PubMed]
- Michel, O.; Garcia Manjon, A.-J.; Pasquier, J.; Ortoleva Bucher, C. How do nurses spend their time? A time and motion analysis of nursing activities in an internal medicine unit. Journal of Advanced Nursing 2021, 77, 4459–4470. [Google Scholar] [CrossRef] [PubMed]
- Brennan, R.A.; Keohane, C.A. How Communication Among Members of the Health Care Team Affects Maternal Morbidity and Mortality. J Obstet Gynecol Neonatal Nurs 2016, 45, 878–884. [Google Scholar] [CrossRef] [PubMed]
- Fernando, O.; Coburn, N.G.; Nathens, A.B.; Hallet, J.; Ahmed, N.; Conn, L.G. Interprofessional communication between surgery trainees and nurses in the inpatient wards: Why time and space matter. J Interprof Care 2016, 30, 567–573. [Google Scholar] [CrossRef]
- Gleeson, L.L.; O’Brien, G.; O’Mahony, D.; Byrne, S. Interprofessional communication in the hospital setting: a systematic review of the qualitative literature. Journal of Interprofessional Care 2023, 37, 203–213. [Google Scholar] [CrossRef]
- Manojlovich, M.; DeCicco, B. Healthy Work Environments, Nurse-Physician Communication, and Patients’ Outcomes. American Journal of Critical Care 2007, 16, 536–543. [Google Scholar] [CrossRef]
- Ma, C.; McHugh, M.D.; Aiken, L.H. Organization of hospital nursing and 30-day readmissions in Medicare patients undergoing surgery. Medical care 2015, 53, 65. [Google Scholar] [CrossRef]
- Ma, C.; Park, S.H.; Shang, J. Inter- and intra-disciplinary collaboration and patient safety outcomes in U.S. acute care hospital units: A cross-sectional study. International Journal of Nursing Studies 2018, 85, 1–6. [Google Scholar] [CrossRef]
- Kang, X.L.; Brom, H.M.; Lasater, K.B.; McHugh, M.D. The association of nurse–physician teamwork and mortality in surgical patients. Western Journal of Nursing Research 2020, 42, 245–253. [Google Scholar] [CrossRef] [PubMed]
- Swiger, P.A.; Patrician, P.A.; Miltner, R.S.S.; Raju, D.; Breckenridge-Sproat, S.; Loan, L.A. The Practice Environment Scale of the Nursing Work Index: An updated review and recommendations for use. Int J Nurs Stud 2017, 74, 76–84. [Google Scholar] [CrossRef] [PubMed]
- Baggs, J.G.; Ryan, S.A.; Phelps, C.E.; Richeson, J.F.; Johnson, J.E. The association between interdisciplinary collaboration and patient outcomes in a medical intensive care unit. Heart & lung: the journal of critical care 1992, 21, 18–24. [Google Scholar]
- Baggs, J.G.; Schmitt, M.H.; Mushlin, A.I.; Mitchell, P.H.; Eldredge, D.H.; Oakes, D.; Hutson, A.D. Association between nurse-physician collaboration and patient outcomes in three intensive care units. Critical care medicine 1999, 27, 1991–1998. [Google Scholar] [CrossRef] [PubMed]
- Higgins, L.W. Nurses’ perceptions of collaborative nurse–physician transfer decision making as a predictor of patient outcomes in a medical intensive care unit. Journal of Advanced Nursing 1999, 29, 1434–1443. [Google Scholar] [CrossRef] [PubMed]
- Rothberg, M.B.; Steele, J.R.; Wheeler, J.; Arora, A.; Priya, A.; Lindenauer, P.K. The Relationship Between Time Spent Communicating and Communication Outcomes on a Hospital Medicine Service. Journal of General Internal Medicine 2012, 27, 185–189. [Google Scholar] [CrossRef]
- Ward, P. Trust and communication in a doctor-patient relationship: a literature review. Arch Med 2018, 3, 36. [Google Scholar]
- Trochim, W.; Kane, M. Concept mapping: An introduction to structured conceptualization in health care. International Journal for Quality in Health Care 2005, 17, 187–191. [Google Scholar] [CrossRef]
- Rosas, S.R.; Kane, M. Quality and rigor of the concept mapping methodology: a pooled study analysis. Evaluation and program planning 2012, 35, 236–245. [Google Scholar] [CrossRef]
- Pantha, S.; Jones, M.; Gray, R. Stakeholders’ perceptions of how nurse-physician communication may impact patient care: protocol for a concept mapping study. Journal of Interprofessional Care 2021, 1–3. [Google Scholar] [CrossRef]
- Cardwell, R.; McKenna, L.; Davis, J.; Gray, R. How is clinical credibility defined in nursing? Protocol for a concept mapping study. J Clin Nurs 2019. [CrossRef]
- Severans, P. Manual Ariadne 3.0; 2015.
- Trochim, W.M.; McLinden, D. Introduction to a special issue on concept mapping. Evaluation and Program Planning 2017, 60, 166–175. [Google Scholar] [CrossRef] [PubMed]
- Abdi, H.; Williams, L.J. Principal component analysis. Wiley interdisciplinary reviews: computational statistics 2010, 2, 433–459. [Google Scholar] [CrossRef]
- National Health and Medical Research Council. Payment of participants in research: Information for researchers, HRECs and other ethics review bodies; R41F; Australian Research Council and Universities Australia: Canberra, 2019; p 14.
- D’amour, D.; Ferrada-Videla, M.; San Martin Rodriguez, L.; Beaulieu, M.-D. The conceptual basis for interprofessional collaboration: core concepts and theoretical frameworks. Journal of interprofessional care 2005, 19, 116–131. [Google Scholar] [CrossRef] [PubMed]
- Stutsky, B.J.; Laschinger, H.K.S. Development and Testing of a Conceptual Framework for Interprofessional Collaborative Practice. Health & Interprofessional Practice 2014, 2. [Google Scholar] [CrossRef]
- Bainbridge, L.; Nasmith, L.; Orchard, C.; Wood, V. Competencies for interprofessional collaboration. Journal of Physical Therapy Education 2010, 24, 6–11. [Google Scholar] [CrossRef]
- Bookey-Bassett, S.; Markle-Reid, M.; Mckey, C.A.; Akhtar-Danesh, N. Understanding interprofessional collaboration in the context of chronic disease management for older adults living in communities: a concept analysis. Journal of advanced nursing 2017, 73, 71–84. [Google Scholar] [CrossRef]
- Petri, L. Concept Analysis of Interdisciplinary Collaboration. Nursing Forum 2010, 45, 73–82. [Google Scholar] [CrossRef]
- Tan, T.C.; Zhou, H.; Kelly, M. Nurse-physician communication - An integrated review. Journal of Clinical Nursing 2017, 26, 3974–3989. [Google Scholar] [CrossRef]
- House, S.; Havens, D. Nurses’ and physicians’ perceptions of nurse-physician collaboration: a systematic review. JONA: The Journal of Nursing Administration 2017, 47, 165–171. [Google Scholar] [CrossRef]
- Cypress, B.S. Exploring the concept of nurse-physician communication within the context of health care outcomes using the evolutionary method of concept analysis. Dimensions of Critical Care Nursing 2011, 30, 28–38. [Google Scholar] [CrossRef]
- Pannick, S.; Davis, R.; Ashrafian, H.; Byrne, B.E.; Beveridge, I.; Athanasiou, T.; Wachter, R.M.; Sevdalis, N. Effects of Interdisciplinary Team Care Interventions on General Medical Wards: A Systematic Review. JAMA Intern Med 2015, 175, 1288–1298. [Google Scholar] [CrossRef] [PubMed]
- Reeves, S.; Pelone, F.; Harrison, R.; Goldman, J.; Zwarenstein, M. Interprofessional collaboration to improve professional practice and healthcare outcomes. Cochrane Database Syst Rev 2017, 6. [Google Scholar] [CrossRef] [PubMed]
- Hong, S.; Oh, S.K. Why People Don’t Use Facebook Anymore? An Investigation Into the Relationship Between the Big Five Personality Traits and the Motivation to Leave Facebook. Frontiers in Psychology 2020, 11. [Google Scholar] [CrossRef] [PubMed]
Figure 1.
Flow of participants through different phases of concept mapping.
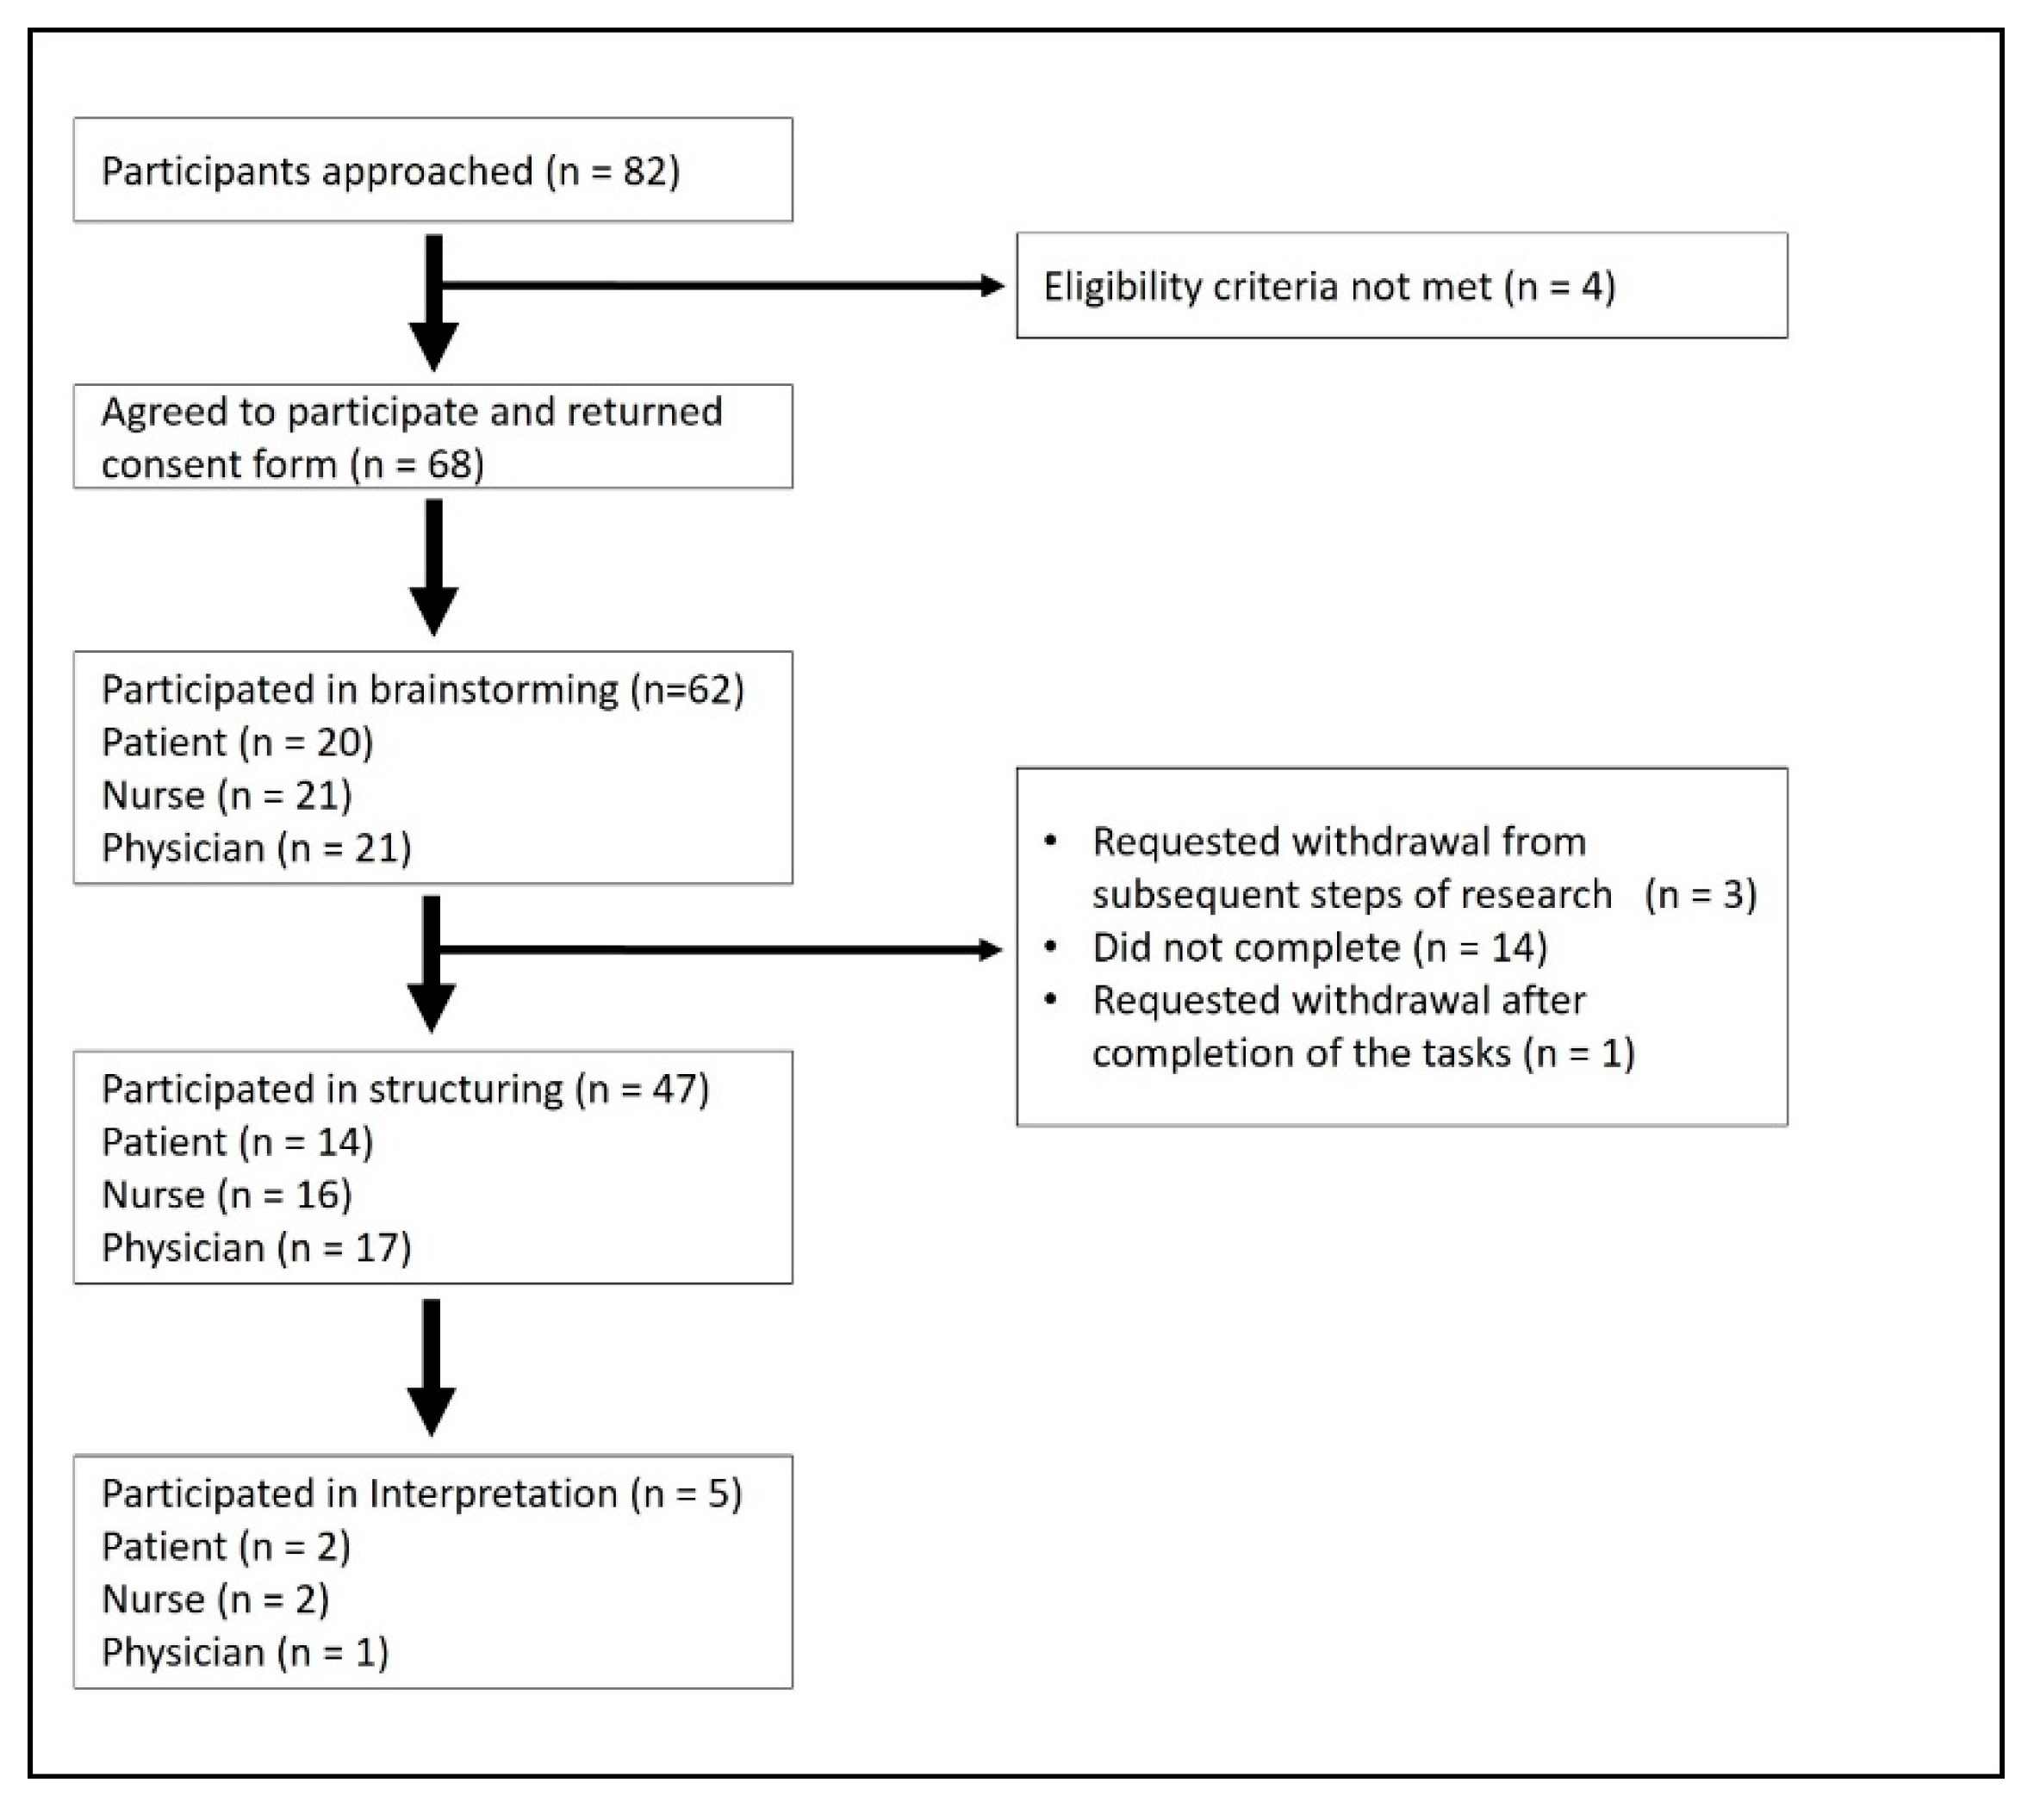
Figure 2.
Point map showing the location of individual statements against the X and Y axis.
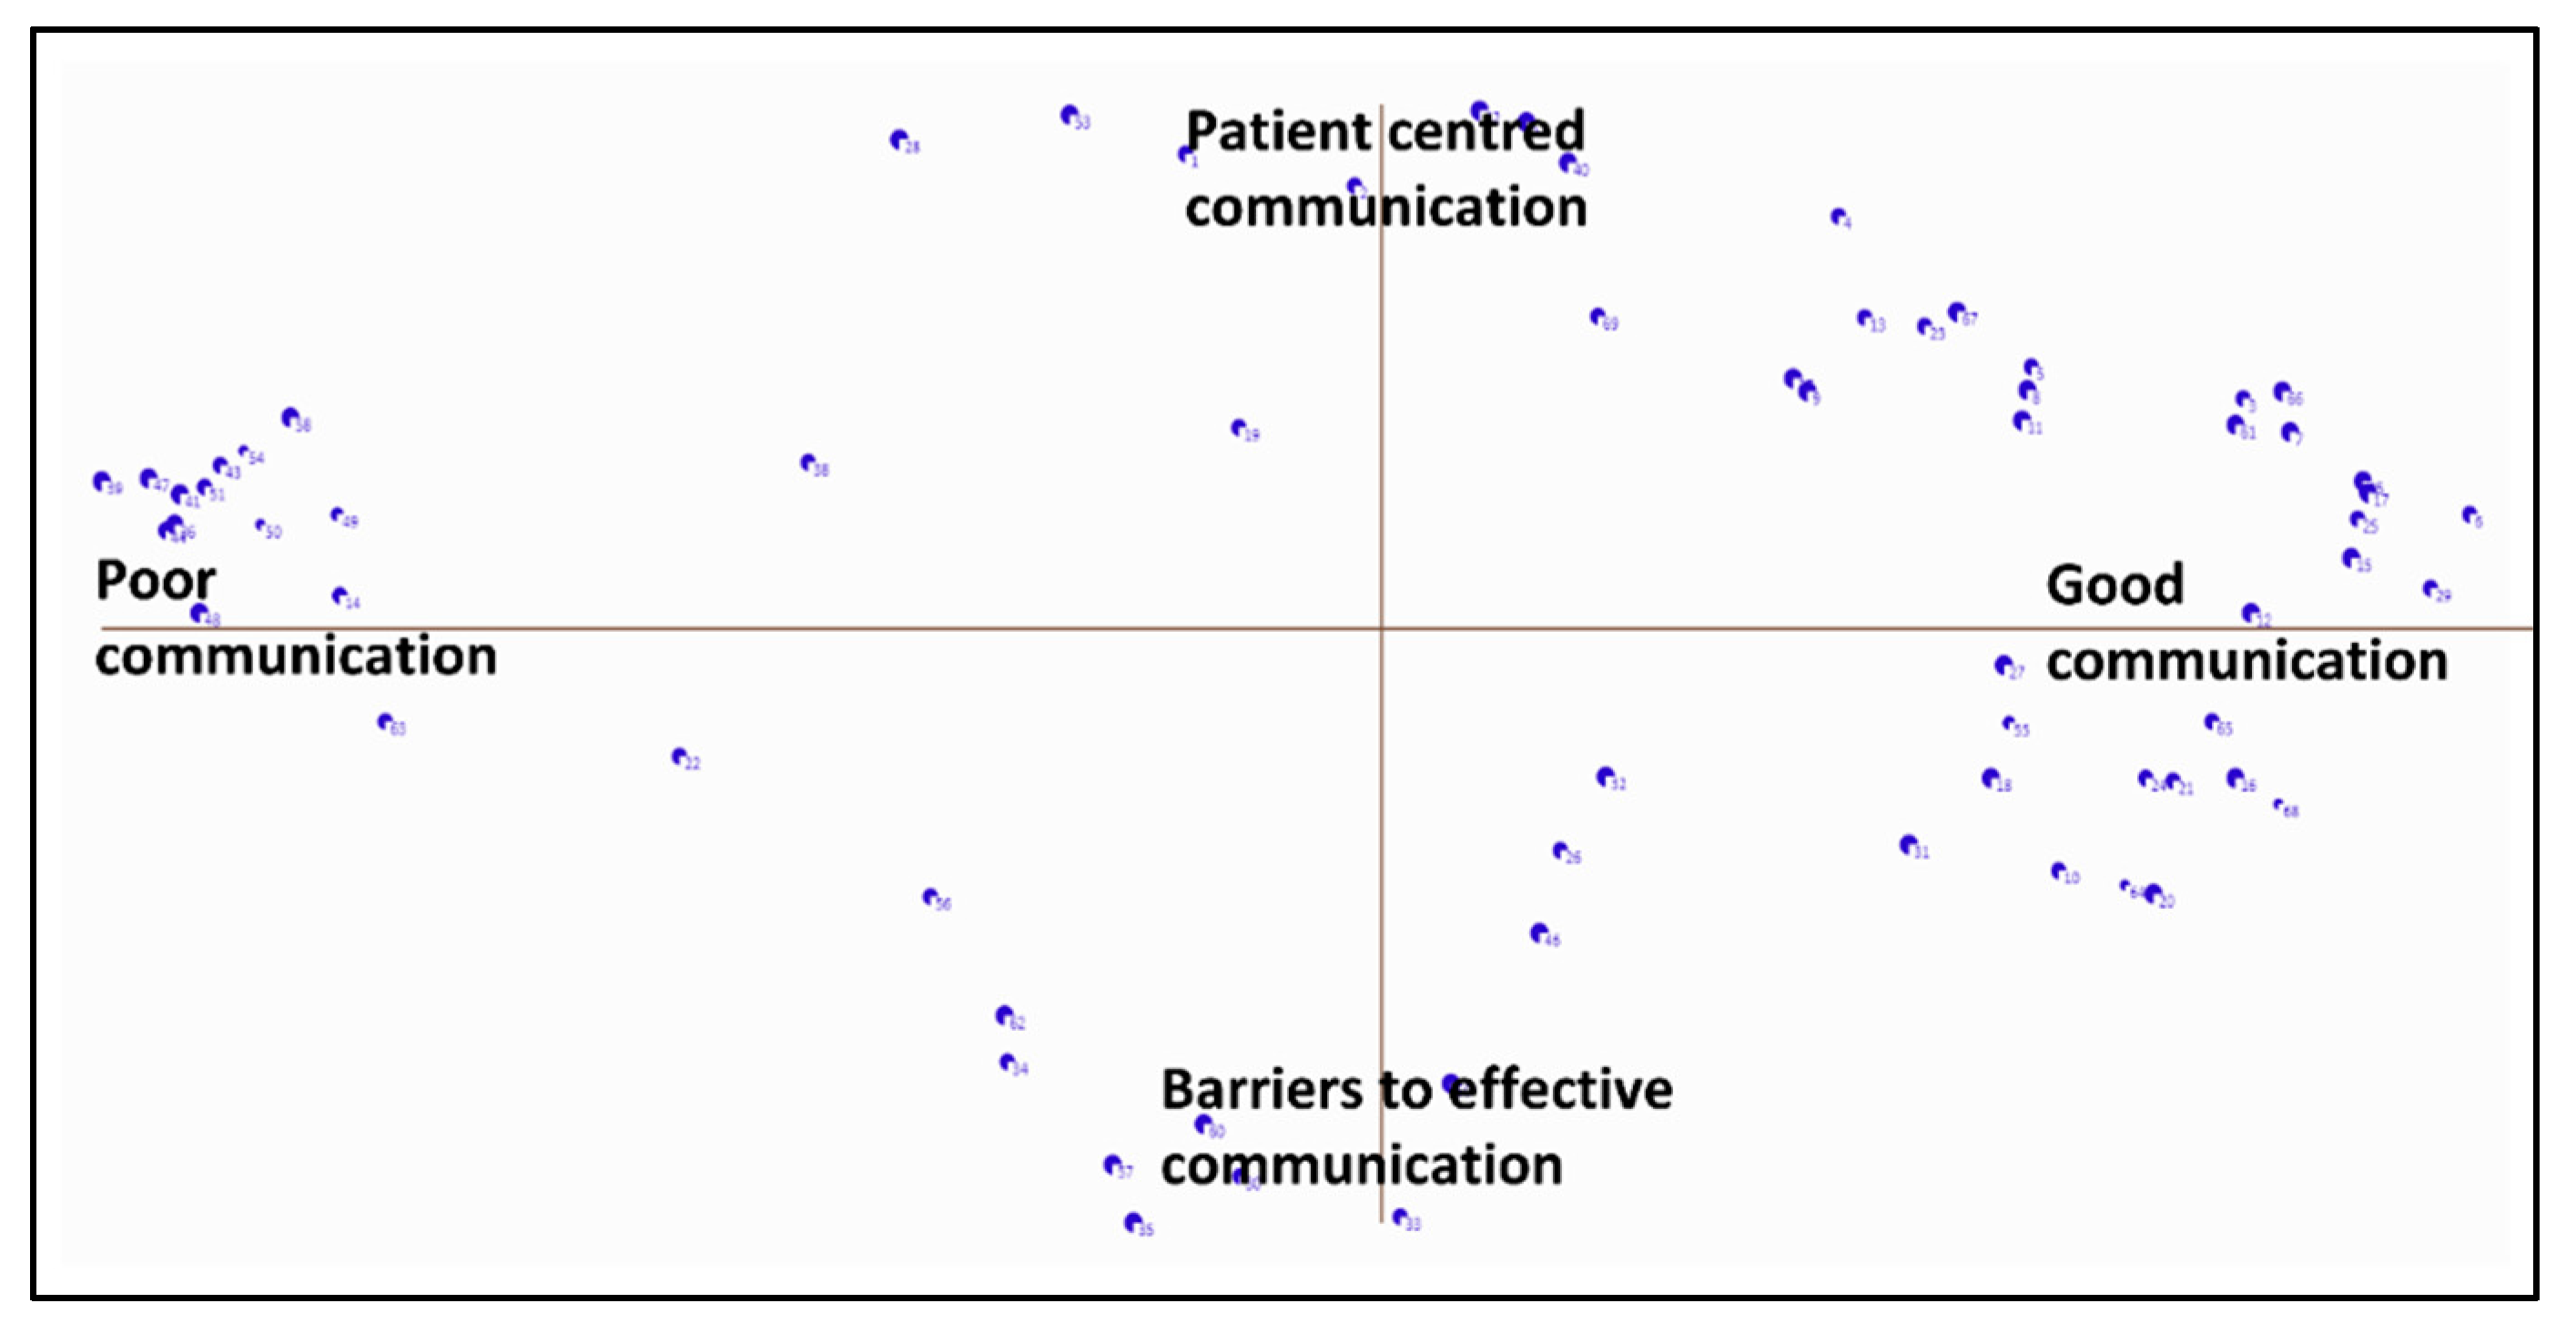
Figure 3.
Five-cluster concept map generated by the participants.
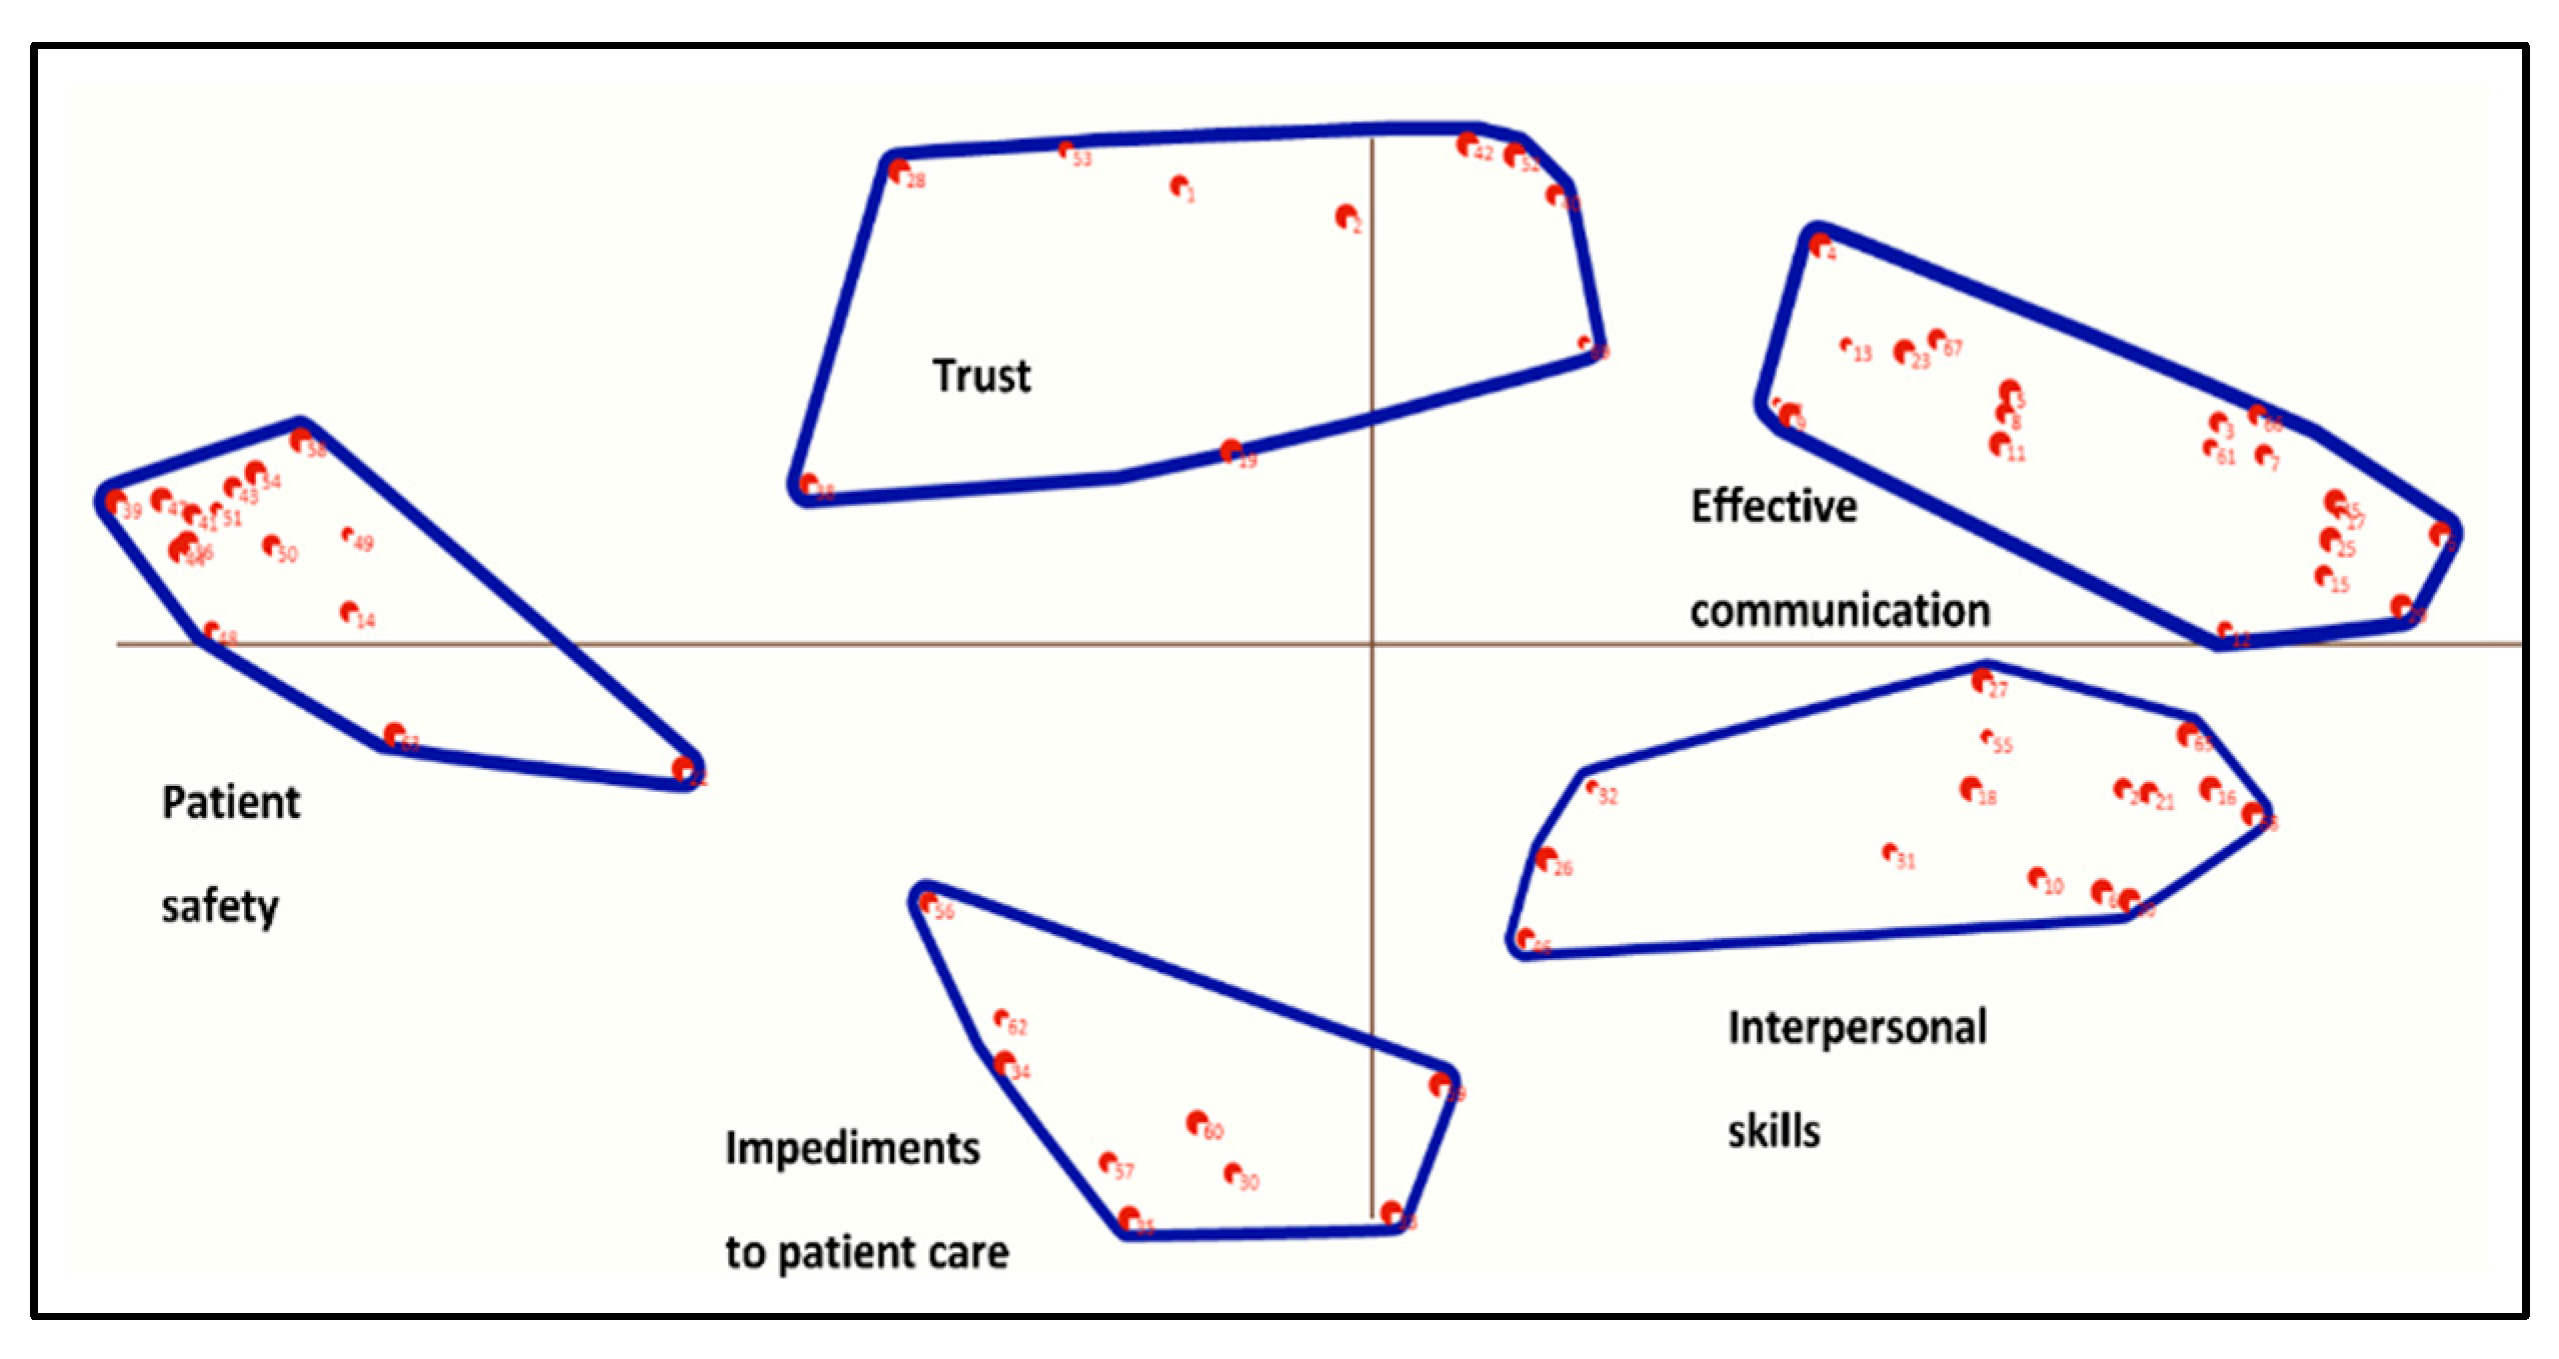
Figure 4.
Pattern match showing stakeholders’ rankings of five clusters.
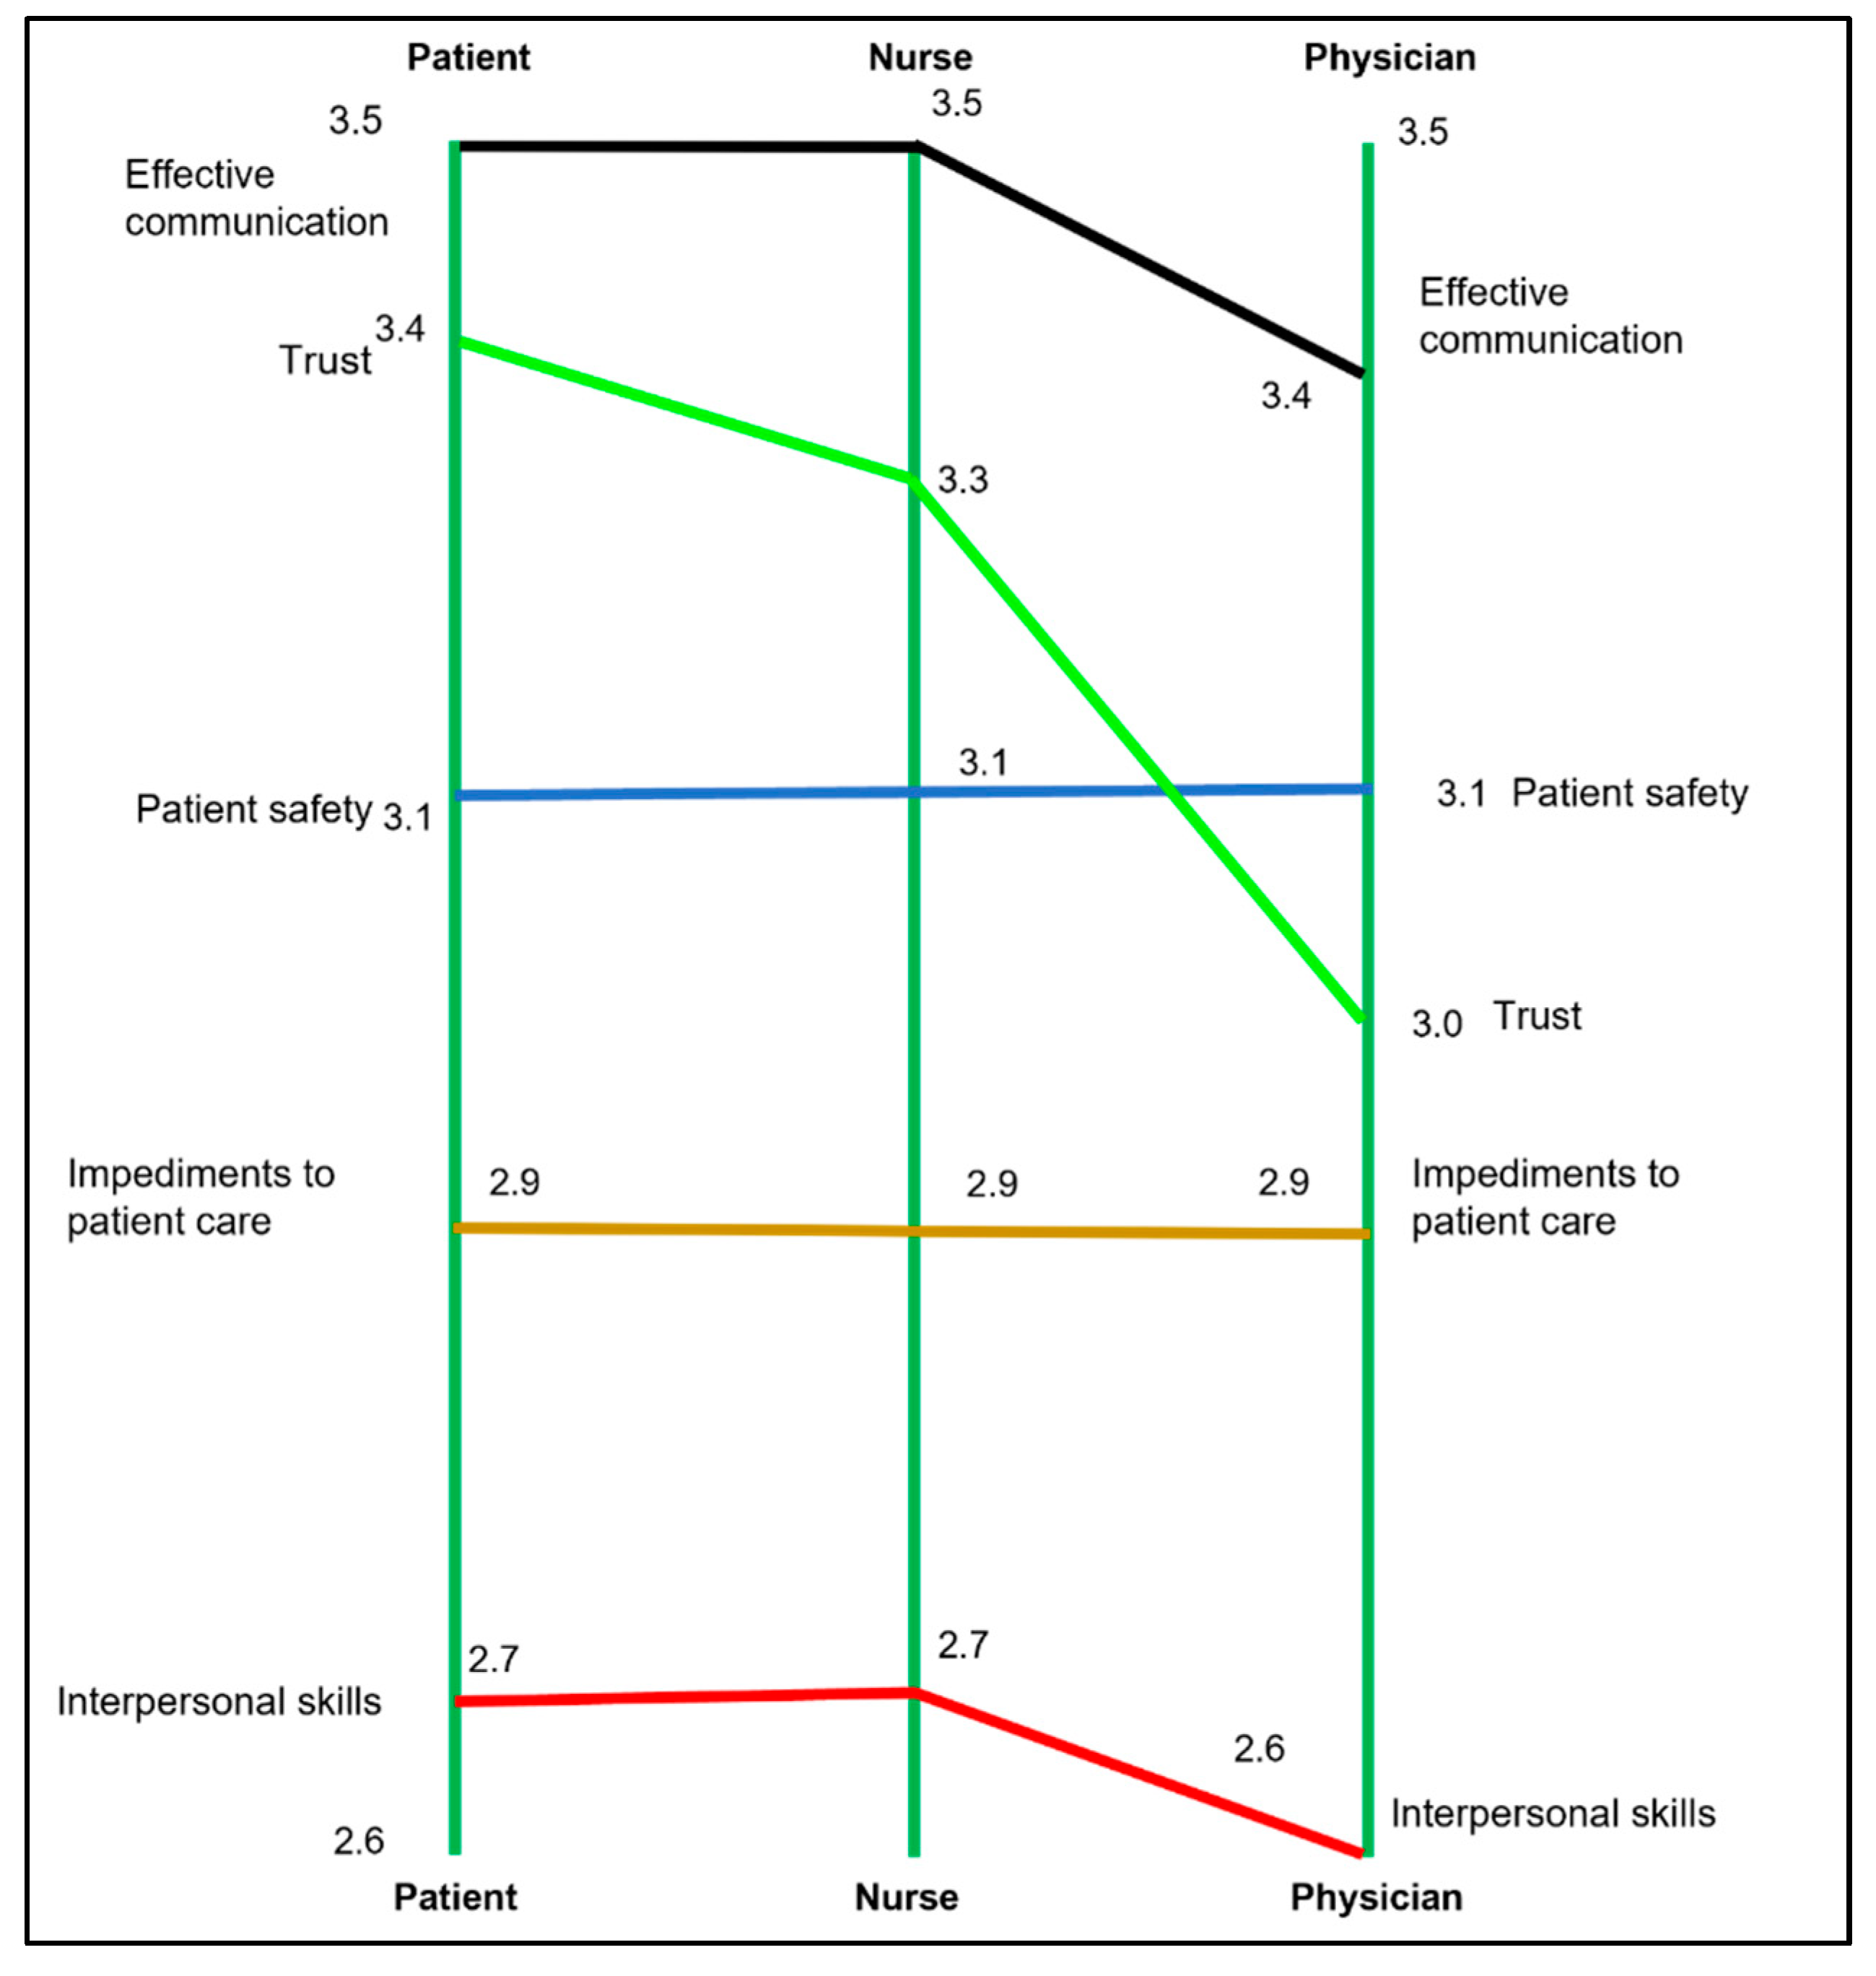

Table 1.
Participant demographic characteristics.
| Characteristics | Participant groups | ||||||||
|---|---|---|---|---|---|---|---|---|---|
| All | Patient | Nurse | Doctor | ||||||
| Brainstorming | Clustering & prioritization | Brainstorming | Clustering & prioritization | Brainstorming | Clustering & prioritization | Brainstorming | Clustering & prioritization | ||
| (n=62) | (n = 47) | (n = 20) | (n = 13) | (n = 21) | (n = 16) | (n = 21) | (n = 18) | ||
| Gender (Female) | 47 (77%) | 38 (81%) | 14 (70%) | 10 (77 %) | 19 (90.5 %) | 14 (88%) | 14 (78%) | 14 (78%) | |
| Age in years (Mean, SD) | 35.9 (10.2) | 38.2 (12.3) | 45 (17) | 43.4 (14.7) | 41 (10.3) | 42.6 (11.1) | 30.3 (6.9) | 30.5 (7.1) | |
| Country of Birth | Australia | 34 (55%) | 28 (60 %) | 11 (55%) | 8 (62%) | 10 (48%) | 9 (56%) | 13 (62%) | 11 (62%) |
| Other | 28 (45%) | 19 (40 %) | 9 (45%) | 5 (38%) | 11 (52%) | 7 (44%) | 9 (38%) | 7 (38%) | |
| Highest educational qualification1 | Undergraduate | 2 (3%) | 2 (4%) | 2 (10%) | 2 (15%) | - | - | - | - |
| Graduate | 19 (31%) | 14 (30%) | 5 (25%) | 2 (15%) | 4 (19%) | 3 (19%) | 10 (48%) | 9 (50%) | |
| Postgraduate | 39 (63%) | 29 (62%) | 13 (65%) | 9 (70%) | 16 (76%) | 12 (75%) | 10 (48%) | 8 (44%) | |
| Country of clinical qualification | Australia | 32 (76%) | 27 (80%) | - | - | 15 (71%) | 12 (75%) | 17 (81%) | 15 (83%) |
| Other | 10 (24%) | 7 (20%) | - | - | 6 (29%) | 4 (25%) | 4 (19%) | 3 (17%) | |
| Years of clinical work (Mean, SD)2 | 9.3 (9.3) | 9.3 (9.9) | - | - | 13.5 (10.4) | 14.6 (11.2) | 4.8 (5.2) | 4.2 (4.6) | |
| Years at current workplace (Mean, SD)2 | 4.1 (5.2) | 4.3 (5.4) | - | - | 6.3 (6.3) | 7 (6.7) | 2 (1.7) | 1.8 (1.6) | |
| Clinical setting | Medical ward | - | - | 7 (35%) | 4 (30%) | - | - | - | - |
| Surgical ward | - | - | 12 (60%) | 8 (62%) | - | - | - | - | |
| Do not know | - | - | 1 (5%) | 1 (8%) | - | - | - | - | |
1 Information not available for two participants. 2 One of the doctors did not provide information.
Table 2.
Rating score for sixty-nine statements, disaggregated by stakeholder groups.
| Number1 | Statement | All stakeholders | Patient | Nurse | Doctor | ||||
|---|---|---|---|---|---|---|---|---|---|
| Mean, SD | 95% CI | Mean, SD | 95% CI | Mean, SD | 95% CI | Mean, SD | 95% CI | ||
| Cluster 1, Effective communication | 3.4 (1.3) | 3.1,3.8 | 3.5 (1.2) | 2.8,4.2 | 3.5 (1.3) | 2.9,4.2 | 3.4 (1.2) | 2.8,3.9 | |
| 23 | Precise communication is required in emergency situations (e.g., cardiac arrest) | 4.6 (1.1) | 4.3,4.9 | 4.9 (0.4) | 4.7,5.1 | 4.2 (1.5) | 3.5,5.0 | 4.7 (0.9) | 4.3,5.1 |
| 61 | Clear and detailed clinical documentation is an important aspect of nurse-doctor communication | 4.2 (1.0) | 4.0,4.5 | 3.7 (1.3) | 3.0,4.5 | 4.5 (0.8) | 4.1,4.9 | 4.3 (0.9) | 3.9,4.7 |
| 4 | Effective nurse-doctor communication improves the quality of patient care | 4.1 (1.2) | 3.7,4.4 | 3.8 (1.4) | 3.0,4.6 | 4.1 (1.4) | 3.4,4.8 | 4.2 (1.0) | 3.7,4.7 |
| 13 | Effective nurse-doctor communication ensures timely patient care | 3.9 (1.2) | 3.6,4.3 | 4.1 (0.9) | 3.6,4.7 | 3.9 (1.0) | 3.4,4.4 | 3.8 (1.4) | 3.1,4.5 |
| 17 | Good communication is important across all shifts (including nights) | 3.9 (1.2) | 3.5,4.2 | 3.7 (1.3) | 3.0,4.5 | 3.7 (1.3) | 3.0,4.3 | 4.1 (1.1) | 3.6,4.6 |
| 8 | Nurses need ensure they are aware of change in patients care plans | 3.9 (1.1) | 3.7,4.2 | 4.0 (1.1) | 3.4,4.6 | 4.5 (0.6) | 4.2,4.8 | 3.4 (1.1) | 2.9,4.0 |
| 66 | Nurses and doctors need to have a good understand of current evidence-based practice guidelines | 3.7 (1.3) | 3.3,4.1 | 3.7 (1.2) | 3.1,4.4 | 3.8 (1.5) | 3.0,4.6 | 3.5 (1.3) | 2.9,4.2 |
| 3 | Nurses and doctors need to provide multidisciplinary patient care | 3.6 (1.4) | 3.2,4.0 | 3.4 (1.5) | 2.5,4.3 | 3.9 (1.2) | 3.3,4.5 | 3.4 (1.6) | 2.7,4.2 |
| 7 | Advice from nurses help doctors to plan patient care | 3.6 (1.2) | 3.2,3.9 | 3.3 (1.4) | 2.5,4.1 | 3.8 (1.1) | 3.2,4.4 | 3.5 (1.0) | 3.1,4.0 |
| 15 | Doctors need to make sure that the instructions they give to nurses is understood | 3.6 (1.1) | 3.4,3.9 | 3.9 (0.9) | 3.4,4.4 | 3.4 (1.3) | 2.8,4.1 | 3.7 (1.1) | 3.2,4.2 |
| 6 | Nurses and doctors need to trust each other’s capabilities | 3.5 (1.2) | 3.1,3.8 | 3.7 (1.2) | 3.0,4.5 | 3.4 (1.4) | 2.7,4.1 | 3.3 (1.1) | 2.8,3.8 |
| 29 | A structured handover between nurses and doctors is important | 3.4 (1.3) | 3.0,3.8 | 3.7 (1.0) | 3.1,4.3 | 3.1 (1.5) | 2.4,3.9 | 3.4 (1.3) | 2.8,4.1 |
| 11 | Nurses are a bridge between patient and the doctor | 3.3 (1.5) | 2.9,3.7 | 3.2 (1.6) | 2.3,4.1 | 3.9 (1.5) | 3.2,4.7 | 2.8 (1.3) | 2.2,3.5 |
| 37 | Nurses and doctors need to make sure that they do not discuss patient care where they can be overheard | 3.2 (1.4) | 2.8,3.6 | 3.0 (1.4) | 2.1,3.8 | 3.4 (1.5) | 2.6,4.2 | 3.0 (1.4) | 2.4,3.7 |
| 67 | Nurses need prioritise care that impacts patient recovery | 3.2 (1.3) | 2.9,3.6 | 3.4 (1.4) | 2.5,4.2 | 3.2 (1.3) | 2.5,3.8 | 3.2 (1.4) | 2.5,3.9 |
| 5 | Good nurse-doctor communication reminds clinicians what tasks need to be completed | 3.1 (1.4) | 2.7,3.5 | 2.6 (1.5) | 1.7,3.5 | 3.4 (1.1) | 2.8,3.9 | 3.2 (1.5) | 2.4,3.9 |
| 25 | Nurses and doctors should discuss care plan before seeing the patient | 3.0 (1.4) | 2.6,3.4 | 4.0 (0.9) | 3.5,4.5 | 3.3 (1.3) | 2.6,4.0 | 1.9 (1.1) | 1.4,2.5 |
| 45 | Clear allocation of tasks to nurses and doctors | 3.0 (1.1) | 2.7,3.3 | 3.1 (1.2) | 2.4,3.8 | 2.7 (1.0) | 2.2,3.2 | 3.2 (1.2) | 2.6,3.7 |
| 9 | Clinical problems can only be addressed through positive nurse-doctor communication | 2.9 (1.4) | 2.6,3.3 | 3.0 (1.4) | 2.2,3.8 | 3.1 (1.6) | 2.3,4.0 | 2.8 (1.2) | 2.2,3.4 |
| 12 | Communication is enhanced if nurses and doctors have consistent shifts (working hours) | 2.2 (1.3) | 1.8,2.6 | 2.4 (1.5) | 1.6,3.3 | 1.8 (1.1) | 1.2,2.4 | 2.4 (1.4) | 1.7,3.1 |
| Cluster 2, Trust | 3.2 (1.3) | 2.9,3.6 | 3.4 (1.2) | 2.7,4.1 | 3.3 (1.2) | 2.7,4.0 | 3.0 (1.2) | 2.6,3.6 | |
| 2 | Nurses and doctors need to be good at communicating with family members | 3.9 (1.1) | 3.6,4.2 | 4.2 (1.0) | 3.6,4.8 | 4.0 (1.2) | 3.4,4.6 | 3.5 (1.0) | 3.0,4.0 |
| 42 | Doctors and nurses need to be honest with patients | 3.9 (1.1) | 3.6,4.2 | 4.0 (1.3) | 3.3,4.8 | 3.5 (1.1) | 3.0,4.1 | 4.0 (1.0) | 3.5,4.5 |
| 28 | Patients need to fully understand their care and treatment | 3.6 (1.4) | 3.2,4.0 | 4.4 (0.8) | 3.9,4.8 | 3.7 (1.5) | 2.9,4.5 | 2.9 (1.4) | 2.2,3.6 |
| 52 | Good interdisciplinary communication will ensure that discharge plans are meaningful | 3.6 (1.2) | 3.3,3.9 | 2.9 (1.3) | 2.2,3.6 | 3.9 (1.1) | 3.3,4.5 | 3.7 (0.9) | 3.3,4.1 |
| 40 | Doctors and nurses need to use language that can be understood by the patient | 3.5 (1.4) | 3.1,3.9 | 4.1 (1.2) | 3.5,4.8 | 3.7 (1.4) | 2.9,4.4 | 3.0 (1.5) | 2.3,3.7 |
| 53 | Good communication between doctors and nurses can comfort patients | 3.3 (1.5) | 2.9,3.7 | 3.8 (1.4) | 3.0,4.6 | 3.4 (1.5) | 2.6,4.1 | 2.9 (1.4) | 2.2,3.6 |
| 19 | Direct (face-to-face) communication reduce delays in patient care | 3.2 (1.4) | 2.8,3.6 | 3.2 (1.4) | 2.4,4.0 | 3.0 (1.2) | 2.4,3.7 | 3.4 (1.7) | 2.6,4.2 |
| 1 | Good communication will improve people’s faith in medicine | 3.0 (1.3) | 2.7,3.4 | 3.1 (1.2) | 2.4,3.8 | 2.8 (1.3) | 2.1,3.5 | 3.1 (1.3) | 2.5,3.7 |
| 69 | Patients tend to share more information with nurses than doctors | 2.6 (1.4) | 2.2,3.0 | 2.2 (1.3) | 1.5,2.9 | 3.3 (1.6) | 2.5,4.1 | 2.2 (1.2) | 1.6,2.8 |
| 38 | Patients can influence communication between nurses and doctors | 2.0 (0.9) | 1.8,2.3 | 2.1 (1.2) | 1.5,2.8 | 2.0 (0.8) | 1.6,2.4 | 2.0 (0.9) | 1.6,2.5 |
| Cluster 3, Patient safety | 3.1 (1.3) | 2.8,3.5 | 3.1 (1.3) | 2.3,3.9 | 3.1 (1.3) | 2.4,3.9 | 3.1 (1.2) | 2.5,3.7 | |
| 49 | When vital information is not communicated, it can lead to an increased risk of mortality | 4.2 (1.1) | 3.9,4.5 | 4.0 (1.1) | 3.4,4.7 | 3.9 (1.3) | 3.2,4.5 | 4.6 (0.8) | 4.3,5.0 |
| 14 | Important information about patient care gets lost if communication is poor | 3.7 (1.2) | 3.3,4.0 | 3.2 (1.5) | 2.4,4.1 | 3.7 (1.2) | 3.1,4.4 | 3.9 (1.0) | 3.5,4.4 |
| 44 | Poor communication can lead to worse health care outcomes in the longer term | 3.7 (1.2) | 3.4,4.1 | 3.2 (1.3) | 2.4,4.0 | 3.6 (1.1) | 3.0,4.2 | 4.2 (1.1) | 3.6,4.7 |
| 43 | Bad communication between nurses and doctors may be traumatic for the patient | 3.4 (1.3) | 3.1,3.8 | 3.5 (1.3) | 2.8,4.3 | 3.5 (1.3) | 2.9,4.2 | 3.3 (1.3) | 2.6,3.9 |
| 48 | Patients can get wrong treatment | 3.2 (1.5) | 2.8,3.7 | 3.5 (1.5) | 2.6,4.4 | 3.2 (1.6) | 2.4,4.0 | 3.1 (1.6) | 2.4,3.9 |
| 41 | Poor communication may prolong a patient’s period of hospitalisation | 3.2 (1.4) | 2.8,3.5 | 3.3 (1.3) | 2.5,4.0 | 3.2 (1.4) | 2.5,4.0 | 3.0 (1.4) | 2.3,3.7 |
| 63 | Delayed communication can lead to frustration | 3.1 (1.3) | 2.8,3.5 | 3.4 (1.4) | 2.6,4.2 | 3.2 (1.5) | 2.4,4.0 | 2.9 (1.2) | 2.3,3.5 |
| 36 | Poor communication may mean that patients are sent to an inappropriate clinical setting | 3.1 (1.2) | 2.8,3.4 | 3.0 (1.1) | 2.4,3.7 | 3.0 (1.4) | 2.3,3.8 | 3.2 (1.2) | 2.6,3.7 |
| 47 | Poor communication may increase the chances of a patient needed to be readmitted | 3.0 (1.4) | 2.7,3.4 | 3.1 (1.5) | 2.3,4.0 | 2.9 (1.3) | 2.2,3.6 | 3.2 (1.4) | 2.5,3.8 |
| 39 | Poor communication may mean that patients are not clear about the self-care behaviours they need to change | 2.9 (1.4) | 2.5,3.2 | 3.2 (1.1) | 2.6,3.9 | 3.0 (1.6) | 2.2,3.8 | 2.5 (1.3) | 1.9,3.1 |
| 51 | Poor communication may mean that patients do not get the required interdepartmental consultation on time | 2.9 (1.3) | 2.5,3.3 | 2.6 (1.4) | 1.8,3.4 | 3.4 (1.2) | 2.8,4.0 | 2.7 (1.4) | 2.1,3.4 |
| 54 | Dissatisfied patients will disengage with healthcare services | 2.8 (1.5) | 2.4,3.2 | 2.8 (1.6) | 1.9,3.8 | 2.9 (1.5) | 2.1,3.7 | 2.7 (1.4) | 2.1,3.4 |
| 22 | The severity of a patient’s condition can impact communication | 2.7 (1.2) | 2.3,3.0 | 2.3 (1.1) | 1.7,2.9 | 2.6 (1.4) | 1.9,3.3 | 3.0 (1.2) | 2.5,3.6 |
| 50 | Patients can be discharged before they are ready | 2.5 (1.3) | 2.1,2.9 | 2.5 (1.3) | 1.8,3.3 | 2.5 (1.4) | 1.8,3.2 | 2.5 (1.3) | 1.9,3.1 |
| 58 | Patients are more likely to complain if they witness poor communication between nurses and doctors | 2.5 (1.2) | 2.2,2.8 | 2.8 (1.1) | 2.2,3.5 | 2.6 (1.4) | 1.9,3.4 | 2.2 (1.1) | 1.6,2.7 |
| Cluster 4, Impediments to patient care | 2.9 (1.2) | 2.6,3.2 | 2.9 (1.2) | 2.2,3.7 | 2.9 (1.2) | 2.2,3.5 | 2.9 (1.1) | 2.3,3.5 | |
| 60 | Unprofessional conduct (e.g., shouting) between nurses and doctors needs to be reported | 3.8 (1.2) | 3.4,4.1 | 3.7 (1.4) | 2.8,4.5 | 3.8 (1.3) | 3.1,4.5 | 3.8 (1.0) | 3.3,4.3 |
| 35 | Workplace bullying impacts communication | 3.7 (1.4) | 3.3,4.1 | 3.6 (1.4) | 2.7,4.4 | 3.9 (1.4) | 3.2,4.6 | 3.7 (1.3) | 3.0,4.3 |
| 57 | Conflict can negatively affect the clinician’s wellbeing | 3.3 (1.2) | 3.0,3.6 | 3.7 (1.0) | 3.2,4.3 | 2.7 (1.1) | 2.2,3.3 | 3.4 (1.2) | 2.9,4.0 |
| 59 | Having English as a second language may impact nurse-doctor communication | 2.8 (1.4) | 2.4,3.2 | 2.7 (1.6) | 1.8,3.6 | 3.2 (1.3) | 2.5,3.9 | 2.5 (1.3) | 1.9,3.1 |
| 33 | Clinicians with a heavy caseload can be less effective at communicating | 2.8 (1.3) | 2.5,3.2 | 2.7 (1.2) | 2.0,3.5 | 2.5 (1.3) | 1.8,3.2 | 3.2 (1.3) | 2.6,3.8 |
| 30 | Personal issues (e.g., family stress) can impact communication | 2.7 (1.2) | 2.4,3.1 | 3.3 (1.3) | 2.5,4.0 | 2.5 (1.2) | 1.9,3.1 | 2.5 (0.9) | 2.1,3.0 |
| 56 | Poor communication between nurses and doctors may lead to people taking time off work | 2.6 (1.3) | 2.3,3.0 | 2.8 (1.3) | 2.1,3.6 | 2.7 (1.4) | 2.0,3.5 | 2.3 (1.2) | 1.8,2.9 |
| 62 | Critical comments negatively impacts the quality of communication | 2.6 (1.3) | 2.2,2.9 | 2.7 (1.2) | 2.0,3.5 | 2.5 (1.5) | 1.8,3.3 | 2.4 (1.3) | 1.8,3.1 |
| 34 | Personal Protective Equipment (PPE) is a barrier to effective communication | 1.9 (1.1) | 1.6,2.2 | 1.2 (0.6) | 0.9,1.5 | 2.1 (0.9) | 1.7,2.6 | 2.2 (1.2) | 1.6,2.8 |
| Cluster 5, Interpersonal skills | 2.7 (1.2) | 2.3,3.0 | 2.7 (1.3) | 1.9,3.5 | 2.7 (1.2) | 2.1,3.3 | 2.6 (1.2) | 2.0,3.1 | |
| 65 | Effective communication is a skill that needs to be taught when nurses and doctors are in training | 3.9 (1.2) | 3.5,4.2 | 4.0 (1.0) | 3.4,4.6 | 3.7 (1.3) | 3.0,4.3 | 4.0 (1.4) | 3.3,4.7 |
| 27 | Clinicians need to be approachable | 3.8 (1.2) | 3.4,4.1 | 3.7 (1.0) | 3.2,4.3 | 3.5 (1.5) | 2.8,4.3 | 3.9 (1.1) | 3.4,4.5 |
| 26 | The quality of communication between nurses and doctors can influence the ward atmosphere | 3.4 (1.3) | 3.0,3.8 | 3.4 (1.3) | 2.6,4.1 | 3.3 (1.4) | 2.6,4.0 | 3.5 (1.3) | 2.9,4.1 |
| 20 | Orientation of new staff improves effective nurse-doctor communication | 3.0 (1.3) | 2.7,3.4 | 2.9 (1.5) | 2.0,3.8 | 3.2 (1.4) | 2.5,4.0 | 3.0 (1.2) | 2.4,3.6 |
| 32 | The volume of information shared between nurses and doctors can impact understanding | 3.0 (1.2) | 2.6,3.3 | 3.4 (1.0) | 2.8,3.9 | 2.9 (1.2) | 2.3,3.5 | 2.7 (1.2) | 2.1,3.3 |
| 64 | Senior clinicians need to proactively help resolve conflicts between nurses and doctors | 2.8 (1.4) | 2.4,3.2 | 2.7 (1.5) | 1.8,3.5 | 3.2 (1.2) | 2.6,3.8 | 2.6 (1.4) | 1.9,3.3 |
| 24 | Finding time for informal discussions about how to improve patient care is important | 2.7 (1.4) | 2.3,3.1 | 2.7 (1.5) | 1.8,3.5 | 3.4 (1.4) | 2.6,4.1 | 2.0 (1.2) | 1.5,2.6 |
| 55 | Technology can be used to improve communication between nurses and doctors | 2.7 (1.4) | 2.3,3.1 | 2.8 (1.4) | 2.0,3.6 | 2.6 (1.6) | 1.8,3.4 | 2.7 (1.2) | 2.1,3.3 |
| 18 | Using the clinicians name in discussion improves communication | 2.5 (1.4) | 2.1,2.9 | 2.4 (1.6) | 1.4,3.3 | 2.9 (1.3) | 2.2,3.6 | 2.3 (1.2) | 1.7,2.9 |
| 21 | Communication is improved if nurse and doctors spend time getting to know each other | 2.3 (1.2) | 2.0,2.7 | 2.5 (1.2) | 1.8,3.2 | 2.4 (1.3) | 1.8,3.1 | 2.0 (1.2) | 1.5,2.6 |
| 10 | Clinicians have a different scope of practice | 2.2 (1.4) | 1.9,2.6 | 1.9 (1.3) | 1.1,2.7 | 2.2 (1.4) | 1.5,2.9 | 2.5 (1.4) | 1.9,3.2 |
| 46 | Doctors’ use of medical jargon impacts understanding by nurses | 2.1 (1.2) | 1.8,2.5 | 2.4 (1.5) | 1.5,3.2 | 2.0 (1.1) | 1.4,2.6 | 2.0 (1.2) | 1.5,2.6 |
| 68 | Doctors need to lead nurse-doctor communication | 2.0 (1.3) | 1.6,2.3 | 2.2 (1.6) | 1.3,3.1 | 1.6 (1.0) | 1.1,2.1 | 2.2 (1.3) | 1.6,2.8 |
| 31 | Clinicians with more clinical experience are better at communicating | 1.9 (1.1) | 1.6,2.2 | 2.1 (1.5) | 1.3,3.0 | 1.8 (1.0) | 1.3,2.3 | 1.9 (1.0) | 1.4,2.4 |
| 16 | Nurses need to lead nurse-doctor communication | 1.7 (1.0) | 1.5,2.0 | 1.6 (0.8) | 1.1,2.1 | 2.0 (0.9) | 1.5,2.4 | 1.6 (1.1) | 1.1,2.1 |
1 Number indicates the sequence (generated using random number generation function of the Microsoft Excel) that was entered in “Ariadne” software.
Disclaimer/Publisher’s Note: The statements, opinions and data contained in all publications are solely those of the individual author(s) and contributor(s) and not of MDPI and/or the editor(s). MDPI and/or the editor(s) disclaim responsibility for any injury to people or property resulting from any ideas, methods, instructions or products referred to in the content. |
© 2023 by the authors. Licensee MDPI, Basel, Switzerland. This article is an open access article distributed under the terms and conditions of the Creative Commons Attribution (CC BY) license (http://creativecommons.org/licenses/by/4.0/).
Copyright: This open access article is published under a Creative Commons CC BY 4.0 license, which permit the free download, distribution, and reuse, provided that the author and preprint are cited in any reuse.
Submitted:
12 August 2023
Posted:
15 August 2023
You are already at the latest version
Alerts
A peer-reviewed article of this preprint also exists.
This version is not peer-reviewed
Submitted:
12 August 2023
Posted:
15 August 2023
You are already at the latest version
Alerts
Abstract
There is some evidence that aspects of nurse-doctor communication are associated with the quality of care and treatment patients receive whilst they are in hospital. To date, no studies have examined stakeholder perceptions of how patient care is influenced by clinical communication between nurses and doctors. We conducted a concept mapping study to generate a deep understanding of how clinical communication impacts patient care. Concept mapping has six phases: preparation, idea generation, structuring, representation, interpretation, and utilization. Twenty patients, 21 nurses, and 21 doctors participated in the study. Brainstorming generated 69 discreet statements about how nurse-doctor communication impacts patient care. The structuring (rating and clustering) phase was completed by 48 participants. The data interpretation workshop selected a five-cluster solution: effective communication, trust, patient safety, impediments to patient care, and interpersonal skills. On the final concept map, the five clusters were arranged in a circle around the center of the map. Clusters were relatively equal in size suggesting, each concept makes a broadly equal contribution to how nurse-doctor communication influences patient care. Our study suggests that there are multiple aspects of clinical communication that impact patient care. Candidate interventions to enhance nurse-doctor communication may need to consider the complex nature of interprofessional working.
Registration: This study was prospectively registered with the Open Science Framework (OSF) (https://osf.io/9np8v/) prior to recruiting the first participant.
Keywords:
Subject: Public Health and Healthcare - Public Health and Health Services
Introduction
Nurses and doctors spend more time than any other professional groups providing direct patient care [1,2], spending on average between a quarter to half of their practice hours in this activity [3,4,5]. Around 90% of the care patients receive whilst they are in hospital are from nurses and doctors [1]. There is considerable overlap in the scope of practice between nurses and doctors underscoring the importance of effective and accurate interdisciplinary communication [6,7,8]. Patient care may be negatively impacted when nurse-doctor communication is inaccurate, distorted, or delayed [7,8].
Several authors have investigated the association between the quality of nurse-doctor communication and patient outcomes [9,10,11,12,13]. For example, Swiger et al. (2017) conducted a systematic review of 46 studies of nurse-doctor communication of which 14 were focused on associations with patient outcomes. The narrative synthesis indicated there was seemingly a consistent association between the quality of communication and reduced rates of medication errors and hospital-acquired pressure ulcers [13]. Kang et al. (2020) examined the association between the quality of nurse-doctor communication, determined using the Practice Environment Scale of the Nursing Work Index (PES-NWI), and 30-day mortality in surgical patients. The study involved 29,391 nurses and 1.32 million patients from 665 acute care hospitals (Kang et al., 2020). The authors report a one-unit increase in the quality of nurse-doctor communication was associated with a 5% reduction in hospital mortality [12].
Few studies have examined the association between the amount of nurse-doctor communication and patient outcomes [14,15,16,17] reporting inconsistent findings. Higgins et al. (1999), for example, reported no association between the amount of nurse-doctor communication and mortality and readmission in 175 patients admitted to Intensive Care. Conversely, Baggs et al. (1992) did report an association between the amount of nurse-doctor communication and patient outcomes. Rothberg et al. (2012) demonstrated an association between the amount of time doctors spend communicating with nurses and levels of agreement on patient care plans. However, there is a paucity of evidence that has examined how nurse-doctor communication impacts patient care. Developing a deeper understanding may inform the development of strategies to enhance interdisciplinary working [18].
Methods
Concept mapping is a mixed methods design extensively used to develop an understanding of complex problems [19,20]. There are six phases to concept mapping: preparation, idea generation (brainstorming), structuring (prioritization and clustering), representation (generation of concept map), interpretation, and utilization.
A protocol describing the methodology for this study has been previously reported [21]. We provide key details of the six phases of concept mapping that we followed.
Phase 1, Preparation
The aim of the first phase is to determine stakeholder groups that will be involved in the research and establish a focus question for the study. The three-stakeholder groups identified were patients, nurses, and medical doctors. The focus question was developed and refined through consultation with representatives of each of the stakeholder groups and members of the research team. We arrived at the focus question ‘How does nurse-doctor communication impact patient care?’
Stakeholder groups
For this research, we defined each of the three stakeholder groups as follows: we considered a patient to be anyone over the age of 18 that had been an inpatient in a medical or surgical ward for at least 24 hours within the last twelve months. Nurses and doctors were defined as registered health workers that spent at least one full day a week providing direct patient care in any clinical setting.
Recruitment and consent
We recruited participants by posting information about the research on various social media platforms (Supplementary Document S1, is the social media advert used for the study) including the “Doctors in Australia”, and “The Nurse break” social media groups. People interested in taking part in the research were asked to contact the study researcher who sent by email the participant information and consent form and arranged a meeting to explain the study and address any questions that they may have about the research. This conversation included a discussion about the possible risks associated with participating.
Participants willing to take part in the research provided an online electronic consent procedure using REDCap (Research Data Capture). We checked consent with all participants before each phase of concept mapping.
Immediately following the consent procedure participants were invited to provide basic demographic information (requested information listed in the protocol, Pantha et al., (2021)) by completing an online survey using REDCap.
Phase 2, Statement generation (Brainstorming)
Statement generation was conducted via video-conferenced individual interviews. The audio component of the interview was retained. Participants were asked to respond to the focus question, ‘How does nurse-doctor communication impact patient care?’ The researcher would invite participants to elaborate on responses by asking supplementary questions (e.g., can you tell me a bit more about...).
Each interview was listened to by a researcher, up to three times, to identify candidate statements. A statement was considered a sentence or phrase containing a single topic, that was easy to understand and did not contain any jargon or acronyms [22]. Statements from all study participants were then combined into a single document and duplicate or essentially similar statements were merged into a single item. Statements that did not relate to the focus question were removed. Statement reduction continued until there were fewer than 98 (the maximum number that can be analyzed by the concept mapping software we used).
Phase 3, Structuring of statements
Structuring of statements required participants to complete two tasks - prioritization and clustering - both undertaken using the online concept mapping software package “Ariadne”.
During the prioritization task, each statement was ranked on a five-point Likert scale from one, (least important) to five (most important). Participants were instructed to ensure that each point on the scale had an equal number (or as close to equal as was possible, if the number of statements was not divisible by five) of statements.
For the clustering task, participants were asked to group statements that seemed to belong together in up to 10 groups. Participants were advised that all statements cannot be piled up into a single cluster and there cannot be a ‘miscellaneous’ group. Additionally, they were asked to generate a label for each cluster.
Study participants were sent a link and a step-by-step guide (doi.org/10.26181/5f43450ce2999) to complete the structuring tasks. A follow-up email was sent after three days to check if there were any issues or problems completing the tasks or if additional support was required. If participants did not complete the task up to three reminder emails were sent.
Phase 4, Representation of the statements
In this phase, a series of candidate concept maps are generated from the clustering data using the “Ariadne” software package. There are three steps to data analysis: 1. Group Similarity Matrix, 2. Principal Component Analysis and 3. Hierarchical Cluster Analysis [23]. Clustering data are coded as a binary response (‘1′ when two statements are grouped, and ‘0′ when not grouped) to generate a group similarity matrix. A principal component analysis then transforms the group similarity matrix data into two-dimensional space, known as a ‘point map’. Each statement is represented as a dot on the map. Statements frequently grouped together appear closer; those infrequently arranged in a pair stay at a distance [24]. The objective of the principal component analysis is to flatten the multidimensional data into two-dimensional space without the loss of its structural integrity [25]. Finally, a hierarchical cluster analysis is computed to produce a series of maps with between two and 18 cluster solutions.
Phase 5, Data Interpretation
Data interpretation was undertaken in four steps. First, the research team reviewed each of the 17 candidate concept maps to eliminate cluster solutions that had overcrowding of statements in one cluster. In addition, concept maps with single statements forming separate clusters were also excluded. Next, we asked participants who completed the structuring phase if they would agree to participate in a single data interpretation workshop. Participants reviewed and discussed each of the candidate cluster solutions to agree on a final concept map that best represented the data. SP reviewed the point map to identify the theme reflected by the statements around the opposite extremes of the x and y axis and proposed labels to the idea captured by the four ends. The research team reviewed and determined the axis labels. The final step involved calculating an average importance rating for each cluster from the final concept map, overall and separately for each group.
Ethical Considerations
The La Trobe University human ethics committee reviewed and approved the study (HREC approval number 20172, 10th June 2020). The main ethical consideration for this study was the decision to reimburse participants for their time which may be considered an inducement to participate. Each participant was paid $25 for completing each phase of the study. The value of the payment was consistent with the Australian National Health and Medical Research Council guidance [26].
Potential study participants were sent written information about the study and then asked to provide consent electronically. There was no opportunity for researchers to check potential participants’ signing of the consent form. However, the study was considered low risk and our procedures for providing information and consent were considered appropriate by the research ethics committee.
Finally, it was possible that talking about the hospital experiences may have been distressing to some participants. Where this occurred, we had in place a stepped approach to provide additional support to participants.
Results
Fieldwork for the study was carried out between the 8th October 2020 and the 14th June 2021 (brainstorming interviews, 8th October 2020 through 5th February 2021 and structuring phase, 7th May through 14th June 2021). The data interpretation session was held on the 8th September 2021.
Figure 1 shows the flow of participants through the different phases of the study. Eighty-two people expressed an interest in participating. Of 78 who met our inclusion criteria, 68 provided written informed consent to take part in the research.
Table 1 shows the demographic characteristics of study participants overall and by stakeholder group. Most participants were female, in their mid-thirties and born in Australia. Around two-thirds were educated to a post-graduate level. Nurses and doctors who participated were generally trained in Australia. Nurses had almost a decade more clinical experience compared with doctors. There were no apparent systematic differences between participants that took part in the different phases of concept mapping.
Phase 2, Idea generation
Brainstorming
In total 62 participants generated 1,307 individual statements (a complete list of all statements is included in Supplementary Document S2). On average, brainstorming interviews lasted 26 minutes.
Statement reduction
Our first round of statement reduction removed 937 statements (Supplementary Document S3). A further 311 (Supplementary Document S4) statements were removed during the second round. The final list had 69 discreet statements (Supplementary Document S5). Statements were edited for clarity, retaining the original wording as far as possible [24].
Phase 3, Structuring of the statements
Fifty-two participants started structuring tasks (prioritization and clustering) that were completed by 48. One participant withdrew from the study after completion of both tasks, requesting their data be removed and destroyed. The final data set comprised data from 47 participants who completed both tasks. Participants organized statements into an average of six clusters. The importance rating (mean, standard deviation and 95% confidence interval) for each statement is shown in Table 2.
Phase 4, Representation of the statements
Figure 2 is the point map, produced from the clustering data, locating each statement (as a dot) on a two-dimensional space. Seventeen candidate concept maps were subsequently generated by “Ariadne” that can be accessed as Supplementary Document S6.
Phase 5, Data Interpretation
The research team reviewed each candidate concept maps (numbered two through 18 in Supplementary Document S6) and selected six (five to 10 cluster solutions) to take forward to the stakeholder interpretation workshop. Concept maps two to four were not considered for further discussion as many statements were not coherent. We removed concept maps 11 through 18 as multiple clusters comprised a single statement.
Five stakeholders (two patients, two nurses, and one doctor) participated in the data interpretation workshop, facilitated by one of the members of the research team (RG). The group reviewed each of the six candidate concept maps considering the strengths and limitations of each solution. The stakeholder group considered the five-cluster concept map as their preferred solution that best reflected the data. During the workshop participants also suggested possible labels for each cluster. However, participants were not able to finalise labels due to time restrictions. The research team made the final decision about the final cluster labels which was a deviation from the planned protocol (Pantha et al., 2021). Figure 3 is the final concept map.
Description of the axis
Concept maps locate individual statements and clusters on an X and Y-axis (Figure 2). The statements on the X-axis represented the quality of communication between nurses and doctors. Statements and clusters located toward the west suggest poor and the east good communication. The Y-axis reflected two concepts labelled, “patient-centered communication” located towards the north of the map and “barriers to effective communication” located on the south.
Description of the clusters
Figure 3 shows the final concept map with five clusters that circle the center of the map. The cluster rankings for all participants and by individual stakeholder group are shown in Table 2. The importance rating for all five clusters was towards the middle of the five-point scale. Figure 4 is a pattern match (or ladder) graph showing the rank order for the five clusters. There were no important differences between stakeholder groups as to which clusters were considered more or less important.
Cluster 1, Effective communication
“Effective communication” was the cluster rated as most important and included 20 statements. The cluster captured the importance of good communication between doctors and nurses to ensure high-quality, timely, patient care. The cluster was located toward the north and extreme east of the concept map. Example statements include “Precise communication is needed in emergency situations”, “A structured handover between nurses and doctors is important” and “Effective nurse-doctor communication ensures timely patient care”.
Cluster 2, Trust
Containing ten statements, the “Trust” cluster was in the centre and towards the north edge of the concept map. Statements in this cluster include “Doctors and nurses need to be honest with patients”, “Patient needs to fully understand their care and treatment”, and “Good communication will improve people’s faith in medicine”.
Cluster 3, Patient safety
The “Patient safety” cluster includes 15 statements. This cluster described how patient safety outcomes can be impacted by poor nurse-doctor communication. Example statements include “Important information about patient care gets lost if communication is poor”, “Poor communication can lead to worse health care outcomes in the longer term”, and “Dissatisfied patients will disengage with healthcare services.” The cluster was located on the extreme west of the concept map, across the x-axis.
Cluster 4, Impediments to patient care
There were nine statements in the cluster “Impediments to patient care”. The cluster reflects workplace factors that can potentially impact patient care. The cluster was located centrally towards the extreme south of the map. Statements in the cluster include “Workplace bullying impacts communication,” “Clinicians with heavy caseload can be less effective at communicating,” and “Critical comments negatively impact the quality of communication”.
Cluster 5, Interpersonal skills
Occupying the southeast quadrant of the concept map the “Interpersonal skills” cluster included 15 statements. The cluster encompassed interpersonal strategies that enhance nurse-doctor communication and include “Clinicians with more clinical experience are better at communicating”, “Finding time for informal discussions about patient care is important”, and “Using clinicians name in discussion improves communication.”
Discussion
This study used concept mapping to examine stakeholder perspectives on how nurse-doctor communication impacts patient care. Stakeholder groups identified that patient care was affected by the individual (e.g., clinical experience), interpersonal (e.g., trust) and workplace aspects (e.g., consistent shifts) of nurse-doctor communication. Broadly, all aspects of nurse-doctor communication were considered of equal importance by study participants.
The concepts identified in our study are consistent with those reported in previous reviews of nurse-doctor communication [27,28,29,30,31,32,33]. For example, a review of 38 studies by Bookey-Bassett et al. (2017) identified that effective communication and trust between clinicians facilitated enhanced management of long-term conditions. Similarly, Stutsky & Laschinger (2014) in their review of interprofessional communication found that trust, patient safety, and interpersonal skills were important in providing high-quality patient care.
Three features of our concept map require consideration. First, clusters were comparatively large but of approximately equal size, underscoring the observation that no one concept was more important than any other in terms of how nurse-doctor communication impacts patient care. The size of clusters could be due to important differences in how participants organized statements into groups during the clustering task. Second, statements within the cluster were not located close together suggesting clusters may lack a clear conceptual focus [24], underscoring the complexities of how patient care is impacted by nurse-doctor communication. Authors of reviews of interprofessional communication have also highlighted the complexity of interdisciplinary working [32,33,34]. Potentially our findings may explain why there are several examples in the literature where authors have focused on targeting a single aspect of nurse-doctor communication (e.g., joint clinical rounding, shared care planning) and failed to show improvements in patient outcomes [35,36]. Finally, two of the clusters (effective communication and interpersonal skills) were particularly close to each other, suggesting that they may be part of a single larger concept.
Limitations
There are several important limitations to consider when interpreting the findings of this study. First, participants were recruited through specific social media groups. It is plausible that there are important differences between people that do and do not engage with social media [37], potentially introducing selection bias. Around one in four participants did not complete the prioritizing and clustering tasks. However, our attrition rate was seemingly typical of concept mapping studies [20] and there did not appear to be a systematic reason for people dropping out of the research. We also note that concept mapping is a group process, and the final concept map is the reflection of the work of all participants rather than individuals per se. Concept maps produced by patients, nurses, and doctors were not analyzed separately. That said, we did not observe important differences between how the three stakeholders ranked individual statements and clusters. Finally, the axis and cluster labels were determined by the research team and not by study participants as is recommended in concept mapping [24]. Whilst stakeholders proposed cluster labels due to time constraints, consensus could not be reached. We acknowledge that the stakeholders could have labelled the clusters differently.
Conclusion
Patients, nurses, and doctors had broadly consistent views on how nurse-doctor communication may impact patient care. The relatively equal size and orientation of the clusters may suggest that all clusters are broadly of equal importance. There is a need for further research to develop insights into how patient care is influenced by clinical communication.
Supplementary Materials
The following supporting information can be downloaded at the website of this paper posted on Preprints.org. Supplementary Document S1, social media advert used for the study, Supplementary Document S2, complete list of all statements generated from the study, Supplementary Document S3, list of statements after first round of the reduction, Supplementary Document S4, list of statements removed during the second round of statement reduction, Supplementary Document S5, final list of 69 statements, Supplementary Document S6, 17 candidate concept maps generated using Ariadne software.
Author Contributions
All authors were involved in the conception of the study, development of the focus prompt. SP conducted brainstorming interviews, extracted statements from the interviews, and undertook the first and second round of statement reduction. All authors were involved in the final stages of statement reduction. SP facilitated communication with participants for rating and clustering tasks and analyzed Ariadne data to generate candidate concept maps. Maps were reviewed and shortlisted by all authors. RG facilitated the stakeholder meeting for data interpretation. SP prepared the first draft of the manuscript. RG undertook an extensive revision of the first draft of the manuscript. All authors reviewed and agreed to the final manuscript.
Funding
The corresponding author has received La Trobe University Postgraduate Research Scholarship (LTUPRS) and La Trobe University Full Fee Research Scholarship (LTUFFRS). There was no additional funding for the research. Participants were reimbursed a digital voucher of 25 AUD for each phase of the study. Fund for the reimbursement was supported by the HDR research grants for PhD study.
Institutional Review Board Statement
The study was approved by the La Trobe University human ethics committee (HEC – 20172).
Informed Consent Statement
All participants provided a written informed consent before the brainstorming interview. At each phase of the research, participants were asked if they still wanted to take part in the research.
Data availability statement
All data related to the research has been provided as Supplementary Materials (Supplementary Document S1 to S6).
Guidelines and Standards Statement
We searched the EQUATOR network website for the availability of a reporting guideline for concept mapping research. There is no reporting guideline available for the reporting of concept mapping research.
Conflicts of interest
Richard Gray is the editor-in-chief of nursing reports.
References
- Butler, R.; Monsalve, M.; Thomas, G.W.; Herman, T.; Segre, A.M.; Polgreen, P.M.; Suneja, M. Estimating Time Physicians and Other Health Care Workers Spend with Patients in an Intensive Care Unit Using a Sensor Network. The American Journal of Medicine 2018, 131, 972.e979–972.e915. [Google Scholar] [CrossRef] [PubMed]
- Wang, Y.-Y.; Wan, Q.-Q.; Lin, F.; Zhou, W.-J.; Shang, S.-M. Interventions to improve communication between nurses and physicians in the intensive care unit: An integrative literature review. International journal of nursing sciences 2018, 5, 81–88. [Google Scholar] [CrossRef] [PubMed]
- Song, X.; Kim, J.H.; Despins, L. Time-motion study in an intensive care unit using the near field electromagnetic ranging system. In Proceedings of Proceedings of the 2017 industrial and systems engineering conference, Pittsburgh, PA, USA.
- Wolff, J.; Auber, G.; Schober, T.; Schwär, F.; Hoffmann, K.; Metzger, M.; Heinzmann, A.; Krüger, M.; Normann, C.; Gitsch, G. , et al. Work time distribution of physicians at a German Hospital. Dtsch Arztebl Int 2017, 114, 705–711. [Google Scholar] [CrossRef] [PubMed]
- Michel, O.; Garcia Manjon, A.-J.; Pasquier, J.; Ortoleva Bucher, C. How do nurses spend their time? A time and motion analysis of nursing activities in an internal medicine unit. Journal of Advanced Nursing 2021, 77, 4459–4470. [Google Scholar] [CrossRef] [PubMed]
- Brennan, R.A.; Keohane, C.A. How Communication Among Members of the Health Care Team Affects Maternal Morbidity and Mortality. J Obstet Gynecol Neonatal Nurs 2016, 45, 878–884. [Google Scholar] [CrossRef] [PubMed]
- Fernando, O.; Coburn, N.G.; Nathens, A.B.; Hallet, J.; Ahmed, N.; Conn, L.G. Interprofessional communication between surgery trainees and nurses in the inpatient wards: Why time and space matter. J Interprof Care 2016, 30, 567–573. [Google Scholar] [CrossRef]
- Gleeson, L.L.; O’Brien, G.; O’Mahony, D.; Byrne, S. Interprofessional communication in the hospital setting: a systematic review of the qualitative literature. Journal of Interprofessional Care 2023, 37, 203–213. [Google Scholar] [CrossRef]
- Manojlovich, M.; DeCicco, B. Healthy Work Environments, Nurse-Physician Communication, and Patients’ Outcomes. American Journal of Critical Care 2007, 16, 536–543. [Google Scholar] [CrossRef]
- Ma, C.; McHugh, M.D.; Aiken, L.H. Organization of hospital nursing and 30-day readmissions in Medicare patients undergoing surgery. Medical care 2015, 53, 65. [Google Scholar] [CrossRef]
- Ma, C.; Park, S.H.; Shang, J. Inter- and intra-disciplinary collaboration and patient safety outcomes in U.S. acute care hospital units: A cross-sectional study. International Journal of Nursing Studies 2018, 85, 1–6. [Google Scholar] [CrossRef]
- Kang, X.L.; Brom, H.M.; Lasater, K.B.; McHugh, M.D. The association of nurse–physician teamwork and mortality in surgical patients. Western Journal of Nursing Research 2020, 42, 245–253. [Google Scholar] [CrossRef] [PubMed]
- Swiger, P.A.; Patrician, P.A.; Miltner, R.S.S.; Raju, D.; Breckenridge-Sproat, S.; Loan, L.A. The Practice Environment Scale of the Nursing Work Index: An updated review and recommendations for use. Int J Nurs Stud 2017, 74, 76–84. [Google Scholar] [CrossRef] [PubMed]
- Baggs, J.G.; Ryan, S.A.; Phelps, C.E.; Richeson, J.F.; Johnson, J.E. The association between interdisciplinary collaboration and patient outcomes in a medical intensive care unit. Heart & lung: the journal of critical care 1992, 21, 18–24. [Google Scholar]
- Baggs, J.G.; Schmitt, M.H.; Mushlin, A.I.; Mitchell, P.H.; Eldredge, D.H.; Oakes, D.; Hutson, A.D. Association between nurse-physician collaboration and patient outcomes in three intensive care units. Critical care medicine 1999, 27, 1991–1998. [Google Scholar] [CrossRef] [PubMed]
- Higgins, L.W. Nurses’ perceptions of collaborative nurse–physician transfer decision making as a predictor of patient outcomes in a medical intensive care unit. Journal of Advanced Nursing 1999, 29, 1434–1443. [Google Scholar] [CrossRef] [PubMed]
- Rothberg, M.B.; Steele, J.R.; Wheeler, J.; Arora, A.; Priya, A.; Lindenauer, P.K. The Relationship Between Time Spent Communicating and Communication Outcomes on a Hospital Medicine Service. Journal of General Internal Medicine 2012, 27, 185–189. [Google Scholar] [CrossRef]
- Ward, P. Trust and communication in a doctor-patient relationship: a literature review. Arch Med 2018, 3, 36. [Google Scholar]
- Trochim, W.; Kane, M. Concept mapping: An introduction to structured conceptualization in health care. International Journal for Quality in Health Care 2005, 17, 187–191. [Google Scholar] [CrossRef]
- Rosas, S.R.; Kane, M. Quality and rigor of the concept mapping methodology: a pooled study analysis. Evaluation and program planning 2012, 35, 236–245. [Google Scholar] [CrossRef]
- Pantha, S.; Jones, M.; Gray, R. Stakeholders’ perceptions of how nurse-physician communication may impact patient care: protocol for a concept mapping study. Journal of Interprofessional Care 2021, 1–3. [Google Scholar] [CrossRef]
- Cardwell, R.; McKenna, L.; Davis, J.; Gray, R. How is clinical credibility defined in nursing? Protocol for a concept mapping study. J Clin Nurs 2019. [CrossRef]
- Severans, P. Manual Ariadne 3.0; 2015.
- Trochim, W.M.; McLinden, D. Introduction to a special issue on concept mapping. Evaluation and Program Planning 2017, 60, 166–175. [Google Scholar] [CrossRef] [PubMed]
- Abdi, H.; Williams, L.J. Principal component analysis. Wiley interdisciplinary reviews: computational statistics 2010, 2, 433–459. [Google Scholar] [CrossRef]
- National Health and Medical Research Council. Payment of participants in research: Information for researchers, HRECs and other ethics review bodies; R41F; Australian Research Council and Universities Australia: Canberra, 2019; p 14.
- D’amour, D.; Ferrada-Videla, M.; San Martin Rodriguez, L.; Beaulieu, M.-D. The conceptual basis for interprofessional collaboration: core concepts and theoretical frameworks. Journal of interprofessional care 2005, 19, 116–131. [Google Scholar] [CrossRef] [PubMed]
- Stutsky, B.J.; Laschinger, H.K.S. Development and Testing of a Conceptual Framework for Interprofessional Collaborative Practice. Health & Interprofessional Practice 2014, 2. [Google Scholar] [CrossRef]
- Bainbridge, L.; Nasmith, L.; Orchard, C.; Wood, V. Competencies for interprofessional collaboration. Journal of Physical Therapy Education 2010, 24, 6–11. [Google Scholar] [CrossRef]
- Bookey-Bassett, S.; Markle-Reid, M.; Mckey, C.A.; Akhtar-Danesh, N. Understanding interprofessional collaboration in the context of chronic disease management for older adults living in communities: a concept analysis. Journal of advanced nursing 2017, 73, 71–84. [Google Scholar] [CrossRef]
- Petri, L. Concept Analysis of Interdisciplinary Collaboration. Nursing Forum 2010, 45, 73–82. [Google Scholar] [CrossRef]
- Tan, T.C.; Zhou, H.; Kelly, M. Nurse-physician communication - An integrated review. Journal of Clinical Nursing 2017, 26, 3974–3989. [Google Scholar] [CrossRef]
- House, S.; Havens, D. Nurses’ and physicians’ perceptions of nurse-physician collaboration: a systematic review. JONA: The Journal of Nursing Administration 2017, 47, 165–171. [Google Scholar] [CrossRef]
- Cypress, B.S. Exploring the concept of nurse-physician communication within the context of health care outcomes using the evolutionary method of concept analysis. Dimensions of Critical Care Nursing 2011, 30, 28–38. [Google Scholar] [CrossRef]
- Pannick, S.; Davis, R.; Ashrafian, H.; Byrne, B.E.; Beveridge, I.; Athanasiou, T.; Wachter, R.M.; Sevdalis, N. Effects of Interdisciplinary Team Care Interventions on General Medical Wards: A Systematic Review. JAMA Intern Med 2015, 175, 1288–1298. [Google Scholar] [CrossRef] [PubMed]
- Reeves, S.; Pelone, F.; Harrison, R.; Goldman, J.; Zwarenstein, M. Interprofessional collaboration to improve professional practice and healthcare outcomes. Cochrane Database Syst Rev 2017, 6. [Google Scholar] [CrossRef] [PubMed]
- Hong, S.; Oh, S.K. Why People Don’t Use Facebook Anymore? An Investigation Into the Relationship Between the Big Five Personality Traits and the Motivation to Leave Facebook. Frontiers in Psychology 2020, 11. [Google Scholar] [CrossRef] [PubMed]
Figure 1.
Flow of participants through different phases of concept mapping.
Figure 2.
Point map showing the location of individual statements against the X and Y axis.
Figure 3.
Five-cluster concept map generated by the participants.
Figure 4.
Pattern match showing stakeholders’ rankings of five clusters.
Table 1.
Participant demographic characteristics.
| Characteristics | Participant groups | ||||||||
|---|---|---|---|---|---|---|---|---|---|
| All | Patient | Nurse | Doctor | ||||||
| Brainstorming | Clustering & prioritization | Brainstorming | Clustering & prioritization | Brainstorming | Clustering & prioritization | Brainstorming | Clustering & prioritization | ||
| (n=62) | (n = 47) | (n = 20) | (n = 13) | (n = 21) | (n = 16) | (n = 21) | (n = 18) | ||
| Gender (Female) | 47 (77%) | 38 (81%) | 14 (70%) | 10 (77 %) | 19 (90.5 %) | 14 (88%) | 14 (78%) | 14 (78%) | |
| Age in years (Mean, SD) | 35.9 (10.2) | 38.2 (12.3) | 45 (17) | 43.4 (14.7) | 41 (10.3) | 42.6 (11.1) | 30.3 (6.9) | 30.5 (7.1) | |
| Country of Birth | Australia | 34 (55%) | 28 (60 %) | 11 (55%) | 8 (62%) | 10 (48%) | 9 (56%) | 13 (62%) | 11 (62%) |
| Other | 28 (45%) | 19 (40 %) | 9 (45%) | 5 (38%) | 11 (52%) | 7 (44%) | 9 (38%) | 7 (38%) | |
| Highest educational qualification1 | Undergraduate | 2 (3%) | 2 (4%) | 2 (10%) | 2 (15%) | - | - | - | - |
| Graduate | 19 (31%) | 14 (30%) | 5 (25%) | 2 (15%) | 4 (19%) | 3 (19%) | 10 (48%) | 9 (50%) | |
| Postgraduate | 39 (63%) | 29 (62%) | 13 (65%) | 9 (70%) | 16 (76%) | 12 (75%) | 10 (48%) | 8 (44%) | |
| Country of clinical qualification | Australia | 32 (76%) | 27 (80%) | - | - | 15 (71%) | 12 (75%) | 17 (81%) | 15 (83%) |
| Other | 10 (24%) | 7 (20%) | - | - | 6 (29%) | 4 (25%) | 4 (19%) | 3 (17%) | |
| Years of clinical work (Mean, SD)2 | 9.3 (9.3) | 9.3 (9.9) | - | - | 13.5 (10.4) | 14.6 (11.2) | 4.8 (5.2) | 4.2 (4.6) | |
| Years at current workplace (Mean, SD)2 | 4.1 (5.2) | 4.3 (5.4) | - | - | 6.3 (6.3) | 7 (6.7) | 2 (1.7) | 1.8 (1.6) | |
| Clinical setting | Medical ward | - | - | 7 (35%) | 4 (30%) | - | - | - | - |
| Surgical ward | - | - | 12 (60%) | 8 (62%) | - | - | - | - | |
| Do not know | - | - | 1 (5%) | 1 (8%) | - | - | - | - | |
1 Information not available for two participants. 2 One of the doctors did not provide information.
Table 2.
Rating score for sixty-nine statements, disaggregated by stakeholder groups.
| Number1 | Statement | All stakeholders | Patient | Nurse | Doctor | ||||
|---|---|---|---|---|---|---|---|---|---|
| Mean, SD | 95% CI | Mean, SD | 95% CI | Mean, SD | 95% CI | Mean, SD | 95% CI | ||
| Cluster 1, Effective communication | 3.4 (1.3) | 3.1,3.8 | 3.5 (1.2) | 2.8,4.2 | 3.5 (1.3) | 2.9,4.2 | 3.4 (1.2) | 2.8,3.9 | |
| 23 | Precise communication is required in emergency situations (e.g., cardiac arrest) | 4.6 (1.1) | 4.3,4.9 | 4.9 (0.4) | 4.7,5.1 | 4.2 (1.5) | 3.5,5.0 | 4.7 (0.9) | 4.3,5.1 |
| 61 | Clear and detailed clinical documentation is an important aspect of nurse-doctor communication | 4.2 (1.0) | 4.0,4.5 | 3.7 (1.3) | 3.0,4.5 | 4.5 (0.8) | 4.1,4.9 | 4.3 (0.9) | 3.9,4.7 |
| 4 | Effective nurse-doctor communication improves the quality of patient care | 4.1 (1.2) | 3.7,4.4 | 3.8 (1.4) | 3.0,4.6 | 4.1 (1.4) | 3.4,4.8 | 4.2 (1.0) | 3.7,4.7 |
| 13 | Effective nurse-doctor communication ensures timely patient care | 3.9 (1.2) | 3.6,4.3 | 4.1 (0.9) | 3.6,4.7 | 3.9 (1.0) | 3.4,4.4 | 3.8 (1.4) | 3.1,4.5 |
| 17 | Good communication is important across all shifts (including nights) | 3.9 (1.2) | 3.5,4.2 | 3.7 (1.3) | 3.0,4.5 | 3.7 (1.3) | 3.0,4.3 | 4.1 (1.1) | 3.6,4.6 |
| 8 | Nurses need ensure they are aware of change in patients care plans | 3.9 (1.1) | 3.7,4.2 | 4.0 (1.1) | 3.4,4.6 | 4.5 (0.6) | 4.2,4.8 | 3.4 (1.1) | 2.9,4.0 |
| 66 | Nurses and doctors need to have a good understand of current evidence-based practice guidelines | 3.7 (1.3) | 3.3,4.1 | 3.7 (1.2) | 3.1,4.4 | 3.8 (1.5) | 3.0,4.6 | 3.5 (1.3) | 2.9,4.2 |
| 3 | Nurses and doctors need to provide multidisciplinary patient care | 3.6 (1.4) | 3.2,4.0 | 3.4 (1.5) | 2.5,4.3 | 3.9 (1.2) | 3.3,4.5 | 3.4 (1.6) | 2.7,4.2 |
| 7 | Advice from nurses help doctors to plan patient care | 3.6 (1.2) | 3.2,3.9 | 3.3 (1.4) | 2.5,4.1 | 3.8 (1.1) | 3.2,4.4 | 3.5 (1.0) | 3.1,4.0 |
| 15 | Doctors need to make sure that the instructions they give to nurses is understood | 3.6 (1.1) | 3.4,3.9 | 3.9 (0.9) | 3.4,4.4 | 3.4 (1.3) | 2.8,4.1 | 3.7 (1.1) | 3.2,4.2 |
| 6 | Nurses and doctors need to trust each other’s capabilities | 3.5 (1.2) | 3.1,3.8 | 3.7 (1.2) | 3.0,4.5 | 3.4 (1.4) | 2.7,4.1 | 3.3 (1.1) | 2.8,3.8 |
| 29 | A structured handover between nurses and doctors is important | 3.4 (1.3) | 3.0,3.8 | 3.7 (1.0) | 3.1,4.3 | 3.1 (1.5) | 2.4,3.9 | 3.4 (1.3) | 2.8,4.1 |
| 11 | Nurses are a bridge between patient and the doctor | 3.3 (1.5) | 2.9,3.7 | 3.2 (1.6) | 2.3,4.1 | 3.9 (1.5) | 3.2,4.7 | 2.8 (1.3) | 2.2,3.5 |
| 37 | Nurses and doctors need to make sure that they do not discuss patient care where they can be overheard | 3.2 (1.4) | 2.8,3.6 | 3.0 (1.4) | 2.1,3.8 | 3.4 (1.5) | 2.6,4.2 | 3.0 (1.4) | 2.4,3.7 |
| 67 | Nurses need prioritise care that impacts patient recovery | 3.2 (1.3) | 2.9,3.6 | 3.4 (1.4) | 2.5,4.2 | 3.2 (1.3) | 2.5,3.8 | 3.2 (1.4) | 2.5,3.9 |
| 5 | Good nurse-doctor communication reminds clinicians what tasks need to be completed | 3.1 (1.4) | 2.7,3.5 | 2.6 (1.5) | 1.7,3.5 | 3.4 (1.1) | 2.8,3.9 | 3.2 (1.5) | 2.4,3.9 |
| 25 | Nurses and doctors should discuss care plan before seeing the patient | 3.0 (1.4) | 2.6,3.4 | 4.0 (0.9) | 3.5,4.5 | 3.3 (1.3) | 2.6,4.0 | 1.9 (1.1) | 1.4,2.5 |
| 45 | Clear allocation of tasks to nurses and doctors | 3.0 (1.1) | 2.7,3.3 | 3.1 (1.2) | 2.4,3.8 | 2.7 (1.0) | 2.2,3.2 | 3.2 (1.2) | 2.6,3.7 |
| 9 | Clinical problems can only be addressed through positive nurse-doctor communication | 2.9 (1.4) | 2.6,3.3 | 3.0 (1.4) | 2.2,3.8 | 3.1 (1.6) | 2.3,4.0 | 2.8 (1.2) | 2.2,3.4 |
| 12 | Communication is enhanced if nurses and doctors have consistent shifts (working hours) | 2.2 (1.3) | 1.8,2.6 | 2.4 (1.5) | 1.6,3.3 | 1.8 (1.1) | 1.2,2.4 | 2.4 (1.4) | 1.7,3.1 |
| Cluster 2, Trust | 3.2 (1.3) | 2.9,3.6 | 3.4 (1.2) | 2.7,4.1 | 3.3 (1.2) | 2.7,4.0 | 3.0 (1.2) | 2.6,3.6 | |
| 2 | Nurses and doctors need to be good at communicating with family members | 3.9 (1.1) | 3.6,4.2 | 4.2 (1.0) | 3.6,4.8 | 4.0 (1.2) | 3.4,4.6 | 3.5 (1.0) | 3.0,4.0 |
| 42 | Doctors and nurses need to be honest with patients | 3.9 (1.1) | 3.6,4.2 | 4.0 (1.3) | 3.3,4.8 | 3.5 (1.1) | 3.0,4.1 | 4.0 (1.0) | 3.5,4.5 |
| 28 | Patients need to fully understand their care and treatment | 3.6 (1.4) | 3.2,4.0 | 4.4 (0.8) | 3.9,4.8 | 3.7 (1.5) | 2.9,4.5 | 2.9 (1.4) | 2.2,3.6 |
| 52 | Good interdisciplinary communication will ensure that discharge plans are meaningful | 3.6 (1.2) | 3.3,3.9 | 2.9 (1.3) | 2.2,3.6 | 3.9 (1.1) | 3.3,4.5 | 3.7 (0.9) | 3.3,4.1 |
| 40 | Doctors and nurses need to use language that can be understood by the patient | 3.5 (1.4) | 3.1,3.9 | 4.1 (1.2) | 3.5,4.8 | 3.7 (1.4) | 2.9,4.4 | 3.0 (1.5) | 2.3,3.7 |
| 53 | Good communication between doctors and nurses can comfort patients | 3.3 (1.5) | 2.9,3.7 | 3.8 (1.4) | 3.0,4.6 | 3.4 (1.5) | 2.6,4.1 | 2.9 (1.4) | 2.2,3.6 |
| 19 | Direct (face-to-face) communication reduce delays in patient care | 3.2 (1.4) | 2.8,3.6 | 3.2 (1.4) | 2.4,4.0 | 3.0 (1.2) | 2.4,3.7 | 3.4 (1.7) | 2.6,4.2 |
| 1 | Good communication will improve people’s faith in medicine | 3.0 (1.3) | 2.7,3.4 | 3.1 (1.2) | 2.4,3.8 | 2.8 (1.3) | 2.1,3.5 | 3.1 (1.3) | 2.5,3.7 |
| 69 | Patients tend to share more information with nurses than doctors | 2.6 (1.4) | 2.2,3.0 | 2.2 (1.3) | 1.5,2.9 | 3.3 (1.6) | 2.5,4.1 | 2.2 (1.2) | 1.6,2.8 |
| 38 | Patients can influence communication between nurses and doctors | 2.0 (0.9) | 1.8,2.3 | 2.1 (1.2) | 1.5,2.8 | 2.0 (0.8) | 1.6,2.4 | 2.0 (0.9) | 1.6,2.5 |
| Cluster 3, Patient safety | 3.1 (1.3) | 2.8,3.5 | 3.1 (1.3) | 2.3,3.9 | 3.1 (1.3) | 2.4,3.9 | 3.1 (1.2) | 2.5,3.7 | |
| 49 | When vital information is not communicated, it can lead to an increased risk of mortality | 4.2 (1.1) | 3.9,4.5 | 4.0 (1.1) | 3.4,4.7 | 3.9 (1.3) | 3.2,4.5 | 4.6 (0.8) | 4.3,5.0 |
| 14 | Important information about patient care gets lost if communication is poor | 3.7 (1.2) | 3.3,4.0 | 3.2 (1.5) | 2.4,4.1 | 3.7 (1.2) | 3.1,4.4 | 3.9 (1.0) | 3.5,4.4 |
| 44 | Poor communication can lead to worse health care outcomes in the longer term | 3.7 (1.2) | 3.4,4.1 | 3.2 (1.3) | 2.4,4.0 | 3.6 (1.1) | 3.0,4.2 | 4.2 (1.1) | 3.6,4.7 |
| 43 | Bad communication between nurses and doctors may be traumatic for the patient | 3.4 (1.3) | 3.1,3.8 | 3.5 (1.3) | 2.8,4.3 | 3.5 (1.3) | 2.9,4.2 | 3.3 (1.3) | 2.6,3.9 |
| 48 | Patients can get wrong treatment | 3.2 (1.5) | 2.8,3.7 | 3.5 (1.5) | 2.6,4.4 | 3.2 (1.6) | 2.4,4.0 | 3.1 (1.6) | 2.4,3.9 |
| 41 | Poor communication may prolong a patient’s period of hospitalisation | 3.2 (1.4) | 2.8,3.5 | 3.3 (1.3) | 2.5,4.0 | 3.2 (1.4) | 2.5,4.0 | 3.0 (1.4) | 2.3,3.7 |
| 63 | Delayed communication can lead to frustration | 3.1 (1.3) | 2.8,3.5 | 3.4 (1.4) | 2.6,4.2 | 3.2 (1.5) | 2.4,4.0 | 2.9 (1.2) | 2.3,3.5 |
| 36 | Poor communication may mean that patients are sent to an inappropriate clinical setting | 3.1 (1.2) | 2.8,3.4 | 3.0 (1.1) | 2.4,3.7 | 3.0 (1.4) | 2.3,3.8 | 3.2 (1.2) | 2.6,3.7 |
| 47 | Poor communication may increase the chances of a patient needed to be readmitted | 3.0 (1.4) | 2.7,3.4 | 3.1 (1.5) | 2.3,4.0 | 2.9 (1.3) | 2.2,3.6 | 3.2 (1.4) | 2.5,3.8 |
| 39 | Poor communication may mean that patients are not clear about the self-care behaviours they need to change | 2.9 (1.4) | 2.5,3.2 | 3.2 (1.1) | 2.6,3.9 | 3.0 (1.6) | 2.2,3.8 | 2.5 (1.3) | 1.9,3.1 |
| 51 | Poor communication may mean that patients do not get the required interdepartmental consultation on time | 2.9 (1.3) | 2.5,3.3 | 2.6 (1.4) | 1.8,3.4 | 3.4 (1.2) | 2.8,4.0 | 2.7 (1.4) | 2.1,3.4 |
| 54 | Dissatisfied patients will disengage with healthcare services | 2.8 (1.5) | 2.4,3.2 | 2.8 (1.6) | 1.9,3.8 | 2.9 (1.5) | 2.1,3.7 | 2.7 (1.4) | 2.1,3.4 |
| 22 | The severity of a patient’s condition can impact communication | 2.7 (1.2) | 2.3,3.0 | 2.3 (1.1) | 1.7,2.9 | 2.6 (1.4) | 1.9,3.3 | 3.0 (1.2) | 2.5,3.6 |
| 50 | Patients can be discharged before they are ready | 2.5 (1.3) | 2.1,2.9 | 2.5 (1.3) | 1.8,3.3 | 2.5 (1.4) | 1.8,3.2 | 2.5 (1.3) | 1.9,3.1 |
| 58 | Patients are more likely to complain if they witness poor communication between nurses and doctors | 2.5 (1.2) | 2.2,2.8 | 2.8 (1.1) | 2.2,3.5 | 2.6 (1.4) | 1.9,3.4 | 2.2 (1.1) | 1.6,2.7 |
| Cluster 4, Impediments to patient care | 2.9 (1.2) | 2.6,3.2 | 2.9 (1.2) | 2.2,3.7 | 2.9 (1.2) | 2.2,3.5 | 2.9 (1.1) | 2.3,3.5 | |
| 60 | Unprofessional conduct (e.g., shouting) between nurses and doctors needs to be reported | 3.8 (1.2) | 3.4,4.1 | 3.7 (1.4) | 2.8,4.5 | 3.8 (1.3) | 3.1,4.5 | 3.8 (1.0) | 3.3,4.3 |
| 35 | Workplace bullying impacts communication | 3.7 (1.4) | 3.3,4.1 | 3.6 (1.4) | 2.7,4.4 | 3.9 (1.4) | 3.2,4.6 | 3.7 (1.3) | 3.0,4.3 |
| 57 | Conflict can negatively affect the clinician’s wellbeing | 3.3 (1.2) | 3.0,3.6 | 3.7 (1.0) | 3.2,4.3 | 2.7 (1.1) | 2.2,3.3 | 3.4 (1.2) | 2.9,4.0 |
| 59 | Having English as a second language may impact nurse-doctor communication | 2.8 (1.4) | 2.4,3.2 | 2.7 (1.6) | 1.8,3.6 | 3.2 (1.3) | 2.5,3.9 | 2.5 (1.3) | 1.9,3.1 |
| 33 | Clinicians with a heavy caseload can be less effective at communicating | 2.8 (1.3) | 2.5,3.2 | 2.7 (1.2) | 2.0,3.5 | 2.5 (1.3) | 1.8,3.2 | 3.2 (1.3) | 2.6,3.8 |
| 30 | Personal issues (e.g., family stress) can impact communication | 2.7 (1.2) | 2.4,3.1 | 3.3 (1.3) | 2.5,4.0 | 2.5 (1.2) | 1.9,3.1 | 2.5 (0.9) | 2.1,3.0 |
| 56 | Poor communication between nurses and doctors may lead to people taking time off work | 2.6 (1.3) | 2.3,3.0 | 2.8 (1.3) | 2.1,3.6 | 2.7 (1.4) | 2.0,3.5 | 2.3 (1.2) | 1.8,2.9 |
| 62 | Critical comments negatively impacts the quality of communication | 2.6 (1.3) | 2.2,2.9 | 2.7 (1.2) | 2.0,3.5 | 2.5 (1.5) | 1.8,3.3 | 2.4 (1.3) | 1.8,3.1 |
| 34 | Personal Protective Equipment (PPE) is a barrier to effective communication | 1.9 (1.1) | 1.6,2.2 | 1.2 (0.6) | 0.9,1.5 | 2.1 (0.9) | 1.7,2.6 | 2.2 (1.2) | 1.6,2.8 |
| Cluster 5, Interpersonal skills | 2.7 (1.2) | 2.3,3.0 | 2.7 (1.3) | 1.9,3.5 | 2.7 (1.2) | 2.1,3.3 | 2.6 (1.2) | 2.0,3.1 | |
| 65 | Effective communication is a skill that needs to be taught when nurses and doctors are in training | 3.9 (1.2) | 3.5,4.2 | 4.0 (1.0) | 3.4,4.6 | 3.7 (1.3) | 3.0,4.3 | 4.0 (1.4) | 3.3,4.7 |
| 27 | Clinicians need to be approachable | 3.8 (1.2) | 3.4,4.1 | 3.7 (1.0) | 3.2,4.3 | 3.5 (1.5) | 2.8,4.3 | 3.9 (1.1) | 3.4,4.5 |
| 26 | The quality of communication between nurses and doctors can influence the ward atmosphere | 3.4 (1.3) | 3.0,3.8 | 3.4 (1.3) | 2.6,4.1 | 3.3 (1.4) | 2.6,4.0 | 3.5 (1.3) | 2.9,4.1 |
| 20 | Orientation of new staff improves effective nurse-doctor communication | 3.0 (1.3) | 2.7,3.4 | 2.9 (1.5) | 2.0,3.8 | 3.2 (1.4) | 2.5,4.0 | 3.0 (1.2) | 2.4,3.6 |
| 32 | The volume of information shared between nurses and doctors can impact understanding | 3.0 (1.2) | 2.6,3.3 | 3.4 (1.0) | 2.8,3.9 | 2.9 (1.2) | 2.3,3.5 | 2.7 (1.2) | 2.1,3.3 |
| 64 | Senior clinicians need to proactively help resolve conflicts between nurses and doctors | 2.8 (1.4) | 2.4,3.2 | 2.7 (1.5) | 1.8,3.5 | 3.2 (1.2) | 2.6,3.8 | 2.6 (1.4) | 1.9,3.3 |
| 24 | Finding time for informal discussions about how to improve patient care is important | 2.7 (1.4) | 2.3,3.1 | 2.7 (1.5) | 1.8,3.5 | 3.4 (1.4) | 2.6,4.1 | 2.0 (1.2) | 1.5,2.6 |
| 55 | Technology can be used to improve communication between nurses and doctors | 2.7 (1.4) | 2.3,3.1 | 2.8 (1.4) | 2.0,3.6 | 2.6 (1.6) | 1.8,3.4 | 2.7 (1.2) | 2.1,3.3 |
| 18 | Using the clinicians name in discussion improves communication | 2.5 (1.4) | 2.1,2.9 | 2.4 (1.6) | 1.4,3.3 | 2.9 (1.3) | 2.2,3.6 | 2.3 (1.2) | 1.7,2.9 |
| 21 | Communication is improved if nurse and doctors spend time getting to know each other | 2.3 (1.2) | 2.0,2.7 | 2.5 (1.2) | 1.8,3.2 | 2.4 (1.3) | 1.8,3.1 | 2.0 (1.2) | 1.5,2.6 |
| 10 | Clinicians have a different scope of practice | 2.2 (1.4) | 1.9,2.6 | 1.9 (1.3) | 1.1,2.7 | 2.2 (1.4) | 1.5,2.9 | 2.5 (1.4) | 1.9,3.2 |
| 46 | Doctors’ use of medical jargon impacts understanding by nurses | 2.1 (1.2) | 1.8,2.5 | 2.4 (1.5) | 1.5,3.2 | 2.0 (1.1) | 1.4,2.6 | 2.0 (1.2) | 1.5,2.6 |
| 68 | Doctors need to lead nurse-doctor communication | 2.0 (1.3) | 1.6,2.3 | 2.2 (1.6) | 1.3,3.1 | 1.6 (1.0) | 1.1,2.1 | 2.2 (1.3) | 1.6,2.8 |
| 31 | Clinicians with more clinical experience are better at communicating | 1.9 (1.1) | 1.6,2.2 | 2.1 (1.5) | 1.3,3.0 | 1.8 (1.0) | 1.3,2.3 | 1.9 (1.0) | 1.4,2.4 |
| 16 | Nurses need to lead nurse-doctor communication | 1.7 (1.0) | 1.5,2.0 | 1.6 (0.8) | 1.1,2.1 | 2.0 (0.9) | 1.5,2.4 | 1.6 (1.1) | 1.1,2.1 |
1 Number indicates the sequence (generated using random number generation function of the Microsoft Excel) that was entered in “Ariadne” software.
Disclaimer/Publisher’s Note: The statements, opinions and data contained in all publications are solely those of the individual author(s) and contributor(s) and not of MDPI and/or the editor(s). MDPI and/or the editor(s) disclaim responsibility for any injury to people or property resulting from any ideas, methods, instructions or products referred to in the content. |
© 2023 by the authors. Licensee MDPI, Basel, Switzerland. This article is an open access article distributed under the terms and conditions of the Creative Commons Attribution (CC BY) license (http://creativecommons.org/licenses/by/4.0/).
Copyright: This open access article is published under a Creative Commons CC BY 4.0 license, which permit the free download, distribution, and reuse, provided that the author and preprint are cited in any reuse.
Implementing a Care Pathway for Complex Chronic Patients from a Nursing Perspective: A Qualitative Study
Rosario Fernández-Peña
et al.
IJERPH,
2021
The Patient Experience: Informing Practice through Identification of Meaningful Communication from the Patient’s Perspective
Angela Grocott
et al.
Healthcare,
2018


MDPI Initiatives
Important Links
© 2024 MDPI (Basel, Switzerland) unless otherwise stated