1. Introduction
We live in an amazing Universe. Its relict radiation or the cosmic microwave background – the radiation filling everywhere the universe with a temperature of about 3 K, poses, in fact, the blackbody radiation [
1]. The first question that arises in this regard concerns the essence of space-time containing this blackbody.
What is space, time, and matter motion? This question has accompanied humanity since antiquity [
2]. The contrary views about space and time have developed in the form of two dialectical opposite ideas, later known as the Democritus-Newton and conceptions [
3,
4]. According to Democritus everything is made up of tiny, invisible, indivisible corpuscles, named "atoms". Atoms diffuse in space and can combine by forming complex visible objects. Between atoms there exists an empty space. On the other hand, Aristotle, student of Plato’s Academy in Athens, believed that the Universe is presented in two parts, the terrestrial part and celestial. The terrestrial part comprises combinations of four substances - fire, air, water, and earth (plasma, gas, fluid, solid, in the modern view). Whereas the celestial part (Sun, planets, stars) consists of ether, a special kind of matter that is not found on Earth. According to Aristotle, emptiness does not exist.
These two opposite ideas on the organization of our world, conditionally speaking the corpuscular world and wavy world, compete for centuries.
The Aristotle celestial element has none of the qualities of the four terrestrial classical elements – fire, air, water, and earth. This element, named by the fifth element and also called ether, possesses radically other qualities than the terrestrial elements. The ether attracted the attention of naturalists as a medium capable of transferring light perturbations.
Isaac Newton and Christian Huygens put forward theories in the seventeenth century for the spreading of light through space.
Huygens believed that the space is everywhere densely filled with the ether [
5], through which light may spread from point to point due to a secondary re-emission of these elements of ether. According to Huygens’ ideas, light is a stream of waves distributed in an unknown hypothetical medium called ether, which fills the space everywhere tightly [
6,
7]. This ether penetrates into objects – air, glass, water, and, of course, it fills the entire vast space between the stars, planets and other celestial bodies. Huygens’ principle states [
5], as a light wave spreads ahead, points along its wavefront become sources of new waves emitted in all directions. As a result, their mutual interference forms the light wave spreading further.
In turn, Newton adhered to the so-called corpuscular theory of light [
8], according to which light is a stream of particles (or in Latin "corpuscles") coming from a light source in all directions. In contrast to Huygens’ light theory this picture of the light corpuscular spreading is clearly explained by three Newtonian laws.
Is the light a flow of corpuscles or is it a wave? Both theories based on the limited understanding of light could not propose accurate experiments for supporting their views.
The understanding of the mechanisms of light propagation through space started with discovering James Maxwell of equations of the electromagnetic field [
9] entitled by his name. The question arises here how electric and magnetic fields are transmitted over large distances through the empty space. It is natural to assume that a medium supporting the transmission of the electromagnetic fields at distances, the ether. However, Maxwell’s attempt to build a model of such a medium which would be like liquid, gas, or solid crystal, was not successful. Perhaps the failure was that this model had been built in accordance with the hallmarks of classical mechanics. The classical ether which could decelerate or accelerate light depending on oncoming or accompanying the earth’s rotation (ether dragging) was rejected after the experiment of Michelson-Morley [
10] which was specifically performed.
Along with that, investigations were rapidly unfolding at the frontier of the 20th century in understanding the processes taking place on a small scale. The milestone for these events was laid by an ordinary work of Max Planck in the attempt to combine the laws of black body radiation with a single formula [
11]. Two known laws were based on the classical principles of thermodynamics. Each of them gives a good description of radiation on the opposite regions of the spectrum. In the long-wavelength region of the spectrum the Rayleigh – Jeans law works. While the second law of Wine radiation gives good results In the short-wavelength region of the spectrum. The attempt to combine these laws led Planck to a somewhat unexpected result – it was necessary to introduce an extra constant to ensure a smooth connection of the aforementioned classical radiation laws. This constant obtained at the tip of the pen, the quantum of action, reads
This result says that oscillators comprising the black body could not absorb or emit the radiant energy with any frequencies from the continuous spectrum but only by discrete portions. And re-emit it by discrete portions as well. On December 14, 1900, Planck spoke at a meeting of the German Physics Community, where he presented the formula for the radiation of a blackbody.
The quantum hypothesis of the German scientist, the deep meaning of which was revealed only much later, marked the birth of quantum physics. For a thorough understanding of the new physics, it was necessary to convene the Solvay Congresses - a series of international conferences to discuss fundamental problems of physics and chemistry, held since 1911 in Brussels by the International Solvay Institute of Physics and Chemistry.
At the first Solvay Congress (1911) Planck outlined the arguments that led him to the discovery of the quantum of action. As soon as Max Planck in 1900 suggested that light is emitted only in quantized portions, then Albert Einstein explained in 1905 the photoelectric effect based on the assumption that light with a certain wavelength is emitted and absorbed exclusively in certain portions (photons) with the energy , where is the wave frequency. Thus, it turned out that light exhibits not only waves, but also corpuscular properties.
French scientist Louis de Broglie (1892-1987), developing ideas about the dual wave-particle nature of light, put forward in 1923 a hypothesis about the universality of wave-particle dualism [
12]. At the fourth Solvay Congress (1924) Louis de Broglie successfully compared the propagation of waves to the motion of a particle. He argued that not only massless photons, but also electrons and any other massive particles of matter have wave properties, along with corpuscular ones. According to de Broglie, corpuscular characteristics – energy
E and momentum
– are associated with each particle, on the one hand, and on the other hand, wave characteristics – frequency
and wavelength
This comparison was soon brilliantly confirmed in the experiments of Clinton Davisson and Lester Germer [
13] and George Thomson [
14]. These experiments showed that electron beams can undergo diffraction when passed through the atomic crystals. From the wave-particle duality principle stated by de Broglie the particle interferometry follows immediately. Now interference patterns even from heavy molecular beams such as fullerene beams [
15] can easily be computed [
16,
17] by applying the Feynman path integral technique [
18].
The principle of particle-wave duality received a more concrete and correct embodiment in Schrödinger ’s "wave mechanics", which then turned into modern quantum mechanics. Schrödinger ’s equations gave solutions that were clearly verifiable by experiments. However, one unclear issue was open. The wave function is a complex-valued one. The physical meaning of phase waves remained largely unclear. Therefore, when de Broglie tried to build a theory of a double solution [
19], following the principle of wave-particle duality, he attributed to a wave function an additional pilot wave – a "fictitious wave" moving with a particle. A goal of the latter was to accompany the particle along an optimal path. The particle was presented as a kind of singularity, accompanied by the pilot wave from creation of the particle up to its detection. The pilot wave in a sense "probings" the surrounding space and transmits the relevant information to the singularity, directing its movement" [
20]. The velocity of a particle being driven by a wave with this approach is a hidden parameter that cannot be measured.
De Broglie failed to convince his colleagues of the validity of his ideas during the fifth Solvay Congress (October 1927), where he made a report on his preliminary theory of the pilot wave. The causal theory of the pilot wave met with a cool reception from the participants of the Solvay Congress. The pilot wave caused confusion by introducing an additional hidden entity into the quantum problem. It remains to be regretted that de Broglie did not know about Madelung’s article "Quantumtheorie in hydrodynamische form" published in German in the journal Zts. f. Phys., 1926 [
21] immediately after Schrödinger’s landmark article [
22]. Unfortunately, we must admit that Madelung’s article went unnoticed by many physicists of that time. Now interest in the Madelung equations has increased due to the fact that the flow of an ideal fluid gives a fine explanation of complex-valued solutions of the Schrödinger equation - wave mechanics corresponds to the Eulerian picture [
23,
24,
25,
26].
Only after the appearance of the works of David Bohm (1917-1992) in 1952 [
27,
28] de Broglie again rekindled his early ideas about the pilot wave accompanying a particle along an optimal trajectory. Bohm essentially repeated Madelung’s results, but went much further by considering the motion of not only one particle, but also their ensemble. Bohm managed also to go much further than de Broglie in substantiating his views, in particular, to build a theory of measurements. The pilot wave theory, which has since been often called the de Broglie–Bohm theory, provides a consistent description of the optimal trajectories along which the singularity (imitating the particle) moves. Further the theory constructed by Bohm was called the Bohmian mechanics [
25,
29,
30,
31,
32,
33], which contained a new attempt to construct a quantum theory with "hidden parameters".
In the early 1960s, de Broglie formulated the idea of hidden thermodynamics of isolated particles, according to which a random element is introduced into the motion of a single particle due to its interaction with a hidden "subquant medium". It is remarkable that such ideas were further developed by Nelson [
34,
35,
36,
37] and Grössing [
38,
39,
40], each with their own peculiar approach. A more detailed historical and philosophical analysis of the scientific activities of Louis de Broglie and David Bam on the deep issues of quantum mechanics (the double solution theory, the pilot-wave dynamics) was carried out by Aurélien Drezet in the article [
41].
As for this article it is organized as follows:
First in
Section 2 we extract from the Schrödinger equation a pair of equations dealing with the real-valued functions – the continuity equation describing the conservation of the density distribution function at any transformations of the medium under consideration, and the modified Hamilton-Jacobi equation describing the velocity field as the time goes on.
Section 2.1 considers the velocity consisting of a superposition of the irrotational and solenoidal (rotational) velocities. Here we mention the Helmholtz and Kelvin theorems relating to vortex motions. The toroidal bubble as a possible model of a particle is considered as an example. When its size goes to zero, it degenerates to a singularity traveling along the irrotational laminar fields. In
Section 2.2 we consider the de Broglie–Bohm approach to quantum mechanics. We also mention the double solution theory, and Bohmian mechanics together with computation of the Bohmian trajectories.
Section 2.3 evaluates the variance of the Bohmian trajectory. From these evaluations finally we come to the mathematical expressions of the uncertainty principle.
Section 2.4 considers forming the irrotational guidance waves. The Feynman path integral technique is applied for drawing the density distributions of incident particles on the interference gratings. For illustration, the Bohmian trajectories are drawing on the background of these distributions. As an example of the material waves coming from the interferometer slits, the fullerene molecules incident on them are taken.
Section 3 deals with the consideration of problems of classical hydrodynamics. But in the beginning the problem of bouncing droplets on the surface of the pool with oil subjected to a slightly noticeable vertical shake is considered briefly. In
Section 3.1 we introduce the classical Navier-Stokes equation in order to show in the next step modifications in this equation opening a road to the quantum-mechanical realm.
Section 3.2 is devoted to derivation of the quantum potential from random walking of a particle in a noise medium. In
Section 3.3 we consider in detail the quantum-mechanical Navier-Stokes equation and come to the Schrödinger equation after a series of computations.
Section 4 considers topological transformations of the vortex tube to toroidal rings and further to vortex double spheres as possible models of the particles. In
Section 4.1 we compare spherical particle models with real ones. The estimates deal with long-lived particles such as an electron and a proton.
Section 5 discusses results of the work and gives concluding remarks.
2. The Bochmian mechanics: Bohmian trajectory fields
Let us begin from the Schrödinger equation describing motion of a particle with mass
m in 3D space under the external potential
:
Hereinafter we use the Dirac’s writing of the wave function as
. Here
is the reduced Planck constant, which has units of action (energy multiplied by time). We refrain from considering the problem in 3N-D space (
), so as not to load subsequent calculations of the quantum potential and the variance of Bohmian trajectories.
Since this equation contains the imaginary unit,
i, as a multiplier at the partial differentiation by time
t, then the wave function
is obviously a complex-valued function. We write the wave function in the polar form:
where
is the density distribution of the carriers
N (particles with the mass
m) in the unit volume
, and the scalar function
is the action. The latter has the dimension equal to energy multiplied by time. So, the ratio
is a dimensionless phase. Substituting this function into Eq. (
3) and dividing this equation into imaginary and real parts, we come, as a result, to two equations.
The first equation composed of imaginary variables is as follows:
Here we define the current velocity proportional accurate to the divisor
m, mass of the particle, to the gradient of the scalar function
The rightmost presentation is taken for completeness from Dürr et al. [
42,
43]. Substituting this result to Eq. (
5), we come to the customary version of the continuity equation:
Here
is the mass density within the unit volume
. The continuity equation describes the conservation of mass
M, or the amount of carriers (particles),
N, of the elementary mass
m, as the unit volume
deforms with the time going on.
The second equation, represented by real variables, is the Hamilton-Jacobi equation, with an added extra term - the quantum potential
:
and the quantum potential reads:
where
is the amplitude density. Further we will show in subsec.
Section 3.2 as the quantum potential follows from the Fick’s laws acting in the medium containing the normal fluid. In Eq. (
8) an arbitrary integration constant
having the dimension equal to energy stems from the fact that the wave function of the Schrödinger equation (
3) is defined accurate to an arbitrary phase
:
. In fact, this constant characterizes the energy level of the medium where the quantum system evolves. It is usually taken as zero - the zero-point energy level.
Two equations, the continuity equation (
7) and the modified Hamilton-Jacobi equation (
8), returning real solutions replace fully the Schrödinger equation (
3) that deals with the complex-valued wave function. The wave function provides simply condensed information regarding both the velocity field of particles and their possible location.
Let us now apply to Eq. (
8) the operator ∇. First we note that the gradient of the scalar function
divided by the mass
m returns the current velocity
, as is shown Eq. (
6). In that case, Eq. (
8) transforms to the following form:
Since this equation has no viscous friction term, it describes the flow of an ideal fluid. In hydrodynamics such a fluid is an imaginary (idealized) liquid in which, unlike a real liquid, there is no viscosity [
44].
2.1. Irrotational and Solenoidal Vector Fields
Note that the gradient of the term
can be rewritten as
Here
is the vorticity. The terms, marked with braces (a) and (b), return different components of the velocity. The velocity covered by brace (a) shows that it stems from a scalar function. The velocity covered by brace (b) gives a non-zero result when it reflects the vortex structure of the flow. First we mention the following theorem having the relation to the above-mentioned problem: the fundamental theorem of vector calculus states [
44,
45]
From this statement it follows that we can represent the current velocity
consisting of two components – irrotational and solenoidal (rotational) [
46,
47]:
where subscripts
I and
R point to the existence of the irrotational and the rotational (solenoidal) fluid velocities. We write the subscript
R (rotational) instead of
S (solenoidal) since the letter
S relates to the notation of the scalar field, to the action function
S. The components, irrotational,
, and rotational,
, velocities, satisfy the following conditions:
There is no possibility to separate Eq. (
10) into two equations describing separately the behavior of the irrotational velocity and the solenoid (rotational) one. Looking ahead, it can be noted that their cardinal difference is due to the existence of two fields - scalar and pseudo-vector. Gradients from the first reduce to irrotational velocities, the rotors of the second give solenoidal velocities. In this regard, it is appropriate to remind a number of Kelvin and Helmholtz theorems on the existence of circulation motions in moving ideal fluids [
44]. The three Helmholtz theorems are as follows:
Helmholtz’s first theorem: The strength of the vortex line is constant along its length.
Helmholtz’s second theorem: A vortex line cannot end in a liquid; it must extend to the boundaries of the liquid or form a closed contour.
Helmholtz’s third theorem: A fluid element that is initially vortex-free remains vortex-free.
Helmholtz’s theorems apply to inviscid flow where the vortex can live infinitely long. In real liquids the strength of vortices always gradually decreases due to the dissipative effect of viscous forces.
Kelvin’s circulation theorem reads: In a barotropic, ideal fluid with conservative body forces, the circulation around a closed curve (which encloses the same fluid elements) moving with the fluid remains constant with time.
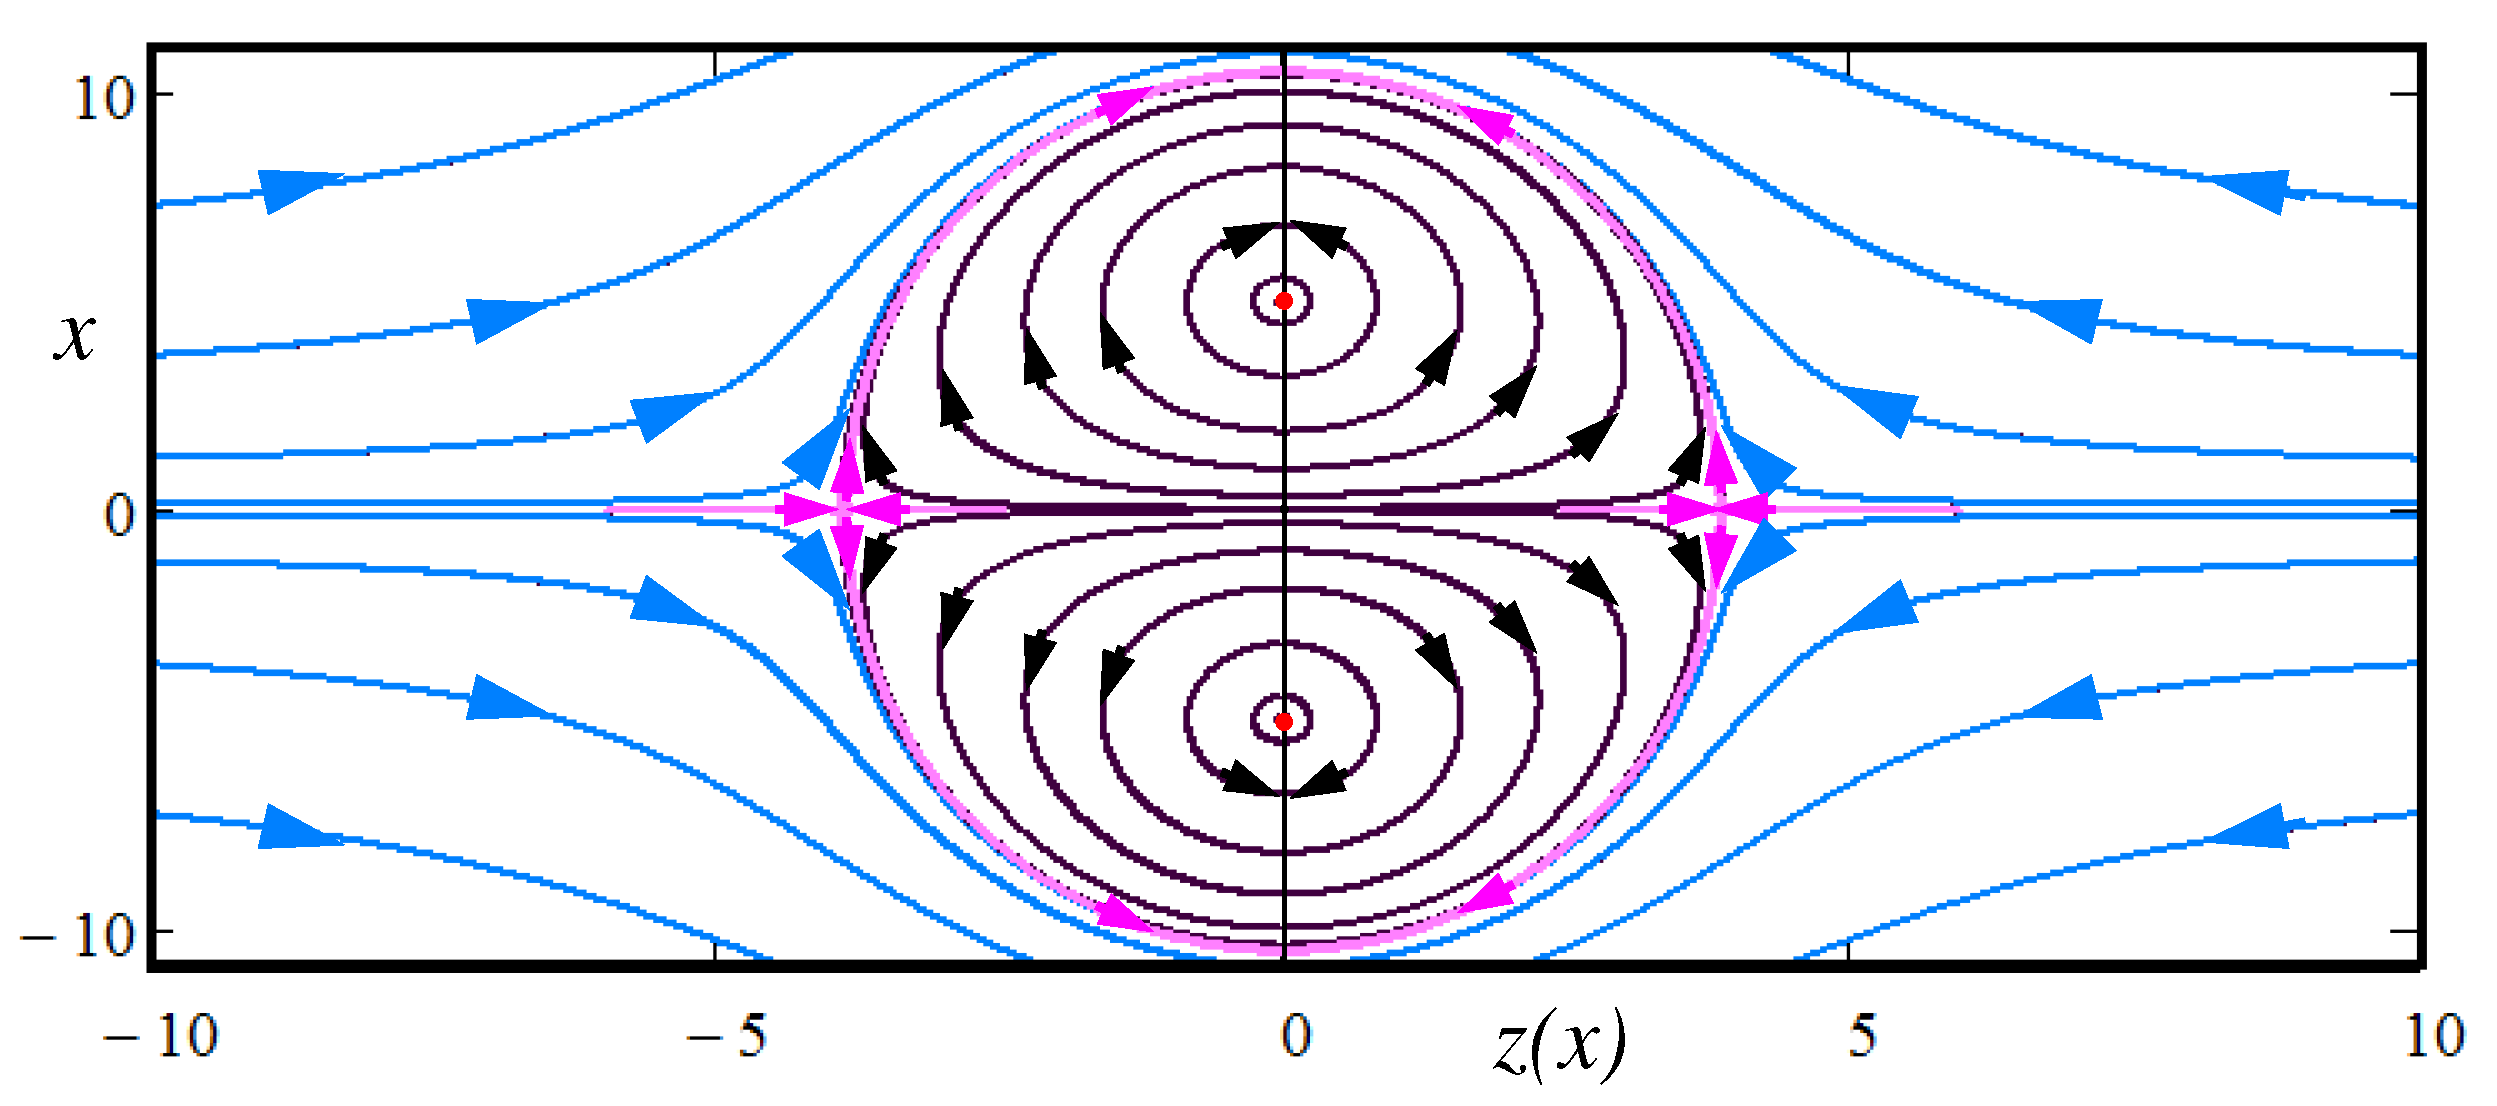
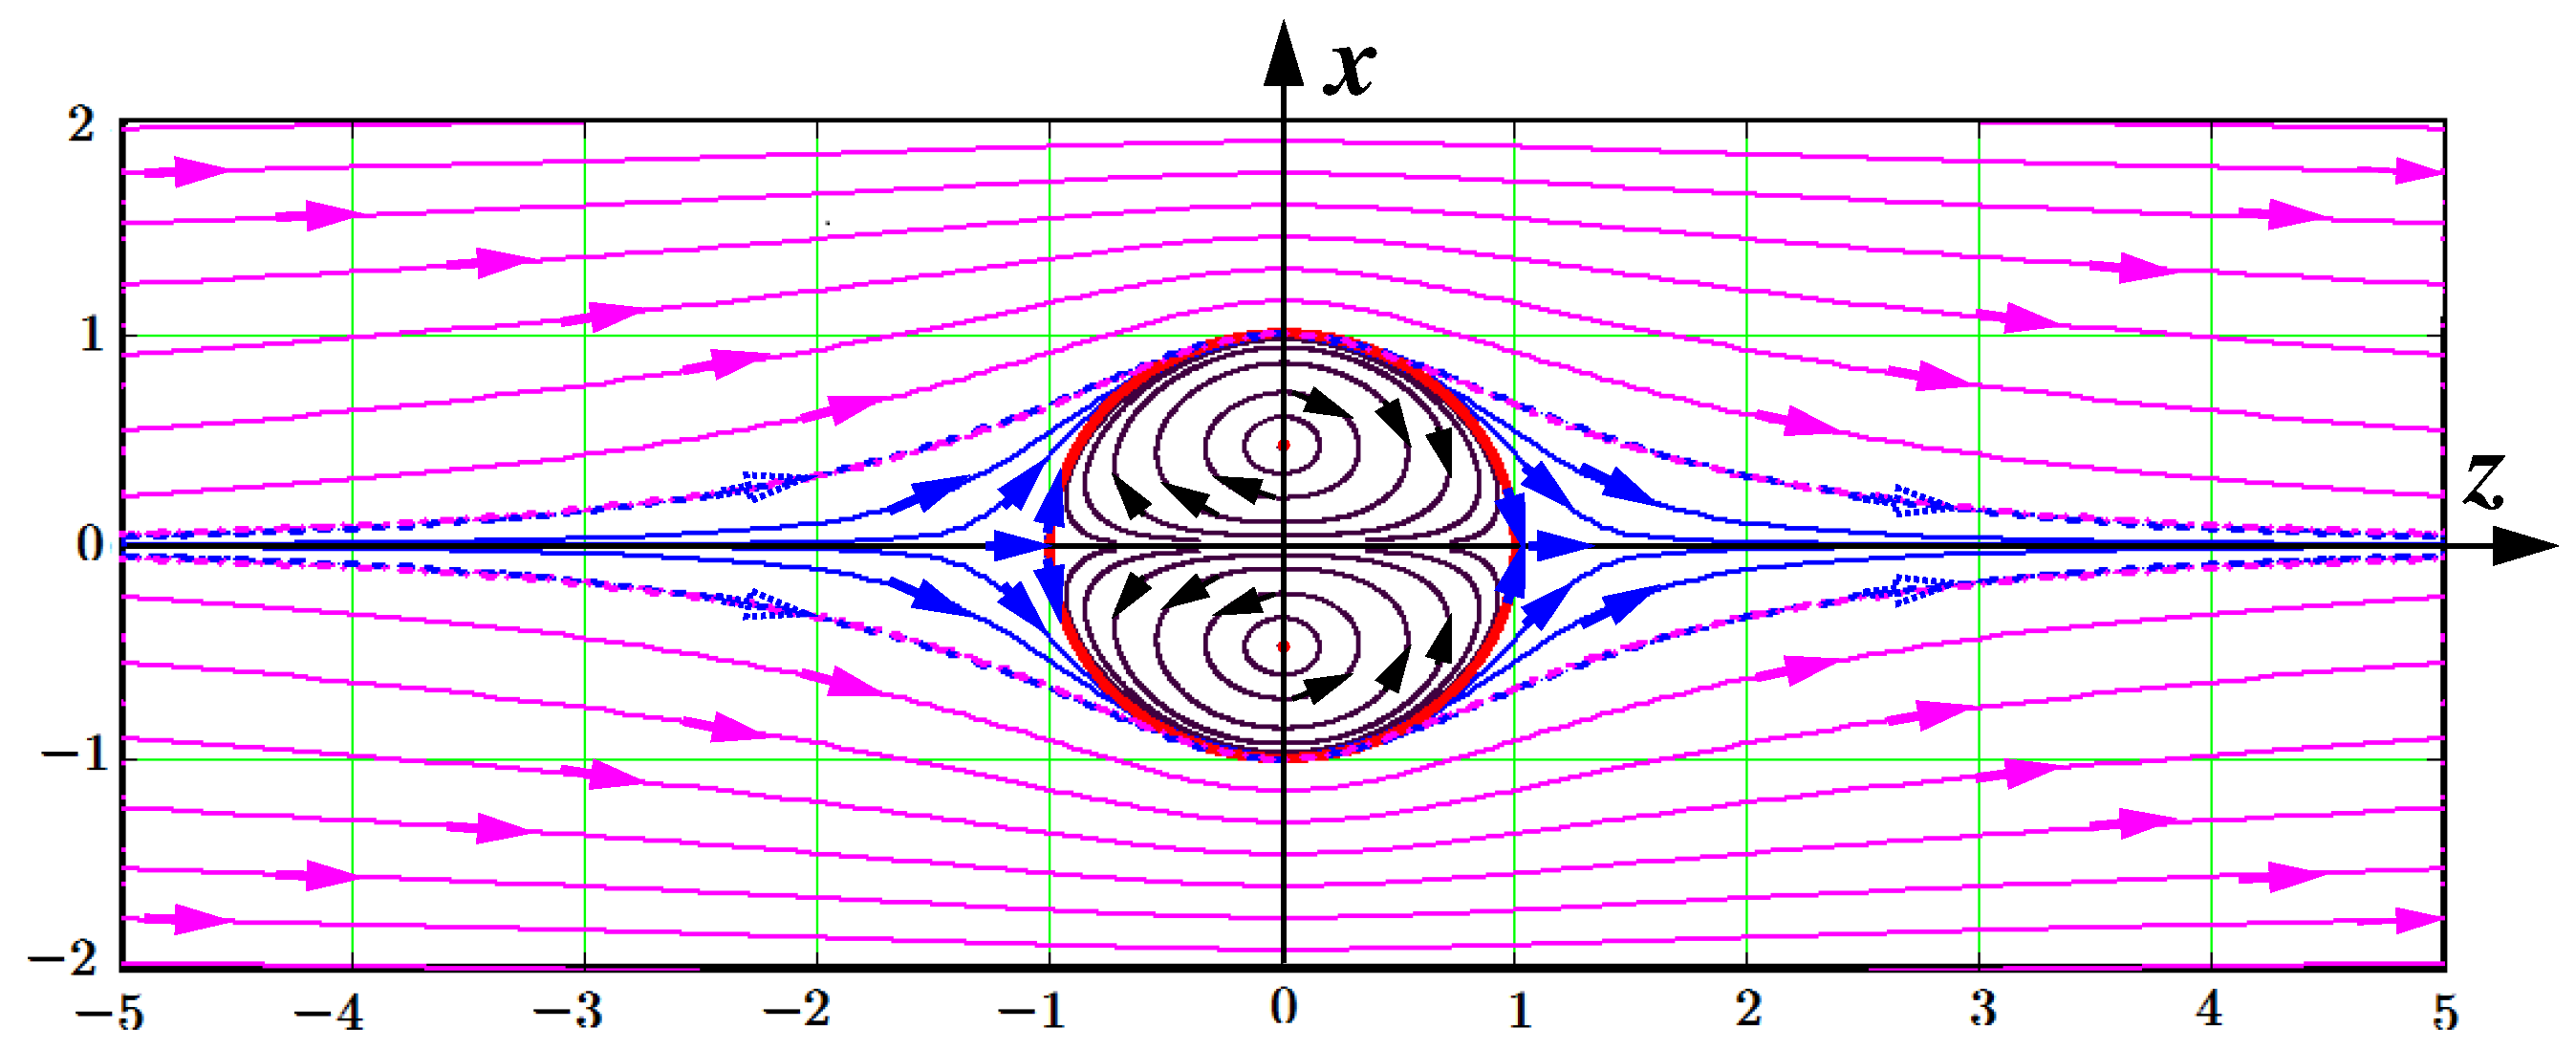
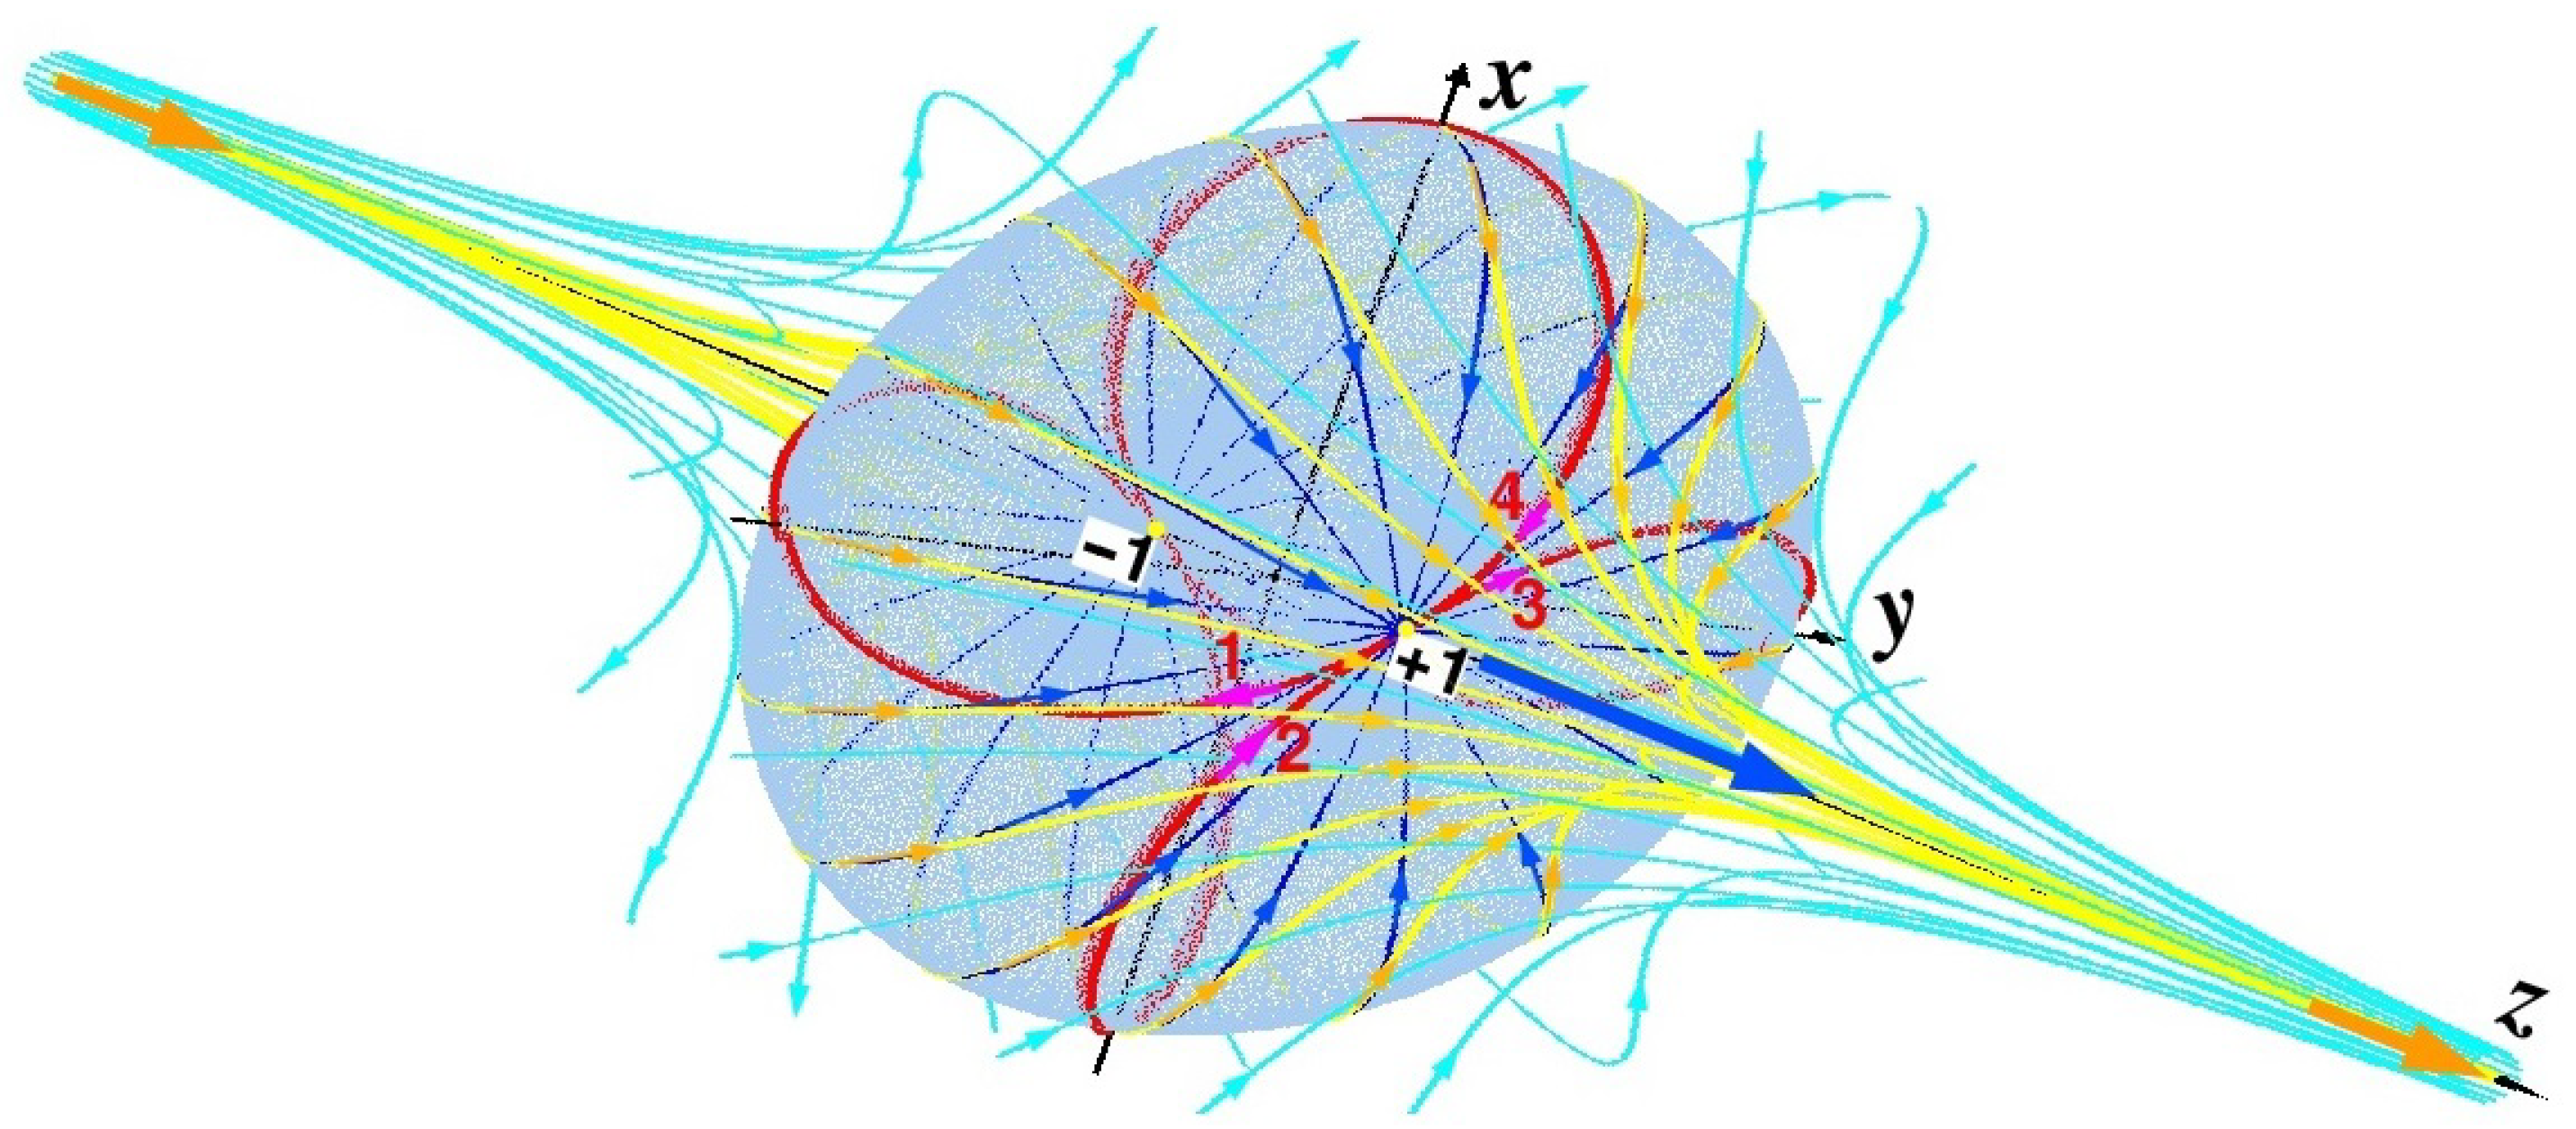
Figure 1 shows a toroidal bubble placed in an irrotational laminar flow. In an ideal fluid, it can exist indefinitely long. As seen there is a complicated transition between the irrotational and solenoidal curves. The separatrix passing over the saddle points (the separatrix and saddle arrows colored in pink) divides the irrotational laminar flow (drawn in blue) from solenoidal flows (drawn in black) within the toroidal bubble. It is instructive to note that Kelvin immediately noticed models of atoms in vortex structures. Here is the beginning of an article by Kelvin entitled "on vortex atoms" printed in the prestigious journal "Proceedings of the Royal Society of Edinburgh" [
48]: "After noticing Helmholtz’s admirable discovery of the law of vortex motion in a perfect liquid – that is, in a fluid perfectly destitute of viscosity (or fluid friction) – the author said that this discovery inevitably suggests the idea that Helmholtz’s rings are the only true atoms."
Figure 1 has been drawn by the formula of Mr D. McFarlane which he has performed by means of the set of curves looked as
This formula is given in Kelvin’s original article [
48]. Here we have replaced the original
y by
z. We rewrite it in the following view:
The control parameters
a and
b determine a general view of the toroidal bubble. In our case shown in
Figure 1 the parameters are as follows:
, but
b takes separate values
at drawing each curve. The case
relates to the rotational curve adjoining the pink separatrix, while
marks the red point on the toroidal core curve lying in the plane
. As for the irrotational curves (drawn in blue) only four first curves hit the rectangle window. Others lie outside the window.
The variable
x ranges from
to 40 with the increment
. Note that at
the rotational curves show themselves at negative
x and the irrotational curves are drawn when
x is in the positive area. In the case
the rotational curves are exhibited at
and the irrotational curves in the negative area. As for the pink separatrix it is well approximated by the circle deformed to ellipse at the chosen parameter
:
Taking into account the variable
x in Eq. (
15) as a radius of torus
we find that
Figure 1 shows a cross-section in the plane
of a toroidal bubble submerged into an irrotational flow colored here in blue. In turn, the solenoidal flow rotates around the torus axis lying in the plane
(the points about which the rotation occurs are marked by red dots).
An astute reader may have noticed that the arrows indicating the direction of the flows give distorted information about the flows. There is no mistake here. If you look at Eq. (
15), you can see that the flow pattern in the negative half-plane of z is mirror symmetric to the same one in the positive half-plane of z. The arrows drawn along the flows in
Figure 1 illustrate this symmetry.
With all the fascination of Eq. (
15), it cannot propose the real picture of flows of fluids. Let us glance at real vortex patterns arising in the fluid. In the paper [
49] authors assuming
have constructed families of steady solutions, for which pressure, inertial, and viscous stresses are in equilibrium. What is implying a corresponding balance between advection (the transport of a substance by bulk motion of a fluid) and diffusion of vorticity.
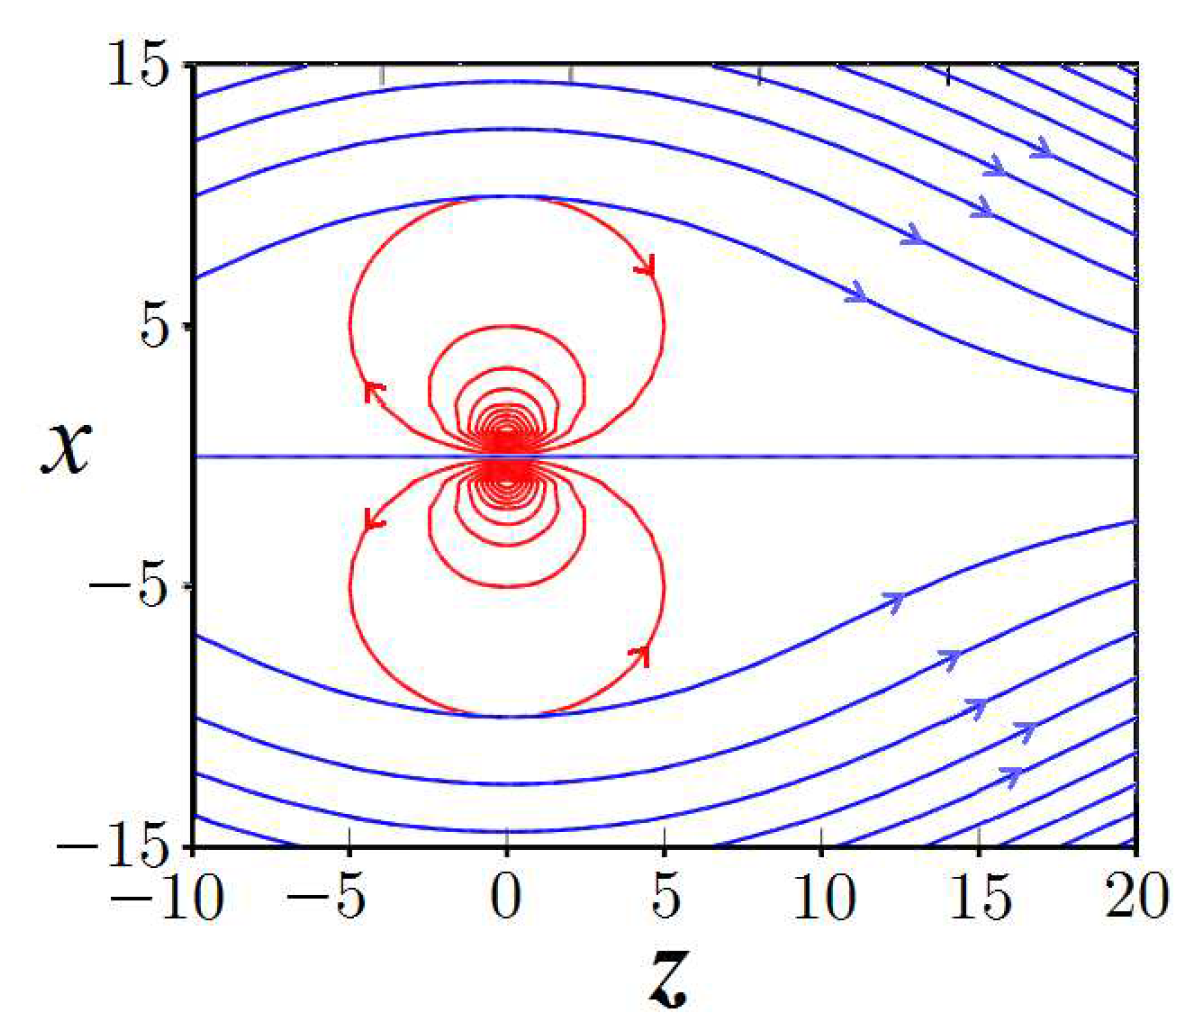
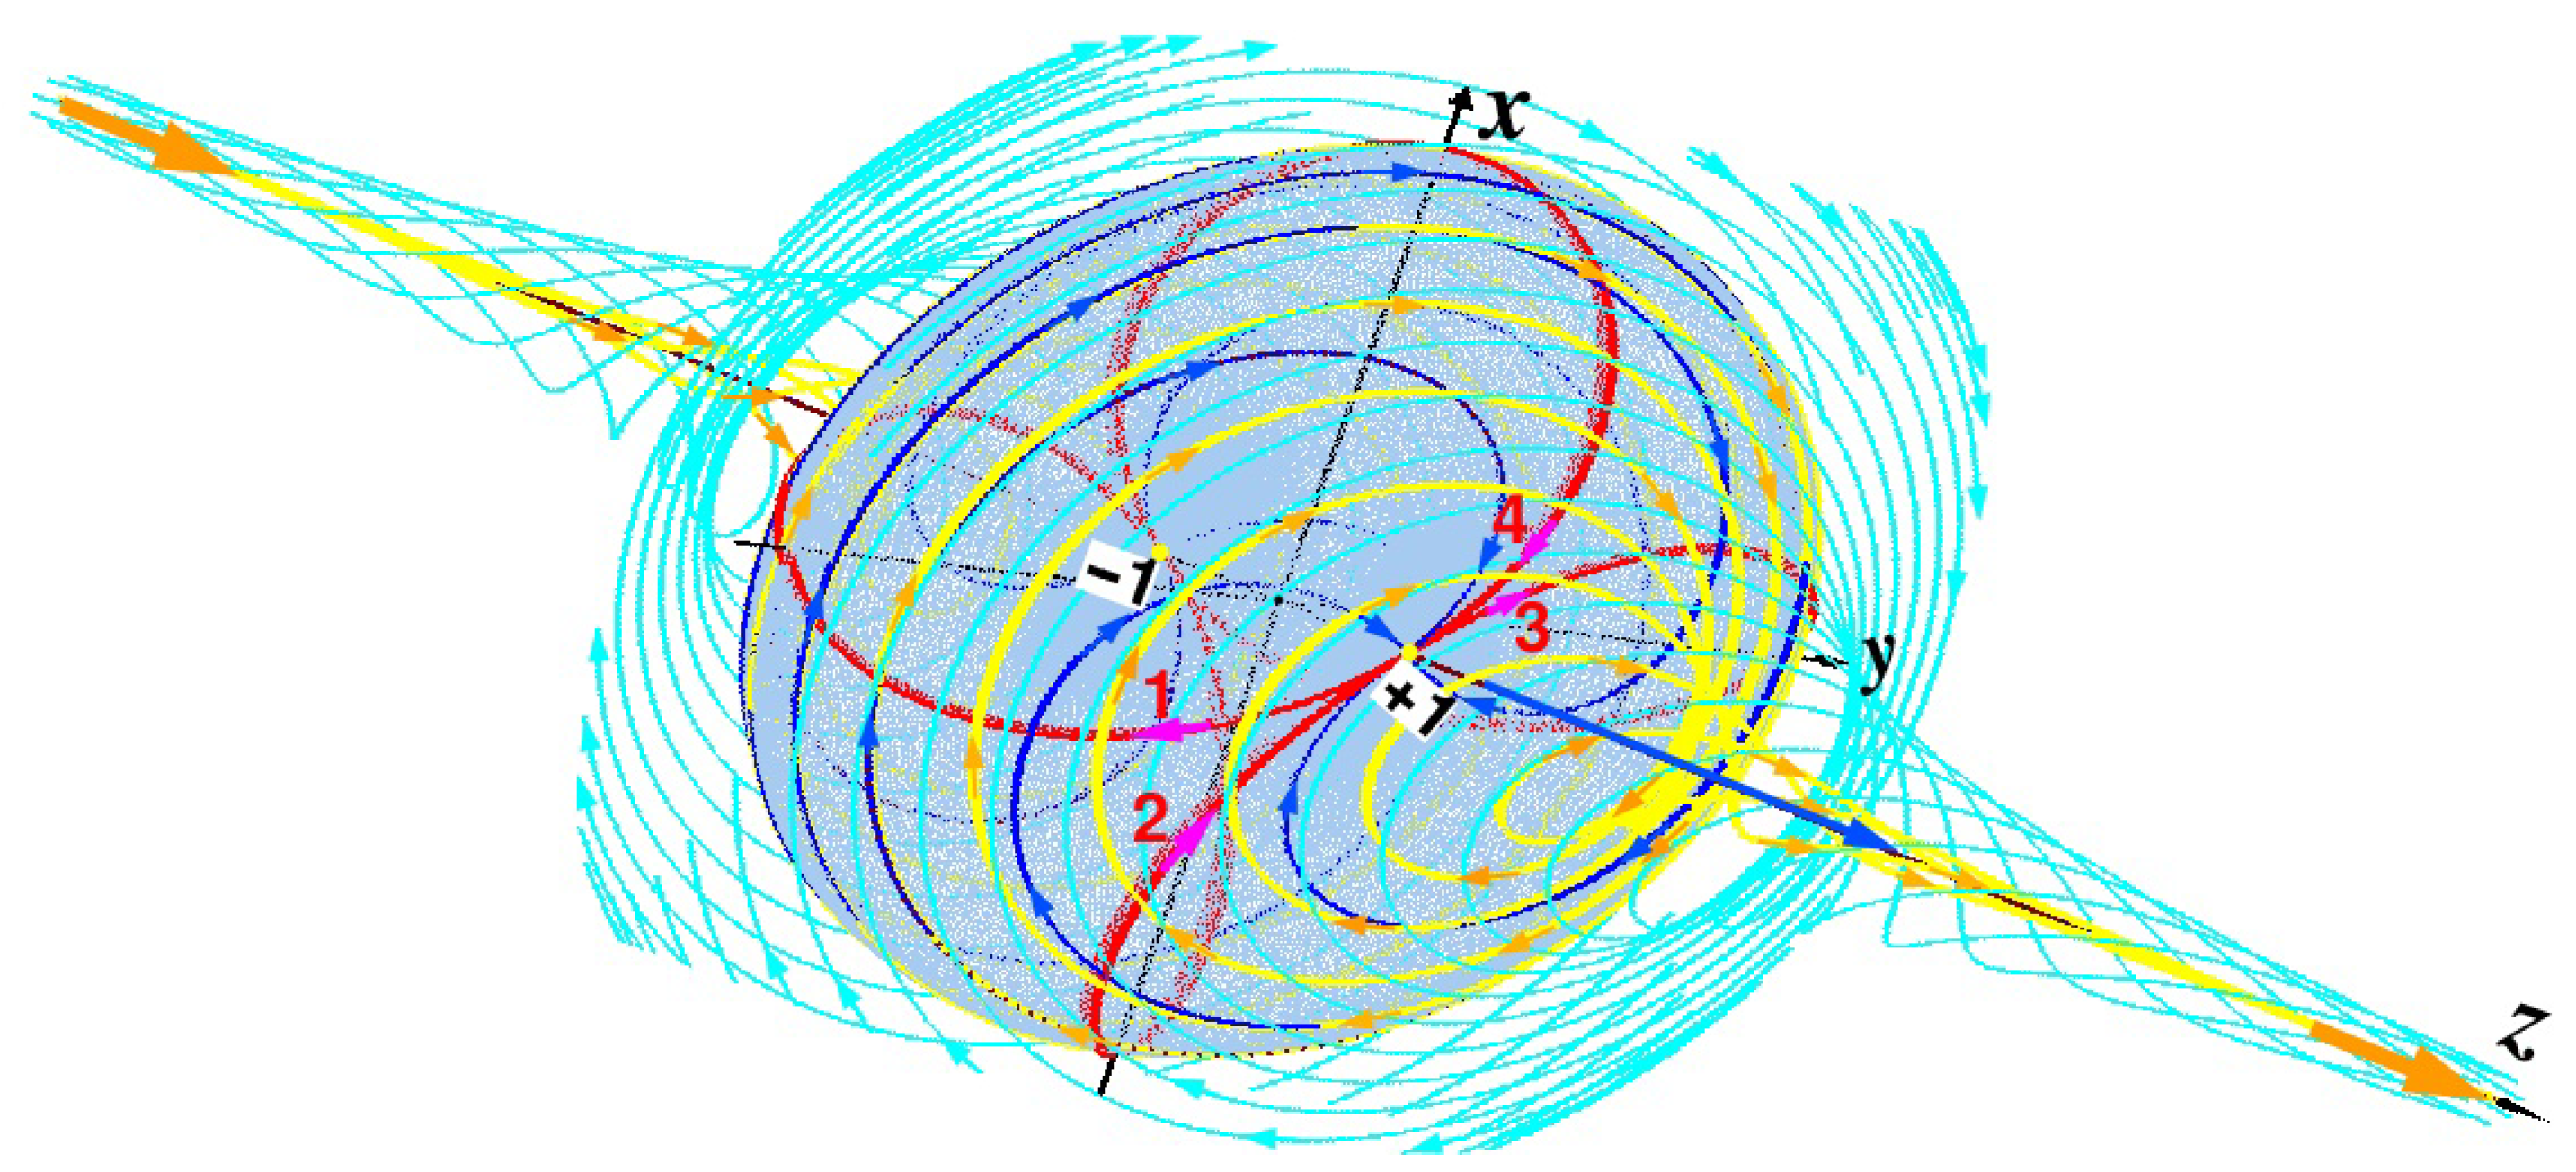
Figure 2 shows a possible solution of the fluid flowing about a toroidal vorticity. It is instructive to compare it with
Figure 1.
Figure 2 showing a solution of the Navier-Stokes equation in the case of the existence of a toroidal vorticity [
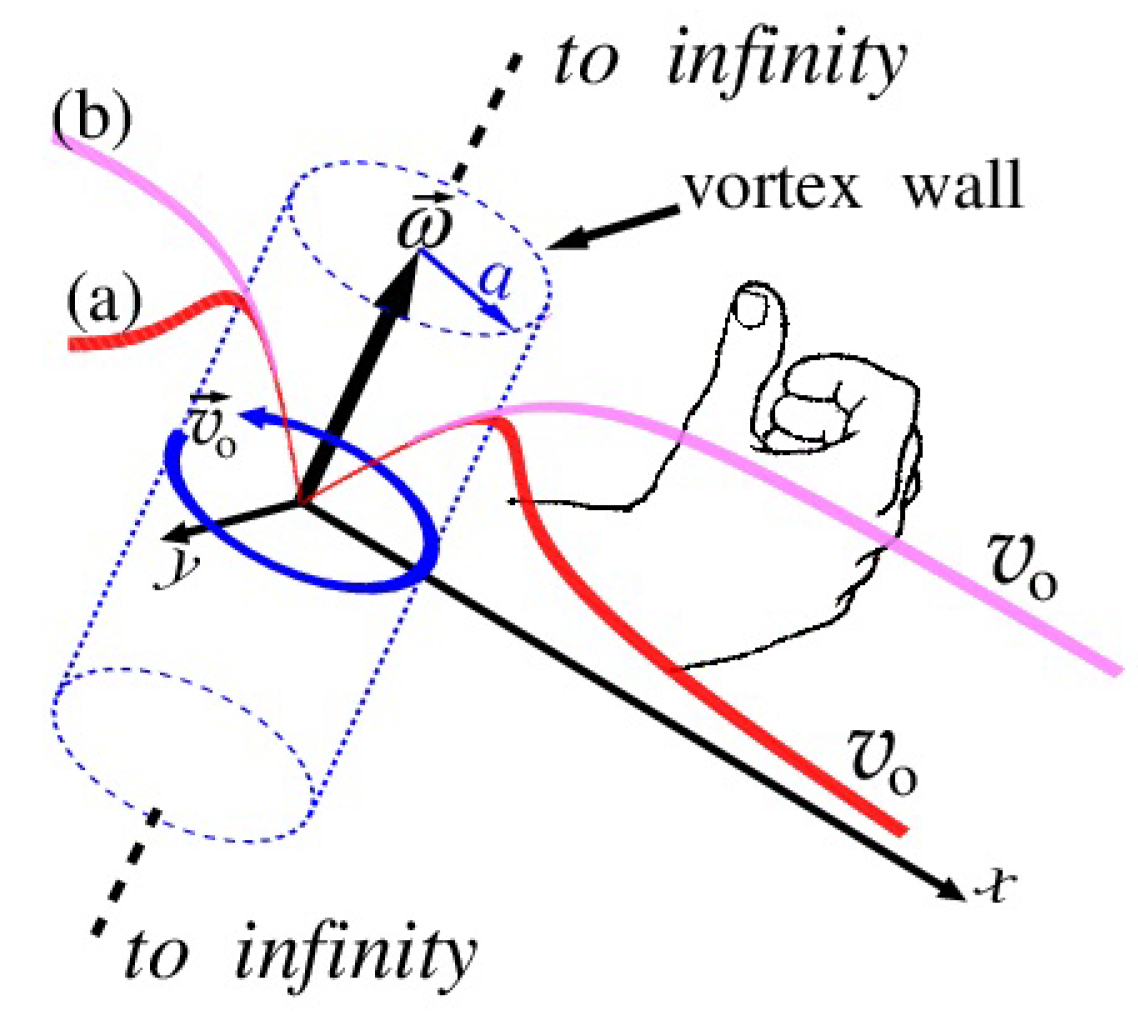
49] gives a hint on a possibility to reproduce both de Broglie’s guiding waves and the particles traveling along paths specified by these waves. In order to find this possibility, following Helmholtz’s theorems let us draw a vortex tube ranging from minus to plus infinity as shown in
Figure 3.
In this case we have the following statements of the Helmholtz theorem [
53]: (i) if fluid particles form, in any moment, a vortex line, then the same particles support it both in the past and in the future; (ii) an ensemble of vortex lines traced through a closed contour forms a vortex tube; (iii) the intensity of the vortex tube is constant along its length and does not change in time. The vortex tube either (a) goes to infinity by both endings; or (b) these endings lean on boundary walls containing the fluid; or (c) these endings are locked to each other forming a vortex ring.
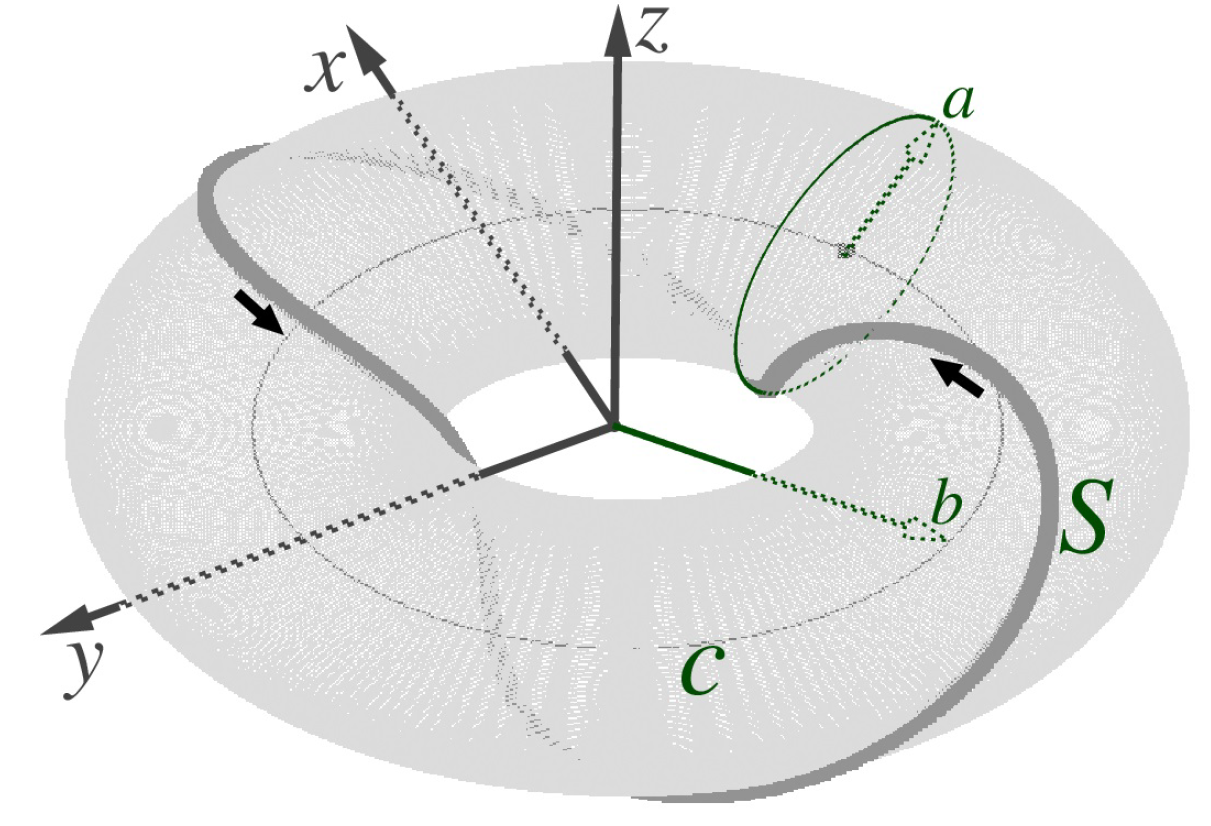
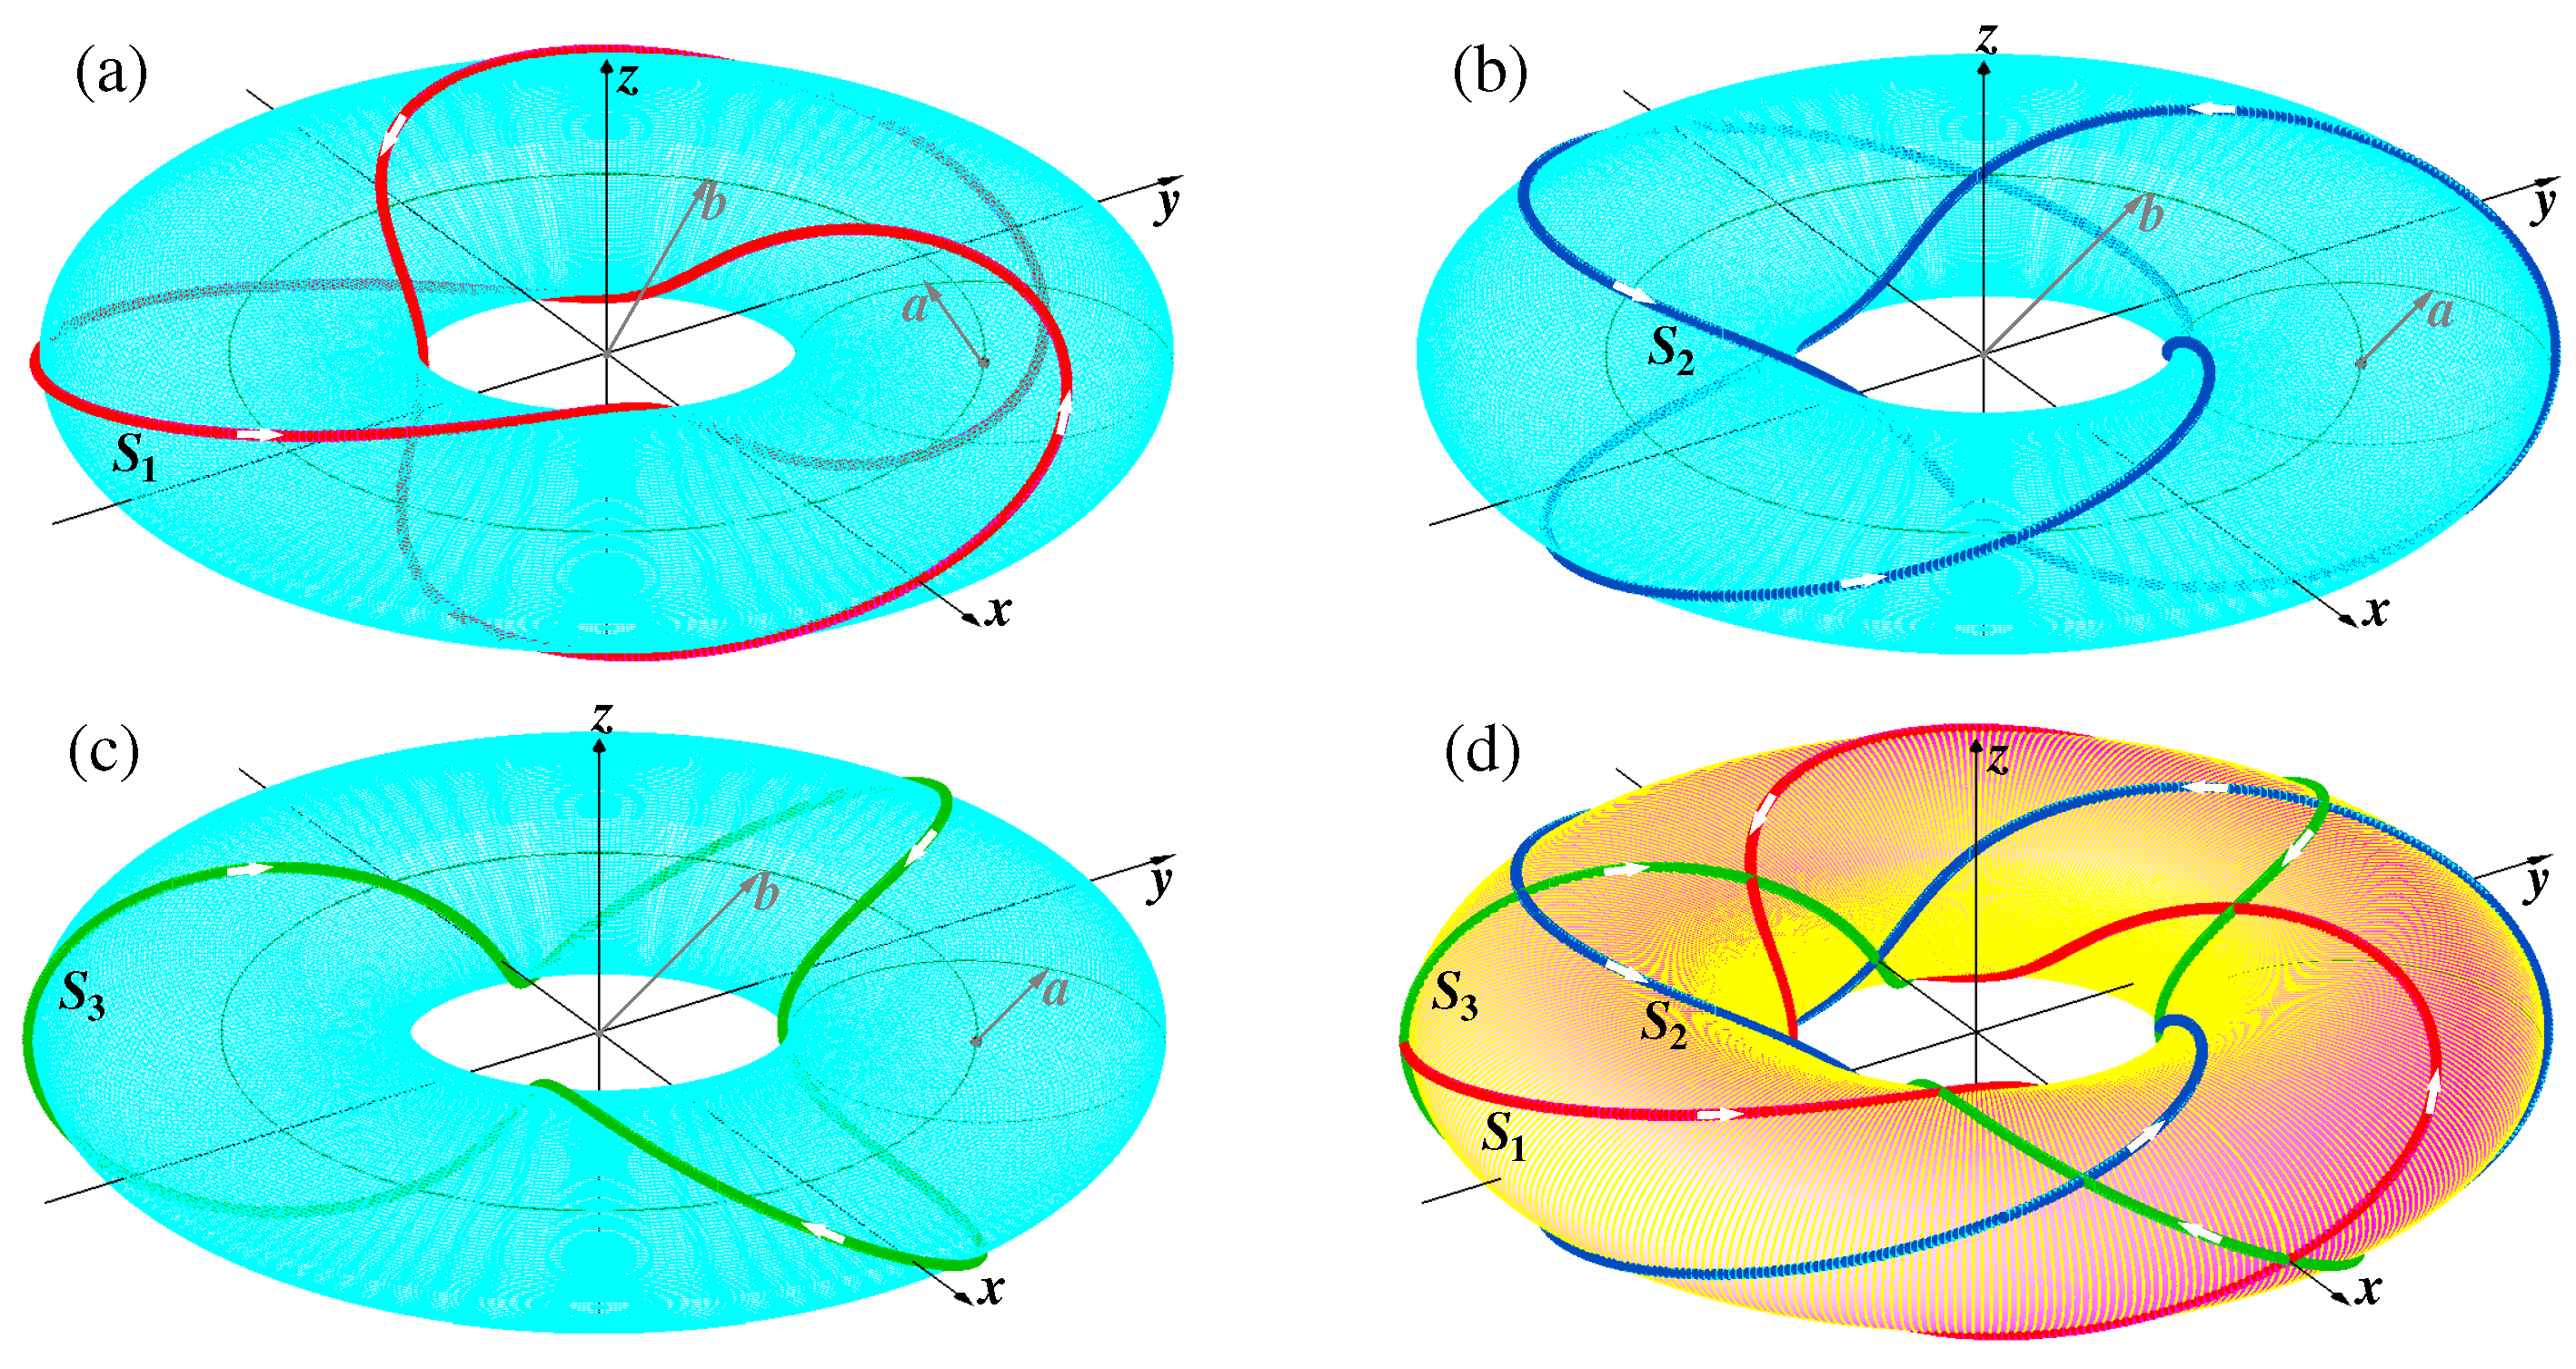
Let us consider the last case. If we roll up the vortex tube into a ring and glue its ends together we get a helical vortex ring - the torus shown in
Figure 4. Position of points on the torus in the Cartesian coordinate system is given by the following set of equations
Here
a is the tube radius and
b is the radius of the torus (the radius of the circulation ring
c). Here we will modify these equations in such a manner that to get (a) the irrotational filaments washing the sphere; and (b) solenoidal closed flows inside the sphere simulating those. See
Figure 1.
The first task is to arrange the irrotational flows washing the sphere as if these flows are superfluid. In other words, the liquid is ideal. Reasons for emerging turbulent instability are absent. Such flows wrapping around the sphere are given in accordance with the following formula
Here a number
is 1 indicating that the irrotational flows scatter on the sphere of radius
a, and it is 0 when the flows pass far from the sphere. The function
(here
) has a different representation depending on the marker
. This function looks as follows:
The partition boundary is a curve dividing flows that wash the sphere and those passing far from it. The position of this boundary is determined by values
in the function
and
in
. These two curves repeat each other, see
Figure 5.
The second task is to arrange the solenoidal flows within the sphere mimicking those given by Eq. (
15). The problem is to transform topologically the torus,
Figure 4, to get a desired pattern. The first step is to decrease the torus radius
b to the tube radius
a. And the next step is the compression of the inner torus walls in such a manner that they would transform in almost parallel to the axis
z. While the outer torus walls would retain a semicircular shape. Obviously, this problem is related to nonlinear transformations. As a result, we come to the following formula:
Here
is the Heaviside step function equal to 1 at
and it vanishes at
. At reaching the
z axis the trajectory quickly turns around and goes backwards to the opposite pole of the sphere. Its purpose is to prevent the false effect of mutual intersection of trajectories.
The nonlinear manifestations of the solenoidal bubbles inhabiting the interior of the sphere are given by the parameters
. Their fitting was carried out in accordance with the qualitative coincidence of the bubbles with that Eq. (
15) gave. These data collected in Table I are numbered by the parameter
b at which the like solenoidal bubble results from Eq. (
15) at
.
Table I:
|
b at , in Eq.(15) |
|
|
|
|
|
| 0.001 |
10 |
0.2 |
0 |
0.5 |
1 |
| 0.03 |
2.2 |
0.9 |
0.02 |
0.495 |
0.93 |
| 0.05 |
2 |
0.92 |
0.02 |
0.489 |
0. 9 |
| 0.1 |
1.8 |
0.95 |
0.027 |
0.485 |
0.847 |
| 0.3 |
1.4 |
1 |
0.048 |
0.458 |
0.71 |
| 0.7 |
1.18 |
1 |
0.108 |
0.392 |
0.54 |
| 1.6 |
1.13 |
1 |
0.225 |
0.27 |
0.32 |
| 2 |
1.1 |
1 |
0.265 |
0.228 |
0.26 |
| 3 |
0.9 |
1 |
0.34 |
0.113 |
0.156 |
| 10 |
0.8 |
1 |
0.4706 |
0.014 |
0.047 |
The meaning of the parameters is to transform the circle in such a manner that it would be deformed to a top/bottom half-circle and its position within the original circle would be correct enough. A main nonlinearity of a solenoidal half-circle is determined by the parameters and . The parameter defines a most severe deformation of the half-circle up to formation of the full half-circle. The parameter scales the deformation of the half-circle with respect to the position of the parameter which sets the lower position of the cycle with respect to the z axis. The parameters , and determine the transversal and longitudinal sizes of the solenoidal half-circle.
As an example of the toroidal bubble placed in the sphere of radius 1 is a solenoidal vortex pentafoil,
Figure 6, drawn for single solenoidal curl
.
2.2. Bohmian trajectories as optimal paths for de Broglie’s singularity simulating a particle.
Further we will consider in detail the irrotational filaments and will see that they are like the Bohmian trajectories along which de Broglie’s -singularities simulating particles migrate.
When the parameter
a in Eqs. (
19) and (
21) goes to zero, the toroidal bubble shown in
Figure 5 tends to singular point located at
. In this case the irrotational flow occupies all space except for the singular point
. This point is the toroidal vortex singularity, which reflects directly de Broglie
–singularity, since they both are tied to the guiding irrotational wave. With accuracy to the singular point we can omit in Eq. (
11) the term embraced by brace (b) and rewrite Eq. (
10) as follows:
This equation reflects action of the first Newton’s law, where apart from the external force
there is also the internal force
to be considered. As for the singularity, we suppose, following de Broglie, it simulates a particle with a high concentration of energy in a tiny physical volume. This singularity controlled by the guidance wave travels along some optimal path [
19,
55] paved by the irrotational flow. For that reason, we should compute the field of the optimal paths [
27,
28,
56,
57] – the field of Bohmian trajectories. Each Bohmian trajectory can be by the guidance for de Broglie’s singularity – the
function sitting on the guide wave and traveling along this trajectory.
In order to calculate the Bohmian trajectory we need to determine the expectation velocity in the vicinity of point
[
58]. Let us start with the statement that the momentum operator is
. The corresponding velocity operator reads:
where
m is the particle mass. From here we can calculate the expectation value of the velocity operator [
46,
58]:
Here we took the wave function
represented in the polar form (
3) with the probability density
,
R is the amplitude density. The real part in this expression is the current velocity of the particle
This expression is seen to be the same as in Eq. (
6). Note also that this computation is equivalent to that done in [
59]. In turn, the imaginary part
represents the osmotic velocity [
34], which has a deep relation with the quantum potential (
9).
With the aim of further computations of the velocity variance, the average velocity
will be marked as
. Position of the particle in each current time starting from any slit up to the detector can be calculated by the following increment formula
Here
t is the time that starts at
on a source within the slit and
is an arbitrarily small increment of the time. As a result, formulas (
25) and (
27) are sufficient for calculations of the Bohmian trajectories when the action function is strictly given. Computations of the Bohmian trajectories are given in many articles devoted to the de Broglie–Bohm theory [
31,
32,
60,
61,
62,
63]. Here we show the Bohmian trajectories calculated for the heavy fullerene molecules [
16,
46] passing from slits of the interference grating,
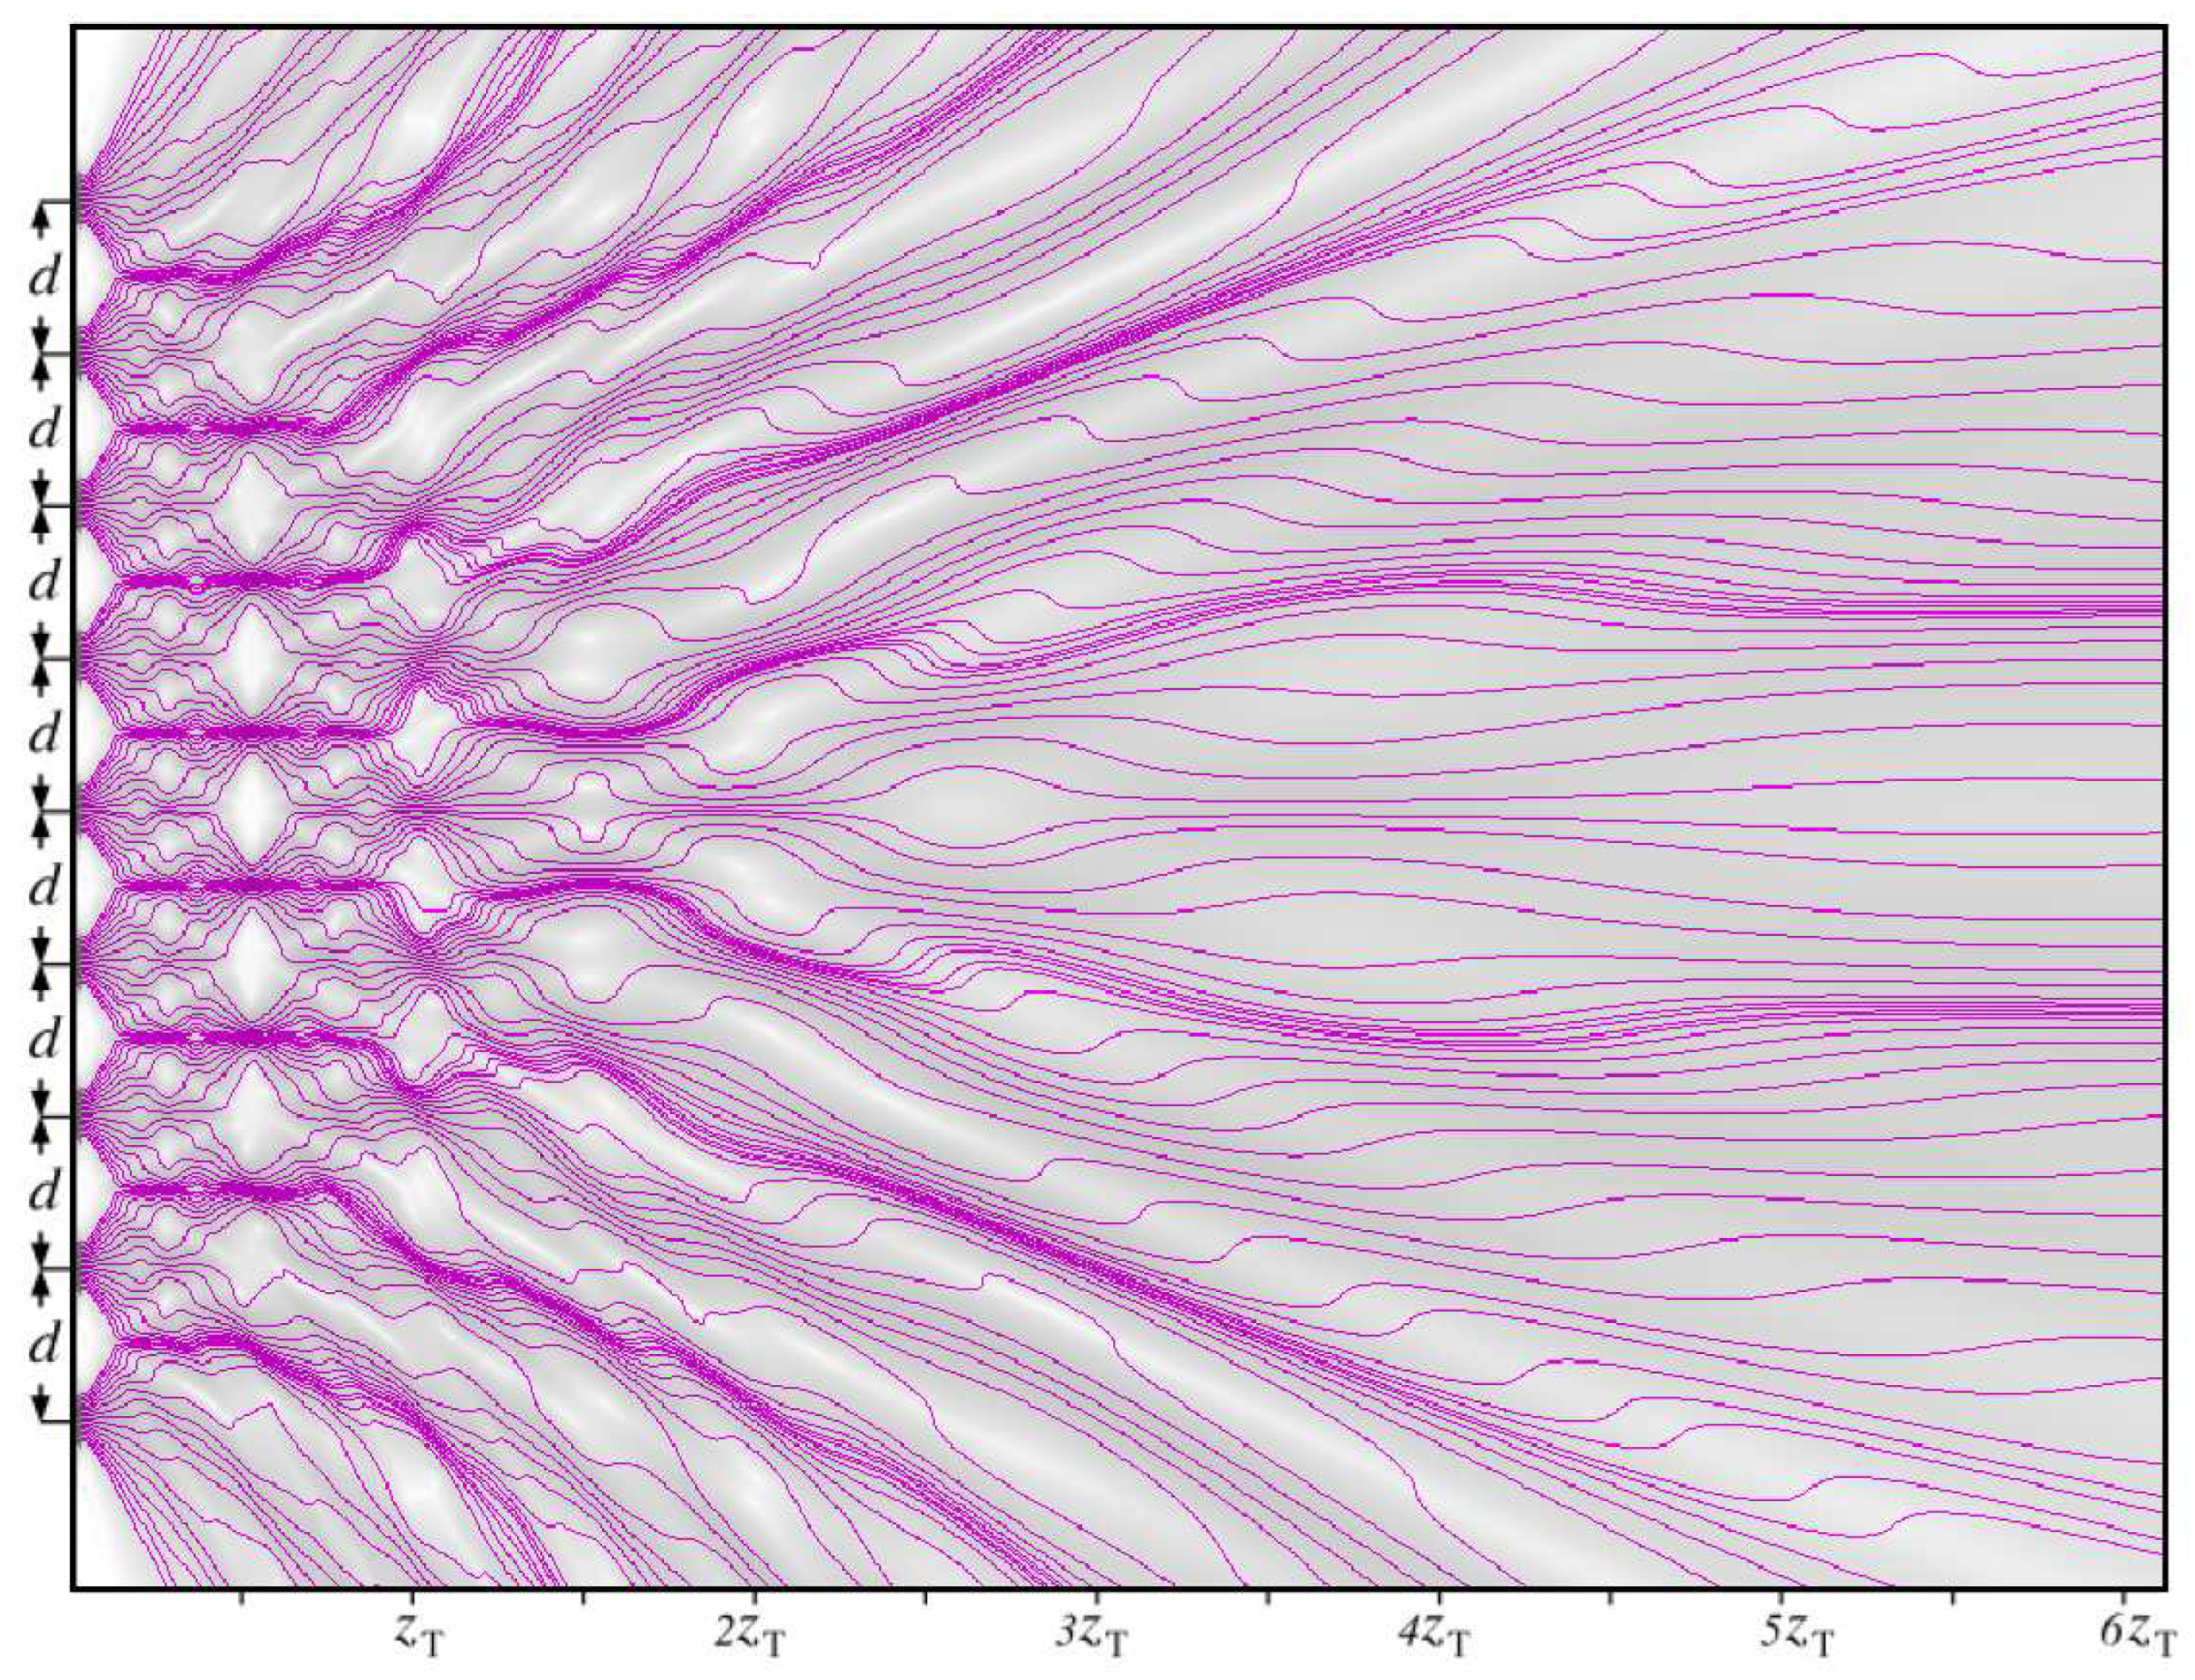
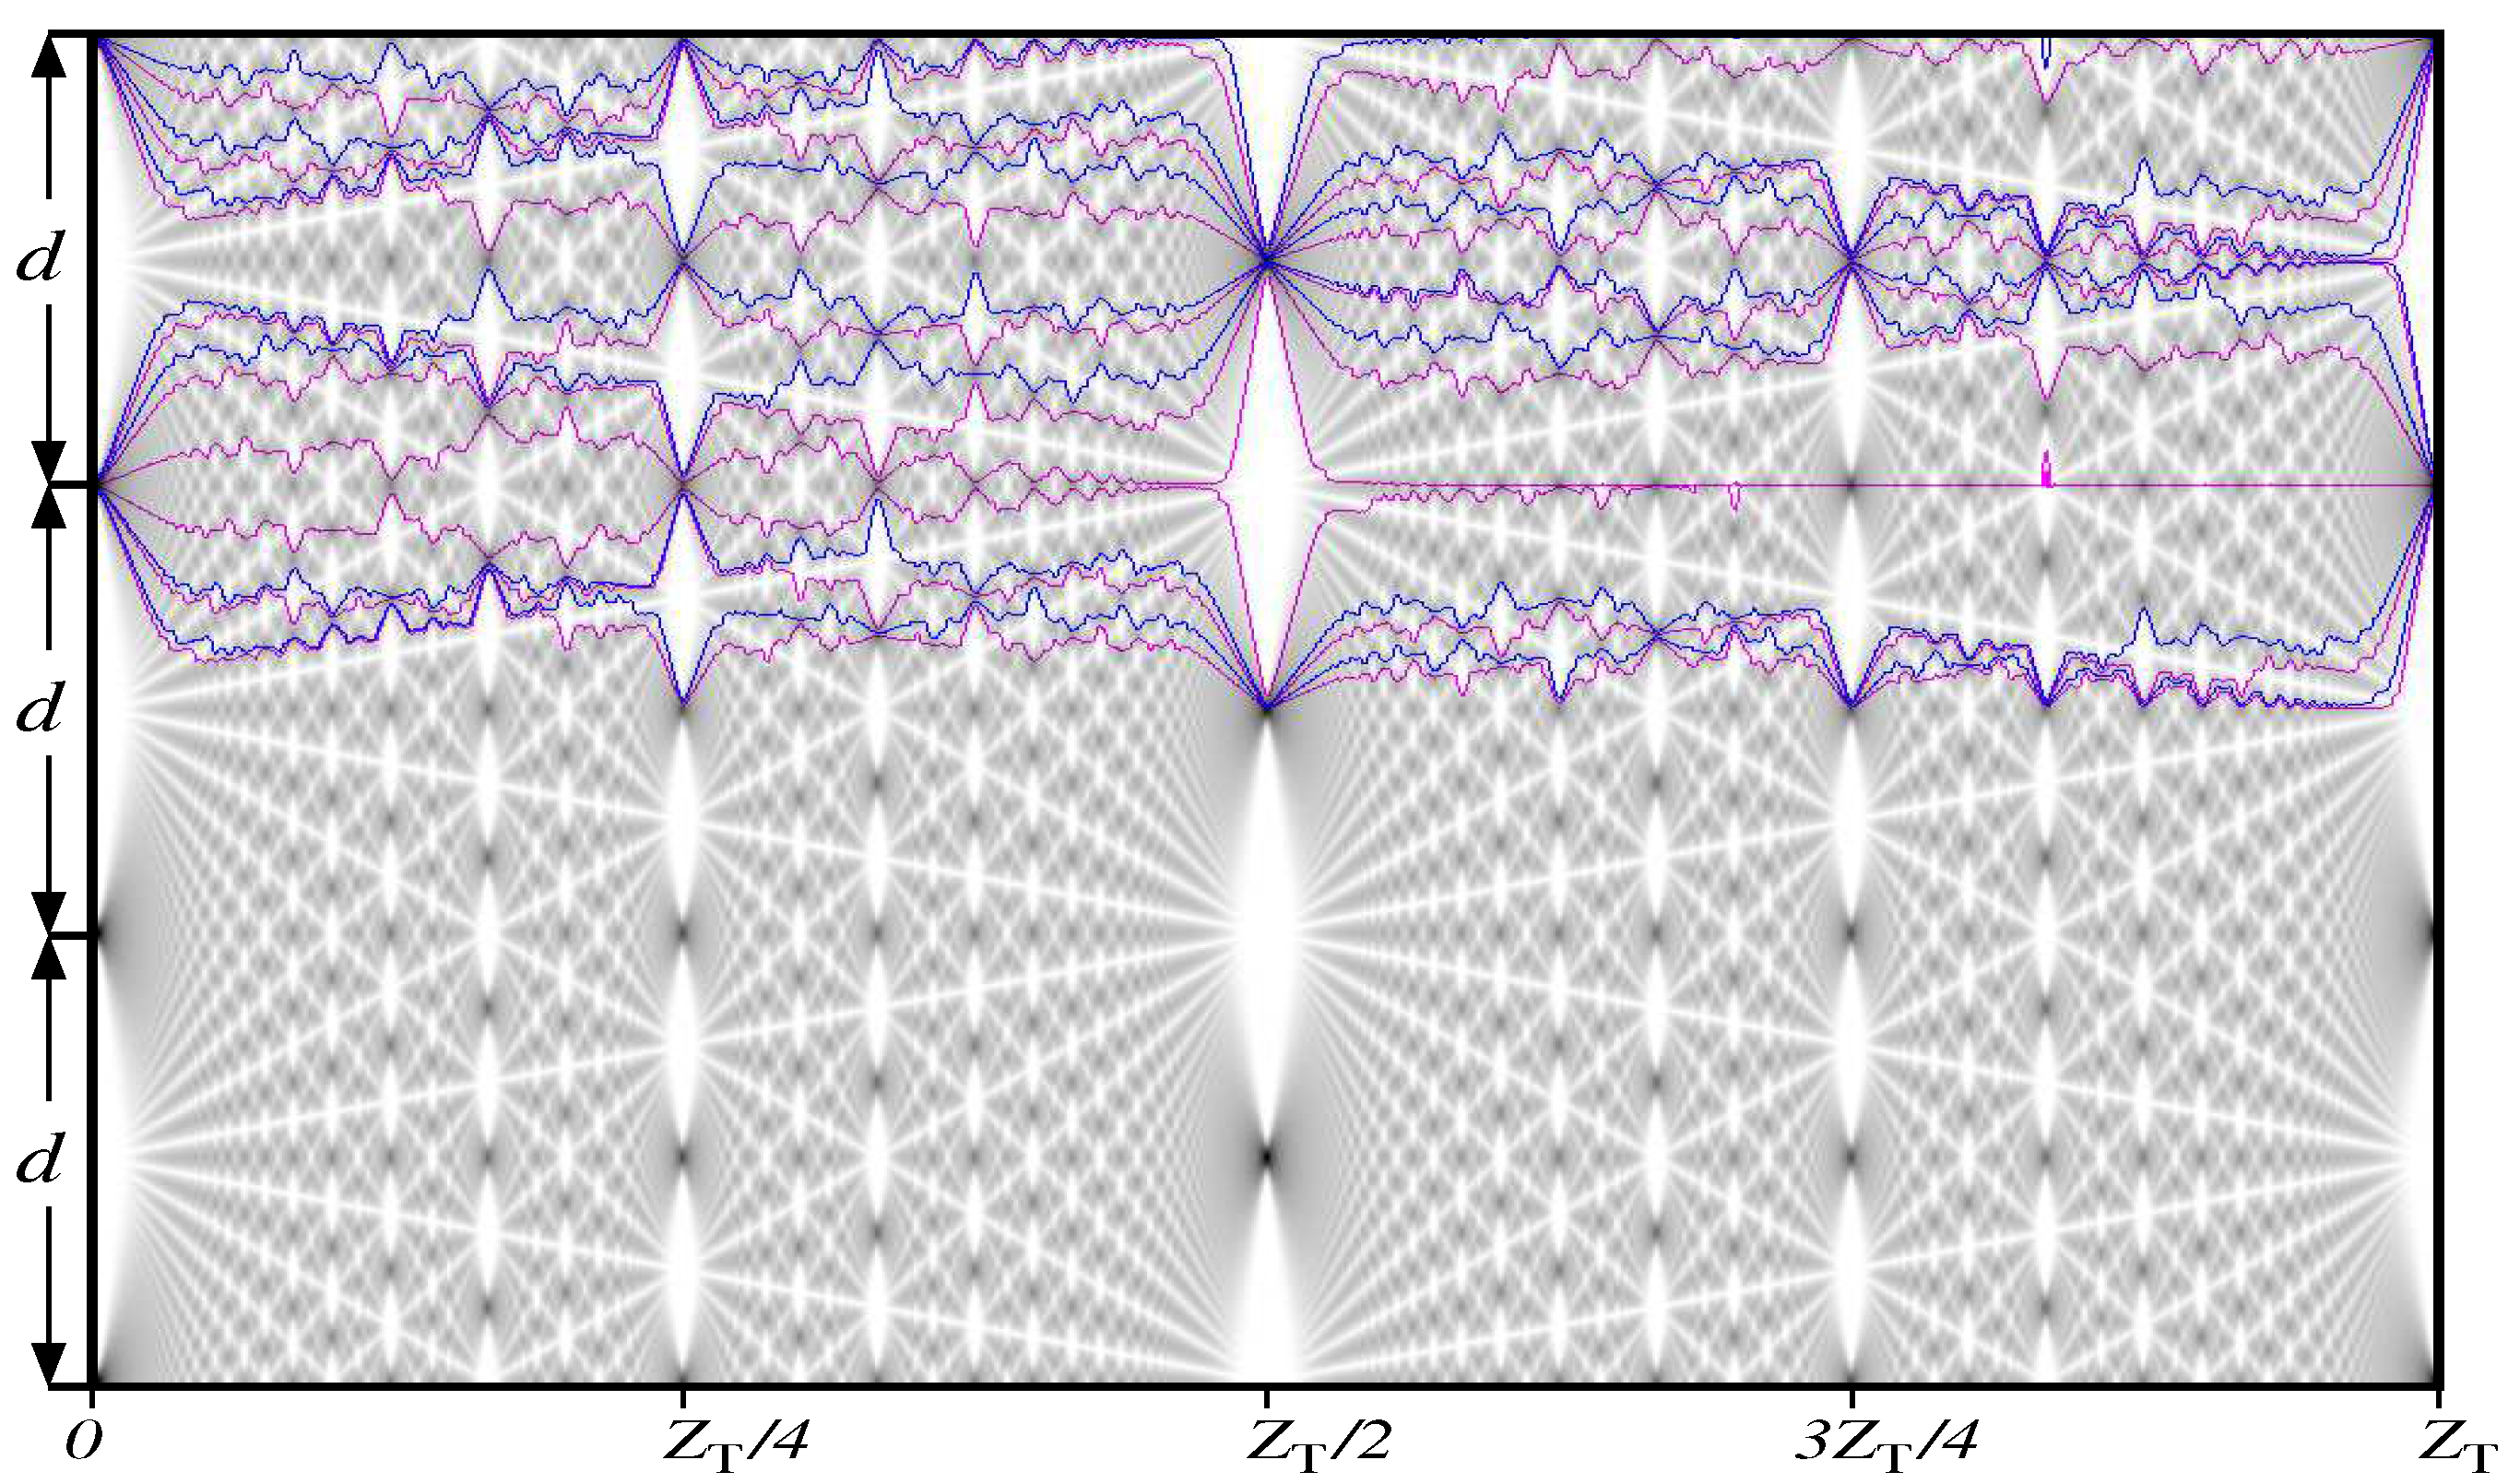
Figure 7.
The trajectories diverging from 9 grating slits are drawn by magenta curves against a gray background. The grouping of the trajectories in areas of increased distribution density (the dark gray background) is clearly visible. Conversely, trajectories avoid areas with reduced distribution density (the light gray background).
The scales in the interference patterns are set based on the known distance,
d, between the slits and the de Broglie’s wavelength,
, of the particles incident on the grating. From here one can define one more length accepted in the interference experiments – the Talbot length [
64,
65]
or
. Choosing the length is conditioned with the location of either the nearest negative images of the slits (big white areas in
Figure 7) or its positive ones (black areas – magenta bunches centered on direction to the slits).
A complex zigzag-like pattern of nodes and antinodes in the nearest area of the grating slits strikes in the eyes. Can a particle make such zigzag–shaped intricate movements near the grating slits? This is a serious question. Since in this case there must be some unaccountable forces that would constantly push the particle in different directions. Bohm suggested the existence of hidden variables [
27,
28] that affect the velocity of a particle. According to de Broglie, such a hidden medium is the ether [
19]. As he writes "for me, the particle, precisely located in space at every instant, forms on the wave a small region of high energy concentration, which may be likened in a first approximation, to a moving singularity."
Bohm and Vigier had published a join article entitled "Model of the causal interpretation of quantum theory in terms of a fluid with irregular fluctuations" [
56] which provided the justification of a causal interpretation of quantum mechanics named by names de Broglie and Bohm. According to this interpretation, in addition to the wave function on the space of all possible configurations a special configuration exists without being measurable. The evolution of this configuration over time (that is, the positions of all particles or the configurations of all fields) is determined by the guiding function resulting from the control equation. This guiding function is like the wave function being the solution of the Schrödinger equation. As for a particle traveling along an optimal path pointed by the guidance wave, it is simulated by the de Broglie singularity described above. It is a local quantum object, but its position on the wavy oscillations is uncertain.
2.3. Computation of the velocity variance
The calculations of (
25) and (
27) are incompatible with each other if somebody tries to execute simultaneously. For that reason we need also to evaluate variance of the above velocity [
58,
66]. Such an evaluation is
The terms over curly bracket (a) cancel each other since the operator
reproduces
as following from Eq. (
24). It is reasonable in the perspective to multiply the above expression by
to deal with the dimension of energy:
After a number of computations we get the following result
One can see that the velocity variance is the velocity expectation squared. Further we will deal only with the real part of the expression over brace (b)
The first term here is the variance of the kinetic energy of the particle
induced by collisions of the particles with virtual (hidden) particles appearing from the medium (ether [
19]) for a short time
. Note that the ether applied in the Nelson’s article [
34] consists of an enormous amount of virtual particles randomly wandering in the space and pushing the particle under consideration sometimes. Such a random dynamics was simulated in his work by the Wiener process.
The short time
comes the second term from. in (
31). With the aim to extract
, we will highlight in the second term a part
which has the dimension – unit divided by time. It characterizes the collision frequency. Here
is the quantum entropy [
67]. From here one can see that the larger this entropy the larger the collision frequency is. Now we can rewrite the above equation in the following view
By defining
we rewrite the above inequality by follows
Let us return now to Eq. (
27) and rewrite it in the following view
Here
. Subscript 1 marks the Bohmian trajectory and subscript 2 does the virtual (hidden) one. Taking into account the decomposition
we obtain
. By substituting this expression into Eq. (
35) and putting into consideration that
we obtain finally
The uncertainty principle expressed by Eqs. (
34) and (
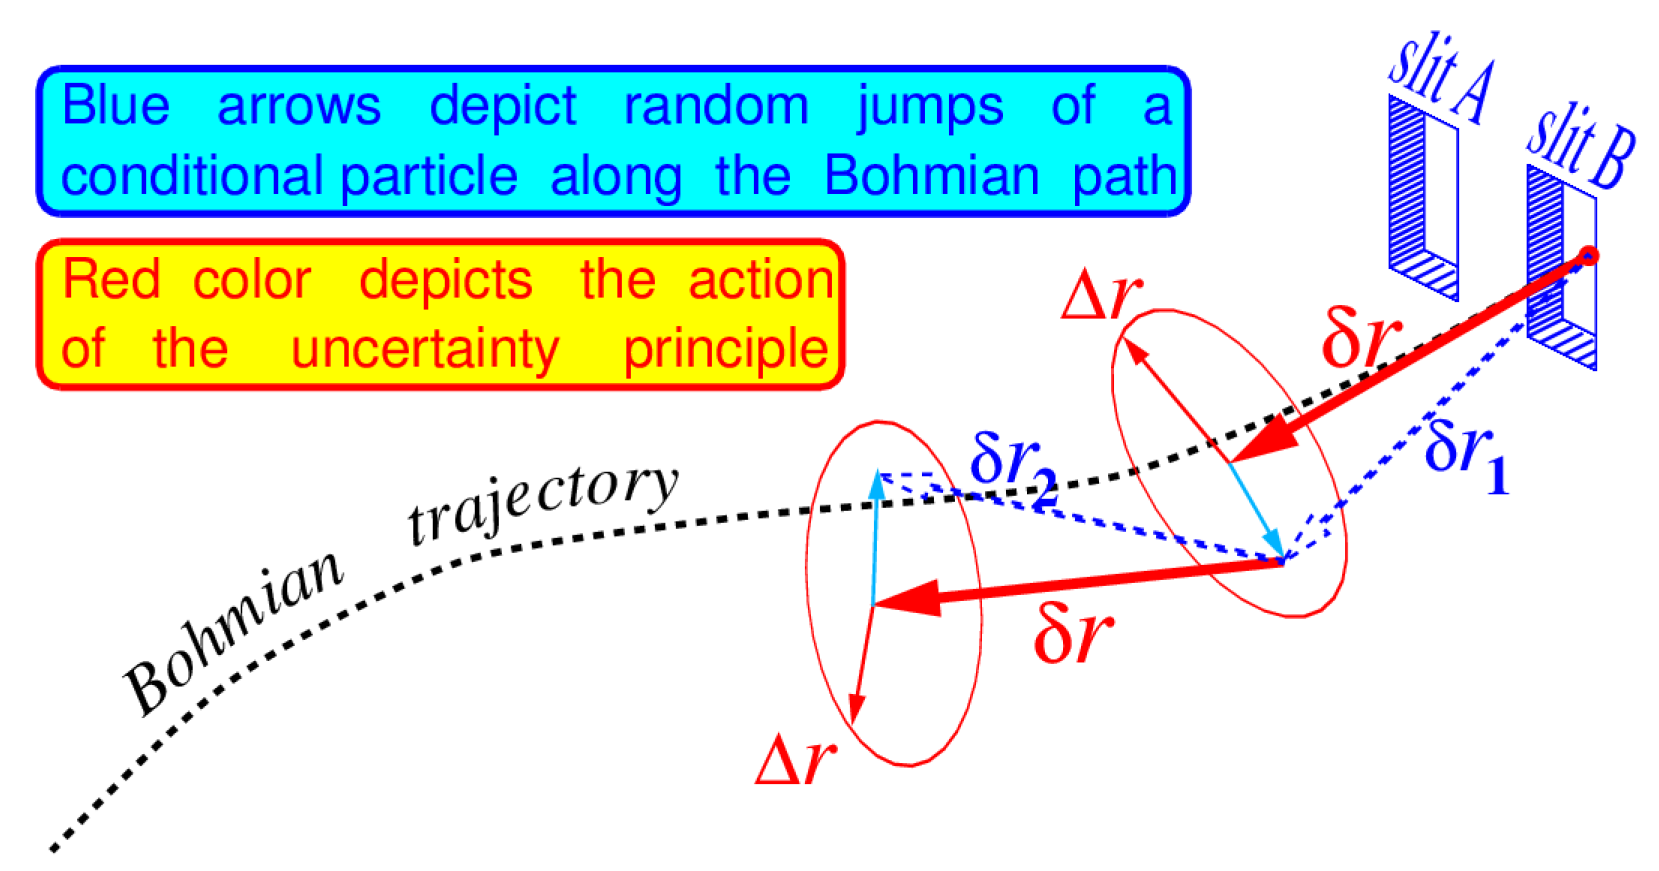
36) is the fundamental principle at measurements. In this respect the Bohmian trajectories are really "hidden entities" with the point of view of this principle. With the point of view of the uncertainty principle, a chaotic walking along the Bohmian trajectory can be evaluated as a random search with the self learning,
Figure 8. Actually, taking into account that
and further following to (
36),
we find the diffusion length of particle migration
where
is the quantum diffusion coefficient [
34].
Nelson has hypothesized that a free particle in the quantum space, or, say, in the ether, undergoes Brownian motion with a diffusion coefficient proportional to the reduced Planck constant,
ℏ, and inverse proportional to the inertial mass
m of the particle [
35,
36]. The particle undergoes random collisions with virtual particle fluctuations, filling ether. It provokes its deviation on about the diffusion length
. Near the slit, the particles experience strong deviations from the average path. Away from the slit, these deviations are weak. The jumps
,
in the figure are drawn by dotted blue arrows. They show deviations from tangents to the optimal Bohmian trajectory, but not more than on the radius of uncertainty given in Eq. (
36). The tangent lines
to possible optimal paths are shown by red arrows.
In average the jumps occur along the places where the density distribution function
reaches maximal values with respect to the adjoint regions having minimal values, see
Figure 7. De Broglie singularities tunnel quickly through these regions. Such transitions of the Bohmian trajectories are well demonstrated in works [
68,
69,
70].
Observe in this place that the set of slits placed regularly along an opaque screen themselves represent a simulacrum of correlated particles, whose wavelengths multiple of the de Broglie wavelength of the particle. Therefore although the particle flies through any one slit, the influence of other slits corrects its moving also. Since all slits act as a well tuned ensemble [
5].
On the other hand, according to the Copenhagen interpretation of quantum mechanics the position of the particle in physical space is absolutely unknown until the experimenter performs measurement. Therefore, no one can say for sure through which slit the particle will pass in the interferometer experiment. The Vienna team has demonstrated impressive experiments on coherent scattering of heavy fullerene molecules (carbon-60 molecules ) on interference gratings [
15,
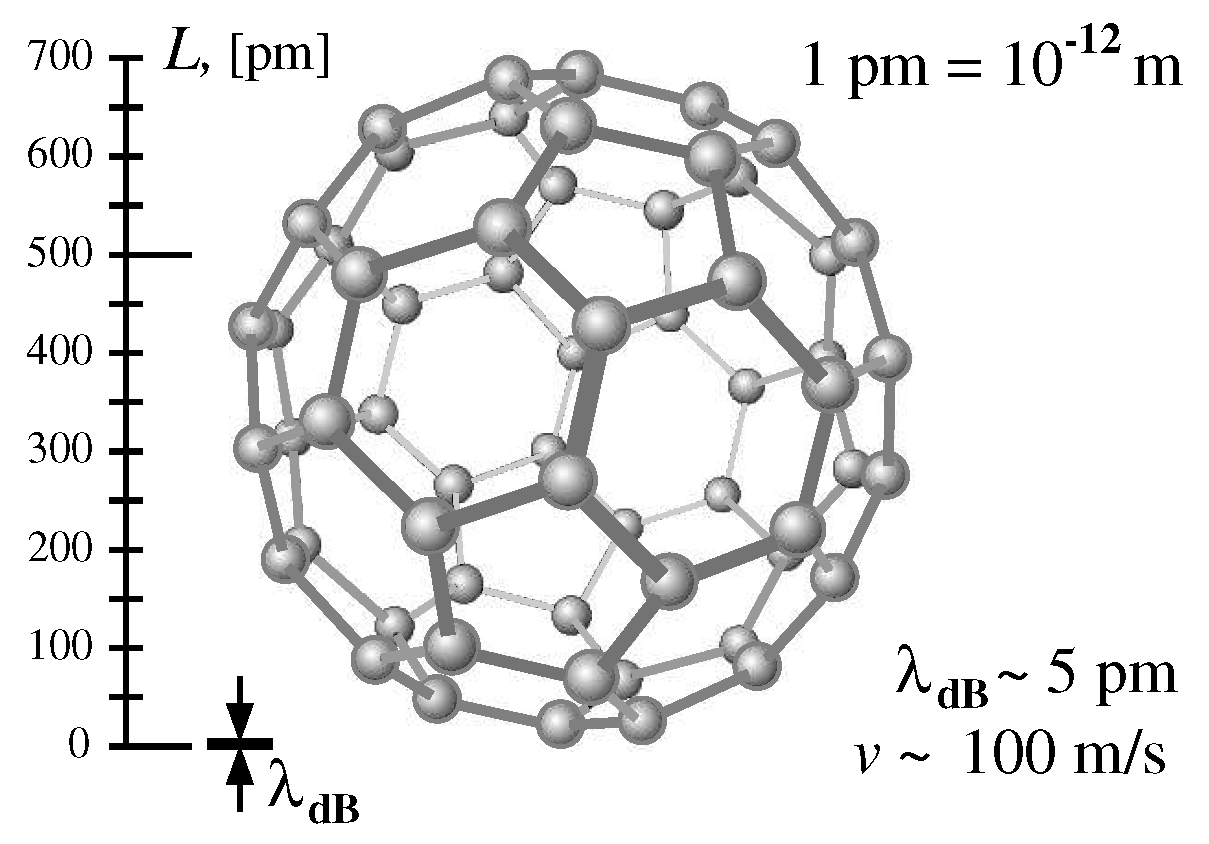
71]. The fullerene molecule has a transversal size about 700 pm. While the de Broglie wavelength is not more than 5 pm. The order in size is impressive [
16]. Nevertheless, the Vienna team has detected the interference pattern at the fullerene molecules incidence on an interferometer grating. They write that even the spontaneous emission of photons by the thermally excited fullerene molecule at passing the grating can not give the possibility to know which slit such a heavy monster,
Figure 9, has passed through.
Note that the irrotational component of the wave function gives a general scene of the space loaded by different physical devices – interferometer gratings, mirrors, collimators, and so forth. In fact, this component bears information about the physical scene of the space. While the toroidal vortex singularity perceives this information through constructive and destructive interference patterns created by the irrotational component in the vicinity of this singularity. Further we will study this mechanism in detail by considering the hopping droplets on the silicon oil described by Couder and Fort in the article [
72] entitled ”Single-particle diffraction and interference at a macroscopic scale”.
But here we will try to evaluate how the irrotational component gets the information about the physical scene.
2.4. Feynman path integral method and Huygens’s wave sources.
The Schrödinger wave equation can be resolved by heuristic writing of a solution by using the Huygens’ principle, which mathematically looks as [
73]:
The propagator
contains information on a physical space loaded by physical equipment, such as sources, detectors, collimators, gratings, etc. This physical scene is described by the potential
and by the boundary conditions superposed on it. So, a solution of the Schrödinger equation can be achieved by applying the Feynman path integral technique [
18,
74].
By applying this technique for describing the wave propagation through a grating consisting of
N slits we get the solution [
16,
67]
Here
is the de Broglie wavelength,
b is the slit width,
d is the distance between slits, and
n is sequence number of the slit.
The density distribution function is a scalar product of the wave function
:
It is show in
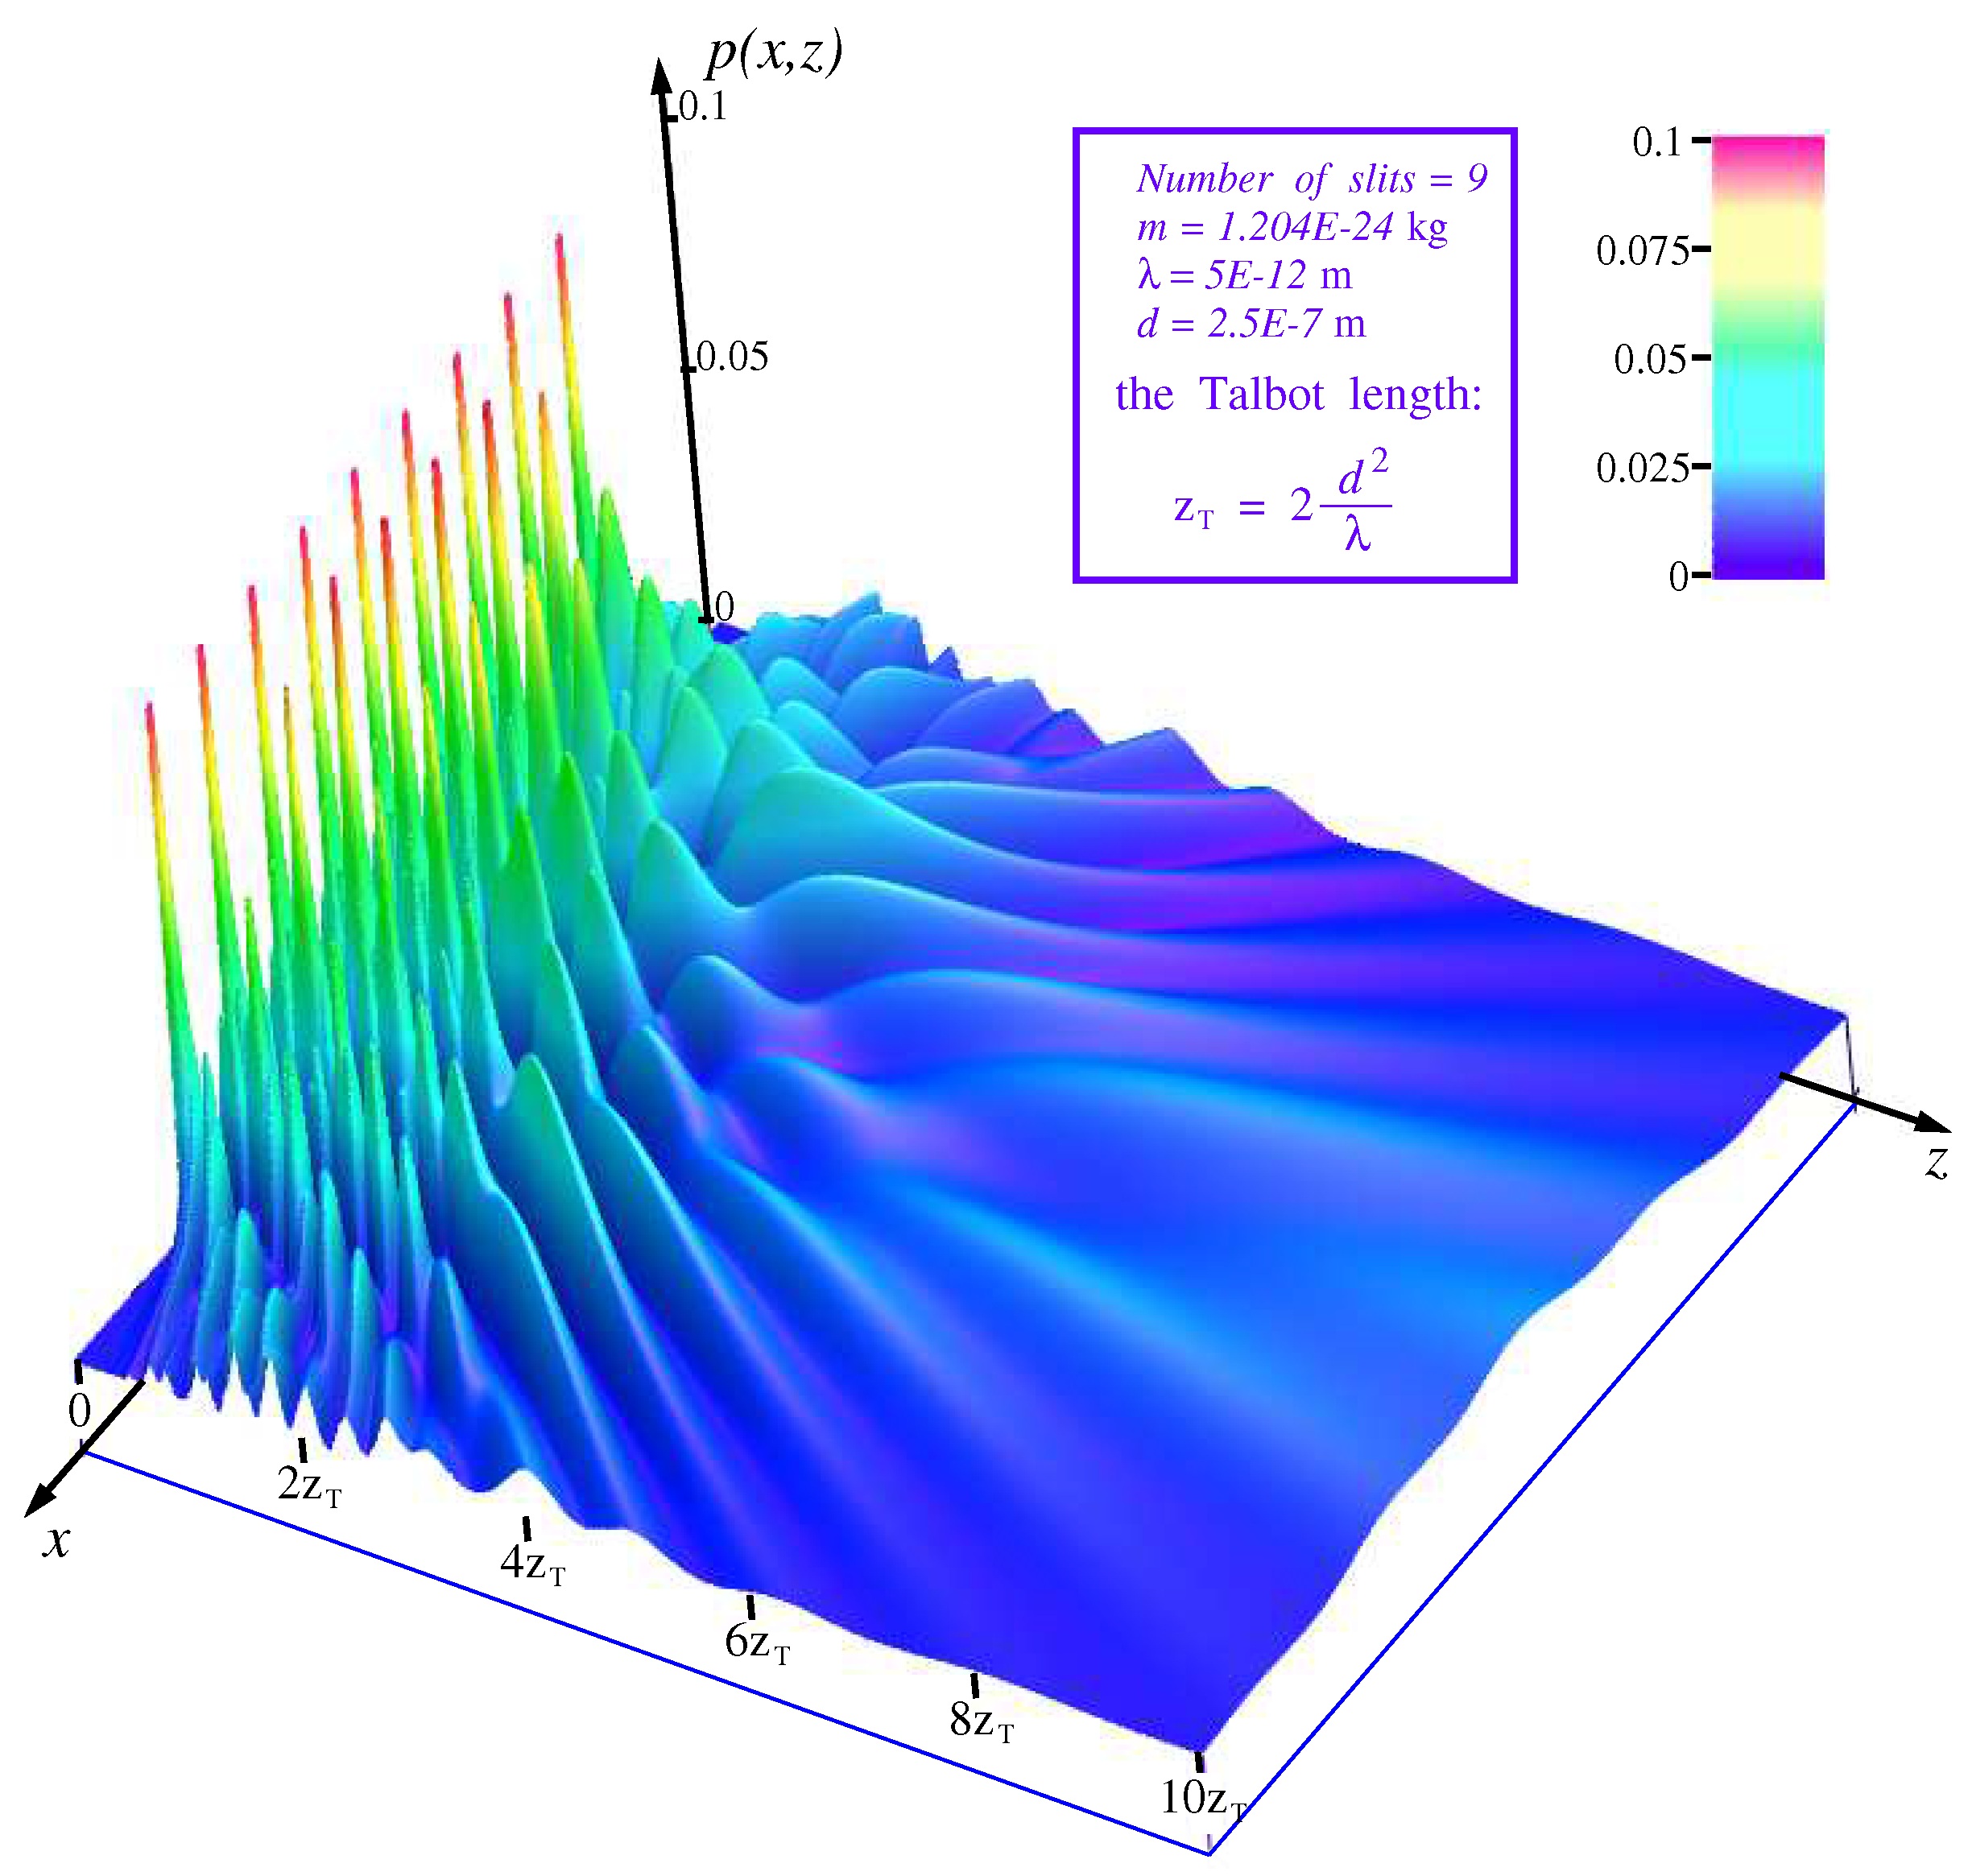
Figure 10. These calculations show interference of the coherent flow of fullerene molecules [
58] from the grating that contains
slits. The fullerene molecules have the de Broglie wavelength
pm what corresponds to the current velocity of the molecules about 100 m/s [
15]. Parameters of the grating are as follows: wide of the slit
nm, distance between the slits
nm.
In order to come from Eq. (
39) to the final result (
40) we need at first to imagine an interferometer design. It is shown in
Figure 11. Let us imagine that a plane wave with some de Broglie wavelength
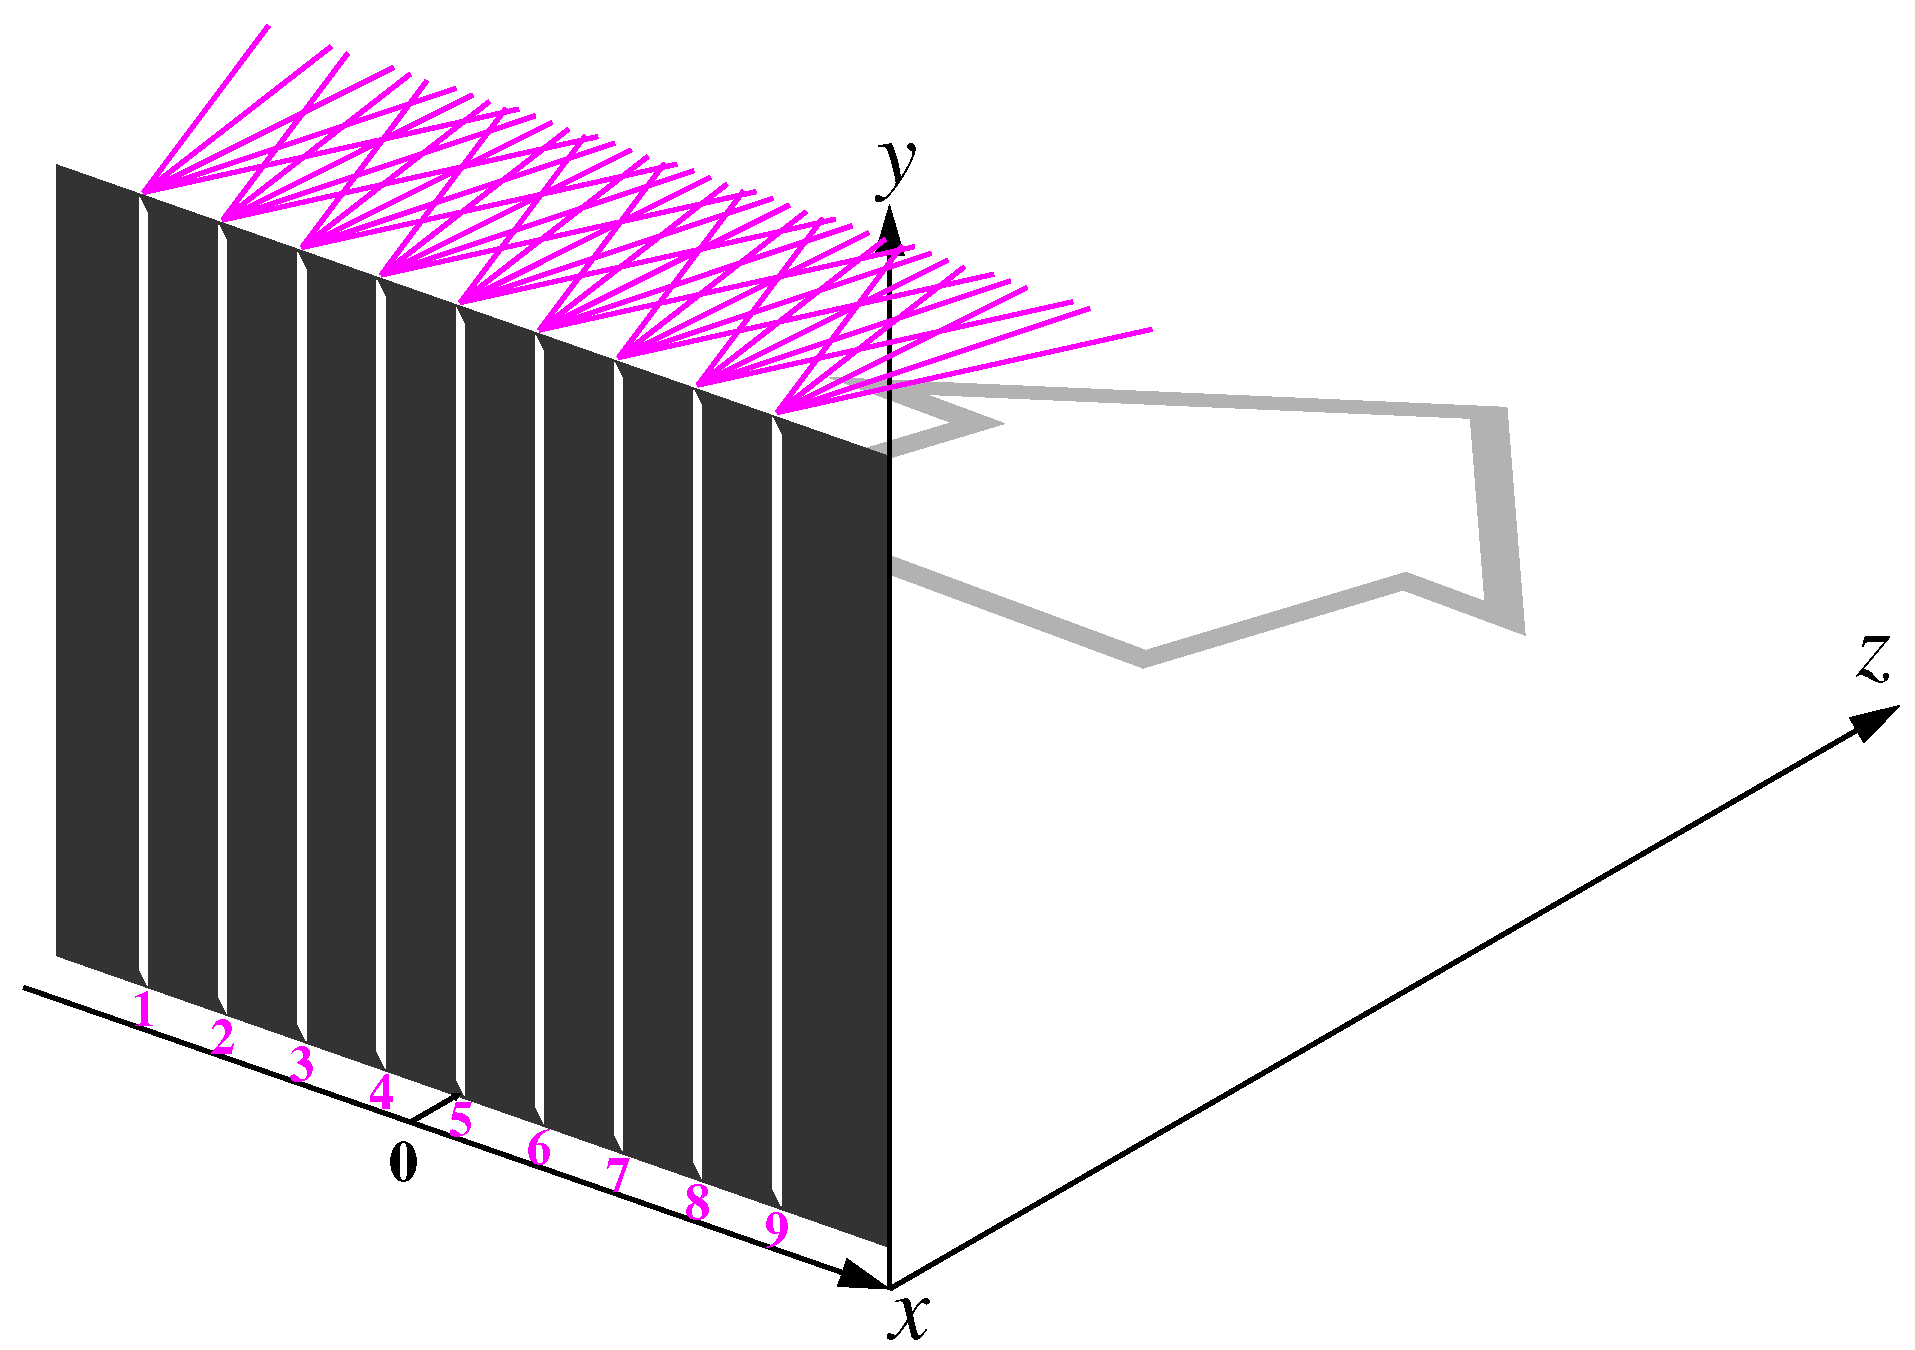
falls on an opaque screen where some parallel slits are cut along the
y-axis. The incident on the opaque screen along the
z-axis the wave has the following wave numbers
,
. By being rewritten through the momentum
one can remark
,
. For the plane wave the following requirement is valid: the variances of these momentum components are almost zeros –
. From the uncertainty principle one can conclude that the plane wave occupies a large volume of space
,
,
.
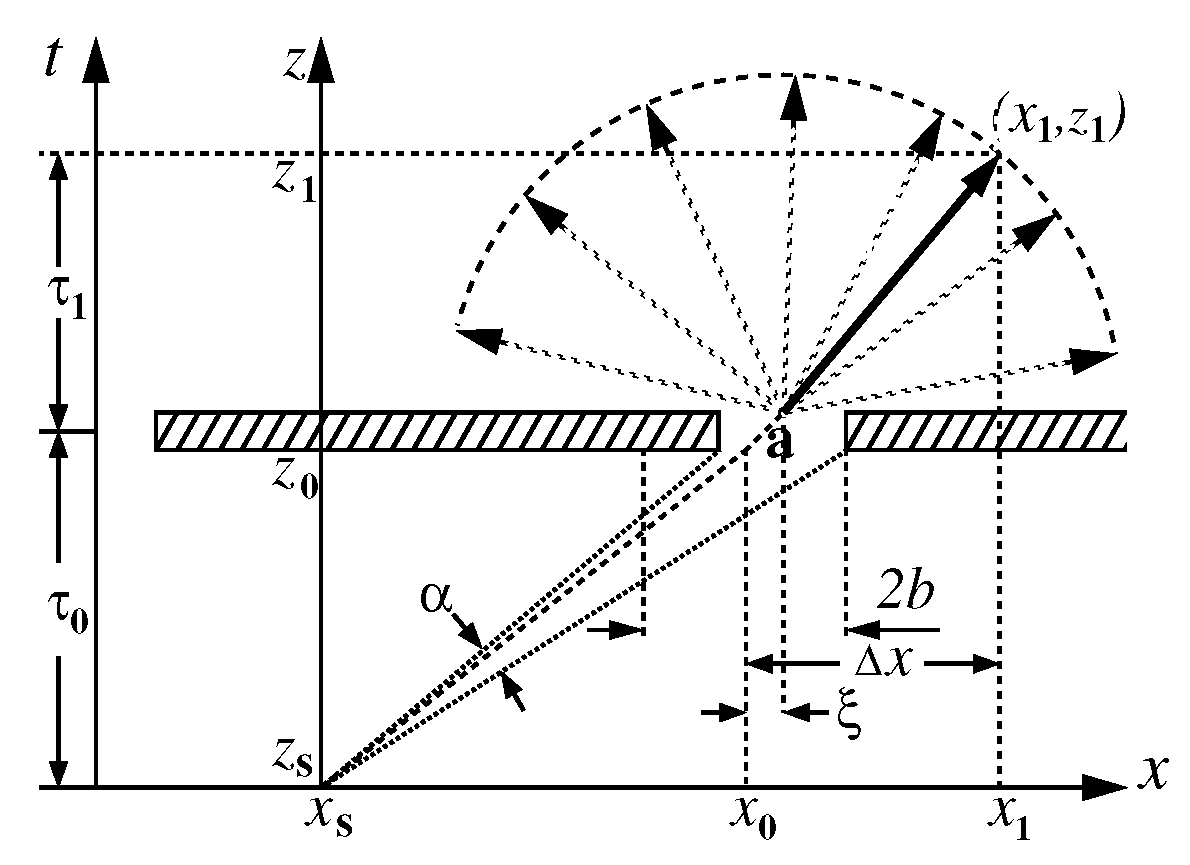
Thus surfaces of equal phases of the plane wave reach the opaque screen at the same time. A set of slits with a slit width multiple of the de Broglie wavelength and equidistantly located on the screen along the x-axis represent a common-mode, coherent emitter. Each slit emits a cylindrical wave oriented along the slit cutting according to Huygens’s law,
Figure 12. The superposition of radiations from all slits discloses an interference pattern behind the opaque screen. It is done by writing the path integral (
39) and its computation [
16]. The result of the computation is given in Eq. (
40). According to this formula the interference pattern in a transient zone is shown in
Figure 7 and
Figure 10. Whereas in the nearest and in the far from zones the interference patterns are shown in
Figure 13 and
Figure 14, respectively.
In the first case,
Figure 13, it is seen as a fancy interference pattern where particles need to perform complex zigzag-like jumps [
32] from one black patch to the nearest one through white areas. Here we need to note that the black patches are places where particle rays converge, and they avoid the white areas. The white areas are seen to divide all space by strict mathematical traceries. At
and
this beautiful interference pattern tends to the fractal Talbot carpet [
65,
75]
In the second case,
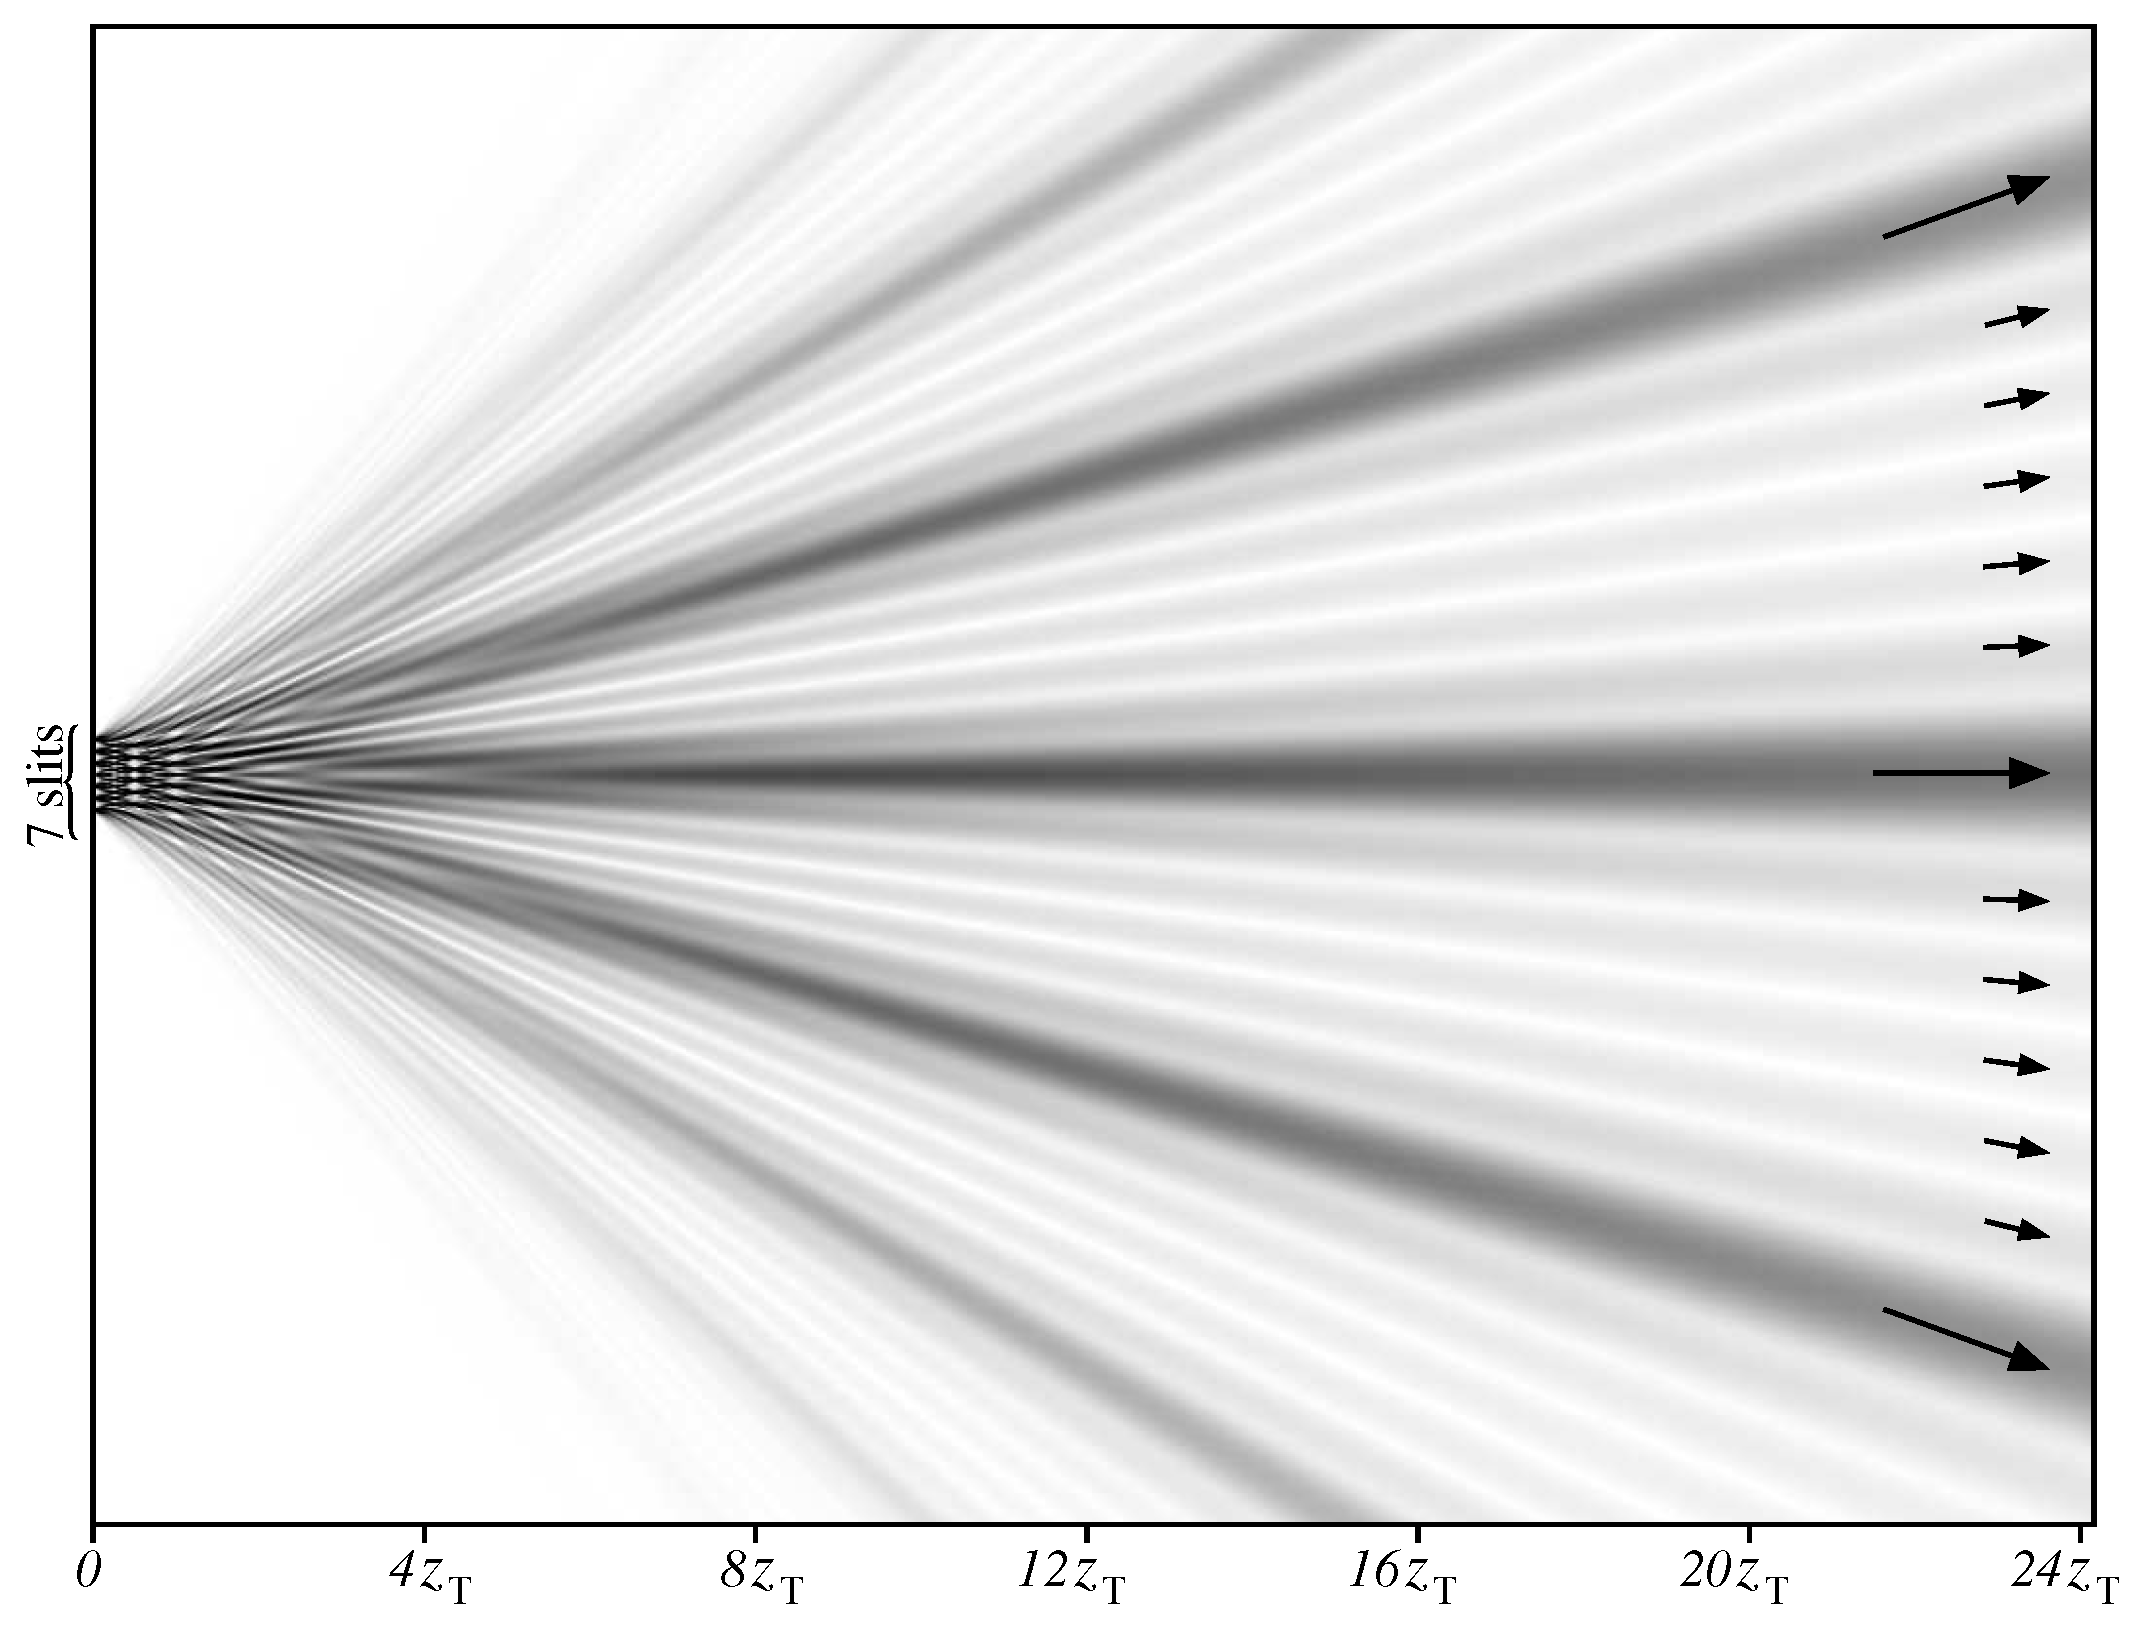
Figure 14, in far from zone the grating forms seven principal maxima. The neighboring principal maxima are seen to be separated by five subsidiary maxima. In this zone Bohmian trajectories of particles are simplified to almost straight rays running along the directions of these maxima.
As for the particles, here we will mention their absolutely indeterminate location in the beam incident on the interference grating,
Figure 11. Whereas their momenta, in accordance with the uncertainty principle, are precisely directed along the axis
z. It means that no one can point through which slit a particle will pass. In order to get the interferometer pattern from particles incident to the grating the experimenter needs to perform a huge number of tests on the passage of particles through the interferometer, as for example, at the interferometry of large molecules - fullerenes [
15].
The question arises – how does a particle choose a path leading it mainly to that area where a true interference fringe from a grating containing N slits should appear? The answer to this question is primarily based on the fact that the N slits grating itself is a quantum object. All slits of which illuminate in phase and determine a luminosity field in front of the lattice in accordance with the Huygens principle, which was mentioned earlier.
With this puzzle in mind, it is proposed to consider the illustrative example of the passage of an oil drop through an obstacle that contains two gates for the drop passing on the other side of the obstacle. It should to be note that to the consideration of the famous experiment, set up by a group of physicists under the guidance of Yves Couder [
72,
76,
77], was devoted a huge amount of articles available in press [
78,
79,
80,
81,
82,
83,
84,
85,
86]. Therefore, it makes no sense to repeat the results of these studies again. Here I will take a look at this problem from the point of view of the physics of critical phenomena.
An important moment for the drop bouncing along the oil surface is a constant shaking of the bath filled by the oil. The shaking at that should be with an amplitude and at a frequency supporting the Faraday waves near the critical boundary of their emergence.
3. Hydrodynamic excursion into understanding the intricacies of quantum mechanics
The main highlight in the task with bouncing droplets on the surface of oil in the bath is a constant shaking of the bath in the vertical direction. The shaking occurs with such frequency and intensity that a homogeneous state of the oil surface without any waves on this surface is supported. But this regime of the shaking is in the very immediate vicinity of the beginning of these waves [
81,
82,
84] – Faraday waves. In fact, the point of separation of these states, where there are no waves and where they already exist, is called the subcritical bifurcation point [
87]. As for the shaking of the surface of a fluid the subcritical bifurcation associates with the Faraday threshold [
78,
88,
89]. When dropping the droplet on the oil surface it generates near the Faraday threshold the appearance of symmetrical lateral waves. The latter by spreading over the whole oil bath and induce a pattern of the classical Faraday instability. This interaction of the droplet with the oil surface Protiére, Boudaoud, and Couder [
78] represent by the following equation:
This is Newton’s first law applied to a drop with mass
moving in the direction of the
x-axis. As for the right side of the equation, here we note only the parameters that are important for the subsequent presentation. A more detailed description of them is given in the mentioned work [
78]. Here
is the velocity of the drop moving along the
x-axis and
is the phase velocity of the Faraday wave induced by the previous collision. The force
is proportional to the amplitude of the vertical acceleration
and to the slope of the generated surface waves. The term
is the effective damping based on the viscosity of air.
The steady regime is when the acceleration
is equal to zero, which means to vanish Eq. (
42). For computing the steady regime we expand the sine into a power series up to the second degree. As a result, we come to two equations. The first equation gives
for all values of the control parameter
. The second equation is quadratic and returns two solutions [
78]:
Here
is the subcritical bifurcation threshold. When the control parameter
reaches this threshold, the walker velocity
as a function of
undergoes a jump of the first derivative by the parameter
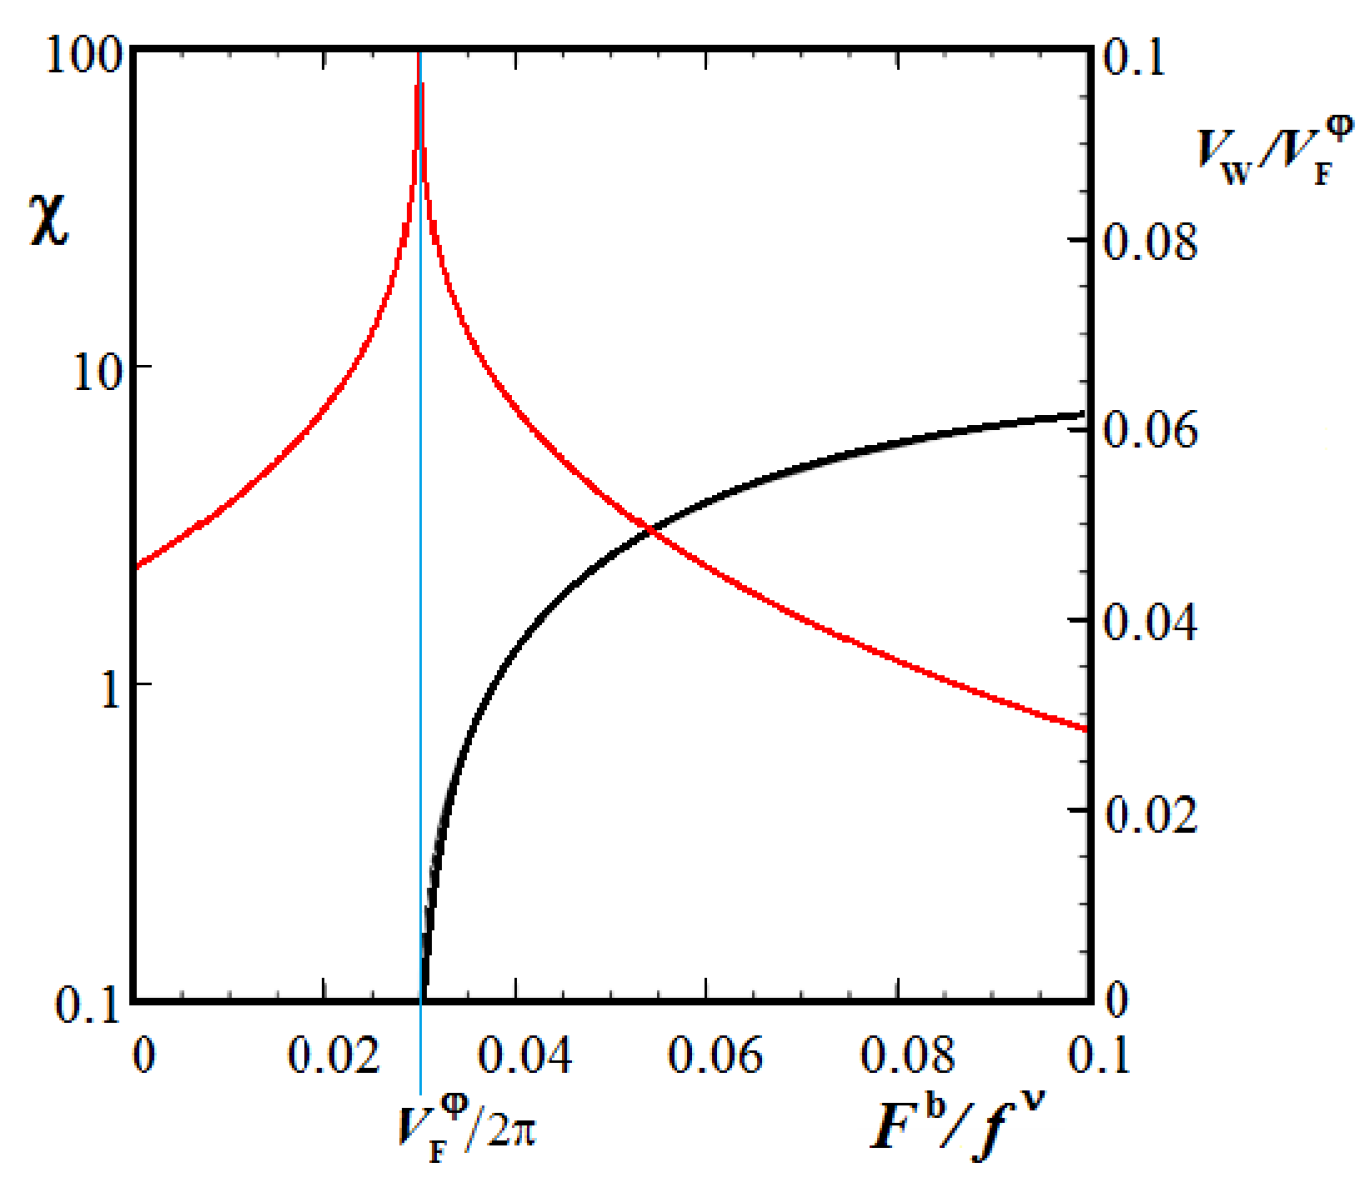
, as shown by the black curve in
Figure 15. Here only the positive branch is shown.
Although the authors [
78] considered the model of the drop movement in one-dimensional space, these conclusions are easily transferred to its motion on a two-dimensional surface. The oil in a bath subjected to vertical shaking can come from the homogeneous state of rest to the state when the shaky waves begin to cover its surface. It occurs when the critical shaking threshold is reached. These waves named the Faraday waves cover the whole surface reflecting from any obstacles placed in this bath. A complex wave pattern induced over the whole bath surface bears information about all obstacles placed in the bath.
The Faraday wave pattern formation on 2D surface after reaching the bifurcation point
is the second order phase transition [
90,
91]. In this case we observe the symmetry breaking at the transition from the homogeneous steady state to the emergence of the high symmetric Faraday wave pattern. The order parameter here can be the amplitude of the Faraday waves.
But a more informative parameter at the second order phase transition is the zero-field susceptibility
. In our case it comes the differentiation of the drop velocity
, i.e., Eq. (
43) by the control parameter
from:
In
Figure 15 this function is drawn by red. One can see that this function goes to infinity as the control parameter
tends to
. It means that the susceptibility of the oil to any extraneous fluctuations, for example, touching the surface of the oil by a bouncing drop, induces long-lived oscillations on the oil surface.
Theoretically, when the control parameter reaches the critical phase transition point then at this point the fluctuations become infinite in lifetime and infinitely long-correlated. Such fluctuations store information about all obstacles immersed in this fluid for a long time. Near the particle the interference fringes from these fluctuations create a pattern mapping the carried information. As for the de Broglie hidden medium [
19] (the ether), here the singular particle traveling through this medium experiences each time the influence of it, due to which the particle moves along some optimal trajectory. Following the above remarks one can guess that the hidden medium is at zero-point energy level, and it possesses high susceptibility in relation to external excitations. The latter may come from different devices embedded in this environment.
Further we try to understand in detail what can represent such a hidden fluid medium.
3.1. Navier-Stokes analog of quantum mechanics
The caption of this subsection stems from Harvey’s article [
92] printed in Physical Review in 1966 and entitled in the same manner. Here we try to understand by which manner the classical viscous fluid can give sprouts leading to the hidden de Broglie medium. For this aim in mind we begin from writing the Navier-Stokes equation for incompressible fluids
[
44]:
The term describing the influence of the gravitational force we do not take into account here because of its absence in Eq. (
10). Instead we write an external conservative force density as the gradient of the external potential energy density
.
The following two terms from the right side in Eq. (
46) are the pressure gradient
and the viscosity term
. Here the parameter
is the dynamical viscosity coefficient having the dimension Pa·sec=kg/(m·s). Although the viscosity is absent in Eq. (
10) describing the flowing of the ideal fluid, we decided to leave it here. The aim is to understand what role the viscosity can play at the emergence of the superfluid flow.
Our target is Eq. (
10). Let us modify the terms in Eq. (
46) in such a manner to get the desired result shown in Eq. (
10). Below we rewrite Eq. (
46) taking into account the desired modification [
46]:
and the second equation is the continuity equation
These two equations at pair give a full picture of the fluid flow. The first equation gives the velocity field of the fluid under consideration, while the second one shows the mass density distribution in this fluid. In these equations
Here the mass
M of the fluid that fills the volume
is equal to the product of the number,
N, of identical sub-particles populating this volume, by the mass
m of these sub-particles [
93]. Consequently, the mass density
is the product of the mass
m by the density of the sub-particles
.
The internal forces are due to pressure gradients acting within the fluid and dissipative forces arising due to the fluid viscosity. They are represented by the last two terms in Eq. (
46).
As for the fluid viscosity we could discard it to come to the describing ideal fluid. Such a fluid manifests at representing the complex-valued wave function by two real-valued functions when solving the Schrödinger equation. It is the solution of the Hamilton-Jacobi equation (
8) convoyed by the continuity equation (
7). However, the lack of viscosity is not a good idea, because sooner or later it leads to the appearance of bad singularities. We adopt the following modifications relating to the viscosity – the dynamic viscosity coefficient,
, fluctuates in time about its zero value:
As for the pressure gradient, its classical witting,
, is subjected to a slight modification
One can see that the difference of Eq. (
47) from the classical Navier-Stokes equation (
46) is due to the existence of the last term in Eq. (
51). This extra term in the pressure gradient provides the emergence of the quantum potential in Eq. (
47). Let us show this.
3.2. Where does the quantum potential come from?
First we rewrite Eq. (
51) in a form convenient for the following computations:
We remark from Eq. (
49) that here
. For that reason we can delete the particle mass from the following consideration. Only the amount of carriers
N inhabiting the volume
under consideration is important. Their random walks lead to mixing of the ensemble of carriers, leading to their chaotization [
35]. It is naturally admitting that the Fick’s laws are justified on this chaotic ensemble if the carriers are elastically dispersed during collisions.
Nelson writes [
37]: "the natural stochastic generalization of classical variational principles leads to a derivation of the Schrödinger equation." Here we begin with the Fick’s law to attain quantum potential. The law says that the diffusion flux,
, is proportional to the negative value of the density gradient:
where
D is the diffusion coefficient. Note that since the term
has dimension of the pressure we define:
Hereinafter we write
is the quantum diffusion coefficient (
38). On the other hand, the kinetic energy of the diffusion flux is
. From here it follows, that there exists one more pressure
as the square of the diffusion flux divided by the double mass density:
Now we can see that the sum of two pressures,
and
, divided by
(we remark that
, see Eq. (
49)) reduces to the quantum potential
A question can arise in this place. If we have proclaimed earlier that the hidden medium possesses superfluid properties, why do we admit the existence of a chaotic medium where the Fick’s laws can act? The answer can be the following. Really the superfluid consists of mixed parts. The first part is possessed by the ideal super fluidity. While the second part is a normal fluid possessed by all signs typical for the Brownian motions. These mixed parts follow from the theory of the superconductivity founded by Landau and Ginsburg in 1950 [
94]. According to this theory, the superfluid contains two components – the superfluid component and the normal one. The ideal superfluid has zero viscosity and flows without Joule losses [
95,
96]. While the normal fluid has such losses. These losses induced by chaotic Brownian walks are the reason for acting the Fick’s laws.
The normal fluid immersed in the superfluid component is encapsulated by this superfluid like the Abrikosov vortices [
97] are encapsulated by a superconductor. The encapsulated normal fluid self organizes in a percolating lattice penetrating the whole superfluid. So, the Brownian walks [
34,
37] are possible through the lattice.
3.3. The quantum-mechanical Navier-Stokes equation
Now, let us rewrite the modified Navier-Stokes equation (
47) by dividing it by
, by substituting the quantum potential
Q instead of
, and replacing
by the expression
, as follows from Eq. (
11), where
is the vorticity. We get:
In the rightmost term
is the particle momentum and the term
is the kinematic viscosity coefficient. Its dimension is m
s
such as for the diffusion coefficient (
38).
Further we will take into account the decomposition of the velocity
into the irrotational
and the rotational (solenoidal)
, see Eqs. (
12) (
13). So, the irrotational velocity
of the particle is defined as
, where the scalar function
S is the action. The momentum and the kinetic energy of the particle in this view have the following representation
The kinetic energy is seen to contain the sum of both energies irrotational and solenoidal energies. Looking ahead one can say that the irrotational motion stemming from the gradient of the scalar function follows from the phase component of the wave function guiding the particle. While the latter term is due to the solenoidal motions leading to formation of different vortex manifestations. The first who took attention to the vortices as the foundation of particles was Kelvin with his famous article devoted to this supervision [
48].
Now we may rewrite the modified Navier-Stokes equation (
57) in the more detailed form
One can see that in this equation there is a series of terms that are under action of the operator ∇ and other terms free from its action. Let us regroup these terms. As a result, this equation can be rewritten as follows:
The braces single out two qualitatively different functions here – scalar-valued function
and vector-valued function
. Therefore, by applying to this equation either the operation of the inner product or that of the cross product, we extract either the left part of this equation or the right part.
Let us apply first the scalar product ∇-operator to Eq. (
60). We see that
vanishes. Only the function
stays nonzero:
Here
C is the integration constant. Recall that this equation is the modified Hamilton-Jacobi equation describing a flow of the irrotational velocities subjected to the kinematic viscosity fluctuations
that submits to the conditions (
50) – the averaged zero viscosity and the nonzero variance. We rewrite in the above equation the term
as follows:
The term
comes from the continuity equation (
7):
The last equation says that the quantum entropy
of the fluid filling the unit volume
changes as the velocity gradient varies of this fluid.
Now the modified Hamilton-Jacobi equation and the continuity one, both dealing with the real-valued functions
and
S, open the path to get the Schrödinger equation, working with the complex-valued wave function:
which is the nonlinear equation, because of existence of the term marked by brace (a). This equation is seen to be like the Gross-Pitaevskii equation [
98,
99] except for two things: (a) the term
enters this equation through the full derivative from logarithm by time; (b) the viscosity coefficient,
, is the fluctuating variable of time, at that the average on time vanishes, but its variance is not-zero, see Eq. (
48). It can mean that the above equation is the Langevin equation with a non-linear noise source. From here we can conclude that the wave function being a solution of this equation may manifest small fluctuations similar to the Brownian ripples.
Now let us multiply Eq. (
60) from the left by the curl operator. The first part,
, vanishes. Only the second part,
, is not zero. It results to the vorticity equation [
47,
54]:
The rightmost term describes dissipation of the energy stored in the vortex. As a result, the vortex should disappear in time. Here we consider the main topological features of the vortex having the nonzero viscosity fluctuations
. Let us look at the vortex tube in its cross-section,
Figure 3, which is oriented along the axis
z and its center is placed in the coordinate origin of the plane
. Equation (
65), written down for the cross-section of the vortex, looks as follows [
54]:
A general solution of this equation has the following view
where
is the integration constant having dimension [length
/time] and the denominator
has a view
Here
is an arbitrary constant such that the denominator
in Eqs. (
67)-(
68) should be always positive.
Note that the kinematic viscosity coefficient
according to (
50) vanishes in the time average, but its variance is not zero. There can also be a rapid oscillating tremor of the particle (the zitterbewegung – "jittery motion") on an angular frequency
which is approximately on
radians per second. Obviously, if
is an alternating function of time, on average on the time it stays equal to zero. The vortex will live indefinitely in this case. The oscillating viscosity one can define, for simplicity, as follows
Such a particle breathing is associated with the irrotational motion described by the Schrödinger equation (
64) through the nonlinear term. Consequently, the both components – the irrotational and solenoidal motions – are connected through the viscosity fluctuating in time. Since the irrotational motion is superfluid then the exchange of the energy by means of the fluctuating viscosity is reversible, it goes without the Joule heating. One can note, however, that such particle breathing can be the reason for its decay.
Now the solution for the rotational velocity
at the time tending to infinity looks as follows [
50,
54]:
Here
should be more then
. The coherent Gaussian vortices with the common core allow superposition
where
grows with increasing
n. For the sake of simplicity, here we consider the following simple dependence [
50]
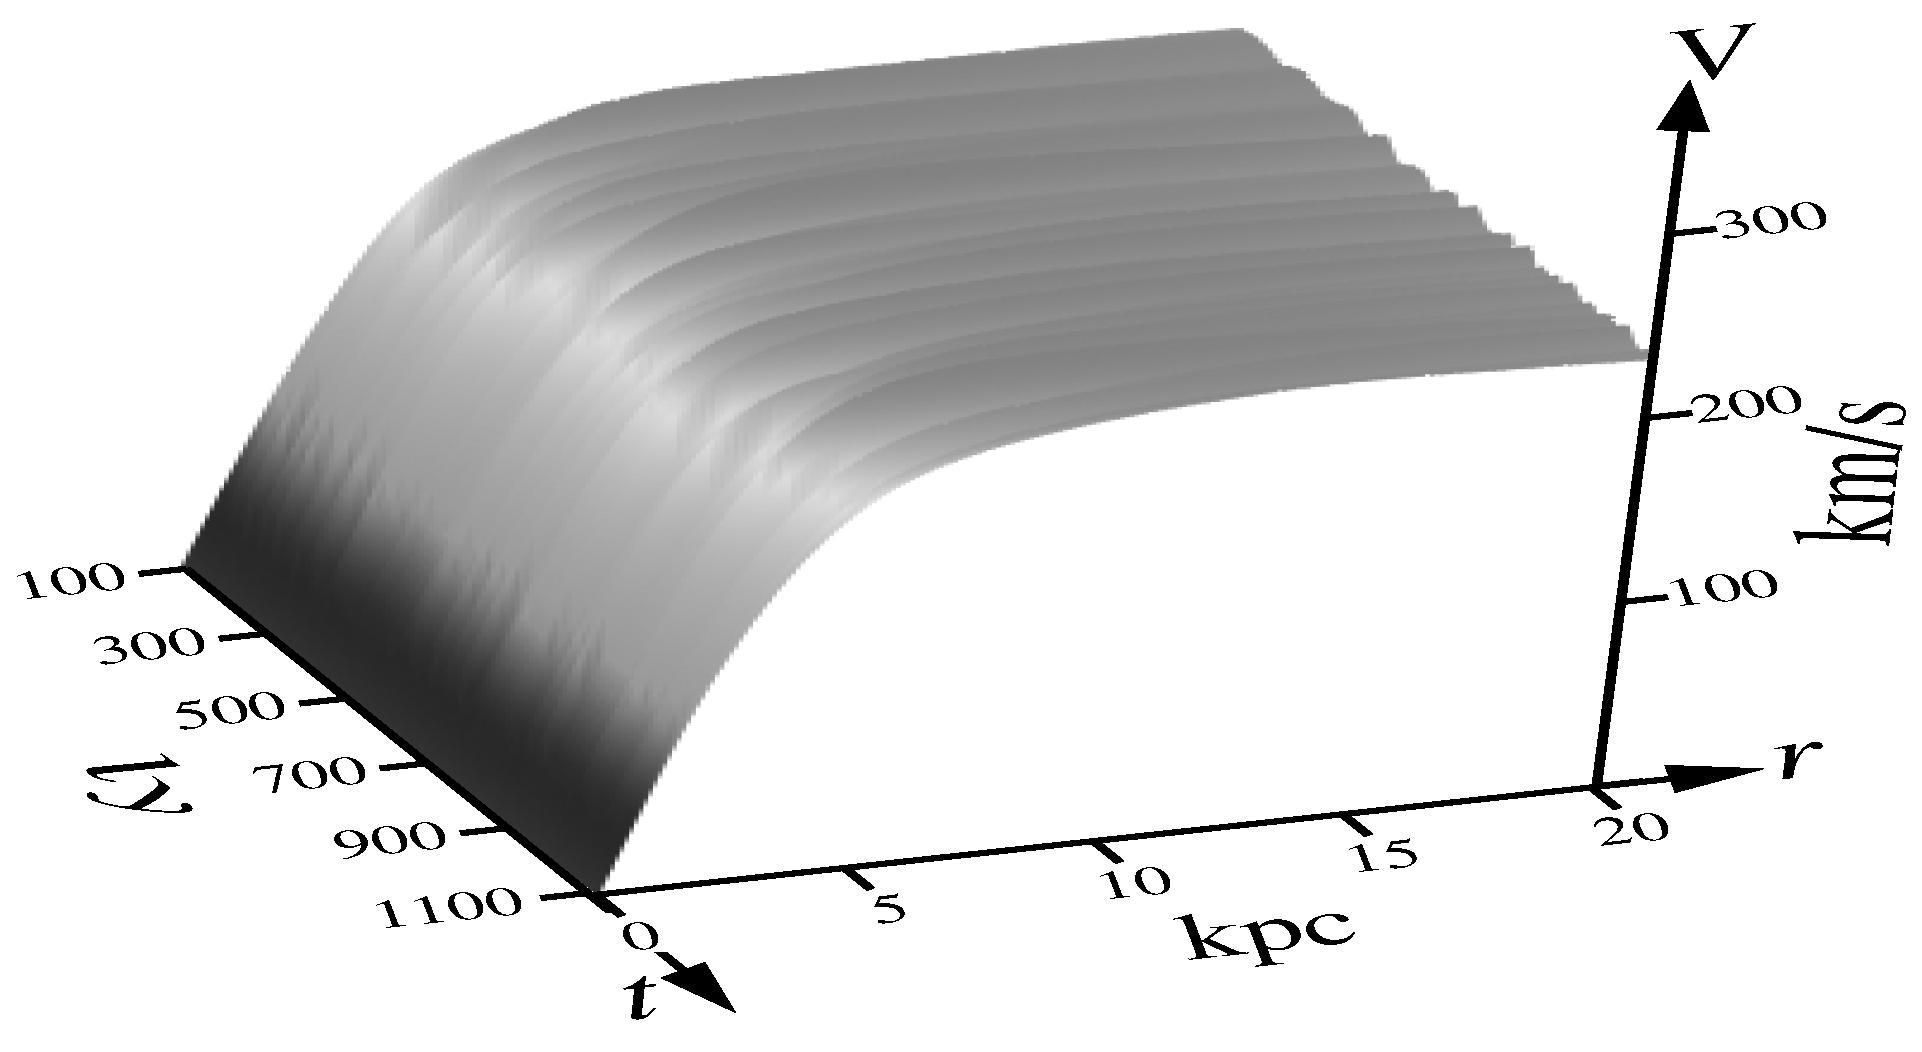
Figure 3 shows the orbital speed as a function of the distance
r for two different cases:
, and
, branches (a) and (b), respectively. The profile of the speed grows monotonically as
r increases from the center of rotation in both cases. In the case of
, the speed after reaching the vortex wall begins to drop monotonously,
Figure 3, branch (a). While for the case of large enough
N, the speed behind the vortex wall comes to a flat level,
Figure 3, branch (b). The latter case agrees well with astronomical observations of the orbital speeds of the rotating spiral galaxies [
101,
102]. As for the term
in Eq. (
71) its availability induces weak oscillations of the vortex branches, as shown, for example, in
Figure 16.
4. Toroidal rings and vortex balls as particle models
Let us glue the opposite ends of the vortex tube having the radius
a, see
Figure 3. As a result, we get a torus shown in
Figure 17(a). In fact, here the topological transformation of an infinitely long vortex tube was done. As a result of this transformation we get a torus.
The torus shown in
Figure 17(a) is calculated at the parameters
and
. On the torus surface a one-dimension string
twice covering the torus tube is shown. The parameters defining the torus (
18) are as follows
,
, and
.
Note that the torus volume and its surface are computed by the formulas
At
a going to zero the volume and surface vanish. The torus degenerates to a ring of the radius
laying in the plane
. When
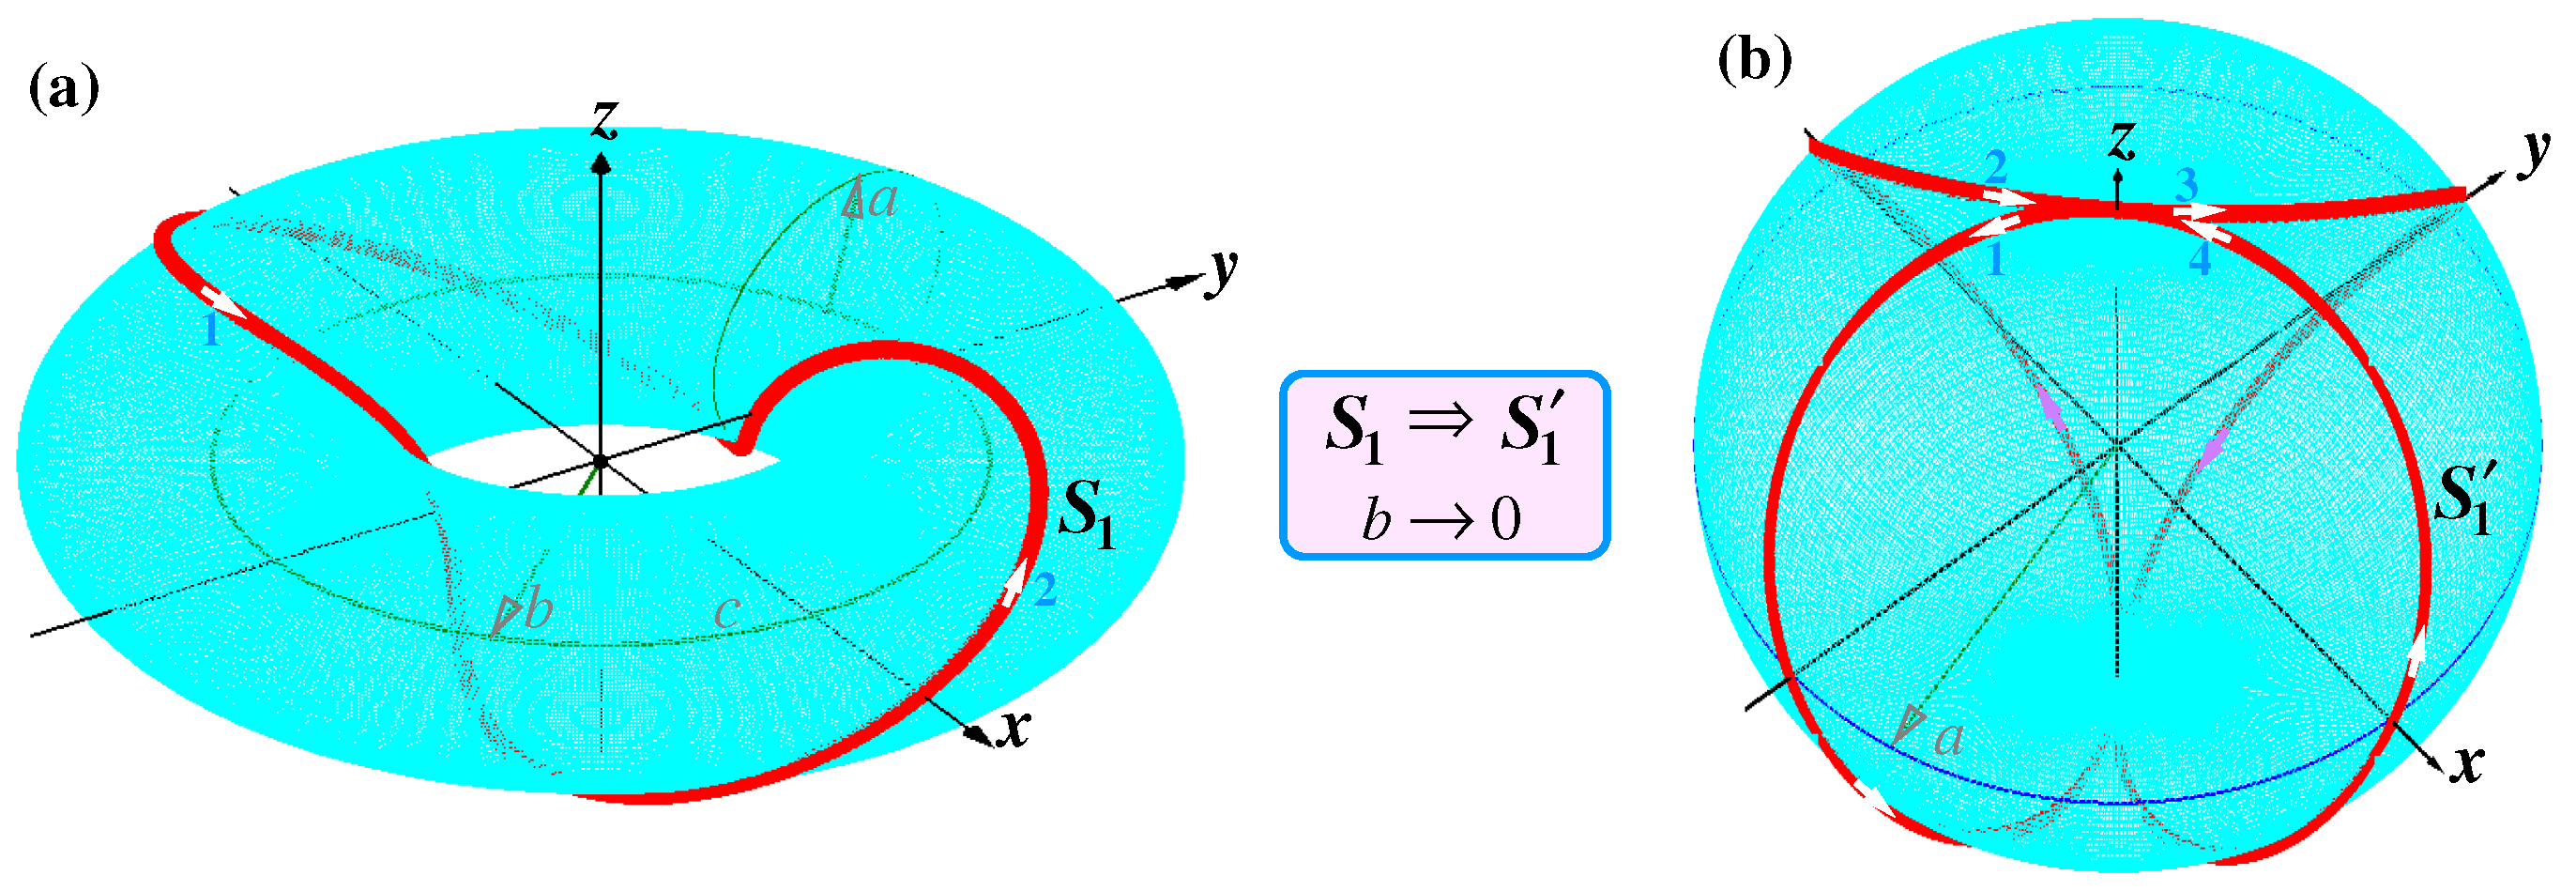
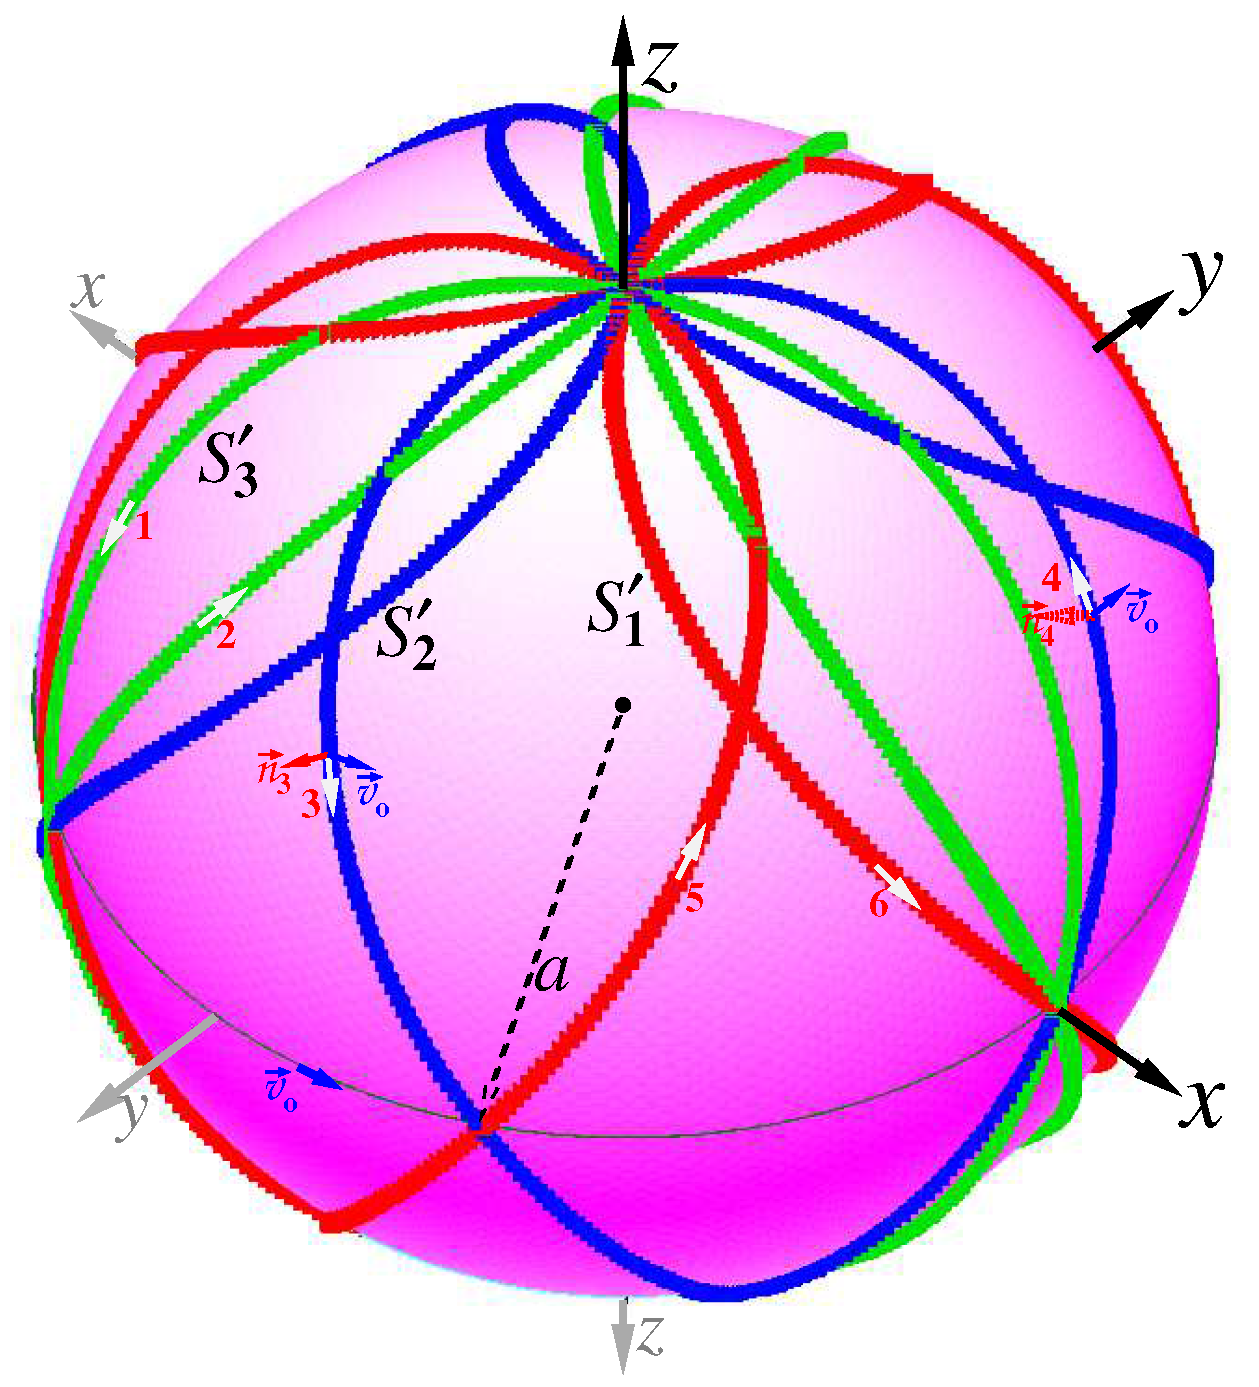
b goes to zero the volume and surface vanish as well. However, the torus in this case transforms to an object twice covering a 2D sphere of the radius
,
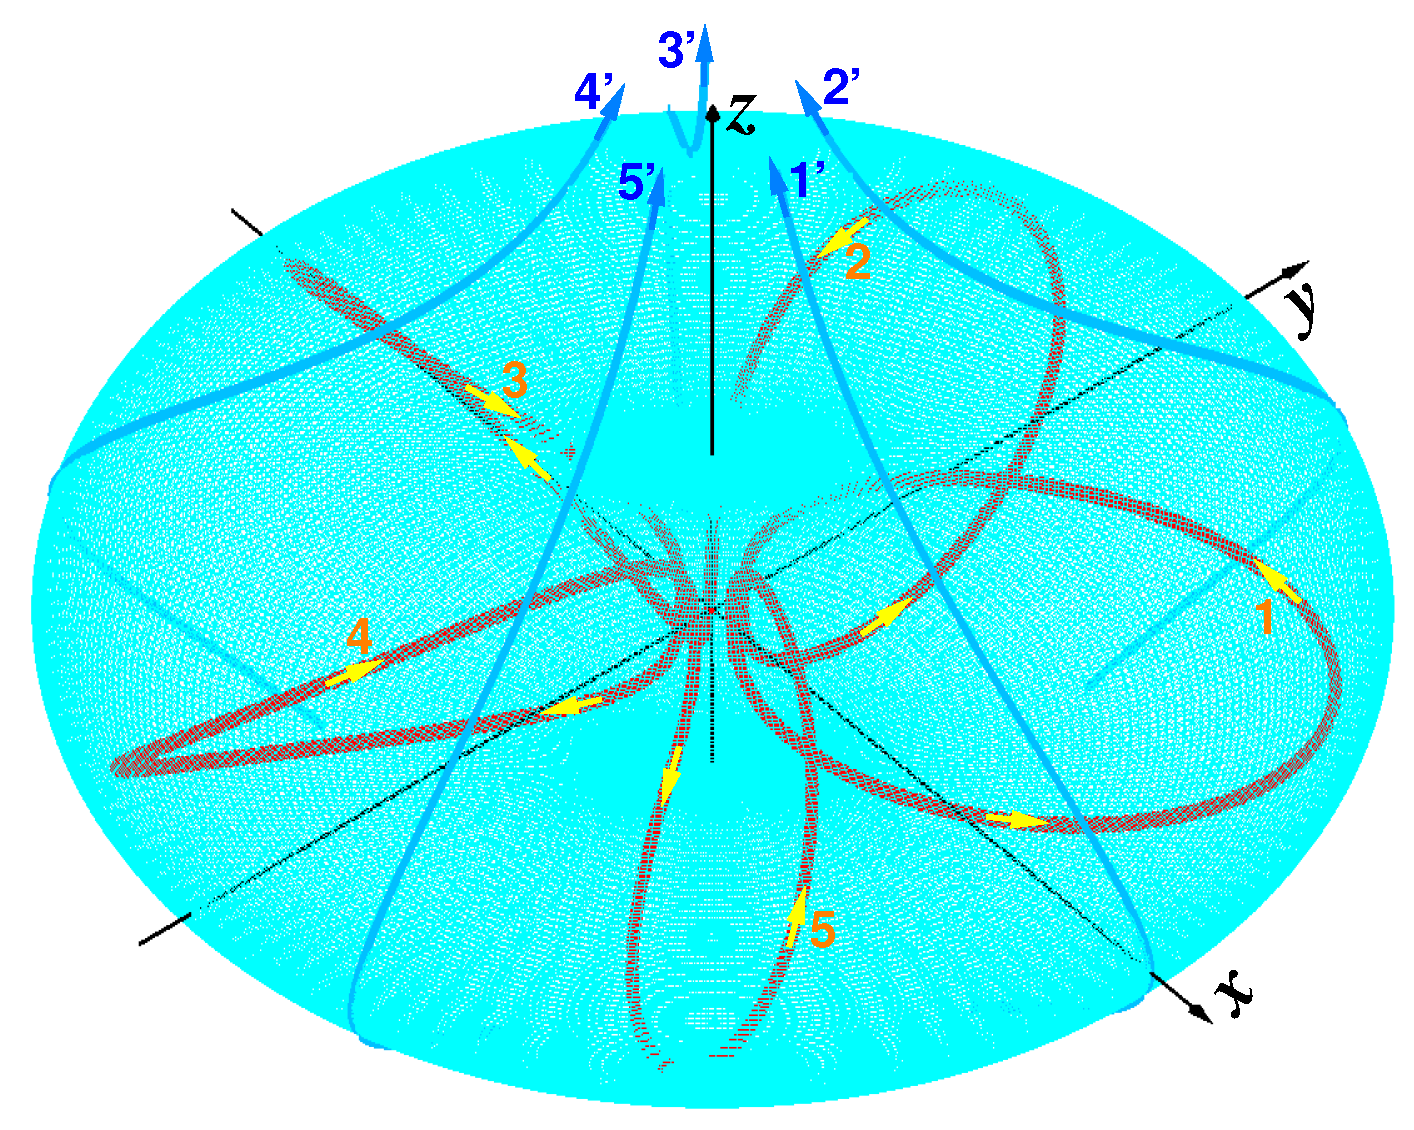
Figure 17(b). The string
maps to the string
laying on the surface of the 3D sphere. The white arrows on these strings point to the orientation of currents flowing along them. On the second figure this orientation is seen to reach its initial state marked by the number 1 after two of its rotations through the bottom pole. It is a characteristic sign of the half-integer spin. The spin rotation on this 2D sphere is represented as a motion of the unit vector in the magnetic field [
103,
104]:
The solution of the spin rotation in this magnetic field looks as
These components submit to the condition
This four-dimension unit vector describes a complex two-fold curve on the surface of this sphere along the string
pointed by the white arrows in
Figure 17(b). Here the parameters
specify the position and the width of a resonance maximum, where
are the Larmor precession frequency and the apex angle of the cone described by the vector
, respectively [
103]. The solution (
77) points indirectly to the double hollow sphere endowed with a fluctuating string enveloping its surface,
Figure 17(b) as a possible model of a particle.
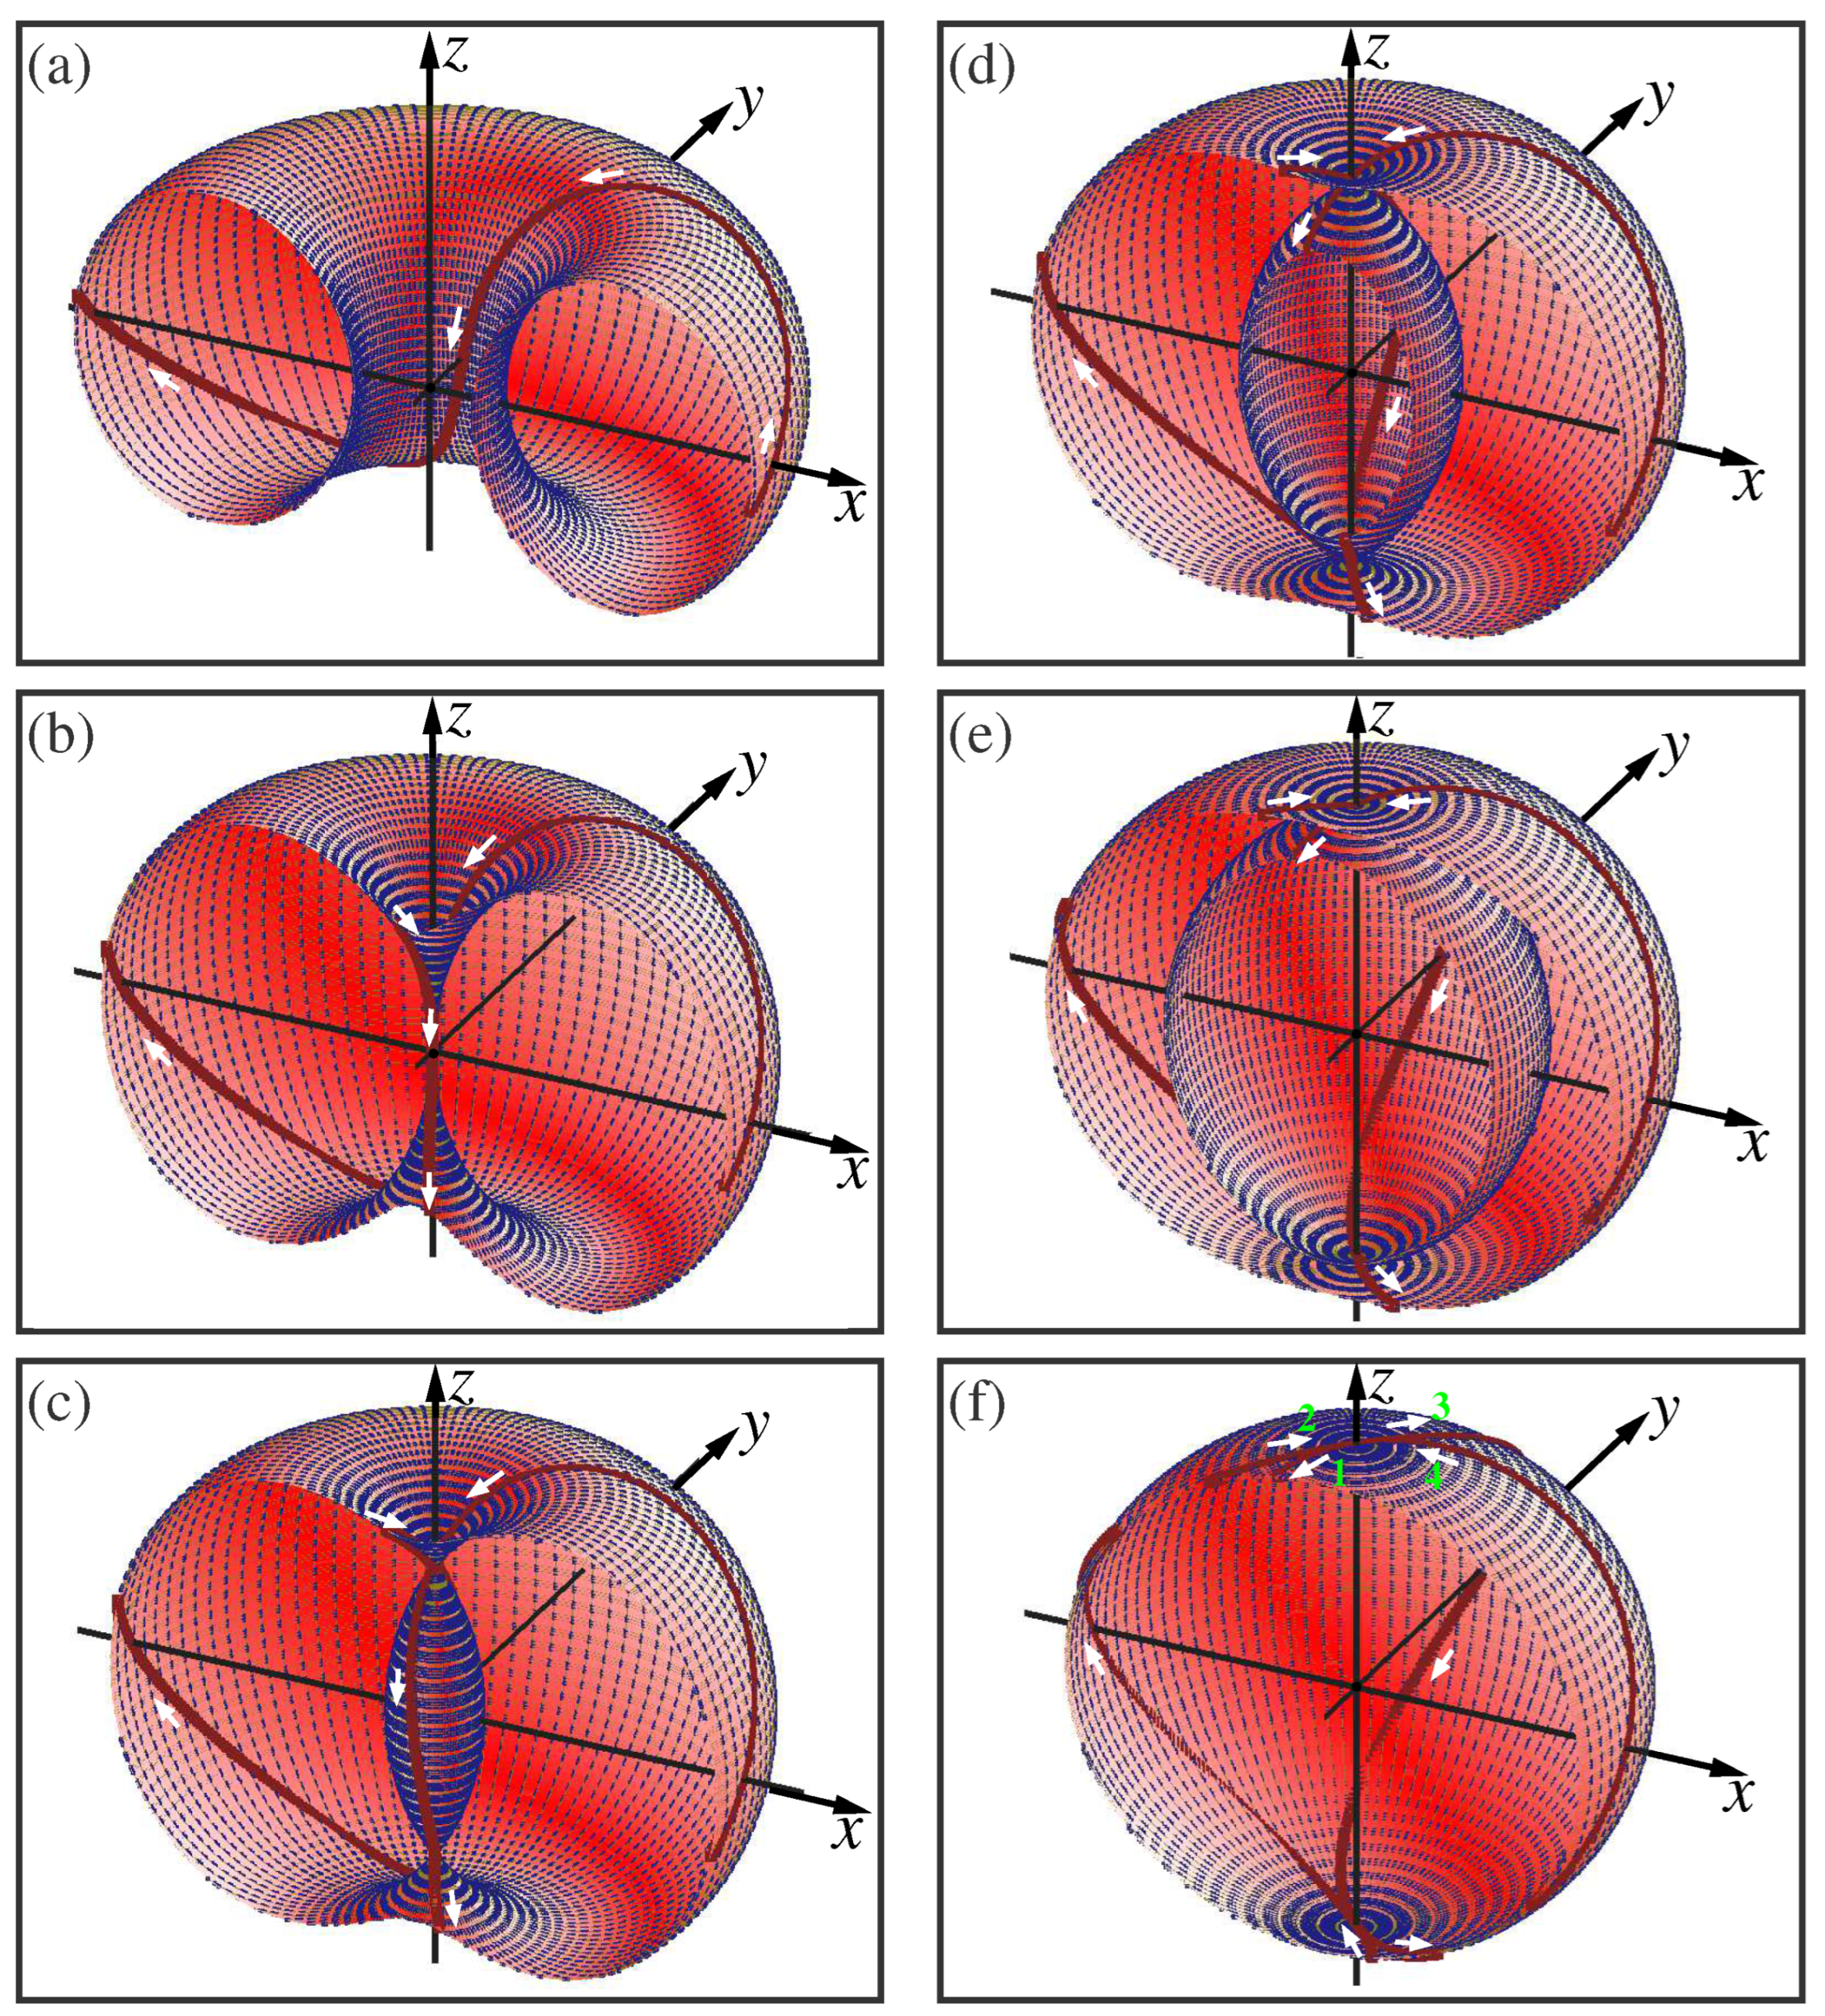
The whole cycle of the torus transformation to the 2D sphere twice covering itself is shown in detail in
Figure 18. Initially a ring torus having radii
shown in
Figure 18(a) transforms to the horn torus,
Figure 18(b), when its radii become equal,
. Take note that the string
tunnels through the ring, the radius of which is equal to zero, from up to down along a narrow bridge. The following stages are transformations through spindle tori when
b becomes less than
a, see
Figure 18(c), (d), (e). In this case, the string
spends part of the time on the outer spindle, and part on the inner. The final stage of the torus transformation is when
b turns to zero. The spindle torus transforms to a double-covered sphere,
Figure 18(f). In this case, the string spends half of the time on the outside of the 2D sphere, and the other half on the inside. These crossings from the outside to inside and back occur on the top and down poles of the 3D sphere.
Let us glance carefully on
Figure 17(b) and
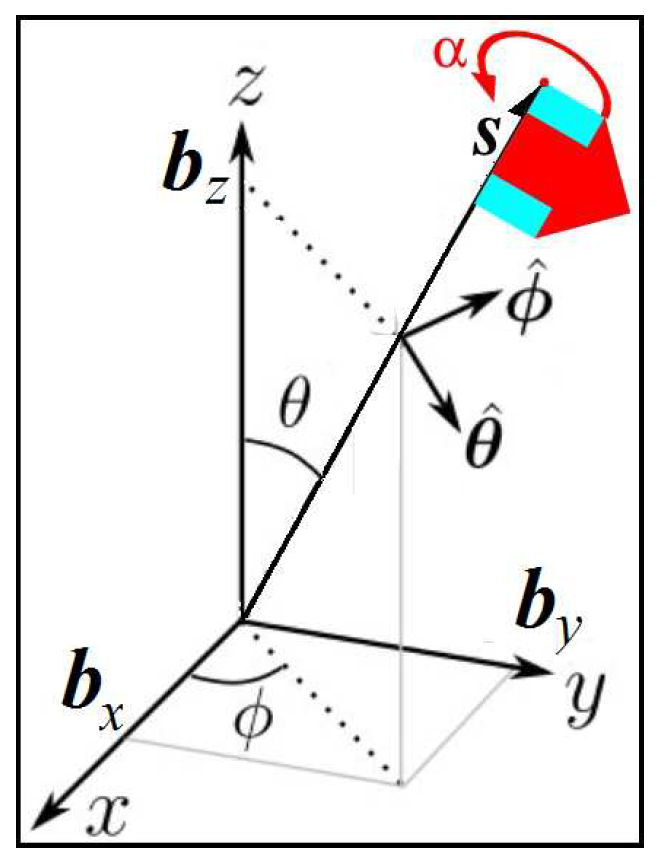
Figure 18(f). Arrows near the top pole of the 2D sphere on these figures are marked by numbers 1, 2, 3, 4. They point both the inflow of current to the pole and the outflow from it. Let the arrow mark orientation of a flag attached to a flagpole that comes out from the origin, as shown in
Figure 19. Now one can see, when the flagpole revolves from the point 1 to the down pole and further to the top pole, arrow 1 returns to arrow 2. The flag turned 180 degrees. Further the flagpole revolves along the path from point 3 to 4. On this path the flag rotates a 180-degree angle. As a result, the flagpole should twice revolve about the origin in order that the flag completes a full 360-degree rotation.
The above rotation on the 2D sphere is a typical situation of revolution of the half-integer spin 1/2. This spin involving the SU(2) group elements is represented in the following form [
104]:
Here
is the unit matrix and
,
.
are three Pauli matrices. The dimension of space where the spin 1/2 moves is four. Let us compute the square of the vector
at given the two-component spinor
:
The square of the axial vector
is 1. From here it follows that the tip of the spin lies on the 2D sphere of the unit radius, see
Figure 17(b). Further we have the squares of sine and cosine is 1. This degree of freedom points that the axial vector
possesses by one more degree of freedom. It is a flag that rotates about this vector, as shown in
Figure 19. That is, the rotation of this flag lies in the tangent space of the 2D sphere,
Figure 17(b). So, one may take this 2D sphere twice covering itself the radius of which is proportional to
as a base for the elementary particle.
White arrows shown on the red string drawn on the surface of this sphere,
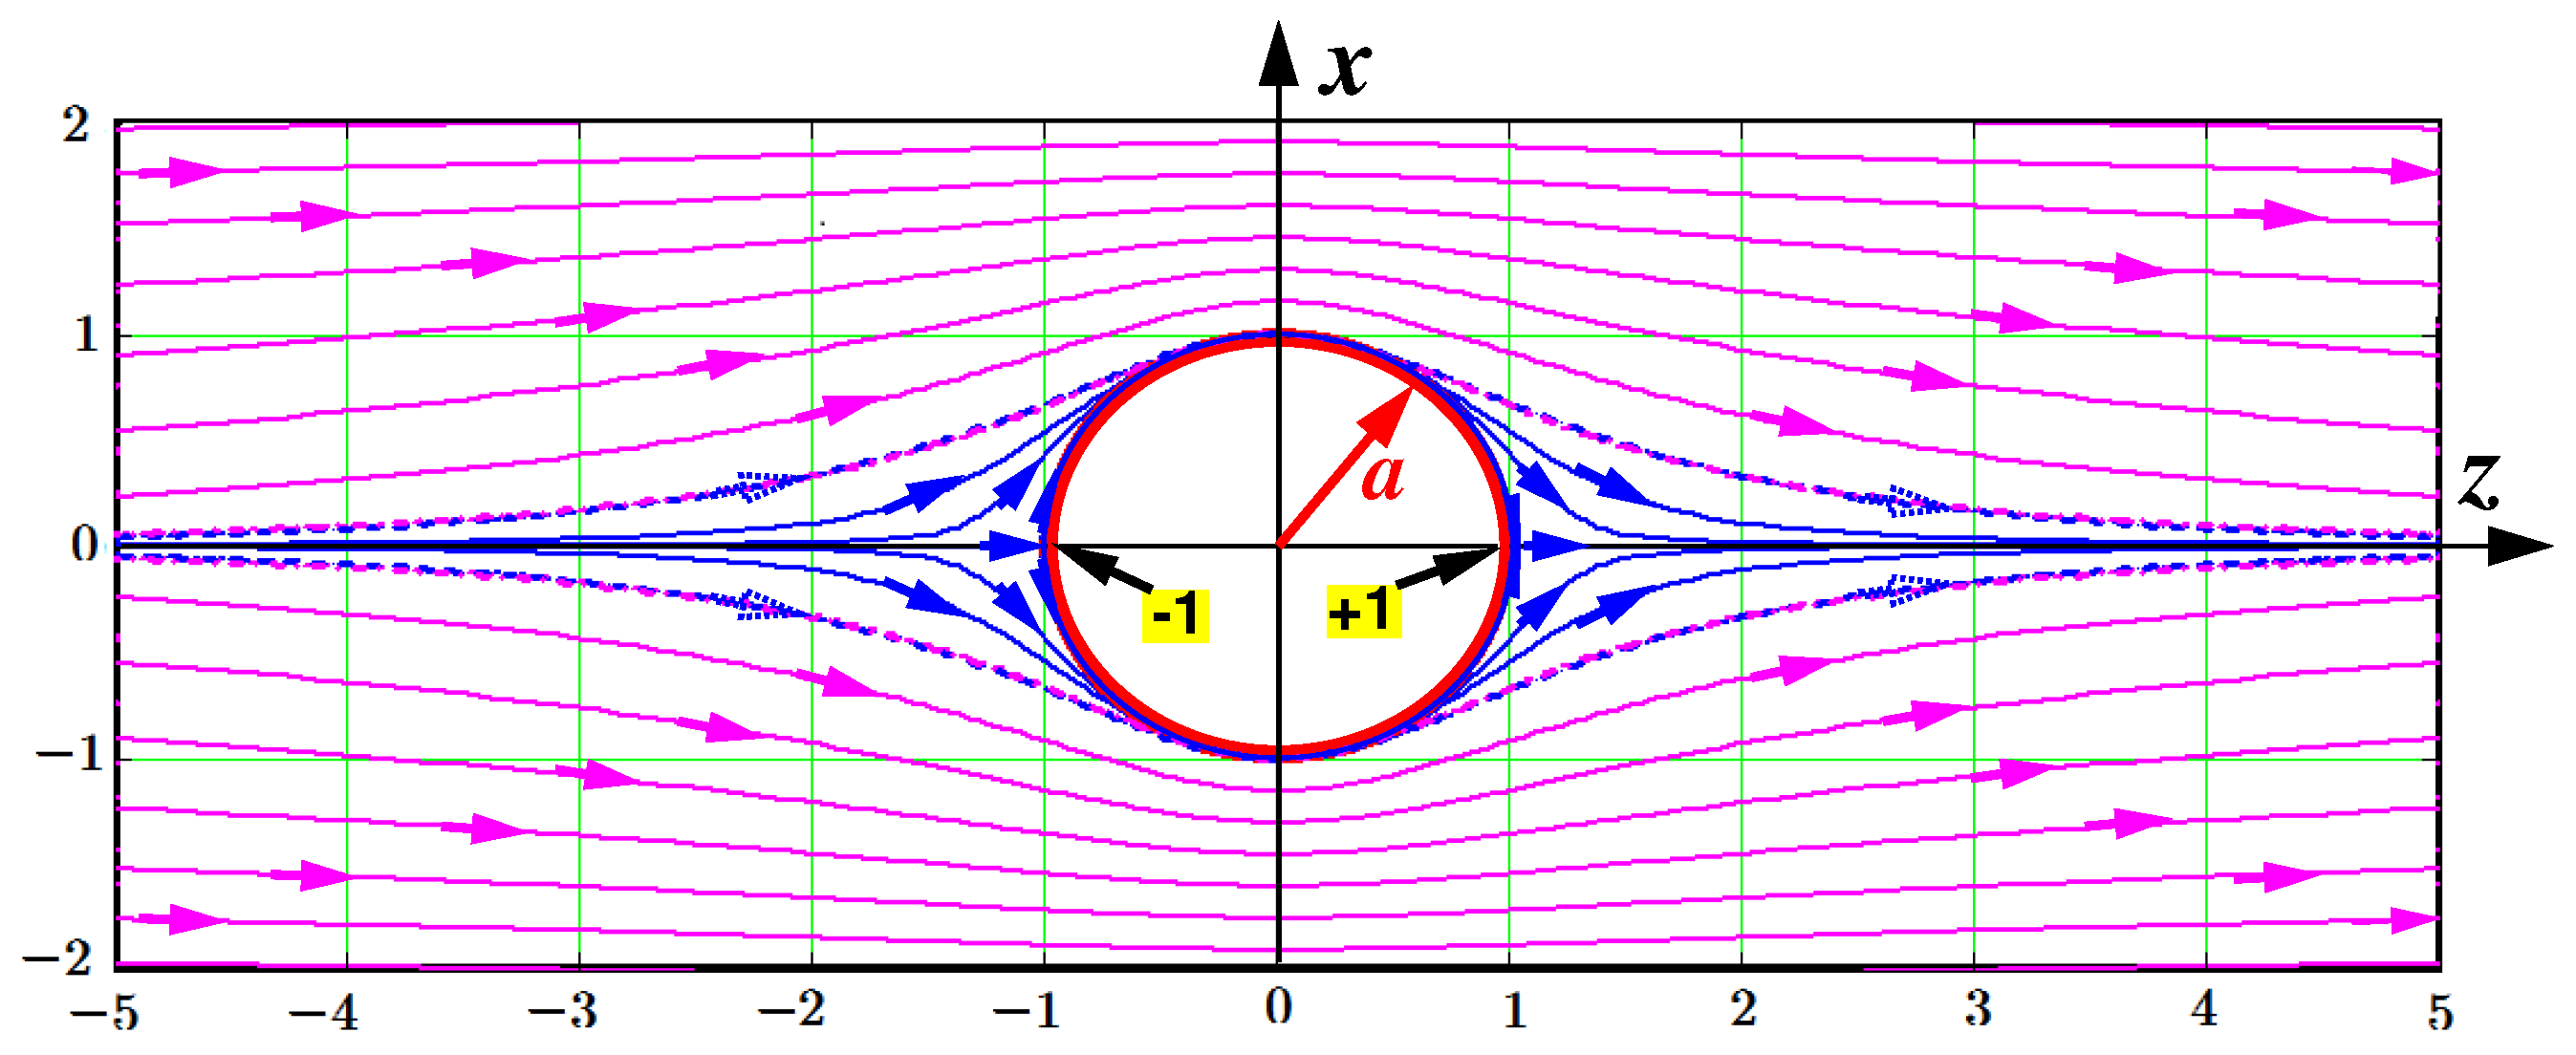
Figure 17(b) points to motion of the currents flowing along this string. It is a solenoidal motion. This sphere with the solenoidal flows on its surface is immersed in the irrotational flow field. The latter play a role of the guidance wave of this sphere along its own flow. The section along the plane
of the irrotational flows wrapping around the sphere is shown in
Figure 20. The double covered sphere of radius
is drawn in this figure in red. It may be the sphere shown, for example, in
Figure 18(b).
The flows washing the sphere shown in blue follow from Eq, (
19) calculated at the value
. While the flows shown in pink relate to
in the same formula. In this figure is shown an irrotational filament drawn by alternating blue - pink dashed curve. It marks the boundary separating the flow washing the sphere and not. It is the partition boundary.
Figure 21 shows the flowing of the double covered sphere from all sides by the irrotational flows depicted by yellow and blue filaments. The yellow filaments drawn at
lie to the partition boundary. The blue filaments washing the sphere are drawn at
. All they are drawn by Eq. (
19) at
and the phase
with the spacing equal to
. The other parameters are
,
.
Note, if we accept in Eq. (
19) non-zero
then the outside flow acquires a vorticity about the
z axis. Such spiral–shaped vortex filaments are shown in
Figure 22 as yellow at
and blue at
curves converging to the
z axis. The phase parameter
is 0,
,
, and
, respectively. While
and
,
. Such twisting of the irrotational filaments is possible in the presence of electromagnetic fields.
4.1. Double-covered sphere as a particle’s model
Our evaluations of the particle models are based on the topological transformations of tori to the twice covered spheres,
Figure 18. Here we accept the particle as a sphere,
Figure 17(b),
Figure 20,
Figure 22, filled by mixed irrotational and solenoidal flows that can exert pressure on the sphere wall. We will evaluate only stable particles such as electrons and protons. The particles have bare masses
kg and
kg.
As for their sizes such as radii of the twice covered sphere we will assume that they are unknown parameters to be found. We will try to calculate them from known masses. Let the radius of the sphere be
, where
x may be either
e (electron), or
p (proton). One can right now calculate the volume of the sphere
. We proclaim that
where
h is the Planck constant. The parameter
has the dimension [
]. It is the quantum dynamic viscosity of the flows filling the sphere to be considered. Let us multiply
by
, where
c is the speed of light. We get
It is a distributed quantum force exerting pressure on the surface of the sphere. Here
is the surface area of the sphere to be considered. Note that here the volume
is replaced simply by
.
A final stage is the dividing this power by
:
Here
is the Compton angular frequency and
is the Compton wavelength of the particle
x of mass
. From here we find
Results of the evaluations of
,
, and
(the length is given in femtometer =
m) are given in Table II:
Table II:
| |
electron |
proton |
| mass, , [kg] |
9.10938377
|
1.67262192
|
| quantum viscosity, , [kg/(m·s)] |
11.0744 |
6.8557
|
| quantum force, , [N] |
0.0337 |
1.1376
|
| Compton wavelength, , [fm] |
2426.31022 |
1.321409858 |
| Bohr radius, , [fm] |
52917.72 |
28.8198917 |
| Classical radius , [fm] |
2.817940305 |
0.001534698 |
The Compton effect manifests at the elastic collision of a photon with a free electron. This leads to the fact that along with scattered rays with a displaced wavelength, accelerated electrons arise – the so-called "recoil electrons". In this case, the Compton length indirectly indicates the electric radius of the particle on which photon scattering is carried out. The electron has no substructure known. Therefore the question of the electron radius is a complex problem of modern physics. In experiments on electron scattering on positrons, the difference from the point character of the particles was not disclosed. However, a point electron (zero radius) generates serious mathematical difficulties due to the tendency of the electron’s own energy to infinity. Obviously, there exists a problem with a definition of its size.
A proton, like any quantum mechanical system, has no clear boundaries – its constituent quarks are smeared in space in accordance with their wave function. Therefore, it is impossible to say unequivocally what the size of a proton is – it is a matter of agreement. Most often the root-mean-square radius of the electric charge distribution (electric radius) is taken as the size of an elementary particle. The electric radius of a proton,
, using ordinary hydrogen atoms in the CODATA-2018 dataset recorded close to that measured on the basis of muon hydrogen spectroscopy is
fm [
105]. According to our evaluations this value follows from the Compton wavelength multiplied by
:
Here
.
There are two more radii for evaluating particle sizes. They come from either dividing or multiplying the Compton wavelength by the fine structure constant
. Bohr radius of rotating a particle and an antiparticle about the mass center and the classical radius of the particle are found from the formula (
86) as follows
Here
ℏ is the reduced Planck constant. Note that
m/s is much less than the speed of light. It means that the particle and antiparticle rotate about their center of mass with the non-relativistic speed. As for the classical radius
it is seen to result from the multiplication of the Compton wavelength
by the fine structure constant due to which the radius shrinks by three orders of magnitude. Observe that this radius stems also from
where
e is the electron charge and
F/m is the vacuum permittivity. Equating each other the radius
given in Eqs. (
88) and (
89) one can express the reduced Planck constant through the electric charge and the vacuum permittivity
Here also the non-relativistic speed appears as
.
From Eq. (
89) it follows that the classical particle radius,
, comes from the classical relativistic particle model, in which the entire mass of the particle is assumed to have an electromagnetic nature. That is, the mass of a particle multiplied by the square of the speed of light is equal to the energy of the electric field created by it
In this case, the particle appears to be a spherical particle with a certain radius, since at zero radius the energy of the field created by it would be infinite.
From Eq. (
91) one can conclude that the classical radius of an electron is equal to the radius of a hollow sphere on which a charge equal to the charge of the electron is uniformly distributed and all this is equal to the relativistic energy of the electron. Since the sphere is twice covered by itself then half of the charge is distributed uniformly on the outer surface and the other half on the inner one. In the sum we have the result shown in the above equality.
The classical radius of the proton is about
m. It is three orders of magnitude smaller than the classical radius of the electron but seventeen orders of magnitude larger than the Planck length. It is a region where quarks are believed to be confined by the strong gluon interactions. So for example a proton is composed of two up quarks, one down quark, and the gluons that mediate the forces binding them together. As well as in the case of the electron, here the two up quarks and one down quark are evenly smeared on the surface of the hollow sphere in such a manner that the total charge is
In particular, one up quark and two down quarks give the total charge equal to zero
which relates to neutrons.
The set of the up and down quark strings drawn according to Eq. (
18) is shown in
Figure 23. Parameters of the torus represented by Eq. (
18) are as follows
,
,
,
, while the parameters
and
show differences of the quarks. The up quark strings shown in
Figure 23(a) and (b) have the parameters
and
and
, respectively. The down quark string shown in
Figure 23(c) has the parameters
and
. Note that the currents flowing along the strings have opposite orientations for up and down quarks shown by white arrows in
Figure 23(d).
The following step is to map the torus, shown in Figure.
Figure 23(d), onto the double covered sphere when the radius
b tends to zero. The result of this mapping gives the sphere wrapped by red, blue, and green strings with the triangular symmetry about the sphere poles,
Figure 24. The mass of the particle is assumed to come from an electromagnetic nature with the charge distributed on the double covered sphere surface of the radius
, see Eq. (
91). The whole charge
e in this formula stems from the sum of the fractional charges (
92).
Note that the above evaluations were done in the frameworks of the classical approximation. However, the strings are essentially quantum objects. That is, the quark strings wrapped on the double covered sphere fluctuate due to gluon exchanging about both azimuthal axis and along the sphere radius. One can assume that these fluctuations are possible up to the radius fm.
5. Conclusion
From ancient times, two schools of understanding of the world order competed. Namely: either the surrounding world contains enormous amount of minuscule corpuscles chaotically moving by scattering on each other and between them the absolute void exists (conditionally, Democritus corpuscular ether), or the Universe is densely filled everywhere by invisible wave background (conditionally, Aristotle fifth element, ether).
These two schools of world understanding competed with each other up to the beginning of the twentieth century, when the crucial problems of quantum mechanics demanded to solve this confrontation cardinally. Niels Bohr formulated a methodological principle – the principle of complementarity – in relation to quantum physics. According to this principle, to most adequately describe a physical object belonging to the microcosm, it must be considered through a prism of mutually exclusive, additional essences. Either as particles or as waves, but never together.
About at the same time Louis de Broglie has proposed a consistent theory for applying the complementarity principle to describe real quantum events. It is the double solution theory [
19]. The sense of this theory consists of two main statements. The first statement says that there is a real physical wave which is not completely identical to the mathematical wave function
resulting from the solution of the Schrödinger equation. Between these waves, accurate to some normalized factor, there is a one-to-one correspondence. The second statement says that a particle imagined as a singularity moves on a crest of this real physical wave. The latter is a guidance wave for the particle carrying it from the creation by a source to a detecting device.
Surprisingly, in the same time when E. Schrödinger published his famous equation E. Madelung published his article where Schrödinger equation is reduced to two equations – the continuity equation and the equation loaded by the quantum potential describing the particle motion in an ideal fluid medium. The particle velocity is proportional to the gradient of the scalar function
S, see Eq. (
6), named the action function. This function determines the particle mobility in the vicinity of its localization point. The action function reflects in itself the influence of all objects (boundary walls, collimators, mirrors, slit gratings, detectors, ets.) placed in the physical space under consideration and defines a scalar field in this space. It is a nonlocal field.
The velocity field extractable from the gradient of the scalar function S is an irrotational field that does not form vortices. The latter are local formations localizing about some selected axes. Further we draw on Helmholtz’s theorems on irrotational and solenoidal velocities existing in ideal incompressible fluids. It turns out that Helmholtz’s theorem on decomposition of a velocity onto the sum of the irrotational and solenoidal ones plays an important role in the analysis of the de Broglie double solution theory. Irrotational flows underlie the guidance waves. Solenoidal flows play an important role in formation of the inner organization of the particles migrating along the optimal paths on the crests of the guiding wave. Figuratively speaking, the guidance wave washes the particle from all sides forcing the latter travels along the irrotational flows of this wave.
The solenoidal flows being predominantly local flows play a role at organizing the particle content. There are two types of organization. The first type is a classical organization represented by the toroidal bubbles. The second type looks like a double hollow sphere with wound strings along its surface. Observations of resonant spin flip-flopping in periodic magnetic fields [
103,
104,
106] provide indirect evidence that the second type relates to the organization of quantum particles.
