Submitted:
15 August 2023
Posted:
16 August 2023
You are already at the latest version
Abstract
Keywords:
1. Introduction and literature review
2. Materials and Methods
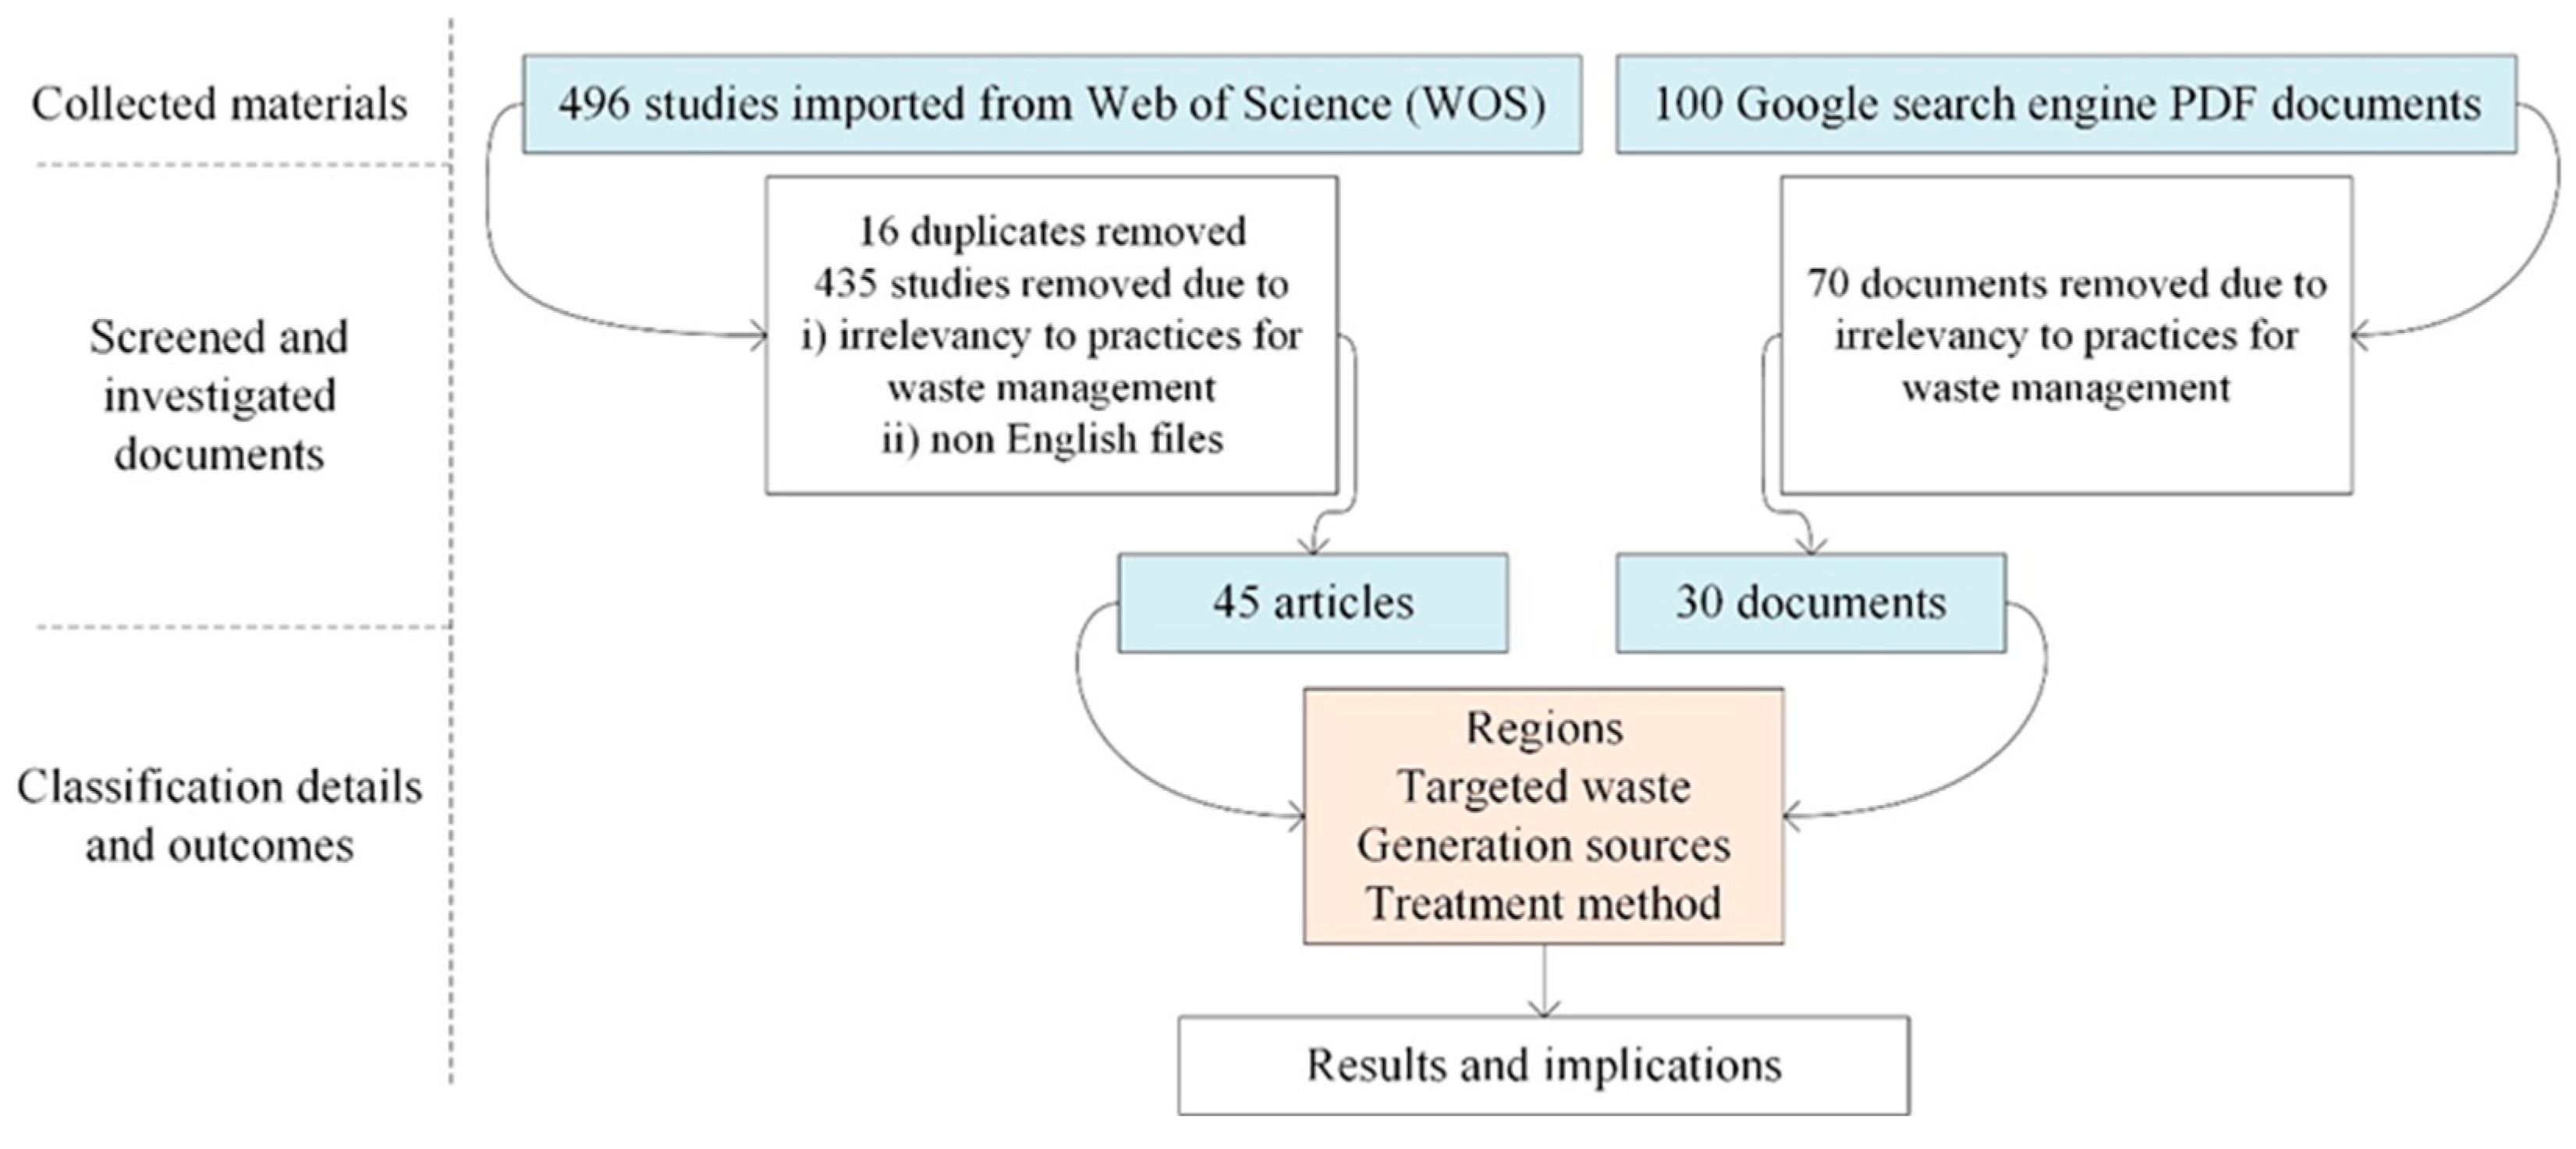
2.1. Searching method
2.2. Academic database
2.3. Google search engine
2.4. Combination and classification of documents
3. Results
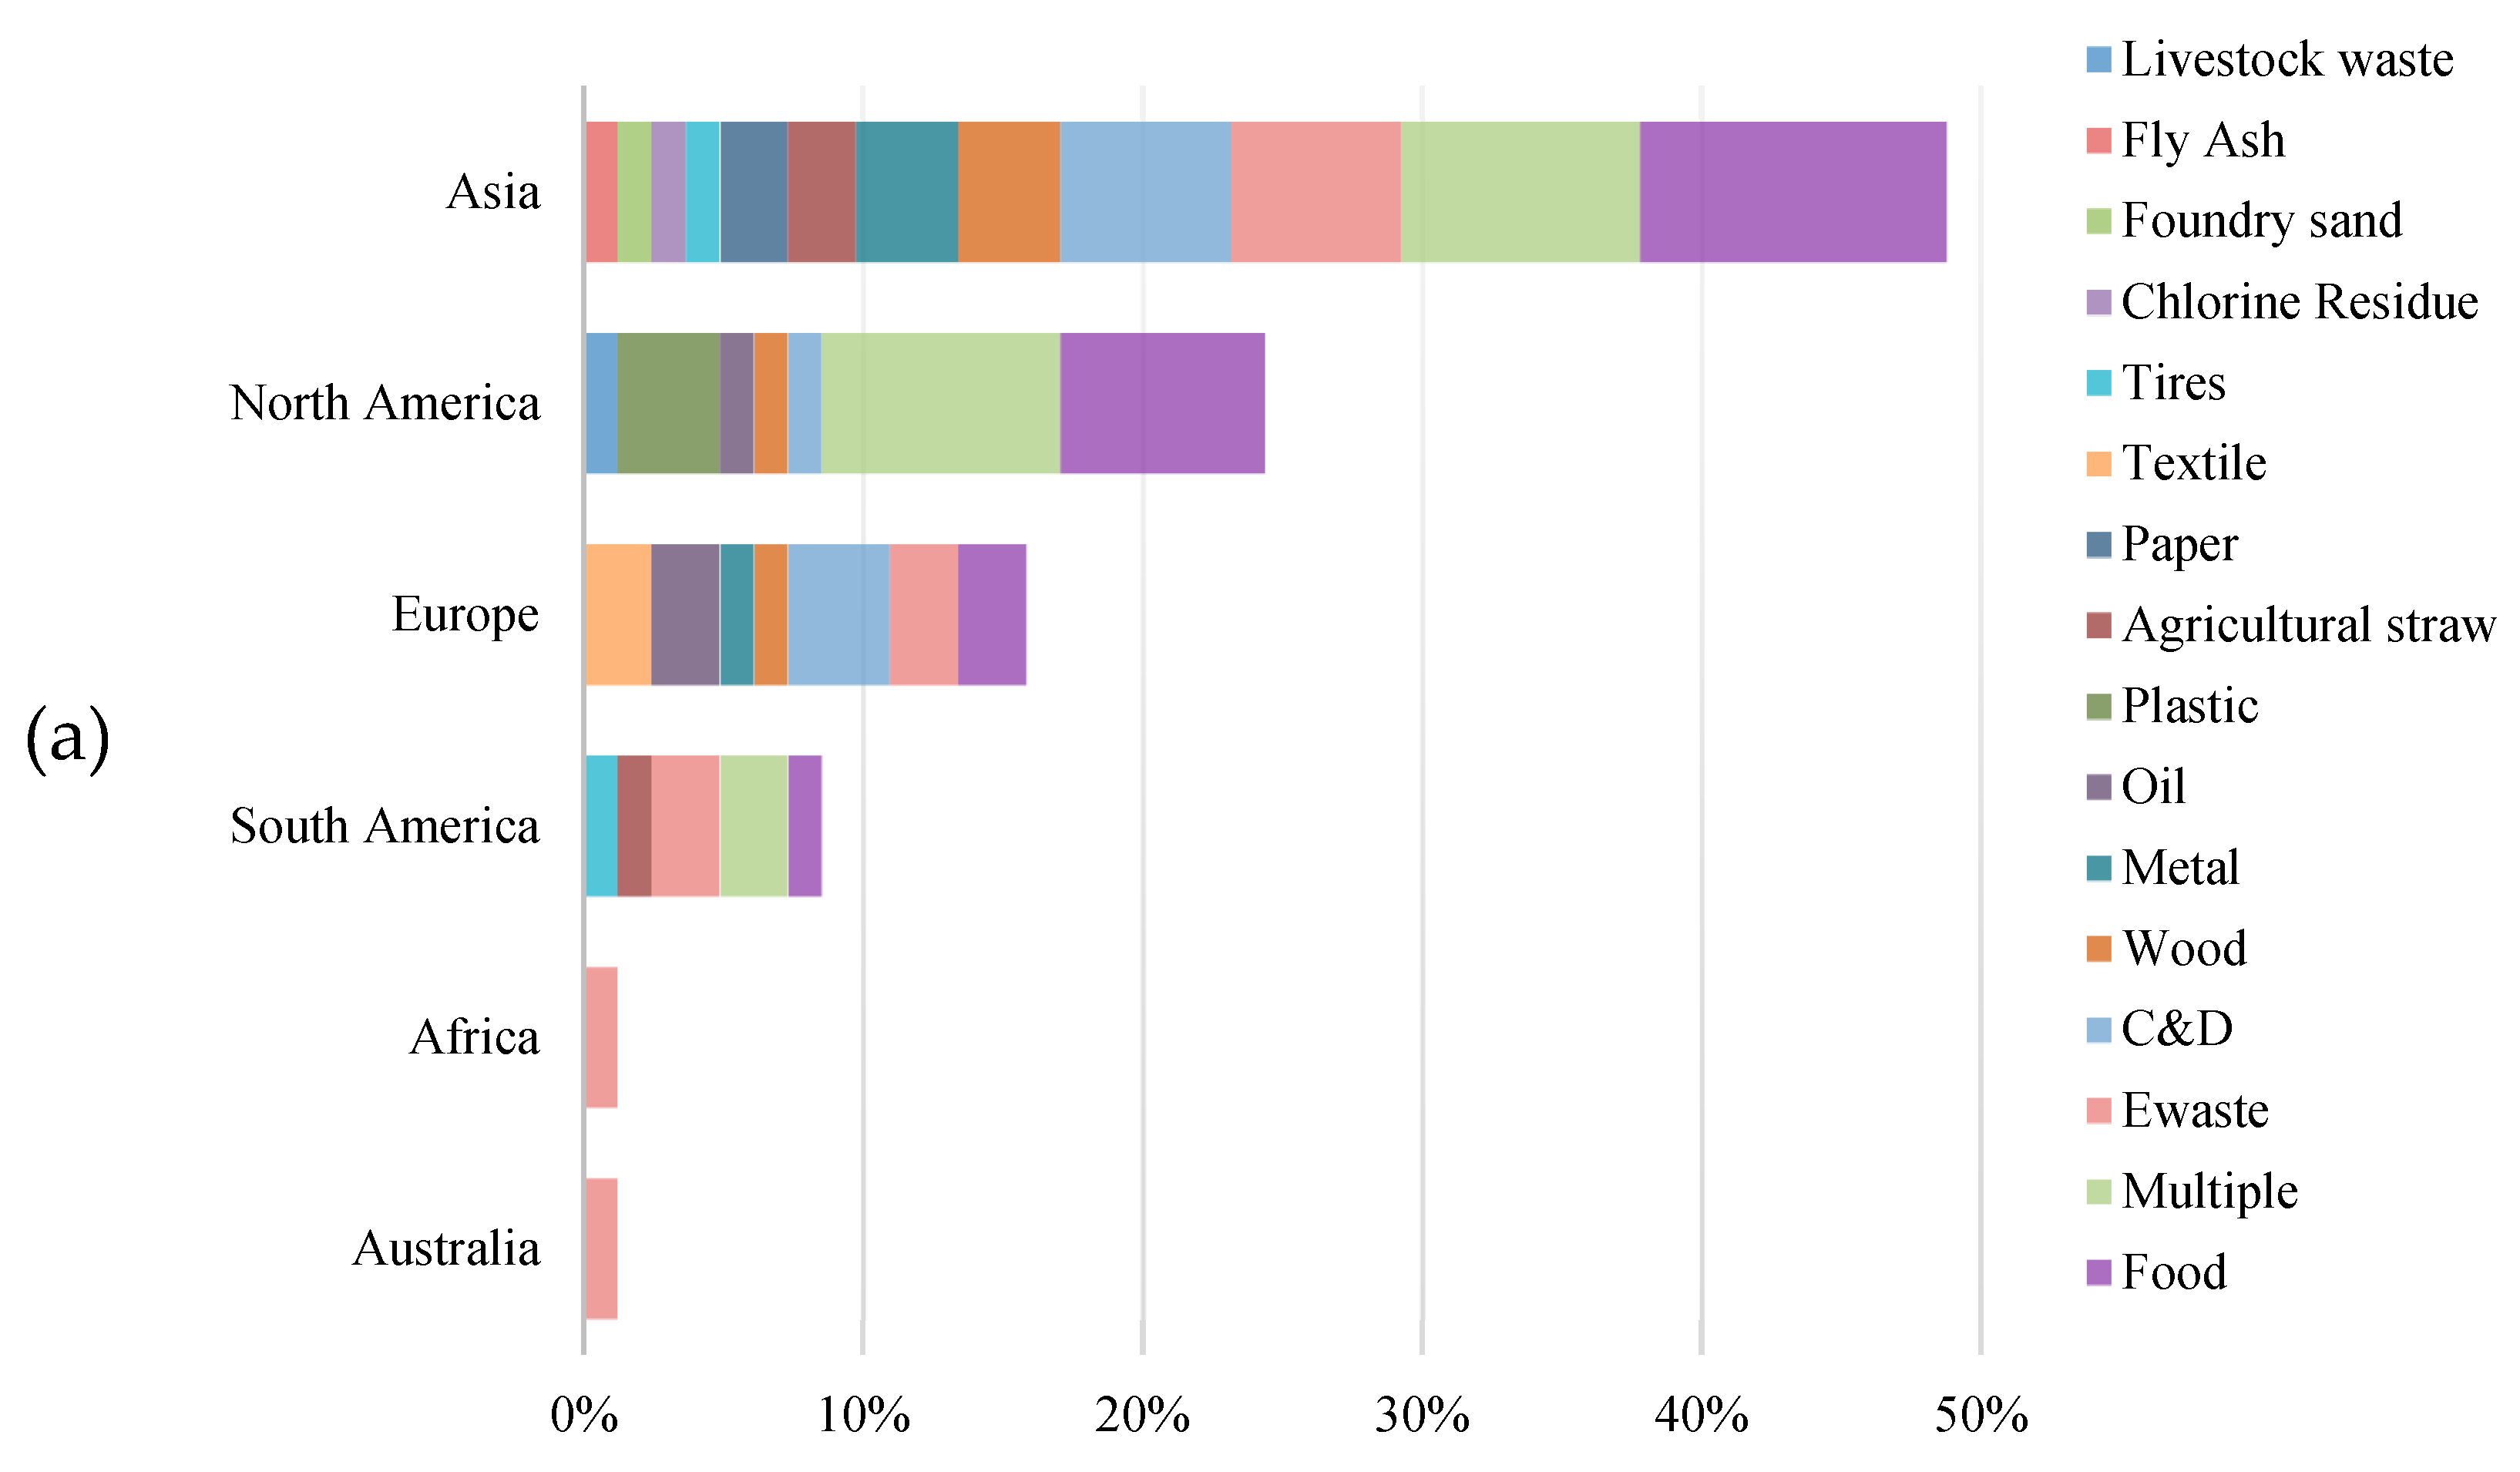
3.1. Regions
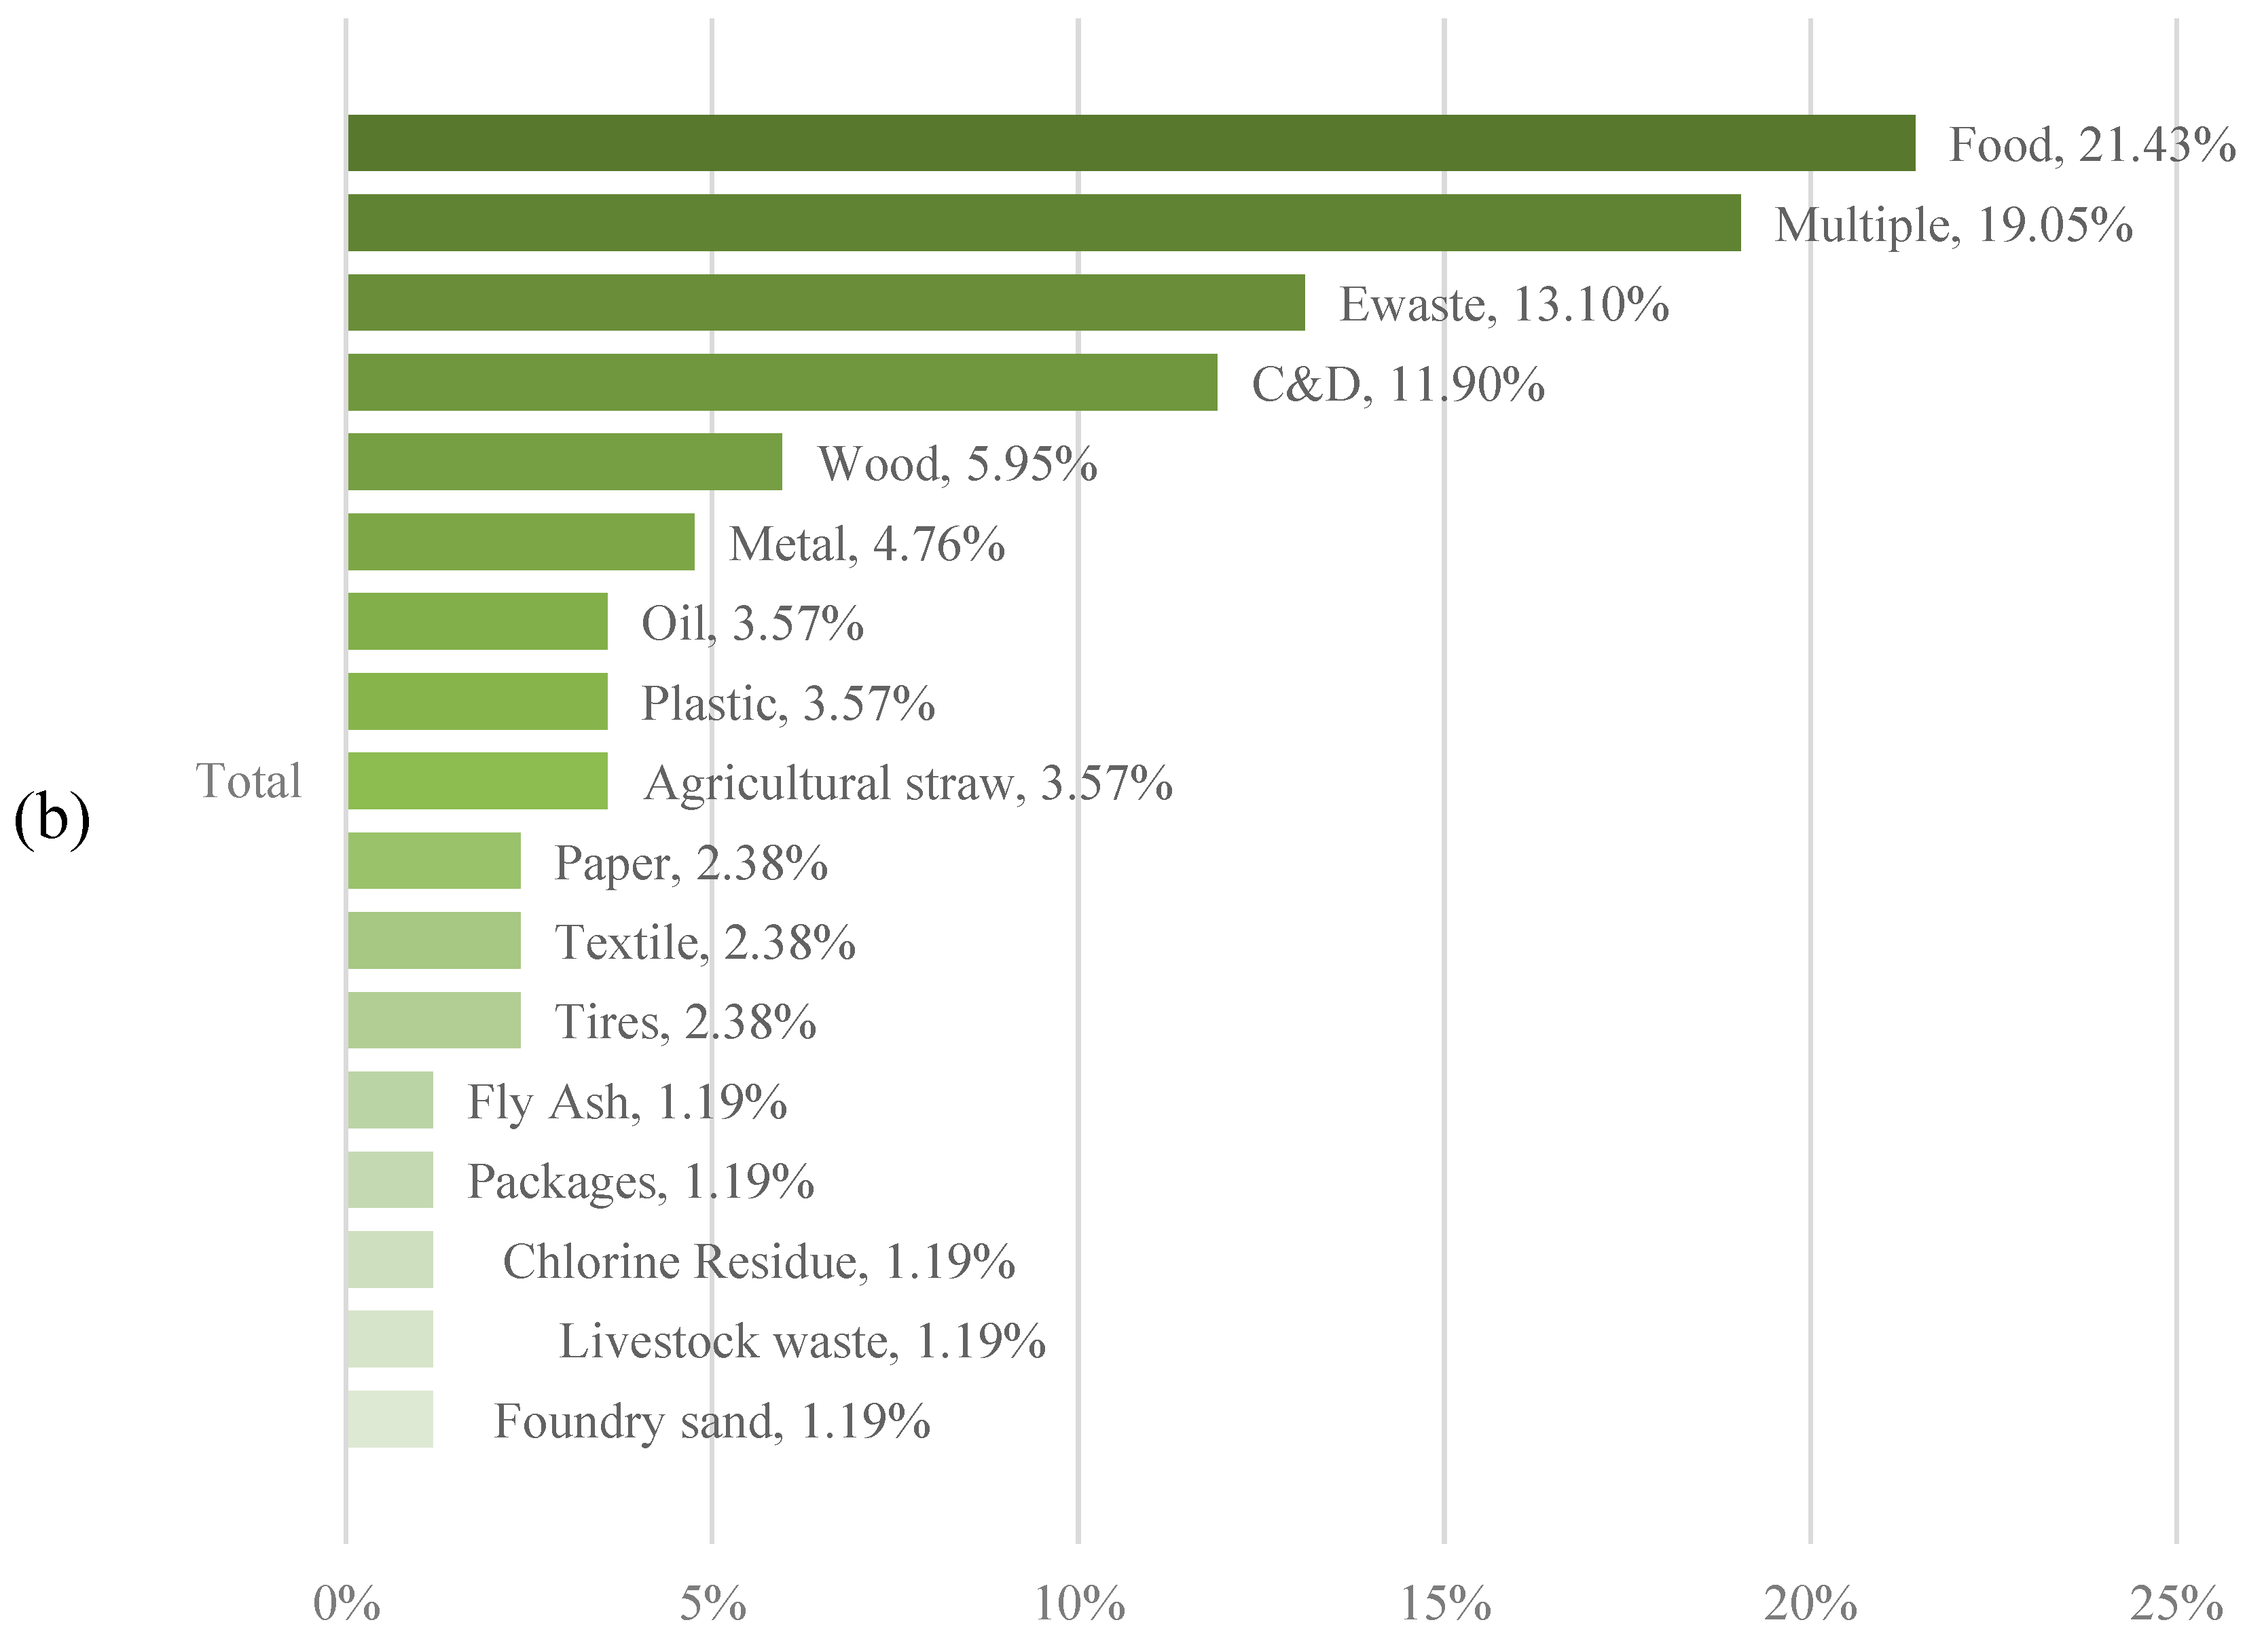
3.2. Targeted waste
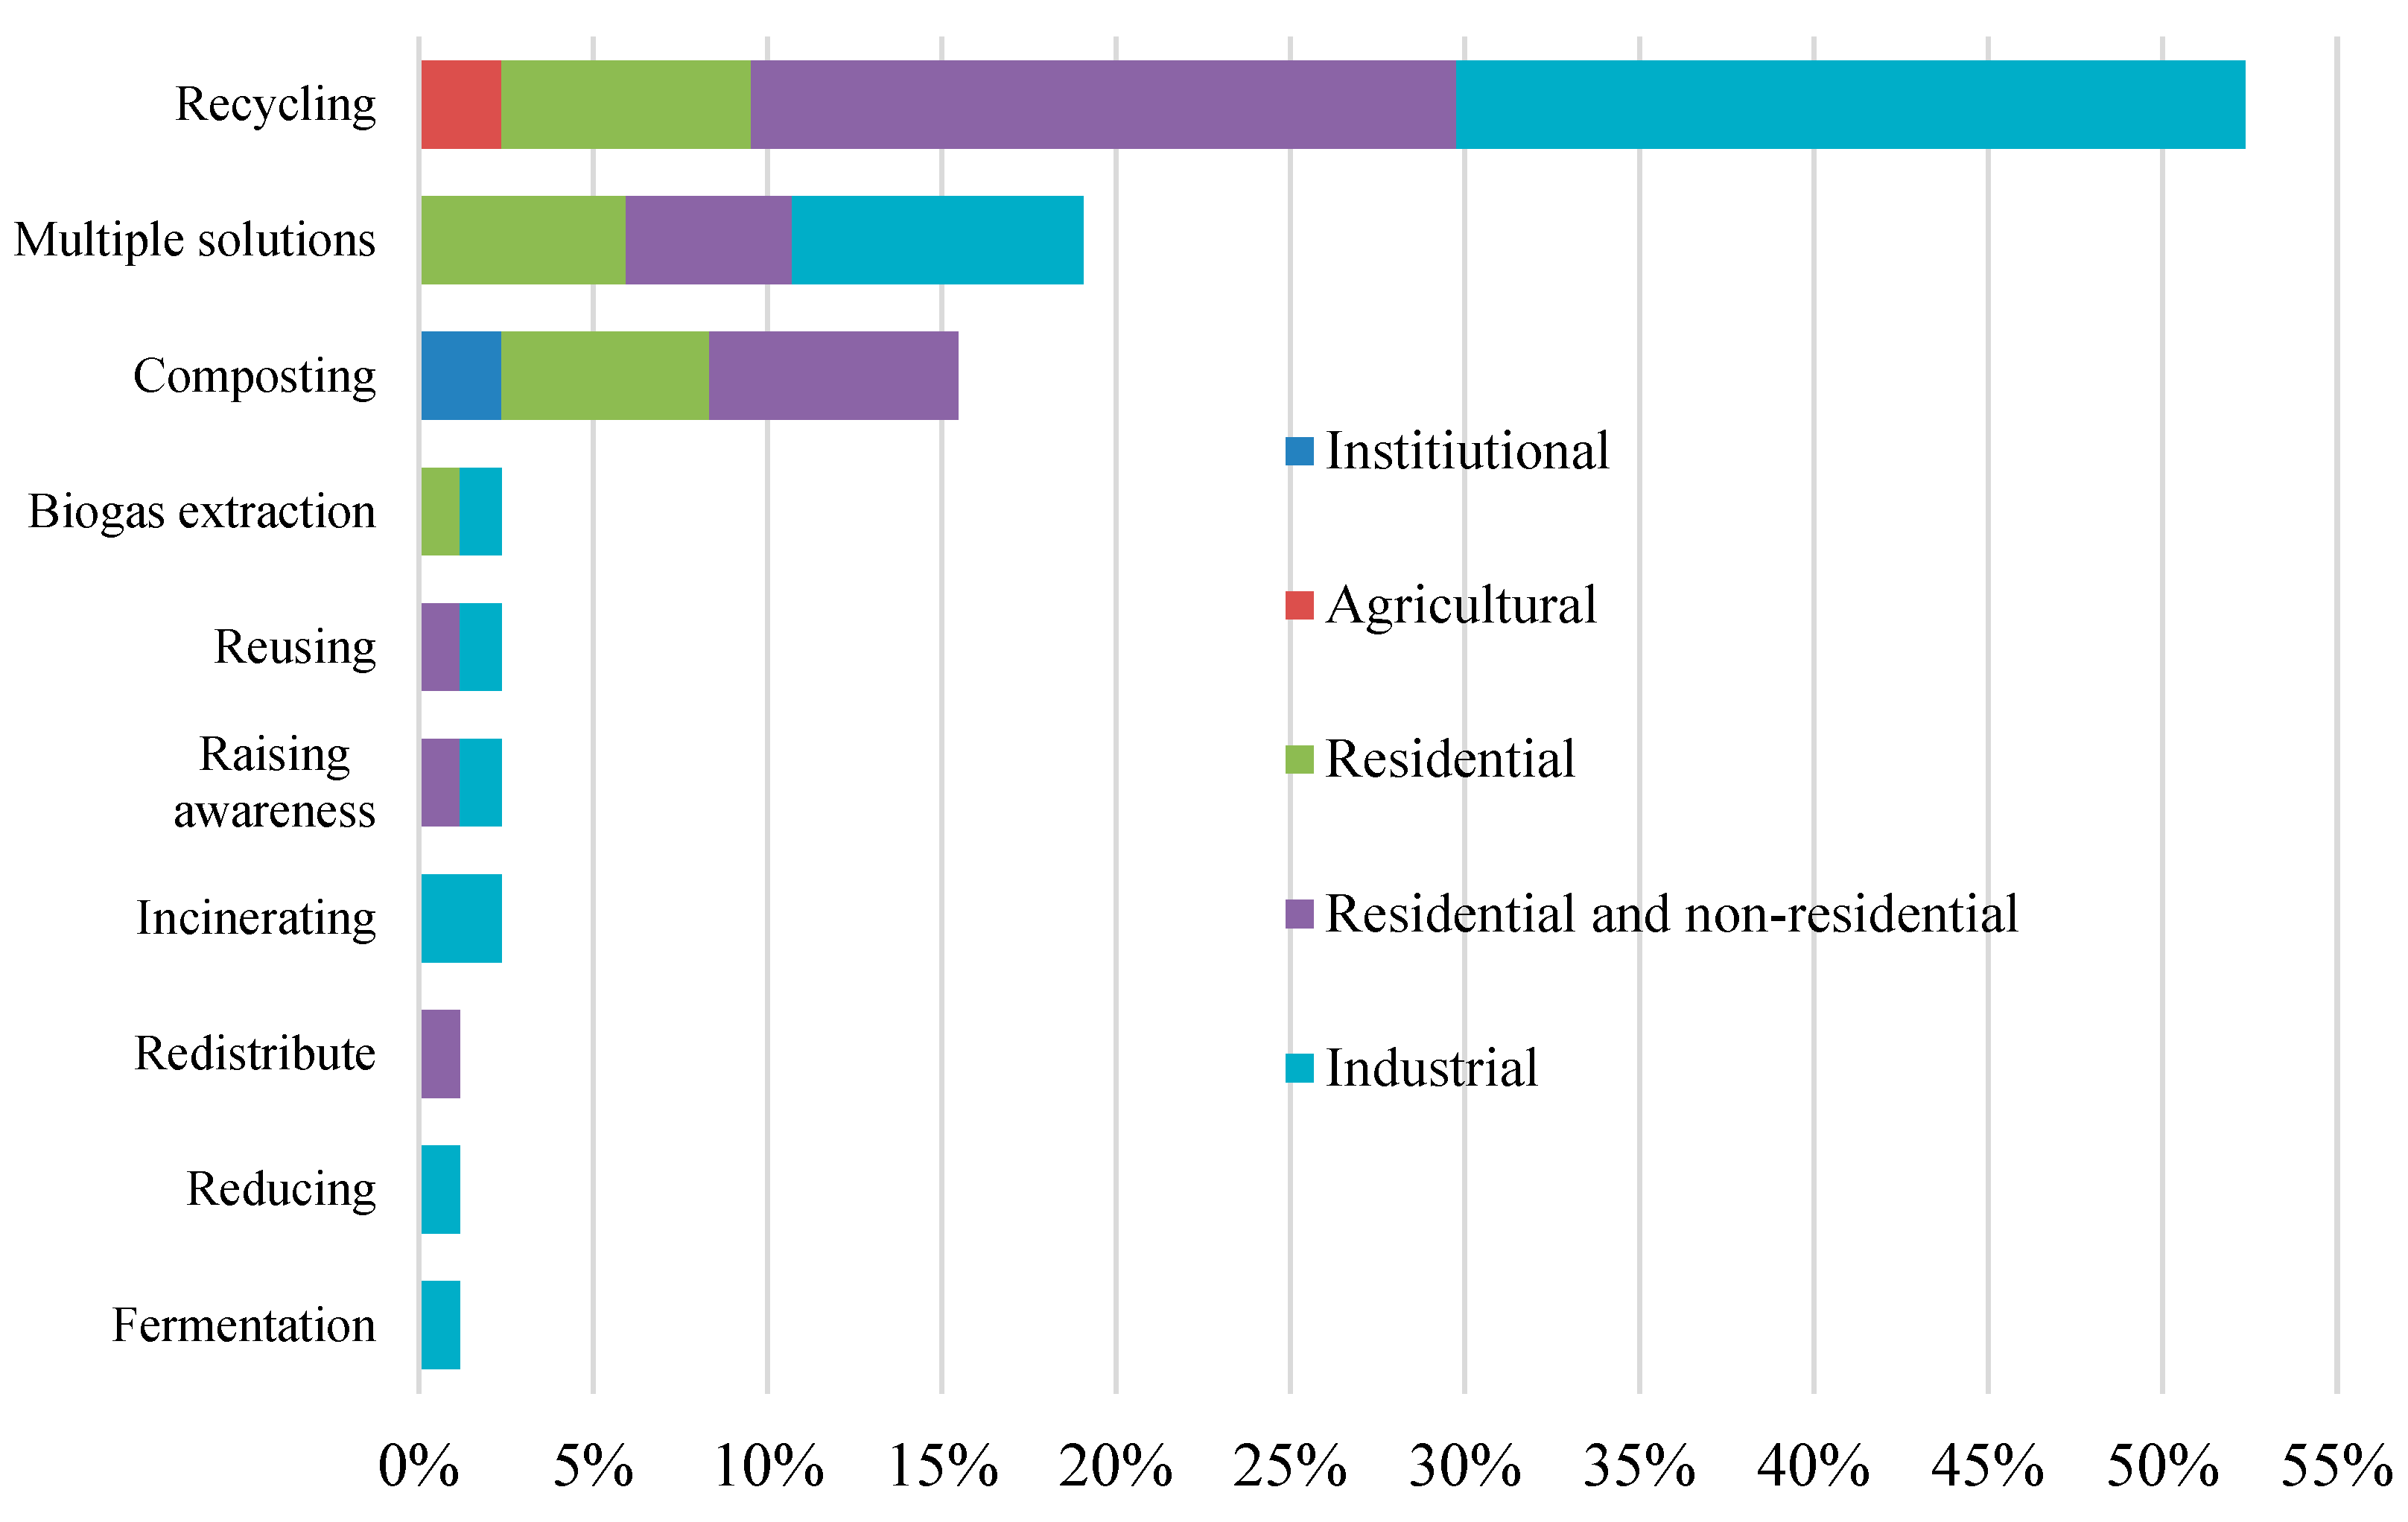
3.3. Treatment method and waste origination
4. Conclusion
Author Contributions
Funding
Data Availability Statement
Abbreviations
| ABSC | Activity Based Standard Costing |
| C&D | Construction and Demolition |
| EPR | Extended Producer Responsibility |
| GHG | Greenhouse Gas |
| GHI | Global Hunger Index |
| MDF | Medium Density Fiberboard |
| NDVI | Normalized Difference Vegetation Index |
| NIMBY | Not In My Backyard |
| PET | Polyethylene Terephthalic |
| PRISMA | Preferred Reporting Items for Systematic Review and Meta-Analysis |
| SDGs | Sustainable Development Goals |
| UFW | Urban Food Waste |
| UN | United Nations |
| USEPA | United States Environmental Protection Agency |
| WOS | Web of Science |
References
- United Nations. United Nations Conference on Environment and Development, Rio de Janeiro, Brazil, 3-14 June 1992. Accessed on https://www.un.org/en/conferences/environment/rio1992. 2022/Oct/20.
- United Nations. Transforming Our World: The 2030 Agenda for Sustainable Development. Accessed on https://sdgs.un.org/2030agenda. 2022/Oct/20.
- Government of Canada. Urban Waste to Electricity Demonstration. Accessed on https://www.nrcan.gc.ca/science-data/funding-partnerships/funding-opportunities/current-investments/urban-waste-electricity-demonstration/4963. 2022/Oct/20.
- Rogger, C.; Beaurain, F.; Schmidt, T. S. Composting Projects under the Clean Development Mechanism: Sustainable Contribution to Mitigate Climate Change. Waste Manage. 2011, 31, 138–146. [Google Scholar] [CrossRef] [PubMed]
- Zainudin, M. H. M.; Zulkarnain, A.; Azmi, A. S.; Muniandy, S.; Sakai, K.; Shirai, Y.; Hassan, M. A. Enhancement of Agro-Industrial Waste Composting Process via the Microbial Inoculation: A Brief Review. Agronomy 2022, 12, 198. [Google Scholar] [CrossRef]
- Adhikari, B. K.; Trémier, A.; Martinez, J.; Barrington, S. Home and Community Composting for On-Site Treatment of Urban Organic Waste: Perspective for Europe and Canada. Waste Manage. Res. 2010, 28, 1039–1053. [Google Scholar] [CrossRef]
- Arif, M. S.; Riaz, M.; Shahzad, S. M.; Yasmeen, T.; Ashraf, M.; Siddique, M.; Mubarik, M. S.; Bragazza, L.; Buttler, A. Fresh and Composted Industrial Sludge Restore Soil Functions in Surface Soil of Degraded Agricultural Land. Sci. Total Environ. 2018, 619, 517–527. [Google Scholar] [CrossRef]
- World Bank. What a Waste, A Global Snapshot of Solid Waste Management to 2050. Accessed on https://datatopics.worldbank.org/what-a-waste/trends_in_solid_waste_management.html. 2023/05/18.
- Richter, A.; Ng, K. T. W.; Karimi, N. A Data Driven Technique Applying GIS, and Remote Sensing to Rank Locations for Waste Disposal Site Expansion. Resour. Conserv. Recycl. 2019, 149, 352–362. [Google Scholar] [CrossRef]
- Karimi, N.; Richter, A.; Ng, K. T. W. Siting and Ranking Municipal Landfill Sites in Regional Scale Using Nighttime Satellite Imagery. J. Environ. Manage. 2020, 256, 109942. [Google Scholar] [CrossRef]
- Karimi, N.; Ng, K. T. W.; Richter, A.; Williams, J.; Ibrahim, H. Thermal Heterogeneity in the Proximity of Municipal Solid Waste Landfills on Forest and Agricultural Lands. J. Environ. Manage. 2021, 287, 112320. [Google Scholar] [CrossRef] [PubMed]
- Government of Canada. Solid Waste Diversion and Disposal. Accessed on https://www.canada.ca/en/environment-climate-change/services/environmental-indicators/solid-waste-diversion-disposal.html. 2022/Oct/31.
- European Environment Agency. Waste Recycling Rate in Europe by Waste Stream. Accessed on https://www.eea.europa.eu/data-and-maps/indicators/waste-recycling-1/assessment-1. 2022/Oct/31.
- Adusei, K. K.; Ng, K. T. W.; Mahmud, T. S.; Karimi, N.; Lakhan, C. Exploring the Use of Astronomical Seasons in Municipal Solid Waste Disposal Rates Modeling. Sustain. Cities Soc. 2022, 86, 104115. [Google Scholar] [CrossRef]
- Gallo, M. An Optimisation Model to Consider the NIMBY Syndrome within the Landfill Siting Problem. Sustainability 2019, 11, 3904. [Google Scholar] [CrossRef]
- Karimi, N.; Ng, K. T. W.; Richter, A. Development of a Regional Solid Waste Management Framework and Its Application to a Prairie Province in Central Canada. Sustain. Cities Soc. 2022, 82, 103904. [Google Scholar] [CrossRef]
- Preziosi, E.; Frollini, E.; Zoppini, A.; Ghergo, S.; Melita, M.; Parrone, D.; Rossi, D.; Amalfitano, S. Disentangling Natural and Anthropogenic Impacts on Groundwater by Hydrogeochemical, Isotopic and Microbiological Data: Hints from a Municipal Solid Waste Landfill. Waste Manage. 2019, 84, 245–255. [Google Scholar] [CrossRef]
- Yu, X.; Sui, Q.; Lyu, S.; Zhao, W.; Liu, J.; Cai, Z.; Yu, G.; Barcelo, D. Municipal Solid Waste Landfills: An Underestimated Source of Pharmaceutical and Personal Care Products in the Water Environment. Environ. Sci. Technol. 2020, 54, 9757–9768. [Google Scholar] [CrossRef]
- Siddiqua, A.; Hahladakis, J. N.; Al-Attiya, W. A. K. An Overview of the Environmental Pollution and Health Effects Associated with Waste Landfilling and Open Dumping. Environ. Sci. Pollut. Res. 2022, 1–23. [Google Scholar] [CrossRef]
- Delkash, M.; Zhou, B.; Han, B.; Chow, F. K.; Rella, C. W.; Imhoff, P. T. Short-Term Landfill Methane Emissions Dependency on Wind. Waste Manage. 2016, 55, 288–298. [Google Scholar] [CrossRef]
- Vinti, G.; Bauza, V.; Clasen, T.; Medlicott, K.; Tudor, T.; Zurbrügg, C.; Vaccari, M. Municipal Solid Waste Management and Adverse Health Outcomes: A Systematic Review. Int. J. Environ. Res. Public Health 2021, 18, 4331. [Google Scholar] [CrossRef] [PubMed]
- Baijius, W.; Patrick, R. J. “We Don’t Drink the Water Here”: The Reproduction of Undrinkable Water for First Nations in Canada. Water 2019, 11, 1079. [Google Scholar] [CrossRef]
- Yang, Y.; Boom, R.; Irion, B.; van Heerden, D.; Kuiper, P.; de Wit, H. Recycling of Composite Materials. Chem. Eng. Process. Process Intensif. 2012, 51, 53–68. [Google Scholar] [CrossRef]
- Vogt, B. D.; Stokes, K. K.; Kumar, S. K. Why Is Recycling of Postconsumer Plastics So Challenging? ACS Appl. Polym. Mater. 2021, 3, 4325–4346. [Google Scholar] [CrossRef]
- Edgerton, E.; McKechnie, J.; Dunleavy, K. Behavioral Determinants of Household Participation in a Home Composting Scheme. Environ. Behav. 2009, 41, 151–169. [Google Scholar] [CrossRef]
- Pergola, M.; Persiani, A.; Palese, A. M.; Di Meo, V.; Pastore, V.; D’Adamo, C.; Celano, G. Composting: The Way for a Sustainable Agriculture. Appl. Soil Ecol. 2018, 123, 744–750. [Google Scholar] [CrossRef]
- Buehlmann, U.; Bumgardner, M.; Fluharty, T. Ban on Landfilling of Wooden Pallets in North Carolina: An Assessment of Recycling and Industry Capacity. J. Cleaner Prod. 2009, 17, 271–275. [Google Scholar] [CrossRef]
- Moh, Y. C.; Abd Manaf, L. Overview of Household Solid Waste Recycling Policy Status and Challenges in Malaysia. Resour. Conserv. Recycl. 2014, 82, 50–61. [Google Scholar] [CrossRef]
- Challcharoenwattana, A.; Pharino, C. Analysis of Socioeconomic and Behavioral Factors Influencing Participation in Community-Based Recycling Program: A Case of Peri-Urban Town in Thailand. Sustainability 2018, 10, 4500. [Google Scholar] [CrossRef]
- Jaffe, K.; Dong, H.; Godefroy, A.; Boutang, D.; Hayashi, K.; Milloy, M. J.; Kerr, T.; Richardson, L. Informal Recycling, Income Generation, and Risk: Health and Social Harms among People Who Use Drugs. Int. J. Drug Policy 2018, 60, 40–46. [Google Scholar] [CrossRef]
- Edmundson, S. J.; Wilkie, A. C. Landfill Leachate–a Water and Nutrient Resource for Algae-Based Biofuels. Environ. Technol. 2013, 34(13-14), 1849-1857. [CrossRef]
- Ikhmayies, S. J. Recycling Silicon and Silicon Compounds. JOM 2020, 72, 2612–2614. [Google Scholar] [CrossRef]
- Page, M. J.; Moher, D.; Bossuyt, P. M.; Boutron, I.; Hoffmann, T. C.; Mulrow, C. D.; Shamseer, L.; Tetzlaff, J. M.; Akl, E. A.; Brennan, S. E. PRISMA 2020 Explanation and Elaboration: Updated Guidance and Exemplars for Reporting Systematic Reviews. BMJ 2021, 372. [Google Scholar] [CrossRef] [PubMed]
- Worldometer, 2022. World Population by Region accessed on https://www.worldometers.info/world-population/ by 2022/Nov/22.
- Peng, B.; Tu, Y.; Wei, G. Governance of Electronic Waste Recycling Based on Social Capital Embeddedness Theory. J. Cleaner Prod. 2018, 187, 29–36. [Google Scholar] [CrossRef]
- Białko, M.; Hoła, B. Identification of Methods of Reducing Construction Waste in Construction Enterprises Based on Surveys. Sustainability 2021, 13, 9888. [Google Scholar] [CrossRef]
- Liang, Y.; Tan, Q.; Song, Q.; Li, J. An Analysis of the Plastic Waste Trade and Management in Asia. Waste Manage. 2021, 119, 242–253. [Google Scholar] [CrossRef]
- Wang, C.; Zhao, L.; Lim, M. K.; Chen, W.; Sutherland, J. W. Structure of the Global Plastic Waste Trade Network and the Impact of China’s Import Ban. Resour. Conserv. Recycl. 2020, 153, 104591. [Google Scholar] [CrossRef]
- United States Environmental Protection Agency (USEPA), 2022a. Celebrating America’s Recycling Day, National Recycles Day accessed on https://www.epa.gov/recyclingstrategy/america-recycles-day by 2022/Nov/22.
- Business Development Bank of Canada (BDC), 2022a. How to Measure Your Carbon Footprint, Calculating Your Company’s Greenhouse Gas Emissions Is a Vital First Step to Reducing Your Environmental Impact accessed on https://www.bdc.ca/en/articles-tools/sustainability/environment/how-measure-your-carbon-footprint by 2022/Nov/22.
- Business Development Bank of Canada (BDC), 2022b. 7 Low-Cost Ways to Lower Your Business’s Carbon Footprint, Small Changes Have Big Impact on Greenhouse Gas Emissions accessed on https://www.bdc.ca/en/articles-tools/sustainability/environment/7-low-cost-ways-lower-businesss-carbon-footprint by 2022/Nov/22.
- European Commission, 2022. EU Waste Management Law accessed on https://eur-lex.europa.eu/legal-content/EN/LSU/?uri=CELEX:32008L0098 by 2022/Nov/22.
- Rutkowski, J. E.; Rutkowski, E. W. Recycling in Brasil: Paper and Plastic Supply Chain. Resources 2017, 6, 43. [Google Scholar] [CrossRef]
- Matzembacher, D. E.; Raudsaar, M.; de Barcellos, M. D.; Mets, T. Sustainable Entrepreneurial Process: From Idea Generation to Impact Measurement. Sustainability 2019, 11, 5892. [Google Scholar] [CrossRef]
- Adhikari, B. K.; Barrington, S.; Martinez, J. Predicted Growth of World Urban Food Waste and Methane Production. Waste Manage. Res. 2006, 24, 421–433. [Google Scholar] [CrossRef]
- Otekunrin, O. A.; Otekunrin, O. A.; Sawicka, B.; Ayinde, I. A. Three Decades of Fighting against Hunger in Africa: Progress, Challenges and Opportunities. World Nutrition 2020, 11, 86–111. [Google Scholar] [CrossRef]
- No Food Waste, 2022. To Feed the Needy and Hungry with Untouchable Edible Surplus Food accessed on https://nofoodwaste.org/about by 2022/Nov/22.
- Natural Resources Defense Council (NRDC), 2022. City Food Scrap Recycling Landscape Assessment Consultant Scope of Work accessed on https://www.nrdc.org/sites/default/files/food-scrap-recycling-assessment-consultant-sow.pdf by 2022/Nov/22.
- Green Era Campus, 2022. Creating More Sustainable Communities by Supporting Local Food Production through Better Management of Biodegradable Waste and Access to Soil accessed on https://www.greenerachicago.org/ by 2022/Nov/22.
- United States Environmental Protection Agency (USEPA), 2022b. Developing and Implementing an Airport Recycling Program accessed on https://archive.epa.gov/wastes/conserve/tools/rogo/web/pdf/airport-recycling-guide.pdf by 2022/Nov/22.
- City of Sioux Falls, 2016. City of Sioux Falls Solid Waste Management Plan prepared by HDR, released November 2017 and revised December 2019 accessed on https://www.siouxfalls.org/public-works/landfill/swm-mp by 2022/Nov/22.
- Herat, S.; Agamuthu, P. E-waste: A Problem or an Opportunity? Review of Issues, Challenges and Solutions in Asian Countries. Waste Manage. Res. 2012, 30, 1113–1129. [Google Scholar] [CrossRef]
- Orlins, S.; Guan, D. China’s Toxic Informal E-waste Recycling: Local Approaches to a Global Environmental Problem. J. Cleaner Prod. 2016, 114, 71–80. [Google Scholar] [CrossRef]
- Li, J.; Yang, J.; Liu, L. Development Potential of E-waste Recycling Industry in China. Waste Manage. Res. 2015, 33, 533–542. [Google Scholar] [CrossRef] [PubMed]
- Akhtar, A.; Sarmah, A. K. Construction and Demolition Waste Generation and Properties of Recycled Aggregate Concrete: A Global Perspective. J. Cleaner Prod. 2018, 186, 262–281. [Google Scholar] [CrossRef]
- MYCOCYCLE, 2022. Converting Waste Stream into Value Streams accessed on https://mycocycle.com/ by 2022/Nov/22.
- Liu, J.; Teng, Y.; Wang, D.; Gong, E. System Dynamic Analysis of Construction Waste Recycling Industry Chain in China. Environ. Sci. Pollut. Res. 2020, 27, 37260–37277. [Google Scholar] [CrossRef]
- Rodríguez, G.; Medina, C.; Alegre, F. J.; Asensio, E.; De Rojas, M. S. Assessment of Construction and Demolition Waste Plant Management in Spain: In Pursuit of Sustainability and Eco-Efficiency. J. Cleaner Prod. 2015, 90, 16–24. [Google Scholar] [CrossRef]
- Food and Agricultural Organization of the United States (FAO), 2003. “Wood Products and Sustainable Construction” accessed on https://www.fao.org/3/xii/1039-a2.htm by 2022/Nov/22.
- Han, X.; Wen, Y.; Kant, S. The Global Competitiveness of the Chinese Wooden Furniture Industry. Forest Policy Econ. 2009, 11, 561–569. [Google Scholar] [CrossRef]
- Yang, D.; Zhu, J. Recycling and Value-added Design of Discarded Wooden Furniture. BioResources 2021, 16. [Google Scholar] [CrossRef]
- Top, Y. Waste Generation and Utilisation in Micro-sized Furniture-manufacturing Enterprises in Turkey. Waste Manage. 2015, 35, 3–11. [Google Scholar] [CrossRef] [PubMed]
- Tsai, W.; Lan, S.; Huang, C. Activity-based Standard Costing Product-mix Decision in the Future Digital Era: Green Recycling Steel-scrap Material for Steel Industry. Sustainability 2019, 11, 899. [Google Scholar] [CrossRef]
- Li, P.; Li, X.; Li, F. A Novel Recycling and Reuse Method of Iron Scraps from Machining Process. J. Cleaner Prod. 2020, 266, 121732. [Google Scholar] [CrossRef]
- Avinash, A.; Sasikumar, P.; Murugesan, A. Understanding the Interaction among the Barriers of Biodiesel Production from Waste Cooking Oil in India-An Interpretive Structural Modeling Approach. Renewable Energy 2018, 127, 678–684. [Google Scholar] [CrossRef]
- Diamantis, V.; Eftaxias, A.; Stamatelatou, K.; Noutsopoulos, C.; Vlachokostas, C.; Aivasidis, A. Bioenergy in the Era of Circular Economy: Anaerobic Digestion Technological Solutions to Produce Biogas from Lipid-rich Wastes. Renewable Energy 2021, 168, 438–447. [Google Scholar] [CrossRef]
- Shane, A.; Gheewala, S. H. Missed Environmental Benefits of Biogas Production in Zambia. J. Cleaner Prod. 2017, 142, 1200–1209. [Google Scholar] [CrossRef]
- Milios, L.; Christensen, L. H.; McKinnon, D.; Christensen, C.; Rasch, M. K.; Eriksen, M. H. Plastic Recycling in the Nordics: A Value Chain Market Analysis. Waste Manage. 2018, 76, 180–189. [Google Scholar] [CrossRef]
- Fråne, A.; Stenmarck, Å; Gíslason, S.; Løkke, S.; zu Castell Rüdenhausen, M.; Raadal, H. L.; Wahlström, M. Future Solutions for Nordic Plastic Recycling. Nordic Council of Ministers, 2015.
- AmberCycle Industries, 2021. Business Plan accessed on https://static.igem.org/mediawiki/2012e/archive/c/cc/20121123003140!Business_Plan_for_Website2.pdf by 2022/Nov/24.
- Pacheco, J. J.; Davis, M. E. Synthesis of Terephthalic Acid via Diels-Alder Reactions with Ethylene and Oxidized Variants of 5-Hydroxymethylfurfural. Proc. Natl. Acad. Sci. USA 2014, 111, 8363–8367. [Google Scholar] [CrossRef] [PubMed]
- Apple, 2018. Supplier Responsibility, 2018 Progress Report accessed on https://www.apple.com/supplier-responsibility/pdf/Apple_SR_2018_Progress_Report.pdf by 2022/Nov/24.
- Fang, X.; Shen, Y.; Zhao, J.; Bao, X.; Qu, Y. Status and Prospect of Lignocellulosic Bioethanol Production in China. Bioresource Technol. 2010, 101, 4814–4819. [Google Scholar] [CrossRef]
- Yin, H.; Zhao, W.; Li, T.; Cheng, X.; Liu, Q. Balancing Straw Returning and Chemical Fertilizers in China: Role of Straw Nutrient Resources. Renewable Sustainable Energy Rev. 2018, 81, 2695–2702. [Google Scholar] [CrossRef]
- Seglah, P. A.; Wang, Y.; Wang, H.; Bi, Y. Estimation and Efficient Utilization of Straw Resources in Ghana. Sustainability 2019, 11, 4172. [Google Scholar] [CrossRef]
- Espinosa, E.; Tarrés, Q.; Delgado-Aguilar, M.; González, I.; Mutjé, P.; Rodríguez, A. Suitability of Wheat Straw Semichemical Pulp for the Fabrication of Lignocellulosic Nanofibres and Their Application to Papermaking Slurries. Cellulose 2016, 23, 837–852. [Google Scholar] [CrossRef]
- Croce, S.; Wei, Q.; D’Imporzano, G.; Dong, R.; Adani, F. Anaerobic Digestion of Straw and Corn Stover: The Effect of Biological Process Optimization and Pre-treatment on Total Bio-methane Yield and Energy Performance. Biotechnol. Adv. 2016, 34, 1289–1304. [Google Scholar] [CrossRef]
- Hong, J.; Ren, L.; Hong, J.; Xu, C. Environmental Impact Assessment of Corn Straw Utilization in China. J. Cleaner Prod. 2016, 112, 1700–1708. [Google Scholar] [CrossRef]
- Liu, H.; Ou, X.; Yuan, J.; Yan, X. Experience of Producing Natural Gas from Corn Straw in China. Resources, Conservation Recycling 2018, 135, 216–224. [Google Scholar] [CrossRef]
- Wang, Z.; Wang, Z.; Tahir, N.; Wang, H.; Li, J.; Xu, G. Study of Synergetic Development in Straw Power Supply Chain: Straw Price and Government Subsidy as Incentive. Energy Policy 2020, 146, 111788. [Google Scholar] [CrossRef]
- Inter-American Development Bank (IDB), 2021. Environmental and Social Review Summary (ESRS), Pantaleon-Guatemala accessed on https://openlandcontracts.org/contract/ocds-591adf-2469737525/download/pdf by 2022/Nov/26.
- Van Velzen, E. T.; Molenveld, K.; Brouwer, M. T.; van der Zee, M.; Smeding, I. Issue Paper: Recycling of Different Waste streams, Wageningen University & Research accessed on https://library.wur.nl/WebQuery/wurpubs/fulltext/555442.
- Hole, G.; Hole, A. S. Improving Recycling of Textiles Based on Lessons from Policies for Other Recyclable Materials: A Minireview. Sustain. Prod. Consum. 2020, 23, 42–51. [Google Scholar] [CrossRef]
- Wang, L.; Sun, H.; Sun, Z.; Ma, E. New Technology and Application of Brick Making with Coal Fly Ash. J. Mater. Cycles Waste Manage. 2016, 18, 763–770. [Google Scholar] [CrossRef]
- Revelo, C. F.; Correa, M.; Aguilar, C.; Colorado, H. A. Composite Materials Made of Waste Tires and Polyurethane Resin: A Case Study of Flexible Tiles Successfully Applied in Industry. Case Stud. Constr. Mater. 2021, 15. [Google Scholar] [CrossRef]
- Makhzoumi Foundation, 2016. Empowering a Better Tomorrow, End of Year Report accessed on http://makhzoumi-foundation.org/wp-content/uploads/2017/02/MF-EOY-2016-new.pdf by 2022/Nov/28.
- Liu, Y.; Tian, T.; Hao, X.; Zhang, Q.; Yao, C.; Liu, G. Promotion of Household Waste Utilization in China: Lessons Learnt from Three Case Studies. Sustainability 2021, 13, 11598. [Google Scholar] [CrossRef]
- Kadaipai, 2019. Let Us Make the Earth a Better Place to Live for Our Future Generations. The Magic Line Is “It Is Not Plastic” accessed on https://kadaipai.com/about-us/ by 2022/Nov/28.
- Shimizu, 2020. Shimizu Corporate Report accessed on https://www.shimz.co.jp/en/company/about/report/ by 2022/Nov/28.
- Enerkem, 2017. Enerkem Products accessed on https://enerkem.com/products/ by 2022/Nov/28.
- United States Environmental Protection Agency (USEPA), 2022c. Composting at Home accessed on https://www.epa.gov/recycle/composting-home by 2022/Nov/28.
- SRM Institute of Science and Technology, 2019. Exhibition cum Industry Academia Meet, Waste Management and Social Entrepreneurship accessed on https://webstor.srmist.edu.in/web_assets/downloads/2021/waste-management-and-social-entrepreneurship.pdf by 2022/Nov/28.
- Western University, 2020. Sustainable Development Goals accessed on https://sustainability.uwo.ca/sdg/2021-22%20Full%20SDG%20Report.pdf by 2021/10/11.
- United States Environmental Protection Agency (USEPA), 2022d. Basic Information about Anaerobic Digestion accessed on https://www.epa.gov/anaerobic-digestion/basic-information-about-anaerobic-digestion-ad#HowADworks by 2022/Nov/28.
- Domingo, J. L.; Marquès, M.; Mari, M.; Schuhmacher, M. Adverse Health Effects for Populations Living Near Waste Incinerators with Special Attention to Hazardous Waste Incinerators. A Review of the Scientific Literature. Environ. Res. 2020, 187, 109631. [Google Scholar] [CrossRef]
- Alexander, C.; Smaje, C. Surplus Retail Food Redistribution: An Analysis of a Third Sector Model. Resour. Conserv. Recycl. 2008, 52, 1290–1298. [Google Scholar] [CrossRef]
- Afroz, R.; Hanaki, K.; Tudin, R. Factors Affecting Waste Generation: A Study in a Waste Management Program in Dhaka City, Bangladesh. Environ. Monit. Assess. 2011, 179, 509–519. [Google Scholar] [CrossRef]


Disclaimer/Publisher’s Note: The statements, opinions and data contained in all publications are solely those of the individual author(s) and contributor(s) and not of MDPI and/or the editor(s). MDPI and/or the editor(s) disclaim responsibility for any injury to people or property resulting from any ideas, methods, instructions or products referred to in the content. |
© 2023 by the authors. Licensee MDPI, Basel, Switzerland. This article is an open access article distributed under the terms and conditions of the Creative Commons Attribution (CC BY) license (http://creativecommons.org/licenses/by/4.0/).


