Submitted:
15 August 2023
Posted:
16 August 2023
You are already at the latest version
Abstract
Keywords:
1. Introduction
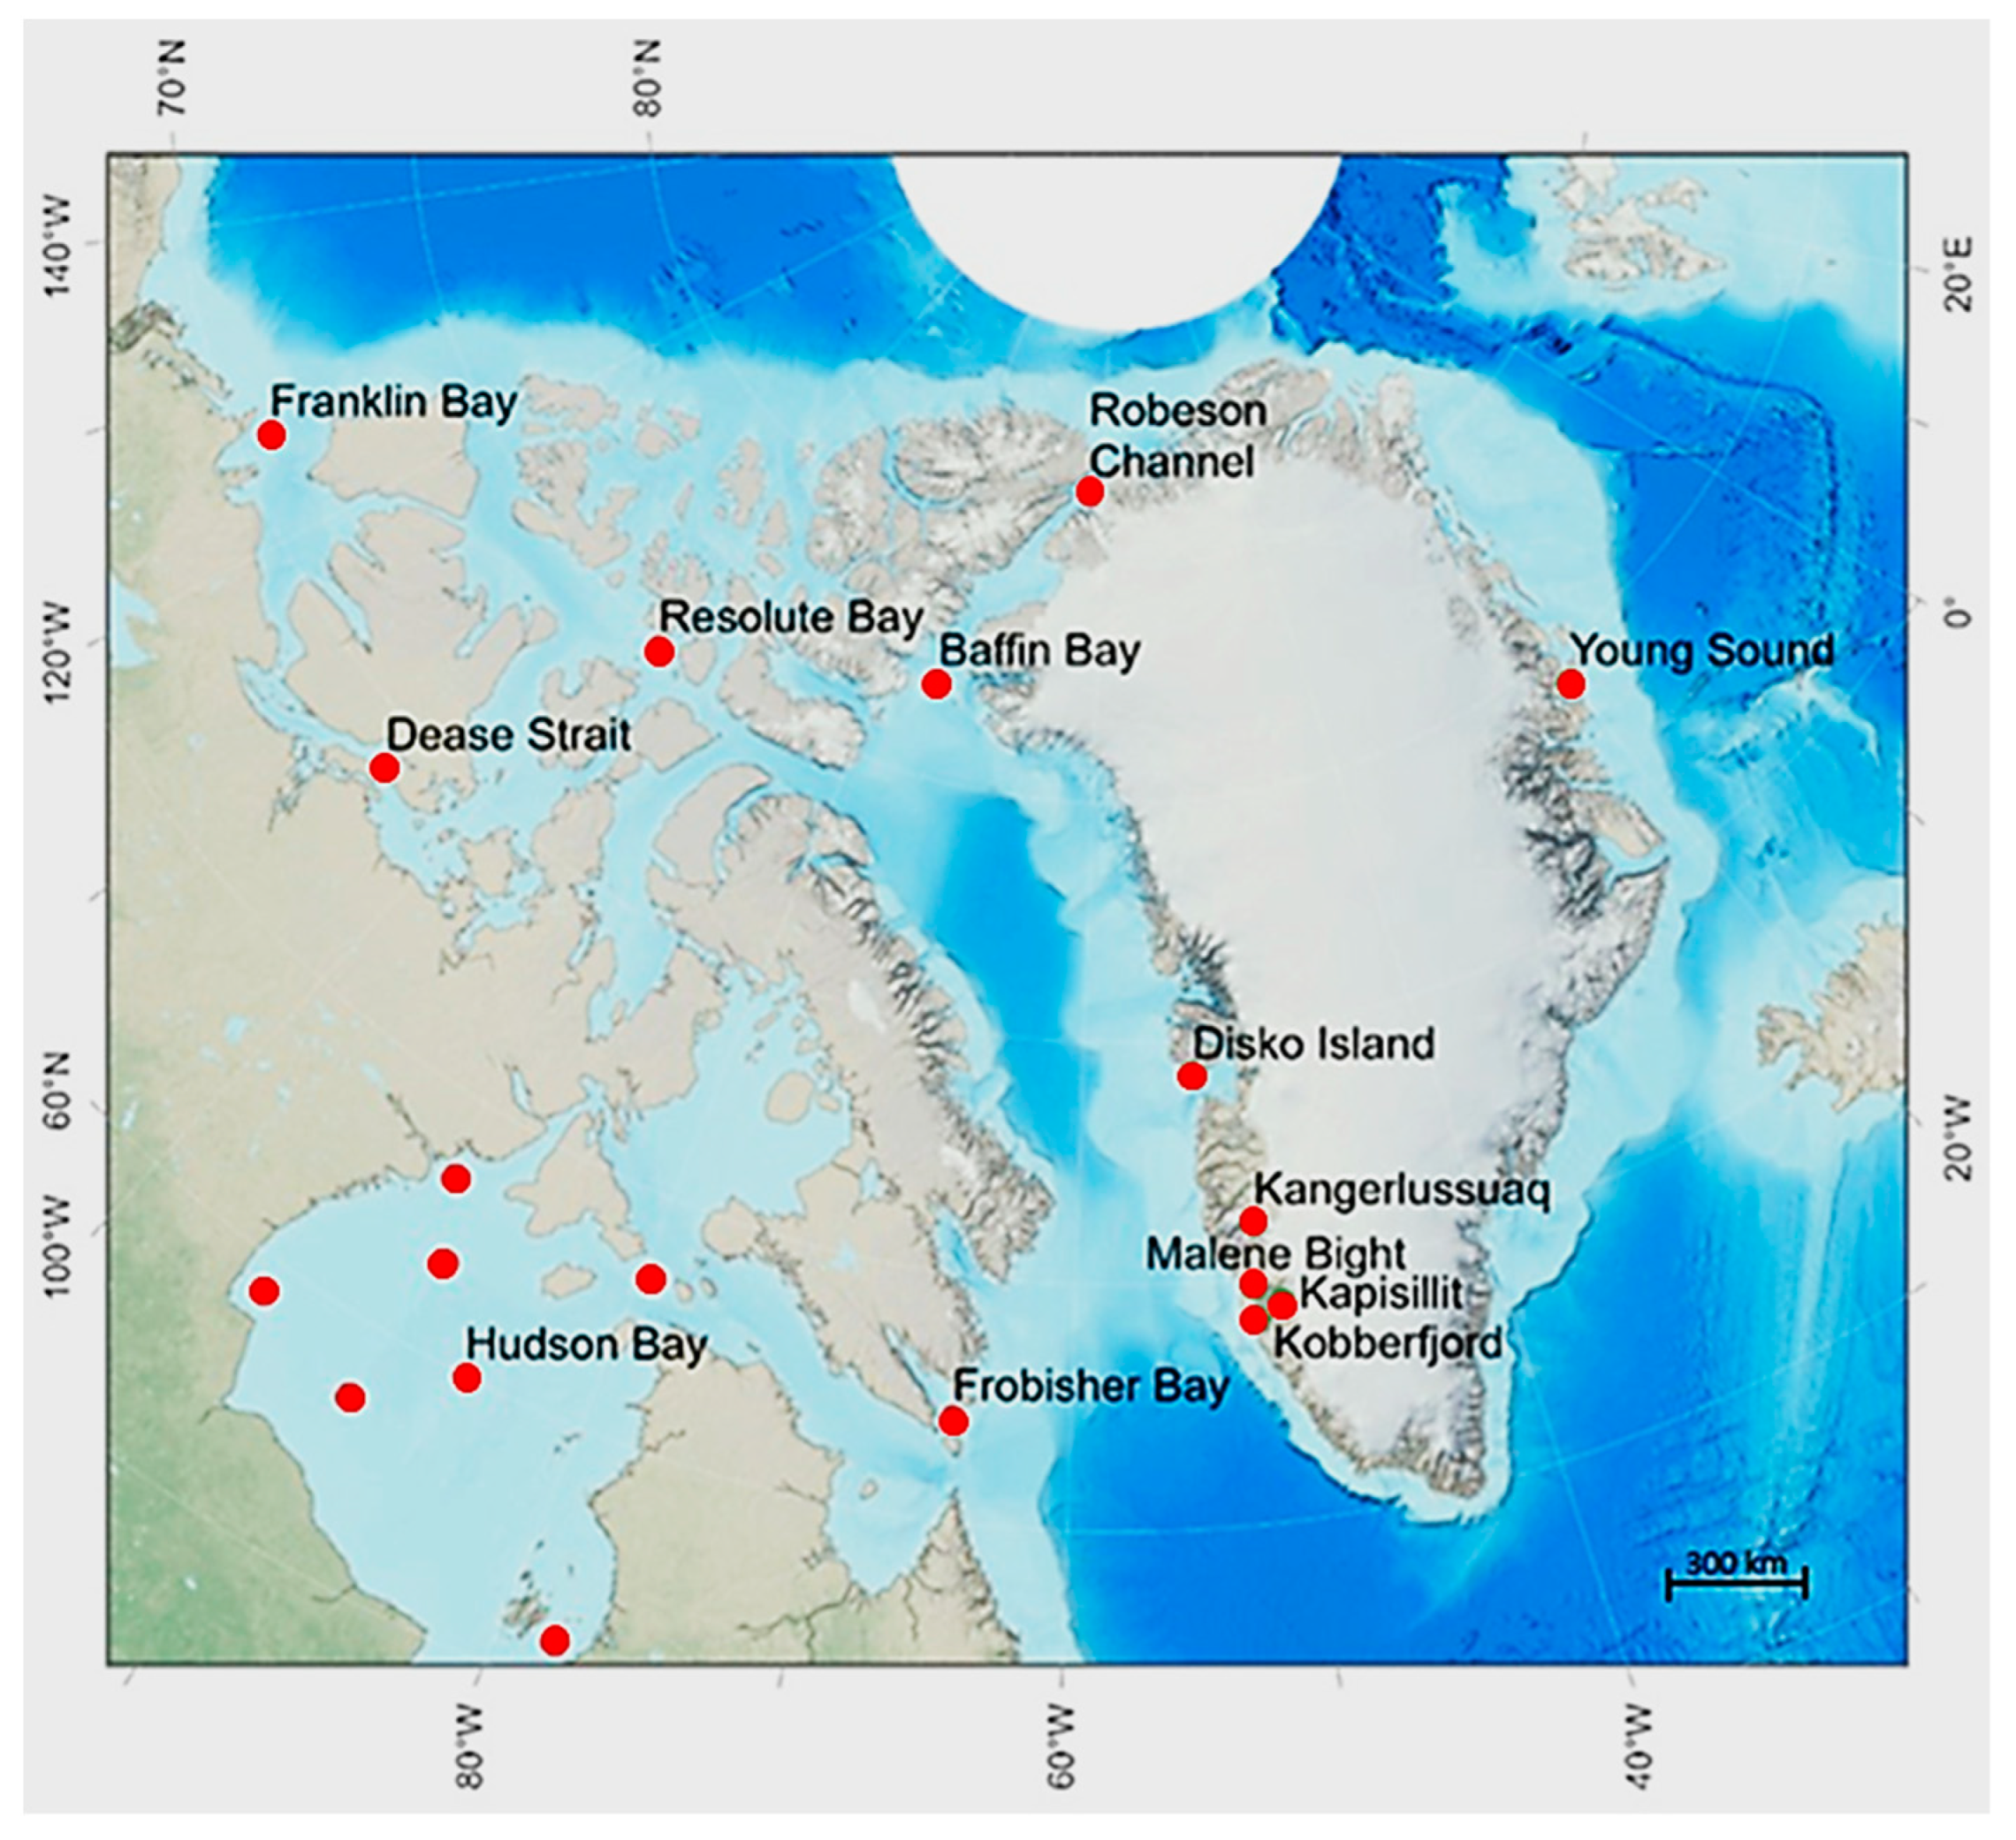
2. Physical and biological parameters of the sea ice
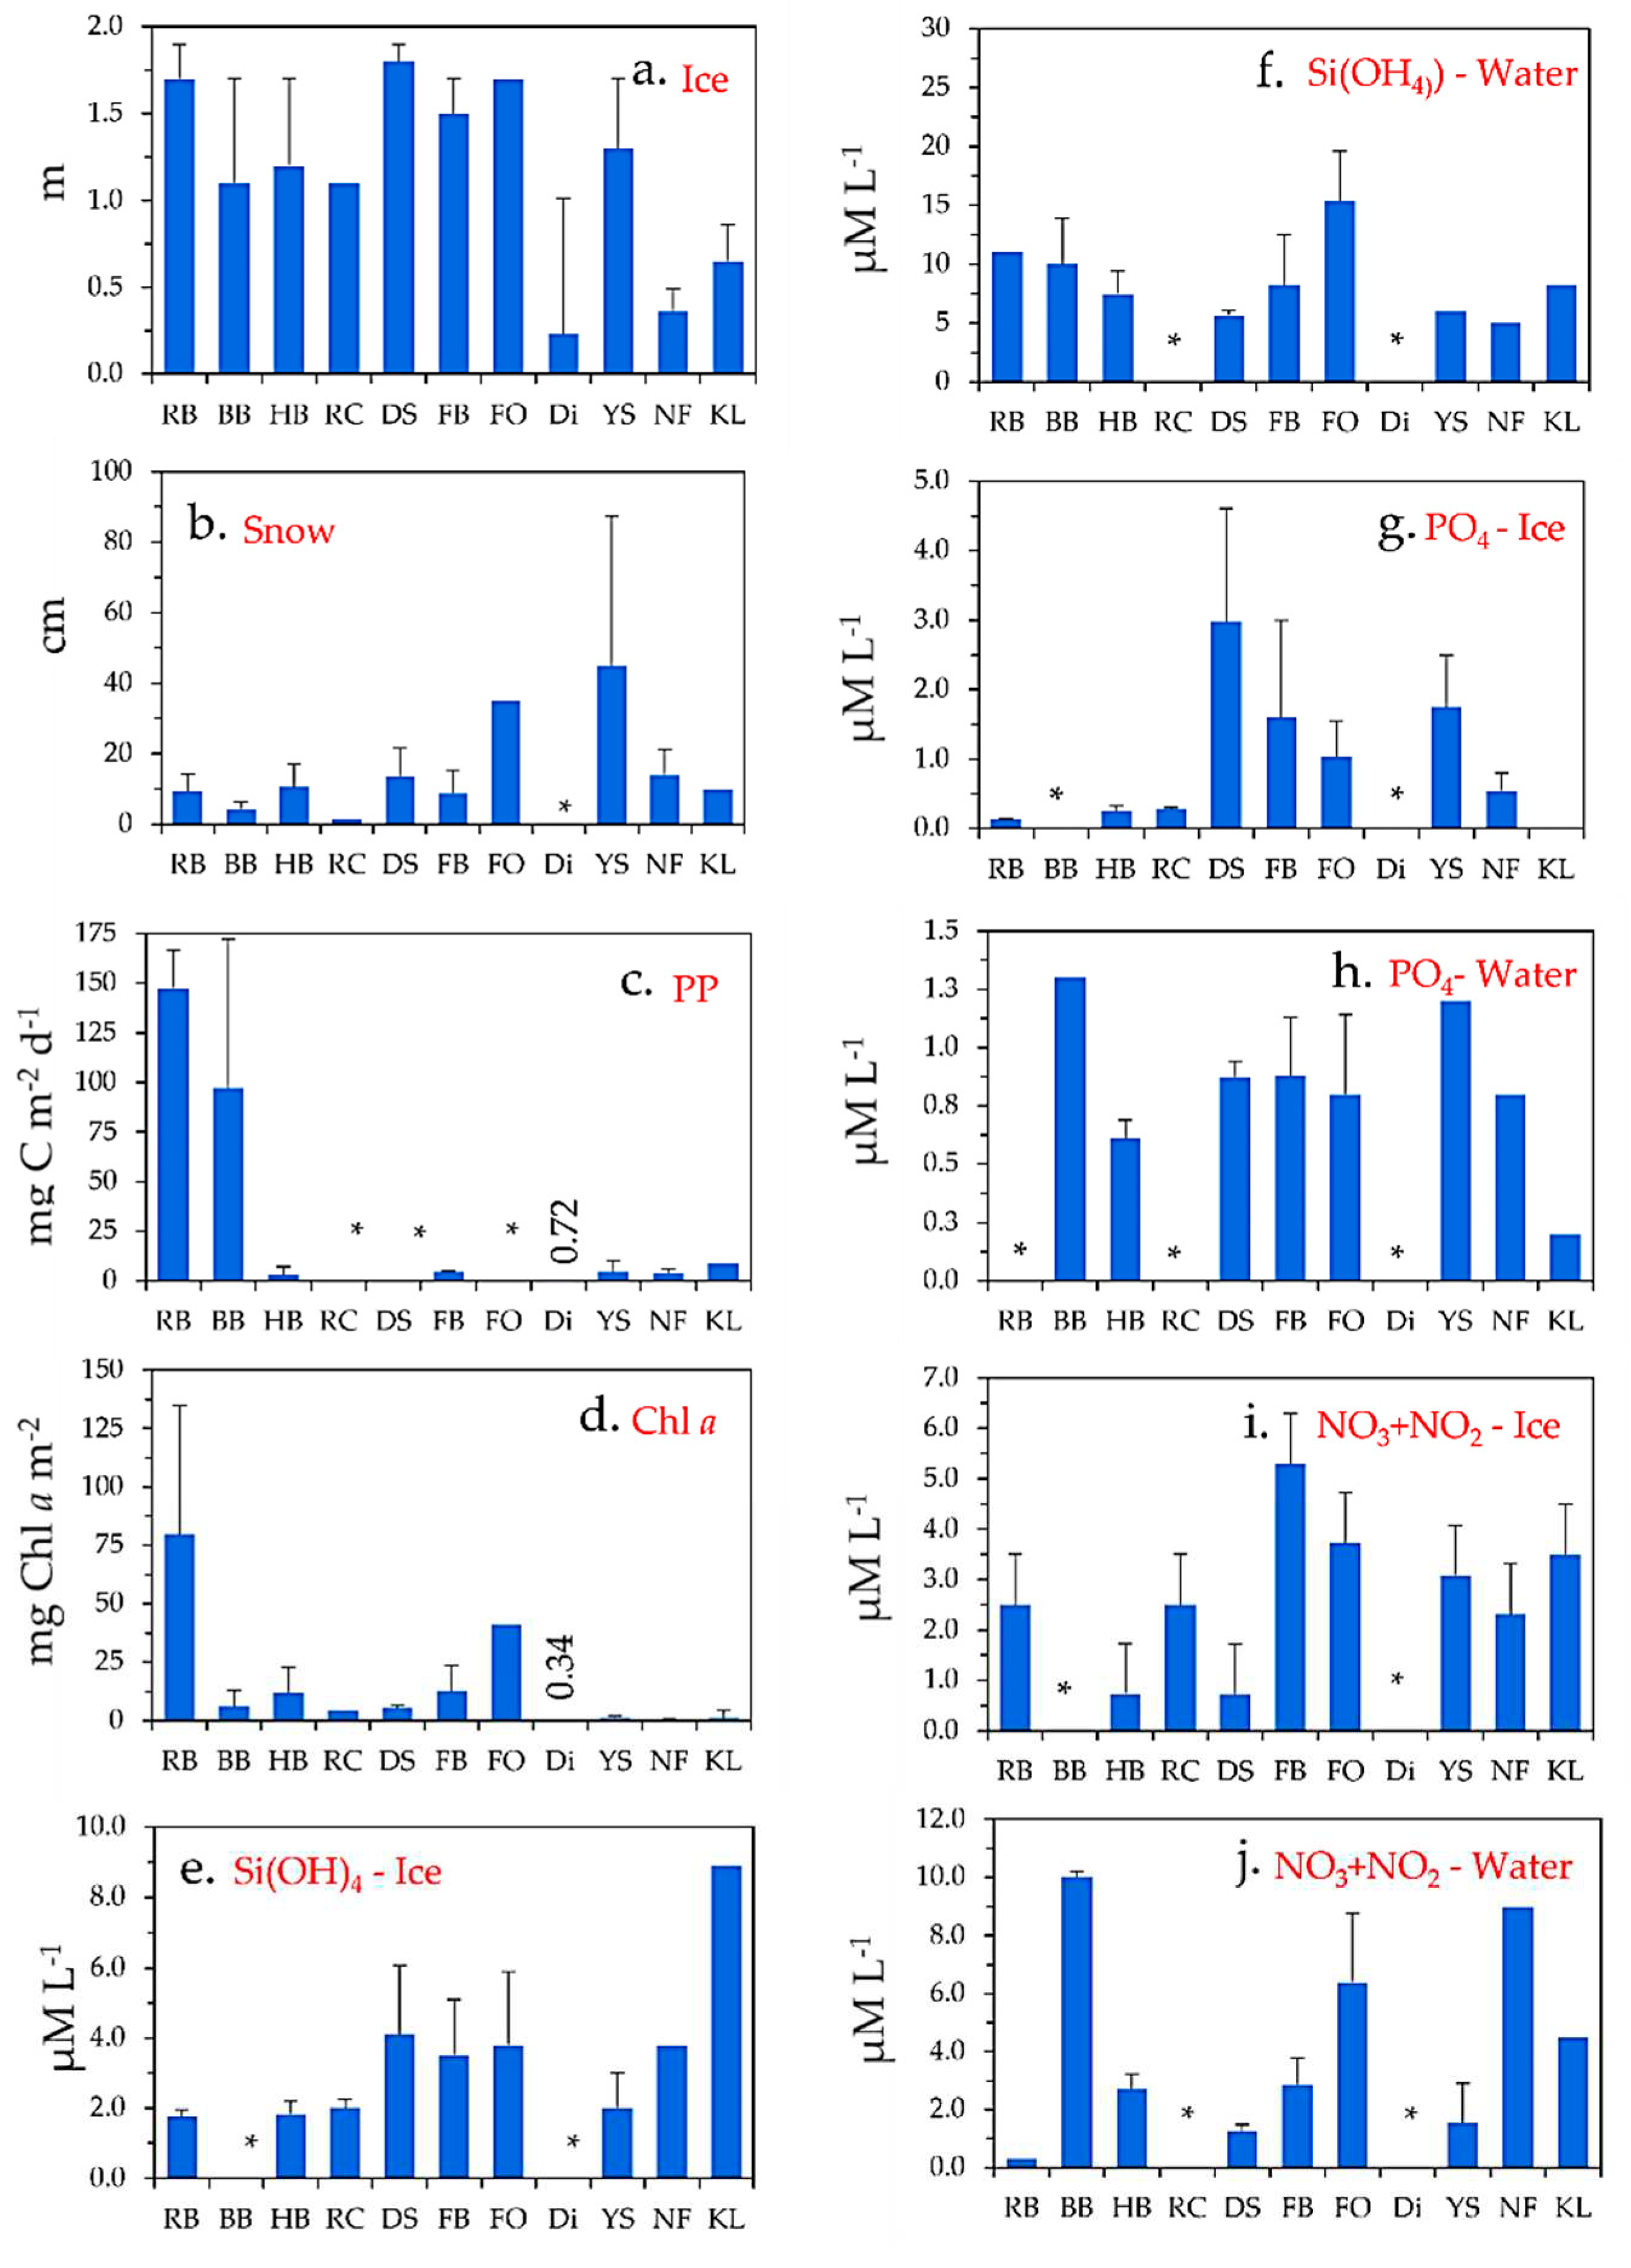
2.1. Ice, snow, production rates and Chl a
2.2. Nutrients in sea ice and in water below
2.3. Primary production at other Arctic sites
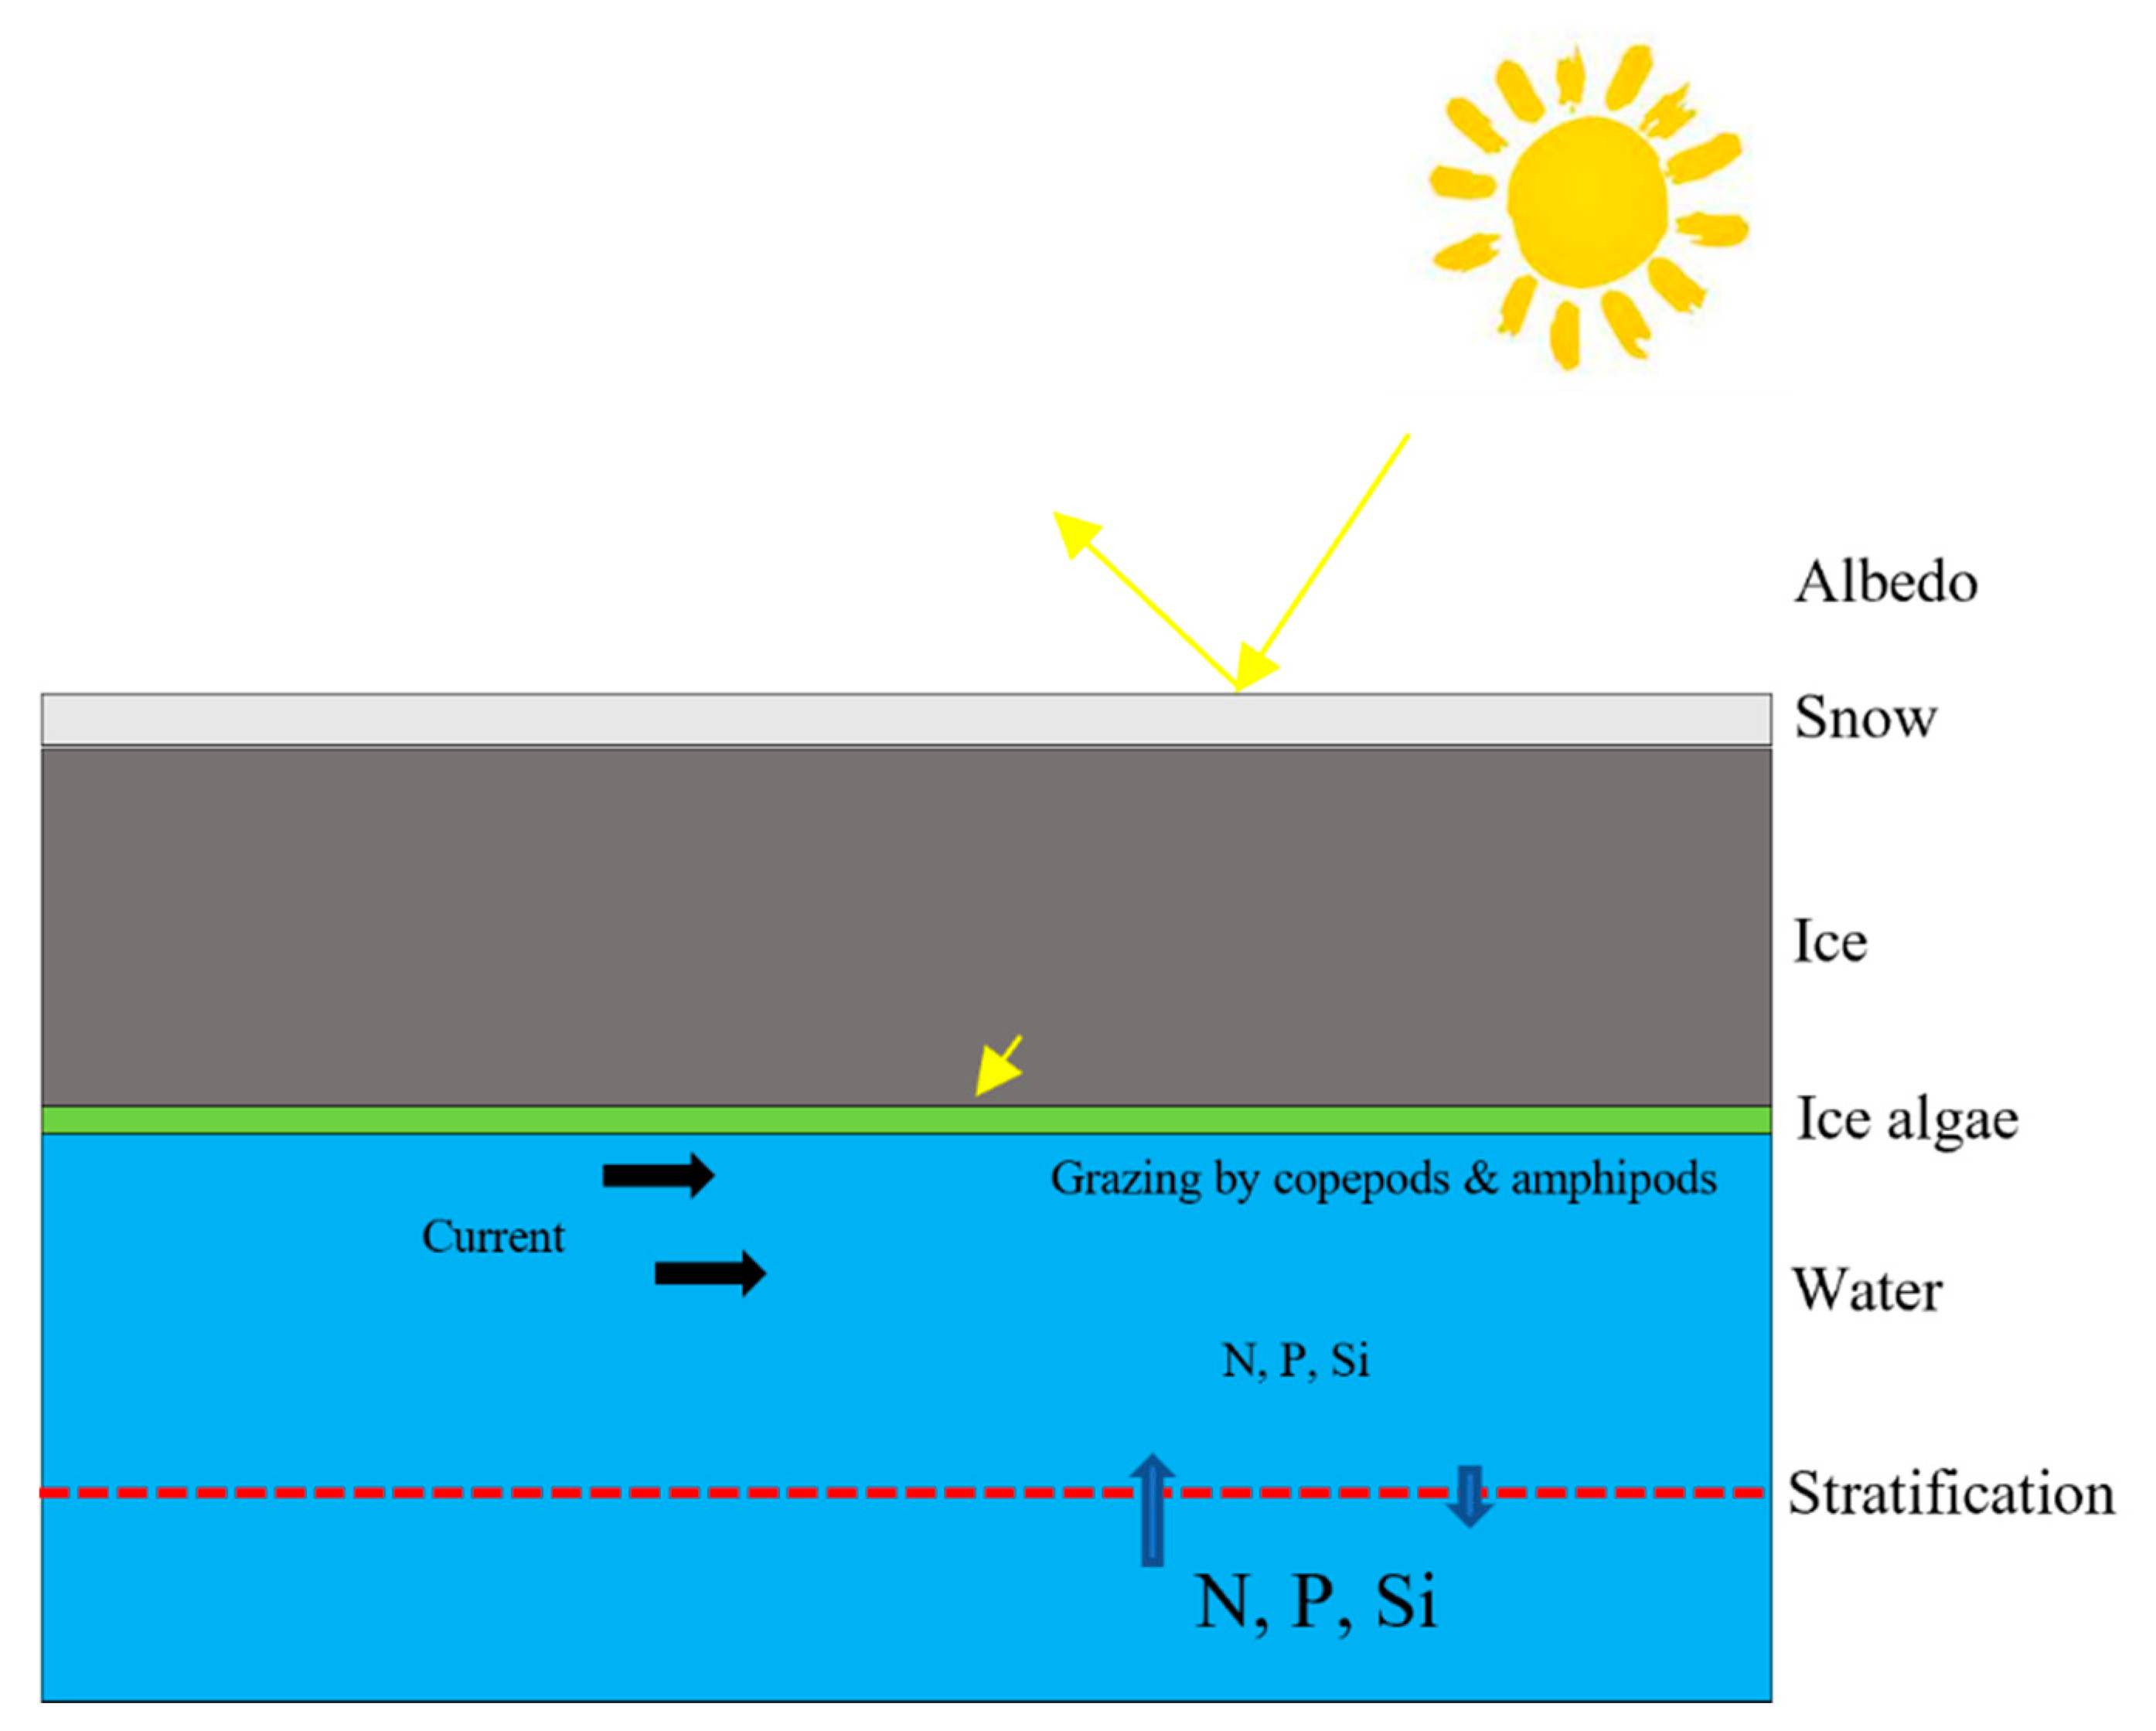
3. Discussion
4. Conclusions
Author Contributions
Funding
Institutional Review Board Statement
Informed Consent Statement
Data availability statement
Conflicts Interests
References
- Andersen, O.G.N. Primary production associated with sea ice at Godhavn, Disko, West Greenland. Ophelia 1977, 16, 205–220. [Google Scholar] [CrossRef]
- Arrigo, K., 2017. Sea ice as a habitat for primary producers. In “Sea Ice”, 3rd ed.; Thomas, D.N., Ed., Wiley Blackwell, Oxford, UK, 2017; 652p.
- Bergmann, M.; Welch, H.; Butler-Walker, J.; Siferd, T. Ice algal photosynthesis at resolute and saqvaqjuac in the Canadian arctic. J. Mar. Syst. 1991, 2, 43–52. [Google Scholar] [CrossRef]
- Boetius, A.; Albrecht, S.; Bakker, K.; Bienhold, C.; Felden, J.; Fernández-Méndez, M.; Hendricks, S.; Katlein, C.; Lalande, C.; Krumpen, T.; et al. Export of Algal Biomass from the Melting Arctic Sea Ice. Science 2013, 339, 1430–1432. [Google Scholar] [CrossRef] [PubMed]
- Bluhm, B.A., Swadling, K.M., Gradinger, R., 2017. In “Sea Ice”, 3rd ed.; Thomas, D.N., Ed., Wiley Blackwell, Oxford, UK, 2017; 652p.
- Booth, J. The Epontic Algal Community of the Ice Edge Zone and Its Significance to the Davis Strait Ecosystem. ARCTIC 1984, 37, 234–243. [Google Scholar] [CrossRef]
- Campbell, K. , Mundy, C., Landy, J., Delaforge, A., Michel, C., Rysgaard, S. Community dynamics of bottom-ice algae in Dease Strait of the Canadian Arctic. Prog. Oceanogr. 2016, 149, 27–39. Biochemistry 1991, 30, 7586–7597. [Google Scholar] [CrossRef]
- Colombo, M.; Jackson, S.L.; Cullen, J.T.; Orians, K.J. Dissolved iron and manganese in the Canadian Arctic Ocean: On the biogeochemical processes controlling their distributions. Geochim. et Cosmochim. Acta 2020, 277, 150–174. [Google Scholar] [CrossRef]
- Dalman, L.A.; Else, B.G.T.; Barber, D.; Carmack, E.; Williams, W.J.; Campbell, K.; Duke, P.J.; Kirillov, S.; Mundy, C.J. Enhanced bottom-ice algal biomass across a tidal strait in the Kitikmeot Sea of the Canadian Arctic. Elementa: Sci. Anthr. 2019, 7. [Google Scholar] [CrossRef]
- Dunbar, M.; Acreman, J. Standing crops and species composition of diatoms in sea ice From Robeson Channel to the Gulf of St. Lawrence. Ophelia 1980, 19, 61–72. [Google Scholar] [CrossRef]
- Dupont, F. Impact of sea-ice biology on overall primary production in a biophysical model of the pan-Arctic Ocean. J. Geophys. Res. Oceans 2012, 117. [Google Scholar] [CrossRef]
- Fernández-Méndez, M.; Katlein, C.; Rabe, B.; Nicolaus, M.; Peeken, I.; Bakker, K.; Flores, H.; Boetius, A. Photosynthetic production in the central Arctic Ocean during the record sea-ice minimum in 2012. Biogeosciences 2015, 12, 3525–3549. [Google Scholar] [CrossRef]
- Francis, J.A. , Wu, B. Why has no new record-minimum Arctic sea-ice extent occurred since September 2012? Environ. Res. Lett. 2020, 15, 114034. [Google Scholar] [CrossRef]
- Glud, R.N.; Rysgaard, S.; Kühl, M. A laboratory study on O2 dynamics and photosynthesis in ice algal communities: quantification by microsensors, O2 exchange rates, 14C incubations and a PAM fluorometer. Aquat. Microb. Ecol. 2002, 27, 301–311. [Google Scholar] [CrossRef]
- Glud, R.N., Rysgaard, S., Kühl, M., Hansen, J.W., 2007. The sea ice in Young Sound: Implications for carbon cycling. Carbon cycling in Arctic marine ecosystems: case study Young Sound. Meddr. Grønland 58, 62-85.
- Gosselin, M.; Legendre, L.; Demers, S.; Ingram, R.G. Responses of Sea-Ice Microalgae to Climatic and Fortnightly Tidal Energy Inputs (Manitounuk Sound, Hudson Bay). Can. J. Fish. Aquat. Sci. 1985, 42, 999–1006. [Google Scholar] [CrossRef]
- Gosselin, M.; Legendre, L.; Therriault, J.-C.; Demers, S. Light and nutrient limitation of sea-ice microalgae (Hudson Bay, Canadian Arctic. J. Phycol. 1990, 26, 220–232. [Google Scholar] [CrossRef]
- Gosselin, M.; Levasseur, M.; Wheeler, P.A.; Horner, R.A.; Booth, B.C. New measurements of phytoplankton and ice algal production in the Arctic Ocean. Deep. Sea Res. Part II: Top. Stud. Oceanogr. 1997, 44, 1623–1644. [Google Scholar] [CrossRef]
- Gradinger, R. Sea-ice algae: Major contributors to primary production and algal biomass in the Chukchi and Beaufort Seas during May/June 2002. Deep. Sea Res. Part II: Top. Stud. Oceanogr. 2009, 56, 1201–1212. [Google Scholar] [CrossRef]
- Haecky, P.; Andersson, A. Primary and bacterial production in sea ice in the northern Baltic Sea. Aquat. Microb. Ecol. 1999, 20, 107–118. [Google Scholar] [CrossRef]
- Hannah, C.G.; Dupont, F.; Dunphy, M. Polynyas and Tidal Currents in the Canadian Arctic Archipelago. ARCTIC 2009, 62, 83–95. [Google Scholar] [CrossRef]
- Hassett, B.T.; Ducluzeau, A.L.L.; Collins, R.E.; Gradinger, R. Spatial distribution of aquatic marine fungi across the western Arctic and sub-arctic. Environ. Microbiol. 2017, 19, 475–484. [Google Scholar] [CrossRef] [PubMed]
- Horner, R.; Schrader, G. Relative Contributions of Ice Algae, Phytoplankton, and Benthic Microalgae to Primary Production in Nearshore Regions of the Beaufort Sea. ARCTIC 1982, 35, 485–503. [Google Scholar] [CrossRef]
- Hsiao, S. Spatial and seasonal variations in primary production of sea ice microalgae and phytoplankton in Frobisher Bay, Arctic Canada. Mar. Ecol. Prog. Ser. 1988, 44, 275–285. [Google Scholar] [CrossRef]
- Ingram, R.G., Bâcle, J., Barber, D.G., Gratton, Y., Melling, H., 2002. An overview of physical processes in the North Water. Deep Sea Research Part II: Topical Studies in Oceanography 49, 4893-4906.
- Jahn, A.; Kay, J.E.; Holland, M.M.; Hall, D.M. How predictable is the timing of a summer ice-free Arctic? Geophys. Res. Lett. 2016, 43, 9113–9120. [Google Scholar] [CrossRef]
- Jeong, H.; Park, H.; Stuecker, M.F.; Yeh, S. Record Low Arctic Sea Ice Extent in 2012 Linked to Two-Year La Niña-Driven Sea Surface Temperature Pattern. Geophys. Res. Lett. 2022, 49. [Google Scholar] [CrossRef]
- Kaartokallio, H.; Søgaard, D.; Norman, L.; Rysgaard, S.; J, L.T.; Delille, B.; Thomas, D. Short-term variability in bacterial abundance, cell properties, and incorporation of leucine and thymidine in subarctic sea ice. Aquat. Microb. Ecol. 2013, 71, 57–73. [Google Scholar] [CrossRef]
- Kanna, N.; Toyota, T.; Nishioka, J. Iron and macro-nutrient concentrations in sea ice and their impact on the nutritional status of surface waters in the southern Okhotsk Sea. Prog. Oceanogr. 2014, 126, 44–57. [Google Scholar] [CrossRef]
- Karami, M.P.; Myers, P.G.; de Vernal, A.; Tremblay, L.B.; Hu, X. The role of Arctic gateways on sea ice and circulation in the Arctic and North Atlantic Oceans: a sensitivity study with an ocean-sea-ice model. Clim. Dyn. 2021, 57, 2129–2151. [Google Scholar] [CrossRef]
- Klein, B.; LeBlanc, B.; Mei, Z.-P.; Beret, R.; Michaud, J.; Mundy, C.-J.; von Quillfeldt, C.H.; Garneau, M.; Roy, S.; Gratton, Y.; et al. Phytoplankton biomass, production and potential export in the North Water. Deep. Sea Res. Part II: Top. Stud. Oceanogr. 2002, 49, 4983–5002. [Google Scholar] [CrossRef]
- Kohlbach, D.; Smik, L.; Belt, S.T.; Hop, H.; Wold, A.; Graeve, M.; Assmy, P. A multi-trophic marker approach reveals high feeding plasticity in Barents Sea under-ice fauna. Prog. Oceanogr. 2022, 208. [Google Scholar] [CrossRef]
- Lehmann, N.; Kienast, M.; Granger, J.; Bourbonnais, A.; Altabet, M.A.; Tremblay, J. Remote Western Arctic Nutrients Fuel Remineralization in Deep Baffin Bay. Glob. Biogeochem. Cycles 2019, 33, 649–667. [Google Scholar] [CrossRef]
- Lewis, E.L.; Ponton, D.; Legendre, L.; Leblanc, B. Springtime sensible heat, nutrients and phytoplankton in the Northwater Polynya, Canadian Arctic. Cont. Shelf Res. 1996, 16, 1775–1792. [Google Scholar] [CrossRef]
- Leu, E.; Mundy, C.; Assmy, P.; Campbell, K.; Gabrielsen, T.; Gosselin, M.; Juul-Pedersen, T.; Gradinger, R. Arctic spring awakening – Steering principles behind the phenology of vernal ice algal blooms. Prog. Oceanogr. 2015, 139, 151–170. [Google Scholar] [CrossRef]
- Lund-Hansen, L.C.; Hawes, I.; Sorrell, B.K.; Nielsen, M.H. Removal of snow cover inhibits spring growth of Arctic ice algae through physiological and behavioral effects. Polar Biol. 2013, 37, 471–481. [Google Scholar] [CrossRef]
- Lund-Hansen, L.C.; Hawes, I.; Nielsen, M.H.; Dahllöf, I.; Sorrell, B.K. Summer meltwater and spring sea ice primary production, light climate and nutrients in an Arctic estuary, Kangerlussuaq, west Greenland. Arctic, Antarct. Alp. Res. 2018, 50. [Google Scholar] [CrossRef]
- Lund-Hansen, L.C.; Søgaard, D.H.; Sorrell, B.K.; Gradinger, R.; Meiners, K.M. Arctic Sea Ice Ecology–Seasonal Dynamics in Algal and Bacterial Productivity; Springer: Berlin, Germany, 2020; 178p. [Google Scholar]
- Lund-Hansen, L.; Hawes, I.; Hancke, K.; Salmansen, N.; Nielsen, J.; Balslev, L.; Sorrell, B. Effects of increased irradiance on biomass, photobiology, nutritional quality, and pigment composition of Arctic sea ice algae. Mar. Ecol. Prog. Ser. 2020, 648, 95–110. [Google Scholar] [CrossRef]
- Lund-Hansen, L.C.; Bendtsen, J.; Stratmann, T.; Tonboe, R.; Olsen, S.M.; Markager, S.; Sorrell, B.K. Will low primary production rates in the Amundsen Basin (Arctic Ocean) remain low in a future ice-free setting, and what governs this production? J. Mar. Syst. 2020, 205, 103287. [Google Scholar] [CrossRef]
- Lund-Hansen, L.C.; Petersen, C.M.; Søgaard, D.H.; Sorrell, B.K. A Comparison of Decimeter Scale Variations of Physical and Photobiological Parameters in a Late Winter First-Year Sea Ice in Southwest Greenland. J. Mar. Sci. Eng. 2021, 9, 60. [Google Scholar] [CrossRef]
- Luhtanen, A.-M.; Eronen-Rasimus, E.; Oksanen, H.M.; Tison, J.-L.; Delille, B.; Dieckmann, G.S.; Rintala, J.-M.; Bamford, D.H. The first known virus isolates from Antarctic sea ice have complex infection patterns. FEMS Microbiol. Ecol. 2018, 94. [Google Scholar] [CrossRef] [PubMed]
- Matthes, L.C.; Ehn, J.K.; Dalman, L.A.; Babb, D.G.; Peeken, I.; Harasyn, M.; Kirillov, S.; Lee, J.; Bélanger, S.; Tremblay, J.; et al. Environmental drivers of spring primary production in Hudson Bay. Elementa: Sci. Anthr. 2021, 9. [Google Scholar] [CrossRef]
- Michel, C.; Legendre, L.; Therriault, J.-C.; Demers, S.; Vandevelde, T. Springtime coupling between ice algal and phytoplankton assemblages in southeastern Hudson Bay, Canadian Arctic. Polar Biol. 1993, 13. [Google Scholar] [CrossRef]
- Michel, C.; Nielsen, T.G.; Nozais, C.; Gosselin, M. Significance of sedimentation and grazing by ice micro- and meiofauna for carbon cycling in annual sea ice (northern Baffin Bay). Aquat. Microb. Ecol. 2002, 30, 57–68. [Google Scholar] [CrossRef]
- Michel, C.; Ingram, R.; Harris, L. Variability in oceanographic and ecological processes in the Canadian Arctic Archipelago. Prog. Oceanogr. 2006, 71, 379–401. [Google Scholar] [CrossRef]
- Mikkelsen, D.M.; Rysgaard, S.; Glud, R.N. Microalgal composition and primary production in Arctic sea ice: a seasonal study from Kobbefjord (Kangerluarsunnguaq), West Greenland. Mar. Ecol. Prog. Ser. 2008, 368, 65–74. [Google Scholar] [CrossRef]
- Mock, T.; Gradinger, R. Determination of Arctic ice algal production with a new in situ incubation technique. Mar. Ecol. Prog. Ser. 1999, 177, 15–26. [Google Scholar] [CrossRef]
- Mundy, C.J.; Gosselin, M.; Gratton, Y.; Brown, K.; Galindo, V.; Campbell, K.; Levasseur, M.; Barber, D.; Papakyriakou, T.; Bélanger, S. Role of environmental factors on phytoplankton bloom initiation under landfast sea ice in Resolute Passage, Canada. Mar. Ecol. Prog. Ser. 2014, 497, 39–49. [Google Scholar] [CrossRef]
- Nielsen, E.S. The Use of Radio-active Carbon (C14) for Measuring Organic Production in the Sea. ICES J. Mar. Sci. 1952, 18, 117–140. [Google Scholar] [CrossRef]
- Rózanska, M.; Gosselin, M.; Poulin, M.; Wiktor, J.M.; Michel, C. Influence of environmental factors on the development of bottom ice protist communities during the winter–spring transition. Mar. Ecol. Prog. Ser. 2009, 386, 43–59. [Google Scholar] [CrossRef]
- Olsen, L.M.; Laney, S.R.; Duarte, P.; Kauko, H.M.; Fernández-Méndez, M.; Mundy, C.J.; Rösel, A.; Meyer, A.; Itkin, P.; Cohen, L.; et al. The seeding of ice algal blooms in Arctic pack ice: The multiyear ice seed repository hypothesis. J. Geophys. Res. Biogeosciences 2017, 122, 1529–1548. [Google Scholar] [CrossRef]
- Parkinson, C.L. Spatially mapped reductions in the length of the Arctic sea ice season. Geophys. Res. Lett. 2014, 41, 4316–4322. [Google Scholar] [CrossRef] [PubMed]
- Pineault, S.; Tremblay, J.; Gosselin, M.; Thomas, H.; Shadwick, E. The isotopic signature of particulate organic C and N in bottom ice: Key influencing factors and applications for tracing the fate of ice-algae in the Arctic Ocean. J. Geophys. Res. Oceans 2013, 118, 287–300. [Google Scholar] [CrossRef]
- Perovich, D.K.; Roesler, C.S.; Pegau, W.S. Variability in Arctic sea ice optical properties. J. Geophys. Res. Oceans 1998, 103, 1193–1208. [Google Scholar] [CrossRef]
- Perovich, D. K. (2017). Sea ice and sunlight. In D. N. Thomas (Ed.), Sea ice (3rd ed., pp. 110–137, 652 pp). Oxford: Wiley Blackwell.
- Riedel, A.; Michel, C.; Gosselin, M.; LeBlanc, B. Winter–spring dynamics in sea-ice carbon cycling in the coastal Arctic Ocean. J. Mar. Syst. 2008, 74, 918–932. [Google Scholar] [CrossRef]
- Randelhoff, A.; Fer, I.; Sundfjord, A.; Tremblay, J.; Reigstad, M. Vertical fluxes of nitrate in the seasonal nitracline of the Atlantic sector of the Arctic Ocean. J. Geophys. Res. Oceans 2016, 121, 5282–5295. [Google Scholar] [CrossRef]
- Rózanska, M.; Gosselin, M.; Poulin, M.; Wiktor, J.M.; Michel, C. Influence of environmental factors on the development of bottom ice protist communities during the winter–spring transition. Mar. Ecol. Prog. Ser. 2009, 386, 43–59. [Google Scholar] [CrossRef]
- Rysgaard, S.; Nielsen, T.; Hansen, B. Seasonal variation in nutrients, pelagic primary production and grazing in a high-Arctic coastal marine ecosystem, Young Sound, Northeast Greenland. Mar. Ecol. Prog. Ser. 1999, 179, 13–25. [Google Scholar] [CrossRef]
- Rysgaard, S.; Kühl, M.; Glud, R.N.; Hansen, J.W. Biomass, production and horizontal patchiness of sea ice algae in a high-Arctic fjord (Young Sound, NE Greenland). Mar. Ecol. Prog. Ser. 2001, 223, 15–26. [Google Scholar] [CrossRef]
- Sampei, M., Fortier, L., Raimbault, P., Matsuno, K., Vet, Y., Quéguiner, LaFond, A., Babin, M., Hirawake, T., (2021). An estimation of the quantitative impacts of copepod grazing on an under sea-ice spring phytoplabnkton bloom in western Baffin Bay, Canadian Arctic. Elementa: Sceince of the Anthropocene, 9. [CrossRef]
- Sanz-Martín, M.; Vernet, M.; Cape, M.R.; Mesa, E.; Delgado-Huertas, A.; Reigstad, M.; Wassmann, P.; Duarte, C.M. Relationship Between Carbon- and Oxygen-Based Primary Productivity in the Arctic Ocean, Svalbard Archipelago. Front. Mar. Sci. 2019, 6. [Google Scholar] [CrossRef]
- Smith, R.E.H., Anning, J., Pierre Clement, Cota, G., 1988. Abundance and production of ice algae in Resolute Passage, Canadian Arctic. Mar. Ecol. Prog. Ser 48, 251-263.
- Smith, R.E.; Herman, A.W. Productivity of sea ice algae: In situ vs. incubator methods. J. Mar. Syst. 1991, 2, 97–110. [Google Scholar] [CrossRef]
- Smith Jr., W.O., Barber, D., (Eds.). 2007. Polynyas: Windows to the world. Elsevier Oceanography Series, Vol. 74. pp 474.
- Steiner, N.S.; Bowman, J.; Campbell, K.; Chierici, M.; Eronen-Rasimus, E.; Falardeau, M.; Flores, H.; Fransson, A.; Herr, H.; Insley, S.J.; et al. Climate change impacts on sea-ice ecosystems and associated ecosystem services. Elementa: Sci. Anthr. 2021, 9. [Google Scholar] [CrossRef]
- Stirling, I. The importance of polynyas, ice edges, and leads to marine mammals and birds. J. Mar. Syst. 1997, 10, 9–21. [Google Scholar] [CrossRef]
- Søgaard, D.H.; Kristensen, M.; Rysgaard, S.; Glud, R.N.; Hansen, P.J.; Hilligsøe, K.M. Autotrophic and heterotrophic activity in Arctic first-year sea ice: seasonal study from Malene Bight, SW Greenland. Mar. Ecol. Prog. Ser. 2010, 419, 31–45. [Google Scholar] [CrossRef]
- Søgaard, D.H.; Thomas, D.N.; Rysgaard, S.; Glud, R.N.; Norman, L.; Kaartokallio, H.; Juul-Pedersen, T.; Geilfus, N.-X. The relative contributions of biological and abiotic processes to carbon dynamics in subarctic sea ice. Polar Biol. 2013, 36, 1761–1777. [Google Scholar] [CrossRef]
- Søgaard, D.H.; Sorrell, B.K.; Sejr, M.K.; Andersen, P.; Rysgaard, S.; Hansen, P.J.; Skyttä, A.; Lemcke, S.; Lund-Hansen, L.C. An under-ice bloom of mixotrophic haptophytes in low nutrient and freshwater-influenced Arctic waters. Sci. Rep. 2021, 11, 1–8. [Google Scholar] [CrossRef]
- Tremblay, J.; Gratton, Y.; Carmack, E.C.; Payne, C.D.; Price, N.M. Impact of the large-scale Arctic circulation and the North Water Polynya on nutrient inventories in Baffin Bay. J. Geophys. Res. Atmos. 2002, 107, 26–1. [Google Scholar] [CrossRef]
- Tremblay, J.É., Bélanger, S., Barber, D., Asplin, M., Martin, J., Darnis, G., Fortier, L., Gratton, Y., Link, H., Archambault, P., 2011. Climate forcing multiplies biological productivity in the coastal Arctic Ocean. Geophysical Research Letters 38.
- Welch, H.E.; Bergmann, M.A. Seasonal Development of Ice Algae and its Prediction from Environmental Factors near Resolute, N.W.T., Canada. Can. J. Fish. Aquat. Sci. 1989, 46, 1793–1804. [Google Scholar] [CrossRef]
- Wratten, E.E.; Cooley, S.W.; Mann, P.J.; Whalen, D.; Fraser, P.; Lim, M. Physiographic Controls on Landfast Ice Variability from 20 Years of Maximum Extents across the Northwest Canadian Arctic. Remote. Sens. 2022, 14, 2175. [Google Scholar] [CrossRef]
- Yoshida, K.; Seger, A.; Corkill, M.; Heil, P.; Karsh, K.; McMinn, A.; Suzuki, K. Low Fe Availability for Photosynthesis of Sea-Ice Algae: Ex situ Incubation of the Ice Diatom Fragilariopsis cylindrus in Low-Fe Sea Ice Using an Ice Tank. Front. Mar. Sci. 2021, 8. [Google Scholar] [CrossRef]


| Location. | Production Rate | Reference |
|---|---|---|
| Resolute Bay | 20.6 – 469 mg C m-2 d-1 | (Smith & Hermann, 1991) |
| Northern Baffin Bay | 26.3 - 317 mg C m-2 d-1 | (Nozais et al. 2001) |
| Arctic Ocean | 0.5-310 mg C m-2 d-1 | (Gosselin et al., 1997) |
| Arctic Ocean | 5.8 mg C m-2 d-1 | (Fernández-Méndez et al., 2015) |
| Beaufort Sea | 2.8-11.2 mg C m-2 d-1 | (Horner, 1982) |
| Chukchi Sea | 20-30 mg C m-2 d-1 | (Gradinger et al., 2009) |
| Beaufort Sea | 4-9 mg C m-2 d-1 | (Gradinger et al., 2009) |
| Pan Arctic PP model | 60-100 mg C m-2 d-1 | (Dupont, 2012) |
| Greenland Sea | 0.25-1.71 mg C m-2 d-1 | (Mock & Gradinger, 1999) |
| Davis Strait | 0.003-2.36 mg C m-2 d-1 | (Booth, 1984) |
| Baltic Sea | 1.0-2.4 mg C m-2 d-1 | (Haecky & Andersson, 1999) |
Disclaimer/Publisher’s Note: The statements, opinions and data contained in all publications are solely those of the individual author(s) and contributor(s) and not of MDPI and/or the editor(s). MDPI and/or the editor(s) disclaim responsibility for any injury to people or property resulting from any ideas, methods, instructions or products referred to in the content. |
© 2023 by the authors. Licensee MDPI, Basel, Switzerland. This article is an open access article distributed under the terms and conditions of the Creative Commons Attribution (CC BY) license (http://creativecommons.org/licenses/by/4.0/).


